Article

Extending the HIRS Data Record with IASI Measurements

1
Cooperative Institute for Satellite Earth System Studies (CISESS), North Carolina State University, Asheville, NC 28801, USA
2
NOAA’s National Centers for Environmental Information (NCEI), Asheville, NC 28801, USA
3
Earth System Science Interdisciplinary Center (ESSIC), University of Maryland, College Park, MD 20742, USA
4
Cooperative Institute for Research in Environmental Sciences, University of Colorado Boulder, Boulder, CO 80309, USA
5
NOAA Physical Sciences Laboratory, Boulder, CO 80305, USA
*
Author to whom correspondence should be addressed.
Remote Sens. 2023, 15(3), 717; https://doi.org/10.3390/rs15030717
Submission received: 10 January 2023 / Revised: 19 January 2023 / Accepted: 23 January 2023 / Published: 26 January 2023

Abstract

:
The High-Resolution Infrared Radiation Sounder (HIRS) on the NOAA and the MetOp satellite series have provided global sounding measurements since the late 1970s, spanning over 40 years. These measurements have been useful in climate change detection, numerical weather prediction, and development of long-term climate data records of profiles of atmospheric temperature and humidity, cloud climatology, upper tropospheric water vapor, outgoing longwave radiation, etc. However, the HIRS instrument is being replaced by the new generation of sounders such as the hyperspectral Infrared Atmospheric Sounding Interferometer (IASI) on recently launched satellites. In order to continue and extend the HIRS record, we use IASI measurements to simulate and derive HIRS-like data for the 12 HIRS longwave channels. The MetOp satellite operated by EUMETSAT carries both the HIRS and the hyper-spectral IASI instrument with accurate spectral and radiometric calibration, providing a great opportunity to consistently calibrate the measurements. The IASI radiances are convolved with the HIRS spectral response functions to produce IASI-simulated HIRS (IHIRS) for the longwave channels. In the present work, IHIRS data are collocated and compared with HIRS observed radiances on the same satellite to develop a calibration table for each of the ascending/descending orbits and cloudy and clear categories. The resulting inter-instrument calibrated IHIRS data was found to agree with HIRS brightness temperatures within 0.05 K for all longwave channels.

1. Introduction

The High-Resolution Infrared Radiation Sounder (HIRS) instrument has flown onboard the NOAA series of polar satellites (TIROS-N to NOAA-19) and more recently on the MetOp-A and MetOp-B platforms operated by the European Organization for the Exploitation of Meteorological Satellites (EUMETSAT), spanning a total of 16 satellites over a period of more than 40 years (1978–2022 and beyond). It has not only provided valuable data for short-term weather prediction [1], but also allowed deriving long time series of climate quality data records of atmospheric temperature, moisture, ozone, cloud climatology [2,3,4], climate indices [5], upper tropospheric humidity (UTH) [6], outgoing longwave radiation (OLR) [7], and other geophysical parameters. The retrieval techniques for the geophysical parameters have evolved over generations beginning with a simple physically based system [8,9] to the current operational sounding system [10] maintained by NOAA.
In order to build a long-term dataset for climate applications, development of a Climate Data Record for temperature and humidity profiles has been initiated at the NOAA [11]. A key component of this effort is maintaining the long-term consistency of the product through intersatellite calibration and evaluation of the consistency of retrievals of atmospheric temperature and humidity profiles through validation with independent sources. A key challenge in developing a long-term time series of climate data records from the HIRS channels has been achieving intersatellite consistency in the HIRS instrument among the different satellites. The key inconsistencies arise due to varying spectral response functions (SRF) for different satellites for the same channel, which results in intersatellite biases. The launch of the hyperspectral Infrared Atmospheric Sounding Interferometer (IASI) onboard the MetOp series, with simultaneous onboard HIRS instruments, provides an excellent opportunity to reduce the intersatellite biases. Chen et al. [12] found that, by shifting the HIRS SRF in wavenumber space and convolving with the IASI spectra iteratively, optimized IASI-simulated HIRS data could be obtained, which reduced the bias significantly. In their study, an optimal SRF shift was derived for long wave channels (4, 5, 6, and 7) from NOAA-9 to MetOp-A. Figure 1 shows the shifted SRFs for the MetOp HIRS channels along with the weights. In a more recent study [13], the SRF shift was extended to other channels (1–3 and 10) from NOAA-6 to MetOp-B.
The primary focus of the present study is to produce HIRS-like data records into the future beyond the NOAA and MetOp HIRS series by utilizing the new generation of sounders. The IASI instrument has been providing radiances since July 2007. IASI is onboard MetOp-A, MetOp-B, and MetOp-C, which are expected to provide data for at least 18 years. A future mission, IASI-NG, is expected to fly on the Sentinel-5/MetOp-SG polar orbiting platform within the next 5 years. Thus, a continuation of long-term measurements is planned with the MetOp second-generation satellites to start in 2024 and extend through 2046. Starting with the intersatellite consistent HIRS radiances, we develop an inter-instrument calibration between IASI-simulated HIRS and HIRS.

2. Data and Methodology

2.1. Data Sources

This study uses the HIRS level-1b and the IASI level-1c data from MetOp-A. Both data are available from the NOAA’s Comprehensive Large Array Data Stewardship System (CLASS). The HIRS sounder measures scene radiance in 19 infrared and one visible channels. Only the first 12 channels are used in the present study (see Table 1). The HIRS instantaneous field of view is 20 km for HIRS-2 (prior to NOAA-15) and HIRS-3 (NOAA-15 through NOAA-17), and 10 km for HIRS-4 (NOAA-18, NOAA-19, MetOp-A, and MetOp-B). The IASI instrument is a cross-track scanning Michelson interferometer providing hyperspectral measurements in 8461 channels in the spectral range of 645–2760 cm−1 (3.6–15.5 µm) at 0.25 cm−1 resolution in a 2 × 2 array of circular footprints with a nadir spatial resolution of 50 × 50 km2 and a corresponding single footprint spatial resolution of roughly 12 km at nadir. IASI has a very high radiometric accuracy of 0.1 K [13]. The HIRS on MetOp-A has been used as a reference satellite for an intersatellite calibrated HIRS brightness temperature dataset [11,14,15,16]. In this study, the HIRS on MetOp-A is also used as the reference satellite to calibrate IASI-simulated HIRS for the purpose of extending the intersatellite calibrated HIRS records. The IASI hyperspectral measurements are convolved with the HIRS SRF on MetOp to produce the IASI-simulated HIRS data, which are represented as IHIRS in this paper (see Section 2.2).
Cloud-clearing of the IASI footprints was performed [17] by collocating with the high-spatial-resolution measurements from the Advanced Very-High-Resolution Radiometer (AVHRR) on the MetOp platform. The cloud information at the full AVHRR/3 resolution is available from Nowcasting Satellite Application Facility (NWC SAF) software distribution [18].

2.2. Convolution of IASI Radiances to HIRS

The simulation of HIRS radiances with the IASI observed radiances involves the convolution of IASI radiances with the HIRS spectral response functions.
N i H I R S θ , φ = N ν I A S I θ , φ · Φ i υ   d υ .
Equation (1) states that the HIRS i-th channel radiances, N i H I R S , can be simulated by convoluting the observed IASI radiances, N ν I A S I , with the corresponding HIRS channel spectral response function, Φ i , assuming that the IASI radiances sufficiently cover the spectral range of the HIRS SRF.
The accuracy of the integral in Equation (1) is affected by the resolution of the IASI radiances. In practice, this integral is computed numerically as a weighted summation between the IASI radiances and HIRS SRF function as
N i H I R S θ , φ = j = a b N j I A S I θ , φ · Φ _ i , j ,
where N j I A S I is the IASI j-th channel radiance, and Φ _ i , j is the normalized spectral response function for the HIRS i-th channel averaged over the width of the IASI j-th channel. The summation over IASI channels [a,b] is performed over the extent of the spectral span of the given HIRS SRF. υ = wavenumber (cm−1), θ = view zenith angle or local zenith angle (°), φ = relative azimuth angle (°), Φ i υ   = normalized spectral response function for the i-th channel (unitless), N i H I R S θ , φ = TOA radiance of HIRS i-th channel (W·m−2·sr−1·(cm−1)−1), N ν I A S I θ , φ   = TOA radiance IASI at wavenumber υ (W·m−2·sr−1·(cm−1)−1), N j I A S I = IASI j-th channel radiance, and Φ _ i , j = normalized spectral response function HIRS i-th channel averaged over the frequency range of the IASI j-th channel.
The brightness temperatures derived from the IASI channel radiance (Equation (2)) include limb effects for off-nadir scan angles, resulting in cooler observed brightness temperatures. Correcting for the limb effects is discussed in Section 3.1. The convolved IASI-simulated HIRS (IHIRS) and the actual HIRS brightness temperature (BT) data prior to applying the limb correction are compared in Figure 2 for a specific day in January 2011, indicating excellent correspondence between the two. Although the differences between IASI-simulated HIRS and HIRS measurements are generally small, mostly less than 0.5 K on average, such differences can produce discontinuity in a long-term time series; thus, for climate application, the simulated data need to be calibrated. This is discussed in Section 2.3 and Section 3.2.

2.3. Calibration Methodology

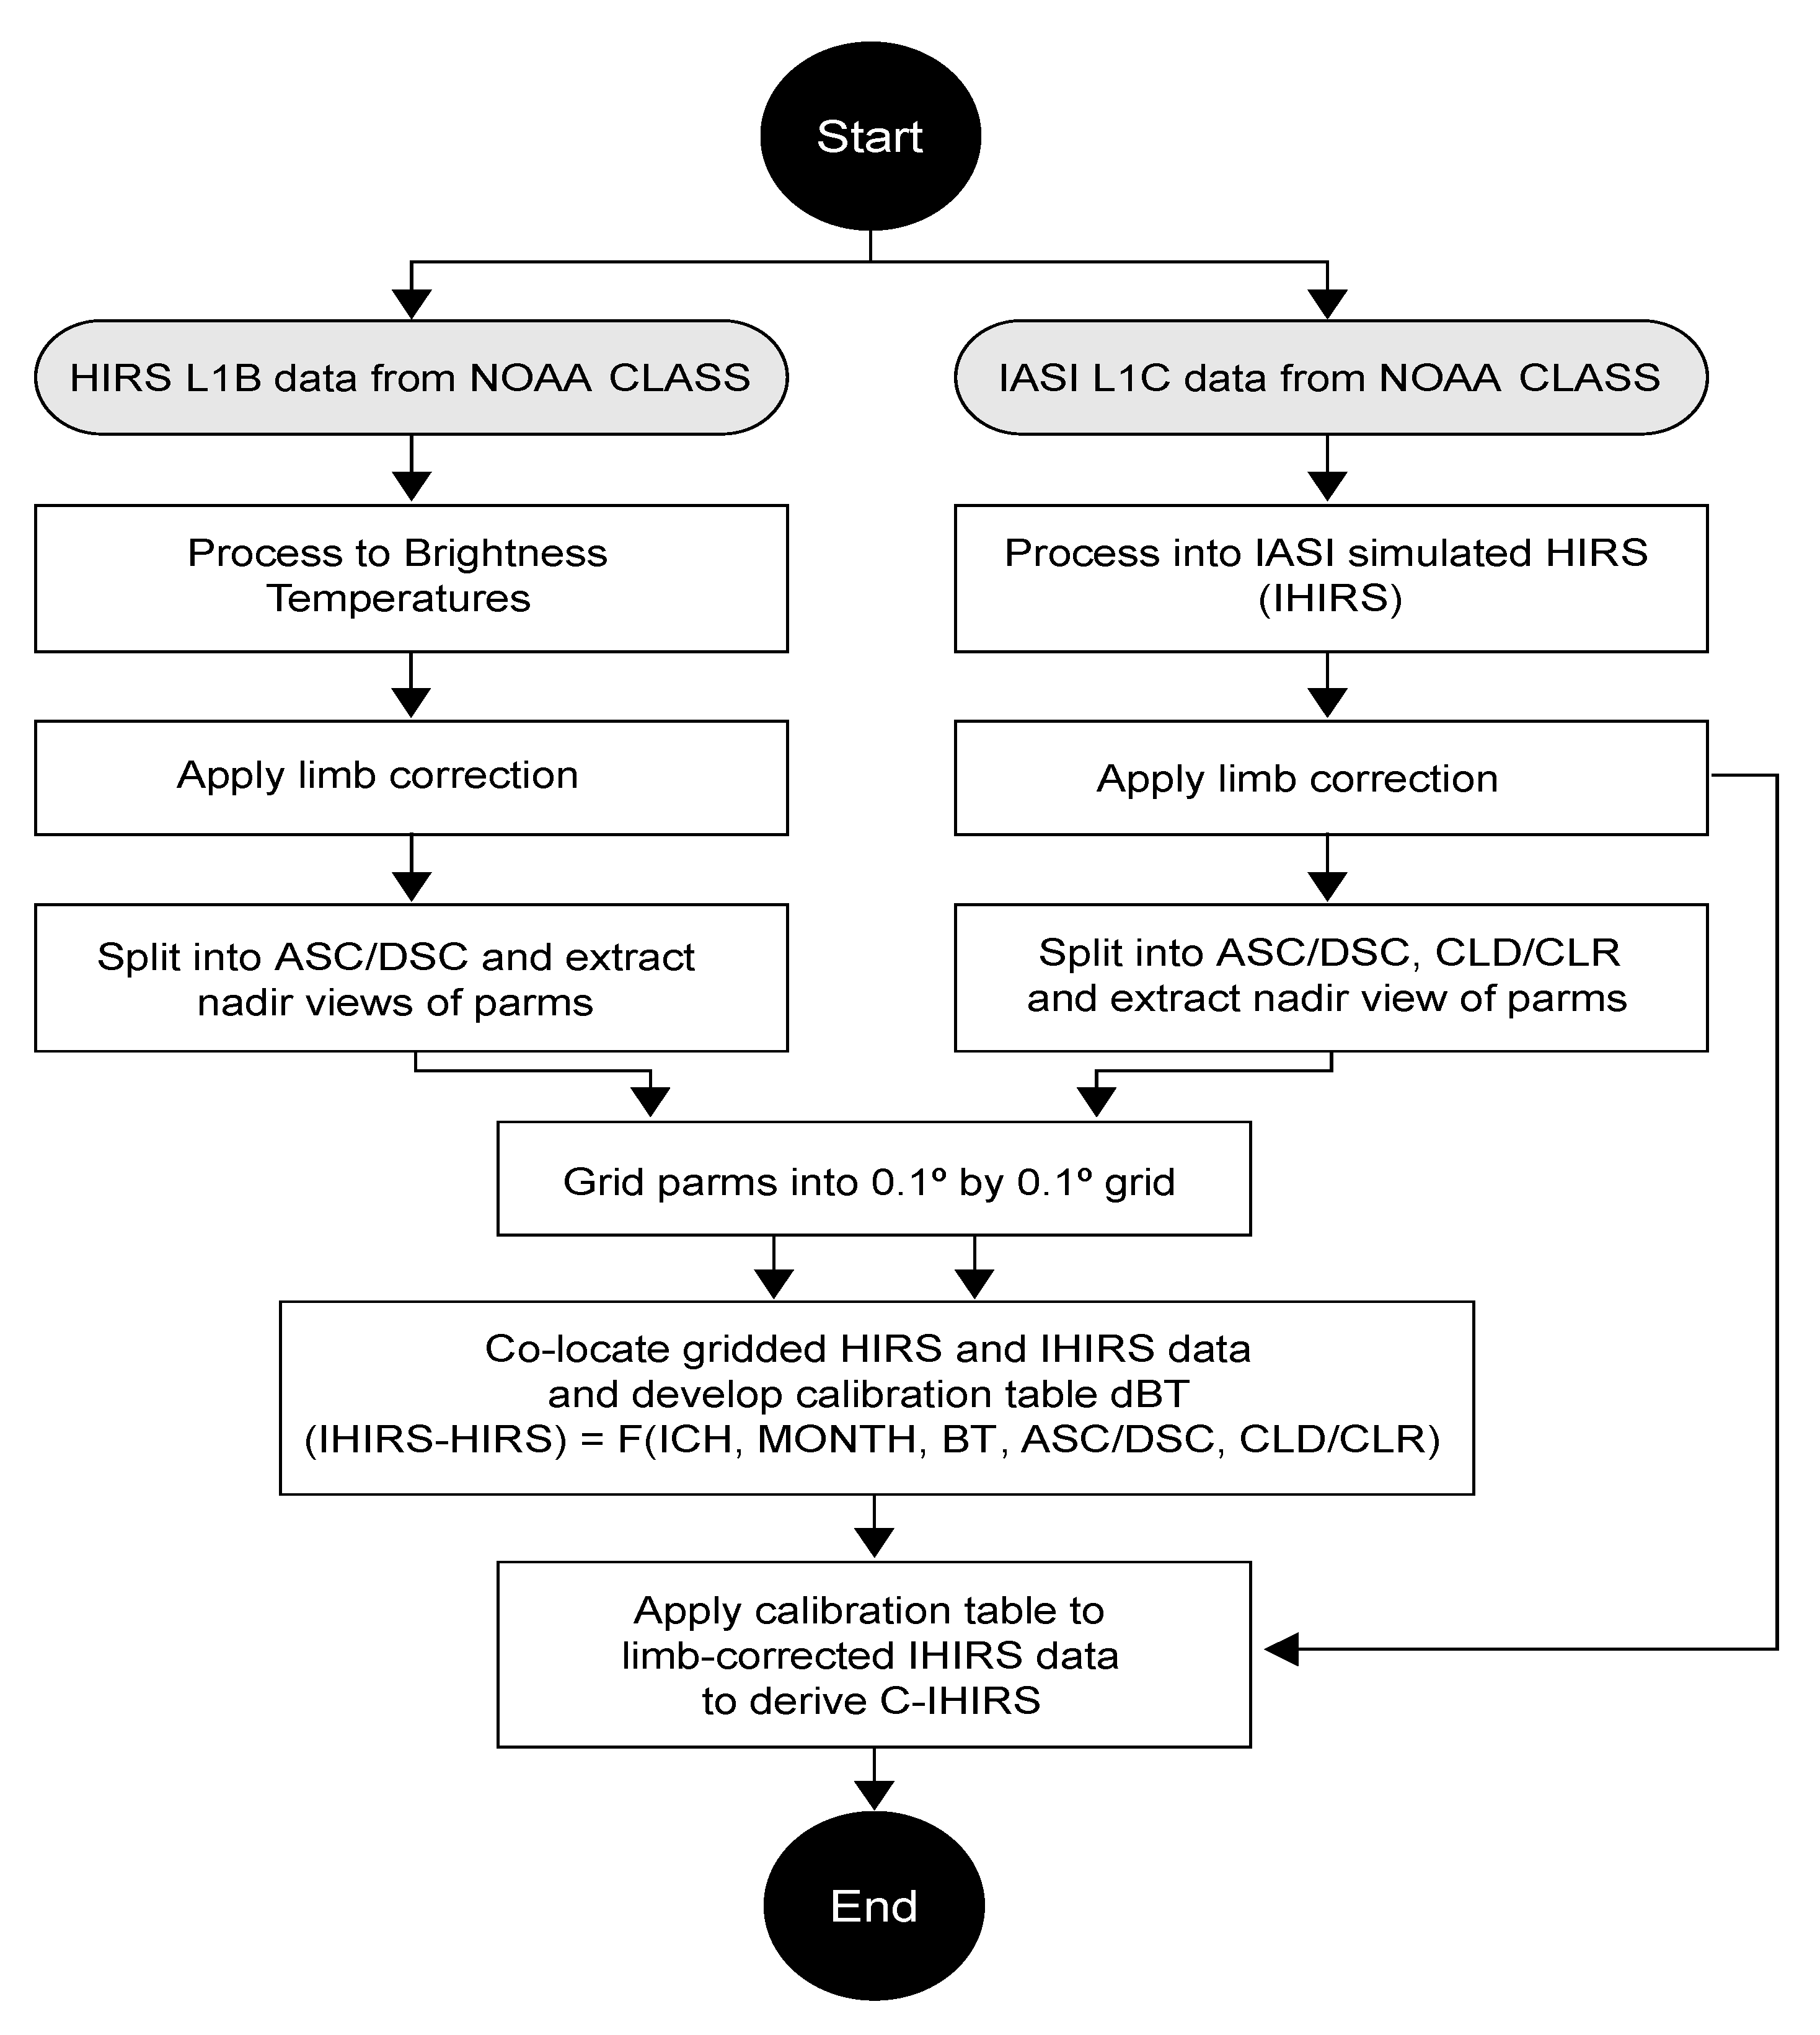
Figure 3 shows a flowchart of steps involved in the calibrations. Inter-instrument calibration between HIRS and IHIRS is developed by collocating nadir views (less than 5° view zenith) of IHIRS and HIRS data. Data are divided into ascending (6 a.m. to 6 p.m. local time) and descending (6 p.m. to 6 a.m. local time) orbits, and cloudy (greater than 10% clouds) and clear (less than 10% clouds) scenes. The instantaneous field of view, scan rate, and cross-track scan coverage of the HIRS (IASI) instrument are 0.7°, 10 km (0.8°, 12 km), and ±49.5, 56 footprints per scanline (±48.3°, 30 footprints per scanline, each containing four pixels), respectively. Owing to these different scanning patterns of HIRS and IASI data, both HIRS and IHIRS data are gridded into 0.1° by 0.1° bins so that the cloud fraction values available from IHIRS data can be applied and used to assess calibration for cloudy and clear scenes. The difference in brightness temperatures, dBT (IHIRS − HIRS) for each channel ICH, is expressed as a function dependent on the brightness temperature (BT) range, ascending or descending orbit (ASC/DSC), and cloudy/clear scenes for each month. The BT data are binned into 10° bins from 180–350 K. Thus, we end up with a multidimensional array,
dBT (IHIRS − HIRS) = F(ICH, month, BT, ASC/DSC, CLD/CLR).
The expression shown in Equation (3) forms the basis of our calibration table. The offsets dBT (Equation (3)) are applied to the limb-corrected IHIRS data (see Section 3.1 for details on limb correction) to produce the HIRS-like or calibrated IASI-simulated HIRS data, which are represented as C-IHIRS in this study (see Figure 3).

3. Results and Discussion

3.1. Limb Correction to the IHIRS Data

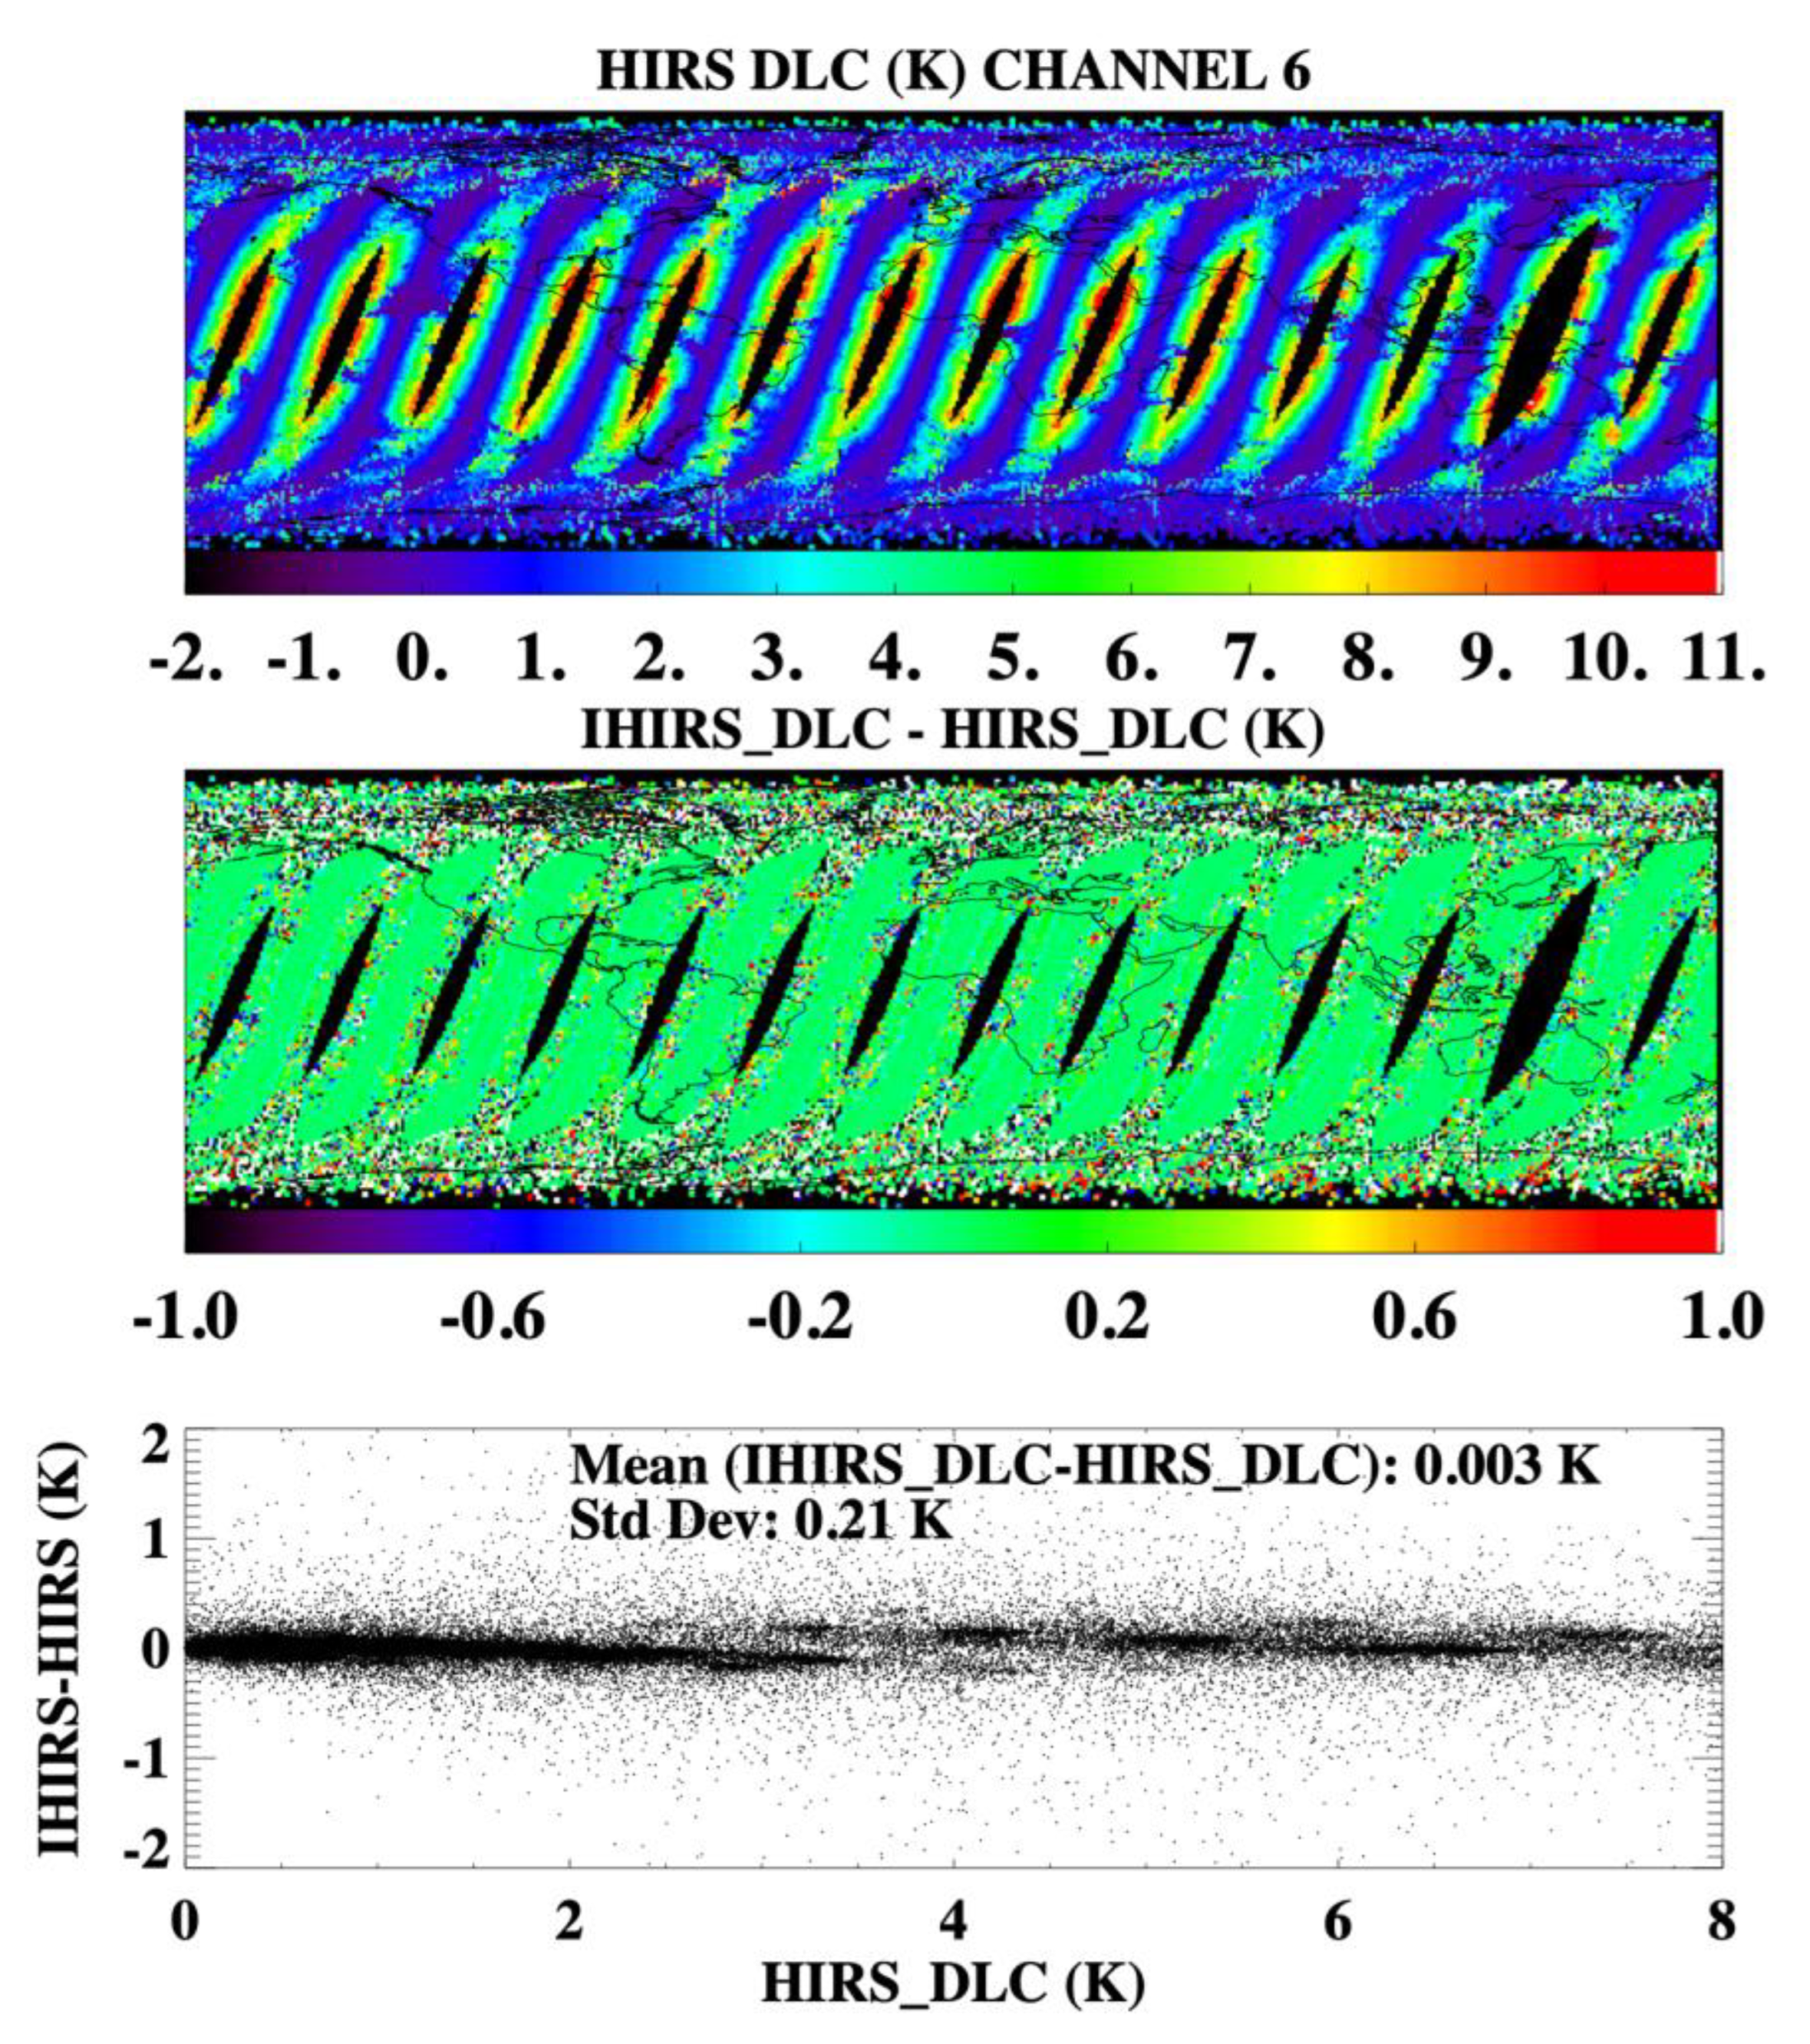
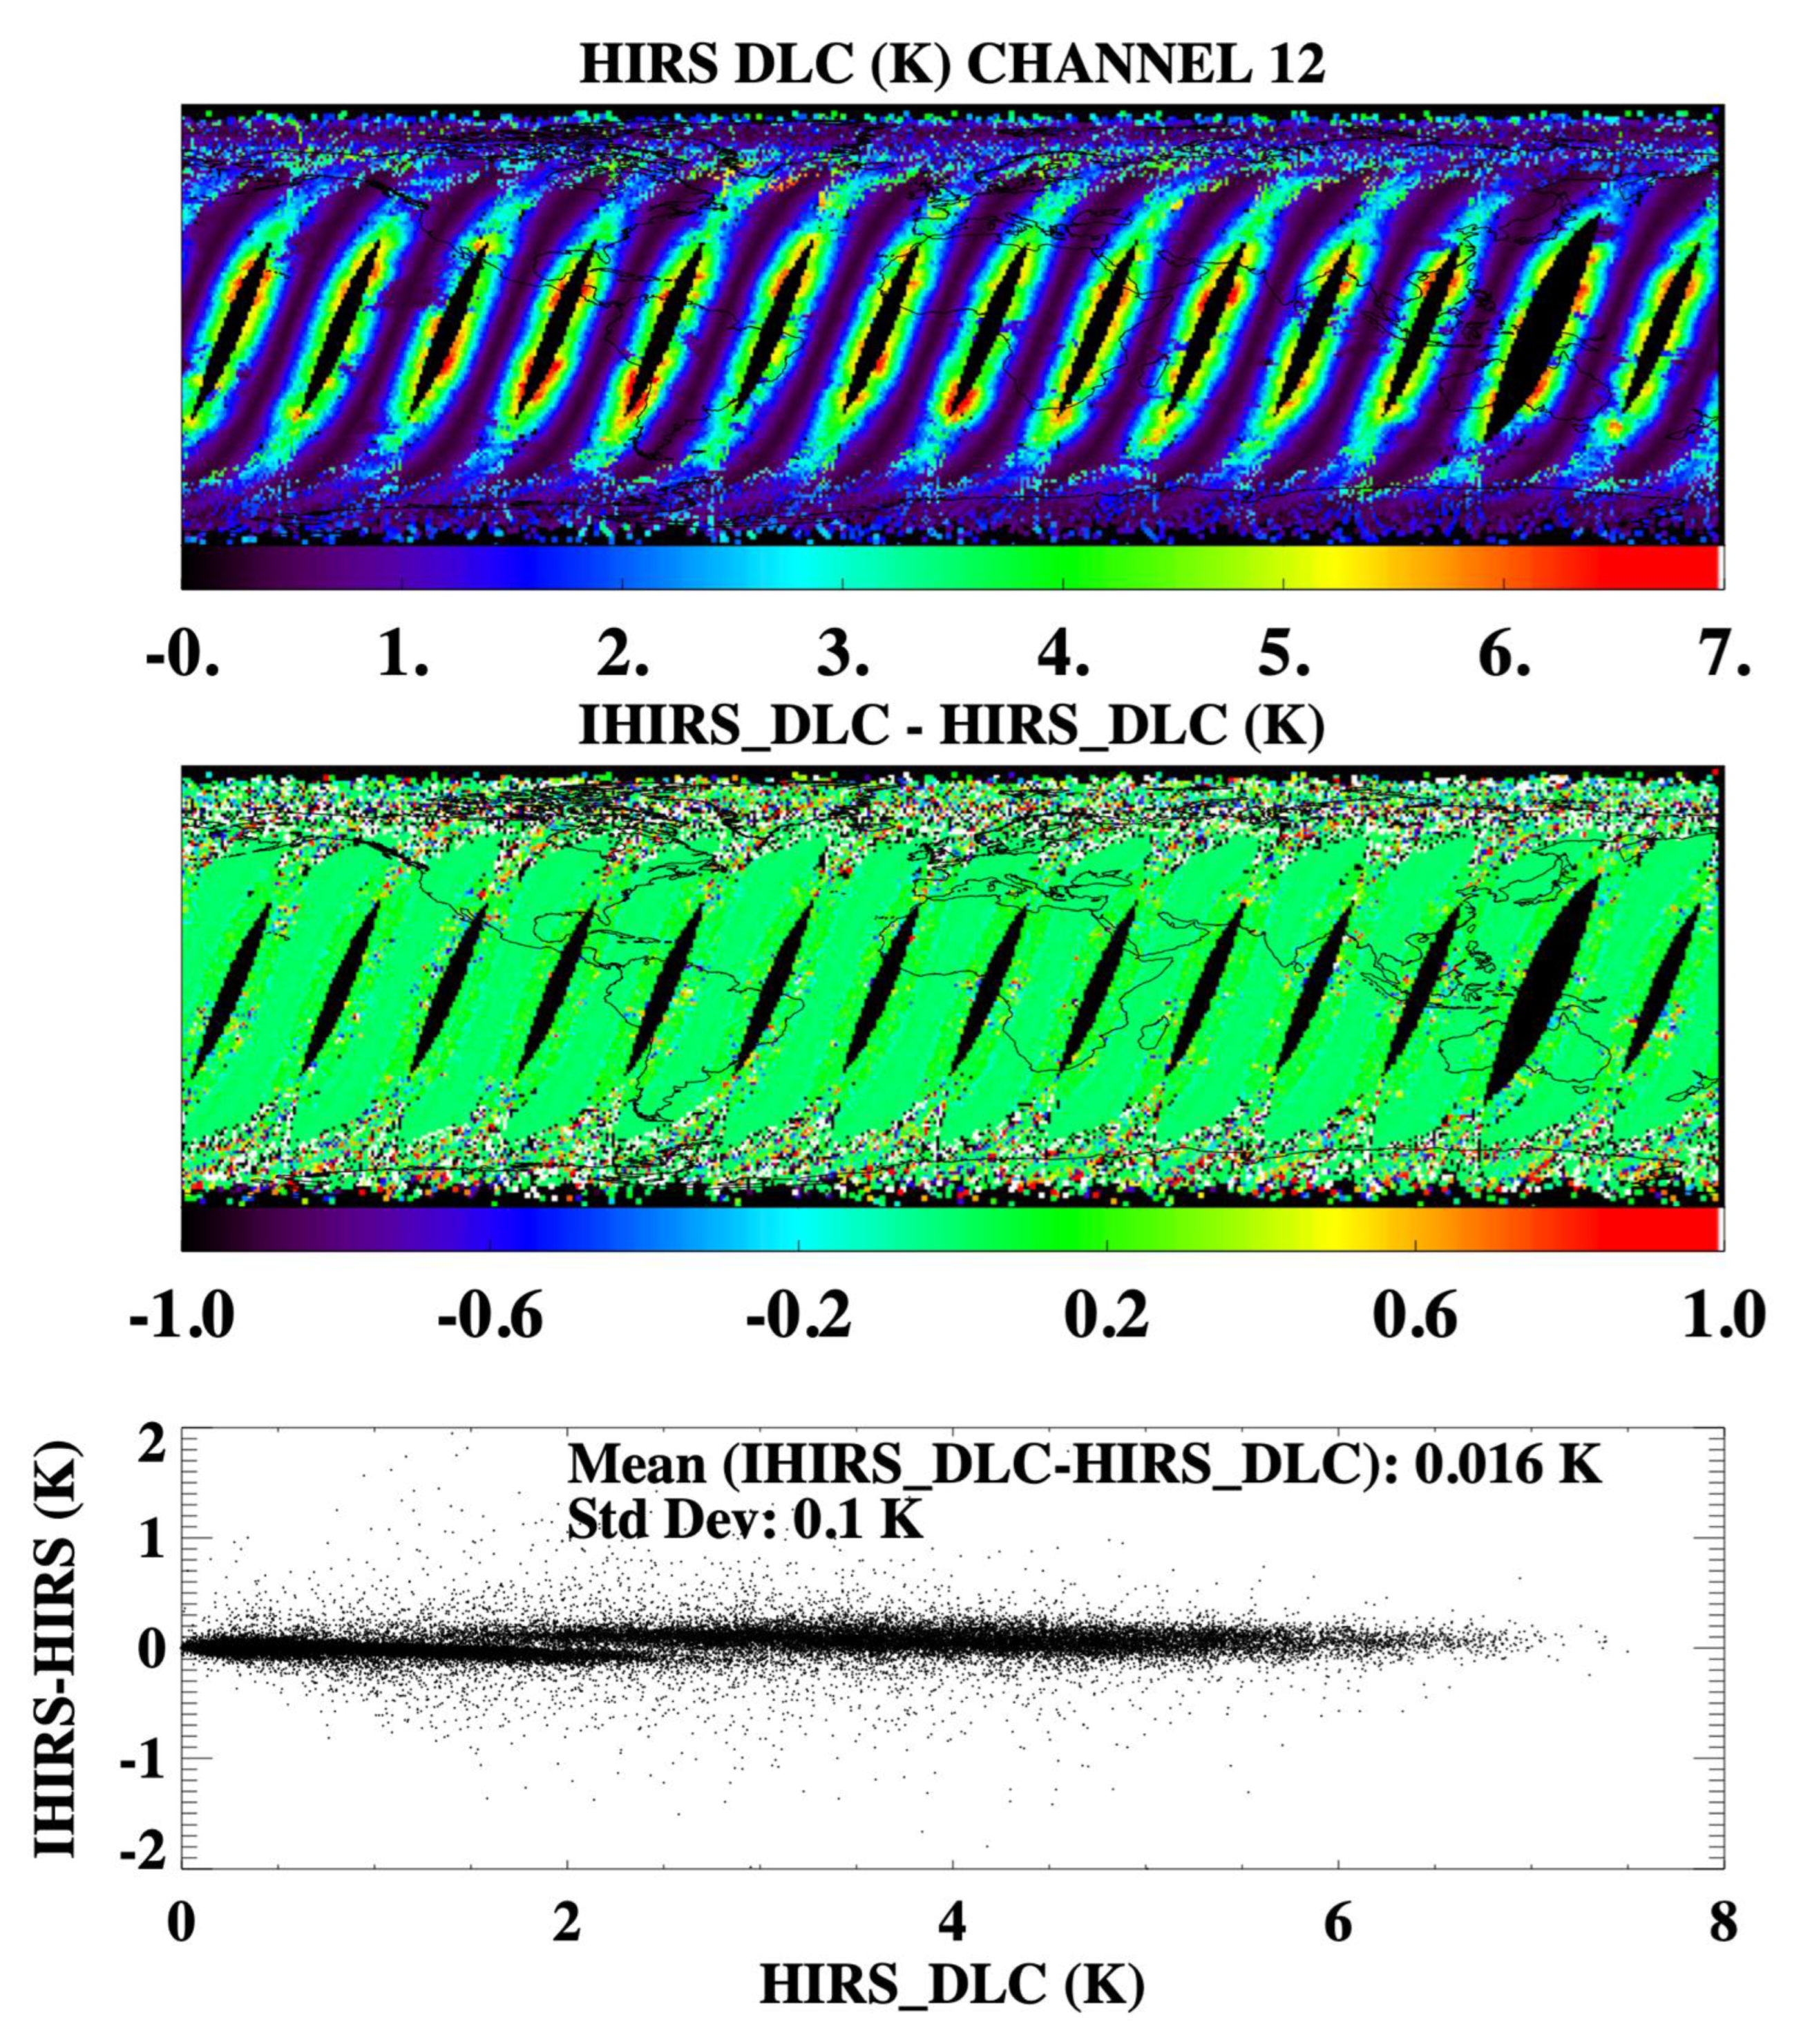
Limb effects for the HIRS dataset were modeled [11] using the Radiative Transfer for TOVS (RTTOV v8.5) model simulations [19], followed by a multivariate regression using multiple HIRS channels. The limb effects depend on the temperature and water vapor. The regression coefficients are a function of scan angle, channel, and satellite. The tabulated coefficients for MetOp-A HIRS were applied to the IHIRS data. The difference in brightness temperatures with limb correction and without limb correction, denoted here as the parameter DLC, was evaluated for both HIRS and IHIRS for various channels, and sample results are shown in Figure 4 and Figure 5 for channels 6 and 12, respectively, for descending orbits for 5 January 2011. The bottom panels in Figure 4 and Figure 5 represent IHIRS_DLC-HIRS_DLC as a function of HIRS_DLC. The bottom panels were restricted to the latitude region of 40S–40N to avoid mismatch of pixels at high latitudes in the gridded data due to different geolocations of pixels in the two sensors in overlapping orbits. The final limb-corrected BT for channel 6 corresponding to Figure 2 is shown in Figure 6, showing that the limb effect is removed, as evidenced by increased BT along both sides of scanlines, as well as the expanded BT range (see color bar compared to Figure 2).

3.2. Performing Inter−Instrument Calibration

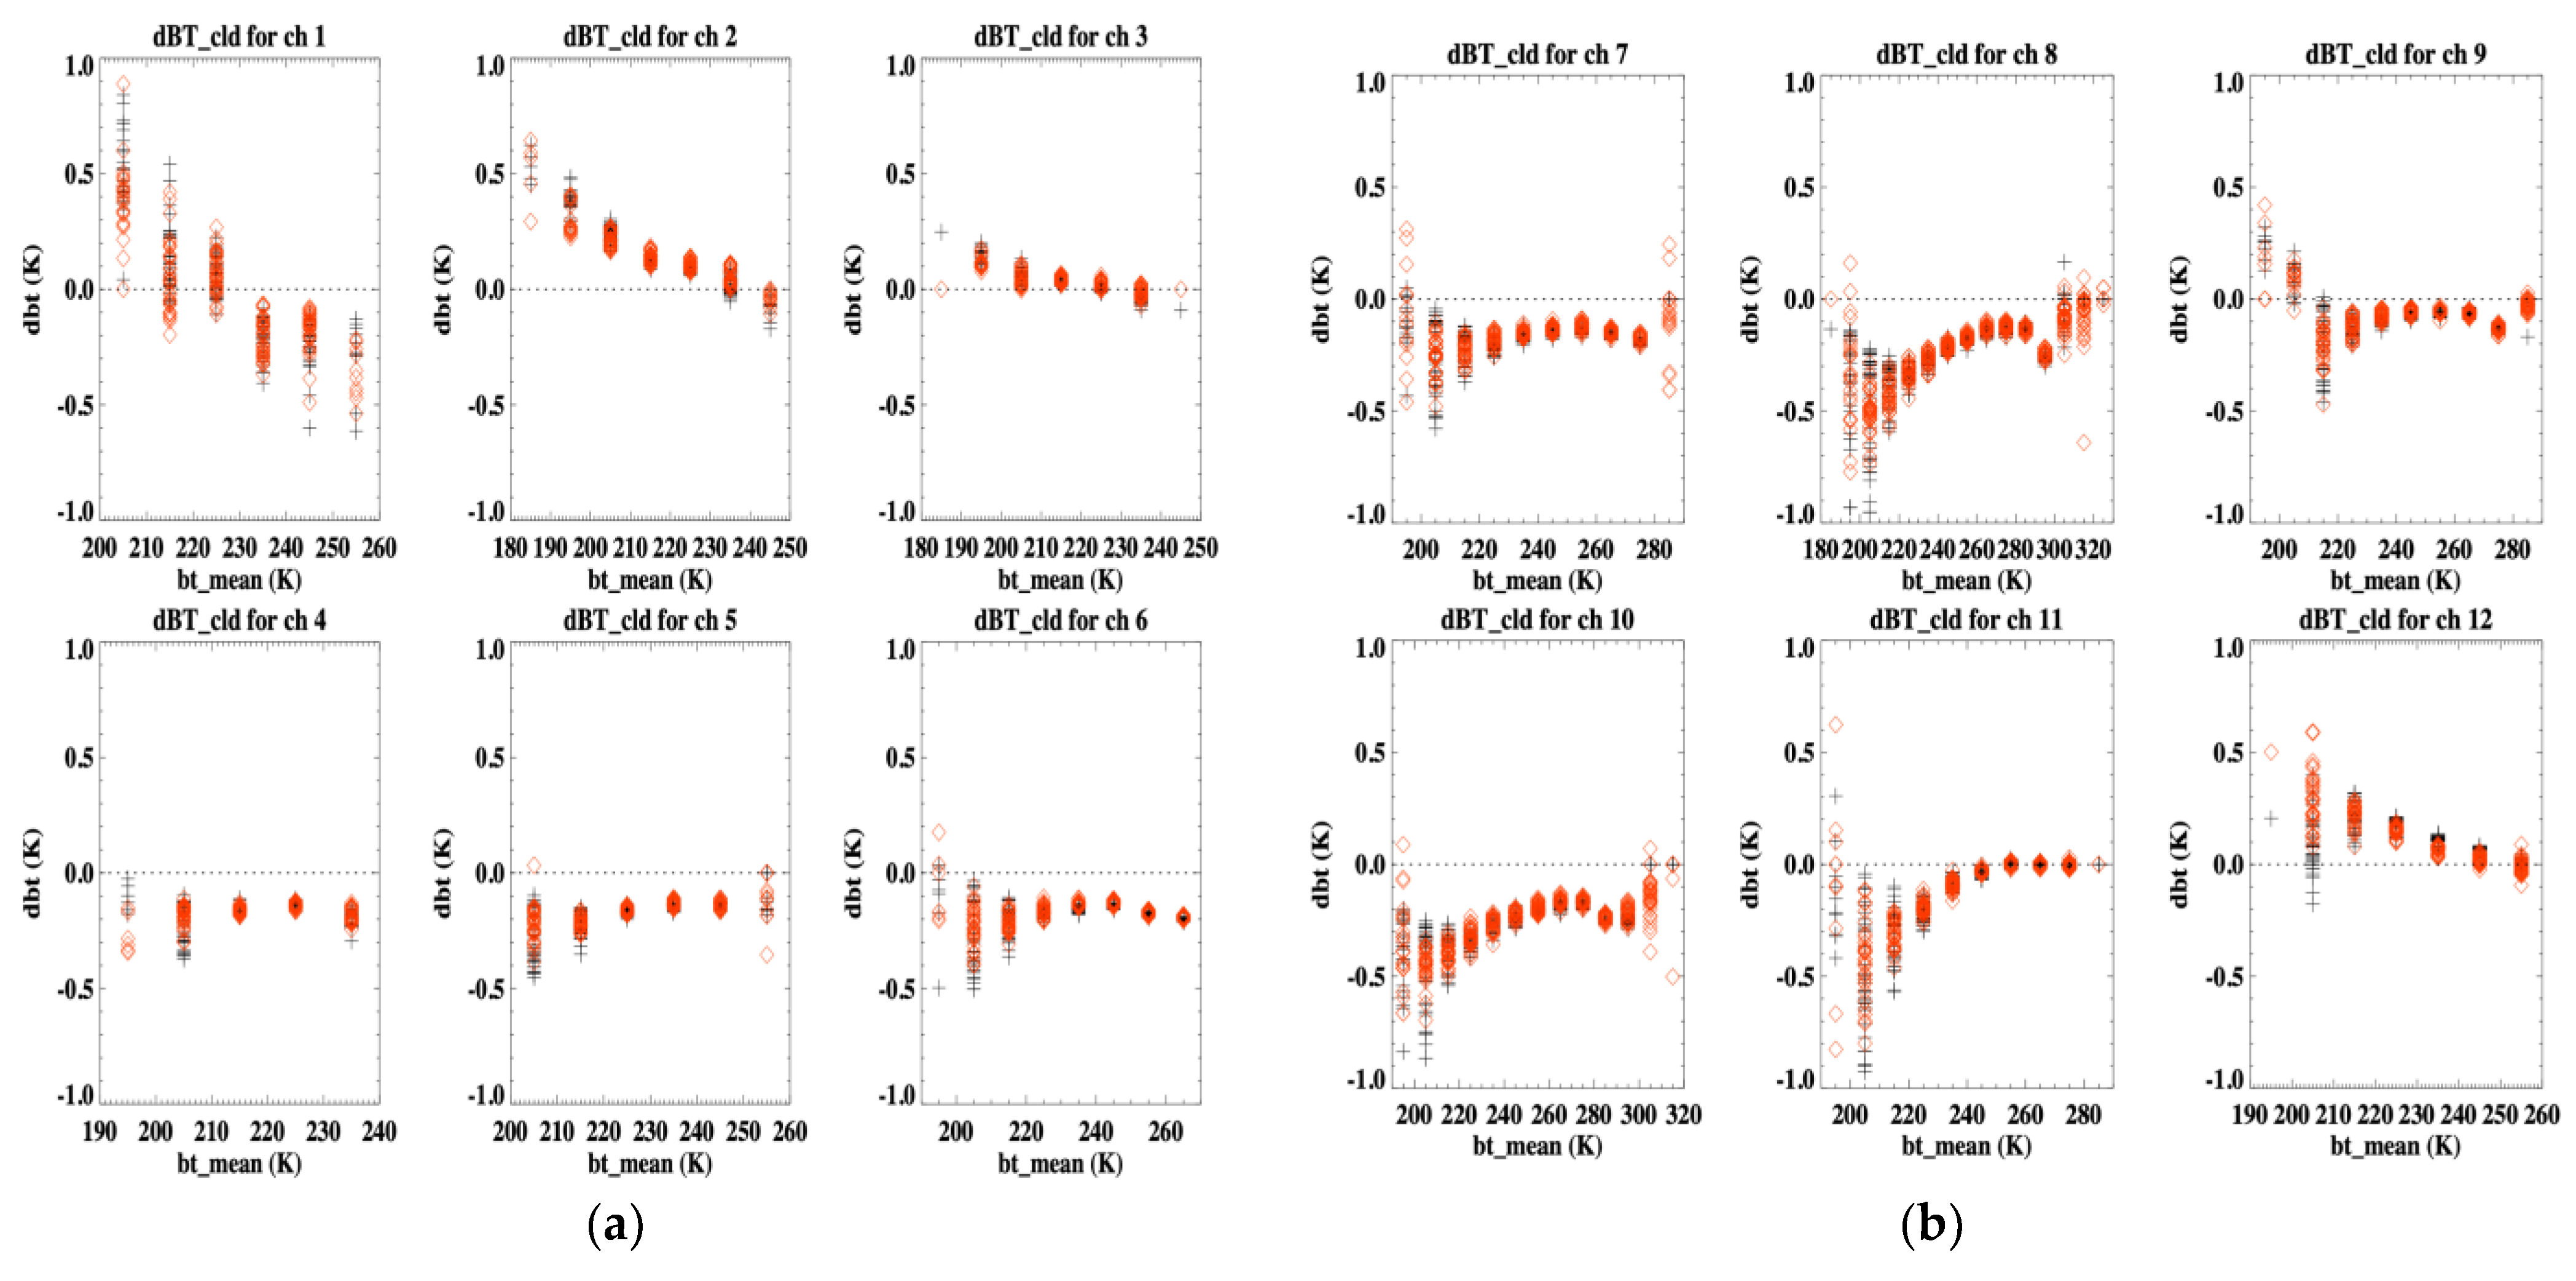
We used the intersatellite consistent IHIRS in conjunction with the HIRS data to develop an inter-instrument calibration. Three years of both HIRS and IHIRS data (2011–2013) were used to develop the calibration. The variation of the difference in brightness temperatures, dBT (IHIRS−HIRS), as expressed in Equation (3), is shown in Figure 7. Each of the data points represents 1 month of data.
The variability of dBT as a function of the BT range for the cloud category is shown in Figure 7a,b for all channels. The black symbols represent ascending orbits, and the red symbols refer to the descending orbits. There is large seasonal variation for BT values below about 220 K for all channels. The dBT values show a downward trend for channels 1–3 for cloudy and clear scenes (Figure 7a,c). Peaks of the weighting functions for ch 1–3 occur at 30, 60, and 100 hPa, respectively, in the stratosphere. The seasonal variation of temperatures is governed by seasonal variations of ozone in the stratosphere. Hence, trends in dBT can be attributed to the variation in stratospheric temperatures due to seasonal variations in the ozone, as well as the stratospheric dynamics. There is significant variability between the ascending and descending orbit dBT values especially for the stratospheric and upper tropospheric channels (channels 1–5). Except for the upper stratospheric channels (1–2), dBT_clr shows a flatter response than dBT_cld for all channels. The dBT array shown in Equation (3) forms our calibration table to be applied to the IHIRS data in order to obtain calibrated IASI data which we refer to as C−IHIRS.
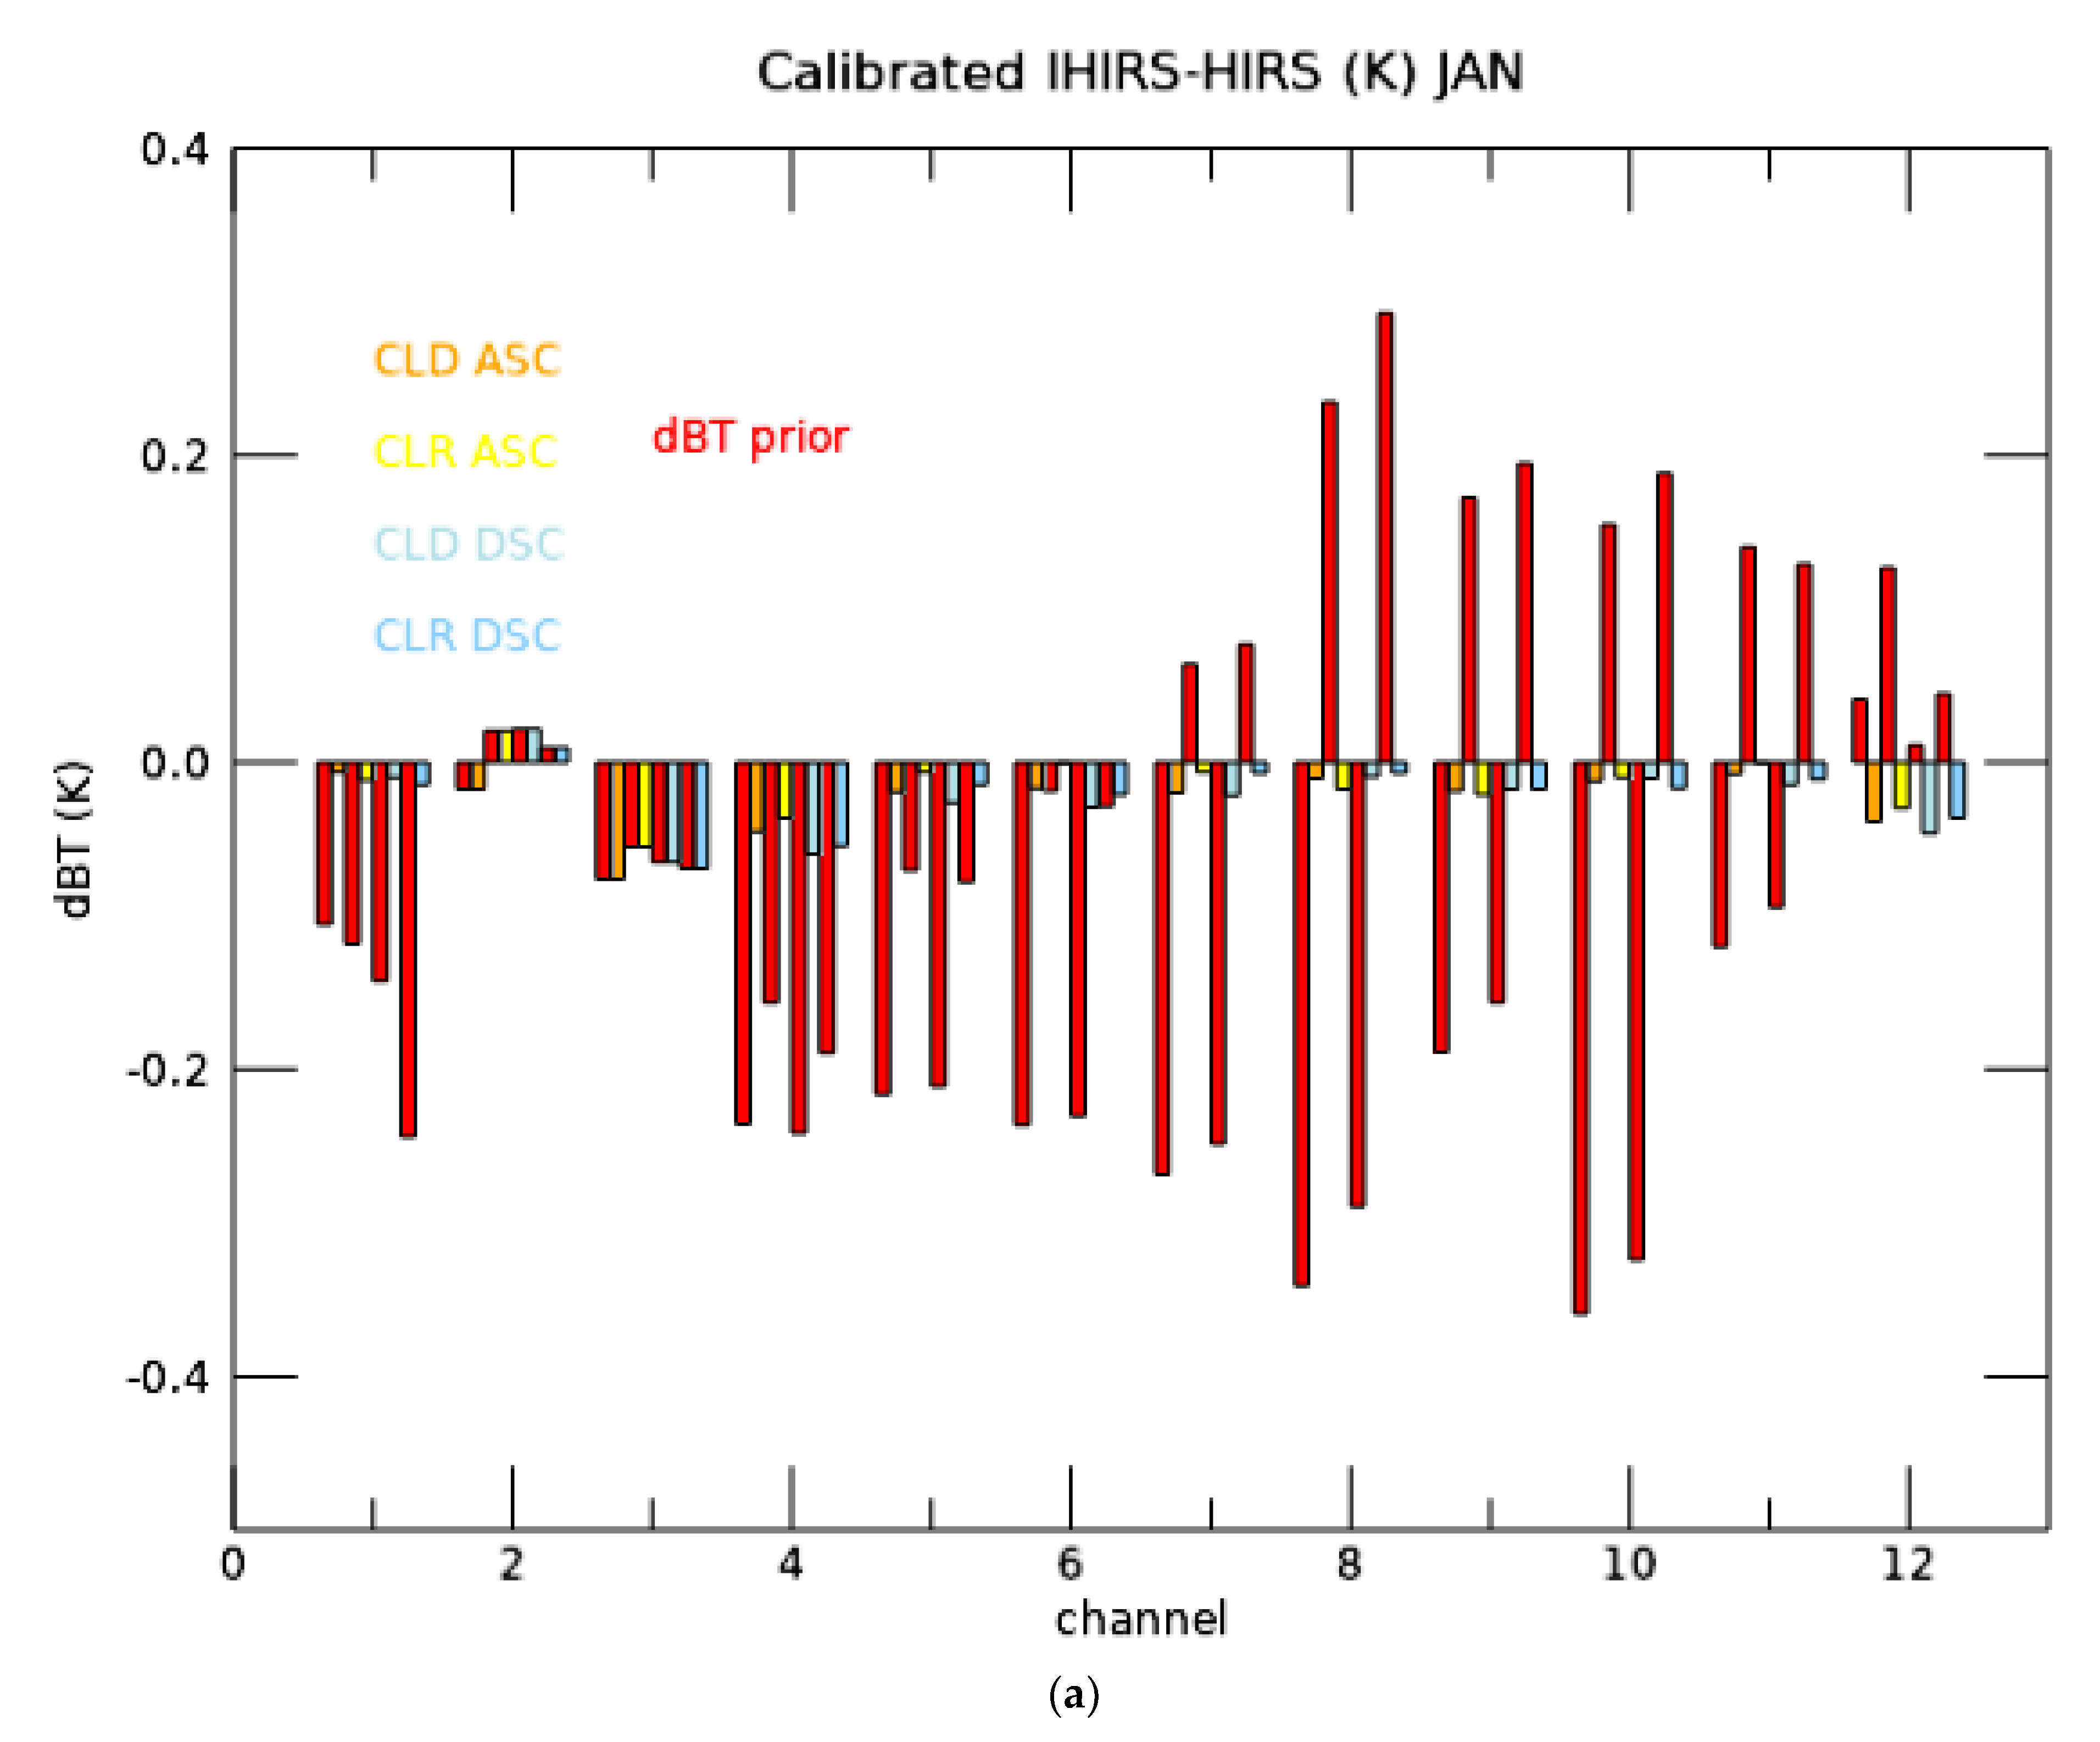
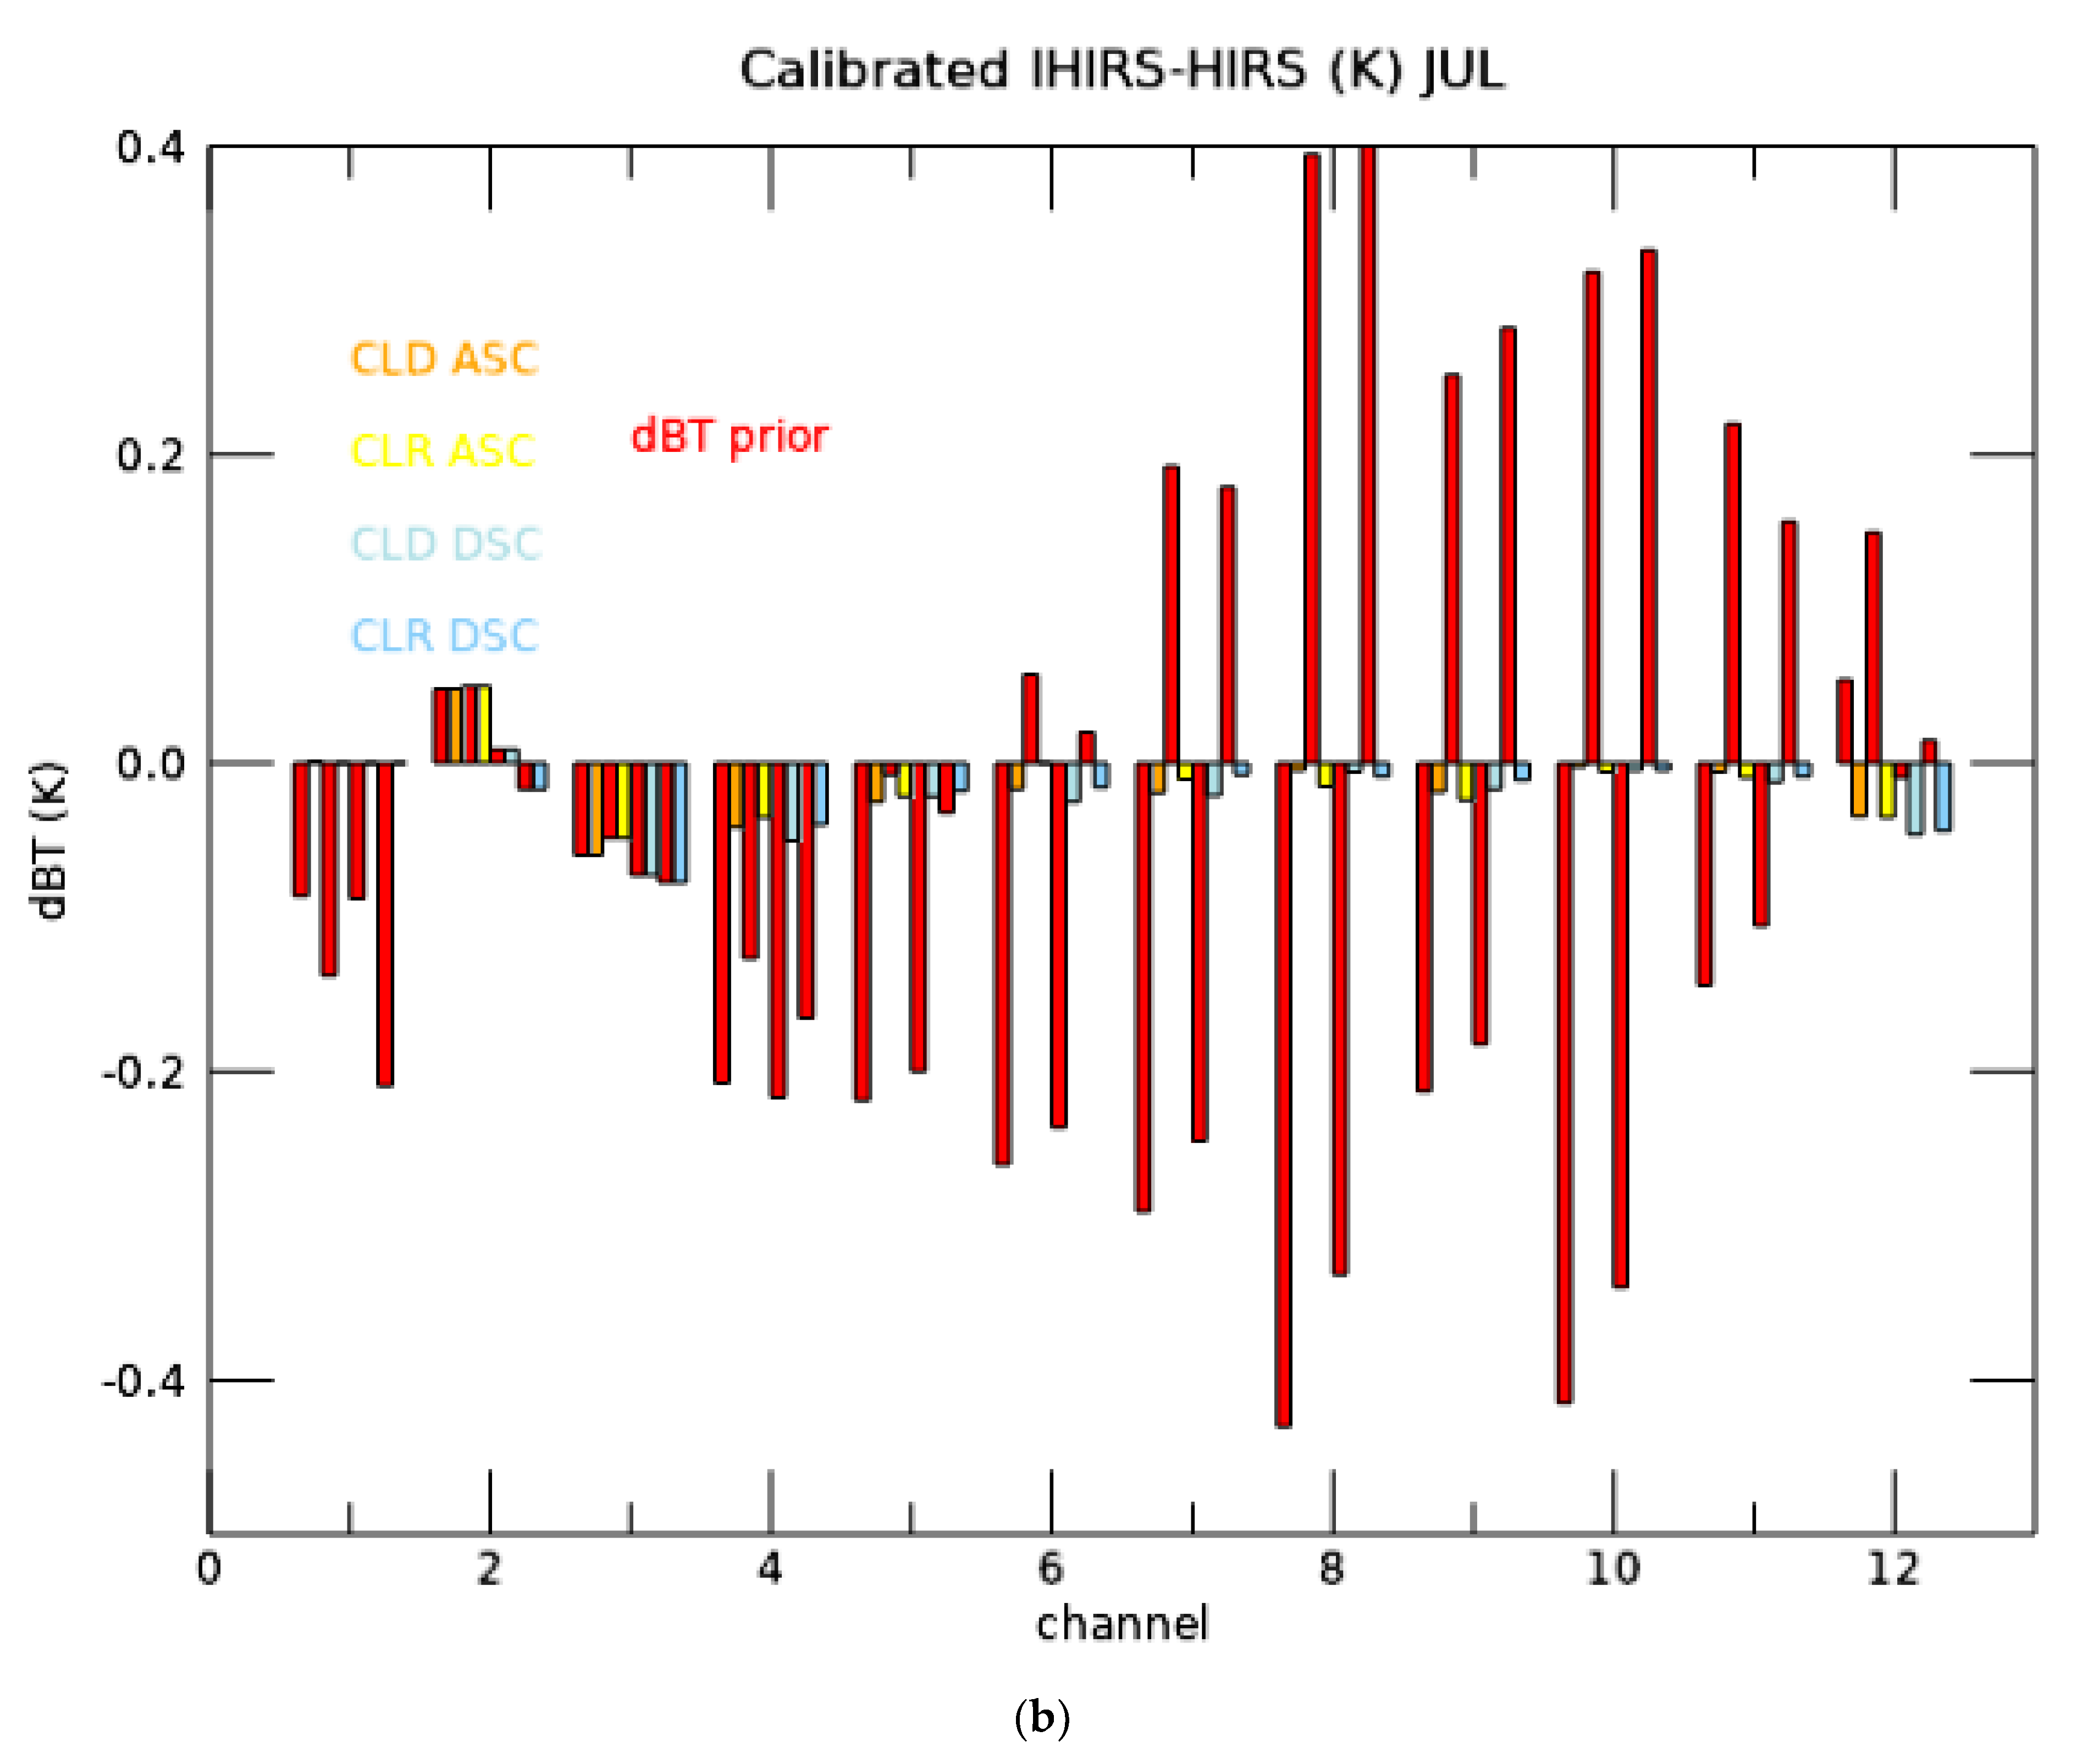
The data shown in Figure 7 represent dBT values (IHIRS−HIRS) prior to applying the inter-instrument calibration. The final calibrated data, C−IHIRS, is determined as C−IHIRS = IHIRS− dBT. While 3 years (2011–2013) of IHIRS and HIRS data were employed to develop the calibration table, the offsets can be applied to other years to derive the C-IHIRS data. Figure 8a shows a bar plot representing the difference in brightness temperatures prior to applying the offsets (red color) and after applying the calibration for all categories (cloudy ascending, clear ascending, cloudy descending, and clear descending orbits) for the month of January, choosing a median value for that month using data for the years 2011–2015. For channels 2 and 3, the mean dBT values are generally small, indicating a good performance of the convolution of IASI radiances with the HIRS channel spectral response functions. Therefore, the inter-instrument calibration is not performed on these two channels. In this study, the inter-instrument calibration was carried out for channels 1 and 4–12. Figure 8a shows that the dBT values after calibration were well below 0.05 K. Figure 8b illustrates a similar pattern for July. The mean variability of bars shown in Figure 8 is provided in Table 2 in terms of standard deviation.
A notable feature in Figure 8a,b is the opposite trends in dBT between cloudy and clear for channels 7–11. This feature only occurs in channels for which the presence of clouds can have a large impact on the measurements. We speculate that the large dBTs with opposite signs for clear and cloudy may have resulted from different ways of sensing through clear air or sensing the top of clouds between IASI and HIRS. After all, the IASI is a hyperspectral sensor, and HIRS is a broadband sensor. They sense and slice the atmosphere differently with different vertical distributions of weighting functions. Despite using the optimal SRF shift method of Chen et al., (2013) and Zhang et al., (2021) [12,13], where the overall averaged channel radiances of IHIRS (which include both clear and cloudy pixels) are adjusted to match HIRS radiances on Metop-A, the SRF shift method does not specifically address the measurement differences of clear or cloudy regions.
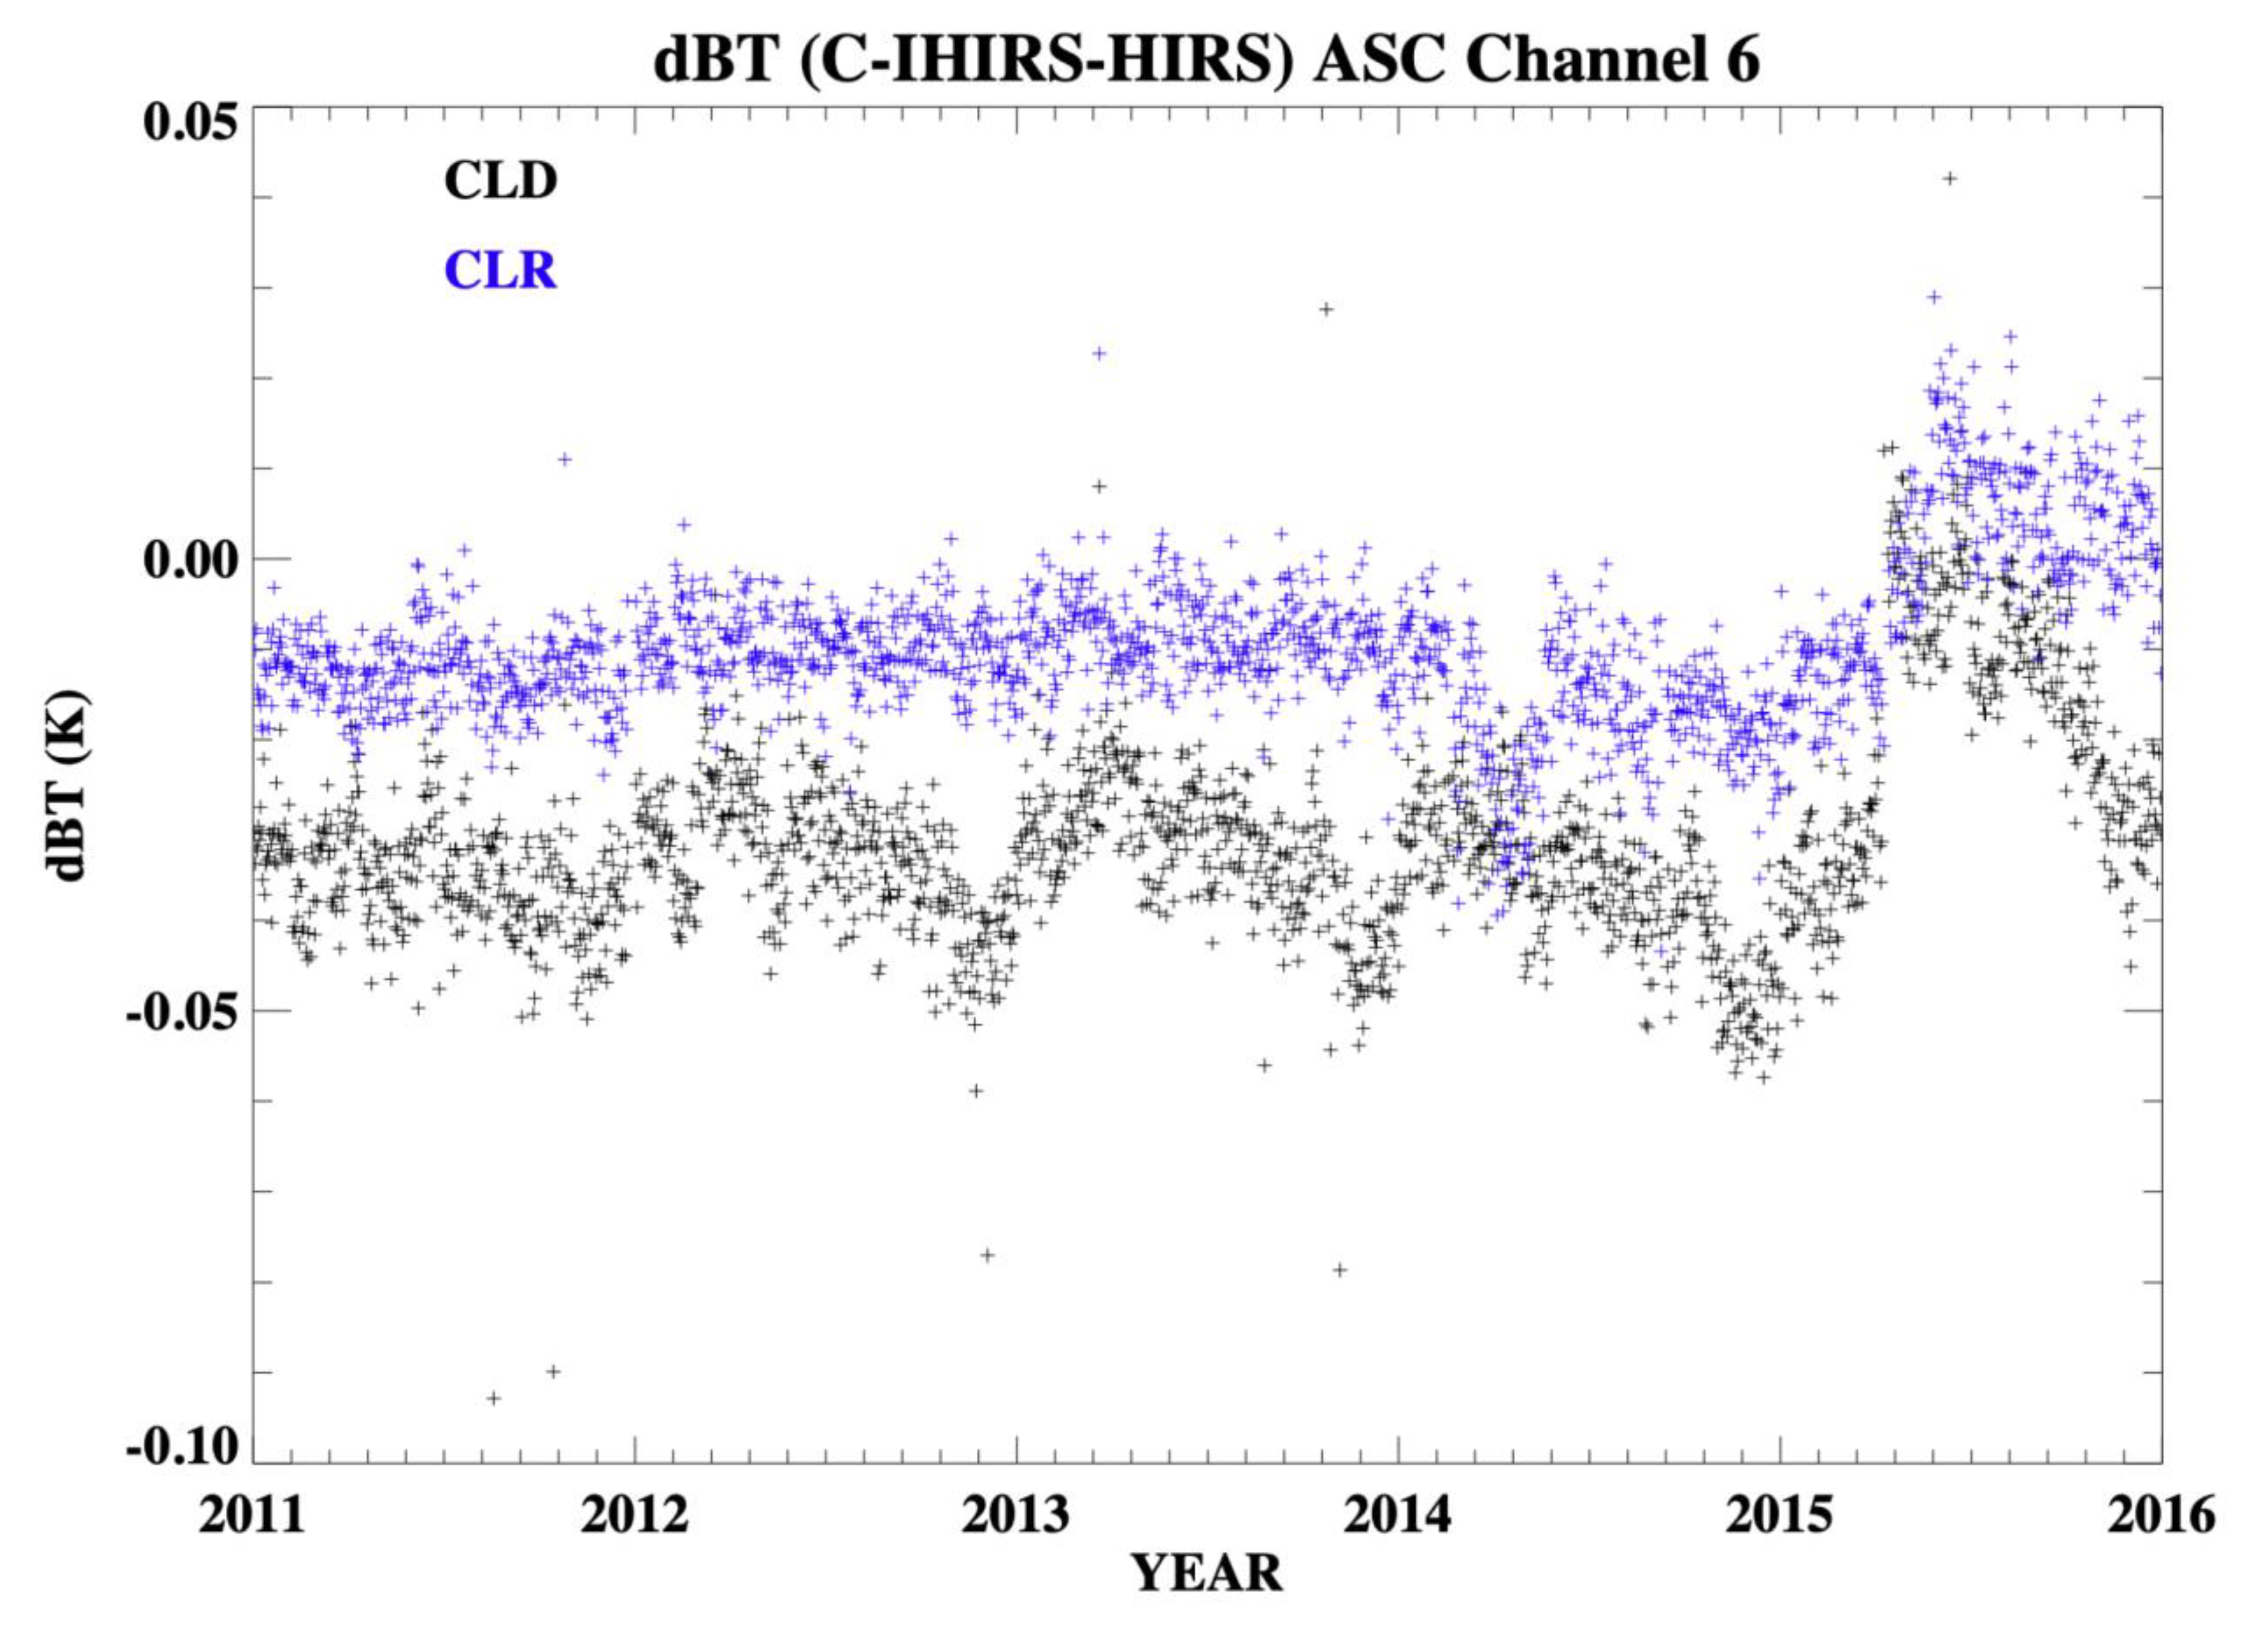
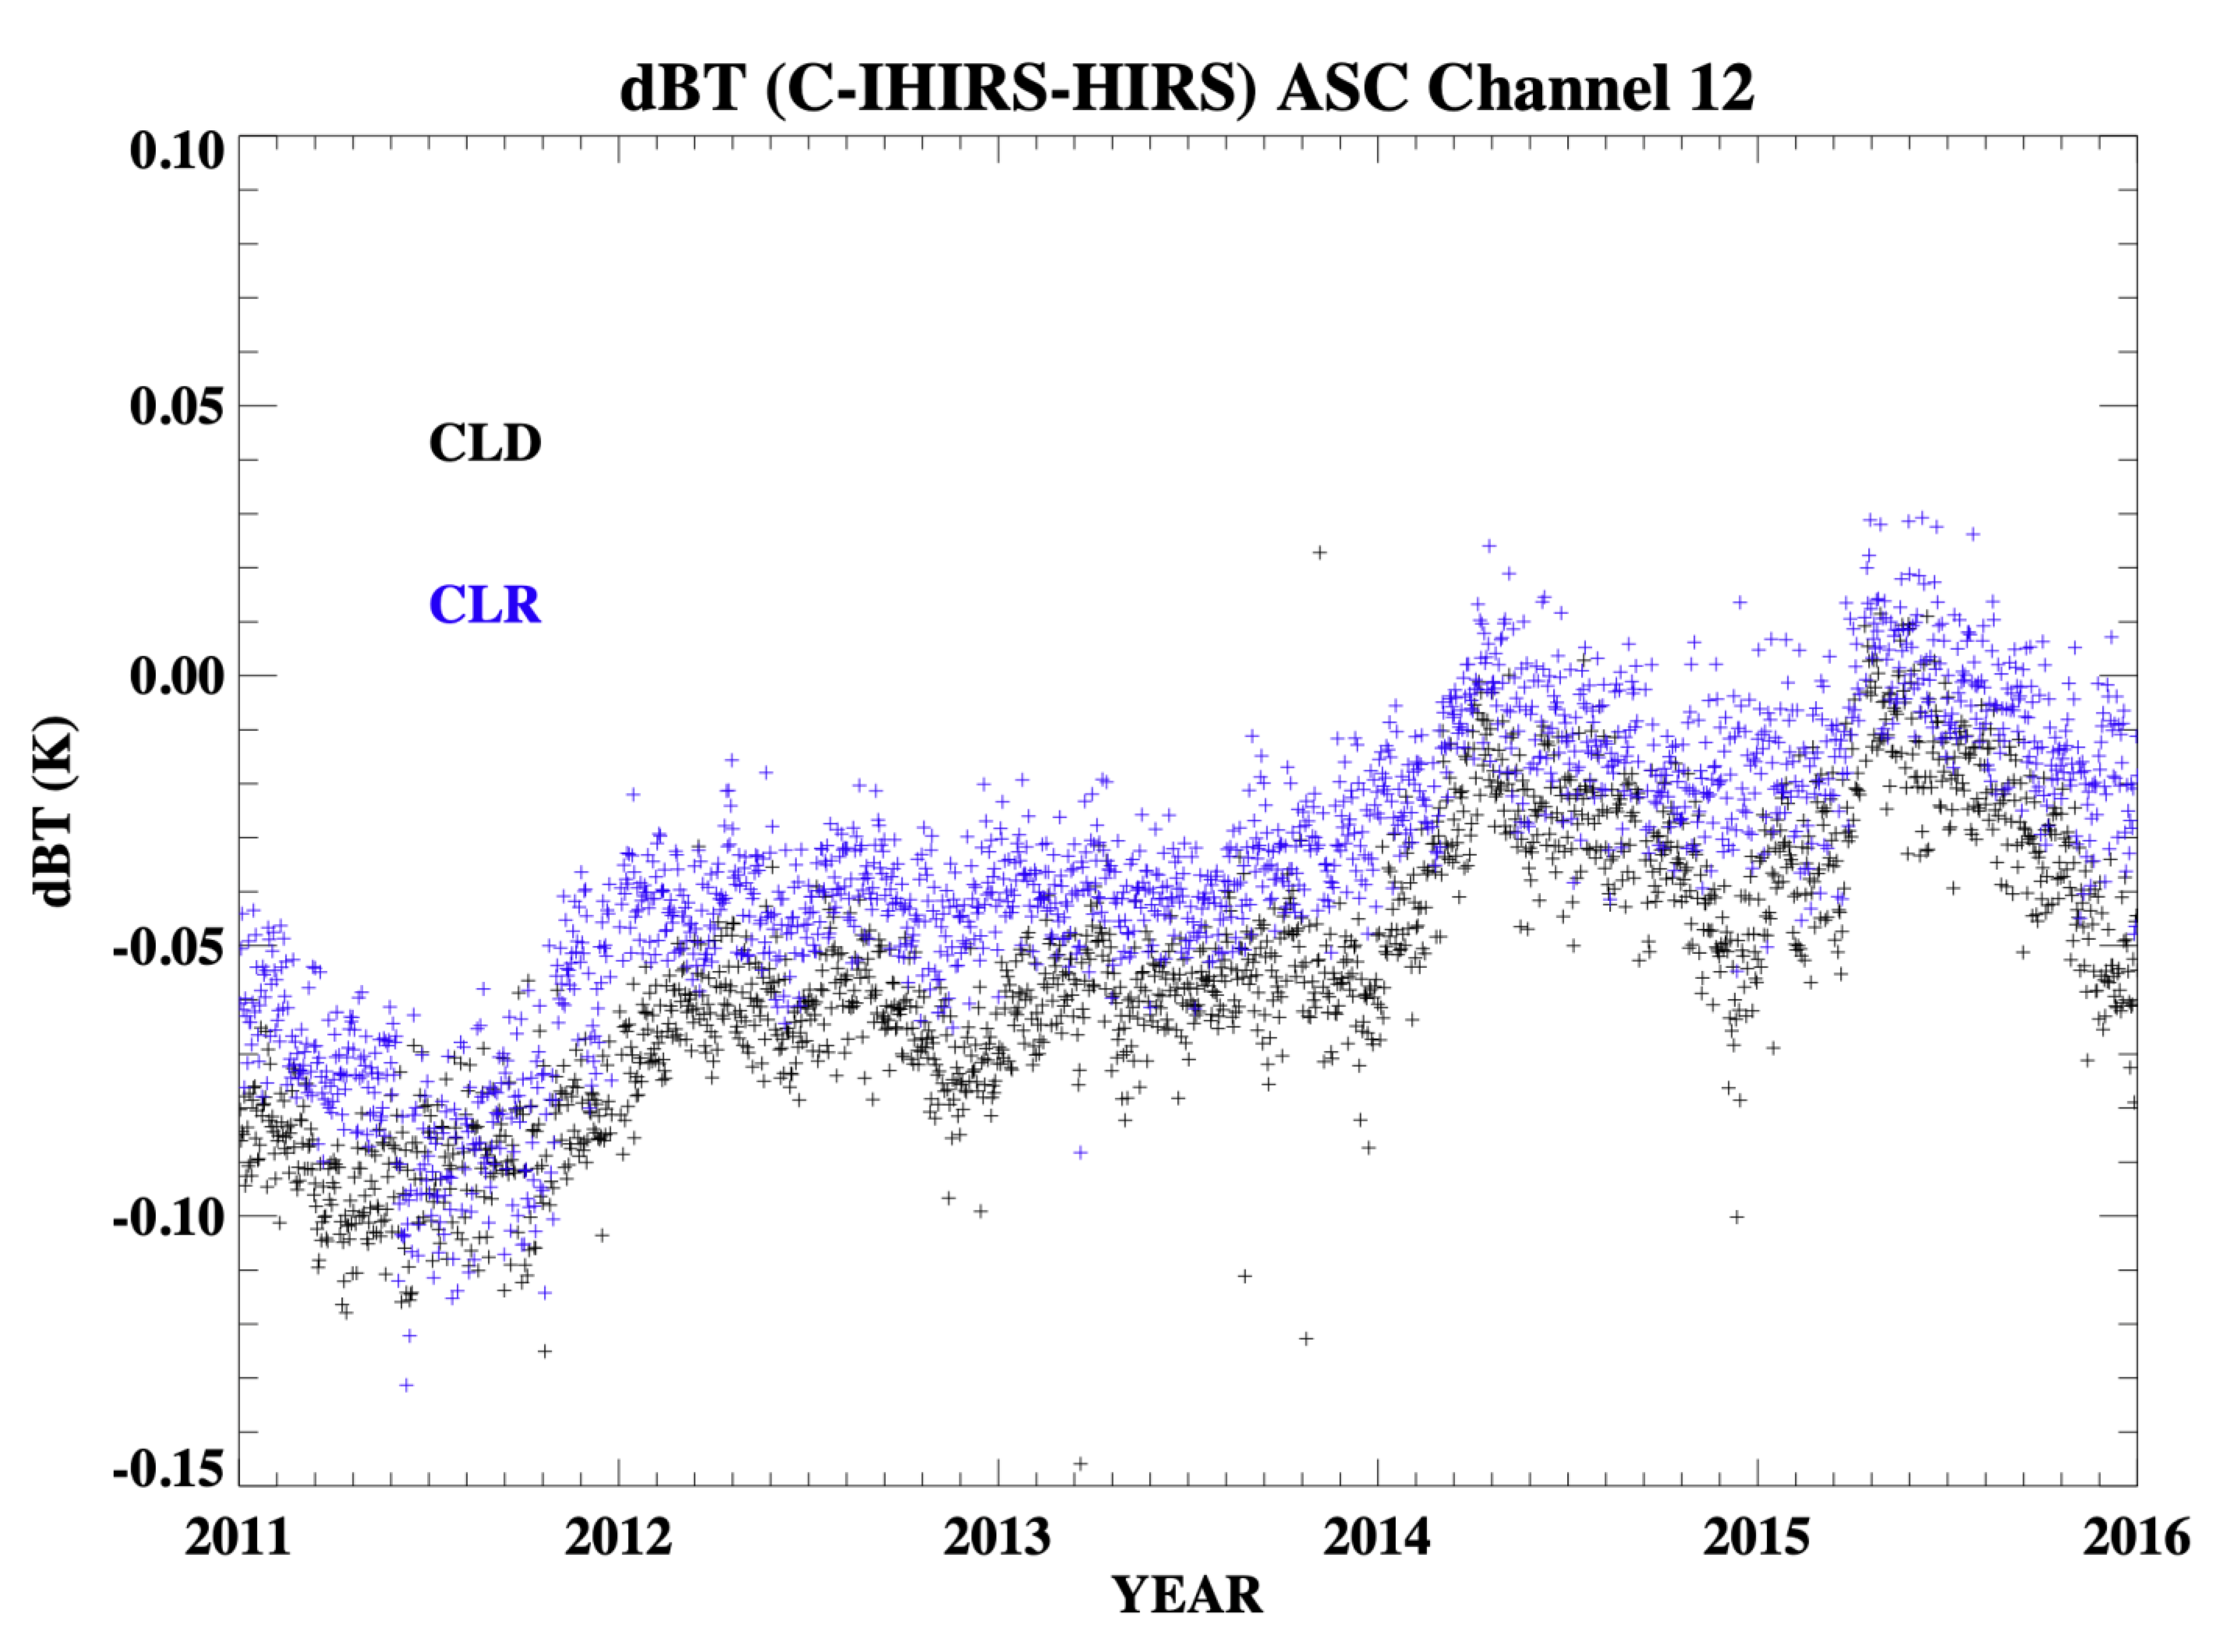
Time series of median differences between C-IHIRS and HIRS followed a similar pattern to that shown in the bar plots (Figure 8) in terms of averaged differences. Results for a sample CO2 channel (channel 6) are shown in Figure 9 for ascending orbits for both cloudy and clear sky situations. Figure 9 displays that, after the inter-instrument calibration, the differences between C-IHIRS and HIRS for channel 6 are reduced to around −0.01 K for clear pixels and around −0.03 K for cloudy pixels. The results represent a significant improvement from the differences prior to the inter-instrument calibration (which were approximately −0.2 K on average for channel 6). Other channels achieved similar improvements after the inter-instrument calibration was performed. Figure 10 shows a time series similar to Figure 9, but for a water vapor channel (channel 12).
There is an indication that HIRS channel 6 on MetOp-A started to show signs of degradation in 2015, marked by the sudden changes in dBT (C-IHIRS−HIRS) for both clear and cloudy pixels, although the changes were still small in 2015. By 2016 (not analyzed in the present study), several HIRS channels on MetOp-A were outside of the specification limit (https://www.eumetsat.int/metopA-spacecraft-status; accessed on 5 October 2022).

4. Summary and Conclusions

HIRS has been one of the main instruments onboard the NOAA series of polar-orbiting satellites and was recently introduced onboard the MetOp-A and MetOp-B operated by EUMETSAT. Owing to its long span of observations starting in 1978, high frequency of observations, and global area coverage, HIRS measurements have been used in monitoring the Earth’s climate system through the development of climate data records such as profiles of atmospheric temperature and humidity [11], upper tropospheric humidity time series [6], and outgoing long wave radiation [7]. Profiles of temperature and humidity derived from HIRS channels [20] form an important input of the International Satellite Cloud Climatology Project (ISCCP) operational at NOAA. The study presented here offers methods to extend the HIRS data record beyond the mission life of NOAA satellites using new-generation operational sounding instruments such as IASI on board the EUMETSAT’s MetOp satellite series. The high-spectral-resolution IASI measurements were convolved with the HIRS SRF to produce IASI-simulated HIRS radiances (IHIRS). In spite of the small differences between HIRS and IHIRS, further calibration was performed using collocated nadir views of IHIRS and HIRS data to account for the inter-instrument differences. We analyzed the brightness temperature differences separately between cloudy (>10% clouds) and clear scenes (>10% clouds), as well as between ascending and descending orbits, and then developed a calibration table for each month as a function of brightness temperature range, cloudy/clear scenarios, and ascending/descending orbit categories. After applying a 3 year median value of the calibration table, the calibrated IHIRS data showed differences well below 0.05 K from the HIRS data for most of the channels. MetOp-A was used as a reference satellite in the present work. Continuation of HIRS-like data into the future will be possible through the MetOp second-generation satellites, as well as the Cross-Track Infrared Sounder (CrIS) on the Suomi National Polar-Orbiting Partnership (NPP) and the Joint Polar Satellite System (JPSS), into the 2023–2040 timeframe.

Author Contributions

Conceptualization and study design, A.K.I. and L.S.; original draft preparation, A.K.I. assisted by L.S. and H.-T.L.; analysis, review, and comments, A.K.I., L.S., H.-T.L., D.L.J., and J.L.M. All authors have read and agreed to the published version of the manuscript.

Funding

This research was funded by NOAA through the Cooperative Institute for Satellite Earth System Studies (CISESS) under Cooperative Agreement NA19NES4320002.

Data Availability Statement

The calibrated IHIRS (C-IHIRS) data will be available from the NOAA CDR Website (https://www.ncei.noaa.gov/products/climate-data-records (accessed on 9 January 2023)) soon when the operational production begins.

Acknowledgments

This work was supported by the NOAA through the Cooperative Institute for Satellite Earth System Studies (CISESS) under Cooperative Agreement NA19NES4320002. The authors wish to acknowledge the help rendered by April Lamb, Scientific Technical Editor at CISESS. The authors are grateful to Brooke Adams, the internal reviewer at NOAA, for her many helpful suggestions, as well as the four anonymous reviewers whose suggestions greatly helped in enhancing the quality of the paper.

Conflicts of Interest

The authors declare no conflict of interest.

Abbreviations

HIRSHigh-Resolution Infrared Radiation Sounder
IASIInfared Atmospheric Sounding Interferometer
IHIRSIASI-simulated HIRS
EUMETSATEuropean Organization for the Exploitation of Meteorological Satellites
C-IHIRSCalibrated IHIRS
BTBrightness temperature
dBTDifference in brightness temperatures
ICHChannel number
ISCCPInternational Satellite Cloud Climatology Project
DLCDifference in brightness temperatures with and without limb correction
NOAANational Oceanic and Atmospheric Administration
MetOpMeteorological Operational Satellite
SRFSpectral response function
NCEINational Centers for Environmental Information
ASCAscending
DSCDescending
CLDCloudy (>10% cloud coverage)
CLRClear (<10% cloud coverage)

References

  1. Saha, S.; Moorthi, S.; Pan, H.-L.; Wu, X.; Wang, J.; Nadiga, S.; Tripp, P.; Kistler, R.; Woollen, J.; Behringer, D.; et al. The NCEP Climate Forecast System Reanalysis. Bull. Amer. Meteor. Soc. 2010, 91, 1015–1057. [Google Scholar] [CrossRef] [Green Version]
  2. Menzel, W.P.; Frey, R.A.; Borbas, E.E.; Baum, B.A.; Cureton, G.; Bearson, N. Reprocessing of HIRS Satellite Measurements from 1980 to 2015: Development toward a Consistent Decadal Cloud Record. J. Appl. Meteor. Climatol. 2016, 55, 2397–2410. [Google Scholar] [CrossRef]
  3. Wylie, D.P.; Menzel, W.P. Eight Years of High Cloud Statistics Using HIRS. J. Clim. 1999, 12, 170–184. [Google Scholar] [CrossRef]
  4. Wylie, D.; Jackson, D.L.; Menzel, W.P.; Bates, J.J. Trends in Global Cloud Cover in Two Decades of HIRS Observations. J. Clim. 2005, 18, 3021–3031. [Google Scholar] [CrossRef]
  5. Shi, L.; Schreck, C.J., III; John, V.O. HIRS channel 12 brightness temperature dataset and its correlations with major climate indices. Atmos. Chem. Phys. 2013, 13, 6907–6920. [Google Scholar] [CrossRef] [Green Version]
  6. Shi, L.; Bates, J.J. Three decades of intersatellite-calibrated High-Resolution Infrared Radiation Sounder upper tropospheric water vapor. J. Geophys. Res. 2011, 116, D04108. [Google Scholar] [CrossRef]
  7. Lee, H.-T. Outgoing Longwave Radiation—Monthly Climate Data Record Algorithm Theoretical Basis Document. NOAA/NCDC Report; 2014. Available online: https://www1.ncdc.noaa.gov/pub/data/sds/cdr/CDRs/Outgoing%20Longwave%20Radiation%20-%20Monthly/AlgorithmDescription_01B-06.pdf (accessed on 10 July 2021).
  8. Susskind, J.; Rosenfield, D.; Reuter, D.; Chahine, M.T. Remote sensing of weather and climate parameters from HIRS2/MSU on TIRON-N. J. Geophys. Res. 1984, 89, 4677–4697. [Google Scholar] [CrossRef]
  9. Schluessel, P. Infrared Remote Sensing of Surface Temperatures as Well as Atmospheric Temperature and Water Vapour Structures. 1987. Available online: https://www.osti.gov/etdeweb/biblio/6091794 (accessed on 9 January 2023).
  10. Reale, A.; Tilley, F.; Ferguson, M.; Allegrino, A. NOAA operational sounding products for advanced TOVS. Int. J. Remote Sens. 2008, 29, 4615–4651. [Google Scholar] [CrossRef]
  11. Shi, L.; Matthews, J.; Ho, S.-P.; Yang, Q.; Bates, J. Algorithm Development of Temperature and Humidity Profile Retrievals for Long-Term HIRS Observations. Remote Sens. 2016, 8, 280. [Google Scholar] [CrossRef] [Green Version]
  12. Chen, R.; Cao, C.; Menzel, W.P. Inter-satellite calibration of NOAA HIRS CO2 channels for climate studies. J. Geophys. Res. 2013, 118, 5190–5203. [Google Scholar] [CrossRef]
  13. Zhang, B.; Cao, C.; Liu, T.-C.; Shao, X. Spectral Recalibration of NOAA HIRS Longwave CO2 Channels toward a 40+ Year Time Series for Climate Studies. Atmosphere 2021, 12, 1317. [Google Scholar] [CrossRef]
  14. Cao, C.; Goldberg, M.; Wang, L. Spectral Bias Estimation of Historical HIRS Using IASI Observations for Improved Fundamental Climate Data Records. J. Atmos. Ocean. Technol. 2009, 26, 1378–1387. [Google Scholar] [CrossRef]
  15. Shi, L.; Bates, J.J.; Cao, C. Scene radiance dependent intersatellite biases of HIRS longwave channels. J. Atmos. Oceanic Technol. 2008, 25, 2219–2229. [Google Scholar] [CrossRef]
  16. Shi, L. Intersatellite Differences of HIRS Longwave Channels between NOAA-14 and NOAA-15 and Between NOAA-17 and MetOp-A. IEEE Trans. Geosci. Remote Sens. 2013, 51, 1414–1424. [Google Scholar] [CrossRef]
  17. Maddy, E.; King, T.; Sun, H.; Wolf, W.; Barnet, C.; Heidinger, A.; Cheng, Z.; Gambacorta, A. Multispectral cloud-clearing using IASI sounding and collocated AVHRR imager measurements. J. Atmos. Oceanic Technol. 2010, 28, 1104–1116. [Google Scholar] [CrossRef]
  18. EUMETSAT. IASI Level 1 Product Guide; Doc. No. EUM/OPS-EPS/MAN/04/0032; EUMETSAT: Darmstadt, Germany, 2017. [Google Scholar]
  19. Jackson, D.L.; Bates, J.J. A 20-year TOVS radiance pathfinder data set for climate analysis. In Proceedings of the 10th Conference on Satellite Meteorology, AMS Annual Meeting, Long Beach, CA, USA, 9–14 January 2000. [Google Scholar]
  20. Young, A.H.; Knapp, K.R.; Inamdar, A.; Hankins, W.; Rossow, W.B. The International Satellite Cloud Climatology Project H-Series climate data record product. Earth Syst. Sci. Data 2018, 10, 583–593. [Google Scholar] [CrossRef] [Green Version]
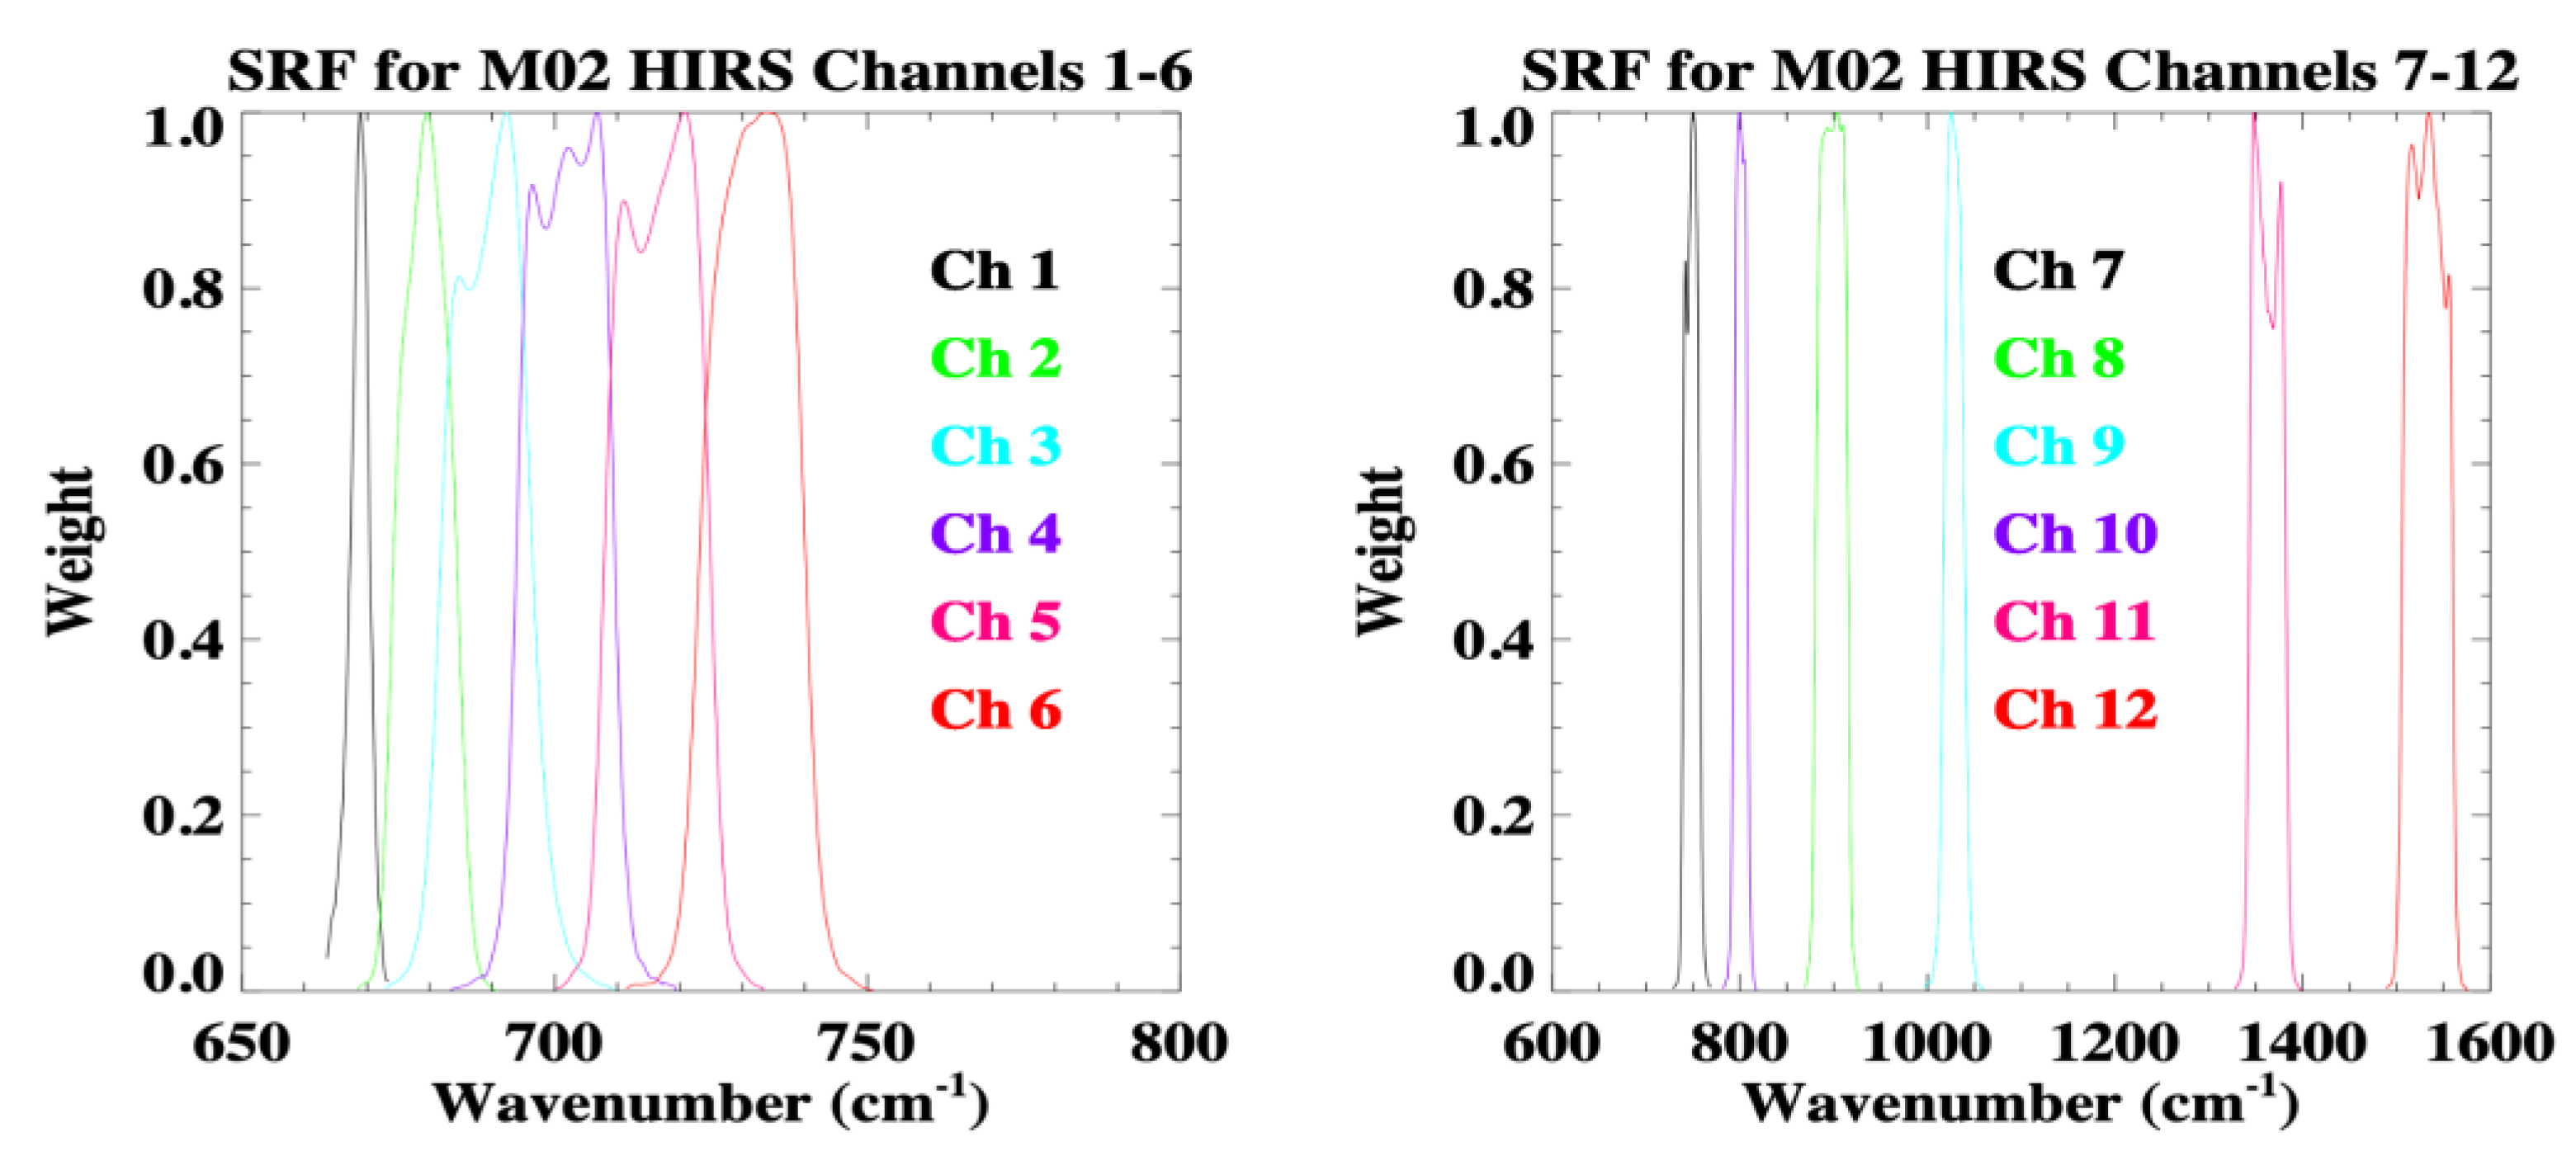
Figure 1. SRFs for MetOp -2 HIRS channels 1–6 (left panel) and 7–12 (right panel).
Remotesensing 15 00717 g001
Figure 2. Spatial distribution of HIRS brightness temperature prior to limb correction for channel 6 for a sample day (5 January 2011) for descending orbits in the top panel, while the middle panel shows the same for the IASI-simulated HIRS (IHIRS_DSC) prior to applying the limb correction. The bottom panel is the difference (IHIRS_DSC-HIRS_DSC) for the descending orbits.
Remotesensing 15 00717 g002
Figure 3. Flowchart depicting steps in deriving C-IHIRS data. Acronyms ASC, DSC, CLD, and CLR represent ascending, descending, cloudy, and clear respectively. Parameters “parms” include brightness temperature and cloud conditions.
Remotesensing 15 00717 g003
Figure 4. The difference in brightness temperatures with limb correction and without limb correction (represented as DLC) for 5 January 2011 for HIRS channel 6 (top) for descending orbits in the top panel, while the middle panel shows the geographical distribution of (IHIRS_DLC-HIRS_DLC). The bottom panel shows variation of the difference (IHIRS_DLC-HIRS_DLC) as a function of HIRS_DLC. Units for the color bar are in K.
Remotesensing 15 00717 g004
Figure 5. Same as Figure 4, but for channel 12.
Remotesensing 15 00717 g005
Figure 6. Limb−corrected BT for descending orbits for 5 January 2011 showing that the previously reduced BT along both sides of scanlines due to limb effect seen in Figure 2 is corrected.
Remotesensing 15 00717 g006
Figure 7. (a) Difference in brightness temperatures (dBT) between IHIRS and HIRS as a function of BT range (10 K intervals) for channels 1–6 for cloudy (>10% cloud) case. Each data point (black for ascending and red for descending orbits) represents a 3 year median value for 1 month. (b) Same as in (a), but for channels 7–12. (c) Same as in (a), but for clear (<10% cloud) skies. (d) Same as in (c), but for channels 7–12.
Remotesensing 15 00717 g007aRemotesensing 15 00717 g007b
Figure 8. (a) The performance of the calibration for all channels (1–12) for January. Clusters of eight bars for each channel. Red-colored bars represent dBT prior to calibration, and the other colored bars represent dBT after applying the offsets for each of the four categories (CLD_ASC, CLR_ASC, CLD_DSC, and CLR_DSC). dBT values are the median of 5 years (2011–2015). (b) Same as Figure 7a, but for the month of July.
Remotesensing 15 00717 g008aRemotesensing 15 00717 g008b
Figure 9. Time series of median difference (C-IHIRS−HIRS) for each day from 2011 to 2015 for channel 6.
Remotesensing 15 00717 g009
Figure 10. Same as Figure 9 except for channel 12.
Remotesensing 15 00717 g010
Table 1. HIRS channel spectral characteristics used in the present study.
ChannelCentral FrequencyWavenumberMain Absorbing SpeciesPeak of the Weighting Function (hPa)
microncm−1
114.95668.9CO230
214.72679.2CO260
314.47691.1CO2100
414.21703.6CO2400
513.95716.1CO2600
613.64732.4CO2/H2O800
713.35749.1CO2/H2O900
811.11900Window/H2OSurface
99.711030O325
1012.47801.9H2O900
117.331364H2O700
126.521534H2O500
Table 2. Mean standard deviation (mean of January, April, July, and October) of dBT after calibration for all categories in Figure 8. Units are in K.
ChannelCLD_ASCCLR_ASCCLD_DSCCLR_DSC
10.0050.0080.0070.011
20.0550.0540.0580.049
30.0490.0460.0530.044
40.030.0270.0360.030
50.0160.0140.0180.017
60.0100.0020.0150.013
70.0130.0090.0150.011
80.0060.0100.0040.006
90.0120.0150.0130.011
100.0070.0090.0070.009
110.0070.0080.0080.009
120.0260.0250.030.026
Disclaimer/Publisher’s Note: The statements, opinions and data contained in all publications are solely those of the individual author(s) and contributor(s) and not of MDPI and/or the editor(s). MDPI and/or the editor(s) disclaim responsibility for any injury to people or property resulting from any ideas, methods, instructions or products referred to in the content.