Article

Spatiotemporal Distribution Pattern and Driving Factors Analysis of GPP in Beijing-Tianjin-Hebei Region by Long-Term MODIS Data

1
State Key Laboratory of Remote Sensing Science, Aerospace Information Research Institute, Chinese Academy of Sciences, Beijing 100101, China
2
University of Chinese Academy of Sciences, Beijing 100094, China
3
Forestry College, Inner Mongolia Agricultural University, Huhhot 010018, China
4
China Siwei Surveying and Mapping Technology Co., Ltd., China Aerospace Science and Technology Corporation, Beijing 100094, China
*
Author to whom correspondence should be addressed.
Remote Sens. 2023, 15(3), 622; https://doi.org/10.3390/rs15030622
Submission received: 12 December 2022 / Revised: 14 January 2023 / Accepted: 17 January 2023 / Published: 20 January 2023

Abstract

:
Gross primary productivity (GPP) is an important parameter that represents the productivity of vegetation and responses to various ecological environments. Using the Mann–Kendall methods, Pearson correlation, and the Geodetector, this study investigated the spatiotemporal variation and driving factors of GPP from 2000 to 2020. The results showed that (1) in terms of spatial distribution, GPP showed a trend of “low-high-low” regions, with low values for grassland and arable land and a high value for forest land. The growth trend is fast in forest areas, while the growth trend is not obvious in cultivated areas. The regions with significant growth accounted for 68.73% of the whole region. (2) The whole region shows a growth rate of 2.07 g C∙m−2∙yr−1, showing obvious seasonality, with a slow growth trend in spring and autumn and a fast growth trend in summer. (3) The driving factors of GPP spatial differentiation in the Beijing-Tianjin-Hebei region were land surface temperature, land use type, and nighttime light data, while precipitation and downward surface shortwave radiation show no strong explanatory power for the spatial differentiation of GPP, which means that these two factors have less driving force on the spatial differentiation of GPP. The interaction of LUCC with the other factors presents two-factor enhancement, while the LST interaction with the other three factors presents non-linear enhancement. This study could provide a theoretical basis for the sustainable development of the Beijing-Tianjin-Hebei Region.

1. Introduction

Gross primary production (GPP) refers to the rate at which chemical energy is acquired by ecosystem producers over a given period of time and stored as biomass through photosynthesis [1]. GPP not only reflects vegetation growth, but also the carbon exchange process between terrestrial ecosystem and atmosphere, which is the key flux driving the terrestrial carbon cycle. Quantitative calculation of GPP and analysis of its temporal and spatial distribution are the focus of carbon cycle research [2].
At present, the most widely used method to calculate GPP is to use the light energy utilization ratio (LUE) for inversion, where LUE is essentially used as the core of a physical model in GPP products around the world [3], e.g., the Carnegie-Ames-Stanford Approach (CASA) Model [4], Global Production Efficiency Model (GLOPEM) [5], Eddy Covariance-Light Use Efficiency (EC-LUE) [6], MOD17 algorithm [7], Vegetation yield Model (VPM) [8], C-Flux [9], etc.
At present, the spatiotemporal analysis of GPP primarily focuses on the spatial distribution pattern of GPP and the inter-annual and intra-annual changes of GPP, e.g., spatiotemporal vegetation variations in the Greater Khingan Mountain on the basis of GPP products that were generated by the GLASS program from 1982 to 2015 [10]. The spatial pattern analysis of GPP can clarify the changes of GPP in different geographical environments [11]. Researchers use GPP trends to measure the influence of human factors and natural pressures on GPP. Additionally, the inter-annual variation of GPP can reflect the inter-annual variation driven by climate change [12]. Current research on GPP generally adopts the correlation coefficient method and trend analysis to analyze the spatial distribution and driving factors of GPP concentrated in the perspective of the dynamic changes, and correlation between all aspects of the spatial differentiation with the static study being lesser, especially as the quantitative attribution to the interaction between natural elements factor is relatively weak [13]. On the basis of traditional analysis methods, we use the Geodetector, which is a statistical tool to measure spatially stratified heterogeneity, to detect the explanatory power of single factors on GPP and the interaction between factors quantitatively [14]. For instance, the geodetector model was used to explore the dominant drivers of spatial variation in grassland NDVI, combined with 34 factors covering natural environmental changes and human disturbances over the same period [15]. In the past, when geographical detectors were used to analyze GPP in the Beijing-Tianjin-Hebei (BTH) region, the driving factors were generally natural factors. We added two human factors to the main natural factors for analysis [16].
The BTH is the region which is the largest in economic scale and has the highest level of development in northern China [17]. It is a key ecological region in the North China Plain and plays an important role in the regional ecological security pattern. It is also an important heavy industry base in China, with carbon emissions of 1.085 billion tons in 2018, accounting for approximately one ninth of the country’s carbon emissions.
Due to the fragile ecological environment in the BTH, and with the acceleration of urbanization, urban carbon emissions show a continuous increasing trend [18]. In order to figure out the coordinated development of BTH and adhere to the principle of ecological priority, this study analyzed the spatiotemporal distribution pattern of GPP in BTH from 2000 to 2020 and analyzed the ecological development trend of this region. Through the analysis of temperature, precipitation, downward surface shortwave radiation, and other factors, the distribution of driving factors of GPP change in the BTH was obtained, so as to realize the control of ecological change in the BTH and provide a reference for the coordinated development of ecology, economy, and society.

2. Materials and Methods
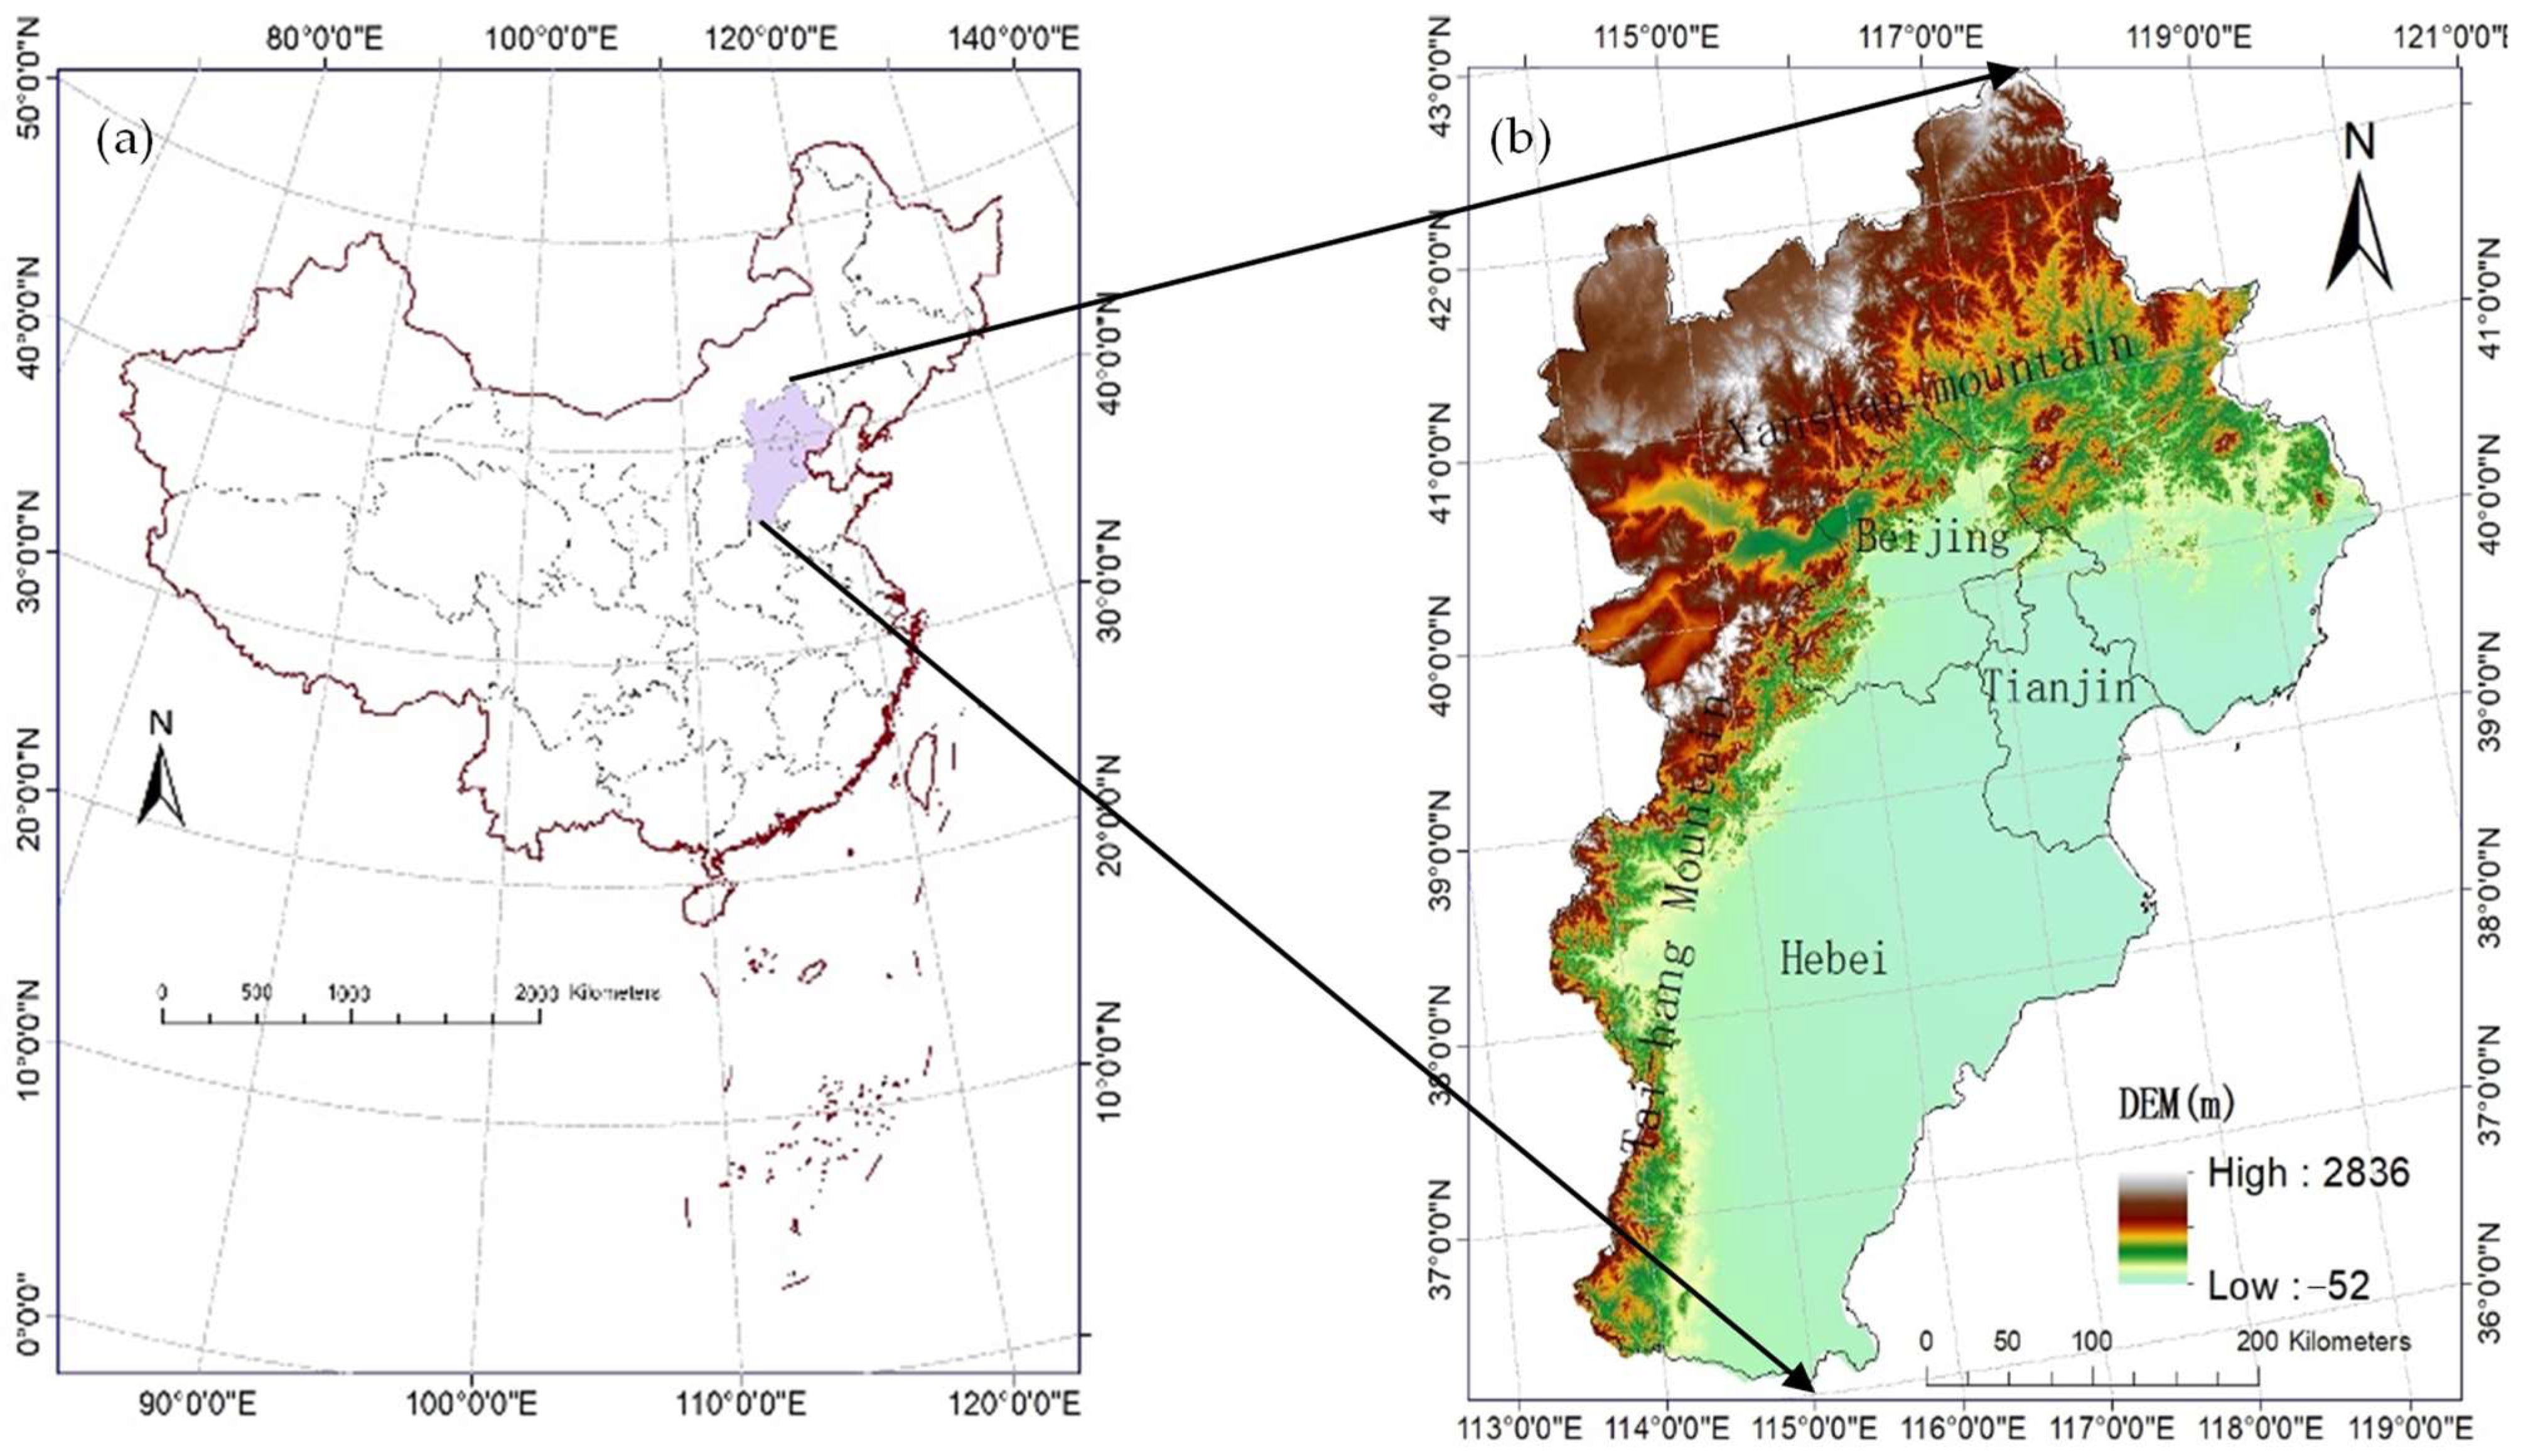
2.1. Study Area

Located at 36°03′N~42°32′N, 113°30′N~119°15’N (Figure 1), the BTH is composed of 11 municipal administrative units in Beijing, Tianjin, and Hebei Province with a total area of about 216,000 km2. The whole study area has a continental monsoon climate, with short spring and autumn seasons, hot and rainy summers, and cold and dry winters. Precipitation distribution is not uniform, with the southeast receiving more precipitation than the northwest. The terrain of the study area is inclined from northwest to southeast, with mountains mostly distributed in the northwest and north, and plains in the middle and south. Due to climate change, topography, and human activities, the proportion of cultivated land in BTH is the highest, followed by forest [19].
As the largest economic region in the north, the BTH’s GDP in 2020 was approximately 8.6 trillion yuan, accounting for about 8.5% of the national GDP. The industrial structure of the region has been dominated by secondary and tertiary industries, and the proportion of the tertiary industries has been increasing, while that of primary industries has been decreasing, and the industrial structure has been constantly improving [20].

2.2. Data

2.2.1. GPP Datasets

MOD17 GPP outputs were used in global carbon cycle analysis, ecosystem status assessment, and environmental change monitoring. The MOD17 algorithm is based on the original radiation use efficiency logic of Monteith. The GPP can be estimated using the LUE model as follows:
GPP = ε× (IPAR × FPAR)
where IPAR is the incident photosynthetically active radiation ( MJ   m 2 ), FPAR is the fraction of photosynthetically active radiation absorbed by the vegetation canopy, and ε is the efficiency coefficient, which varies widely with different vegetation types.
The MOD17A2H 006 product exhibited a long temporal cover, which includes data every eight days starting from 2000 to the present with a spatial resolution of 500 m, so we used it to analyze the spatiotemporal distribution and variation of GPP in BTH [21].
Aiming to exploring inter-annual variation of GPP, we calculated accumulated GPP during the growing season from April to October [22], the spring season from March to May, the summer season from June to August, and the autumn season from September to November of each year.

2.2.2. Auxiliary Datasets

In this study, we use two kinds of data: meteorological datasets (land surface temperature (LST), precipitation (PR), downward surface shortwave radiation (SRAD)) and human intervention indices (land-use and land-cover change (LUCC), nighttime light data (LIGHT)).
We use the land surface temperature from MOD11A2 as the temperature dataset, which includes data every eight days starting from 2000 to 2020 with a spatial resolution of 1000 m [23]. We use the CHIRPS precipitation product to evaluate the influence of precipitation [24]. The downward surface shortwave radiation is obtained from TerraClimate, which is a dataset of monthly climate and climatic water balance for global terrestrial surfaces [25]. We obtained the land-use and land-cover change data from the Resource and Environment Science and Data Center (http://www.resdc.cn (accessed on 1 April 2022)), with a spatial resolution of 1000 m. The nighttime light data used come from an extended time-series (2000–2020) of global NPP-VIIRS-like nighttime light data from cross-sensor calibration [26].
The satellite data used for the study (GPP, temperature, precipitation, downward surface shortwave radiation) were obtained using Google Earth Engine (GEE) [27]. All of these programs were coded in GEE Code Editor. The workflow of this research is shown in Figure 2.

2.3. Methods

2.3.1. Pearson Correlation

Pearson correlation is used to reflect the degree of linear correlation between two random variables. It can be expressed as follows:
r = i = 1 n x i   x ¯ y i   y ¯ i = 1 n x i   x ¯ 2 i = 1 n y i   y ¯ 2
where x i and y i (i = 1, 2, …, n) are time series for two variables,   x ¯ and   y ¯ are multi-year average values of two variables, and r is the correlation coefficient. The value r > 0 (near +1) reflects a perfect positive correlation between x and y, the value r < 0 (near −1) reflects a perfect negative correlation between x and y, and the value r = 0 indicates that no correlation can be found between x and y. We use the 0.05 significance level to conduct all of the results [28].
We use long-term GPP data and three meteorological datasets to calculate the correlation between GPP and temperature, precipitation, and downward surface shortwave radiation, so that we can explore the relationship of the distribution of GPP and these factors [29].

2.3.2. Mann-Kendall Trend Test

The Mann–Kendall trend test (sometimes called the M-K test) is used to analyze data collected over time for consistently increasing or decreasing trends (monotonic) in Y values [30]. Therefore, in this study, we use the MK test to detect monotonic trends in the GPP data series. It can better show the changes of GPP in the BTH over the past 20 years.
The Mann–Kendall test for a time series x 1 , x 2 , …, x n of length n is supposed to compute the indicator function sgn x i x j such that:
sgn x i x j = 1 ,     x i x j > 0   0 ,     x i x j > 0   1 ,     x i x j > 0
S = i = 1 N 1 j = i + 1 N s g n ( x i x j )
where N is the length of the dataset and x i , x j denote the data value of times i and j. A negative value of S indicates a decreasing trend, while a positive value indicates an increasing trend [31]. The statistical significance of the trend is checked using the variance of the MK statistics, while N > 10, which is calculated as:
Var s = n n 1 2 n + 5 i = 1 p q i q i 1 2 q i + 5 18
where p is the number of parallel groups in the data and q i is the number of data points contained in the k-th parallel group. If the binding group is not available, this summation process is eliminated from the equation. The standard Z-value of the test statistic can be estimated by the following formula:
Z = S 1 Var S   S > 0   0 ;   S = 0 S 1 Var S   S < 0
If the calculated standard Z value is greater than the critical value of the standard normal distribution at the specified significance level (α), it was identified as a significant trend and the null hypothesis is rejected.
In this paper, the GPP data from 2000 to 2020 are calculated pixel-by-pixel, the trend of 21 data values of each pixel is calculated, its slope is taken as the trend of GPP change, and its significance is calculated.

2.3.3. Geodetector

Geodetector is a group of statistical methods that detect spatial variability and reveal the driving factors [32]. The geodetector consists of four parts: risk detector, factor detector, ecological detector, and interaction detector [15].
Factor detector: Factor detector detects the spatial stratified heterogeneity (SSH) of the dependent variable y (GPP value) and the explanation degree of the independent variable x (natural factor and human factor) to the SSH of y value. The expression is as follows:
q = 1 h = 1 L N h σ h 2 N σ 2
where L is the stratification of the dependent variable GPP or influence factor X, N and N h are the number of sample units in strata h and the total region, respectively. σ h 2 and σ 2 are the variance in the h strata and the variance in the region. The larger the value, the stronger the explanatory power of each factor. In this paper, q value indicates the degree of explanation of different drivers.
Interaction detector: Interaction detector identifies the interaction between the different risk factors X, i.e., whether the meteorological variables X 1 and X 2 work together to increase or decrease the explanatory power of the dependent variable Y, or whether the effects of these factors on Y are independent of each other. Interactions can be classified into five types, as shown in Table 1.
Risk detector: Risk detection is used to determine whether there is a significant difference in the mean value of attributes between two sub-regions. On the strength of this, we can search the suitable region of factors affecting the dependent variable GPP.
Ecological detector: Ecological detector determines whether there is a significant difference between two factors ( X 1 and X 2 ) in terms of their influence on the spatial pattern of GPP change, which is examined by F statistic:
F = N X 1 N X 2 1 S S W X 1 N X 2 N X 1 1 S S W X 2  
S S W X 1 = h = 1 L 1 N h σ h 2 N σ 2   ,   S S W X 1 = h = 1 L 1 N h σ h 2 N σ 2
where N X 1 and N X 2 represent the sample number of two factors ( X 1 and X 2 ), respectively. S S W X 1 and S S W X 1 represent the sum of variance of each class formed by two factors ( X 1 and X 2 ), respectively. X 1 and X 2 represent the number of classes for variable X 1 and X 2 , respectively. F-test was used to determine the significance level of F statistic.
Generally, natural and human factors are the main factors affecting GPP. Therefore, this paper selected three natural and two human activity factors to form the influencing factors of GPP. GPP, precipitation, and downward surface shortwave radiation were calculated as multi-year accumulated values, whereas temperature and nighttime light data were calculated as multi-year average values. All data need to be discretized. The natural breaks (jenks) method in ArcGIS is used for discretization (LST and PR are 6 levels, SRAD and LIGHT are 8 levels, LUCC is 7 levels.), and classification results are applied to create a fishing net tool and generated a grid of 5 × 5 km. A total of 8600 center points were used as sampling points to extract the corresponding attribute values of the GPP and impact factors. Quantitative relationships between GPP and impact factors can be obtained by the Geodetector in BTH.

3. Results

3.1. Spatiotemporal Distribution and Variation of GPP

Figure 3a shows that the GPP ranges from 350 to 1100 g   C / m 2 , where the high values are mainly concentrated in the northern and western Tai-hang Mountains, and the GPP ranges from 600 to 850 g   C / m 2 . The areas with low values are mainly concentrated in coastal and urban areas. The northwest and the southern Plains range from 300 to 500 g   C / m 2 . The effect of topography and vegetation type on GPP distribution can be clearly seen.
Figure 3b shows the spatiotemporal variation of the annual growth rate of GPP: in the plains area, the growth rate of GPP is between 0 and 15 g   C · m 2 · y r 1 , and in the mountainous forest area in the northwest and north, the growth rate is between 15 and 20 g   C · m 2 · y r 1 . The mountainous forest area is significant, while the non-significant area is distributed in the central and southern plains area. This may be related to land use type. Over the whole region, the proportion of the area with a growth trend is 68.73%, while the area with a decreasing trend is 0.44%, and the rest is 30.83%.
We calculated the mean value of GPP in the whole region and processed the mean value of GPP every year by way of linear fitting, as shown in Figure 4. The overall trend of GPP from 2000 to 2020 was increased at a rate of 2.07 g   C · m 2 · y r 1 . In the 21 years, the maximum value of GPP appeared in 2016 and the minimum value in 2001.
According to the seasonal classification of GPP, spring is from March to May, summer is from June to August, autumn is from September to November, and growing season is from April to October [33]. Figure 5 shows that the growth rate is the fastest in the summer season from 2000 to 2020, with an increase rate of 4.26 g   C · m 2 · y r 1 . The growth trend of the whole growing season is slightly slower than that of summer. The growth rate in spring is 2.62 g   C · m 2 · y r 1 , and the growth trend in autumn is the slowest at only 1.78 g   C · m 2 · y r 1 per year. It is speculated that the growth rate is related to vegetation phenology. In summer, vegetation grows heavily and there is a large gap with spring and autumn. In autumn, crop harvesting and defoliation in broad-leaved forests will lead to a sharp decline in GPP and slow down the growth rate.

3.2. Correlation Distribution of GPP with Precipitation, Temperature and Downward Surface Shortwave Radiation

Figure 6 shows that in the north and the west of the BTH, GPP presents a low correlation with LST, with the correlation coefficient being between 0 and 0.2. In the central and southern plains, GPP presents a strong correlation with the LST, indicating that there is obvious spatial differentiation between the inter-annual variation of GPP and LST, which means in different land use types the driving force of LST is different. The inter-annual variation of GPP is not correlated with the inter-annual variation of precipitation, indicating that the change trend of GPP has no obvious driving relationship with precipitation, and as such there is no spatial difference between precipitation change and GPP change in the whole study area. At the same time, the inter-annual variation of GPP in the whole region is strongly correlated with the downward surface shortwave radiation, indicating that the continuous growth of GPP over time is strongly correlated with downward surface shortwave radiation. The growth of GPP is driven by the downward surface shortwave radiation, and the growth is not affected by spatial differentiation.

3.3. Geodetector of GPP Spatial Distribution

We used land surface temperature data, precipitation data, downward surface shortwave radiation, night light data, and land use data for the years 2000, 2005, 2010, 2015, and 2020, and resampled the five types of the data to achieve a spatial resolution of 500 m. There are seven types of land use data: residential land, forest, water body, grassland, unused land, cultivated land, and sea. Then, we classified five kinds of data, and the classification results are sampled by fishnet. The sample points are at an interval of 5000 m, and we put these sample points into the Geodetector. The results of these five years are obtained by calculating the obtained sample points. Figure 7 shows the spatial distribution of the five factors, taking 2020 as an example.

3.3.1. Factor Detector

Five natural and human factors, including land surface temperature, precipitation, downward surface shortwave radiation, nighttime light data, and land use type data, were calculated using Geodetectors. Taking 2020 as an example, the results in Table 2 show the explanatory power of each factor on the spatial differentiation of GPP, ranked as follows: land use type (0.336) > temperature (0.325) > night light data (0.236) > precipitation (0.092) > downward surface shortwave radiation (0.032). It can be seen that for the spatial distribution of GPP in the growing season, land use type has a great influence, and nighttime light data show that human activities also have great influence on the distribution of GPP. Among the natural factors, surface temperature is the dominant factor, and precipitation and downward surface shortwave radiation have less influence, which may be related to the uniform distribution of precipitation and downward surface shortwave radiation in the whole research area. Throughout the time period, human activity was more influential than nature in the study area.
Figure 8 shows that land surface temperature and land use type have always been the leading factors of spatial differentiation of GPP in BTH in the past 20 years. Human activities, such as urbanization processes reflected by night light intensity, represent the secondary economic and social factors affecting GPP change, and their influence keeps rising with the development of society and the economy. Precipitation and downward surface shortwave radiation have little influence on GPP. On the whole, the influence of human activities continues to rise, while the explanatory power of natural factors remains basically stable.

3.3.2. Ecological Detector

Ecological detector is used to represent the significance of the difference between influence factors regarding the impact of the spatial distribution of GPP. The results presented in Table 3 show that the land use types and precipitation, downward surface shortwave radiation, and nighttime light have significant differences, and for the land surface temperature and precipitation, downward surface shortwave radiation, and nighttime light, there is no significant difference with land use types. The results show that the land surface temperature distribution is related to the other four factors, but the land use type has no obvious relationship with precipitation, downward surface shortwave radiation, and night light.

3.3.3. Interaction Detector of Five Factors

The purpose of factor interaction detection is to identify the interaction between different risk factors X, which determines whether the influence of these factors on Y is independent of each other.
Table 4 shows that the interaction factors of surface temperature and precipitation, downward surface shortwave radiation, and night light all show nonlinear enhancement, as do precipitation and downward surface shortwave radiation. The interaction factors between land use type and surface temperature, precipitation, downward surface shortwave radiation, and night light all showed double factor enhancement. In particular, night light and precipitation are mutually independent, and their interaction factor is the sum of the contributions of the two factors.

3.3.4. Risk Detector of Five Factors

According to the risk detection of the five factors (Table 5), we calculated the suitable range of each factor and analyzed the best type for GPP distribution. In this area, when LST was in the range of 13.2–21.1 °C, precipitation was in the range of 645–788 mm, downward surface shortwave radiation was in the range of 223.3–224.7 W / m 2 , and GPP value was the highest. The GPP value reached the maximum range when the DN value was the lowest, which indicated that the vegetation damage was the least and the GPP value was larger in places where human activities were not obvious. In the case of forest land, GPP showed the maximum value, indicating that forest land was the main contribution land use type of GPP in this region, and trees could provide more productivity than other vegetation.

4. Discussion

The BTH is a typical area sensitive to climate change. In recent years, extreme weather events in the BTH have been occurring frequently, and their frequency and intensity are gradually increasing, which have brought many adverse effects on the ecological environment. In view of the special geographical location and climate characteristics of the BTH, as well as its important economic status, we analyzed the gross primary productivity of the whole region from 2000 to 2020 to test the protection effect of the ecological environment in the BTH after the implementation of ecological projects aiming to return farmland to forest and grassland post-2000 [34].

4.1. Spatiotemporal Distribution in the BTH

The temporal and spatial distribution trend of gross primary productivity in BTH from 2000 to 2020 was studied in this paper. Hence, GPP in BTH shows an increasing trend over time in the last 20 years, which also indicates the role of the ecological restoration by returning farmland to forest and grassland [35]. In terms of spatial distribution, GPP in the BTH showed a low-high-low trend. Starting from the Zhangjiakou region in the northwest, the Bashang grassland region mainly consists of grassland and arable land, which has a low GPP value, while the Yanshan and Tai-hang Mountains are mainly forest land with a high GPP value [36]. The central and southern parts of the BTH is mostly cultivated land, and the GPP values are low. These findings are consistent with other studies. According to the growth trend in the past 20 years, the forest showed a faster growth trend, while the northern grassland and cultivated land showed a growth trend, and the cultivated land in the central and southern areas showed no obvious growth trend. According to the growth trend in different seasons, the growth rate in summer is higher than that in spring and autumn, indicating that summer is the rapid growth period of GPP and is also the main reason for the growth of the whole growth season.

4.2. Correlation between GPP and LST, PR, SRAD

In this paper, the correlation calculation of selected driving natural factors of GPP was carried out. The results show that the mean value of GPP has a high correlation with land surface temperature [37], and there is a significant correlation in the Yanshan and Tai-hang Mountains. However, the overall correlation is low, and the correlation coefficient ranges from 0 to 0.2, while there is a high significant correlation in the central and southern plains region. The results showed that the distribution of gross primary productivity and land surface temperature has a strong correlation [38]. The correlation between GPP and precipitation shows that the whole region presents a significant correlation, but the correlation is low, indicating that although the increase of GPP in 20 years is related to the increase of precipitation, there is no strong significant correlation, and the regional difference is small, indicating that the precipitation gap is not obvious for the whole study area. For the correlation between downward surface shortwave radiation and GPP, the variation trend of GPP in the whole region has a very strong and significant correlation with downward surface shortwave radiation in the past 20 years. This result indicates that downward surface shortwave radiation has no obvious spatial difference but has a very strong driving effect on the long-term change of GPP [39].

4.3. Dominant Driving Factors of GPP

When exploring the spatial distribution of GPP in the BTH, we selected three natural driving factors (surface temperature, precipitation, and downward shortwave radiation) and two human driving factors (nighttime light data and land use data) [40]. With these five factors, we quantitatively calculated the explanatory credibility and interaction between factors. The results show that land surface temperature is the most important natural factor that influences the spatial distribution [41] of GPP in the BTH. It is speculated that land surface temperature may affect the gross primary productivity of vegetation photosynthesis, leading to spatial differentiation within the region. Precipitation [42] and the downward surface shortwave radiation effects on the spatial distribution are small. It can be speculated that if the northern regional precipitation difference is not big enough, the vegetation survival demand is small, and cultivated land types of irrigation may affect the distribution of GPP. Downward surface shortwave radiation was not a large factor, with its value changing little due to a small difference in elevation in the BTH, showing little influence on spatial heterogeneity. Both nighttime light data and land use data showed significant contributions. Land use type directly determines the presence and type of vegetation, so it has a direct contribution to the spatial distribution of GPP, which is similar to the results of previous studies [43]. As one of the characteristics of human activities, the contribution of nocturnal light data indicates that the spatial distribution of GPP is affected by human activities, and the gross primary productivity of vegetation is lower in areas with frequent human activities [44].
The results of interaction factor analysis shows that the synergistic effect of two factors increases the explanatory power of the spatial differentiation of GPP compared with the single factor effect. According to Table 5, the interaction between LST and precipitation, downward surface shortwave radiation, and night light all showed nonlinear enhancement, indicating that precipitation, shortwave radiation, night light, and other factors increased the explanatory power of spatial differentiation of GPP due to their combination with LST. The interaction between land type and the four factors showed that all the four factors enhanced the explanatory power of land use on the spatial differentiation of GPP. Therefore, we should pay more attention to the positive and negative effects of environmental factors interaction on vegetation productivity and regional carbon storage while focusing on the impact of single factors on GPP [45].
In this paper, the spatial distribution and temporal variation of GPP in the past 20 years were analyzed, and the correlation of natural factors was explored. The spatial differentiation of GPP in the BTH was analyzed using geographic detectors, and the driving factors and influencing mechanisms of spatial analysis of GPP in the BTH were studied.

4.4. Limitations of the Current Study

The first limitation is the selection of data resolution. Using higher resolution data at the provincial scale will make the results more accurate, and subsequent research needs to use higher resolution data for analysis.
The second limitation is land surface temperature data. Because land surface temperature is affected by radiation balance, evapotranspiration, and land type, it is not a primary variable. Subsequent studies will explore the differences between weather station data and land surface temperature data.
The third limitation is the data limitation. There are a few driving factors involved in this paper. In subsequent work, more driving factors should be considered as much as possible, as well as data related to national policies [46]. The effect of the classification method on the final result should be taken into account in the geographical detector.

5. Conclusions

Based on the data of gross primary productivity in the BTH from 2000 to 2020, this paper analyzed the spatial distribution and temporal changes of GPP in the past 21 years, the growth trend, and the correlation between the change trend and surface temperature, precipitation, downward surface shortwave radiation, etc. In addition, geodetectors were used to quantitatively detect the driving mechanism of each influencing factor on the spatiotemporal variability of GPP in the BTH by using the five selected factors, which include land surface temperature, precipitation, short-wave radiation, nighttime light data, and land use type. The main conclusions are as follows:
(1)
As far as spatial distribution is concerned, from northwest to southeast, the value of GPP gradually increases from a low value and then gradually decreases, which showed a low-high-low trend. The GPP of grassland and cultivated land in the Zhangjiakou region was in the range of 300 to 500 g   C / m 2 , while that of the Yanshan and Tai-hang Mountains was in the range of 600 to 850 g   C / m 2 , and that of cultivated land was in the range of 300–500 g   C / m 2 . The growth trend and spatial distribution showed a similar trend, and the Yanshan and Tai-hang Mountains showed a stronger growth trend, with a growth rate of 20–50 units. The growth trend was relatively slow in the northwest, while the growth area decreased in the central and southern plains, and no significant increase was observed in most regions. However, 68.73% of the area in the whole BTH showed an increasing trend.
(2)
In terms of time-series, GPP in the BTH presents a significant growth trend and has obvious seasonality, with a faster growth trend in summer and slower growth in spring and autumn. It also showed a relatively fast trend throughout the growing season.
(3)
The driving factors of GPP spatial differentiation in the whole BTH are land surface temperature, land use type, and nighttime light data, while precipitation and shortwave radiation contribute less. The increase of night light data indicates that human activities have an increasing influence on the spatial distribution of GPP.
(4)
The interaction among the five factors showed significant enhancement effects. In the future, proper attention should be paid to the effects of human factors and synergistic effects of multiple factors on the spatial differentiation of GPP, and the driving mechanism of spatial distribution of GPP should be further studied.

Author Contributions

Conceptualization, H.G. and C.C.; data curation, H.G. and X.Y.; formal analysis, H.G.; funding acquisition, C.C. and M.X.; investigation, H.G. and M.X.; methodology, H.G. and K.W.; project administration, C.C., M.X. and X.Y.; resources, C.C.; software, H.G. and Y.C.; supervision, C.C.; validation, H.G. and J.L.; visualization, H.G. and X.G.; writing—original draft, H.G., M.X. and X.Y.; writing—review & editing, H.G. and R.S.D. All authors have read and agreed to the published version of the manuscript.

Funding

This work was supported by the project of the National Key R&D Program of China grant number 2021YFB3901104 and the National Natural Science Foundation of China grant number 41971394 and 2020 Report on Forestry Technological Developments and Monitoring and Assessment of Terrestrial Ecosystem Research grant number 2020132108.

Data Availability Statement

Not applicable.

Conflicts of Interest

The authors declare no conflict of interest.

References

  1. Anav, A.; Friedlingstein, P.; Beer, C.; Ciais, P.; Harper, A.; Jones, C.; Murray-Tortarolo, G.; Papale, D.; Parazoo, N.C.; Peylin, P.; et al. Spatiotemporal patterns of terrestrial gross primary production: A review. Rev. Geophys. 2015, 53, 785–818. [Google Scholar] [CrossRef] [Green Version]
  2. Xiao, X.M.; Hollinger, D.; Aber, J.; Goltz, M.; Davidson, E.A.; Zhang, Q.Y.; Moore, B. Satellite-based modeling of gross primary production in an evergreen needleleaf forest. Remote Sens. Environ. 2004, 89, 519–534. [Google Scholar] [CrossRef]
  3. Wei, S.H.; Yi, C.X.; Fang, W.; Hendrey, G. A global study of GPP focusing on light-use efficiency in a random forest regression model. Ecosphere 2017, 8, e01724. [Google Scholar] [CrossRef]
  4. Field, C.B.; Randerson, J.T.; Malmstrom, C.M. Global Net Primary Production—Combining Ecology and Remote-Sensing. Remote Sens. Environ. 1995, 51, 74–88. [Google Scholar] [CrossRef] [Green Version]
  5. Prince, S.D.; Goward, S.N. Global primary production: A remote sensing approach. J. Biogeogr. 1995, 22, 815–835. [Google Scholar] [CrossRef]
  6. Yuan, W.P.; Liu, S.G.; Yu, G.R.; Bonnefond, J.M.; Chen, J.Q.; Davis, K.; Desai, A.R.; Goldstein, A.H.; Gianelle, D.; Rossi, F.; et al. Global estimates of evapotranspiration and gross primary production based on MODIS and global meteorology data. Remote Sens. Environ. 2010, 114, 1416–1431. [Google Scholar] [CrossRef] [Green Version]
  7. Running, S.W.; Nemani, R.R.; Heinsch, F.A.; Zhao, M.S.; Reeves, M.; Hashimoto, H. A continuous satellite-derived measure of global terrestrial primary production. Bioscience 2004, 54, 547–560. [Google Scholar] [CrossRef]
  8. Xiao, X.M.; Zhang, Q.Y.; Braswell, B.; Urbanski, S.; Boles, S.; Wofsy, S.; Berrien, M.; Ojima, D. Modeling gross primary production of temperate deciduous broadleaf forest using satellite images and climate data. Remote Sens. Environ. 2004, 91, 256–270. [Google Scholar] [CrossRef]
  9. King, D.A.; Turner, D.P.; Ritts, W.D. Parameterization of a diagnostic carbon cycle model for continental scale application. Remote Sens. Environ. 2011, 115, 1653–1664. [Google Scholar] [CrossRef]
  10. Hu, L.; Fan, W.; Ren, H.; Liu, S.; Cui, Y.; Zhao, P. Spatiotemporal Dynamics in Vegetation GPP over the Great Khingan Mountains Using GLASS Products from 1982 to 2015. Remote Sens. 2018, 10, 488. [Google Scholar] [CrossRef]
  11. Goulden, M.L.; Munger, J.W.; Fan, S.M.; Daube, B.C.; Wofsy, S.C. Exchange of carbon dioxide by a deciduous forest: Response to interannual climate variability. Science 1996, 271, 1576–1578. [Google Scholar] [CrossRef] [Green Version]
  12. Verma, M.; Friedl, M.A.; Law, B.E.; Bonal, D.; Kiely, G.; Black, T.A.; Wohlfahrt, G.; Moors, E.J.; Montagnani, L.; Marcolla, B.; et al. Improving the performance of remote sensing models for capturing intra- and inter-annual variations in daily GPP: An analysis using global FLUXNET tower data. Agric. For. Meteorol. 2015, 214, 416–429. [Google Scholar] [CrossRef] [Green Version]
  13. Guan, X.; Shen, H.; Li, X.; Gan, W.; Zhang, L. A long-term and comprehensive assessment of the urbanization-induced impacts on vegetation net primary productivity. Sci. Total Environ. 2019, 669, 342–352. [Google Scholar] [CrossRef] [PubMed]
  14. Cai, L.P.; Fan, D.L.; Wen, X.J.; Wang, H.; Badarifu; Wang, S.S. Spatiotemporal tendency of agricultural water use efficiency in the northernmost Yellow River: Indicator comparison and interactive driving factors. J. Arid Environ. 2022, 205, 104822. [Google Scholar] [CrossRef]
  15. Wang, K.; Cao, C.; Xie, B.; Xu, M.; Yang, X.; Guo, H.; Duerler, R.S. Analysis of the Spatial and Temporal Evolution Patterns of Grassland Health and Its Driving Factors in Xilingol. Remote Sens. 2022, 14, 5179. [Google Scholar] [CrossRef]
  16. Ma, J.; Xiao, X.; Miao, R.; Li, Y.; Chen, B.; Zhang, Y.; Zhao, B. Trends and controls of terrestrial gross primary productivity of China during 2000–2016. Environ. Res. Lett. 2019, 14, 084032. [Google Scholar] [CrossRef] [Green Version]
  17. Peng, C.C.; Li, B.; Nan, B. An analysis framework for the ecological security of urban agglomeration: A case study of the Beijing-Tianjin-Hebei urban agglomeration. J. Clean. Prod. 2021, 315, 128111. [Google Scholar] [CrossRef]
  18. Wang, Z.; Yang, L. Delinking indicators on regional industry development and carbon emissions: Beijing–Tianjin–Hebei economic band case. Ecol. Indic. 2015, 48, 41–48. [Google Scholar] [CrossRef]
  19. Bao, W.; Yang, Y.; Zou, L. How to reconcile land use conflicts in mega urban agglomeration? A scenario-based study in the Beijing-Tianjin-Hebei region, China. J. Environ. Manag. 2021, 296, 113168. [Google Scholar] [CrossRef]
  20. Yang, H.; Tao, W.; Liu, Y.; Qiu, M.; Liu, J.; Jiang, K.; Yi, K.; Xiao, Y.; Tao, S. The contribution of the Beijing, Tianjin and Hebei region’s iron and steel industry to local air pollution in winter. Environ. Pollut. 2019, 245, 1095–1106. [Google Scholar] [CrossRef]
  21. Pei, Y.Y.; Dong, J.W.; Zhang, Y.; Yang, J.L.; Zhang, Y.Q.; Jiang, C.Y.; Xiao, X.M. Performance of four state-of-the-art GPP products (VPM, MOD17, BESS and PML) for grasslands in drought years. Ecol. Inform. 2020, 56, 101052. [Google Scholar] [CrossRef]
  22. Linderholm, H.W. Growing season changes in the last century. Agric. For. Meteorol. 2006, 137, 1–14. [Google Scholar] [CrossRef]
  23. Wan, Z.M. New refinements and validation of the collection-6 MODIS land-surface temperature/emissivity product. Remote Sens. Environ. 2014, 140, 36–45. [Google Scholar] [CrossRef]
  24. Katsanos, D.; Retalis, A.; Michaelides, S. Validation of a high-resolution precipitation database (CHIRPS) over Cyprus for a 30-year period. Atmos. Res. 2016, 169, 459–464. [Google Scholar] [CrossRef]
  25. Abatzoglou, J.T.; Dobrowski, S.Z.; Parks, S.A.; Hegewisch, K.C. TerraClimate, a high-resolution global dataset of monthly climate and climatic water balance from 1958–2015. Sci. Data 2018, 5, 170191. [Google Scholar] [CrossRef] [Green Version]
  26. Chen, Z.; Yu, B.; Yang, C.; Zhou, Y.; Yao, S.; Qian, X.; Wang, C.; Wu, B.; Wu, J. An extended time series (2000–2018) of global NPP-VIIRS-like nighttime light data from a cross-sensor calibration. Earth Syst. Sci. Data 2021, 13, 889–906. [Google Scholar] [CrossRef]
  27. Gorelick, N.; Hancher, M.; Dixon, M.; Ilyushchenko, S.; Thau, D.; Moore, R. Google Earth Engine: Planetary-scale geospatial analysis for everyone. Remote Sens. Environ. 2017, 202, 18–27. [Google Scholar] [CrossRef]
  28. Benesty, J.; Chen, J.; Huang, Y.; Cohen, I. Pearson correlation coefficient. In Noise Reduction in Speech Processing; Springer: Berlin/Heidelberg, Germany, 2009; pp. 1–4. [Google Scholar]
  29. Wu, G.H.; Guan, K.Y.; Jiang, C.Y.; Peng, B.; Kimm, H.; Chen, M.; Yang, X.; Wang, S.; Suyker, A.E.; Bernacchi, C.J.; et al. Radiance-based NIRv as a proxy for GPP of corn and soybean. Environ. Res. Lett. 2020, 15, 034009. [Google Scholar] [CrossRef]
  30. McLeod, A.I. Kendall rank correlation and Mann-Kendall trend test. R Package Kendall 2005, 602, 1–10. [Google Scholar]
  31. Ay, M.; Kisi, O. Investigation of trend analysis of monthly total precipitation by an innovative method. Theor. Appl. Climatol. 2015, 120, 617–629. [Google Scholar] [CrossRef]
  32. Wang, J.F.; Li, X.H.; Christakos, G.; Liao, Y.L.; Zhang, T.; Gu, X.; Zheng, X.Y. Geographical Detectors-Based Health Risk Assessment and its Application in the Neural Tube Defects Study of the Heshun Region, China. Int. J. Geogr. Inf. Sci. 2010, 24, 107–127. [Google Scholar] [CrossRef]
  33. Menzel, A.; Fabian, P. Growing season extended in Europe. Nature 1999, 397, 659. [Google Scholar] [CrossRef]
  34. Li, Z.; Sun, X.; Huang, Z.; Zhang, X.; Wang, Z.; Li, S.; Zheng, W.; Zhai, B. Changes in nutrient balance, environmental effects, and green development after returning farmland to forests: A case study in Ningxia, China. Sci. Total Environ. 2020, 735, 139370. [Google Scholar] [CrossRef] [PubMed]
  35. Zhang, H.; Sun, R.; Peng, D.; Yang, X.; Wang, Y.; Hu, Y.; Zheng, S.; Zhang, J.; Bai, J.; Li, Q. Spatiotemporal dynamics of net primary productivity in China’s urban lands during 1982–2015. Remote Sens. 2021, 13, 400. [Google Scholar] [CrossRef]
  36. Fang, J.; Yu, G.; Liu, L.; Hu, S.; Chapin, F.S., 3rd. Climate change, human impacts, and carbon sequestration in China. Proc. Natl. Acad. Sci. USA 2018, 115, 4015–4020. [Google Scholar] [CrossRef] [Green Version]
  37. Hu, L.; Montzka, S.A.; Kaushik, A.; Andrews, A.E.; Sweeney, C.; Miller, J.; Baker, I.T.; Denning, S.; Campbell, E.; Shiga, Y.P.; et al. COS-derived GPP relationships with temperature and light help explain high-latitude atmospheric CO2 seasonal cycle amplification. Proc. Natl. Acad. Sci. USA 2021, 118, e2103423118. [Google Scholar] [CrossRef]
  38. Yan, S.; Wang, H.; Jiao, K.W. Spatiotemporal dynamic of NDVI in the Beijing–Tianjin–Hebei region based on MODIS data and quantitative attribution. J. Geo-Inf. Sci. 2019, 21, 767–780. [Google Scholar]
  39. Liu, X.J.; Liu, Z.Q.; Liu, L.Y.; Lu, X.L.; Chen, J.D.; Du, S.S.; Zou, C. Modelling the influence of incident radiation on the SIF-based GPP estimation for maize. Agric. For. Meteorol. 2021, 307, 108522. [Google Scholar] [CrossRef]
  40. Zhu, L.J.; Meng, J.J.; Zhu, L.K. Applying Geodetector to disentangle the contributions of natural and anthropogenic factors to NDVI variations in the middle reaches of the Heihe River Basin. Ecol. Indic. 2020, 117, 106545. [Google Scholar] [CrossRef]
  41. Li, H.; Liu, J.; Lei, X.; Ju, Y.; Bu, X.; Li, H. Quantitative Determination of Environmental Factors Governing the Snow Melting: A Geo-Detector Case Study in the Central Tienshan Mountains. Res. Square 2022. preprint. [Google Scholar] [CrossRef]
  42. Qiao, Y.; Wang, X.Q.; Han, Z.X.; Tian, M.; Wang, Q.; Wu, H.; Liu, F.T. Geodetector based identification of influencing factors on spatial distribution patterns of heavy metals in soil: A case in the upper reaches of the Yangtze River, China. Appl. Geochem. 2022, 146, 105459. [Google Scholar] [CrossRef]
  43. Zhao, Y.; Liu, L.; Kang, S.; Ao, Y.; Han, L.; Ma, C.J.L. Quantitative analysis of factors influencing spatial distribution of soil erosion based on geo-detector model under diverse geomorphological types. Land 2021, 10, 604. [Google Scholar] [CrossRef]
  44. Huo, H.; Sun, C.P. Spatiotemporal variation and influencing factors of vegetation dynamics based on Geodetector: A case study of the northwestern Yunnan Plateau, China. Ecol. Indic. 2021, 130, 108005. [Google Scholar] [CrossRef]
  45. Wan, H.W.; Li, H.X.; Wu, J.H.; Liu, Y.P. Spatial distribution pattern in mammal and bird richness and their relationship with ecosystem services in Sanjiangyuan National Park, China. J. Mount. Sci. 2021, 18, 1662–1677. [Google Scholar] [CrossRef]
  46. Xu, L.; Du, H.R.; Zhang, X.L. Driving forces of carbon dioxide emissions in China’s cities: An empirical analysis based on the geodetector method. J. Clean. Prod. 2021, 287, 125169. [Google Scholar] [CrossRef]
Figure 1. Location (a) and elevation (b) of the Beijing−Hebei−Tianjin Region.
Remotesensing 15 00622 g001
Figure 2. Workflow of spatiotemporal variation and main driving factors in BTH.
Remotesensing 15 00622 g002
Figure 3. Spatial distribution of (a) average of accumulated gross primary productivity (GPP) (unit: g   C · m 2 · y r 1 ) and (b) inter–annual GPP trend (unit: g   C · m 2 · y r 1 ) during 2000–2020.
Remotesensing 15 00622 g003
Figure 4. Inter-annual variation trends of GPP in the BTH from 2000 to 2020.
Remotesensing 15 00622 g004
Figure 5. Inter-annual variation trends of GPP in the BTH from 2000 to 2020. ((a) spring; (b) summer; (c) autumn; (d) growth).
Remotesensing 15 00622 g005
Figure 6. Correlation of GPP with LST (a), precipitation (b), SRAD (c) across BTH from 2000–2020.
Remotesensing 15 00622 g006
Figure 7. The spatial distribution of all factors in 2020. ((a) is land surface temperature, (b) is precipitation, (c) is downward surface shortwave radiation, (d) is land use and land cover, (e) is night light data).
Remotesensing 15 00622 g007
Figure 8. q value of the influence of each factor from 2000 to 2020.
Remotesensing 15 00622 g008
Table 1. The five types of interaction detector.
q Value ComparisonInteraction
q( X 1 X 2 ) < Min(q( X 1 ),q( X 2 ))Non-linear weakening
Min(q( X 1 ),q( X 2 )) < q( X 1 X 2 ) < Max (q( X 1 ),q( X 2 ))Single-factor nonlinear attenuation
q( X 1 X 2 ) > Max(q( X 1 ),q( X 2 ))Two-factor enhancement
q( X 1 X 2 ) = q( X 1 ) + q( X 2 )Independent
q( X 1 X 2 ) > q( X 1 ) + q( X 2 )Non-linear enhancement
Table 2. The results of factor detection.
LSTPRSRADLIGHTLUCC
q statistic0.3250.0920.0320.2360.336
p value0.0000.0000.0000.0000.000
Table 3. The result of ecological detection.
LSTPRSRADLIGHTLUCC
LST
PRN
SRADNN
LIGHTNYY
LUCCNYYY
‘Y’ means there is a significant difference, ’N’ means not. The result have a significant difference at a confidence level of 0.95.
Table 4. The results of interaction detection.
LSTPRSRADLIGHTLUCC
LST0.325
PR0.4300.092
SRAD0.3640.1640.032
LIGHT0.4460.3280.2530.236
LUCC0.4570.3900.3640.4310.336
blue means nonlinear enhancement, red means two-factor enhancement, orange means independent. gray means q value of each factor.
Table 5. The best type or range of the main factors with maximum GPP.
FactorComfort Range or Type GPP   ( g   C / m 2 )
LST13.2–21.1 °C914.26
PR645–788 mm910.13
SRAD223.3–224.7 W/m2702.55
LIGHT0–4.5714.99
LUCCforest887.33
Disclaimer/Publisher’s Note: The statements, opinions and data contained in all publications are solely those of the individual author(s) and contributor(s) and not of MDPI and/or the editor(s). MDPI and/or the editor(s) disclaim responsibility for any injury to people or property resulting from any ideas, methods, instructions or products referred to in the content.

