Article

The Kinematic and Microphysical Characteristics of Extremely Heavy Rainfall in Zhengzhou City on 20 July 2021 Observed with Dual-Polarization Radars and Disdrometers

1
Huzhou Meteorological Bureau, Huzhou 313000, China
2
Collaborative Innovation Center on Forecast and Evaluation of Meteorological Disasters, Nanjing University of Information Science & Technology, Nanjing 210044, China
3
Changxing Meteorological Bureau, Huzhou 313000, China
4
Meteorological Observatory of Zhejiang Province, Hangzhou 310051, China
*
Author to whom correspondence should be addressed.
Remote Sens. 2023, 15(24), 5688; https://doi.org/10.3390/rs15245688
Submission received: 30 September 2023 / Revised: 1 December 2023 / Accepted: 8 December 2023 / Published: 11 December 2023
(This article belongs to the Special Issue Synergetic Remote Sensing of Clouds and Precipitation II)

Abstract

:
In this study, we utilized dual-polarization weather radar and disdrometer data to investigate the kinematic and microphysical characteristics of an extreme heavy rainfall event that occurred on 20 July 2021, in Zhengzhou. The results are as follows: FY-2G satellite images showed that extremely heavy rainfall mainly occurred during the merging period of medium- and small-scale convective cloud clusters. The merging of these cloud clusters enhanced the rainfall intensity. The refined three-dimensional wind field, as retrieved by the multi-Doppler radar, revealed a prominent mesoscale vortex and convergence structure at the extreme rainfall stage. This led to echo stagnation, resulting in localized extreme heavy rainfall. We explored the formation mechanism of the notable ZDR arc feature of dual-polarization variables during this phase. It was revealed that during the record-breaking hourly rainfall event in Zhengzhou (20 July 2021, 16:00–17:00 Beijing Time), the warm rain process dominated. Effective collision–coalescence processes, producing a high concentration of medium- to large-sized raindrops, significantly contributed to heavy rainfall at the surface. From an observational perspective, it was revealed that raindrops exhibited significant collision interactions during their descent. Moreover, a conceptual model for the kinematic and microphysical characteristics of this extreme rainfall event was established, aiming to provide technical support for monitoring and early warning of similar extreme rainfall events.

Graphical Abstract

1. Introduction

In recent years, China has experienced frequent extreme weather and climate events, with secondary disasters caused by heavy rainfall posing serious threats to the national economic and social development, as well as the safety of its people and their property. From 18 to 22 July 2021, the Zhengzhou region in Henan Province witnessed an unprecedented episode of extreme heavy rainfall. The average rainfall in the Zhengzhou area reached 527.4 mm. The highest cumulative rainfall was recorded at the Baizhai Station in Xinmi city, amounting to 985.2 mm, while the National Meteorological Station in Zhengzhou (hereafter referred to as the Zhengzhou Station) recorded a cumulative rainfall of 817.3 mm. This rainfall event broke various historical records in China [1,2]. Specifically, between 16:00 and 17:00 Beijing Time (BT) on 20 July, Zhengzhou Station recorded an hourly rainfall of 201.9 mm, surpassing the maximum hourly rainfall ever documented in mainland China since meteorological records began in 1951 [3]. This extreme rainfall event led to devastating flooding in highly urbanized areas, resulting in the death of over 300 individuals and direct economic losses exceeding CNY 100 billion [4].
In the case of the extremely heavy rainfall event in Zhengzhou on 20 July 2021, scholars have analyzed this event from various perspectives. They have utilized multisource observational data such as sounding, automatic weather station, radar, and FY-4A meteorological satellite data to analyze this extreme precipitation process. They have discovered that stable atmospheric circulation patterns, sufficient water vapor transport and energy, merging and stagnation of mesoscale convective systems (MCS), and topographical influences were the fundamental causes [1,2,5,6,7]. Sun et al. (2021) [8] calculated the optical flow field using FY-4A remote sensing data to analyze the characteristics of moisture transport on a large scale. Yin et al. (2023) [9] used the Weather Research and Forecasting model to study the large-scale precipitation efficiency and cloud microphysics precipitation efficiency during this extremely heavy rainfall event, revealing that water vapor flux convergence was the key factor influencing the large-scale precipitation efficiency. The aforementioned studies mainly focused on the interactions between various weather-scale systems, activity of mesoscale systems, and topographical effects. However, the contributions of kinematic and microphysical processes to this extremely heavy rainfall event, which are yet to be fully understood, are attracting increasing attention [10].
Extreme heavy rainfall events are often closely related to convective activities and meso- to small-scale processes. Some intense hourly rainfall is associated with mesoscale vortices, denoted as γ, generated within supercells or MCS. The dynamic influence of these vortices can promote the occurrence of extreme heavy rainfall [11,12,13]. Doppler weather radar data are characterized by high spatial and temporal resolutions [14]. Moreover, the three-dimensional wind field retrieval technique of the dual (or multi)-Doppler radar has become an essential tool for studying the meso- to small-scale three-dimensional structures and internal kinematics of heavy rainfall systems, shedding light on the triggering and evolution mechanisms of extreme heavy rainfall systems [15,16,17,18].
The dual-polarization weather radar emits both horizontally and vertically polarized electromagnetic waves. In addition to obtaining the reflectivity factor (ZH), it provides the differential reflectivity (ZDR), specific differential phase (KDP), and correlation coefficient (ρhv) among other dual-polarization variables. These variables are highly sensitive to the phase, shape, orientation, and distribution of precipitation particles and can be used to reveal specific cloud microphysical processes [19,20,21]. Different types of microphysical processes dictate the ground raindrop size distribution (DSD) and precipitation intensity [3,22]. When a precipitation system passes over a ground meteorological observation station, a disdrometer can provide DSD information at this location, which can be used to compute various microphysical characteristics of the precipitation process [3,22,23,24]. Many researchers have studied the climatic characteristics of DSD, and the results show significant differences in DSD across different climatic zones, seasons, and types of precipitation [25,26,27,28]. Such studies have enhanced our understanding of the DSD characteristics across various locations and weather systems. Significant differences in DSD characteristics exist across the different development stages (such as growth, maturity, and dissipation) and within various regions of convective systems, such as severe convective weather or heavy rainfall [29,30,31]. The characteristics of the convective core typically indicate higher number concentrations and larger average particle diameters [22,32]. These differences in microphysical precipitation features pose challenges in radar-based quantitative precipitation estimation (QPE) studies [33,34,35] and limit the capability of quantitative precipitation forecasting (QPF) [36]. Therefore, understanding the kinematic and microphysical structural evolution characteristics during the lifecycle of mesoscale convective systems is crucial for enhancing the monitoring and forecasting capabilities for extreme heavy rainfall events and improving the accuracy of both QPE and QPF [31,37,38].
In contrast to the perspectives of previous studies on the extremely heavy rainfall event in Zhengzhou on 20 July 2021, in this study, we investigated the kinematic and microphysical characteristics leading to the record-breaking hourly rainfall event in Zhengzhou using coupled information of the three-dimensional (3D) wind and microphysical fields obtained from multiple dual-polarization radar and surface disdrometer observations. First, we utilized the FY-2G meteorological satellite and dual-polarization radar to analyze the development and macrostructure of mesoscale convective systems during this event. Second, based on the retrieval of the three-dimensional wind field from the multi-Doppler radar, polarimetric variables obtained from the dual-polarization radar, and corresponding retrieved DSD parameters, combined with surface disdrometer observations, we examined the macro- and microstructural characteristics during the record-breaking extreme hourly precipitation period in Zhengzhou (20 July 2021, from 16:00 to 17:00 BT, with an hourly rainfall of 201.9 mm). This revealed the complex small-scale kinematic and microphysical processes and their formation mechanisms.

2. Data, Methodology, and Study Area

The observational instruments used in this study mainly included S-band dual-polarization weather radars in Zhengzhou and Luoyang (ZZ-SPOL and LY-SPOL, respectively), Doppler weather radar in Pingdingshan (PDS-RD), automatic weather observation stations (AWSs) throughout the study region, and disdrometers at the Zhengzhou, Xinmi, and Zhongmou stations (ZZ, XM, and ZM stations, respectively). Figure 1 shows the study area and the locations of these instruments.

2.1. Polarimetric Radar Observations and Data Processing

Both ZZ-SPOL (34.70°N, 113.70°E, altitude of 206 m) and LY-SPOL (34.56°N, 112.45°E, altitude of 305 m) operate using the VCP21 volume scanning mode, completing scans at 9 elevation angles (0.5°, 1.5°, 2.4°, 3.4°, 4.3°, 6.0°, 9.9°, 14.6°, and 19.5°) within 6 min. They provide a radial resolution of 250 m and an azimuthal resolution of 1.0°. Each parameter has been rigorously calibrated, providing variables including the reflectivity factor (ZH), radial velocity (Vr), spectral width (W), ZDR, ρhv, and KDP. PDS-RD (33.76°N, 113.11°E, altitude of 302 m), however, is a single-polarization Doppler weather radar, which uses the VCP21 volume scanning mode with an azimuth resolution of 1.0°, and provides three basic variables: ZH, Vr, and W. The radial resolution for ZH is 1000 m, while the radial resolutions for Vr and W are 250 m each. The primary performance parameters of each radar are presented in Table 1.
In this part, a brief introduction to the dual-polarization variables and their physical significance is provided. ZDR is the ratio of the horizontal to vertical polarization reflectivity factors, measured in dB. It reveals information on the shape, composition, and density of the hydrometeors. ρhv provides a measure of how similar the horizontal and vertical scattering cross-sections of objects are. It is dimensionless and can be employed for radar data quality assessment and radar echo classification. KDP is defined as the derivative of the phase difference between the horizontal and vertical pulses with respect to distance, in units of ° km−1, which provides information on the liquid water content. The characteristics of polarimetric variables enable the deduction of microphysical processes [19,39]. The dual-polarization radar data were preprocessed to remove nonweather-related signals, setting a threshold of ρhv below 0.7 [40]. Following this, filtering techniques were applied to ZH, ZDR, KDP, and ρhv to stabilize any unpredictable fluctuations. To gain a deeper understanding of the microphysical processes and temporal evolution characteristics of this extremely heavy rainfall event, we employed high-resolution quasivertical profiles (QVPs) of the polarimetric radar variables, including ZH, ZDR, ρhv, and KDP, at an elevation angle of 19.5° [20,24,31].
Before retrieving the 3D wind field from the dual (multi)-Doppler radar data, we started by applying an automated dealiasing algorithm to Vr [41]. Subsequently, every measured variable was interpolated onto a Cartesian grid with horizontal and vertical spacings of 1 and 0.5 km, respectively. The three-dimensional wind patterns covered regions of 70 × 70 km2, as indicated by the black dotted boxes in Figure 1, extending up to an altitude of 20 km MSL. These patterns were derived using the variational multiple-Doppler wind analysis procedure [42,43]. A more technical description of this wind analysis procedure is given in Appendix A.

2.2. Surface Disdrometers

Raindrop size distribution (DSD) observations were sourced from the OTT disdrometer deployed in Henan Province. The core component of this device is an optical sensor, which generates a 1 mm thick horizontal light beam, with a measurement area of 54.0 cm2 (180 mm in length and 30 mm in width) and a temporal resolution of 1 min. By observing the shadowing effects of falling particles on the laser, the disdrometer captures information on the number, size, and fall velocity of precipitation particles in the observation area [22]. The OTT disdrometer categorizes precipitation particles into 32 bins based on their diameter and fall velocity, corresponding to median sizes ranging from 0.062 to 24.5 mm and median fall speeds ranging from 0.05 to 20.8 m s−1 [44]. To minimize the errors caused by strong winds, splashes, or edgefall artifacts, particles deviating from the fall speed–diameter relationship were excluded from the observational data, as recommended by Friedrich et al. (2013) [45]. To ensure the data quality, observations were considered noise when the total number of raindrops was less than 10 or the computed rainfall intensity was below 0.1 mm h−1 [46]. After quality control, the DSD parameter N(D) can be derived, allowing the computation of related microphysical parameters such as the mass-weighted mean diameter Dm (mm), rain rate R (mm h−1), liquid water content LWC (g m−3), reflectivity factor Z (mm6 mm−3), mass distribution m(D) (g m−3 mm−1), and generalized intercept parameter Nw (mm−1 m−3) [19,40,47].

2.3. DSD Retrieval with Polarimetric Radar

To gain more precise quantitative insight into the 3D microphysical structures of extreme heavy rainfall events, DSDs can be retrieved from polarimetric radar data using a gamma function [48,49]. In this research, the gamma function is used [50], which can be expressed as:
N ( D ) = N 0 D μ exp ( Λ D )
where N(D) (mm−1m−3) is the number of drops in a unit volume for each unit diameter bin, and N0 (mm−1−μ m−3) is the intercept parameter, with D (mm) denoting the equivalent volume diameter. μ and Λ(mm−1) are the shape and slope parameters, respectively.
Zhang et al. (2001) proposed the establishment of a constrained-gamma (C-G) model to retrieve the DSD using dual-polarization radar observations of ZH and ZDR [51]. However, the empirical μ-Λ model is influenced by different precipitation types and climatic regions, leading to errors in retrieval and affecting the reliability of the retrieval results [40]. Consequently, we collected data from OTT disdrometers at over 50 national stations across Henan Province. These stations reported cumulative rainfall levels exceeding 200 mm from 19 to 21 July 2021. With the use of the method introduced by Cao et al. (2008) and combined with the drop axis ratio relationship [52], we corrected the empirical μ-Λ relationship and derived the following:
μ = 0.0592 Λ 2 + 0.8119 Λ 0.8185
Based on the revised empirical μ-Λ relationship in conjunction with the S-band dual-polarization radar observational variables, the DSD of the extreme heavy rainfall event was analyzed, ultimately revealing the microphysical structure of the intense precipitation process. R (mm h−1), Dm (mm), LWC (g m−3), and Nw (mm−1 m−3) can be retrieved using the following equations, as suggested by Bringi et al. (2003) and Brandes et al. (2002, 2004) [25,48,52]:
R = 6 π × 10 4 0 D max D 3 N ( D ) v t ( D ) d D
D m = 0 D max D 4 N ( D ) d D 0 D max D 3 N ( D ) d D
L W C = ρ w π × 10 3 6 0 D max N ( D ) D 3 d D
N w = 4 4 π ρ w 10 3 W D m 4
where ρ w is the density of water, which is 1 g cm−3.

3. Results

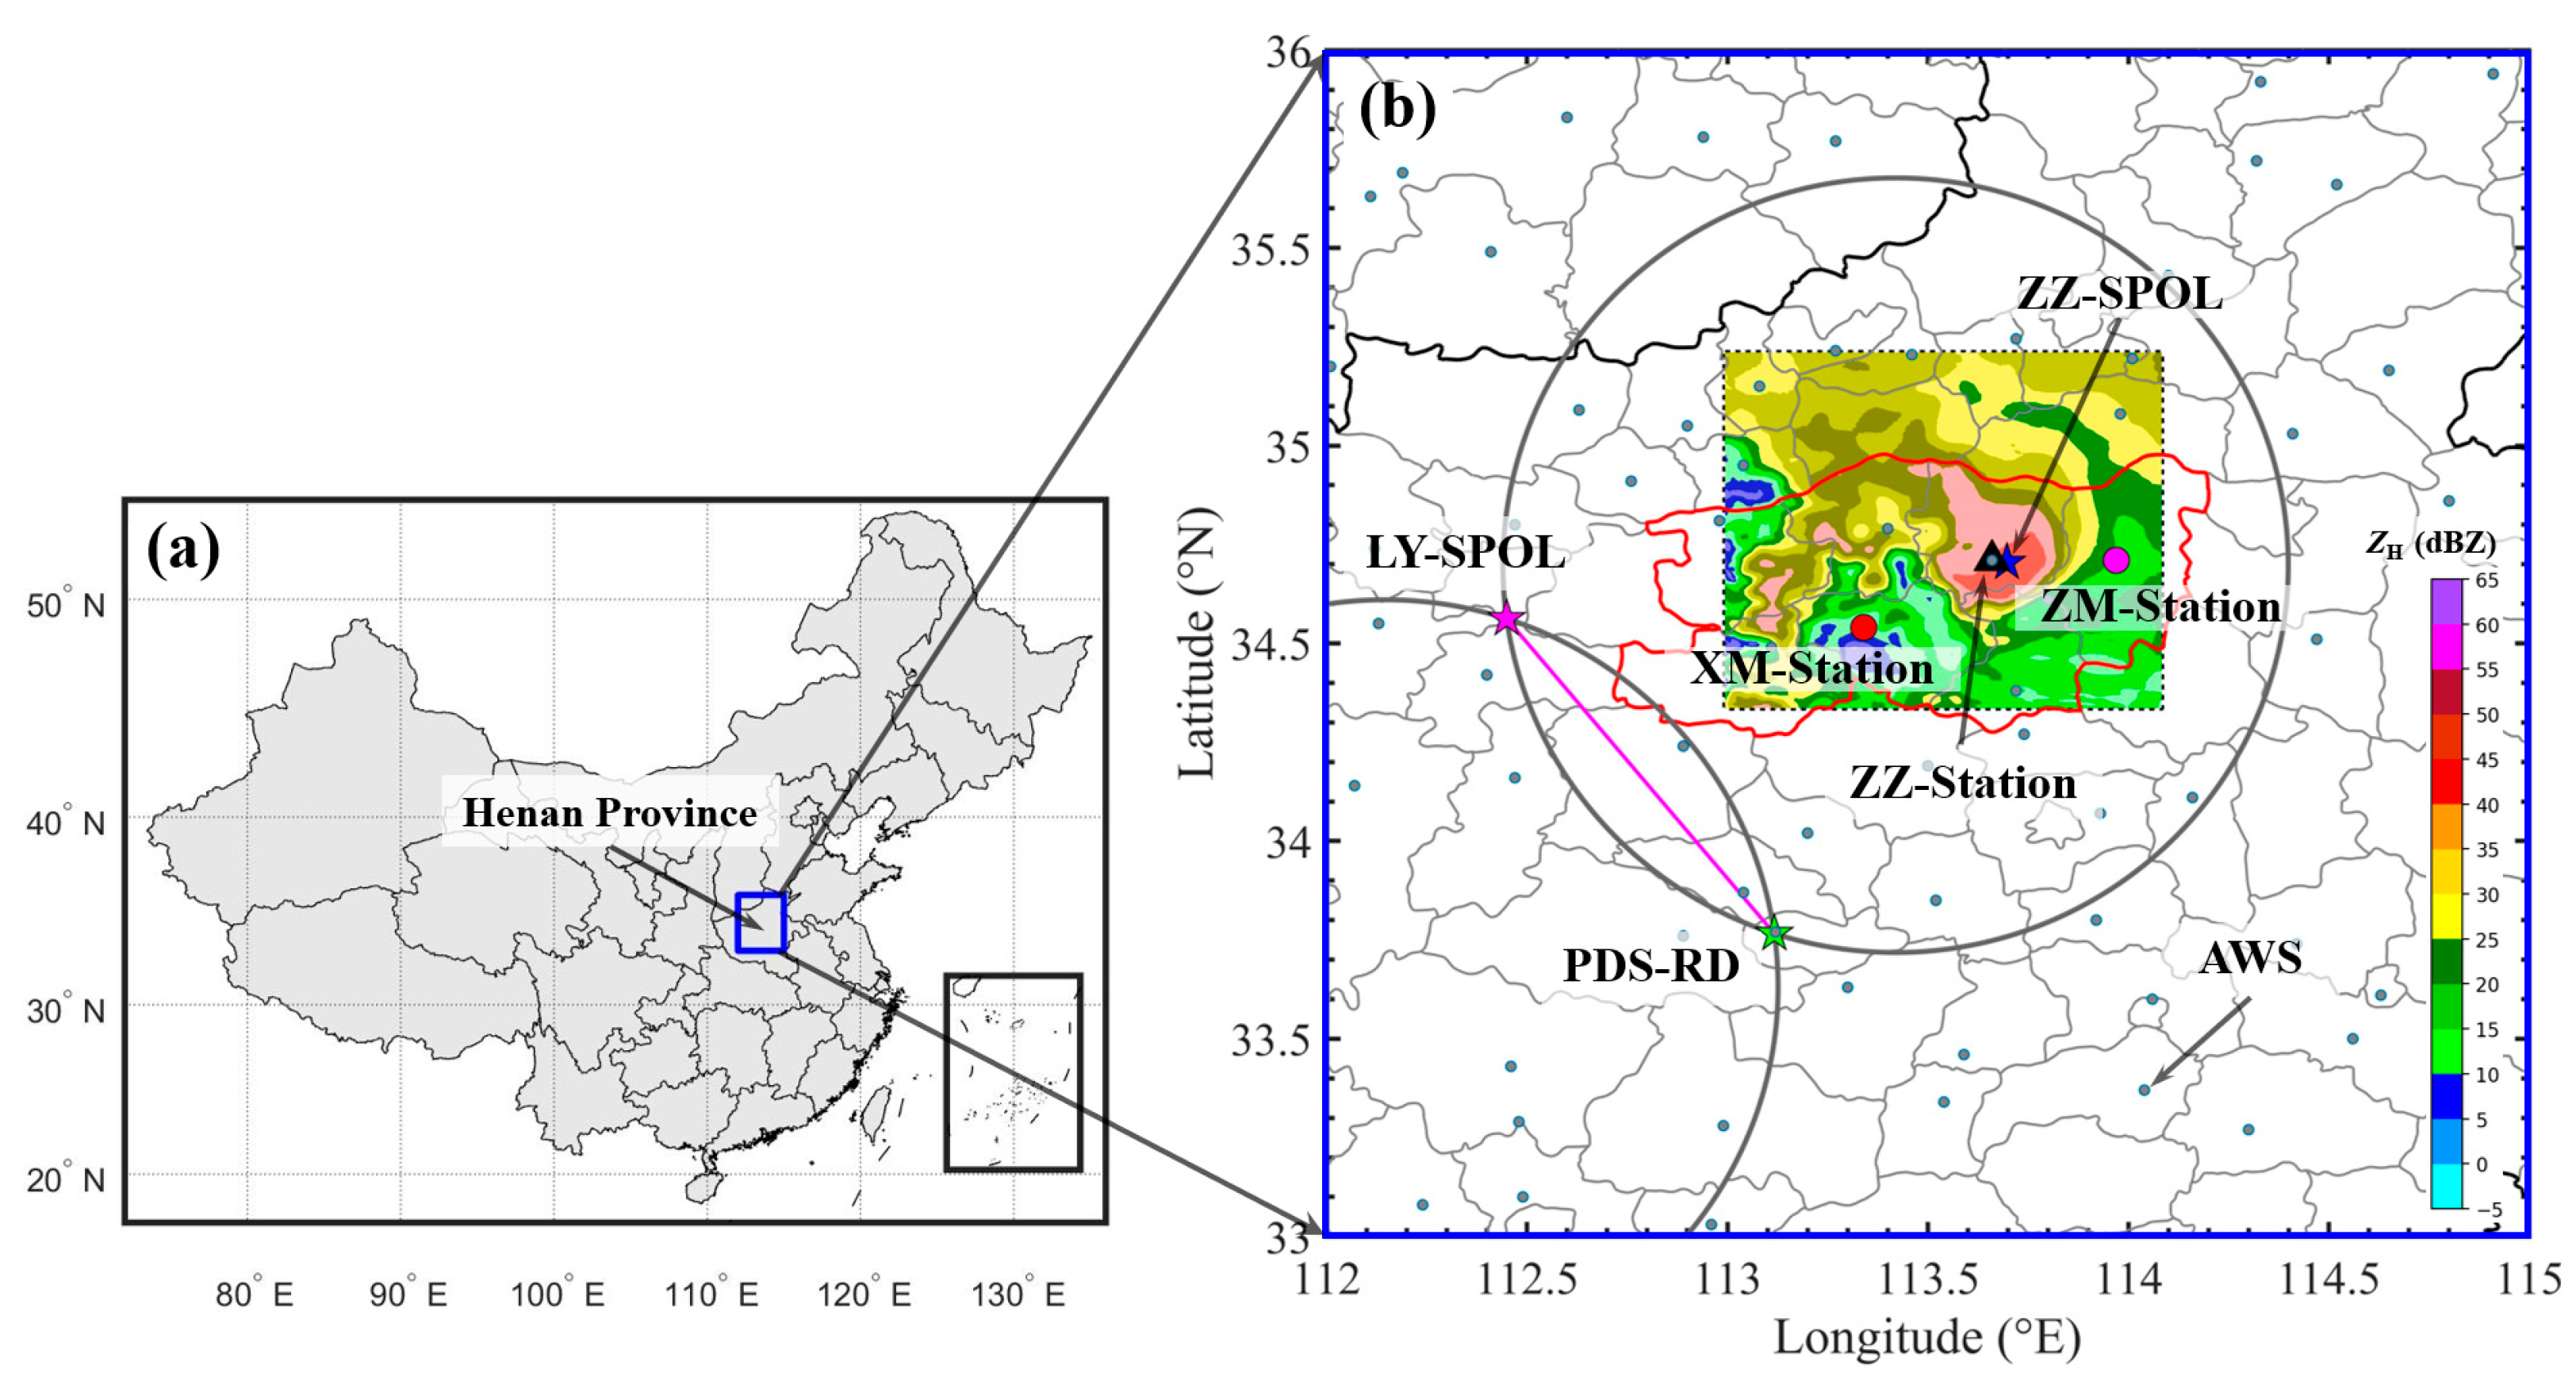
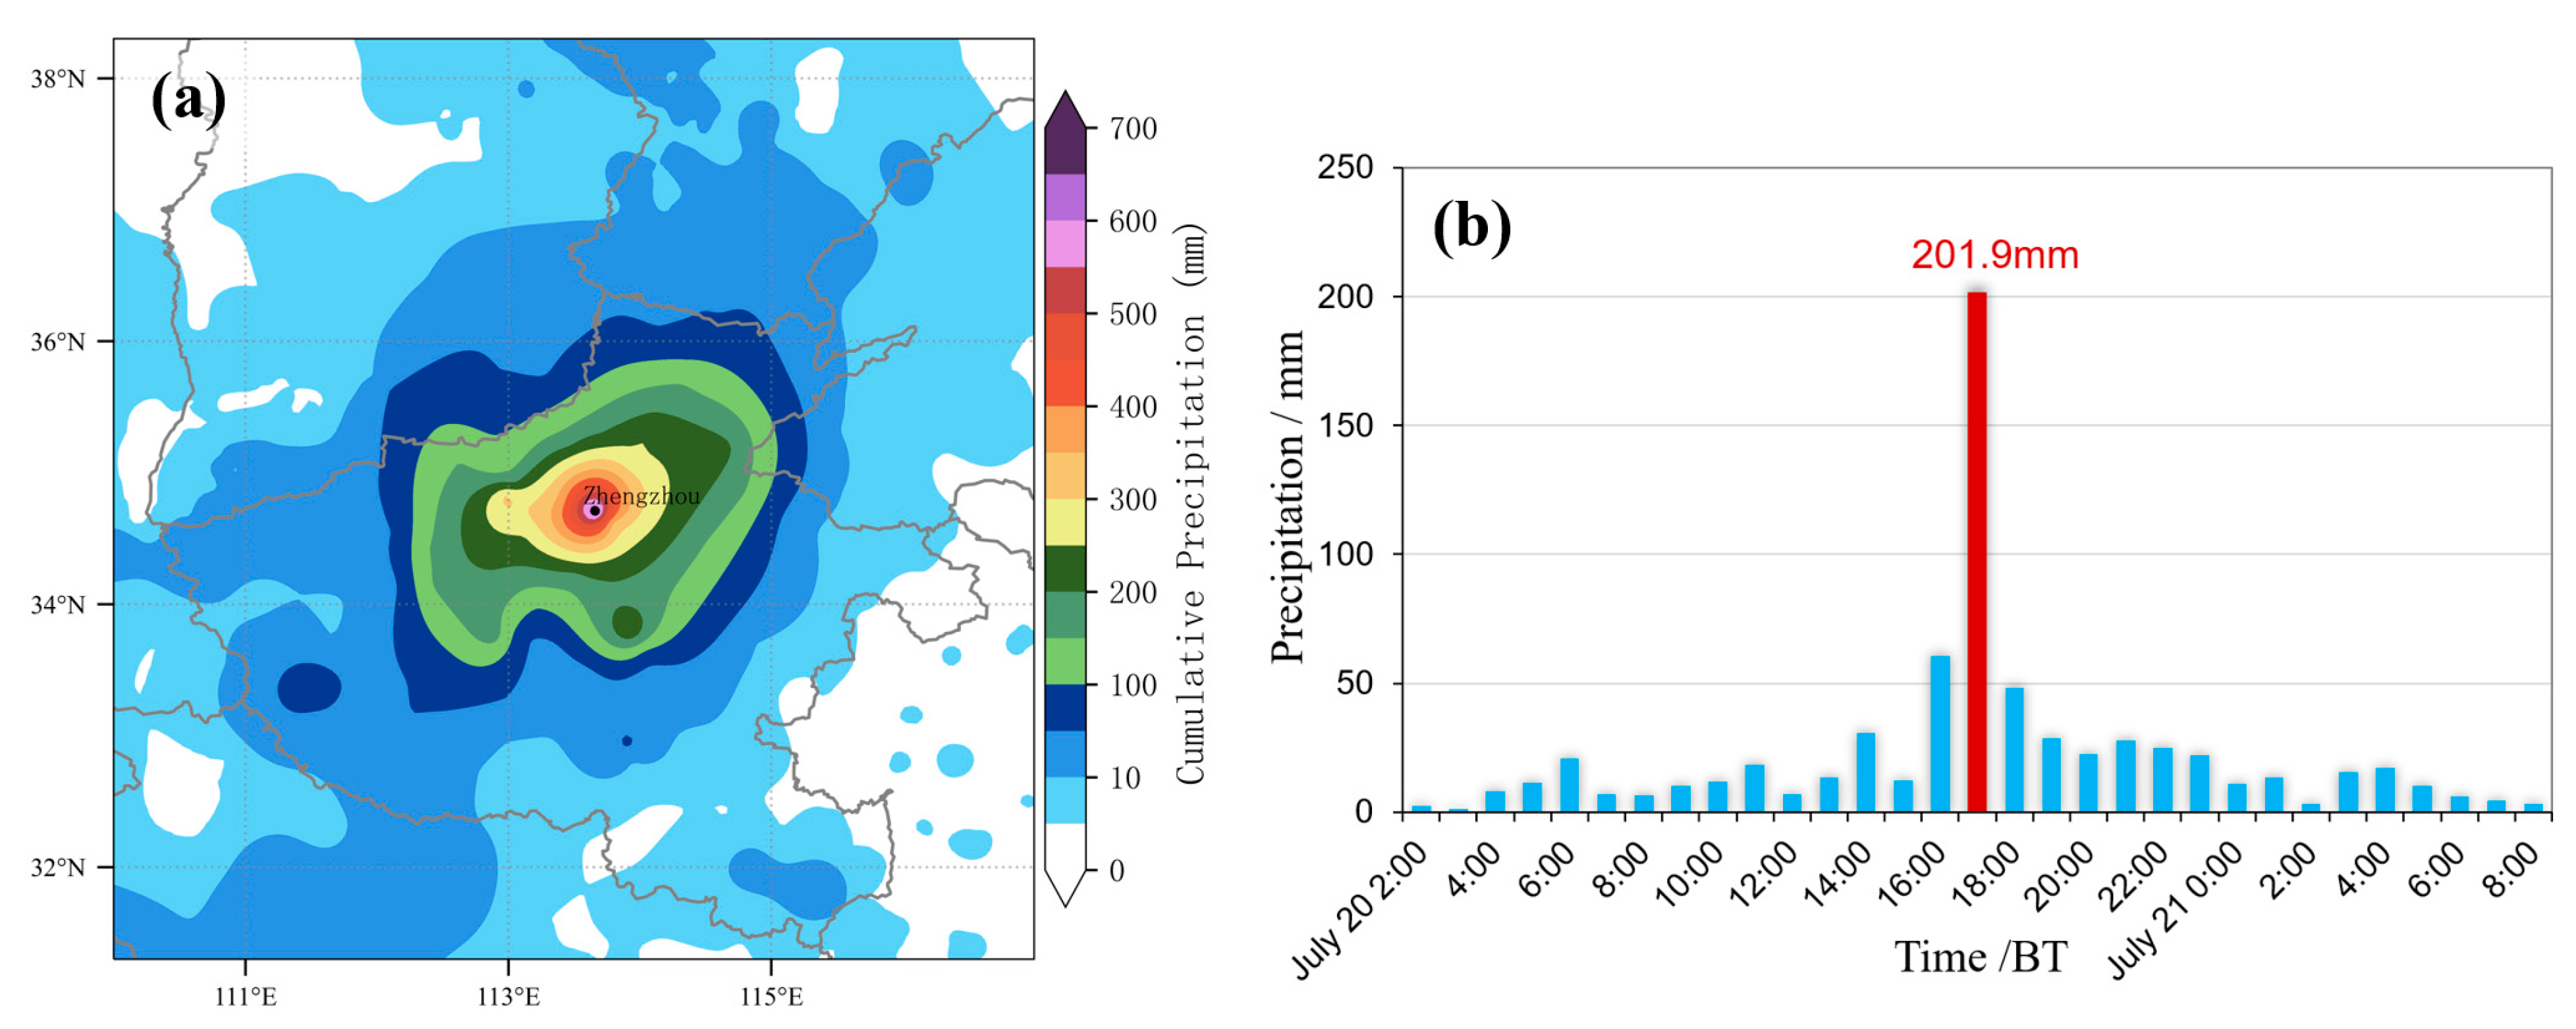
3.1. Case Description and Synoptic Conditions

Figure 2a shows the 24 h accumulated rainfall distribution map of Henan Province from 20:00 BT on 19 July 2021 to 20:00 BT on 20 July 2021. Specifically, the hourly rainfall recorded at the ZZ Station from 16:00 to 17:00 BT on July 20 was 201.9 mm, surpassing the historical maximum hourly rainfall recorded in mainland China (as shown in Figure 2b).
Figure 3 shows the synoptic conditions of the extreme heavy rainfall event, drawn using ERA5 reanalysis data. At 08:00 BT on 20 July 2021, at 500 hPa (Figure 3a), the subtropical high was robustly developed and anomalously extended northward, with its center occurring near the Sea of Japan. The 588 hPa contour line extended westward to the eastern coast of China, placing Henan in a high-temperature and high-humidity environment on the southwestern side of this high. In low-latitude areas, Severe Typhoon In-fa was located over the ocean to the east of Taiwan (at approximately 132°E), south of the subtropical high. Westward extension of the subtropical high and Typhoon In-fa resulted in a substantial pressure gradient and strong easterly winds. At this time, another typhoon, Cempaka, made landfall in Yangjiang, Guangdong [7]. At 700 hPa, there was a clear convergence of southwesterly flows south of Zhengzhou and southeasterly flows stemming from the western side of the subtropical high (Figure 3b). At 850 hPa, the easterly winds over Zhengzhou significantly strengthened, creating a shear line in central and eastern Henan between the easterlies and southeasterly winds from the southwestern side of the high. Additionally, a low-level jet stream occurred near Zhengzhou, with peak speeds exceeding 16 m s−1 (Figure 3c). Influenced by the subtropical high and Typhoon In-fa, a strong southeasterly boundary layer jet stream extended from the East China Sea to Zhengzhou at 925 hPa at 08:00 BT on July 20 (Figure 3d). The boundary layer jet stream wind speed also reached 12 m s−1 in the upwind area of Zhengzhou (around Jiangsu). Convergence in the exit region of the boundary layer jet stream, combined with the topography, provided abundant moisture and dynamic conditions for precipitation, leading to this persistent extreme rainfall event [53].

3.2. Mesoscale Structural Features in Extreme Heavy Precipitation

Utilizing the FY-2G meteorological satellite TBB observational data and weather radar 1.5° elevation angle plan position indicator (PPI) reflectivity factor, the onset, development, and structural evolution of mesoscale and smaller-scale convective systems during the Zhengzhou extreme heavy rainfall event can be visualized. Figure 4 shows the evolution of the FY-2G satellite TBB and ZZ-SPOL ZH every 3 h from 08:00 on July 20 to 05:00 BT on July 21, where a comparison of the two reveals that this extreme precipitation event was primarily caused by a mesoscale convective complex (MCC) stably maintained over central and northeastern Henan. At 08:00 BT on July 20, southwestern and southeastern flows in central and northeastern Henan formed a densely structured mesoscale cloud cluster with a diameter of approximately 400~450 km, indicating a stable and less mobile state, with less vigorous convection development. Its TBB values ranged from 213 to 238 K (−60 to −35 °C), corresponding to ZH values ranging from 10 to 55 dBZ (Figure 4(a1,a2)). Within this MCC, several strong β-mesoscale and γ-mesoscale systems existed, and regions with the ground-level 3 h cumulative rainfall exceeding 20 mm corresponded well with the distributions of these mesoscale systems. In the afternoon of July 20, with continuous genesis and incorporation of convective entities on the southern and eastern sides of the MCC, the mesoscale convective systems within the MCC continued to merge and strengthen. By 17:00 BT, the MCC sharply developed and intensified (Figure 4(d1,d2)), remaining stable and less mobile, with the lowest TBB value of the cold cloud top declining to 203 K (−70 °C) and the highest ZH value reaching 60 dBZ. At this stage, extreme short-duration heavy precipitation occurred at the ground level, with the record-breaking extreme hourly rainfall (RBEHR) at the ZZ Station reaching 201.9 mm between 16:00 and 17:00 BT. Starting at 20:00 BT (Figure 4(e1,e2)), as several β-mesoscale convective systems within the MCC merged and convective entities on its southern side converged, an elliptical α-mesoscale convective system was formed to the east of Zhengzhou, with a horizontal scale of 250~400 km. The lowest TBB value of the cold cloud top decreased from 208 K (−65 °C) to 198 K (−75 °C), convection exhibited vigorous vertical development, and the ZH strong-echo area expanded, but the structure and strength were loosened and reduced, respectively, relative to earlier values. The corresponding ground-level 3 h cumulative rainfall significantly decreased, with less than 75 mm of rainfall recorded at the maximum heavy precipitation center. Overall, the afternoon to evening on 20 July marked the development stage of the MCC, where the RBEHR mainly occurred during the merging period of meso- and small-scale cloud clusters. The merging of cloud clusters was conducive to the increase in precipitation, while this MCC kept circulating and revolving over Zhengzhou city.

3.3. Characteristics and Evolution of the Three-Dimensional Fine-Scale Kinematic Structure in Extreme Heavy Rainfall

3.3.1. Horizontal Structural Characteristics

Figure 5 shows the CAPPI of the polarimetric variables ZH, ZDR, and KDP overlaid with the horizontal wind fields at a height of 1.5 km, as retrieved from the combination of data collected by the three radars (i.e., LY-SPOL, ZZ-SPOL, and PDS-RD) at different times (i.e., before, during and after the RBEHR, respectively) on 20 July 2021. At 15:42 BT, the heavy rainfall center was primarily situated near the ZZ station. This location was dominated by a low-altitude southeast jet stream with wind speeds reaching 20 m s−1. This provided the necessary low-level moisture and convective instability conditions for extreme rainfall. There was a notable cyclonic curvature and convergence, with a vertical vorticity of 2 × 10⁻² s−1 near the ZZ station, creating dynamic conditions conducive to the onset and persistence of short-duration heavy rainfall. Analyzing the polarimetric variables, ZH ranged from 50 to 55 dBZ, ZDR ranged from 2.0 to 2.2 dB, and KDP varied between 1.7 and 3.1° km−1, indicating the presence of a high concentration of large raindrops. By 16:30 BT, the heavy rainfall center moved slightly southeast. The super low-altitude jet stream from the southeast persisted. A clear mesoscale vortex emerged above Zhengzhou (as indicated by the blue rotating arrow in Figure 5(b1)) along with wind direction and speed convergence features. This yielded an almost stationary radar echo, leading to a localized whirl of rain, resulting in the RBEHR. ZH over Zhengzhou ranged from 50 to 55 dBZ, ZDR decreased to 1.2 to 1.5 dB relative to 15:42 BT, and KDP increased to 2.4 to 3.1° km−1, suggesting that the hydrometeors were transformed into a high concentration of medium-sized raindrops. Furthermore, a very distinct ZDR arc feature occurred in the ZDR field, coinciding with the area of maximum cyclonic shear. Its position matched the high vertical vorticity zone well (ranging from 2 × 10⁻² s−1 to 3 × 10⁻² s−1). The formation of this ZDR arc feature is primarily due to the wind shear effect, resulting in particle size sorting. This suggests that larger particles fall nearby, while smaller particles are advected farther away. The ZZ Station was situated downstream (northwest side) of the high concentration of large raindrops at the 1.5 km altitude. By 17:18 BT, the heavy rainstorm split into two precipitation entities. One was located southwest of the ZZ Station, and the other occurred to its east. The radar echo above Zhengzhou notably weakened, with ZH dropping to 40–45 dBZ. ZDR and KDP decreased to 1.0–1.2 dB and 0.5–0.75° km−1, respectively.

3.3.2. Vertical Structural Characteristics

Figure 6 depicts the vertical cross-section of the polarimetric variables (ZH, ZDR, and KDP) overlaid with wind fields along the direction of the red dashed line (A–B) in Figure 5(a1). At 15:42 BT near the ZZ Station, there was an easterly jet stream at the lower levels, which transitioned to a westerly jet stream at the mid-upper levels, revealing a pronounced vertical wind shear. This structure, with convergence at the lower levels and divergence at the upper levels, was conducive to promoting vertical updrafts, with the center of convergence and upward motion located to the west of the ZZ Station (as indicated by the blue arrow in Figure 6(a1)). The locations of the ZH and KDP columns agreed well, while the peak region of the ZDR column (>1.5 dB) occurred slightly eastward of the KDP peak region (>1.7° km−1), an outcome attributed to size sorting [21]. By 16:30 BT, the center of heavy rainfall moved eastward, and the vertical wind shear intensified. The intensity of ZH above Zhengzhou remained relatively consistent, but its vertical development height was notably higher than that at 15:42 BT, with corresponding decreases in ZDR and increases in KDP. The strong convergence and updraft center moved directly above the ZZ Station (blue arrow in Figure 6(b1)), with the vertical extent of the ZDR column exceeding 5 km and the KDP column approaching the –10 °C isotherm, demonstrating deep convection characteristics. This indicates an enhancement in the vertical upward movement over Zhengzhou city. By 17:18 BT, after the heavy rainstorm was split into two storm cells, both the easterly flow at the lower levels and the westerly flow at the mid-upper levels were significantly weakened. The vertical wind shear of the entire layer decreased, and the lower levels transitioned from high to low divergence. Vertical upward movement greatly decreased, and the values of each polarimetric variable significantly decreased. It should be noted that, as the LY-SPOL instrument occurs more than 100 km away from the ZZ Station and the station is located beneath the static cone area of ZZ-SPOL, it is impossible to obtain accurate polarimetric variables and wind field structures at ground level (0~1 km height) near Zhengzhou and the microphysical processes they represent. Additionally, as particles descend, they are influenced by vertical wind shear and microphysical processes such as coalescence and fragmentation, leading to changes in their microphysical characteristics. Hence, there is a need to integrate actual observations from surface disdrometers to comprehensively analyze these complex cloud microphysical processes.

3.3.3. Three-Dimensional Structural Characteristics

To better understand the three-dimensional structural characteristics of the precipitation system over the Zhengzhou region, three-dimensional wind fields were plotted at height levels of 1, 3, 5, and 8 km at 16:30 BT on 20 July 2021, with three-dimensional radar echoes superimposed, as shown in Figure 7. At the lower levels (1 and 3 km, Figure 7a,b), there was a clear mesoscale vortex structural feature. Moreover, at the mid-levels (5 km, Figure 7c), there occurred both mesoscale cyclonic rotation and convergence features, with the convergence center corresponding to the center of strong echoes. At the upper levels (8 km, Figure 7d), the wind field gradually transitioned to divergence. From a vertical perspective, this resulted in a kinematic structure characterized by mesoscale cyclonic rotation and convergence at the middle and lower levels and divergence at the upper levels. This caused the echoes to remain relatively stationary, leading to the occurrence of localized extreme precipitation.

3.4. Microphysical Structure and Evolution of Extreme Heavy Rainfall

3.4.1. Polarimetric Radar-Based QVP Retrieval

To better understand the microphysical processes and evolution characteristics of the extreme heavy rainfall event in Zhengzhou, we analyzed the QVPs of ZH, ZDR, ρhv, and KDP retrieved from ZZ-SPOL data (Figure 8). From 00:00 BT to 15:00 BT, the 0 °C-level bright band was obvious, with ZH ranging from 35 to 45 dBZ, ZDR ranging from 0.4 to 1.5 dB, ρhv ranging from 0.9 to 0.96, and KDP ranging from 0.1 to 0.2° km−1. As time progressed, the altitude of the bright band and echo top slightly increased. When the precipitation (ZH) intensified, both ZDR and ρhv increased correspondingly. KDP also significantly increased near the ground (0–2 km altitude), and a saggy bright band emerged (as indicated by the red arrow in Figure 8b) [54]. This was mainly due to the increased particle density and sphericity from riming, leading to faster descent and therefore a lower complete melting height than that of unrimed particles [20,31,54,55,56]. Moreover, riming may also have lowered the 0 °C-level bright band at a high precipitation intensity [57,58]. Starting from 15:00 BT, ZH rapidly increased below the 0 °C isotherm, and the bright band characteristic disappeared. Especially between 16:00 and 17:00 BT (RBEHR, indicated by the blue arrow), ZH reached its highest value between 50 and 55 dBZ in the 0–3 km altitude range. Correspondingly, ZDR suddenly increased, with ZDR values of 0.6–1.5 dB within the 0–4 km altitude range and reaching its peak values of 1.0–1.5 dB within the 0–2 km altitude range. ρhv also significantly increased, with KDP reaching 2–3° km−1 within the 0–3 km altitude range. It is important to note that there was a radar malfunction in Zhengzhou between 17:13 and 19:47 BT, resulting in a data gap during this period. After 19:48 BT, the ground rainfall intensity significantly decreased, and the values of ZH, ZDR, and KDP all decreased, indicating a change in the DSD type, similar to the types of DSD before 15:00 BT, dominated by low-concentration small raindrops. The QVPs showed that the DSDs during the RBEHR were different from those during the other periods. This stage was mainly characterized by warm-rain processes, where effective collision–coalescence formed high concentrations of larger-sized raindrops, yielding a significant contribution to the intense surface rainfall [59]. In addition, periodic enhancements in ZDR and KDP were observed at altitudes corresponding to the –10 to –20 °C isotherms (indicated by the red dashed ellipses in Figure 8b,d), suggesting the presence of a dendritic growth layer (DGL). This plays a crucial role in ice growth processes and their evolution in clouds, including ice crystals and snowflakes [60,61].

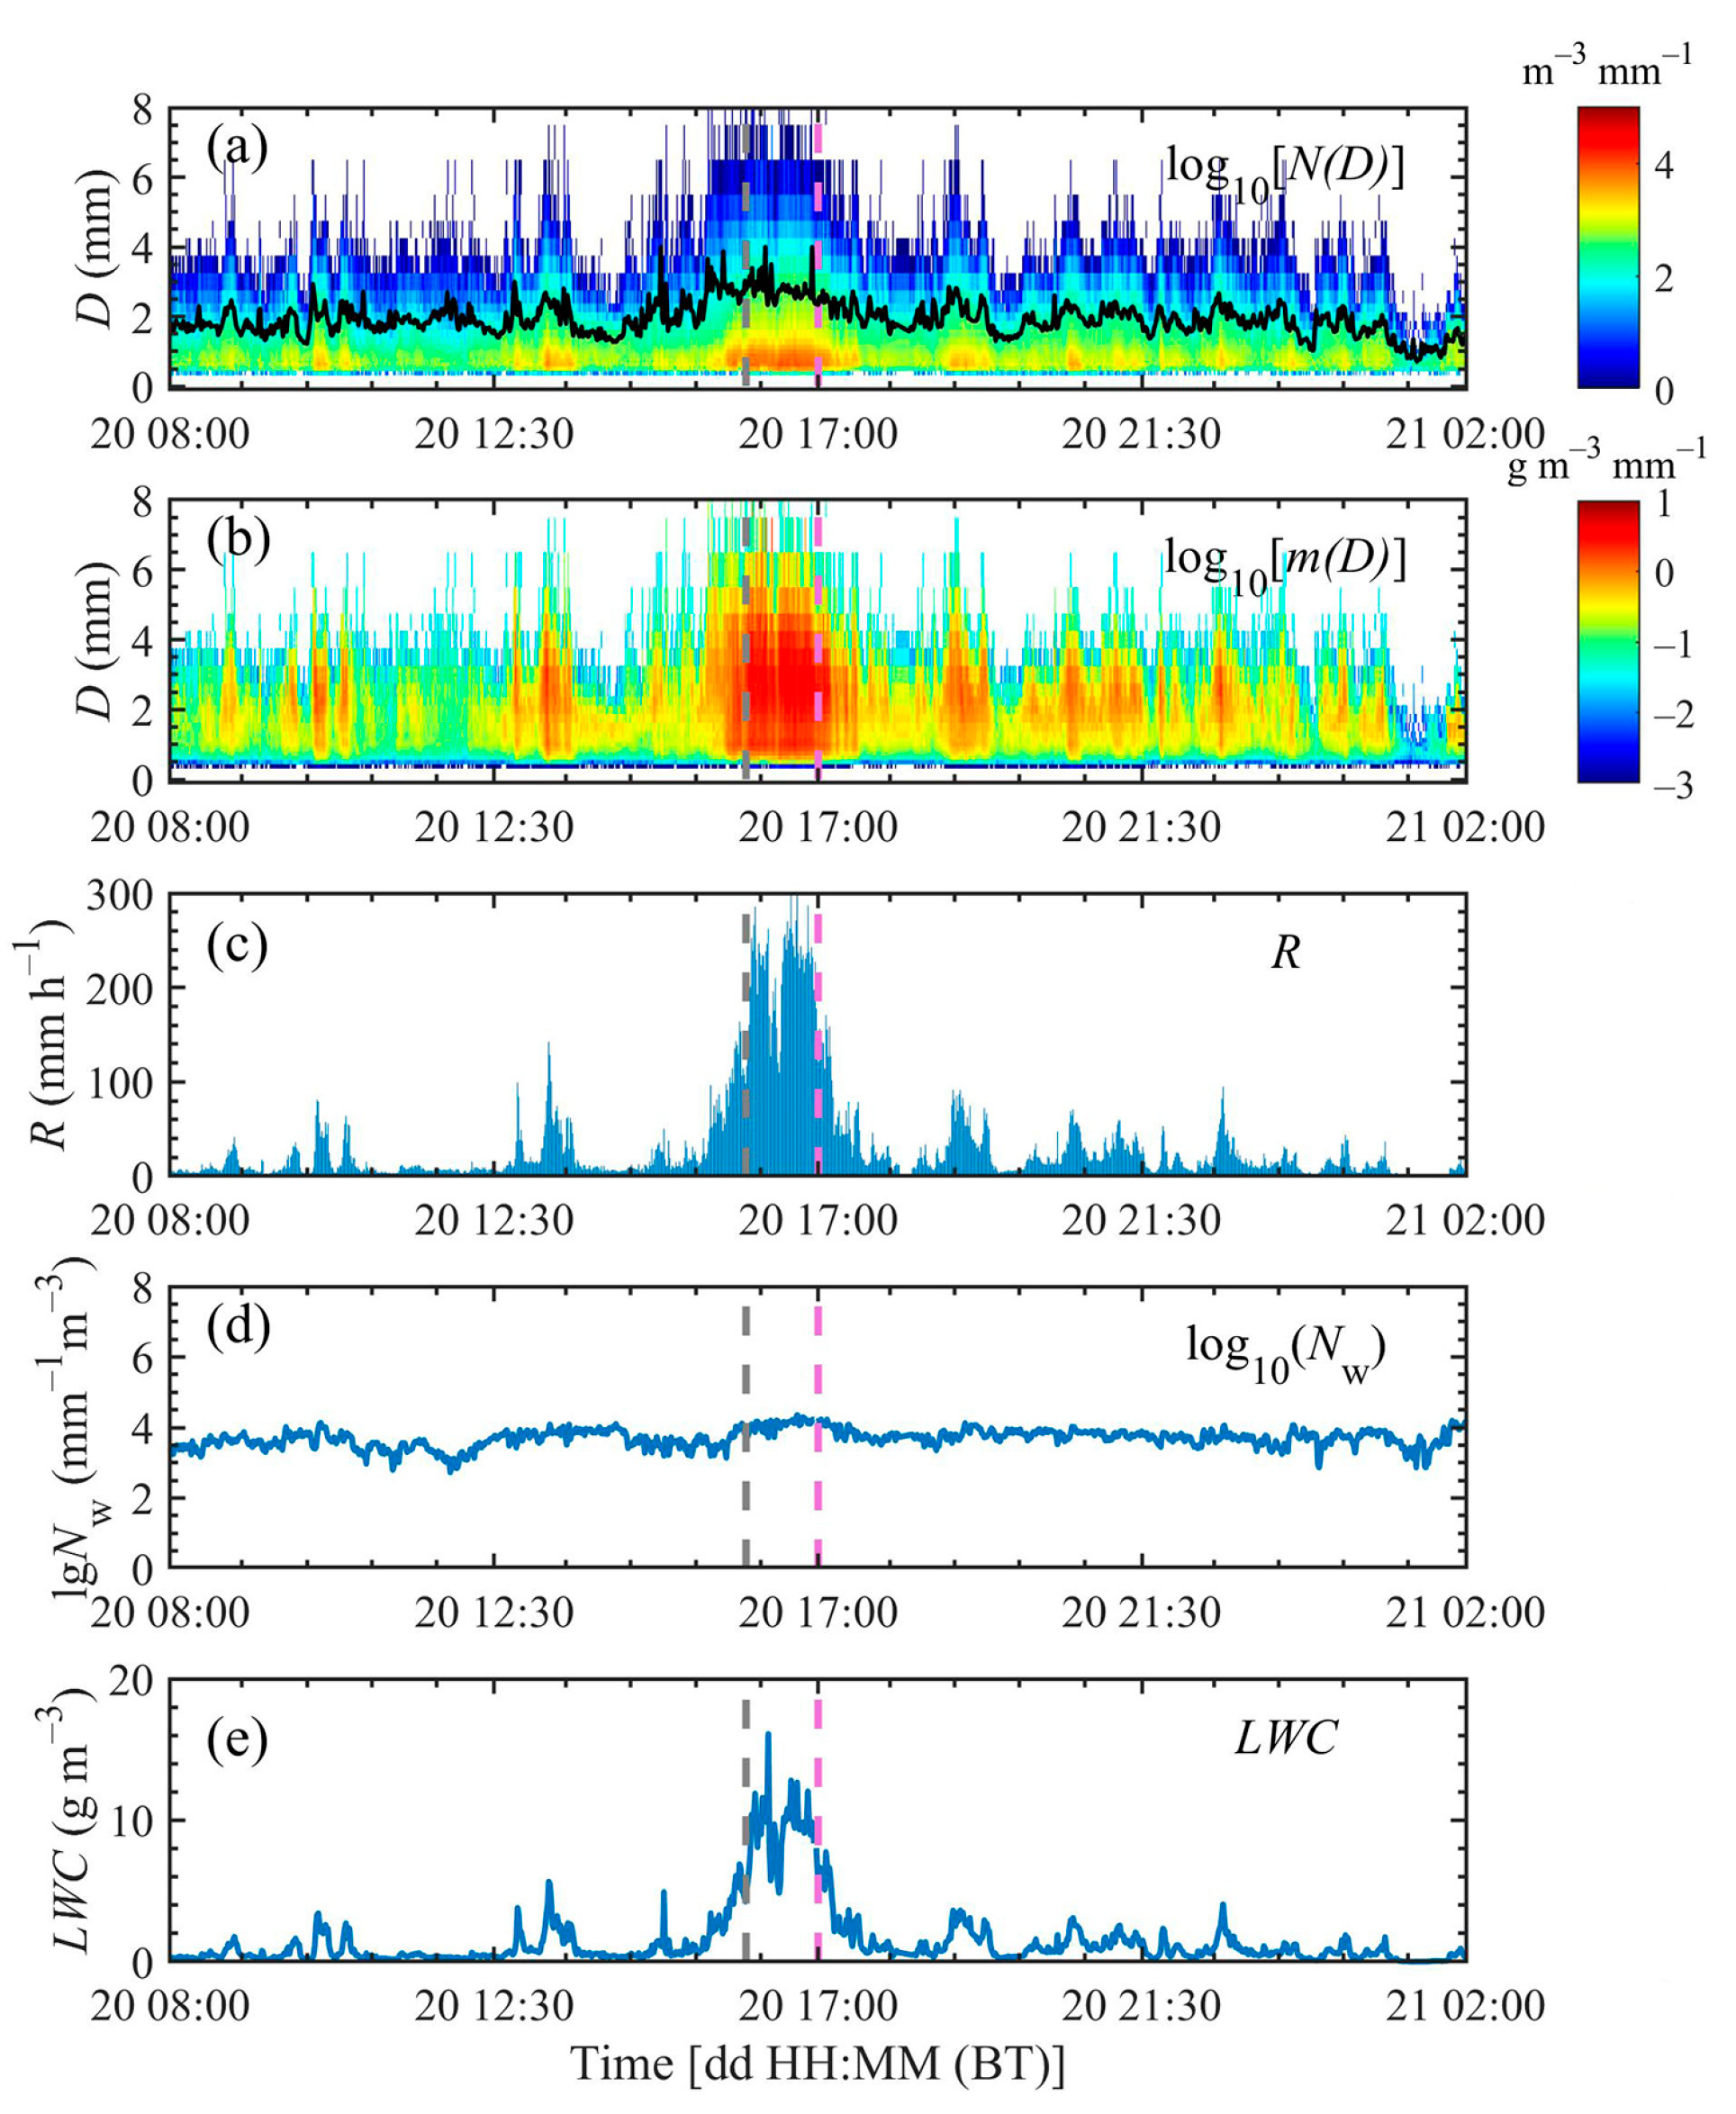
3.4.2. Surface Disdrometer Observations

Figure 9 shows the DSD evolution derived from the disdrometer measurements at the ZZ Station between 08:00 BT on 20 July 2021 and 02:00 BT on 21 July 2021. Prior to the RBEHR (8:00~15:00 BT), there were several instances of short-duration heavy rainfall. Between 13:00 and 14:00 BT, the ZZ Station recorded a short-duration heavy rainfall of 30.6 mm within 1 h, corresponding to a high concentration of small particles (0.5~1 mm) with a maximum raindrop diameter of approximately 6 mm and the mass-weighted mean diameter (Dm) peaking at approximately 2.5 mm (Figure 9a). The peak of the mass spectrum m(D) occurred for small to medium-sized raindrops (Figure 9b), corresponding to a higher rain rate (Figure 9c); both log10(Nw) (Figure 9d) and LWC (Figure 9e) increased significantly. Notably, the intense rainfall during this period was mainly composed of a high concentration of smaller particles. From 16:00 to 17:00 BT, the rainfall still primarily consisted of high concentrations of small raindrops (0.5~1.5 mm) with a number concentration N(D) of approximately 104 m−3 mm−1. The maximum raindrop diameter exceeded 6 mm, and Dm peaked at 4 mm (Figure 9a). The peak of m(D) occurred in the medium to large raindrop diameter range (Figure 9b), corresponding to an extremely high ground rainfall rate (Figure 9c) with a peak close to 300 mm h−1. The log10(Nw) value (Figure 9d) increased to 4.5 mm−1 m−3, and the LWC value (Figure 9e) rapidly increased, peaking over 15 g m−3. It is clear that the high concentration of medium- to large-sized raindrops significantly contributed to the RBEHR. After 17:00 BT, the characteristics of the raindrop spectrum were similar to those before 16:00 BT, with short-duration intense rainfall mainly comprising a high concentration of smaller particles.

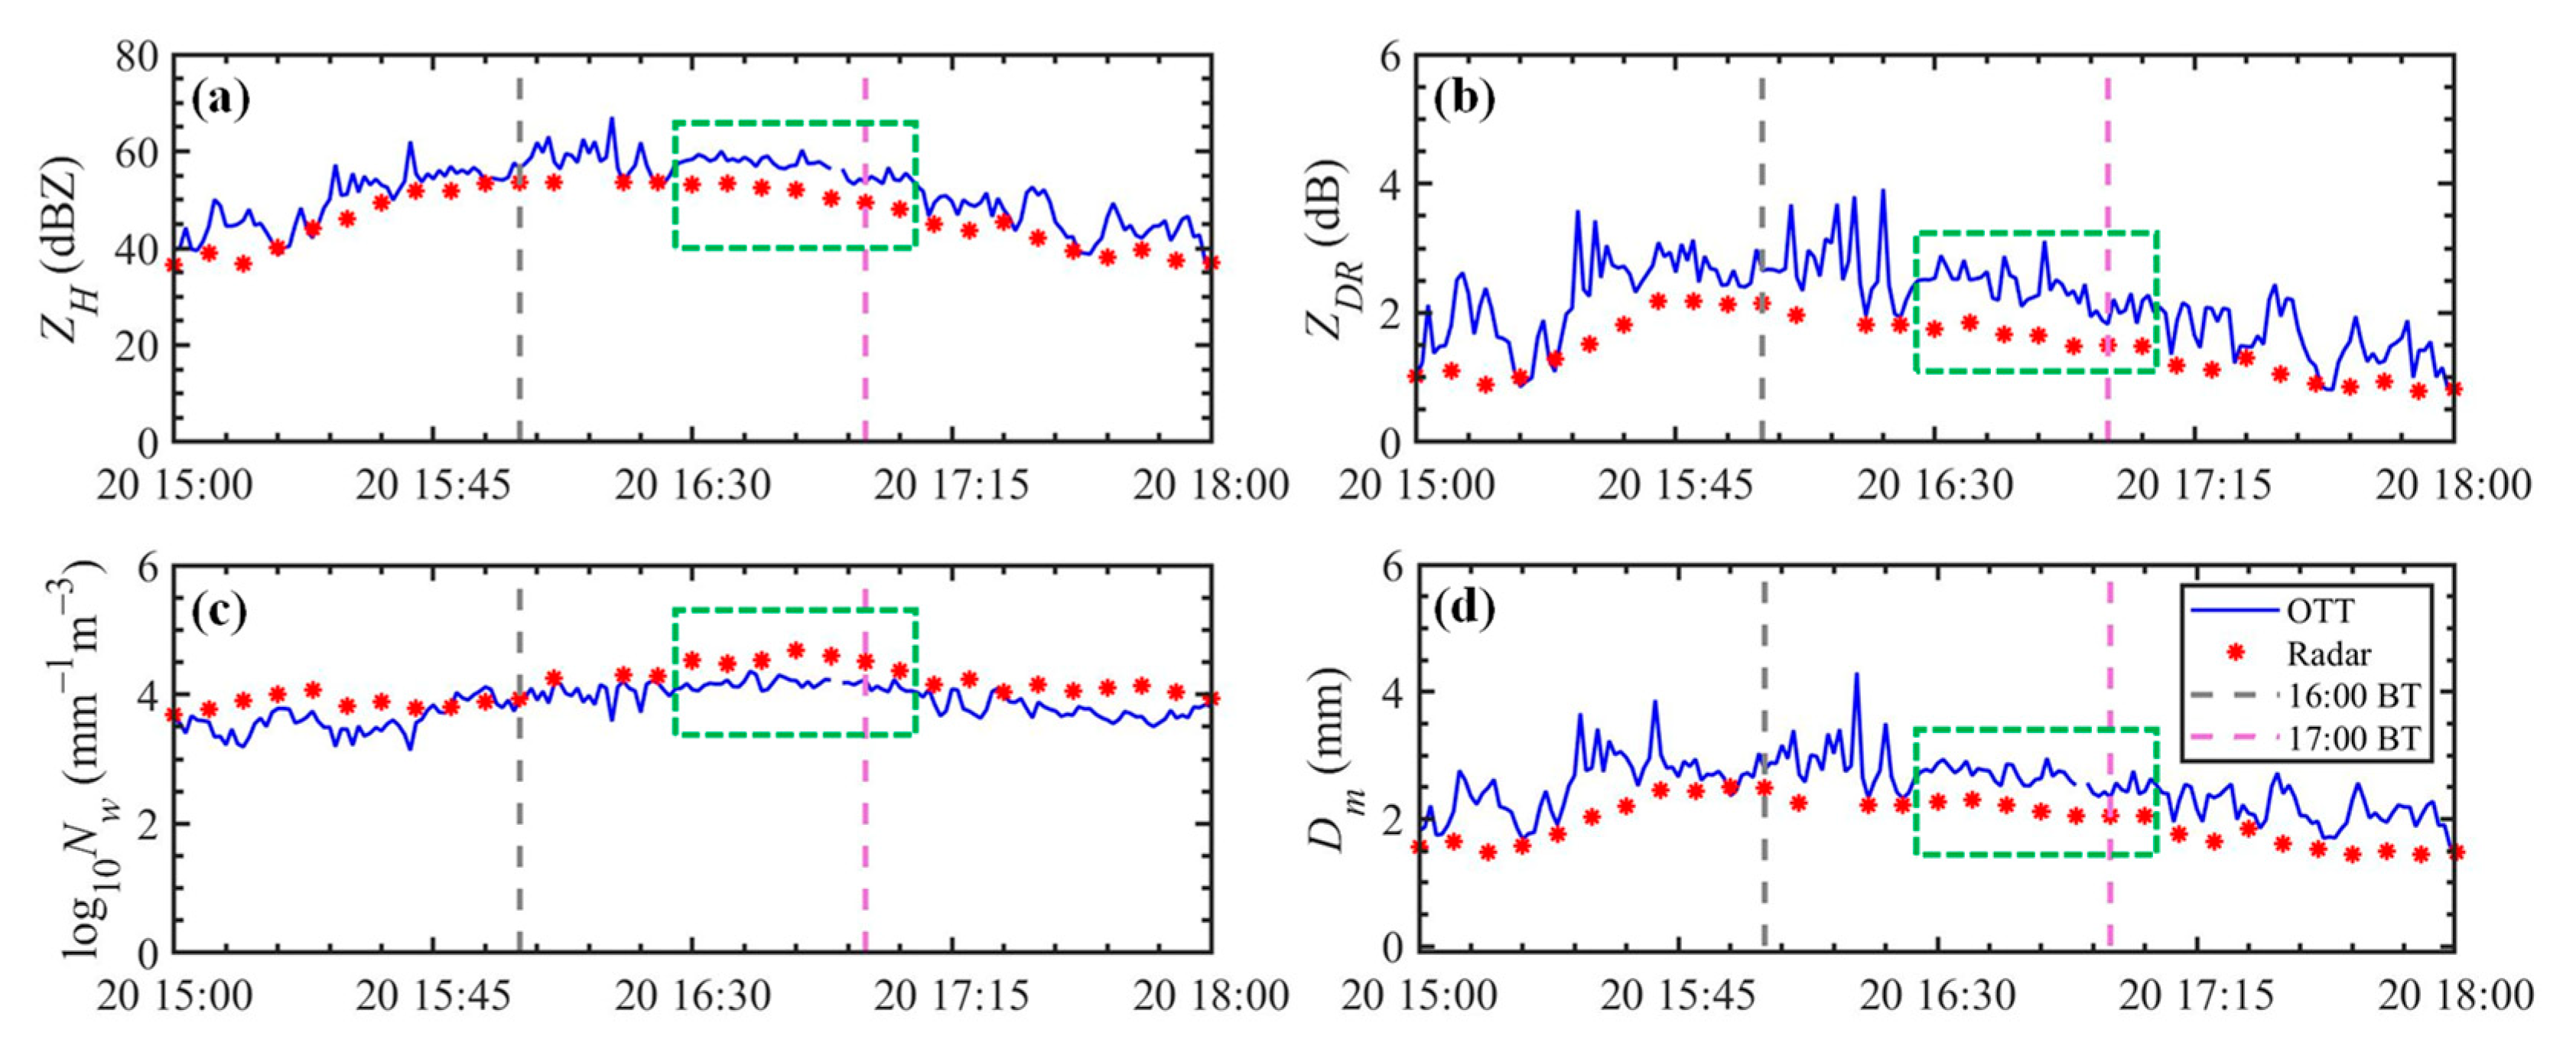
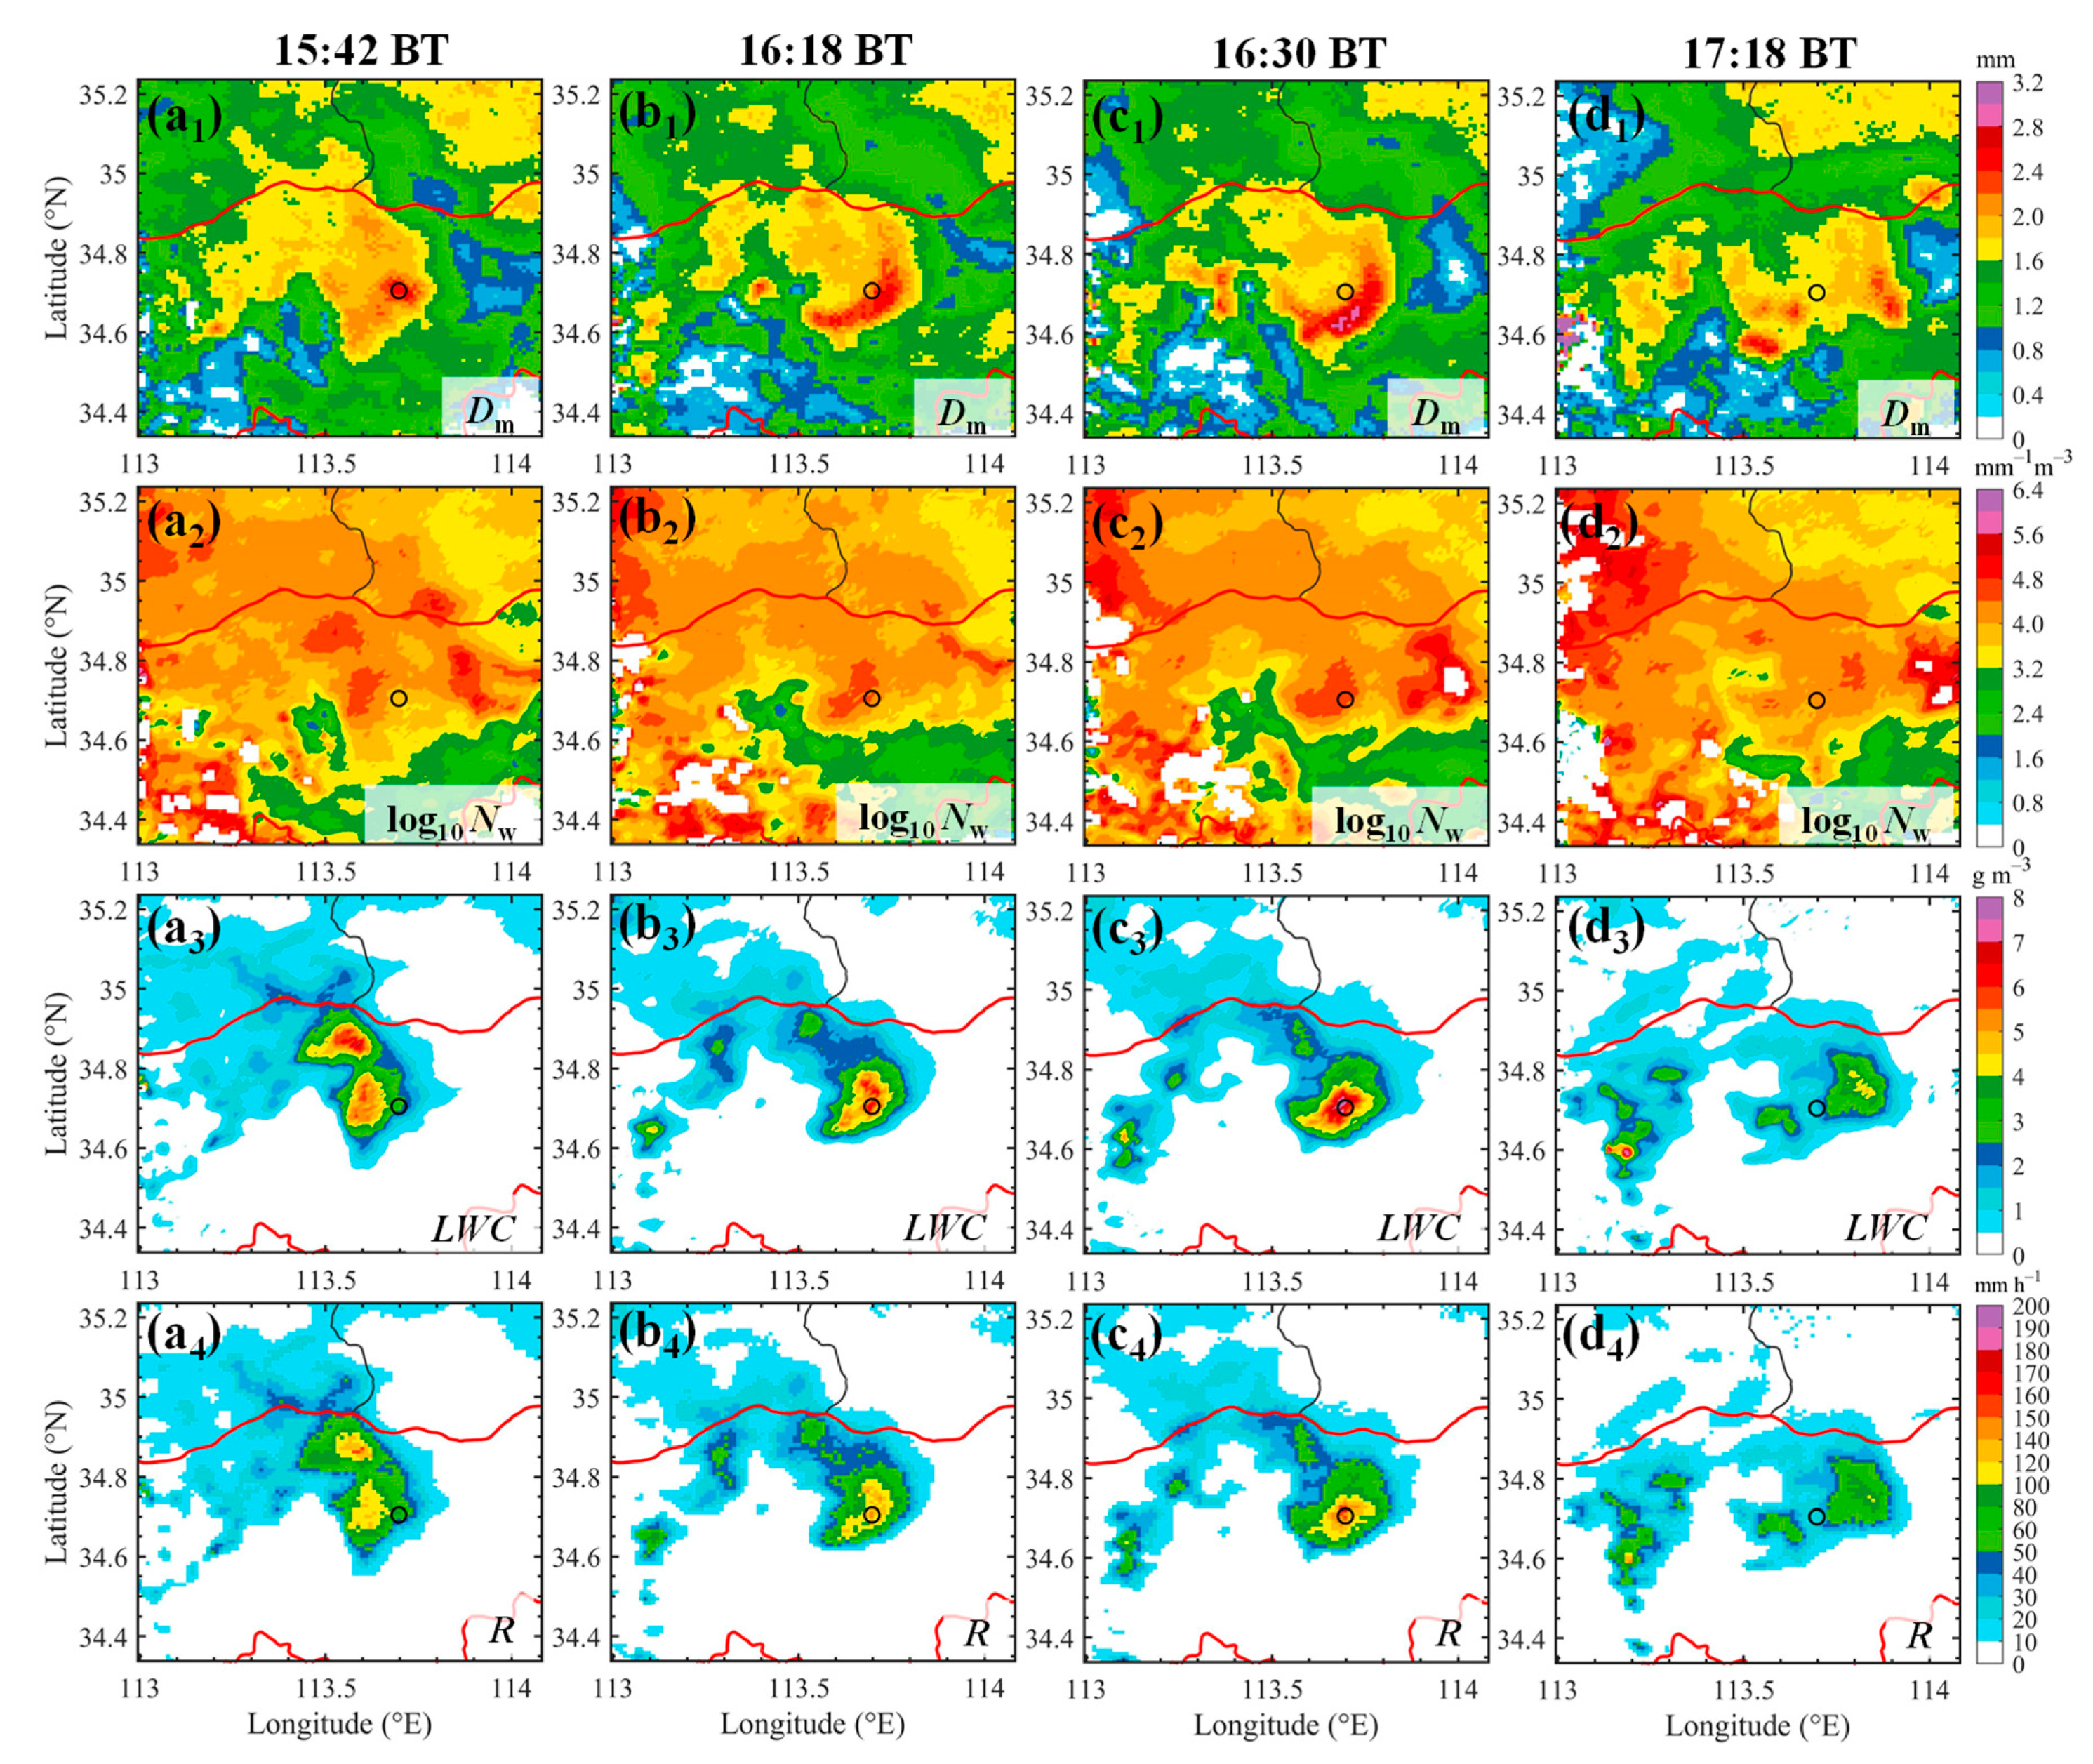
3.4.3. Radar-Retrieved DSD and Characteristics

Figure 10 shows a comparison between the microphysical parameters of precipitation at the 1.5 km height retrieved by LY-SPOL and the disdrometer observations at the ZZ Station. Figure 10a shows the polarimetric variables ZH at the same location, as observed by LY-SPOL and computed using the T-matrix method by the disdrometer. Figure 10b is similar but for the polarimetric variable ZDR. The comparison revealed that the evolution trends of ZH (Figure 10a) observed by the radar and derived from the disdrometer were generally consistent. However, between 16:30 and 17:05 BT, ZH observed by the radar was consistently lower by approximately 5 dBZ than the results computed by the disdrometer (indicated by the green dashed box in Figure 10a), and this difference remained stable for nearly 35 min. Correspondingly, ZDR observed by the radar during this period was consistently approximately 0.5 to 0.8 dB lower than the computed results of the disdrometer. Figure 10c,d show comparisons of Dm and log10 Nw retrieved from the disdrometer observations and LY-SPOL using the improved C-G model. Between 16:30 and 17:05 BT, the radar-retrieved log10 Nw was slightly higher (by 0.2~0.4 mm−1 m−3) than the disdrometer measurements, although the trends largely matched. Similar to the aforementioned ZH and ZDR comparison, Dm retrieved from the radar observations was 0.3~0.5 mm lower than the disdrometer-derived values between 16:30 and 17:05 BT. The differences between the two sets of observations could primarily be ascribed to the inconsistencies in the sampling volume and spatial location [40,48], with horizontal and vertical wind shear also playing a role. Notably, Dm observed by the disdrometer was higher than the radar-retrieved results at the 1.5 km altitude, while the particle concentration (log10 Nw) was lower (as indicated by the green dashed box in Figure 10c,d). This suggests a significant collision–coalescence process among raindrops during their descent, where larger raindrops entrain smaller raindrops, resulting in an increased particle diameter and decreased concentration by the time they reach the ground. This is consistent with the retrieved QVP results, where ZH and ZDR significantly increase near the ground. The comparative analysis suggests that the microphysical parameters retrieved using the polarimetric radar provide a suitable representation of the microphysical characteristics of the extreme heavy rainfall event in Zhengzhou and can be utilized to analyze the spatial microphysical structure and its evolution in the intense rainfall regions above Zhengzhou.
Figure 11(a1–a4) shows the DSD characteristics before the RBEHR at 15:42 BT. At this time, Dm was relatively large (Dm: 2.2~2.6 mm), log10 Nw was also large (log10 Nw: 3.8~4.2 mm−1 m−3), LWC was smaller (LWC: 3.0~4.0 g m−3), and R ranged from 60 to 80 mm, corresponding to a 1 h rainfall of 60.6 mm at the ZZ Station from 15:00 to 16:00 BT. At the onset of the RBEHR (16:18 BT), Dm slightly decreased (Dm: 2.0~2.4 mm), with larger Dm values mainly distributed southeast of the ZZ Station in an arc shape, aligning with the position of the ZDR arc feature in the dual-polarization measurements. Combined with the detailed three-dimensional wind field, this was primarily attributed to size sorting caused by wind shear. The log10 Nw value increased (log10 Nw: 4.2~4.6 mm−1 m−3), the LWC increased (LWC: 6.0~6.2 g m−3), and R ranged from 140 to 160 mm. During the peak phase of the RBEHR (16:30 BT), the variation in Dm was minimal (Dm: 2.0~2.4 mm), and its region with larger values slightly moved southeast of the ZZ Station. The log10 Nw value markedly increased (log10 Nw: 4.6~5.0 mm−1 m−3), the LWC increased (LWC: 6.0~8.0 g m−3), and the rain rate R ranged from 140 to 180 mm, corresponding to a 1 h rainfall of 201.9 mm at the ZZ Station from 16:00 to 17:00 BT. After the RBEHR phase (17:18 BT), Dm significantly decreased (Dm: 1.6~1.8 mm), log10 Nw decreased (log10 Nw: 4.2~4.4 mm−1 m−3), and the LWC also notably decreased (LWC: 1.0~2.0 g m−3). At this point, R decreased to 20~40 mm, corresponding to a 1 h rainfall reduction to 48.3 mm at the ZZ Station from 17:00 to 18:00 BT. This indicates that the anomalously high concentration of medium-sized raindrops plays a dominant role in influencing the liquid water content and rainfall rate.

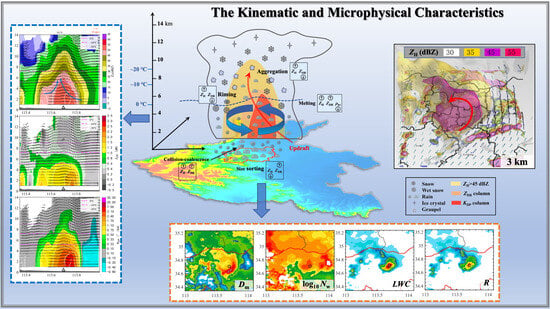
3.5. Conceptual Model

Figure 12 summarizes the conceptual model for the kinematic and microphysical characteristics of the extreme heavy rainfall event in Zhengzhou on 20 July 2021. As depicted in Figure 12a, the center of the heavy rainfall shows a pronounced mesoscale vortex and convergence structure (as indicated by the blue curled arrows), which promotes vertical upward convection. Strong vertical updrafts elevate large raindrops above the 0 °C isotherm, leading to distinct ZDR column and KDP column characteristics. Above the 0 °C isotherm, ice-phase processes are relatively active, with aggregation and riming processes evident (ZH increases, ZDR decreases). Below the 0 °C isotherm, there is intense warm rain processing, where many ice-phase particles descend and melt, forming large raindrops (both ZH and ZDR increase, while ρhv decreases). These particles then merge with the high-concentration raindrops in the lower layers, growing in size (with increases in ZH and ZDR). This results in the formation of high-concentration, large raindrops of various sizes (noted by increased ZH, ZDR, and KDP), which eventually contribute to extreme heavy rainfall at the ground level. Figure 12b provides a horizontal projection of the convective rainstorm from Figure 12a. Due to both horizontal and vertical wind shear effects, large raindrops exhibit size sorting during their descent, forming a distinct ZDR arc feature. The areas of heavy rainfall at the ground level largely coincide with the areas of strong updrafts.

4. Discussion and Conclusions

In this study, the kinematic and microphysical characteristics of the extreme heavy rainfall event in Zhengzhou on 20 July 2021 were examined based on ERA5, dual-polarization Doppler radar, FY-2G satellite, surface disdrometer, and AWS data. We focused especially on the macroscopic and microscopic features and the evolution mechanism of the RBEHR from 16:00 to 17:00 BT. The main conclusions and implications can be summarized as follows:
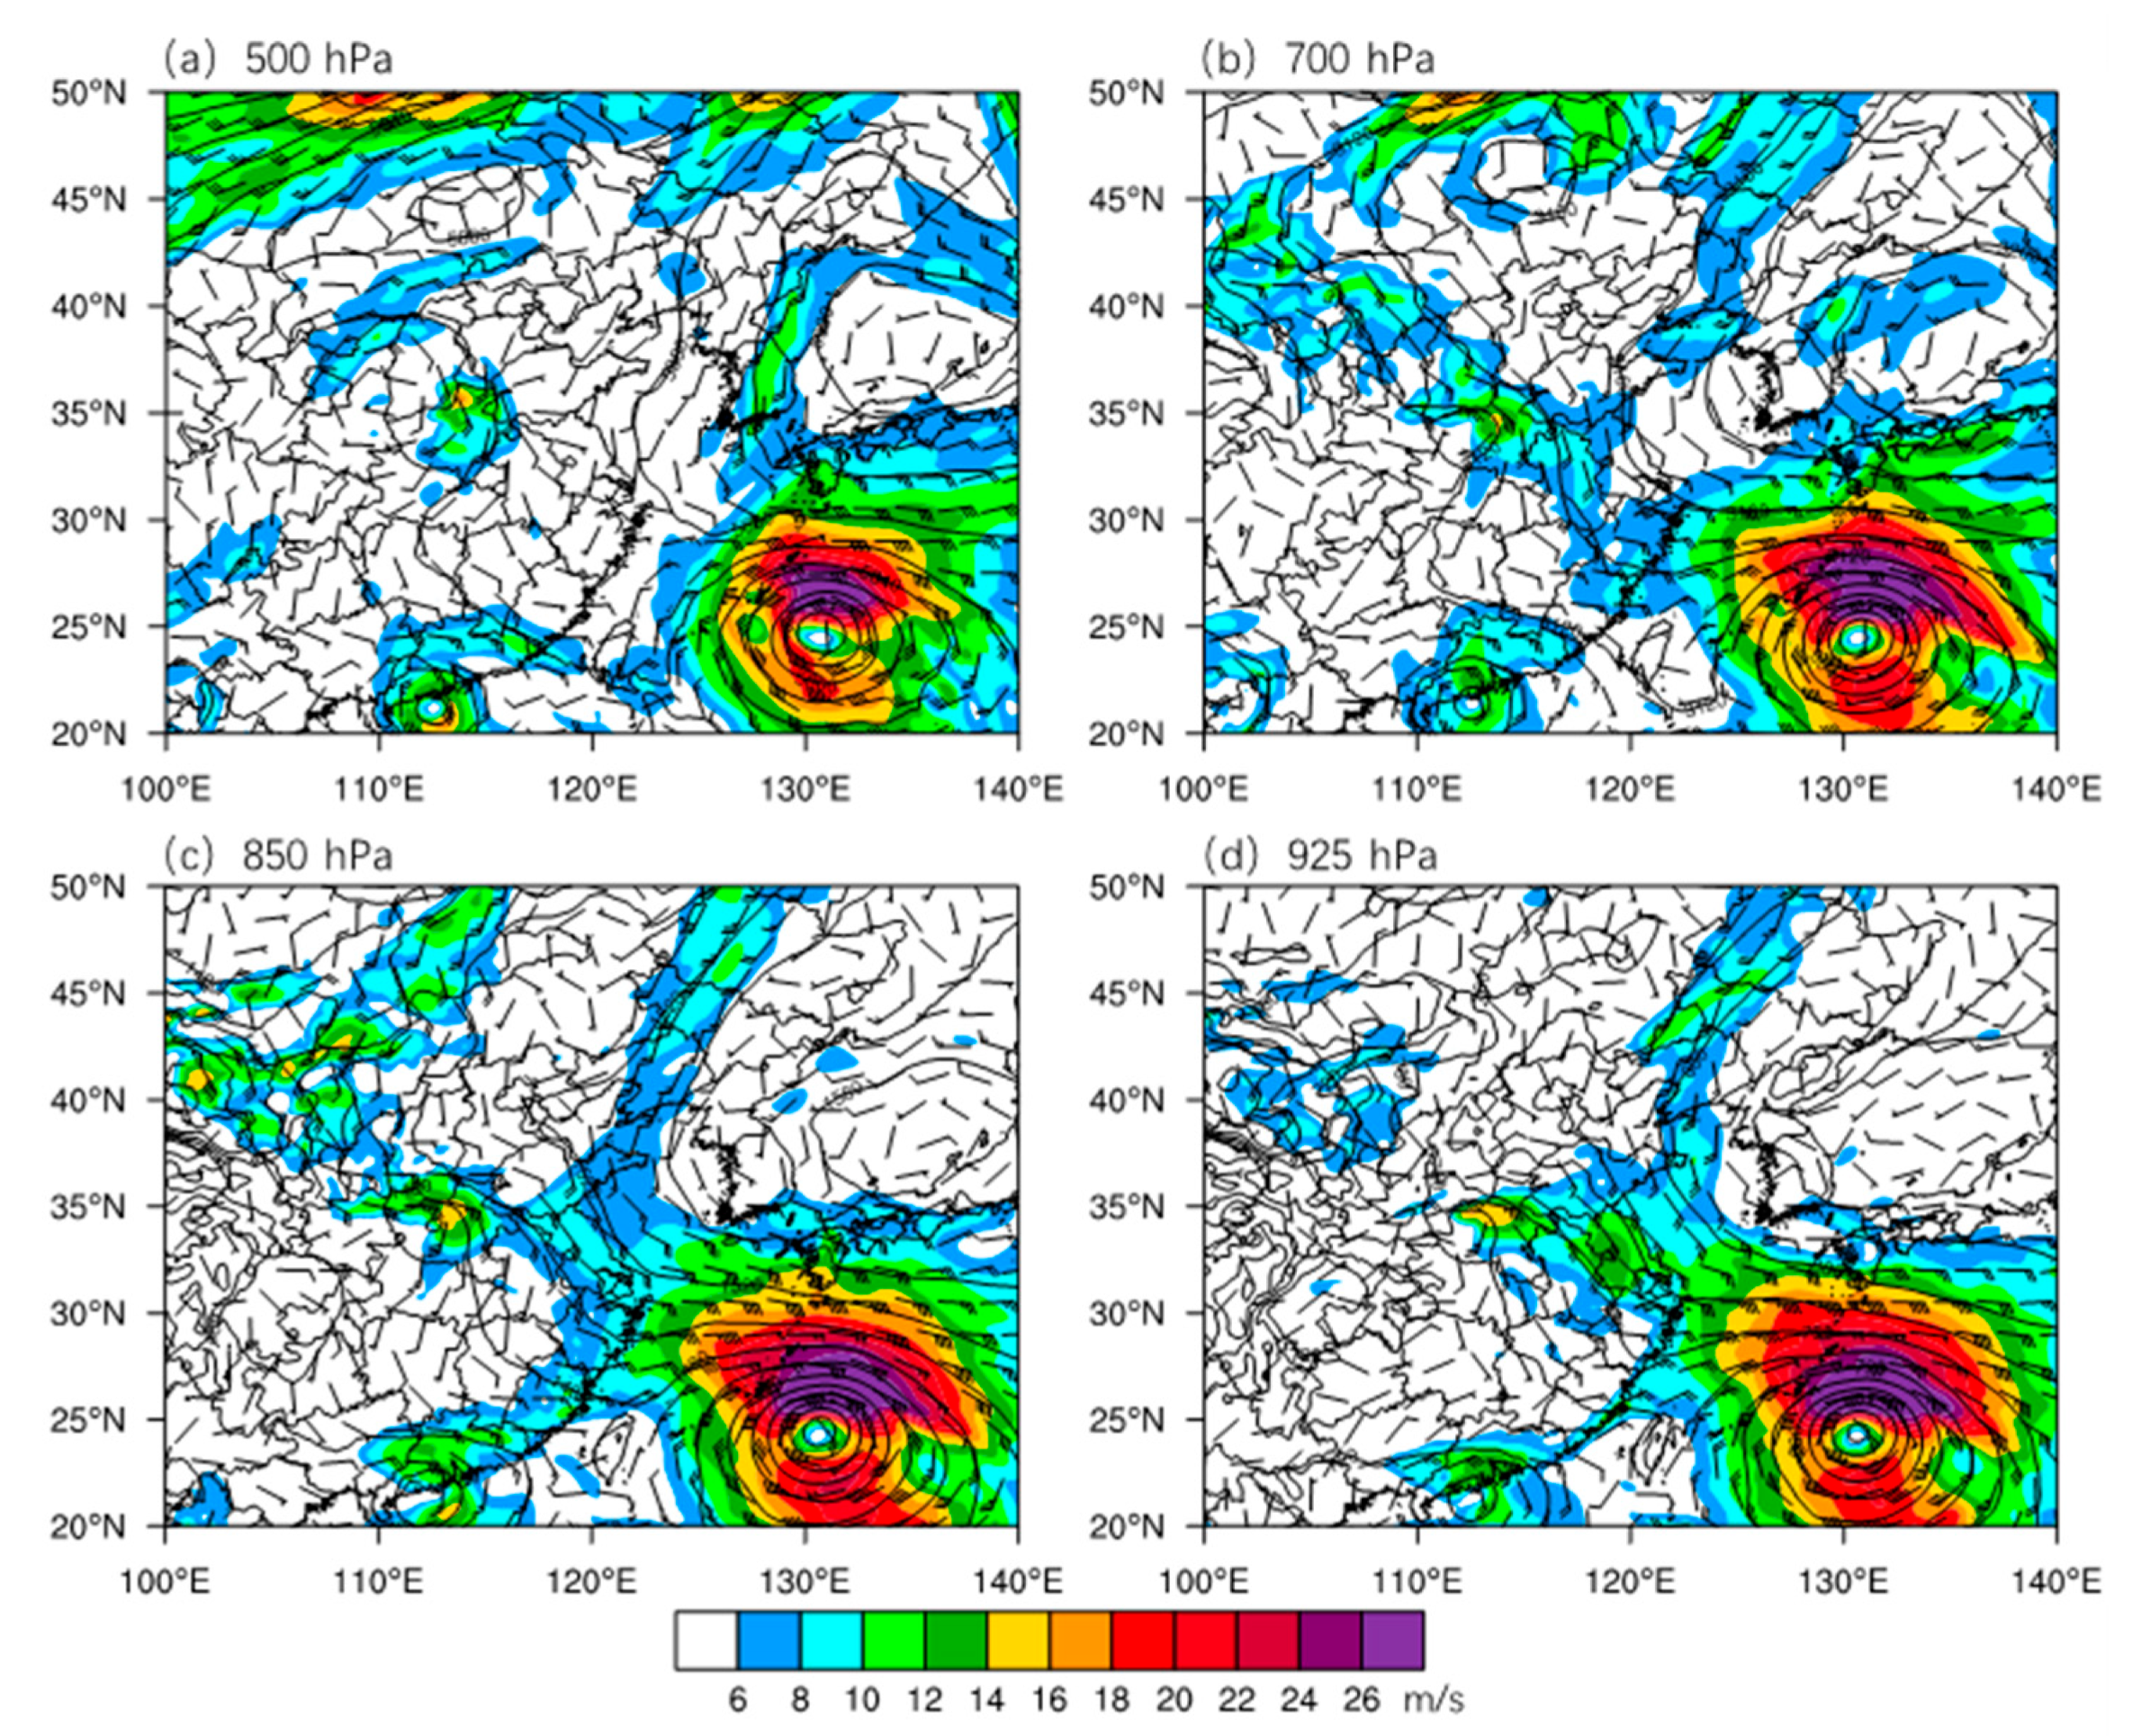
  • From a circulatory background perspective, the conditions for extreme rainfall in Zhengzhou are similar to those of a warm-sector downpour. The abnormally northward-shifted West Pacific subtropical high and Typhoon In-fa transported a large amount of warm, moist air from the sea to the Zhengzhou region. Converging low-level airstreams on the eastern, southern, and northern sides of Zhengzhou contributed to the maintenance and development of this quasi-stationary storm, causing it to stall over the area. Additionally, the barrier effect of the Taihang Mountains to the north prompted the easterly winds to be deflected southward, converging with airflows from the south over Zhengzhou. The moisture transported by the southeastern boundary layer jet also accumulated in front of the mountains, providing favorable conditions for the development of the persistent precipitation system, leading to record-breaking extreme hourly rainfall in Zhengzhou;
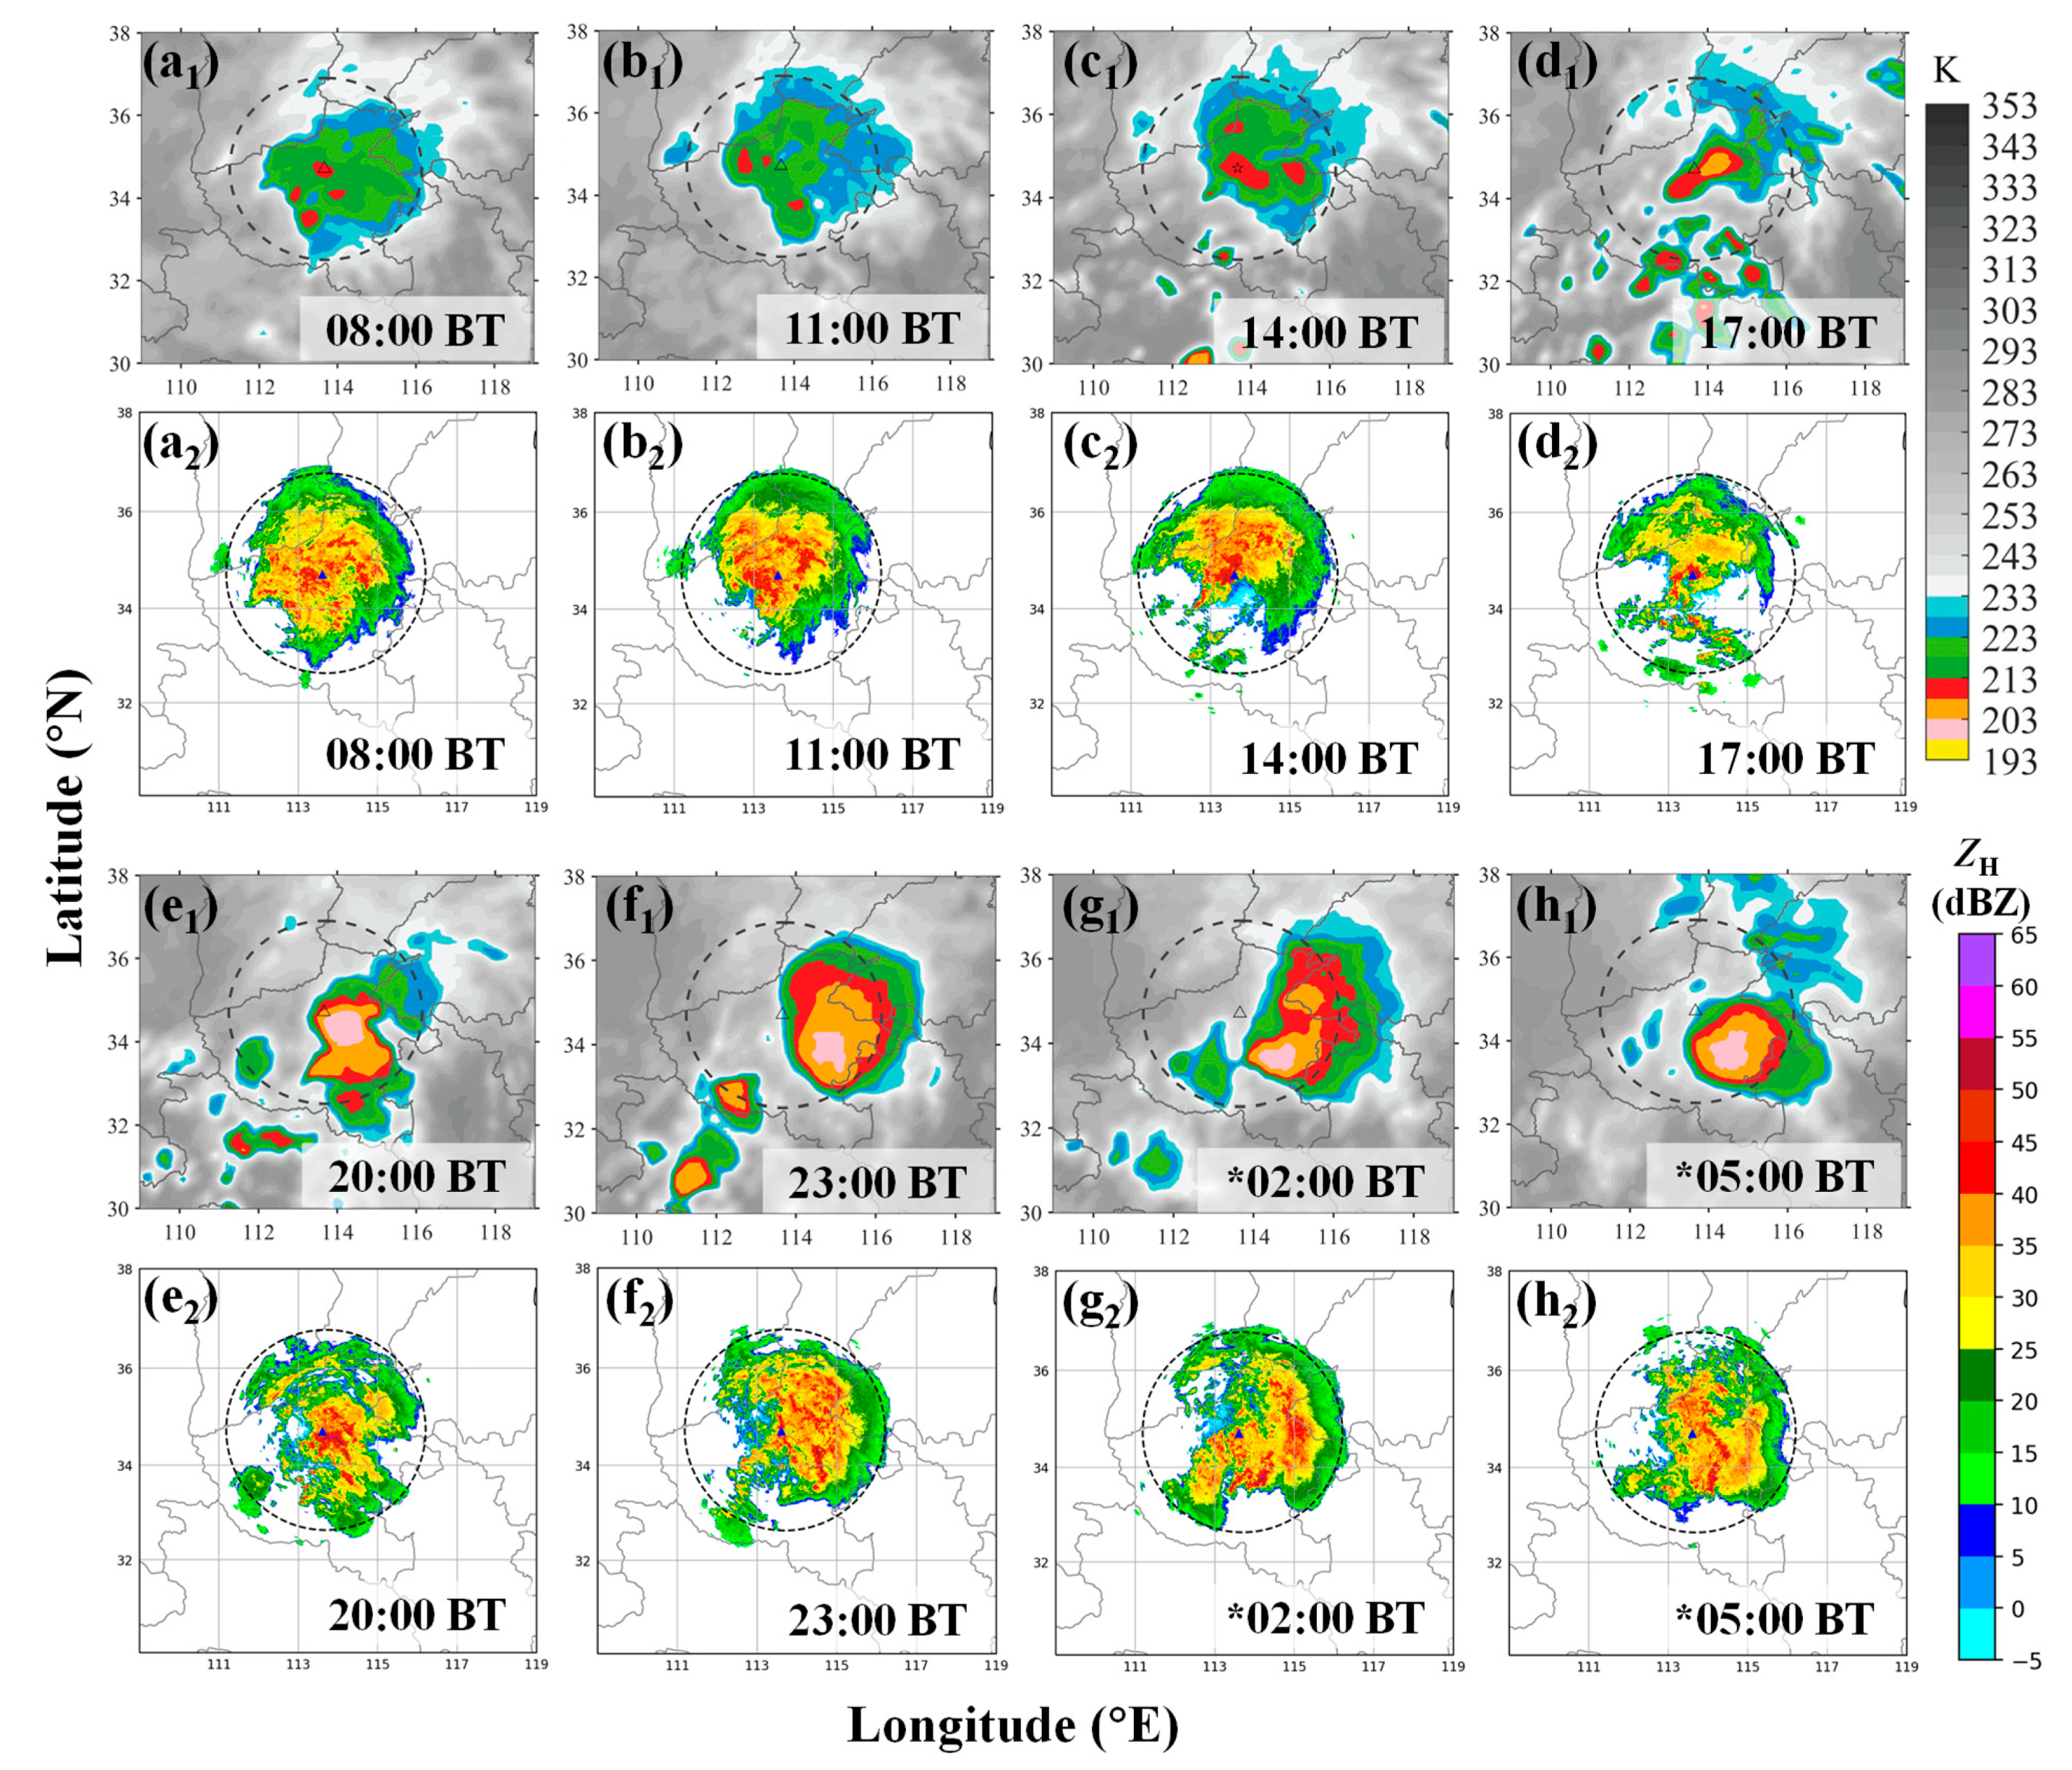
  • In terms of the FY-2G TBB and radar echo structure, the afternoon to evening of 20 July was the development phase of the MCC. The RBEHR in Zhengzhou from 16:00 to 17:00 BT primarily occurred during the merger of meso- and small-scale cloud clusters, and the merging of these clusters contributed to the increase in rainfall;
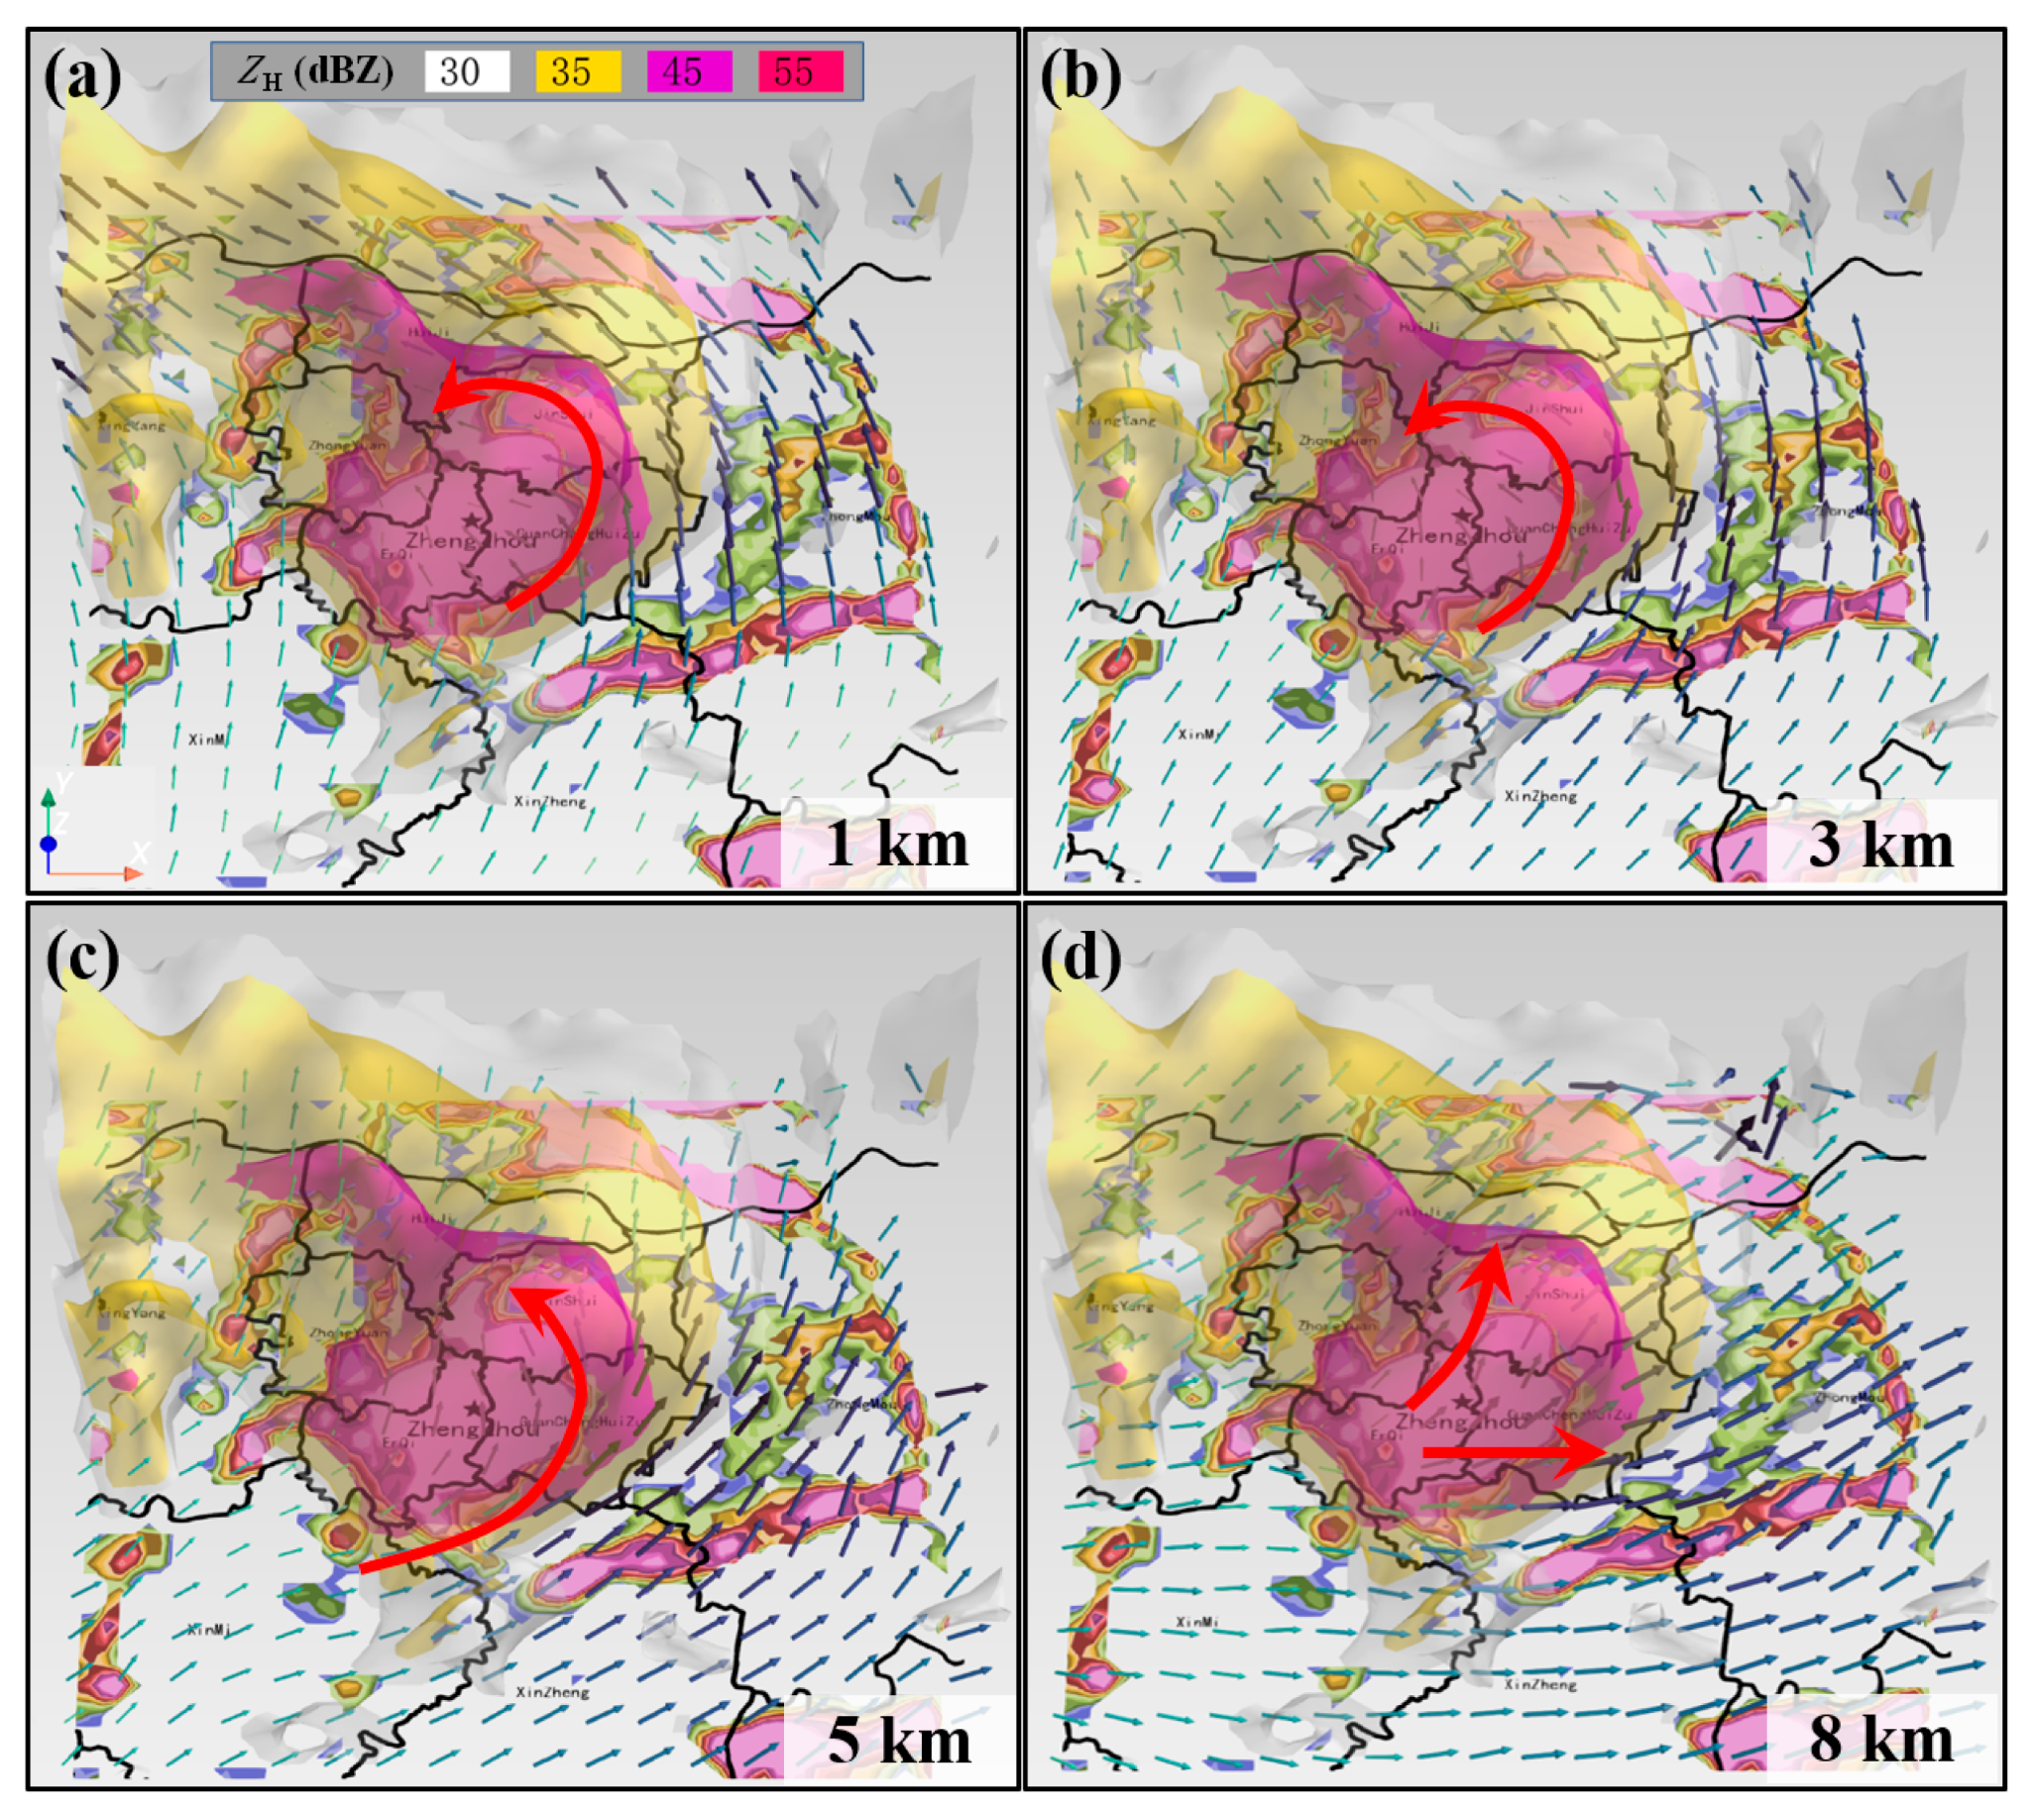
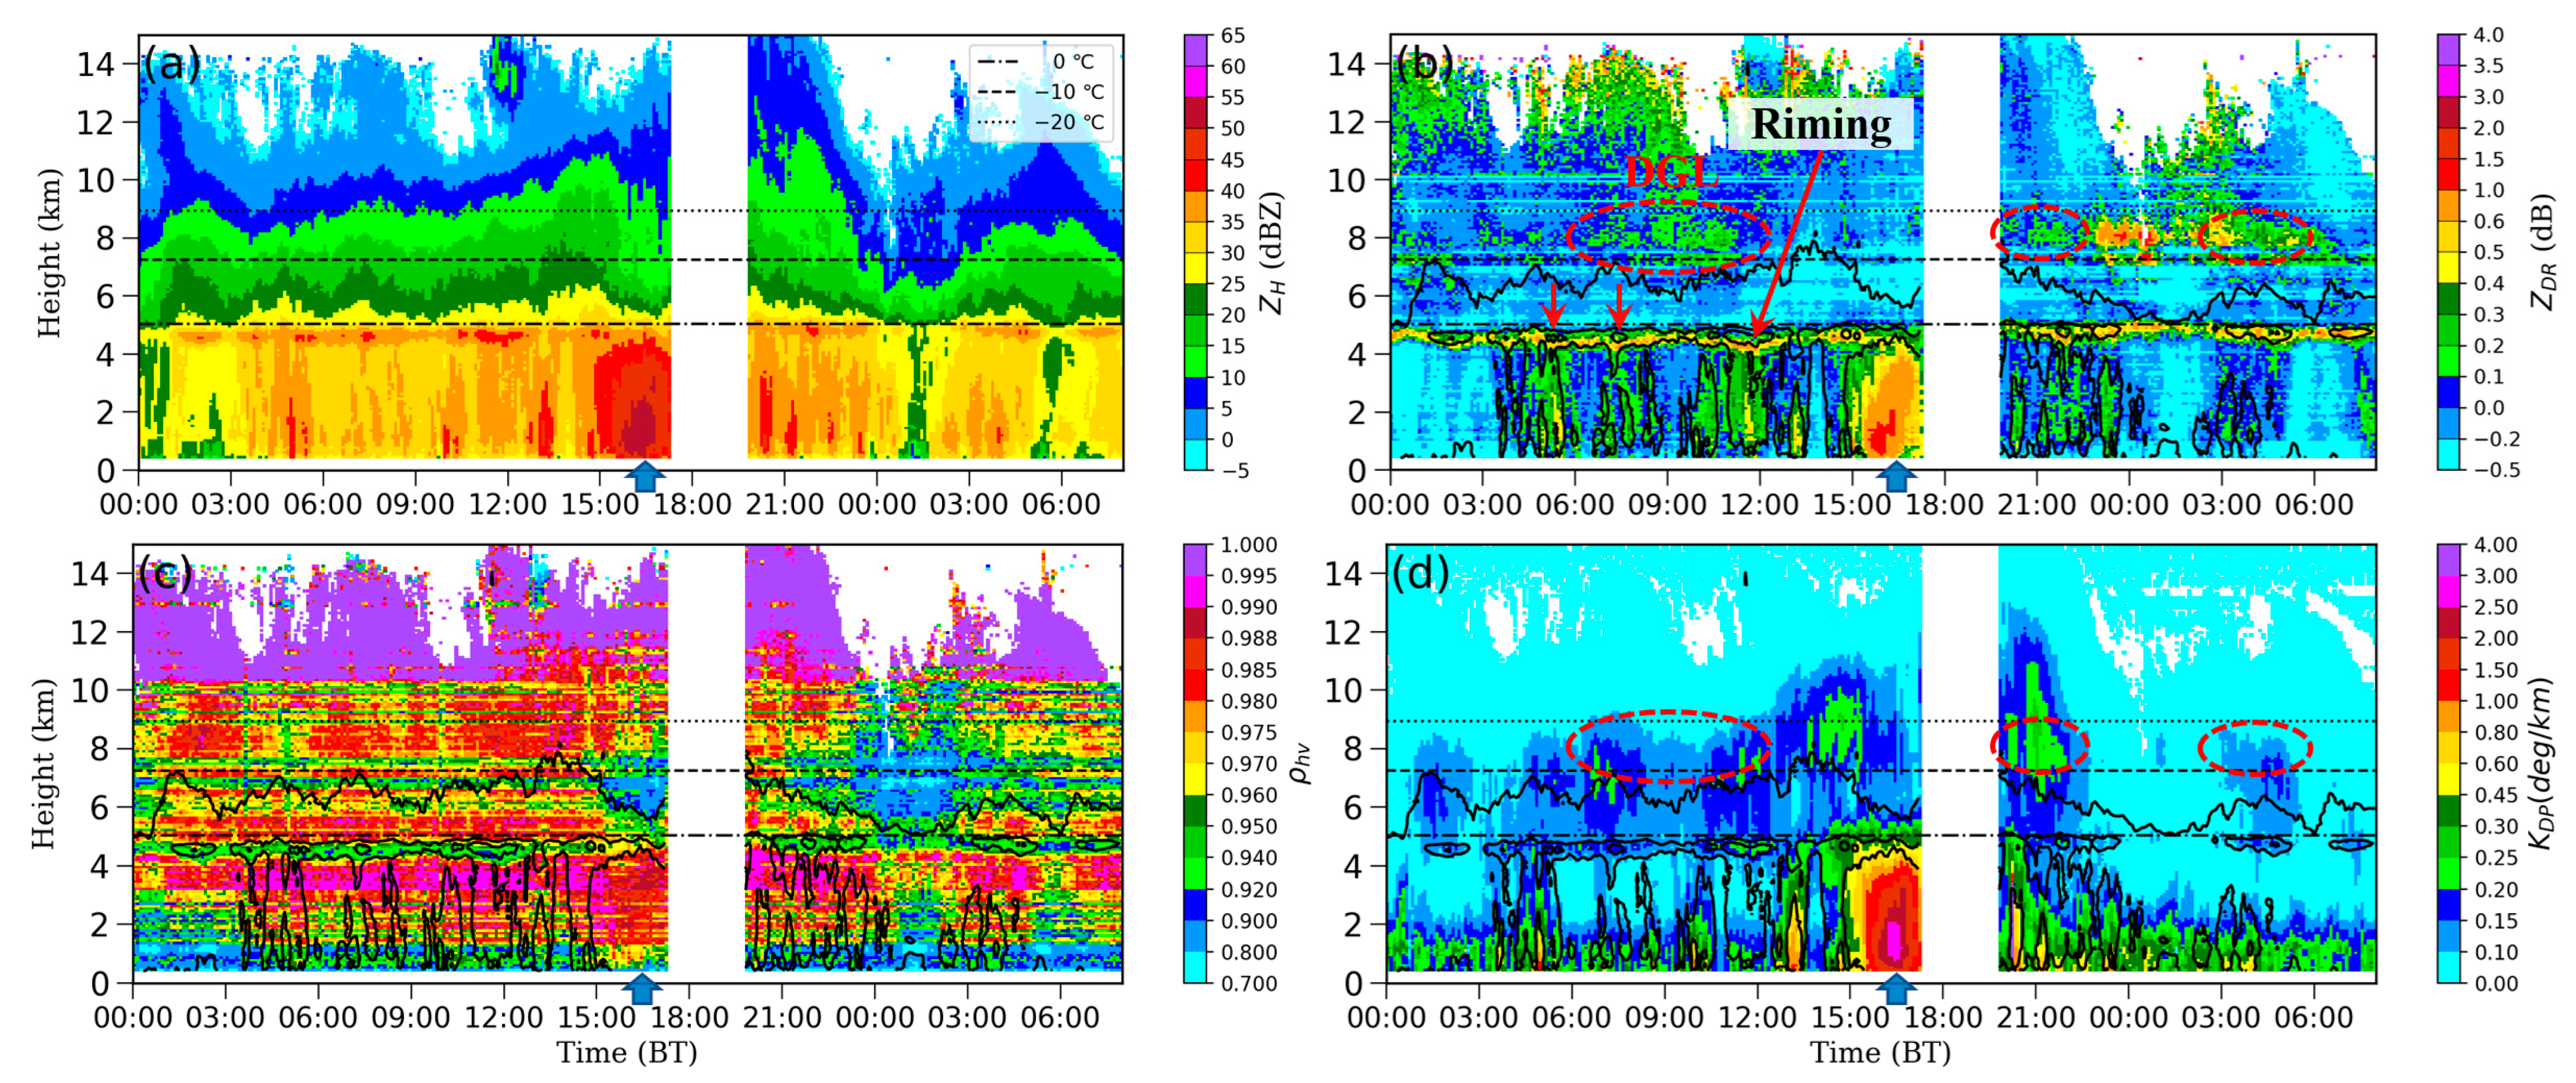
  • Regarding the three-dimensional fine-scale kinematic characteristics, during the RBEHR period, a super low-level jet from the southeast was maintained, showing significant vertical wind shear. Low-level convergence and upper-level divergence favored the vertical ascent of air. From 16:00 to 17:00 BT, there was a considerable mesoscale vortex and convergence structure, causing the echoes to remain relatively stationary and the precipitation to revolve locally, resulting in localized extreme rainfall in Zhengzhou. Among the polarimetric variables, there were evident ZH columns, ZDR columns, and KDP columns corresponding to vertical updraft. Combined with the fine wind field and vertical vorticity information, the formation mechanism of the prominent ZDR arc feature in the polarimetric variables at this stage was revealed;
  • Considering the strong localized nature of this extreme heavy rainfall event, we quantitatively analyzed its microphysical structure and evolutionary characteristics using radar-retrieved QVPs, DSDs, and surface disdrometer data. The results showed that the DSD type during the RBEHR period differed from that at other times and was primarily characterized by warm rain processes. Effective collision–coalescence processes led to the formation of high concentrations of raindrops with medium to large diameters, which predominantly contributed to extreme surface rainfall. The particle diameter observed by the surface disdrometer was larger than that determined by the low-level (1.5 km altitude) radar, whereas the particle concentration was lower. This suggests that during their descent, raindrops underwent significant collision–coalescence processes, resulting in an increase in the particle diameter and a decrease in the particle concentration by the time they reached the ground.
Although this study preliminarily revealed the kinematic and microphysical characteristics of the extremely heavy rainfall event in Zhengzhou on 20 July 2021, and their impact on the precipitation efficiency, more analysis should be performed. For instance, in QPE and automatic identification of short-term intense rainfall using the dual-polarization radar, it is essential to fully consider the changes in precipitation microphysics to establish more accurate radar QPE algorithms and objective identification models. Deepening our understanding of the impact of microphysical processes on extremely heavy rainfall can provide technical support for the optimization and improvement in model microphysical process parameterization schemes, thereby enhancing the forecasting capabilities for extreme heavy rainfall events. Extremely heavy rainfall events often occur in conjunction with γ-mesoscale vortices. Therefore, the use of multiband (e.g., S, C, and X bands) Doppler radar networks for coordinated observation and real-time retrieval of 3D wind fields to improve the monitoring and early warning of extremely heavy rainfall and severe convective weather also deserves further in-depth investigation.

Author Contributions

Conceptualization, B.W.; methodology, B.W.; data, M.W. and W.L.; validation, M.W., B.W. and W.L.; investigation, B.W., S.D. and Y.L.; writing—original draft preparation, B.W.; review and editing, M.W.; visualization, B.W., Y.L., Y.S., D.W. and L.X.; supervision, M.W. and L.L. All authors have read and agreed to the published version of the manuscript.

Funding

This research was supported by the Joint Funds of the Zhejiang Provincial Natural Science Foundation of China (Grant No. LZJMY23D050002 and LZJMD23D050001), Science and Technology Program of Zhejiang Province (Grant No. 2022C03150), Science and Technology Program of Huzhou (Grant No. 2022GZ60), Science and Technology (Key) Program of Zhejiang Meteorological Service (Grant No. 2022ZD27), and Review and Summary Special Program of China Meteorological Administration (Grant No. FPZJ2023-054).

Data Availability Statement

The data used in this study can be accessed by contacting the corresponding author. The data are not publicly available due to privacy.

Conflicts of Interest

The authors declare no conflict of interest.

Appendix A

Appendix A.1. Interpolation of Radar Data from Polar to Cartesian Coordinates

As a first step for any regridding activity, a mapping must be established between two different coordinate systems. The weather radar observations are given in the polar coordinates of azimuth (ϕ), elevation (θ), and range (r). However, the analysis and interpretation of data are more effectively performed in a Cartesian coordinate system (x, y, z), especially when calculating gradient quantities like divergence and integral quantities such as vertical velocity. Before initiating the wind analysis procedure, transforming the radar data from polar to Cartesian coordinates is essential. This transformation is achieved through geometric relations [62]:
x y z = r cos ( π / 2 ϕ ) cos ( θ ) r sin ( π / 2 ϕ ) cos ( θ ) r sin ( θ ) .
where (x, y, z) represents the Cartesian coordinates. The zenith direction is +z, west is −x, and east is +x; south is −y, and north is +y.
The gridding operation provides interpolation from the radar’s polar sampling points to the desired grid points, and as a result of the interpolation, the data undergo a degree of filtering. Several gridding techniques with varying levels of complexity are typically available in common radar software packages, including the nearest-neighbor approach, bilinear interpolation, Cressman analysis [63], and Barnes analysis [64,65]. The choice of the technique is mainly dictated by the available computational resources and by the variable being represented (e.g., scalar variables such as reflectivity, vector variables such as Doppler velocity, or categorical variables such as hydrometeor classification).

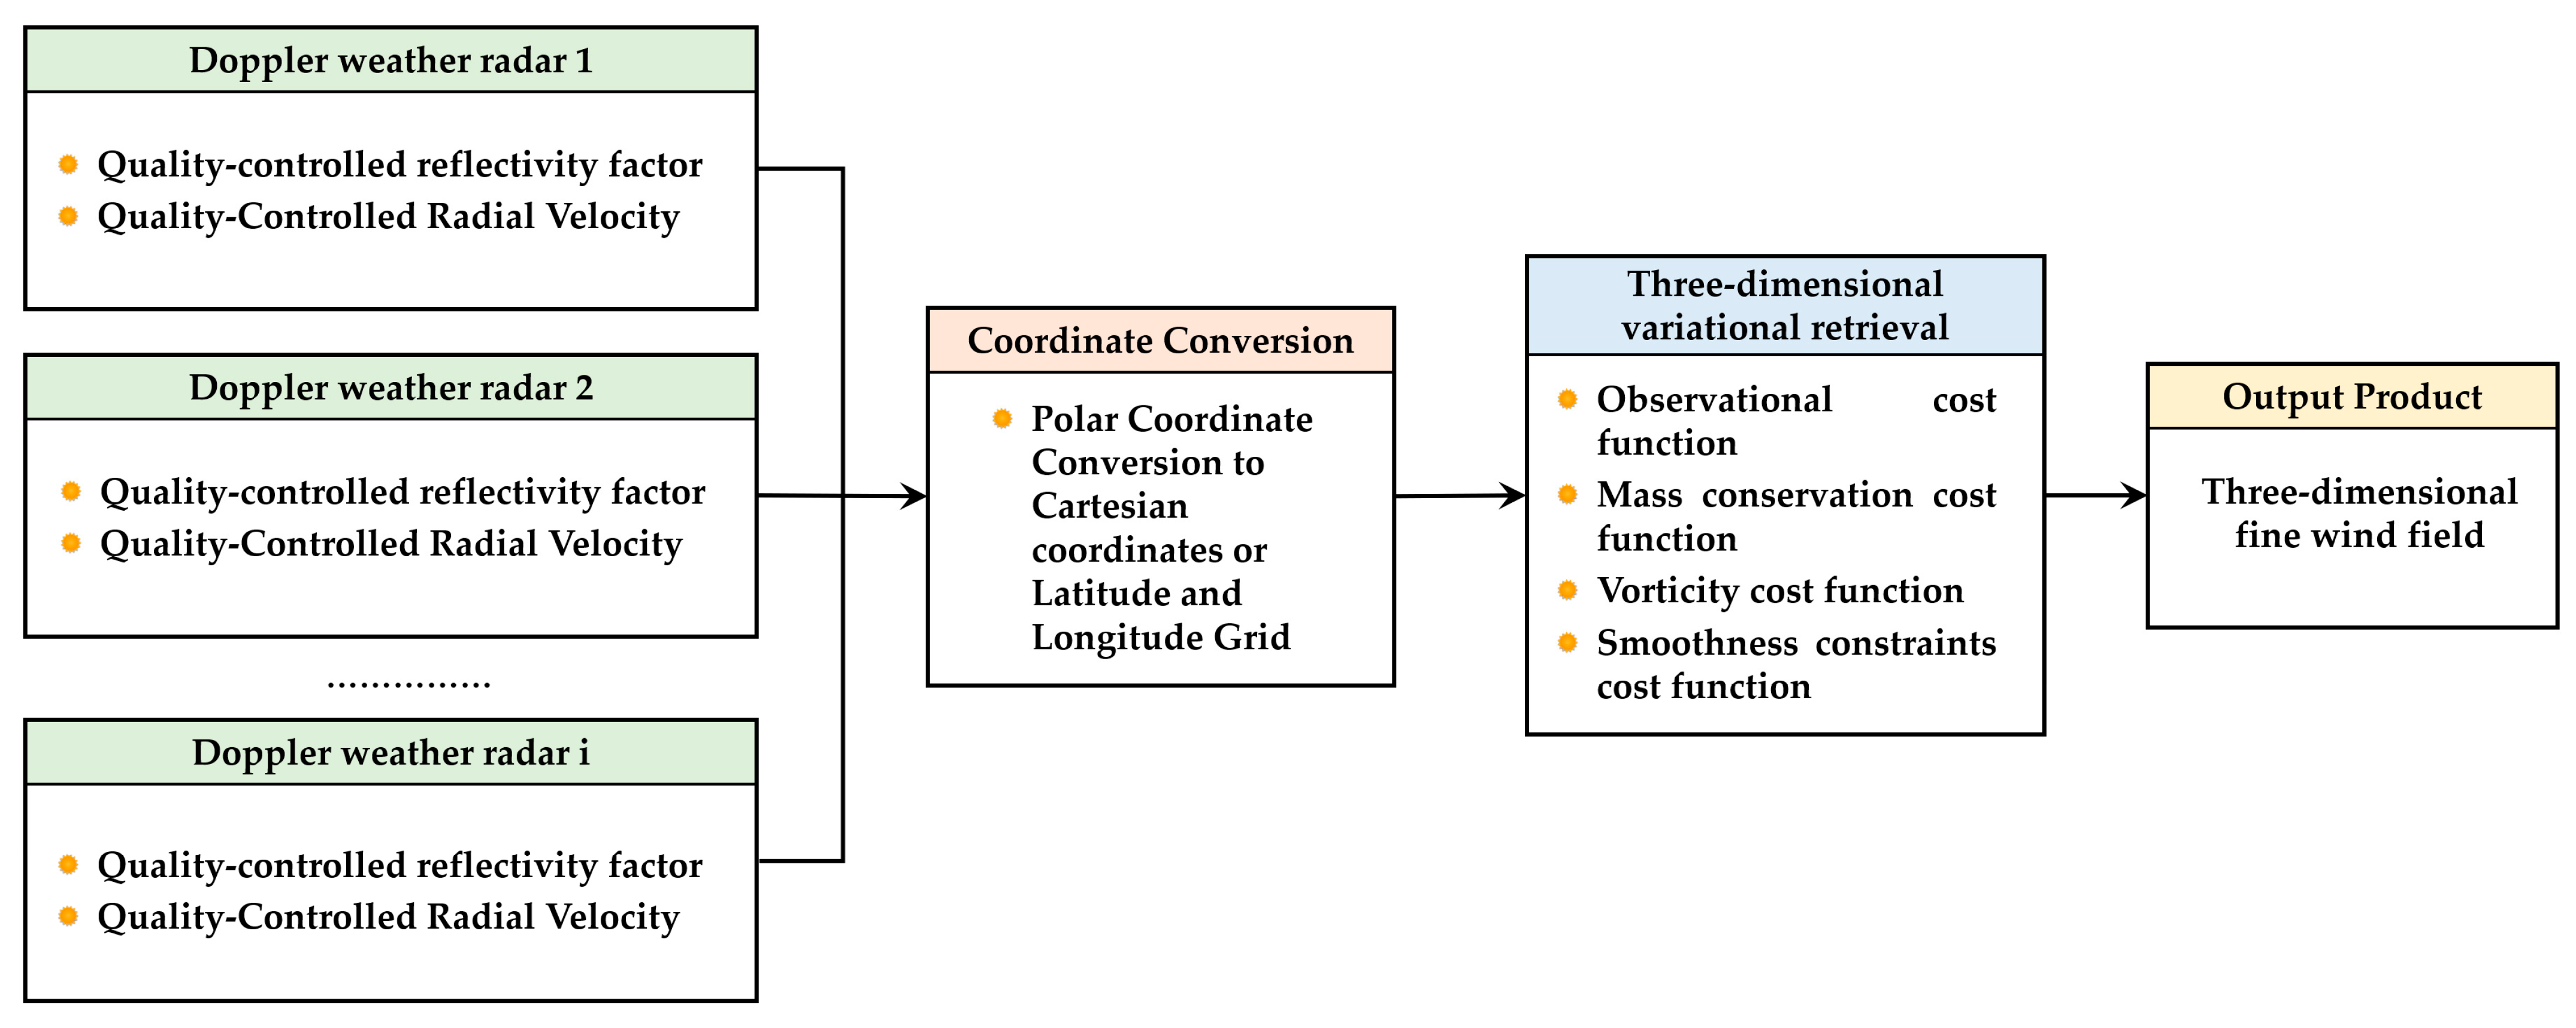
Appendix A.2. Three-Dimensional Variational Wind Field Retrieval Algorithm

In the analysis, we employed the sophisticated variational multiple-Doppler radar wind analysis procedure, as developed and refined by Shapiro et al. [42], Potvin et al. [43] and Wu et al. [31]. Given the multitude of potential errors, uncertainties, and associated limitations arising from the observational, computational, and spatiotemporal interpolation methods, we applied the weak-constraint variational formalism to the analysis of three-dimensional winds. This approach utilizes dealiased radial velocity observations from Doppler radars. The cost function for this analysis can be defined as follows:
J = J O + J M + J V + J S
where J O , J M , J V , and J S are the cost functions associated with the observational, mass conservation, vorticity, and smoothness constraints, respectively. Within each of these cost functions, the constant constraint weight is denoted by a corresponding subscript λ .
The observational cost function is as follows:
J O = i = 1 n λ O v r i o b s v r i a 2 , i = 1 , , n ,
where n denotes the number of radars, while v r i o b s denotes the radial wind observed by the i th radar (ranging from 1 to n ) within the Cartesian analysis space. Moreover, v r i a denotes the analyzed radial wind corresponding to the i th radar. To consider the wind field displacement from t = 0 to the observation time t at location x , y , z , the variable v r i a is defined as:
v r i a = r i x , y , z i u a x , y , z t D u D t x , y , z + j v a x , y , z t D v D t x , y , z + k w a x , y , z w t
where w t is the terminal velocity of the hydrometeors, which can be estimated through the radar reflectivity coupled with an empirical equation [66]; u a , v a , and w a are evaluated at the location shifted backward in time; and D u / D t and D v / D t are incorporated to accommodate the intrinsic evolution of the horizontal wind field between the analysis and observation times. Moreover, r i x , y , z = cos θ sin ϕ i + cos θ cos ϕ j + sin θ k denotes the radial unit vector corresponding to the radar beam, defined specifically by the elevation angle θ and the azimuth angle ϕ of the radar.
The mass conservation cost function can be expressed as:
J M Cart λ M ( ρ s u a ) x + ( ρ s v a ) y + ( ρ s w a ) z 2
where ρ s denotes the base-state atmospheric density, which is assumed to have a value of ρ s ( z ) = ρ 0 exp ( z / H ) with ρ 0 = 1 kg m−3 and a scale height H = 10 km. All the subsequent cost functions, including this one, are computed across all points in the Cartesian analysis grid (Cart).
The vorticity constraint can be expressed as:
J V Cart λ V u a U ζ a x + v a V ζ a y + w a ζ a z + v a z w a x u a z w a y + ζ a u a x + v a y 2
where ζ   ( = v / x u / y ) is the vertical vorticity and U and V are precalculated advection velocity components.
The smoothness cost function can be expressed as:
J S Cart λ S 1 2 u a x 2 2 + 2 u a y 2 2 + 2 v a x 2 2 + 2 v a y 2 2 + Cart λ S 2 2 u a z 2 2 + 2 v a z 2 2 + Cart λ S 3 2 w a x 2 2 + 2 w a y 2 2 + Cart λ S 4 2 w a z 2 2
where J S serves as a filter to suppress small-scale noise in the analyzed wind field and for interpolated the observational variables into areas with missing data. The utilization of second-order derivatives enables the extension of the spatial trends in the wind field into regions where data are absent.
Under the upper-level boundary condition (at the top of the atmosphere), we enforce a vertical velocity of w = 0, commonly referred to as the impermeability condition [67]. In regions with a flat topography, the lower boundary condition also maintains w = 0, consistent with the upper-level boundary condition. In cases involving a complex geometry, the establishment of lower boundary conditions depends on the immersed boundary method (IBM) [68]. In this study, we applied the Dirichlet boundary condition to w , while the Neumann boundary condition was applied to u and v , which can be expressed as:
u n = v n = 0
and
w = u h x + v h y
where u / n and v / n denote the normal derivatives of u and v , respectively, as they cross the boundary, and h denotes the terrain height. For a comprehensive explanation of the schemes for the lower boundary conditions in terrains, please consult the literature [15,69,70].

Appendix A.3. Process for Dual (Multiple) Radar Wind Field Retrieval

Figure A1 illustrates the retrieval process for a three-dimensional wind field using dual (multiple) radars. Firstly, the radial velocities and reflectivity factors from quality-controlled weather radars are converted from polar to Cartesian coordinates or latitude-longitude grids. Then, the radial velocity data from the latitude-longitude grid of at least two weather radars are used to perform a three-dimensional variational analysis to find the optimal solution. Finally, the three-dimensional wind field is output. The cost function for the optimal solution consists of four constraints: radial observation constraint, mass conservation constraint, vertical vorticity constraint, and spatial smoothing constraint.
Figure A1. Dual (multiple) radar three-dimensional wind field retrieval process.
Remotesensing 15 05688 g0a1

References

  1. Yin, J.F.; Gu, H.D.; Liang, X.; Yu, M.; Sun, J.S.; Xie, Y.X.; Li, F.; Wu, C. A possible dynamic mechanism for rapid production of the extreme hourly rainfall in Zhengzhou City on 20 July 2021. J. Meteorol. Res. 2023, 6, 6–25. [Google Scholar] [CrossRef]
  2. Su, A.F.; Lv, X.N.; Cui, L.M.; Li, Z.; Xi, L.; Li, H. The basic observational analysis of “7.20” extreme rainstorm in Zhengzhou. Torr. Rain Dis. 2021, 40, 445–454. (In Chinese) [Google Scholar] [CrossRef]
  3. Chen, G.; Zhao, K.; Lu, Y.H.; Zheng, Y.Y.; Xue, M.; Tan, Z.M.; Xu, X.; Huang, H.; Chen, H.N.; Xu, F.; et al. Variability of Microphysical Characteristics in the “21·7” Henan Extremely Heavy Rainfall Event. Sci. China Earth Sci. 2022, 65, 1861–1878. [Google Scholar] [CrossRef]
  4. Fu, S.M.; Zhang, Y.C.; Wang, H.J.; Tang, H.; Li, W.L.; Sun, J.H. On the Evolution of a Long-Lived Mesoscale Convective Vortex That Acted as a Crucial Condition for the Extremely Strong Hourly Precipitation in Zhengzhou. J. Geophys. Res. Atmos. 2022, 127, e2021JD036233. [Google Scholar] [CrossRef]
  5. Sun, J.H.; Fu, S.M.; Wang, H.J.; Zhang, Y.C.; Chen, Y.; Su, A.F.; Wang, Y.Q.; Tang, H.; Ma, R.Y. Primary Characteristics of the Extreme Heavy Rainfall Event over Henan in July 2021. Atmos. Sci. Lett. 2023, 24, e1131. [Google Scholar] [CrossRef]
  6. Chyi, D.; He, L.F.; Wang, X.M.; Chen, S. Fine observation characteristics and thermodynamic mechanisms of extreme heavy rainfall in Henan on 20 July 2021. J. Appl. Meteorol. Sci. 2022, 33, 1–15. (In Chinese) [Google Scholar] [CrossRef]
  7. Ran, L.K.; Li, S.W.; Zhou, Y.S.; Yang, S.; Ma, S.P.; Zhou, K.; Shen, D.D.; Jiao, B.F.; Li, N. Observational Analysis of the Dynamic, Thermal, and Water Vapor Characteristics of the “7.20” Extreme Rainstorm Event in Henan Province, 2021. Chin. J. Atmos. Sci. 2021, 45, 1366–1383. (In Chinese) [Google Scholar]
  8. Sun, Y.; Xiao, H.; Yang, H.L.; Ding, J.F.; Fu, D.H.; Guo, X.L.; Feng, L. Analysis of Dynamic Conditions and Hydrometeor Transport of Zhengzhou Superheavy Rainfall Event on 20 July 2021 Based on Optical Flow Field of Remote Sensing Data. Chin. J. Atmos. Sci. 2021, 45, 1384–1399. (In Chinese) [Google Scholar] [CrossRef]
  9. Yin, L.; Ping, F.; Mao, J.H.; Jin, S.G. Analysis on Precipitation Efficiency of the “21.7” Henan Extremely Heavy Rainfall Event. Adv. Atmos. Sci. 2023, 40, 374–392. [Google Scholar] [CrossRef]
  10. Guo, H.H.; Wang, K. Analysis of the microphysical characteristics of the “7·20” extremely heavy rainfall in Zhengzhou based on dual-polarization radar and precipitation phenomenon instrument data. Trans. Atmos. Sci. 2023, 46, 713–724. (In Chinese) [Google Scholar] [CrossRef]
  11. Zhang, Q.; Luo, Y.; Tang, Y.; Xu, X.; Yu, S.; Wu, C. Cause-Effect Relationship between Meso-γ-Scale Rotation and Extreme Short-Term Precipitation: Observational Analyses at Minute and Sub-Kilometer Scales. J. Meteorol. Res. 2022, 36, 539–552. [Google Scholar] [CrossRef]
  12. Nielsen, E.R.; Russ, S.S. Dynamical Mechanisms Supporting Extreme Rainfall Accumulations in the Houston “Tax Day” 2016 Flood. Mon. Weather Rev. 2020, 148, 83–109. [Google Scholar] [CrossRef]
  13. Nielsen, E.R. Observations of Extreme Short-Term Precipitation Associated with Supercells and Mesovortices. Mon. Weather Rev. 2020, 148, 159–182. [Google Scholar] [CrossRef]
  14. Wu, B.; Wei, M.; Li, Y. Dual-Polarization Radar Observations of the Evolution of a Supercell Tornado and Analysis of the Echo Mechanisms. Atmosphere 2022, 13, 797. [Google Scholar] [CrossRef]
  15. Liou, Y.-C.; Chang, Y.-J. A Variational Multiple-Doppler Radar Three-Dimensional Wind Synthesis Method and its Impacts on Thermodynamic Retrieval. Mon. Weather Rev. 2009, 137, 3992–4010. [Google Scholar] [CrossRef]
  16. Chang, W.Y.; Lee, W.C.; Liou, Y.C. The Kinematic and Microphysical Characteristics and Associated Precipitation Efficiency of Subtropical Convection During Sowmex/Timrex. Mon. Weather Rev. 2015, 143, 317–340. [Google Scholar] [CrossRef]
  17. Bousquet, O.; Tabary, P.; Parent du Châtelet, J. Operational multiple-Doppler wind retrieval inferred from long-range radial velocity measurements. J. Appl. Meteorol. Climatol. 2008, 47, 2929–2945. [Google Scholar] [CrossRef]
  18. Murphy, T.A.; Knupp, K. An Analysis of Cold Season Supercell Storms Using the Synthetic Dual-Doppler Technique. Mon. Weather Rev. 2013, 141, 602–624. [Google Scholar] [CrossRef]
  19. Zhang, G.F. Weather Radar Polarimetry; CRC Press: Boca Raton, FL, USA, 2016; pp. 10–16. [Google Scholar]
  20. Ryzhkov, A.; Zhang, P.; Reeves, H.; Kumjian, M.; Tschallener, T.; Troemel, S.; Simmer, C. Quasi-vertical profiles—A new way to look at polarimetric radar data. J. Atmos. Ocean. Technol. 2016, 33, 551–562. [Google Scholar] [CrossRef]
  21. Kumjian, M.R.; Khain, A.P.; Benmoshe, N.; Ilotoviz, E.; Ryzhkov, A.V.; Phillips, V.T. The Anatomy and Physics of Zdr Columns: Investigating a Polarimetric Radar Signature with a Spectral Bin Microphysical Model. J. Appl. Meteorol. Climatol. 2014, 53, 1820–1843. [Google Scholar] [CrossRef]
  22. Chen, B.J.; Wang, J.; Gong, D.L. Raindrop Size Distribution in a Midlatitude Continental Squall Line Measured by Thies Optical Disdrometers over East China. J. Appl. Meteorol. Climatol. 2016, 55, 621–634. [Google Scholar] [CrossRef]
  23. Janapati, J.; Seela, B.K.; Lin, P.L.; Lee, M.T.; Joseph, E. Microphysical Features of Typhoon and Non-Typhoon Rainfall Observed in Taiwan, an Island in the Northwestern Pacific. Hydrol. Earth Syst. Sci. 2021, 25, 4025–4040. [Google Scholar] [CrossRef]
  24. Wu, B.; Wang, D.D.; Li, Y.F.; Yin, H.; Du, S.; Li, P.H. A Comprehensive Observational Analysis for the Effects of Gas Cannons on Clouds and Precipitation. J. Trop. Meteorol. 2022, 28, 237–251. [Google Scholar] [CrossRef]
  25. Bringi, V.N.; Chandrasekar, V.; Hubbert, J.; Gorgucci, E.; Randeu, W.L.; Schoenhuber, M. Raindrop Size Distribution in Different Climatic Regimes from Disdrometer and Dual-Polarized Radar Analysis. J. Atmos. Sci. 2003, 60, 354–365. [Google Scholar] [CrossRef]
  26. Tang, Q.; Xiao, H.; Guo, C.W.; Feng, L. Characteristics of the Raindrop Size Distributions and Their Retrieved Polarimetric Radar Parameters in Northern and Southern China. Atmos. Res. 2014, 135–136, 59–75. [Google Scholar] [CrossRef]
  27. Ma, Y.; Ni, G.; Chandra, C.V.; Tian, F.; Chen, H. Statistical Characteristics of Raindrop Size Distribution During Rainy Seasons in the Beijing Urban Area and Implications for Radar Rainfall Estimation. Hydrol. Earth Syst. Sci. 2019, 23, 4153–4170. [Google Scholar] [CrossRef]
  28. Wen, L.; Zhao, K.; Zhang, G.F.; Xue, M.; Zhou, B.; Liu, S.; Chen, X.C. Statistical Characteristics of Raindrop Size Distributions Observed in East China During the Asian Summer Monsoon Season Using 2-D Video Disdrometer and Micro Rain Radar Data. J. Geophys. Res. Atmos. 2016, 121, 2265–2282. [Google Scholar] [CrossRef]
  29. DeHart, J.C.; Michael, M.B. A Comparison of the Polarimetric Radar Characteristics of Heavy Rainfall from Hurricanes Harvey (2017) and Florence (2018). J. Geophys. Res. Atmos. 2020, 125, e2019JD032212. [Google Scholar] [CrossRef]
  30. Han, B.; Du, Y.; Wu, C.; Liu, X. Microphysical Characteristics of the Coexisting Frontal and Warm-Sector Heavy Rainfall in South China. J. Geophys. Res. Atmos. 2021, 126, e2021JD035446. [Google Scholar] [CrossRef]
  31. Wu, B.; Wei, M.; Li, Y.; Wang, Z.; Du, S.; Zhao, C. Analysis of the Characteristics and Evolution Mechanisms of a Bow-Shaped Squall Line in East China Observed with Dual-Polarization Doppler Radars. Remote Sens. 2022, 14, 3531. [Google Scholar] [CrossRef]
  32. Maki, M.; Keenan, T.D.; Sasaki, Y.; Nakamura, K. Characteristics of the Raindrop Size Distribution in Tropical Continental Squall Lines Observed in Darwin, Australia. J. Appl. Meteorol. 2001, 40, 1393–1412. [Google Scholar] [CrossRef]
  33. Li, H.; Moisseev, D.; Luo, Y.; Liu, L.; Ruan, Z.; Cui, L.; Bao, X. Assessing Specific Differential Phase KDP -Based Quantitative Precipitation Estimation for the Record-Breaking Rainfall over Zhengzhou City on 20 July 2021. Hydrol. Earth Syst. Sci. 2023, 27, 1033–1046. [Google Scholar] [CrossRef]
  34. Zhang, J.; Tang, L.; Cocks, S.; Zhang, P.F.; Ryzhkov, A.; Howard, K.; Langston, C.; Kaney, B. A Dual-Polarization Radar Synthetic QPE for Operations. J. Hydrometeorol. 2020, 21, 2507–2521. [Google Scholar] [CrossRef]
  35. Zhang, Z.; Qi, Y.C.; Li, D.H.; Zhao, Z.F.; Cui, L.M.; Su, A.F.; Wang, X.M. Raindrop Size Distribution Characteristics of the Extreme Rainstorm Event in Zhengzhou 20 July, 2021 and Its Impacts on Radar Quantitative Precipitation Estimation. Chin. J. Atmos. Sci. 2022, 46, 1002–1016. (in Chinese). [Google Scholar] [CrossRef]
  36. Brown, B.R.; Bell, M.M.; Frambach, A.J. Validation of Simulated Hurricane Drop Size Distributions Using Polarimetric Radar. Geophys. Res. Lett. 2016, 43, 910–917. [Google Scholar] [CrossRef]
  37. Zhang, D.L.; Lin, Y.H.; Zhao, P.; Yu, X.D.; Wang, S.Q.; Hongwen Kang, H.W.; Ding, Y.H. The Beijing Extreme Rainfall of 21 July 2012: “Right Results” but for Wrong Reasons. Geophys. Res. Lett. 2013, 40, 1426–1431. [Google Scholar] [CrossRef]
  38. Houze, R.A. Orographic Effects on Precipitating Clouds. Rev. Geophys. 2012, 50, RG1001. [Google Scholar] [CrossRef]
  39. Bringi, V.; Chandrasekar, V. Polarimetric Doppler Weather Radar. Principles and Applications; Cambridge University Press: Cambridge, UK, 2001; pp. 378–531. [Google Scholar]
  40. Wen, J.; Zhao, K.; Huang, H.; Zhou, B.W.; Yang, Z.L.; Chen, G.; Wang, M.J.; Wen, L.; Dai, H.N.; Xu, L.L.; et al. Evolution of Microphysical Structure of a Subtropical Squall Line Observed by a Polarimetric Radar and a Disdrometer During Opacc in Eastern China. J. Geophys. Res. Atmos. 2017, 122, 8033–8050. [Google Scholar] [CrossRef]
  41. Zhang, J.; Wang, S.X. An Automated 2D Multipass Doppler Radar Velocity Dealiasing Scheme. J. Atmos. Ocean. Technol. 2006, 23, 1239–1248. [Google Scholar] [CrossRef]
  42. Shapiro, A.; Potvin, C.K.; Gao, J.D. Use of a Vertical Vorticity Equation in Variational Dual-Doppler Wind Analysis. J. Atmos. Ocean. Technol. 2009, 26, 2089–2106. [Google Scholar] [CrossRef]
  43. Potvin, C.K.; Shapiro, A.; Xue, M. Impact of a Vertical Vorticity Constraint in Variational Dual-Doppler Wind Analysis: Tests with Real and Simulated Supercell Data. J. Atmos. Ocean. Technol. 2012, 29, 32–49. [Google Scholar] [CrossRef]
  44. Löffler-Mang, M.; Joss, J. An Optical Disdrometer for Measuring Size and Velocity of Hydrometeors. J. Atmos. Ocean. Technol. 2000, 17, 130–139. [Google Scholar] [CrossRef]
  45. Friedrich, K.; Higgins, S.; Masters, F.J.; Lopez, C.R. Articulating and Stationary Parsivel Disdrometer Measurements in Conditions with Strong Winds and Heavy Rainfall. J. Atmos. Ocean. Technol. 2013, 30, 2063–2080. [Google Scholar] [CrossRef]
  46. Tokay, A.; Bashor, P.G. An Experimental Study of Small-Scale Variability of Raindrop Size Distribution. J. Appl. Meteorol. Climatol. 2010, 49, 2348–2365. [Google Scholar] [CrossRef]
  47. Guyot, A.; Pudashine, J.; Protat, A.; Uijlenhoet, R.; Pauwels, V.; Seed, A.; Walker, J. Effect of Disdrometer Type on Rain Drop Size Distribution Characterisation: A New Dataset for South-Eastern Australia. Hydrol. Earth Syst. Sci. 2019, 23, 4737–4761. [Google Scholar] [CrossRef]
  48. Brandes, E.A.; Zhang, G.F.; Vivekanandan, J. Drop Size Distribution Retrieval with Polarimetric Radar: Model and Application. J. Appl. Meteorol. 2004, 43, 461–475. [Google Scholar] [CrossRef]
  49. Gorgucci, E.; Chandrasekar, V.; Bringi, V.N.; Scarchilli, G. Estimation of Raindrop Size Distribution Parameters from Polarimetric Radar Measurements. J. Atmos. Sci. 2002, 59, 2373–2384. [Google Scholar] [CrossRef]
  50. Ulbrich, C.W. Natural Variations in the Analytical Form of the Raindrop Size Distribution. J. Appl. Meteorol. Climatol. 1983, 22, 1764–1775. [Google Scholar] [CrossRef]
  51. Zhang, G.F.; Vivekanandan, J.; Brandes, E. A method for estimating rain rate and drop size distribution from polarimetric radar measurements. IEEE Trans. Geosci. Remote Sens. 2001, 39, 830–841. [Google Scholar] [CrossRef]
  52. Brandes, E.A.; Zhang, G.; Vivekanandan, J. Experiments in rainfall estimation with a polarimetric radar in a subtropical environment. J. Appl. Meteorol. 2002, 41, 674–685. [Google Scholar] [CrossRef]
  53. Luo, Y.H.; Du, Y. The Roles of Low-Level Jets in “21·7” Henan Extremely Persistent Heavy Rainfall Event. Adv. Atmos. Sci. 2023, 40, 350–373. [Google Scholar] [CrossRef]
  54. Kumjian, M.R.; Mishra, S.; Giangrande, S.E.; Toto, T.; Ryzhkov, A.V.; Bansemer, A. Polarimetric Radar and Aircraft Observations of Saggy Bright Bands During MC3E. J. Geophys. Res. Atmos. 2016, 121, 3584–3607. [Google Scholar] [CrossRef]
  55. Zawadzki, I.; Szyrmer, W.; Bell, C.; Fabry, F. Modeling of the Melting Layer. Part III: The Density Effect. J. Atmos. Sci. 2005, 62, 3705–3723. [Google Scholar] [CrossRef]
  56. Griffin, E.M.; Schuur, T.J.; Ryzhkov, A.V. A Polarimetric Radar Analysis of Ice Microphysical Processes in Melting Layers of Winter Storms Using S-Band Quasi-Vertical Profiles. J. Appl. Meteorol. Climatol. 2020, 59, 751–767. [Google Scholar] [CrossRef]
  57. Carlin, J.T.; Ryzhkov, A.V. Estimation of Melting-Layer Cooling Rate from Dual-Polarization Radar: Spectral Bin Model Simulations. J. Appl. Meteorol. Climatol. 2019, 58, 1485–1508. [Google Scholar] [CrossRef]
  58. Li, H.; Tiira, J.; Lerber, A.V.; Moisseev, D. Towards the Connection between Snow Microphysics and Melting Layer: Insights from Multifrequency and Dual-Polarization Radar Observations During BAECC. Atmos. Chem. Phys. 2020, 20, 9547–9562. [Google Scholar] [CrossRef]
  59. Carr, N.; Kirstetter, P.E.; Gourley, J.J.; Hong, Y. Polarimetric Signatures of Midlatitude Warm-Rain Precipitation Events. J. Appl. Meteorol. Climatol. 2017, 56, 697–711. [Google Scholar] [CrossRef]
  60. Homeyer, C.R.; Fierro, A.O.; Schenkel, B.A.; Didlake, A.C.; McFarquhar, G.M.; Hu, J.X.; Ryzhkov, A.V.; Basara, J.B.; Murphy, A.M.; Zawislak, J. Polarimetric Signatures in Landfalling Tropical Cyclones. Mon. Weather Rev. 2021, 149, 131–154. [Google Scholar] [CrossRef]
  61. Von Terzi, L.; Neto, J.D.; Ori, D.; Myagkov, A.; Kneifel, S. Ice Microphysical Processes in the Dendritic Growth Layer: A Statistical Analysis Combining Multi-Frequency and Polarimetric Doppler Cloud Radar Observations. Atmos. Chem. Phys. 2022, 22, 11795–11821. [Google Scholar] [CrossRef]
  62. Chandrasekar, V.; Beauchamp, R.M.; Bechini, R. Introduction to Dual Polarization Weather Radar; Cambridge University Press: New York, NY, USA, 2023; pp. 445–451. [Google Scholar] [CrossRef]
  63. Cressman, G.P. An operational objective analysis system. Mon. Weather Rev. 1959, 87, 367–374. [Google Scholar] [CrossRef]
  64. Barnes, S.L. A technique for maximizing details in numerical weather map analysis. J. Appl. Meteorol. 1964, 3, 396–409. [Google Scholar] [CrossRef]
  65. Askelson, M.A.; Aubagnac, J.-P.; Straka, J.M. An adaptation of the Barnes filter applied to the objective analysis of radar data. Mon. Weather Rev. 2000, 128, 3050–3082. [Google Scholar] [CrossRef]
  66. Shapiro, A.; Ellis, S.; Shaw, J. Single-Doppler Velocity Retrievals with Phoenix II Data: Clear Air and Microburst Wind Re-trievals in the Planetary Boundary Layer. J. Atmos. Sci. 1995, 52, 1265–1287. [Google Scholar] [CrossRef]
  67. Potvin, C.; Betten, D.; Wicker, L.; Elmore, K.; Biggerstaff, M. 3DVAR versus Traditional Dual-Doppler Wind Retrievals of a Simulated Supercell Thunderstorm. Mon. Weather Rev. 2012, 140, 3487–3494. [Google Scholar] [CrossRef]
  68. Peskin, C. Flow Patterns around Heart Valves: A Numerical Method. J. Comput. Phys. 1972, 10, 252–271. [Google Scholar] [CrossRef]
  69. Liou, Y.C.; Chang, S.F.; Sun, J. An Application of the Immersed Boundary Method for Recovering the Three-Dimensional Wind Fields over Complex Terrain Using Multiple-Doppler Radar Data. Mon. Weather Rev. 2012, 140, 1603–1619. [Google Scholar] [CrossRef]
  70. Bell, M.; Montgomery, M.; Emanuel, K. Air–Sea Enthalpy and Momentum Exchange at Major Hurricane Wind Speeds Observed During Cblast. J. Atmos. Sci. 2012, 69, 3197–3222. [Google Scholar] [CrossRef]
Figure 1. (a) Map of China highlighting the focus area in this study. The blue box indicates the boundaries of the study area. (b) Positions of the observational instruments and stations. The blue, magenta, and green five-pointed stars indicate the locations of ZZ-SPOL, LY-SPOL, and PDS-RD, respectively. LY-SPOL is located 107 km from PDS-RD and 115 km from ZZ-SPOL. The areas within the two gray circles (excluding the overlap) indicate the 30° dual-Doppler lobes for two radars (LY-SPOL and PDS-RD). The red and magenta circles mark the disdrometer locations at the XM and ZM stations, respectively. The black triangle denotes the position of the AWS and disdrometer at the ZZ Station. The black dotted boxes indicate the boundaries of the retrieved 3D wind fields of ZZ-SPOL, LY-SPOL, and PDS-RD. The map is colored based on the constant-altitude plan position indicator (CAPPI) scan of ZH at an altitude of 2 km of the LY-SPOL instrument at 16:30 BT on 20 July 2021.
Remotesensing 15 05688 g001
Figure 2. (a) Map of the 24 h accumulated rainfall distribution in Henan Province from 20:00 BT on 19 July 2021 to 20:00 BT on 20 July 2021 and (b) hourly rainfall sequence chart for the ZZ Station from 02:00 BT on 20 July 2021 to 08:00 BT on 21 July 2021.
Remotesensing 15 05688 g002
Figure 3. Geopotential height fields (contour lines) and wind fields (wind barbs and color fill) at 08:00 BT on 20 July 2021 at (a) 500 hPa, (b) 700 hPa, (c) 850 hPa, and (d) 925 hPa.
Remotesensing 15 05688 g003
Figure 4. From 08:00 BT on 20 July 2021 to 05:00 BT on 21 July 2021, FY-2G meteorological satellite TBB images (a1h1) and ZZ-SPOL 1.5° elevation angle PPI ZH (a2h2). “*” denotes 21 July 2021, the dashed black circle indicates the 230 km effective radar detection range, and the triangle indicates the ZZ station.
Remotesensing 15 05688 g004
Figure 5. CAPPI of the polarimetric variables ZH, ZDR, and KDP overlaid with the horizontal wind fields (black arrows) at a height of 1.5 km, as retrieved from the combination of data collected by the three radars (i.e., LY-SPOL, ZZ-SPOL, and PDS-RD) at (a1a3) 15:42 BT, (b1b3) 16:30 BT, and (c1c3) 17:18 BT on 20 July 2021. The white lines indicate vertical vorticity contour lines (unit: 10−3 s−1), and the black triangle indicates the ZZ station. The black line represents the boundary of Zhengzhou city. The dashed red line (A–B) in (a1) indicates the position of the vertical section in Figure 6, and the blue rotating arrow in (b1) denotes the location of the mesoscale vortex.
Remotesensing 15 05688 g005
Figure 6. Vertical wind fields along the direction of the red dashed line (A–B) in Figure 5(a1) on 20 July 2021 at (a1a3) 15:42 BT, (b1b3) 16:30 BT, and (c1c3) 17:18 BT. The colored shading indicates the overlaid ZH, ZDR, and KDP. The black triangle denotes the ZZ Station, the white solid lines denote the ZDR contour lines (unit: dB), and the dark gray shading indicates the underlying terrain. The blue arrows in (a1,b1) indicate the general direction of the wind field.
Remotesensing 15 05688 g006
Figure 7. Three-dimensional wind fields and superimposed three-dimensional radar echoes at the height levels of (a) 1 km, (b) 3 km, (c) 5 km, and (d) 8 km at 16:30 BT on 20 July 2021. The black star indicates the ZZ station and the red arrows indicate the general direction of the wind field.
Remotesensing 15 05688 g007
Figure 8. Height-time representation of the QVPs of (a) ZH, (b) ZDR, (c) ρhv, and (d) KDP retrieved from ZZ-SPOL data collected at an elevation angle of 19.5° between 00:00 on 20 July and 08:00 BT on 21 July 2021. The thick blue arrow indicates the RBEHR period. The solid black lines indicate the isopleths of ZH at 20, 35, and 40 dBZ.
Remotesensing 15 05688 g008
Figure 9. Time series of the precipitation DSD collected by the disdrometer at the ZZ Station between 08:00 BT on 20 July 2021 and 02:00 BT on 21 July 2021. The gray and magenta dashed lines indicate the start and end times, respectively, of the RBEHR, which are 16:00 and 17:00 BT, respectively. (a) Log10 N(D) (the color denotes the number concentration; the solid black line indicates Dm). (b) log10 m(D) (the color denotes the total mass of all raindrops per unit diameter range and unit volume). (c) R. (d) Log10 Nw. (e) LWC.
Remotesensing 15 05688 g009
Figure 10. Comparison between the microphysical parameters of precipitation at the 1.5 km altitude inverted from LY-SPOL and the observations of the disdrometer at the ZZ Station from 15:00 to 18:00 BT on 20 July 2021, including (a) ZH, (b) ZDR, (c) log10 Nw, and (d) Dm. The green dashed box represents the collision–coalescence process.
Remotesensing 15 05688 g010
Figure 11. DSD parameters retrieved from LY-SPOL at the 1.5 km elevation for Dm, log10 Nw, LWC, and R at 15:42 BT (a1a4), 16:18 BT (b1b4), 16:30 BT (c1c4), and 17:18 BT (d1d4) on 20 July 2021. The black circle indicates the location of the ZZ station. The red line represents the boundary of Zhengzhou City, while the black line represents the boundaries of Xinxiang City and Jiaozuo City.
Remotesensing 15 05688 g011
Figure 12. (a) Schematic representation of the kinematic and microphysical characteristics inside the storm, depicted using a vertical cross-section approximately along the dashed line shown in (b). The yellow, pink, and red columns represent the ZH > 45 dBZ, ZDR column, and KDP column, respectively. Blue curled arrows indicate the center of the vortex. (b) Horizontal cross-section showcasing the updraft, low-level radar structures, and cloud features. The dashed line indicates the direction of the vertical cross-section presented in (a).
Remotesensing 15 05688 g012
Table 1. Radar characteristics (PRF is the pulse repetition frequency).
PDS-RDZZ-SPOL +LY-SPOL +
Wavelength (cm)101010
Peak power (kW)700700700
PRF (Hz) *322~1304322~1304322~1304
Pulse width (μs)1.57, 4.71.57, 4.71.57, 4.7
Antenna gain (dB)45.544.8244.82
Data range resolution (m)ZH: 1000; V, W: 250ZH, Vr: 250ZH, Vr: 250
Azimuthal resolution (°)1.01.01.0
Horizontal beamwidth (°)0.930.990.99
Vertical beamwidth (°)0.930.93
Scan properties9 elevation angles
(0.5°–19.5°) in 6 min
9 elevation angles
(0.5°–19.5°) in 6 min
9 elevation angles (0.5°–19.5°) in 6 min
* According to the observation range and Doppler speed requirements, the PRFs in the surveillance mode are 322, 446, and 644 Hz, and the PRFs in the Doppler mode are 1014 and 1181 Hz. The symbol “+” indicates a dual-polarization Doppler radar.
Disclaimer/Publisher’s Note: The statements, opinions and data contained in all publications are solely those of the individual author(s) and contributor(s) and not of MDPI and/or the editor(s). MDPI and/or the editor(s) disclaim responsibility for any injury to people or property resulting from any ideas, methods, instructions or products referred to in the content.

