Abstract
Forest canopy height data are essential to assessing forest biomass and carbon storage, and they can be efficiently retrieved using the Advanced Terrain Laser Altimetry System (ATLAS) onboard ICESat-2. However, due to the sparse and discrete distribution of ATLAS footprints, the wall-to-wall mapping of forest canopy heights requires a combination of other ancillary data. In order to match the ATLAS data with ancillary data, or estimate higher-resolution canopy heights, the standard ATLAS canopy height products (ATL08), reported at a fixed step size of 100 m (12 m × 100 m), are typically divided into 30 m step sizes. There is little concern about the accuracy of the generated 30 m segment (12 m × 30 m) dataset. Furthermore, previous studies have primarily evaluated the along-track performance of the canopy height product, rather than the ability of ATLAS to provide an accurate representation of canopy heights at the pixel-wise level. In this study, we use airborne LiDAR data as references with which to evaluate the along-track accuracy of 30 m segment canopy height products and their accuracy in representing canopy height at the pixel-wise level. A framework method for spatially matching ATLAS canopy height estimate data with ancillary data accurately is also established in this study. This enables the use of ATLAS data to characterize pixel-wise canopy heights more precisely. The results show that the accuracy of the 30 m segment version dataset in representing the pixel-wise canopy heights (R2 = 0.38, RMSE = 8.37 m) is lower than its along-track accuracy (R2 = 0.44, RMSE = 7.63 m). Using only the nighttime data for the Taranaki region, the proposed method improves the estimation of pixel-wise forest canopy heights, with the R2 increasing from 0.49 to 0.59, the RMSE decreasing from 7.48 m to 5.51 m, and the %RMSE decreasing from 36.7% to 27.6%. This study contributes to understanding the accuracy of the ATLAS in reflecting pixel-wise canopy height and provides a new way of spatially matching ATLAS canopy height data with other remote sensing data.
1. Introduction
Forests are the largest carbon pool in terrestrial ecosystems, exhibiting carbon sink and source characteristics [1,2]. The continuous monitoring of forests is crucial to enhancing our understanding of global carbon cycle mechanisms and developing more scientifically informed forest resource management policies [3]. Forest canopy height (FCH) is a crucial factor for estimating and modeling forest biomass and carbon sinks [4,5,6] as well as a significant component of forest resource assessments. With its inherent penetrative capabilities, Light Detection and Ranging (LiDAR) offers a natural advantage for assessing vertical forest structures [7,8,9,10]. Emerging spaceborne LiDAR for FCH measurement has shown great potential in efficiently retrieving canopy height on a global or regional scale [11,12,13,14,15].
In 2018, NASA launched the Ice, Cloud, and Land Elevation Satellite-2 (ICESat-2). Unlike other full-waveform laser ranging systems, such as GEDI, GF-7, and GLAS, ICESat-2 carries the Advanced Topographic Laser Altimeter System (ATLAS), which utilizes multi-beam, photon-counting, laser ranging technology [16]. The laser pulses emitted from the ATLAS are separated into three pairs of 532 nm wavelength laser beams through diffraction via optical elements. Each pair consists of a weak beam and a strong beam, with a transmission energy ratio of 1:4. The members within each pair of beams have a separation of 90 m, and each pair has a separation of 3.3 km [17]. The ATLAS samples every 0.7 m along the track, recording 0 to 3 reflected photon events for each laser pulse (area covered by vegetation) [18]. This process generates overlapping footprints on the ground, each with a diameter of approximately 10 m [19]. The National Snow and Ice Data Centre (NSIDC) uses the ICESat-2/ATLAS raw data (ATL00) to generate 20 standard data products, ranging from the ATL01 to the ATL21 (excluding ATL05). Among these, the ATL03 (Global Geolocated Photon Cloud) data record the geolocation, ellipsoidal height, and signal-to-noise attributes of each photon, which then serve as a basis for generating higher-level data products [20]. The ATL08 (Land and Vegetation Height) product is a repository for recording along-track information, including terrain, canopy height, vegetation coverage, and other related data. These parameters are estimated values, obtained through analysis and statistics by combining the ATL03 photon information within 100 m along-track segments with the land cover data [21].
With open access to the ICESat-2 data, researchers have evaluated the accuracy of the ATL08 data (100 m segment lengths) at multiple sites globally, based on field measurements and airborne LiDAR data, and analyzed various factors affecting its accuracy [22,23,24,25,26]. Neuenschwander and Magruder (2019) published the first accuracy assessment of the ATL08, using specific track data in Finland, and reported an RMSE value of 3.69 m for the canopy height estimates [27]. The narrow bandpass filtering applied in the ATLAS photon receivers cannot fully eliminate the background noise induced via sunlight [28]. This results in substantial discrepancies in data quality between nighttime and daytime acquisitions. In comparison to the daytime acquisition of canopy height (RMSE ranging from 7.09 m to 10.98 m), nighttime measurements showed significantly reduced RMSE values (RMSE ranging from 3.93 m to 5.07 m), according to an accuracy assessment of the ATL08 conducted by Liu et al., who utilized data from multiple regions in the United States [17]. Neuenschwander and Guenther evaluated ATL08 products based on airborne LiDAR data covering southern Finland and discovered that beam selection (strong beam vs. weak beam) affects the accuracy of the canopy height estimate data acquired from ICESat-2. According to their research, the accuracy is highest at night/strong beam/summer, with a %RMSE value of 13.75%, while the use of weak beams increases the underestimation of canopy height by 1.06 m and increases the %RMSE by 8.08% [22]. As the error factor with the greatest influence on terrain estimate accuracy, the slope has a significant impact on the estimation of forest canopy height [29]. Dong et al. demonstrated that dense forest cover leads to increased errors in canopy height estimates from ATL08 data [30]. Moreover, the accuracy of the forest canopy height obtained from ICESat-2 can also be impacted by a variety of other factors, including snow cover, signal-to-noise ratio, vegetation type, etc. [29,31]. However, due to the discrete distribution of ATLAS laser points and the lack of data across tracks, ATLAS data usually need to be combined with other ancillary data to generate spatially continuous products [32]. In such cases, spatial matching is required to assign the ATLAS canopy height estimates to the pixels of ancillary data or target maps [33,34]. Essentially, this is a gridding process that provides pixel-wise estimates of ATLAS canopy heights. Previous studies have focused more on reflecting the performance of ATLAS canopy height products in the along-track direction (the corresponding area), but have ignored accuracy when representing pixel-wise canopy heights after matching the ATLAS data with ancillary data.
ATLAS photons are remapped to shorter segments, despite the fact that the standard ATL08 data product reports at a fixed along-track step of 100 m, to meet the requirements of matching with multi-sensor data and estimating higher-resolution canopy height [35]. Zhu generated a canopy height dataset with 25 m segments using ATLAS data fused with GEDI data, intending to densify forest canopy height sample points [32]. Chen et al. found that 50 m segment data can characterize the canopy height of hilly areas more accurately (RMSE = 2.2 m) [36]. Various research has generated 30 m segment ATLAS canopy height data combined with Landsat or Sentinel-2 data for the wall-to-wall mapping of canopy height [37,38]. The 30 m segment ATLAS data were also used to train aboveground biomass density (AGBD) models in a boreal biomass mapping project [39]. In response, Feng et al. validated a 30 m segment ATLAS canopy height dataset for accuracy in mapping North American forests (RMSE = 4.75 m) [35]. Nevertheless, we should still be concerned about the performance of 30 m segment data across additional sites and ecosystems.
Due to the different densities of ATLAS footprints in the along-track and across-track directions, each ATL08 segment is considered a 12 m × 100 m rectangular box along the orbit [17]. A reliable spatial matching method needs to be developed to associate ATLAS data with ancillary data for acquiring pixel-wise canopy height estimations [40,41]. This will facilitate establishing more accurate canopy height inversion models to map wall-to-wall (spatially continuous) forest canopy heights [34,42,43]. Various studies have chosen to match directly based on the centroid of the ATL08 segments. For example, Wu et al. filtered the ATL08 segments to remove those with geolocation errors and then matched the centroids of the retained segments to 30 m resolution Landsat pixels [44]. Sun et al. selected the sample point with the maximum canopy height from all ATL08 centroids overlapping a 1 km × 1 km image pixel to represent the canopy height for the corresponding pixel [45]. In order to approximate the segment range to the pixel extent, researchers obtained the along-track data of the corresponding step size based on the pixel size of the matching data. For example, Sothe et al. sampled the data into 250 m along-track segments and matched them with image pixels based on the segment centroid when mapping the forest canopy height in Canada at a 250 m × 250 m resolution [46]. Li et al. and Malambo et al. remapped the ATLAS photons in a 30 m along-track segment, using the segment centroids to match with the Landsat-8 data [37,38]. These studies typically represent each segment using its centroid point and match ancillary data based on the centroid’s geographical location. Although this method enables rapid matching, the non-overlapping of the data pane results in reduced precision. Currently, there is no consistent standard for spatially matching satellite data with traditional sensor data. Landsat data are a major source of ancillary data that can be used to extract variables related to forest canopies, including spectral information, vegetation index, and spatial texture [47]. It is an important task to study spatial matching between Landsat and ATLAS data.
In summary, in this study, we aim to validate the accuracy of 30 m segment ATLAS canopy height estimates in characterizing pixel-wise canopy height and explore spatial matching methods that can more accurately represent corresponding pixel-wise canopy heights. To achieve this, we follow three research steps: (1) Evaluating the accuracy of 30 m segment (12 m × 30 m) versions of canopy estimates based on airborne LiDAR data in the Taranaki region. This assessment is conducted following two scenarios: along-track direction and pixel-wise canopy height representation. (2) Proposing a framework method for spatially matching ATLAS canopy height estimate data with ancillary data, through which a 30 m × 30 m resolution gridded dataset of ATLAS canopy height estimations is derived. (3) Evaluating the accuracy of 30 m × 30 m spatial resolution data and the impacts of sensor specifications (such as beam intensity and acquisition timing), slope, and canopy cover on precision.
2. Materials and Methods
2.1. Study Area
The Taranaki region (38°41′11″S to 38°52′30″S, 173°04′53″E to 173°43′30″E) on the west coast of New Zealand’s North Island has a temperate maritime climate (Figure 1). The region has an average elevation of around 224 m and an average slope of around 15.7°. In the western part is the towering Mount Taranaki, which reaches a height of 2518 m. In the eastern part are lower mountainous areas. The total land area is 7236.1 km2, and 38% is covered by broad-leaved virgin forests, with beech and podocarp as the dominant tree species [48].
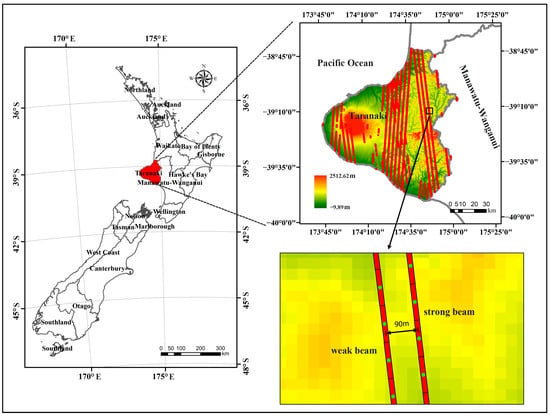
Figure 1.
Taranaki region and ICESat-2 footprints.
2.2. Airborne LiDAR Data
The airborne LiDAR data were collected by the Taranaki Base Committee from 3 April to 16 October 2021, covering the entire Taranaki region and parts of the Ruapehu region, with a total area of 8169.48 km2. The dataset comprises approximately 74.1 billion laser footprints, with an average point density of 9.08 points/m2. The vertical accuracy is ±0.2 m (95%), and the horizontal accuracy specification is ±1.0 m (95%). The derived product datasets, such as the Digital Terrain Model (DTM) and Digital Surface Model (DSM), are generated by the AAM company with its subcontractors. The management and publication of these datasets are handled by Toitū Te Whenua Land Information New Zealand (https://data.linz.govt.nz/, accessed on 8 March 2023). The DTM and DSM datasets are utilized, with a spatial resolution of 1 m. The vertical datum is NZVD2016, while the horizontal datum is WGS84. These datasets are projected using the UTM_Zone_60S coordinate reference system.
2.3. ICESat-2 Data
All ATL03 and ATL08 data collected in the same period as the airborne LiDAR data (April to November) were downloaded from the Earthdata website (https://www.earthdata.nasa.gov/, accessed on 4 March 2023). These products are stored in Hierarchical Data Format (HDF), and the parameters and paths are listed in Table 1.

Table 1.
ATL03 and ATL08 data extraction parameters.
In the ATL03 files, the photon parameters are stored in the order of photon return time and indexed based on segment numbers (where photons within a range of approximately 20 m are grouped into one segment) and the number of photons within each segment [20]. The ATL08 product contains classification information for each photon, including noise (0), ground (1), canopy (2), and top of canopy (3). To obtain these classifications, NSIDC first applies the Differential, Regression, and Gaussian Adaptive Nearest Neighbor (DRAGAAN) algorithm to denoise the along-track cross-sections of ATLAS photon signals. Then, both iterative median and smoothing filtering are employed to estimate the ground and canopy surfaces. The classification of photons is determined based on their positions relative to the fitted ground and canopy surfaces. Based on the classification results, various terrain and canopy height parameters are calculated using 100 m segments, and the coordinates of the centroid of each segment are yielded [21].
2.4. Ancillary Data
Several ancillary datasets were utilized in this study, including the Earth Gravitational Model XGM2019e_2159, Landsat-8 OLI data, and land cover data. (1) To ensure a consistent vertical reference, the Earth Gravitational Model XGM2019e_2159 was downloaded from the International Centre for Global Earth Models (ICGEMs) website (http://icgem.gfz-potsdam.de/, accessed on 15 April 2023) for elevation correction purposes. (2) Landsat-8 OLI level 2 products with minimal cloud cover from April to November 2021 were obtained to acquire pixel boundaries (https://earthexplorer.usgs.gov/, accessed on 2 May 2023). (3) The 10 m resolution land cover data provided by ESRI were collected to obtain forest extent. This dataset was generated by Impact Observatory, which applied a deep-learning artificial intelligence land classification model to the Sentinel-2 scene collection on Microsoft Planetary Computer. The model utilized a large-scale training dataset with billions of manually labeled image pixels developed by the American Geographic Society. The data can be accessed through the ESRI website (https://www.arcgis.com/home/index.html, accessed on 20 April 2023).
2.5. Data Processing
2.5.1. Generation of 30 m Segment Canopy Height Estimates
Considering that the laser pulse footprint emitted from the ATLAS on the Earth’s surface has a diameter of approximately 10 m to 12 m, the along-track segment with a 30 m step size can be regarded as rectangles of 12 m × 30 m in the horizontal plane (Figure 2) [17,35]. To obtain the canopy height estimates of the 30 m segment, we conducted the following process: Firstly, based on the correlated parameters (segment_ph_cnt, segment_id, classed_pc_indx, and ph_segment_id), the photon point classification of ATL08 was matched with the photon geolocation information and the elevation of the ATL03 file. This matching process allows for the extraction of all photons classified as the canopy and the top of the canopy. Secondly, to unify the vertical datum to NZVD2016, the elevations of non-ground signal photons were adjusted using XGM2019e_2159. Then, the corresponding airborne LiDAR DTM was subtracted from the converted elevation to obtain the normalized height value of the canopy photons. Finally, the normalized height values of photons within each segment were arranged, and their 98th percentile was obtained as the estimated canopy height for the segment [22].
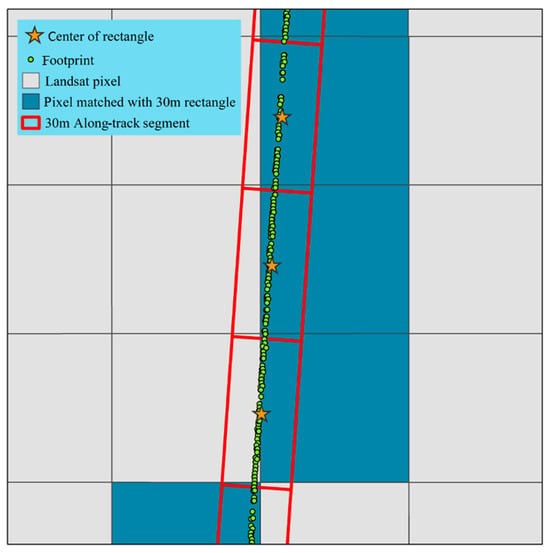
Figure 2.
Schematic diagram of 30 m segment and Landsat pixel.
2.5.2. Generation of Reference Canopy Height
Airborne LiDAR scanning data can accurately capture terrain and surface information [49]. The derived product, the Canopy Height Model (CHM), can provide references for canopy height in the area. In this study, a high-resolution CHM (with a resolution of 1 m × 1 m) was obtained by subtracting the DTM from matching DSM, both of which were produced using airborne LiDAR point clouds. To comprehensively evaluate the accuracy of the ATLAS in canopy estimation, two different reference values for canopy height were obtained. The first reference value, , was calculated as the 98th percentile of all CHM values within a 30 m along-track segment (a rectangular window of 12 m × 30 m). The second reference value, , was calculated as the 98th percentile of all CHM values within a Landsat pixel (30 m × 30 m) encompassing the centroid of a 30 m along-track segment.
2.6. Accuracy Assessment
Based on the obtained canopy height reference values, i.e., and , assessments were conducted at both segment (representing the canopy height of the along-track segment) and pixel-wise levels (representing the canopy height of the pixel encompassing the centroid of the segment). In this study, we employed the following five metrics for accuracy assessment: (1) the mean bias (Bias), (2) the mean absolute error (MAE), (3) the coefficient of determination (R2), and (4) the root-mean-square error (RMSE), and (5) the percentage root-mean-square error (%RMSE).
Here, represents the canopy height reference value (either or ) of the segment at index i; represents the canopy height estimates of the segment at index i; and represents the average value of all canopy height estimates.
2.7. Generation of Pixel-Wise Canopy Height Estimates Based on Spatial Matching
As shown in Figure 2, when spatially matching ATLAS data with gridded data, the sampling scope of the ATLAS segments is always inconsistent with the matching pixel extent. ATLAS photons from outside the pixel extent may distort this value when using the segment canopy height estimates to represent the canopy height of the matched pixels.
In order to more accurately characterize pixel-wise canopy heights using ATLAS data, we established a framework method for spatial matching between the ATLAS segments and gridded imagery, with the workflow shown in Figure 3. In this method, the geographic location of each ATLAS photon is directly matched with the Landsat image pixels, and canopy height estimates are extracted based on the pixel extent. Specifically, the photon-normalized height values within each Landsat-8 OLI pixel (30 m × 30 m) are sorted, and the percentile height values from 1 to 100 (RH1-100) are calculated. The value with the highest correlation to the reference FCH is selected as the canopy height estimate.
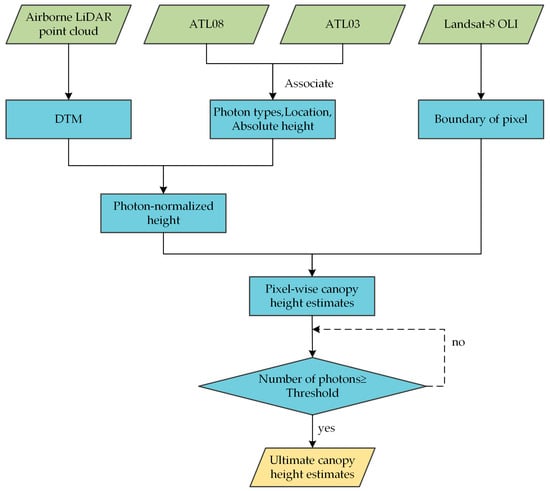
Figure 3.
Workflow of canopy height estimate generation.
The accuracy of the ATLAS canopy height estimates is significantly affected by the number of canopy photon signals within each statistical unit (segment or pixel) [40]. Data organization based on pixel segmentation can lead to unstable photon counts within statistical units. Insufficient photon counts can negatively impact the accuracy of the canopy height estimates. Therefore, it was necessary to exclude such data from the analysis. A filtering method was implemented for canopy height estimates, using photon counts as the threshold to enhance data quality. Pixels with a photon count above the threshold are retained, and the retained data are used to calculate the Pearson correlation coefficient (r) and RMSE between the estimated canopy height values at a 30 m × 30 m resolution and their corresponding reference values (the 98th percentile of all CHM values within the corresponding pixel). Generally, the accuracy of the canopy height estimates based on photon calculations increases with a higher number of photons within a statistical unit. However, as the photon count threshold increases, the volume of data retained for estimating canopy height decreases [50]. Therefore, selecting an optimal threshold for the photon count within a pixel that balances data accuracy and quantity is important. Additionally, daytime data are not recommended for canopy height retrieval, and we only implemented this process for nighttime data [22].
3. Results
3.1. Canopy Height Estimates for 30 m Segment
The evaluation result using all data, regardless of data acquisition time and beam intensity, shows that 30 m segment canopy height estimates exhibit better accuracy at the segment level than at the pixel-wise level, with R2 values of 0.44 and 0.38 and RMSE values of 7.63 and 8.37, respectively (Figure 4). The canopy height estimates exhibit minimum bias relative to (Bias = −0.09 m) but higher bias relative to the reference (Bias = 2.24 m). This indicates that using 30 m segment canopy height estimates to represent pixel-wise level canopy heights results in some overestimation. To verify the impact of sensor specifications on accuracy, the accuracy of the canopy height estimates was validated in the four scenarios, categorized based on the acquisition time (daytime/nighttime) and the beam strength (strong/weak). As shown in Table 2, using strong beams at nighttime leads to the highest accuracy (R2 = 0.61/0.20), while using weak beams during the daytime results in the lowest accuracy (R2 = 0.53/0.17). Due to this large discrepancy in accuracy, filtering according to acquisition time and beam intensity is necessary when retrieving canopy heights.
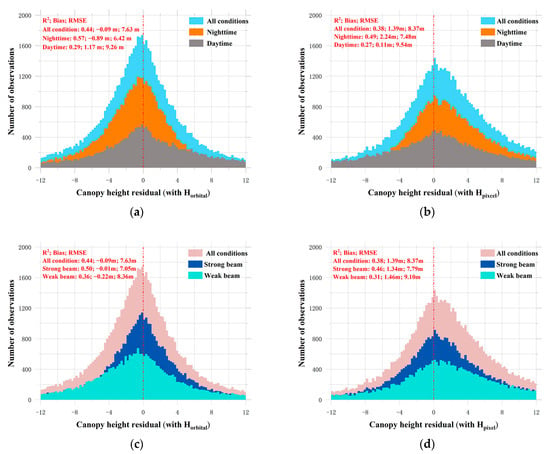
Figure 4.
The 30 m segment canopy height data for reference value residual histograms (a,c) and 30 m segment canopy height data for reference value residual histograms (b,d).

Table 2.
Accuracy of 30 m segment canopy height estimates at both segment and pixel levels.
The canopy height estimate accuracy shows consistent patterns at both segment and pixel levels. The data collected at nighttime (R2 = 0.57/0.49) exhibit lower errors than those collected during the daytime (R2 = 0.29/0.27), which can be attributed to the background noise interference caused by sunlight during the daytime. The accuracy of the data obtained from the strong beam (R2 = 0.50/0.46) is higher than that obtained from the weak beam (R2 = 0.46/0.31), which can be attributed to the greater penetration power and higher sampling density of the strong beam. It is noteworthy that the influence of collection time on data accuracy is greater than the impact of beam strength. When the data volume is insufficient to retrieve canopy height using only nighttime/strong beams, we propose supplementing with nighttime/weak beams instead of daytime/strong beams.
3.2. 30 m × 30 m Canopy Height Estimates
Figure 5 presents the r and RMSE for the 1–100th percentile of ATLAS photon-normalized height values within a pixel vs. the reference value . As the percentile increases, the RMSE gradually decreases but suddenly increases after the 94th percentile. Similarly, the r shows an increase up to the 92nd percentile, followed by a decrease. When considering only the data collected during nighttime, the highest r (r = 0.69) is observed in the 88th to 92nd percentile range, and the lowest RMSE of 6.55 m is found in the 90th to 91st percentile range. Therefore, we take the 90th percentile as the estimated ATLAS canopy height value for this pixel.
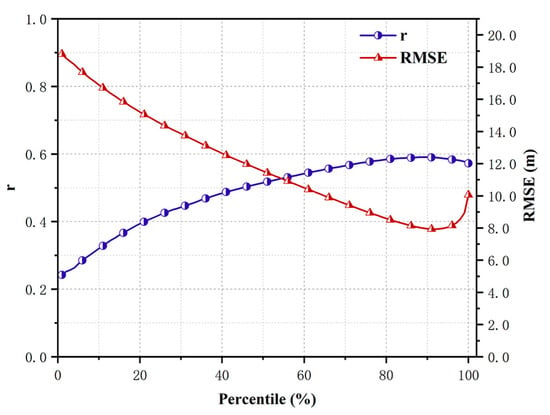
Figure 5.
RMSE and r of the percentile and ATLAS height estimates and reference values.
The data volume and accuracy as the threshold rises from 1 to 32 are depicted in Figure 6. The canopy height estimates show a decreasing trend in RMSE relative to the reference value as the threshold increases. The r peaks (0.77) at a photon count of 25. The rate of decrease in data volume follows a slow–fast–slow–fast pattern. The highest data volume decline rate is at a threshold of 9, while the data volume remains relatively stable between 20 and 28. Based on the above factors, the optimal threshold for filtering the canopy height estimates at a 30 m resolution in the Taranaki forest area is determined as 25. With this threshold, the R2 is 0.59, the RMSE is 5.51 m, the bias is 1.43, and the %RMSE is 27.6%. The scatter plot in Figure 7b illustrates these results.
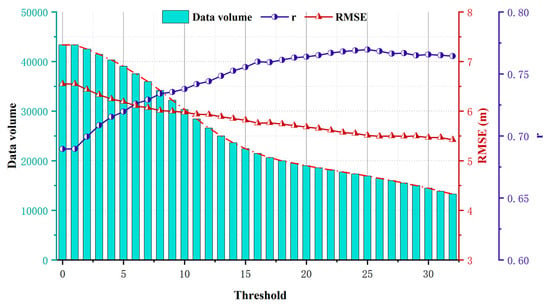
Figure 6.
Relationships between the threshold and the r and RMSE.
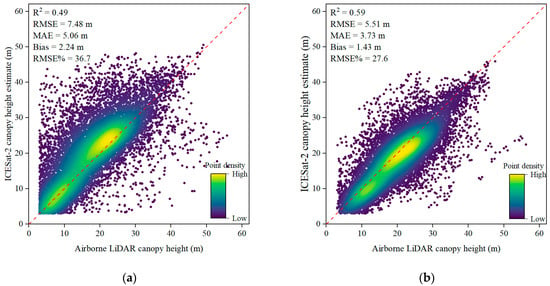
Figure 7.
Scatter plots of ICESat-2 canopy height estimates obtained using the two methods and airborne LiDAR canopy height values (). (a) Canopy height estimates obtained by matching the centroid of the 30 m along-track segment with the pixel. (b) Extraction of canopy height estimates based on pixel boundaries.
As shown in Figure 7, the pixel-wise canopy height estimations acquired in this study exhibited better accuracy (RMSE = 5.51 m) when compared to the data obtained via centroid-based spatial matching (RMSE = 7.48 m). The method we proposed reduced the bias from 2.24 m to 1.43 m and improved the R2 from 0.49 to 0.59. However, correspondingly, the data volume decreased significantly due to filtering. In the data filtering process, most weak beam data were removed, but the accuracy of the retained data (R2 = 0.83, RMSE = 2.46 m) is higher than that of the strong beam data (R2 = 0.59, RMSE = 5.58 m) (Figure 8).
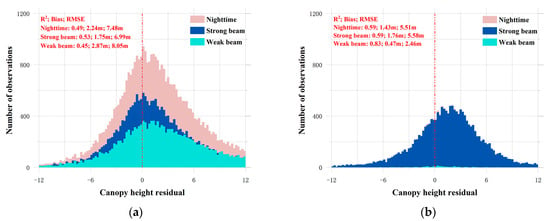
Figure 8.
Residual plots of ICESat-2 canopy height estimates obtained through the two methods and airborne LiDAR canopy height values (). (a) Canopy height estimates obtained by matching the centroid of the 30 m along-track segment with the pixel. (b) Extraction of canopy height estimates based on pixel boundaries.
4. Discussion
4.1. Performance of 30 m Segment Canopy Height Estimates
In general, the accuracy of the 30 m segment canopy height estimates obtained in this study (RMSE from 7.63 m to 8.37 m) is comparable to that of the mountainous ATL08 data in previous studies (7.02 m to 8.92 m) [25]. Pang et al.’s research indicates that introducing the airborne LiDAR DTM can improve the accuracy of canopy height inverted from the ATLAS [50]. We did not observe such phenomena, which may be attributed to a scale-effect-induced degradation in accuracy [51]. Compared to the accuracy of the 30 m segment data (an RMSE of 20 m) obtained by Feng et al. in high-relief terrain, our data exhibit a small improvement. Additionally, tall (>20 m) and dense (>90%) tree canopies can occlude the ground, thereby preventing laser points from reaching the ground and, thus, being recorded [17]. The absence of ground information adversely affects the fitting of the terrain, decreasing the accuracy of canopy height estimation.
We analyzed the data distribution of canopy height estimation at intervals of 10 under different slopes, levels of canopy cover, and tree heights (Figure 9). The Taranaki forest has a canopy height ranging from 3 m to 50 m, and these forests are mainly in hilly and mountainous regions with slope angles between 20° and 50°. Moreover, most forests in this region have a canopy cover exceeding 90%. These environmental factors present challenges for canopy height estimation based on the ICESat-2 data.
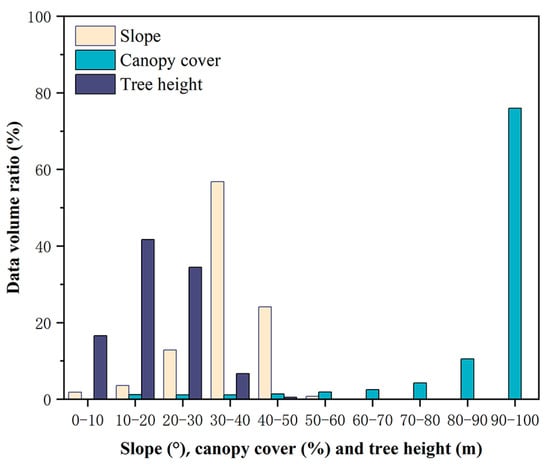
Figure 9.
Data volume ratio of canopy height estimates under different slopes, levels of canopy cover, and tree heights.
4.2. Effect of Spatial Matching Methods
Compared to the data obtained via centroid-based spatial matching, the pixel-wise canopy height estimations acquired in this study demonstrate superior accuracy (Figure 7). The accuracy improvement can be attributed to the following two factors: (1) The approach of spatial matching based on ATLAS photon locations eliminates the influence of photons outside the pixel on the canopy height estimates. (2) Insufficient photon counts within the statistical unit lead to an incomplete acquisition of canopy information, thus resulting in an underestimation of pixel canopy height. Filtering the data based on photon counts removes data that would otherwise result in underestimated pixel canopy heights.
To capture more accurate data for individual canopy height expression, the ATL08 segments are divided into 30 m step sizes (Figure 10). However, for consistency with other data requirements, ATLAS photons that fall outside the pixel boundaries are usually included when the pixel canopy heights are represented using the statistical values of photon heights within the rectangular along-track segments. Figure 10a includes three along-track segments, I–III, as well as six Landsat pixels, A–F. When matching along-track segment II with pixel D and segment III with pixel B, a high degree of overlap between the ATLAS photons is observed, resulting in minimal impact. However, when matching along-track rectangular segment I with pixel F, the significant influence of the data in pixel E on the statistical value of segment I can lead to an erroneous representation of pixel F, which often results in overestimation. In the case of Figure 10, when dividing the track into 30 m rectangular segments and matching them with the pixel using the segment centroid, the approach retains pixels B, D, and F. However, the method proposed in this study retains pixels B, D, and E. Pixel F is excluded due to the low number of photons falling below the filtering threshold. The orbit of ICESat-2 has a slope of approximately 8°, thus causing intersections between the photon track and pixel boundaries every 240 m. These frequent intersections can result in a series of mismatches, potentially decreasing overall data accuracy.
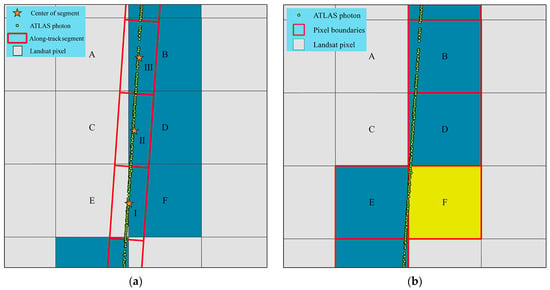
Figure 10.
Schematic diagrams of (a) 30 m along-track segment and (b) pixel-based pane.
Figure 10 also explains the outlier phenomenon in some points below the y = x bisector in the scatter plot (Figure 7). The ATLAS can only record the canopy height along the photon footprint trajectory. Uneven vegetation distribution or significant canopy height differences within a 30 m × 30 m pixel can lead to underestimated canopy heights.
4.3. Effects of Slope and Canopy Cover
Previous studies on the impact of error factors on canopy height have mainly focused on ATL08 data (12 m × 100 m), with less attention given to higher-resolution canopy height data and the 30 m × 30 m data used in this study [31,43]. In this study, we obtain the average slope values and canopy coverages corresponding to each pixel and evaluate the data accuracy under different scenarios in a stratified manner, as shown in Figure 11 and Figure 12. Figure 11 shows that the forest in the Taranaki region is primarily distributed in areas with slope angles ranging from 30° to 40°. The R2 decreases as the average slope increases, while the RMSE shows an increasing trend. Unlike previous evaluations of ATL08, the accuracy of the data in this study did not deteriorate under a high level of canopy coverage [30]. This is due to the introduction of the high-precision airborne LiDAR DTM. The R2 increases with increasing vegetation coverage, while the RMSE decreases from approximately 7 m to 5 m. This result is consistent with the findings of Liu et al. [17]. The method of acquiring relative canopy height (photon-normalized height) used in this study is generally applied to extract mountain forest canopy heights, with the prerequisite of having corresponding airborne LiDAR data available for the region [50].
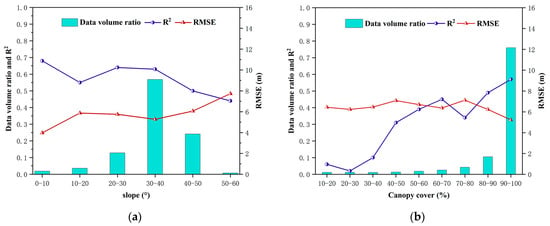
Figure 11.
Accuracy of canopy height estimates and proportion of data volume under different (a) slopes and (b) levels of canopy cover.
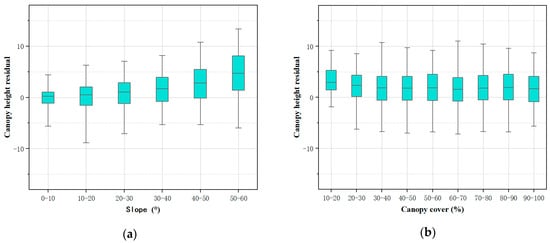
Figure 12.
Canopy height residual under different (a) slopes and (b) levels of canopy cover (90% confidence interval).
5. Conclusions
In this study, we evaluated the along-track accuracy of ICESat-2 canopy height data at a higher resolution (30 m segment) using airborne LiDAR data as references. Additionally, the performance of this higher-resolution version in representing pixel-wise canopy height was examined. Furthermore, a spatial matching method was developed to facilitate the acquisition of high-quality estimates of pixel-wise (30 m × 30 m) canopy height. The accuracy of pixel-wise canopy height estimate data was assessed, and the influence of error factors, such as slope and canopy cover, on the accuracy was analyzed. The results indicated the following findings: (1) The accuracy of the 30 m segment data in representing canopy height at the pixel-wise level (R2 = 0.38, RMSE = 8.37 m) is lower than that at the segment level (R2 = 0.44, RMSE = 7.63 m). (2) The 30 m × 30 m canopy height data obtained using the spatial matching method proposed in this study exhibits higher accuracy (nighttime; R2 = 0.59, RMSE = 5.51). (3) With an external high-precision DTM, the accuracy of ATLAS canopy height data decreases with increasing slope and increases with increasing canopy cover. This study contributes to more accurately matching ICESat-2/ATLAS canopy height data with gridded auxiliary data, which is essential for the multisource data-based retrieval of wall-to-wall FCH using satellite-based LiDAR data.
Author Contributions
Conceptualization, F.C. and X.Z.; methodology, F.C.; software, F.C.; validation, F.C., B.D. and L.W. (Linwei Wang); formal analysis, F.C. and L.W. (Longyu Wang); data curation, F.C.; writing—original draft preparation, F.C. and X.Z.; writing—review and editing, F.C. and X.Z.; visualization, F.C. and S.D. All authors have read and agreed to the published version of the manuscript.
Funding
This research was funded by the National Natural Science Foundation of China (Grant Nos.: 42077242 and 41820104001).
Data Availability Statement
Publicly available datasets were analyzed in this study. These datasets can be found using links provided in this paper.
Conflicts of Interest
The authors declare no conflict of interest.
References
- Wang, Y.; Zhang, X.; Guo, Z. Estimation of tree height and aboveground biomass of coniferous forests in North China using stereo ZY-3, multispectral Sentinel-2, and DEM data. Ecol. Indic. 2021, 126, 107645. [Google Scholar] [CrossRef]
- Yang, Y.; Shi, Y.; Sun, W.; Chang, J.; Zhu, J.; Chen, L.; Wang, X.; Guo, Y.; Zhang, H.; Yu, L.; et al. Terrestrial carbon sinks in China and around the world and their contribution to carbon neutrality. Sci. China Life Sci. 2022, 65, 861–895. [Google Scholar] [CrossRef]
- Pugh, T.A.M.; Lindeskog, M.; Smith, B.; Poulter, B.; Arneth, A.; Haverd, V.; Calle, L. Role of forest regrowth in global carbon sink dynamics. Proc. Natl. Acad. Sci. USA 2019, 116, 4382–4387. [Google Scholar] [CrossRef] [PubMed]
- Balzter, H.; Rowland, C.; Saich, P. Forest canopy height and carbon estimation at Monks Wood National Nature Reserve, UK, using dual-wavelength SAR interferometry. Remote Sens. Environ. 2007, 108, 224–239. [Google Scholar] [CrossRef]
- Tang, H.; Armston, J.; Hancock, S.; Marselis, S.; Goetz, S.; Dubayah, R. Characterizing global forest canopy cover distribution using spaceborne lidar. Remote Sens. Environ. 2019, 231, 111262. [Google Scholar] [CrossRef]
- Duncanson, L.; Neuenschwander, A.; Hancock, S.; Thomas, N.; Fatoyinbo, T.; Simard, M.; Silva, C.A.; Armston, J.; Luthcke, S.B.; Hofton, M.; et al. Biomass estimation from simulated GEDI, ICESat-2 and NISAR across environmental gradients in Sonoma County, California. Remote Sens. Environ. 2020, 242, 111779. [Google Scholar] [CrossRef]
- Beland, M.; Parker, G.; Sparrow, B.; Harding, D.; Chasmer, L.; Phinn, S.; Antonarakis, A.; Strahler, A. On promoting the use of lidar systems in forest ecosystem research. For. Ecol. Manag. 2019, 450, 117484. [Google Scholar] [CrossRef]
- Dandois, J.P.; Ellis, E.C. High spatial resolution three-dimensional mapping of vegetation spectral dynamics using computer vision. Remote Sens. Environ. 2013, 136, 259–276. [Google Scholar] [CrossRef]
- Lefsky, M.A.; Cohen, W.B.; Parker, G.G.; Harding, D.J. Lidar remote sensing for ecosystem studies. Bioscience 2002, 52, 19–30. [Google Scholar] [CrossRef]
- Lisein, J.; Pierrot-Deseilligny, M.; Bonnet, S.; Lejeune, P. A Photogrammetric Workflow for the Creation of a Forest Canopy Height Model from Small Unmanned Aerial System Imagery. Forests 2013, 4, 922–944. [Google Scholar] [CrossRef]
- Coops, N.C.; Tompalski, P.; Goodbody, T.R.H.; Queinnec, M.; Luther, J.E.; Bolton, D.K.; White, J.C.; Wulder, M.A.; van Lier, O.R.; Hermosilla, T. Modelling lidar-derived estimates of forest attributes over space and time: A review of approaches and future trends. Remote Sens. Environ. 2021, 260, 112477. [Google Scholar] [CrossRef]
- Jiang, F.; Zhao, F.; Ma, K.; Li, D.; Sun, H. Mapping the Forest Canopy Height in Northern China by Synergizing ICESat-2 with Sentinel-2 Using a Stacking Algorithm. Remote Sens. 2021, 13, 1535. [Google Scholar] [CrossRef]
- Luo, Y.; Qi, S.; Liao, K.; Zhang, S.; Hu, B.; Tian, Y. Mapping the Forest Height by Fusion of ICESat-2 and Multi-Source Remote Sensing Imagery and Topographic Information: A Case Study in Jiangxi Province, China. Forests 2023, 14, 454. [Google Scholar] [CrossRef]
- Potapov, P.; Li, X.; Hernandez-Serna, A.; Tyukavina, A.; Hansen, M.C.; Kommareddy, A.; Pickens, A.; Turubanova, S.; Tang, H.; Silva, C.E.; et al. Mapping global forest canopy height through integration of GEDI and Landsat data. Remote Sens. Environ. 2021, 253, 112165. [Google Scholar] [CrossRef]
- Rodda, S.R.; Nidamanuri, R.R.; Fararoda, R.; Mayamanikandan, T.; Rajashekar, G. Evaluation of Height Metrics and Above-Ground Biomass Density from GEDI and ICESat-2 Over Indian Tropical Dry Forests using Airborne LiDAR Data. J. Indian Soc. Remote Sens. 2023, 1–16. [Google Scholar] [CrossRef]
- Markus, T.; Neumann, T.; Martino, A.; Abdalati, W.; Brunt, K.; Csatho, B.; Farrell, S.; Fricker, H.; Gardner, A.; Harding, D.; et al. The Ice, Cloud, and land Elevation Satellite-2 (ICESat-2): Science requirements, concept, and implementation. Remote Sens. Environ. 2017, 190, 260–273. [Google Scholar] [CrossRef]
- Liu, A.; Cheng, X.; Chen, Z. Performance evaluation of GEDI and ICESat-2 laser altimeter data for terrain and canopy height retrievals. Remote Sens. Environ. 2021, 264, 112571. [Google Scholar] [CrossRef]
- Neuenschwander, A.; Magruder, L. The Potential Impact of Vertical Sampling Uncertainty on ICESat-2/ATLAS Terrain and Canopy Height Retrievals for Multiple Ecosystems. Remote Sens. 2016, 8, 1039. [Google Scholar] [CrossRef]
- Magruder, L.; Brunt, K.; Neumann, T.; Klotz, B.; Alonzo, M. Passive Ground-Based Optical Techniques for Monitoring the On-Orbit ICESat-2 Altimeter Geolocation and Footprint Diameter. Earth Space Sci. 2021, 8, e2020EA001414. [Google Scholar] [CrossRef]
- Neumann, T.; Brenner, A.; Hancock, D.; Robbins, J.; Saba, J.; Harbeck, K.; Gibbons, A. Ice, Cloud, and Land Elevation Satellite–2 (Icesat-2) Project: Algorithm Theoretical Basis Document (Atbd) for Global Geolocated Photons (ATL03); NASA Goddard Space Flight Center: Greenbelt, MD, USA, 2019; Volume 5, p. 6.
- Neuenschwander, A.; Pitts, K.; Jelley, B.; Robbins, J.; Markel, J.; Popescu, S.; Nelson, R.; Harding, D.; Pederson, D.; Klotz, B.; et al. Ice, Cloud, and Land Elevation Satellite-2 (ICESat-2) Algorithm Theoretical Basis Document (ATBD) for Land—Vegetation Along-Track Products (ATL08); NASA Goddard Space Flight Center: Greenbelt, MD, USA, 2022.
- Neuenschwander, A.; Guenther, E.; White, J.C.; Duncanson, L.; Montesano, P. Validation of ICESat-2 terrain and canopy heights in boreal forests. Remote Sens. Environ. 2020, 251, 112110. [Google Scholar] [CrossRef]
- Purslow, M.; Hancock, S.; Neuenschwander, A.; Armston, J.; Duncanson, L. Can ICESat-2 estimate stand-level plant structural traits? Validation of an ICESat-2 simulator. Sci. Remote Sens. 2023, 7, 100086. [Google Scholar] [CrossRef]
- Yu, J.; Nie, S.; Liu, W.; Zhu, X.; Lu, D.; Wu, W.; Sun, Y. Accuracy Assessment of ICESat-2 Ground Elevation and Canopy Height Estimates in Mangroves. IEEE Geosci. Remote Sens. Lett. 2022, 19, 1–5. [Google Scholar] [CrossRef]
- Zhu, X.; Nie, S.; Wang, C.; Xi, X.; Hu, Z. A Ground Elevation and Vegetation Height Retrieval Algorithm Using Micro-Pulse Photon-Counting Lidar Data. Remote Sens. 2018, 10, 1962. [Google Scholar] [CrossRef]
- Zhu, X.; Nie, S.; Zhu, Y.; Chen, Y.; Yang, B.; Li, W. Evaluation and Comparison of ICESat-2 and GEDI Data for Terrain and Canopy Height Retrievals in Short-Stature Vegetation. Remote Sens. 2023, 15, 4969. [Google Scholar] [CrossRef]
- Neuenschwander, A.L.; Magruder, L.A. Canopy and Terrain Height Retrievals with ICESat-2: A First Look. Remote Sens. 2019, 11, 1721. [Google Scholar] [CrossRef]
- Neumann, T.A.; Martino, A.J.; Markus, T.; Bae, S.; Bock, M.R.; Brenner, A.C.; Brunt, K.M.; Cavanaugh, J.; Fernandes, S.T.; Hancock, D.W.; et al. The Ice, Cloud, and Land Elevation Satellite—2 Mission: A Global Geolocated Photon Product Derived From the Advanced Topographic Laser Altimeter System. Remote Sens Environ. 2019, 233, 111325. [Google Scholar] [CrossRef] [PubMed]
- Wang, C.; Zhu, X.; Nie, S.; Xi, X.; Li, D.; Zheng, W.; Chen, S. Ground elevation accuracy verification of ICESat-2 data: A case study in Alaska, USA. Opt Express 2019, 27, 38168–38179. [Google Scholar] [CrossRef]
- Dong, J.; Ni, W.; Zhang, Z.; Sun, G. Performance of ICESat-2 ATL08 product on the estimation of forest height by referencing to small footprint LiDAR data. Natl. Remote Sens. Bull. 2021, 25, 1294–1307. [Google Scholar] [CrossRef]
- Moudrý, V.; Gdulová, K.; Gábor, L.; Šárovcová, E.; Barták, V.; Leroy, F.; Špatenková, O.; Rocchini, D.; Prošek, J. Effects of environmental conditions on ICESat-2 terrain and canopy heights retrievals in Central European mountains. Remote Sens. Environ. 2022, 279, 113112. [Google Scholar] [CrossRef]
- Zhu, X. Research on Retrieval of Forest Height in China at a 30 Meter Resolution Based on ICESat-2 and GEDI Data. Doctor’s Thesis, Chinese Academy of Sciences (Aerospace Information Research Institute), Beijing, China, 2021. [Google Scholar]
- Musthafa, M.; Singh, G.; Kumar, P. Comparison of forest stand height interpolation of GEDI and ICESat-2 LiDAR measurements over tropical and sub-tropical forests in India. Environ. Monit. Assess 2022, 195, 71. [Google Scholar] [CrossRef]
- Nandy, S.; Srinet, R.; Padalia, H. Mapping Forest Height and Aboveground Biomass by Integrating ICESat-2, Sentinel-1 and Sentinel-2 Data Using Random Forest Algorithm in Northwest Himalayan Foothills of India. Geophys. Res. Lett. 2021, 48, e2021GL093799. [Google Scholar] [CrossRef]
- Feng, T.; Duncanson, L.; Montesano, P.; Hancock, S.; Minor, D.; Guenther, E.; Neuenschwander, A. A systematic evaluation of multi-resolution ICESat-2 ATL08 terrain and canopy heights in boreal forests. Remote Sens. Environ. 2023, 291, 113570. [Google Scholar] [CrossRef]
- Chen, B.; Pang, Y.; Li, Z.; North, P.; Rosette, J.; Sun, G.; Suárez, J.; Bye, I.; Lu, H. Potential of Forest Parameter Estimation Using Metrics from Photon Counting LiDAR Data in Howland Research Forest. Remote Sens. 2019, 11, 856. [Google Scholar] [CrossRef]
- Malambo, L.; Popescu, S.; Liu, M. Landsat-Scale Regional Forest Canopy Height Mapping Using ICESat-2 Along-Track Heights: Case Study of Eastern Texas. Remote Sens. 2022, 15, 1. [Google Scholar] [CrossRef]
- Li, W.; Niu, Z.; Shang, R.; Qin, Y.; Wang, L.; Chen, H. High-resolution mapping of forest canopy height using machine learning by coupling ICESat-2 LiDAR with Sentinel-1, Sentinel-2 and Landsat-8 data. Int. J. Appl. Earth Obs. Geoinf. 2020, 92, 102163. [Google Scholar] [CrossRef]
- Aboveground Woody Biomass Product Validation Good Practices Protocol. Available online: https://lpvs.gsfc.nasa.gov/PDF/CEOS_WGCV_LPV_Biomass_Protocol_2021_V1.0.pdf (accessed on 15 November 2023).
- Zhu, X.; Wang, C.; Nie, S.; Pan, F.; Xi, X.; Hu, Z. Mapping forest height using photon-counting LiDAR data and Landsat 8 OLI data: A case study in Virginia and North Carolina, USA. Ecol. Indic. 2020, 114, 106287. [Google Scholar] [CrossRef]
- Montesano, P.M.; Rosette, J.; Sun, G.; North, P.; Nelson, R.F.; Dubayah, R.O.; Ranson, K.J.; Kharuk, V. The uncertainty of biomass estimates from modeled ICESat-2 returns across a boreal forest gradient. Remote Sens. Environ. 2015, 158, 95–109. [Google Scholar] [CrossRef]
- Liu, X.; Su, Y.; Hu, T.; Yang, Q.; Liu, B.; Deng, Y.; Tang, H.; Tang, Z.; Fang, J.; Guo, Q. Neural network guided interpolation for mapping canopy height of China’s forests by integrating GEDI and ICESat-2 data. Remote Sens. Environ. 2022, 269, 112844. [Google Scholar] [CrossRef]
- Narine, L.L.; Popescu, S.C.; Malambo, L. A Methodological Framework for Mapping Canopy Cover Using ICESat-2 in the Southern USA. Remote Sens. 2023, 15, 1548. [Google Scholar] [CrossRef]
- Wu, Z.; Shi, F. Mapping Forest Canopy Height at Large Scales Using ICESat-2 and Landsat: An Ecological Zoning Random Forest Approach. IEEE Trans. Geosci. Remote Sens. 2023, 61, 1–16. [Google Scholar] [CrossRef]
- Sun, T.; Qi, J.; Huang, H. Discovering forest height changes based on spaceborne lidar data of ICESat-1 in 2005 and ICESat-2 in 2019: A case study in the Beijing-Tianjin-Hebei region of China. For. Ecosyst. 2020, 7, 53. [Google Scholar] [CrossRef]
- Sothe, C.; Gonsamo, A.; Lourenço, R.B.; Kurz, W.A.; Snider, J. Spatially Continuous Mapping of Forest Canopy Height in Canada by Combining GEDI and ICESat-2 with PALSAR and Sentinel. Remote Sens. 2022, 14, 5158. [Google Scholar] [CrossRef]
- Roy, D.P.; Wulder, M.A.; Loveland, T.R.; Woodcock, C.E.; Allen, R.G.; Anderson, M.C.; Helder, D.; Irons, J.R.; Johnson, D.M.; Kennedy, R.; et al. Landsat-8: Science and product vision for terrestrial global change research. Remote Sens. Environ. 2014, 145, 154–172. [Google Scholar] [CrossRef]
- Amoore, Q.; Bedford, G.; Benson, M.; Blakemore, K.; Clark, C.; Dearden, J.; Deegan, P.; Ellis, S.; Fox, V.; Hafiz, F.; et al. Our Place: Taranaki State of Environment 2022. 2022. Available online: https://www.trc.govt.nz/assets/Documents/Environment/SOE2022/TRC_State-Of-Environment_A4_Web-Spreads.pdf (accessed on 13 July 2023).
- Matasci, G.; Hermosilla, T.; Wulder, M.A.; White, J.C.; Coops, N.C.; Hobart, G.W.; Zald, H.S.J. Large-area mapping of Canadian boreal forest cover, height, biomass and other structural attributes using Landsat composites and lidar plots. Remote Sens. Environ. 2018, 209, 90–106. [Google Scholar] [CrossRef]
- Pang, S.; Li, G.; Jiang, X.; Chen, Y.; Lu, Y.; Lu, D. Retrieval of forest canopy height in a mountainous region with ICESat-2 ATLAS. For. Ecosyst. 2022, 9, 100046. [Google Scholar] [CrossRef]
- Silva, C.A.; Duncanson, L.; Hancock, S.; Neuenschwander, A.; Thomas, N.; Hofton, M.; Fatoyinbo, L.; Simard, M.; Marshak, C.Z.; Armston, J.; et al. Fusing simulated GEDI, ICESat-2 and NISAR data for regional aboveground biomass mapping. Remote Sens. Environ. 2021, 253, 112234. [Google Scholar] [CrossRef]
Disclaimer/Publisher’s Note: The statements, opinions and data contained in all publications are solely those of the individual author(s) and contributor(s) and not of MDPI and/or the editor(s). MDPI and/or the editor(s) disclaim responsibility for any injury to people or property resulting from any ideas, methods, instructions or products referred to in the content. |
© 2023 by the authors. Licensee MDPI, Basel, Switzerland. This article is an open access article distributed under the terms and conditions of the Creative Commons Attribution (CC BY) license (https://creativecommons.org/licenses/by/4.0/).