Abstract
Intermittent and ephemeral channels are a critical component of the global hydrologic network. The dominant feature in dryland environments, ephemeral channel transmission loss facilitates aquifer recharge. Characterizing flow intermittency improves groundwater storage estimates; however, limited gauging of intermittent systems impedes this understanding. This research develops an improved classification for surface flow, optimized for ephemeral systems using linear discriminant function analysis and remotely sensed imagery. It further applies this methodology to assess temporal and spatial flow patterns across the Souss channel, an ungauged, ephemeral system in central Morocco. Linear discriminant function analysis demonstrates high predictive accuracy for Landsat imagery, with significantly improved classification success as compared to the Modified Normalized Difference Water Index. Application to the Souss channel from 1984 to 2022 points to a decreasing trend in flow frequency. Despite this change, flow events remain concentrated within the wet season, critical for regional aquifer recharge. Spatial flow characteristics further support sustained infiltration, with the majority of events focused within the upstream channel section during both dry and wet seasons. Decreased occurrence moving downstream highlights the likely impact of additional factors such as transmission loss, evapotranspiration, and agricultural abstraction contributing to channel intermittency.
1. Introduction
Perennial channels remain the dominant conceptual framework for hydrologic research, yet more than half of the global stream network experiences flow cessation on an annual basis [1,2]. Non-perennial channels (e.g., intermittent, and ephemeral channels) encompass a broad range of dynamic systems, with periods of flow discontinuity ranging from a single day to the majority of the year [3]. Observed across both humid and arid climates, this range of disruption, as well as the primary drivers, vary widely [2,4,5]. Intermittent flow is a naturally occurring feature of many hydrologic regimes; it may be catalyzed by drought, anthropogenic abstraction, or occur only in response to precipitation events. Key drivers of flow variability include climate, topography, height of the water table, and basin land use [2,4,5,6]. In conjunction with providing critical water resources, non-perennial channels facilitate key biogeochemical processes and sediment flux as they shift between wet and dry phases [1,7,8,9].
Despite their hydrologic and ecologic significance, intermittent systems remain poorly characterized [1,10]. Though increasing work has been carried out to understand their prevalence and global distribution, minimal research has been focused on the dynamic nature and temporal variability of flow. This is particularly relevant as many perennial streams are anticipated to grow increasingly intermittent with projected climate warming and altered patterns of precipitation [5].
Limited characterization is a specific concern within dryland environments, where intermittent and ephemeral channels are the dominant hydrologic feature [2,4,11,12]. Ephemeral channels experience episodic flow only in response to storm events; streamflow is closely tied to precipitation seasonality and is spatially and temporally variable [13]. Transmission loss, the vertical infiltration of surface water through channel sediments, represents the primary form of aquifer recharge within arid zones [14,15,16]. Limited research has focused on quantifying ephemeral channel flow regimes, despite direct implications of channel intermittency for groundwater recharge and water availability. This is, in part, a result of the minimal gauging and limited data history frequently observed in non-perennial systems [3,16,17]. Though under-prioritized, ephemeral channels present specific challenges to monitoring [18]. Extended periods of no-flow, punctuated by large, destructive floods may damage gauge equipment. Flow may further be spatially discontinuous across the channel, with stationary gauges poorly suited to capture flow heterogeneity [10]. In arid regions with already limited water resources, even minor shifts in onset, duration, and distribution of precipitation may have profound implications for ephemeral channel flow and resulting recharge [13]. Failure to quantify spatial and temporal patterns of surface flow impedes modeling efforts and water-balance estimates, increasing the likelihood of mismanagement [19].
Remote sensing has frequently been used to characterize landscapes, including substantial work in water detection [20,21]. Common methods include the application of image masks, indices, classification schemes, and proxies to differentiate water pixels from the land surface. These methods however are broadly focused on large, clear water bodies, such as oceans, lakes, and major perennial rivers, which display low, relatively consistent reflectance values over space and time [22,23,24,25]. Though interest has increased in recent years, water detection methods developed for open water bodies are poorly suited for water pixel identification within ephemeral channels [26,27]. Within these systems, water pixels are frequently mixed, highly turbid, and spatially and temporally inconsistent [27,28,29,30]. Common fluvial features such as braided or multi-threaded geomorphology may yield channels too narrow to be resolved at the spatial resolution of common sensors [16,30]. Temporally, ephemeral channels vary greatly, with inundation ranging from a period of hours to days [3,16]. The limited temporal resolution of publicly available satellites may further fail to capture this variability. Physical properties of arid environments may present challenges, with low topographic gradients and limited vegetation impeding channel delineation [31]. Highly turbid flow events may additionally produce high spectral reflectance, reducing contrast between adjacent channel alluvial sediments [31,32]. Recent work has identified the utility of tailored water pixel detection to specific environments through the use of machine learning algorithms and statistical analyses [31,32,33]. Specific applications include the use of random forest algorithms with satellite-derived variables (TOA bands, NDVI, or common water pixel indices) for water pixel prediction and subsequent mapping [28,34,35,36,37]. For intermittent systems, this has the potential to improve water pixel classification and identification.
At present, remote sensing analysis of temporary water bodies is minimal and has primarily assessed non-channelized flow, such as generalized flooding, glacial outbursts, or isolated pools [26,27,35,36]. Within ephemeral systems, research has focused on the mapping and delineation of channel morphology and connectivity, disregarding fluctuations in inundation [31,34,37]. Across this work, LiDAR is frequently chosen for high-resolution, spatially focused imagery capable of measuring topographic variation [31,35]. LiDAR scanning however is costly and not readily available, with limited temporal range for trend analysis. Publicly available, passive satellites may be better suited for the assessment of long-term shifts in inundation; imagery is generally available across a longer temporal period, necessary for the evaluation of hydrologic trends [26]. Existing research within this area generally struggles with data availability, both temporally and spatially, for the assessment of significant trends at the established 30-year hydrologic reference period [38]. This limits the ability of existing methodologies to quantify statistically significant trends, particularly in intermittent systems which may be experiencing shifting inundation in relation to climate warming.
This research is focused on understanding large-scale hydrologic processes within ungauged basins through the use of remote sensing and a flexible statistical classification. It further explores the application of this remote sensing methodology to quantify streamflow variability within an ungauged, ephemeral channel in central Morocco. This work specifically aims to (1) assess the utility of discriminant function analysis for improved classification of ephemeral channel inundation. In turn, this methodology is applied to (2) quantify the temporal and (3) spatial patterns of flow variability across the Souss channel, an evolving ephemeral system.
Within this study, discriminant function analysis was applied to NASA Landsat imagery (missions 5, 7, and 8) from 1984 to 2022 to develop an optimized water classification scheme based on the unique characteristics of water pixels within ephemeral river systems. Improved water pixel classification was applied to identify patterns of surface flow across upstream, midstream, and downstream reaches of the channel. Remotely sensed precipitation data (TRMM-TMPA, GPM-IMERG) were applied to validate flood presence. Remote sensing has the potential to resolve data gaps for the past and present characterization of channel intermittency, particularly in data-limited systems. This analysis demonstrates potential in its application to quantify patterns of intermittent surface flow across non-perennial channels, improving management in water-scarce regions.
2. Materials and Methods
2.1. Study Area
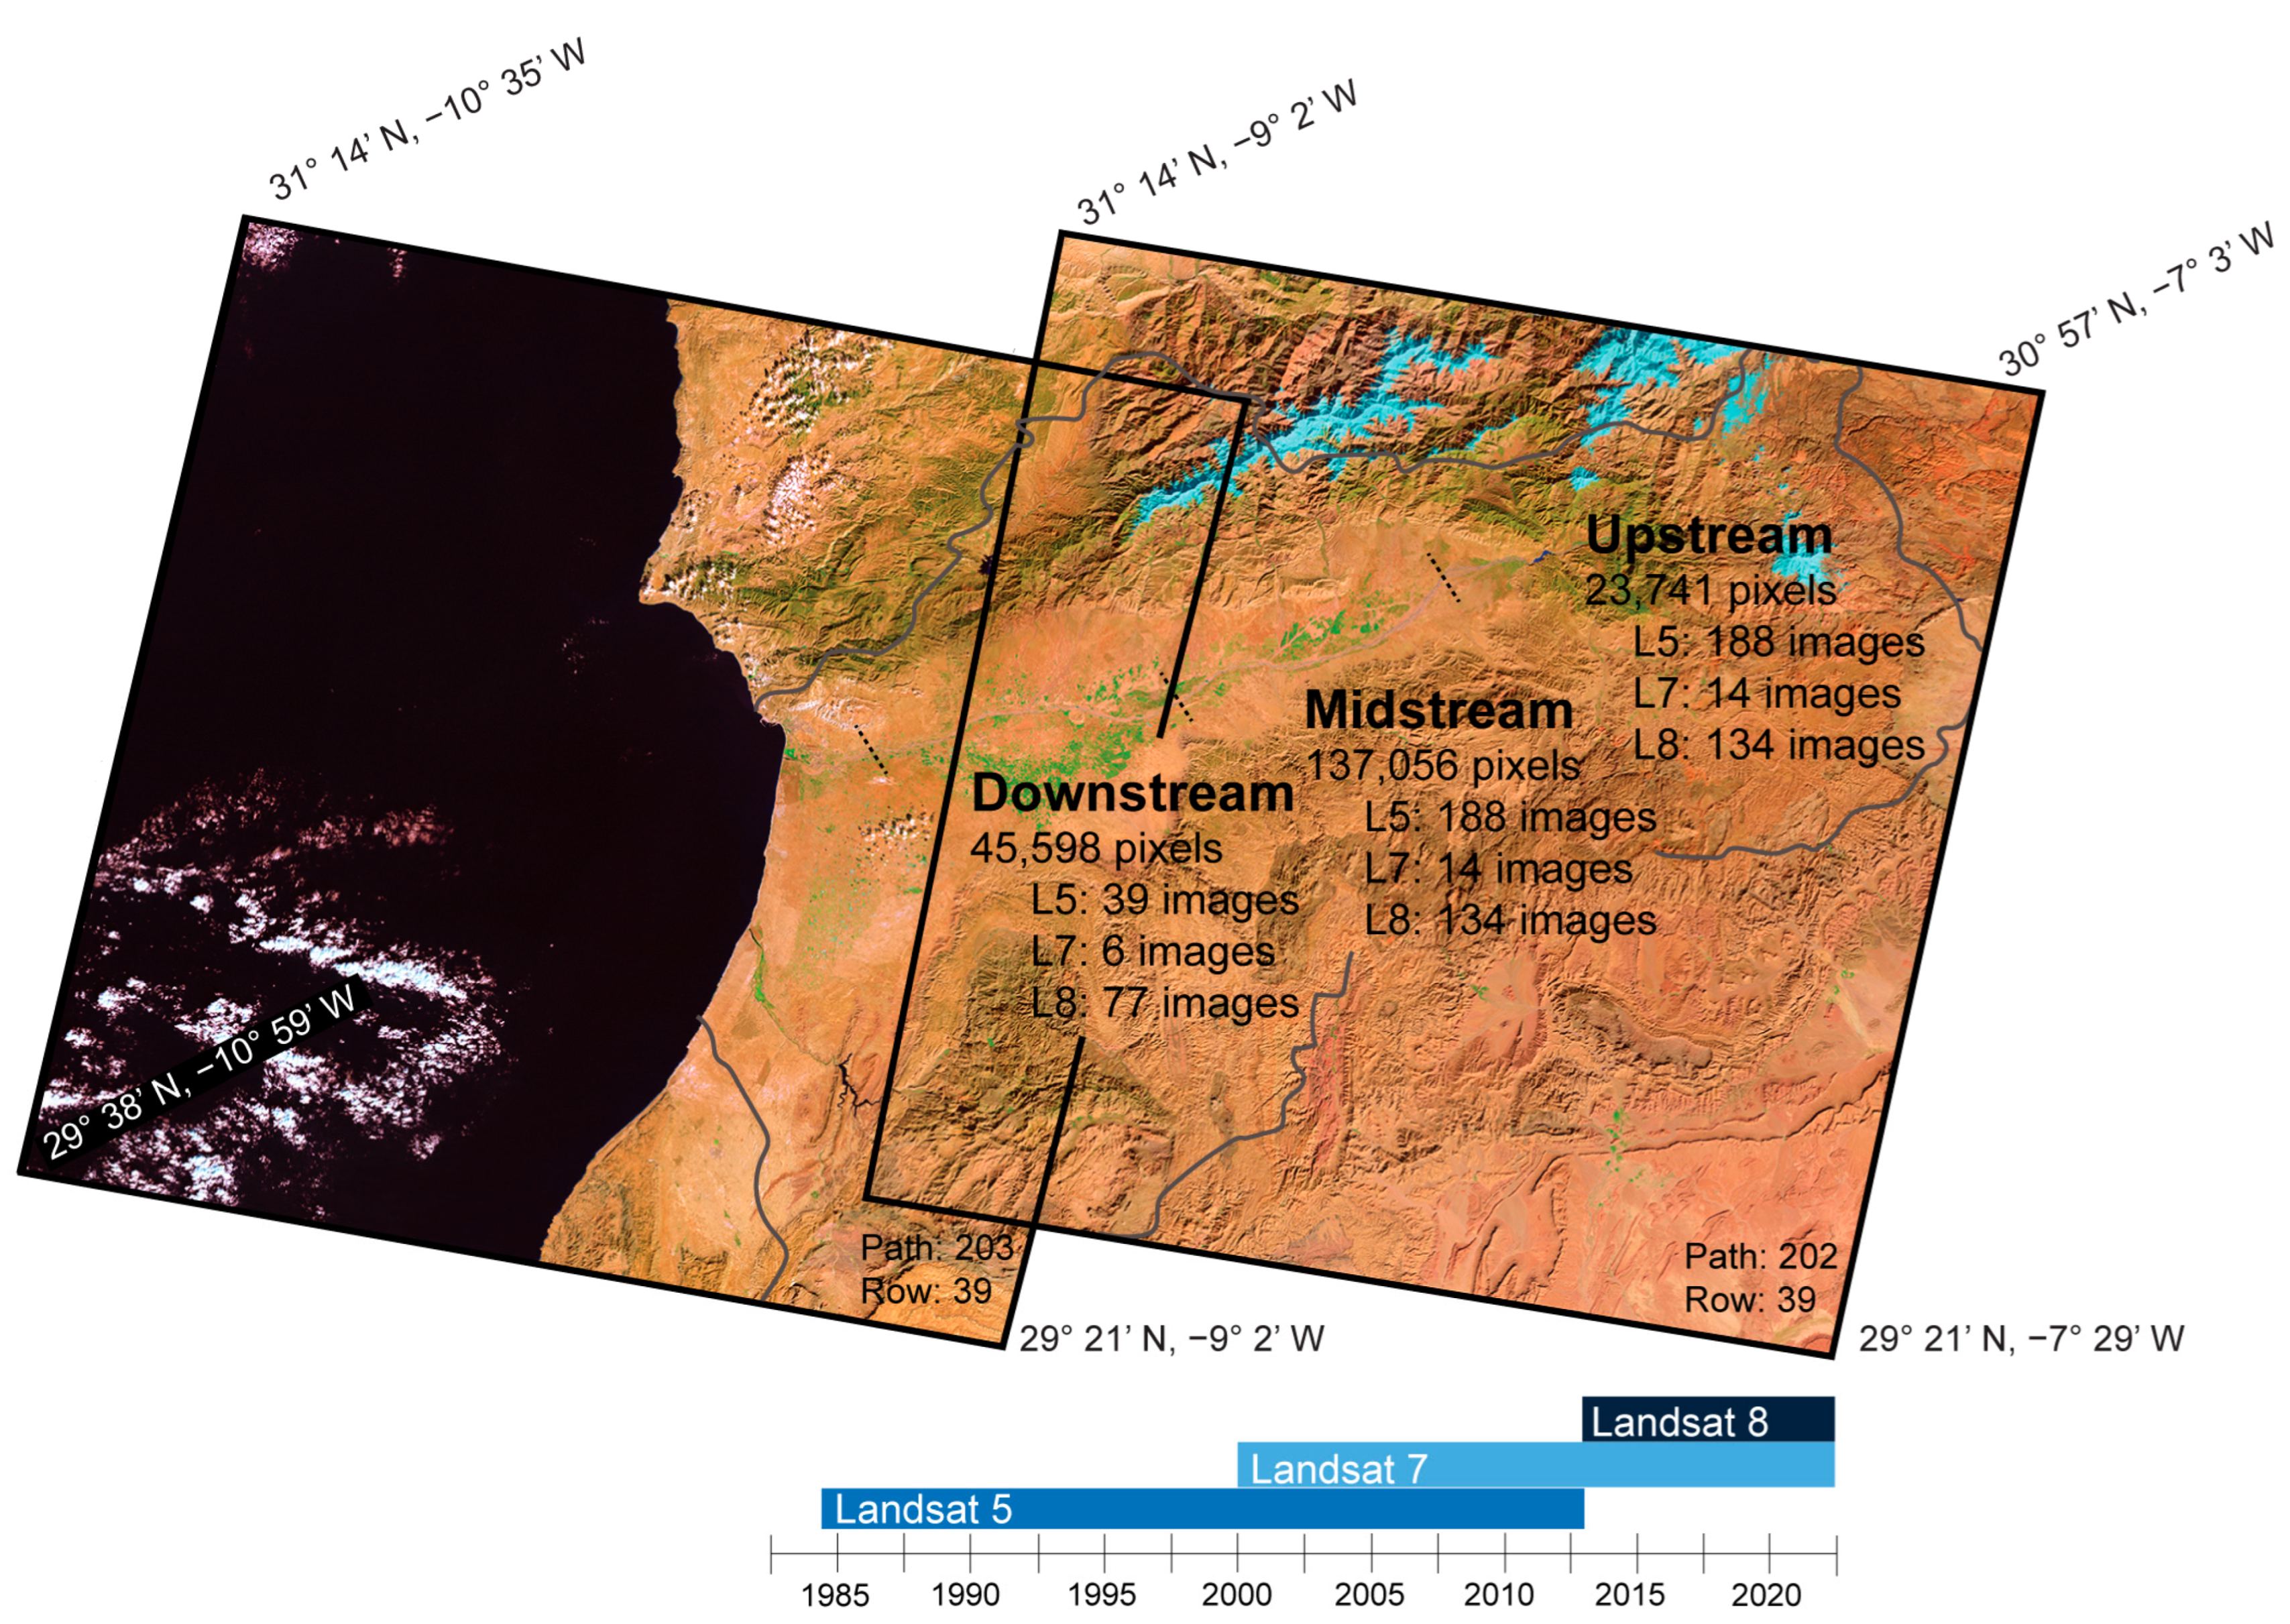
The Souss–Massa (27,000 km2) is a semi-arid, highly agricultural basin located in central Morocco (Figure 1) [39,40]. Bounded by the High-Atlas Mountains to the north and Anti-Atlas Mountains to the south, the Souss channel flows from the Aoulouz reservoir in the foothills to terminate at the Atlantic Ocean. Overall, a gently sloping system, the average stream gradient shifts from 12.2 m/km in the channel upstream to flatten across the midstream and downstream sections (5.7 m/km and 3.1 m/km, respectively). This channel is underlain by alluvial material, primarily gravels, sands, and lacustrine limestones, which comprise a thick Pliocene–Quaternary sequence [41,42]. These sediments contain an unconfined regional aquifer with variable thickness; depth to the water table is shown to increase moving westward and with distance from the channel [43,44]. The unconfined aquifer is shallowest adjacent to the Souss, ranging from an average of 10–30 m below the surface [43,44]. Historically an ephemeral system, surface flow is seasonal, supported by tributaries originating in the High-Atlas Mountains and precipitation during the wet season from November–March [39,40]. Post-1990, discharge has been modulated through releases by the Aoulouz dam, located at the channel headwaters [45]. As a result of flow intermittency and limited infrastructure, data are scarce across the basin. Discharge measurements are restricted to only two gauges located in the upstream and midstream channel sections, with intermittent measurements beginning in 1999 [46].
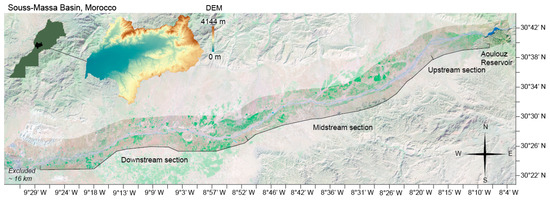
Figure 1.
The Souss channel, located in central Morocco. The channel is broken into three distinct sections based on basin morphology: upstream, midstream, and downstream. The final 16 km of the downstream section of the channel was excluded from analysis, as the reach from Drarga to the terminus at the Atlantic Ocean experiences rare surface flow and common saltwater intrusion. In the upper left, a DEM of the Souss–Massa basin displays variable elevation, ranging from 4144 m in the channel uplands to 0 m across the downstream section of the plain.
Across this basin, precipitation is heterogenous, with annual averages ranging from 500 mm in the uplands to 250 mm across the plain [41]. Decreased precipitation intensity and increased mean annual temperature have been observed in recent decades, with inter-annual variability resulting in a higher frequency of drought [39,45]. Despite limited water resources, the Souss–Massa basin relies heavily on irrigation via surface and groundwater pumping to support critical citrus and vegetable exports, accounting for greater than 50% and 85%, respectively, of the national total [43,47]. The basin additionally is widely utilized for cereal and almond production [47]. Since the 1970s, over-pumping for agriculture, in tandem with reduced precipitation, has driven steady declines in the height of the unconfined Souss aquifer [43]. Though surface flow in the channel plays a vital role in supporting regional agriculture, a limited understanding of flow intermittency creates a challenge for sustainable water management.
2.2. Data
Using Google Earth Engine, satellite imagery of the Souss channel was acquired from NASA Landsat missions 5, 7, and 8, spanning a combined 38-year period from 1984 to 2022. Top of Atmosphere (TOA) reflectance imagery (Tier 1) was selected, and dark-object subtraction was applied for atmospheric correction [48]. Landsat imagery is available approximately every 16 days; however images were filtered for low cloud cover (less than 5% of the image), reducing the number of available images (Table 1). The Souss channel was divided into three sections of varying length corresponding to upstream, midstream, and downstream reaches, delineated on the basis of channel morphology and geographic markers. In particular, the upstream and midstream sections were separated at a distinct bend in the channel, which is further the approximate location of reduced flow frequency. The midstream and downstream channel sections were delineated at the mid-sized town of Taroudant, which is further correlated to qualitative observations of reduced surface flow (Figure 1). Channel reaches were used to spatially filter imagery to regions of interest (Figure 2). Only images which entirely cover channel sections were selected to avoid edge pixels, which commonly have incomplete band information. An exception, however, was made for the downstream section, with the inclusion of four additional images which only partially cover the section (ranging from 0.69 to 5.11% fewer pixels) to support a more complete time span for Landsat 5 path 203/row 39 (WRS-2). Though the number of images per section is in part an artifact of variable cloud cover, Landsat 5 path 203/row 39 has approximately one-third fewer images collected than path 202/row 39. From visual inspection, the truncated images included were entirely dry and devoid of surface flow. Across all selected imagery, band values were extracted for each pixel in the image (Figure 3). For comparison across bands, each pixel value was converted to a percent range, standardizing the scale of all values from 0 to 1, as demonstrated in Equation (1).

Table 1.
Landsat 5, 7, and 8 satellite information. Across the three satellites, the Panchromatic and Thermal bands (1 and 2) were excluded from linear discriminant function analysis due to their varied spatial resolutions.
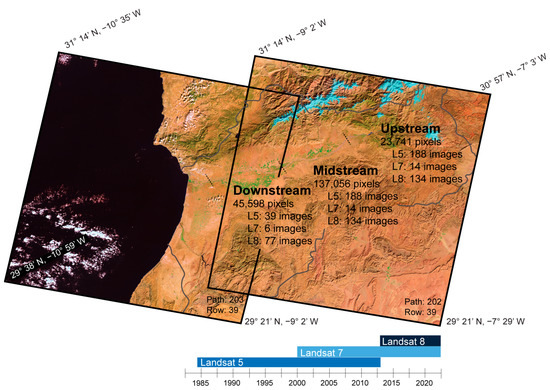
Figure 2.
Footprint of Landsat imagery within the Souss–Massa basin (outlined in gray). Across the channel, the differing section length translates to a variable number of pixels per section. The upstream and midstream reach both fall within the path 202/row 39 Landsat image, while the downstream stretch falls entirely within the path 203/row 39 image and partially in the path 202/row 39 image (WRS-2).
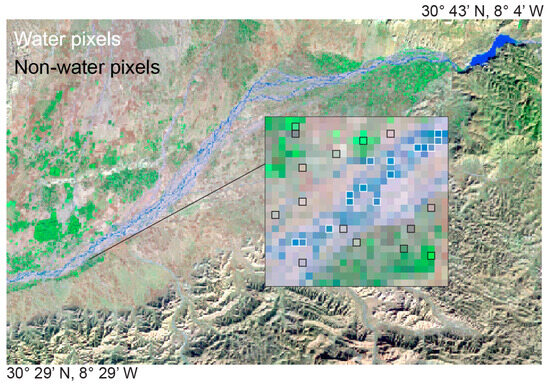
Figure 3.
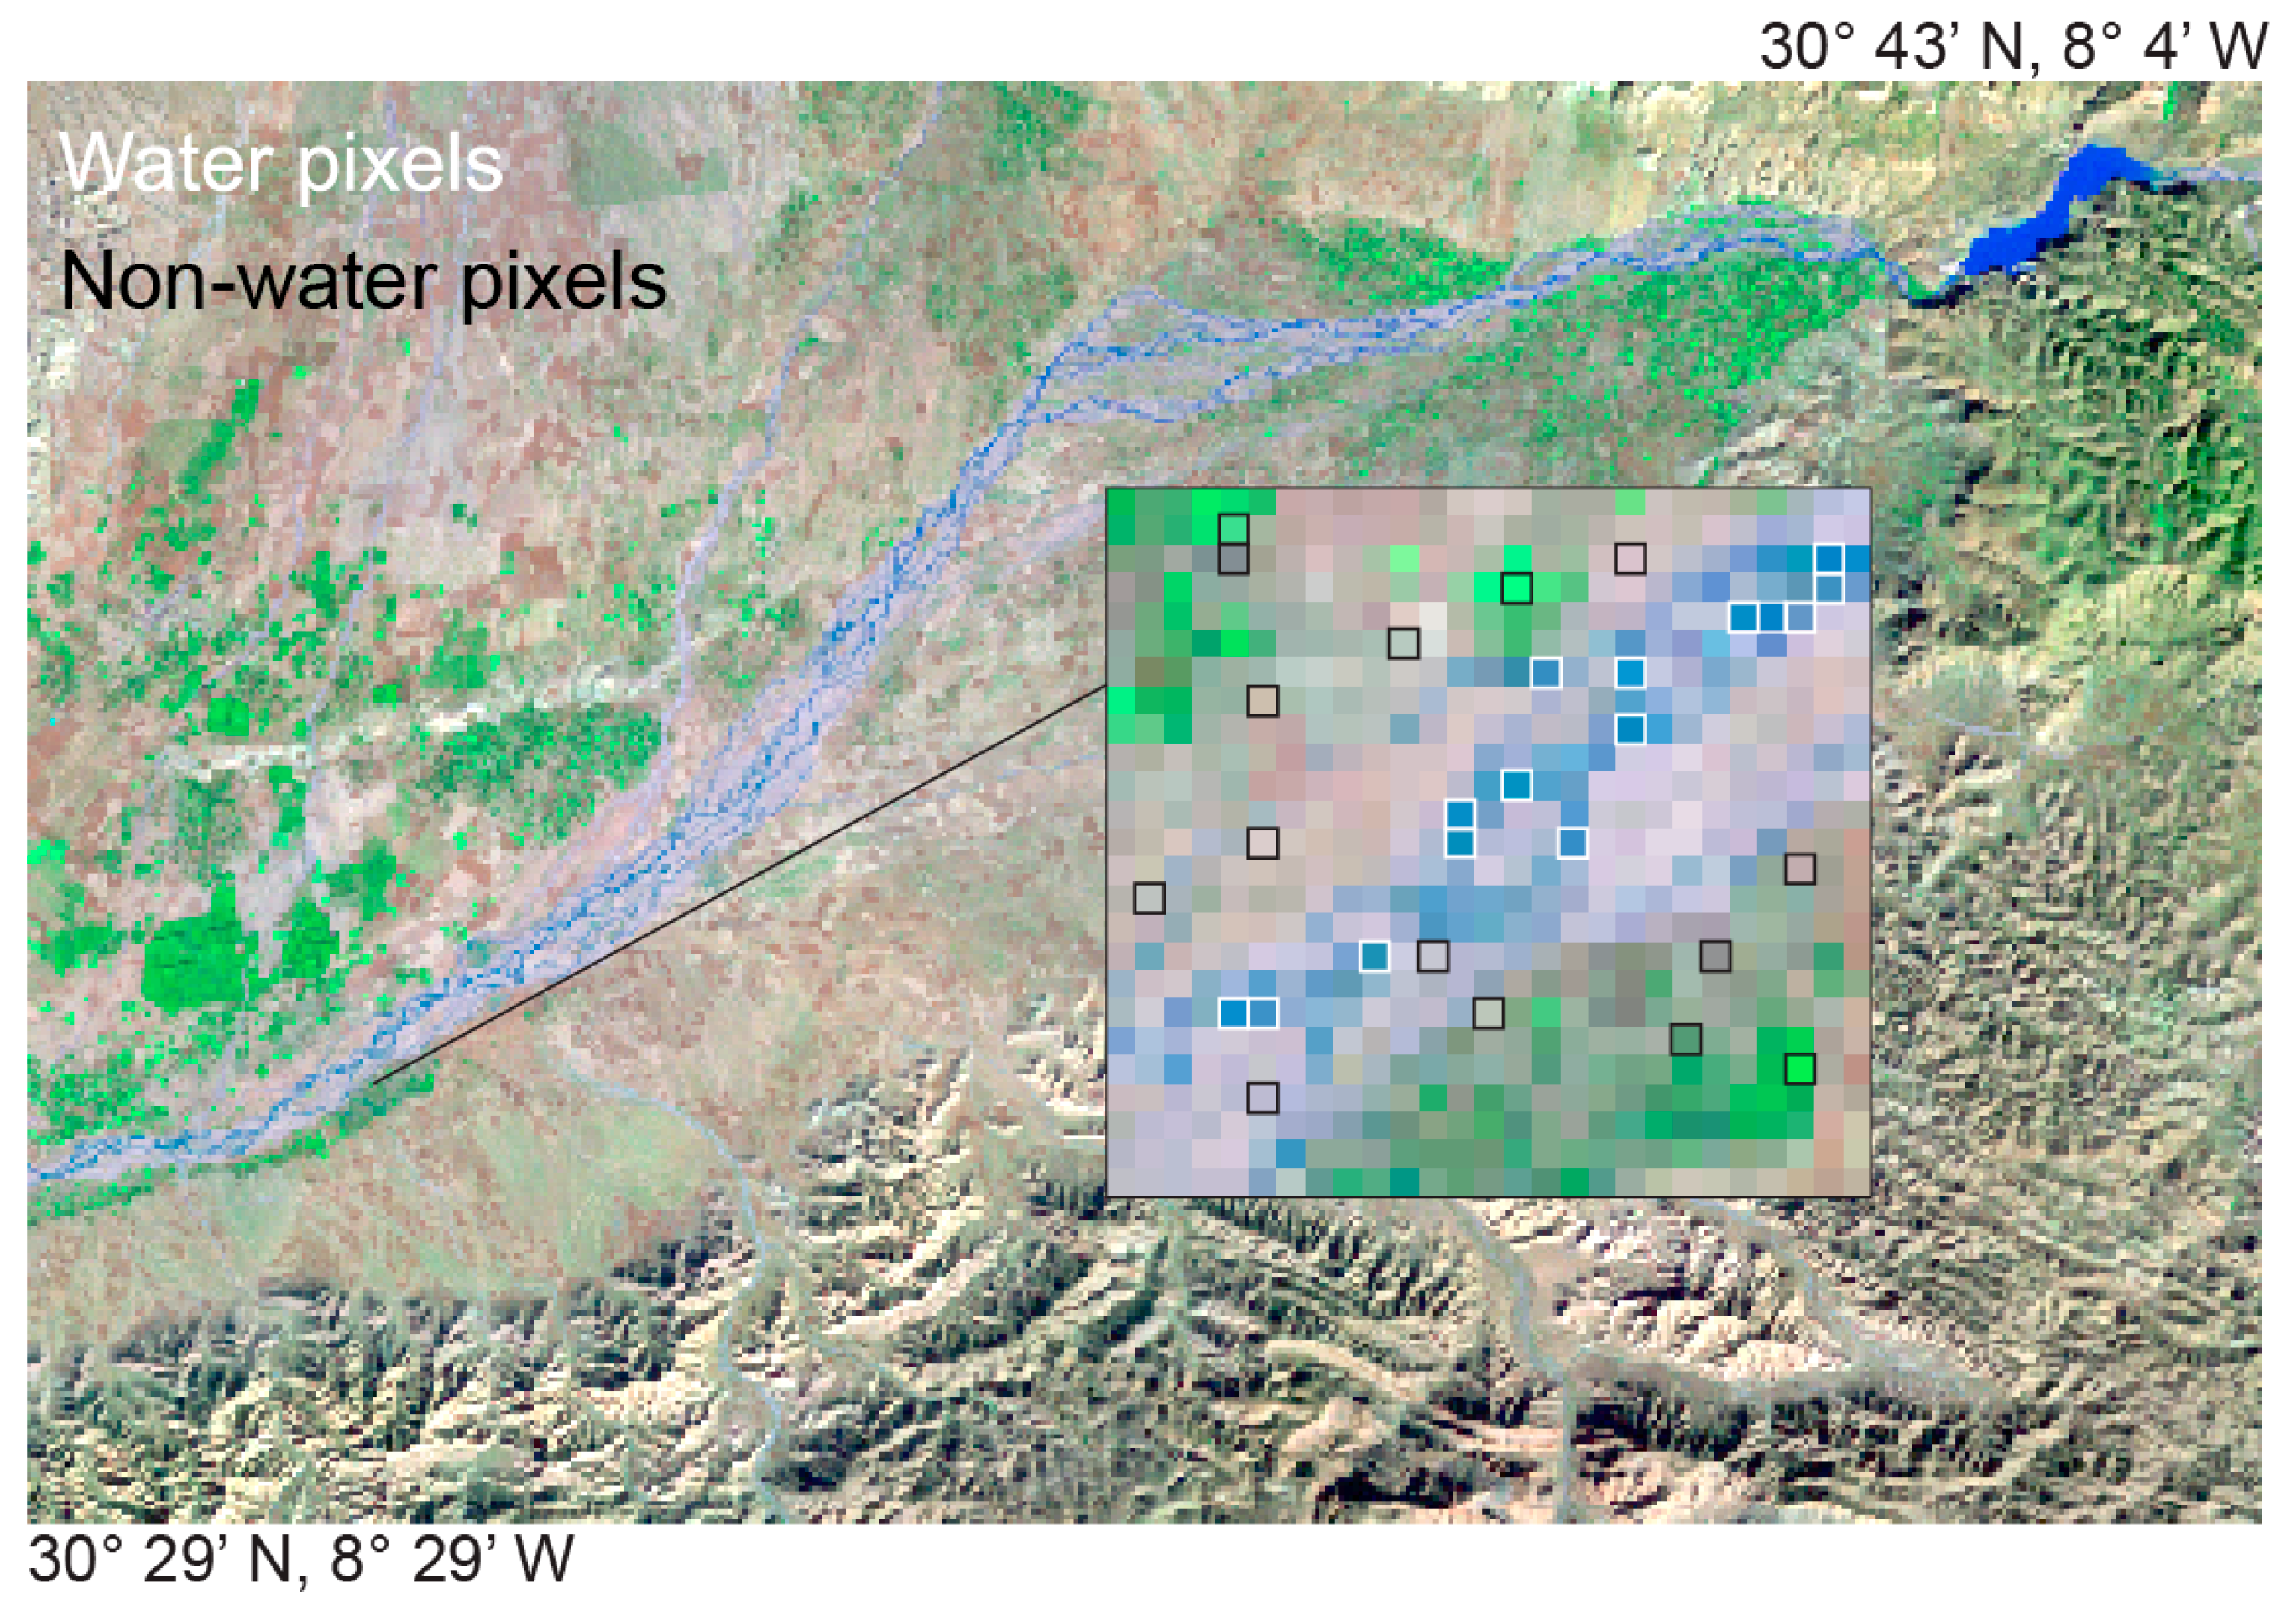
Example of water and non-water pixel selection within the training dataset. Pixels outlined in white indicate water, while pixels outlined in black indicate non-water.
2.3. Statistical Analysis
Discriminant function analysis is a statistical method used to identify known, categorical groups within unknown, continuous data. For remotely sensed images, this statistical procedure allows for a computationally simple, supervised pixel classification based on a combination of variables. Within ephemeral channels where water pixels do not closely align with those of clear and open water bodies, water pixel identification can be tailored to site-specific reflectance values across multiple bands. Discriminant function analysis provides the advantage of rapid, computationally inexpensive, and flexible classification for binary groups without overfitting, an advantage over similar machine learning classifiers such as decision trees or random forest models. Linear Discriminant Analysis (LDA) generates a linear function which maximizes the distinction between groups, in this study, water and non-water pixels [49]. This function uses the visible and near-infrared bands of each satellite as explanatory variables, producing loadings for each. Larger loadings, positive or negative, identify the bands which have the greatest impact on group determination [49,50]. For each pixel within the training dataset, group membership is determined as a classification probability. The predictive accuracy of an LDA is evaluated through a comparison of a pixel’s group classification via linear function and its known group membership [50]. This is further evaluated using jackknife validation, which generates a predictive accuracy free of resubstitution error [50]. When appropriate accuracy has been determined, an LDA is free to be applied to pixels outside of the training dataset, those with unknown group membership.
For Landsat 5 and 8, an image corresponding to a flood event within the midstream section of the ephemeral channel was visually identified in natural color and used to construct a training dataset. Water and non-water pixels were manually selected (1600 pixels per group, 3200 total) for the training dataset (Table A1). The selection prioritized pixels with clear group membership and avoided edge or mixed pixels. Using R Statistical Software (v4.1.1) and the MASS R package (v7.3–60), a separate LDA was then trained for each satellite based on the known pixel values of the training dataset [51,52]. When appropriate predictive accuracy was determined via jackknife validation, the LDA function was applied across all previously identified images for that satellite, predicting group membership for each pixel. This was then translated to a percent of water pixels per image, used to determine whether an image displays inundation or dry conditions.
As the Souss channel is predominantly dry, the majority of images are expected to display water pixel percentages near zero. Flood events represent atypical behavior in this system, resulting in significantly fewer images with elevated water pixel percentages. Surface flow has qualitatively been observed less frequently with increasing distance from source. Flood events which originate in the upstream section of the channel may extend only partially into midstream and downstream channel reaches, though this spatial variability is poorly understood. Small percentages of water pixels may be identified within images lacking surface flow as a result of either anthropogenic water storage adjacent to the channel or analysis error. Such percentages, however, are expected to be minimal due to the high predictive accuracy of both LDAs.
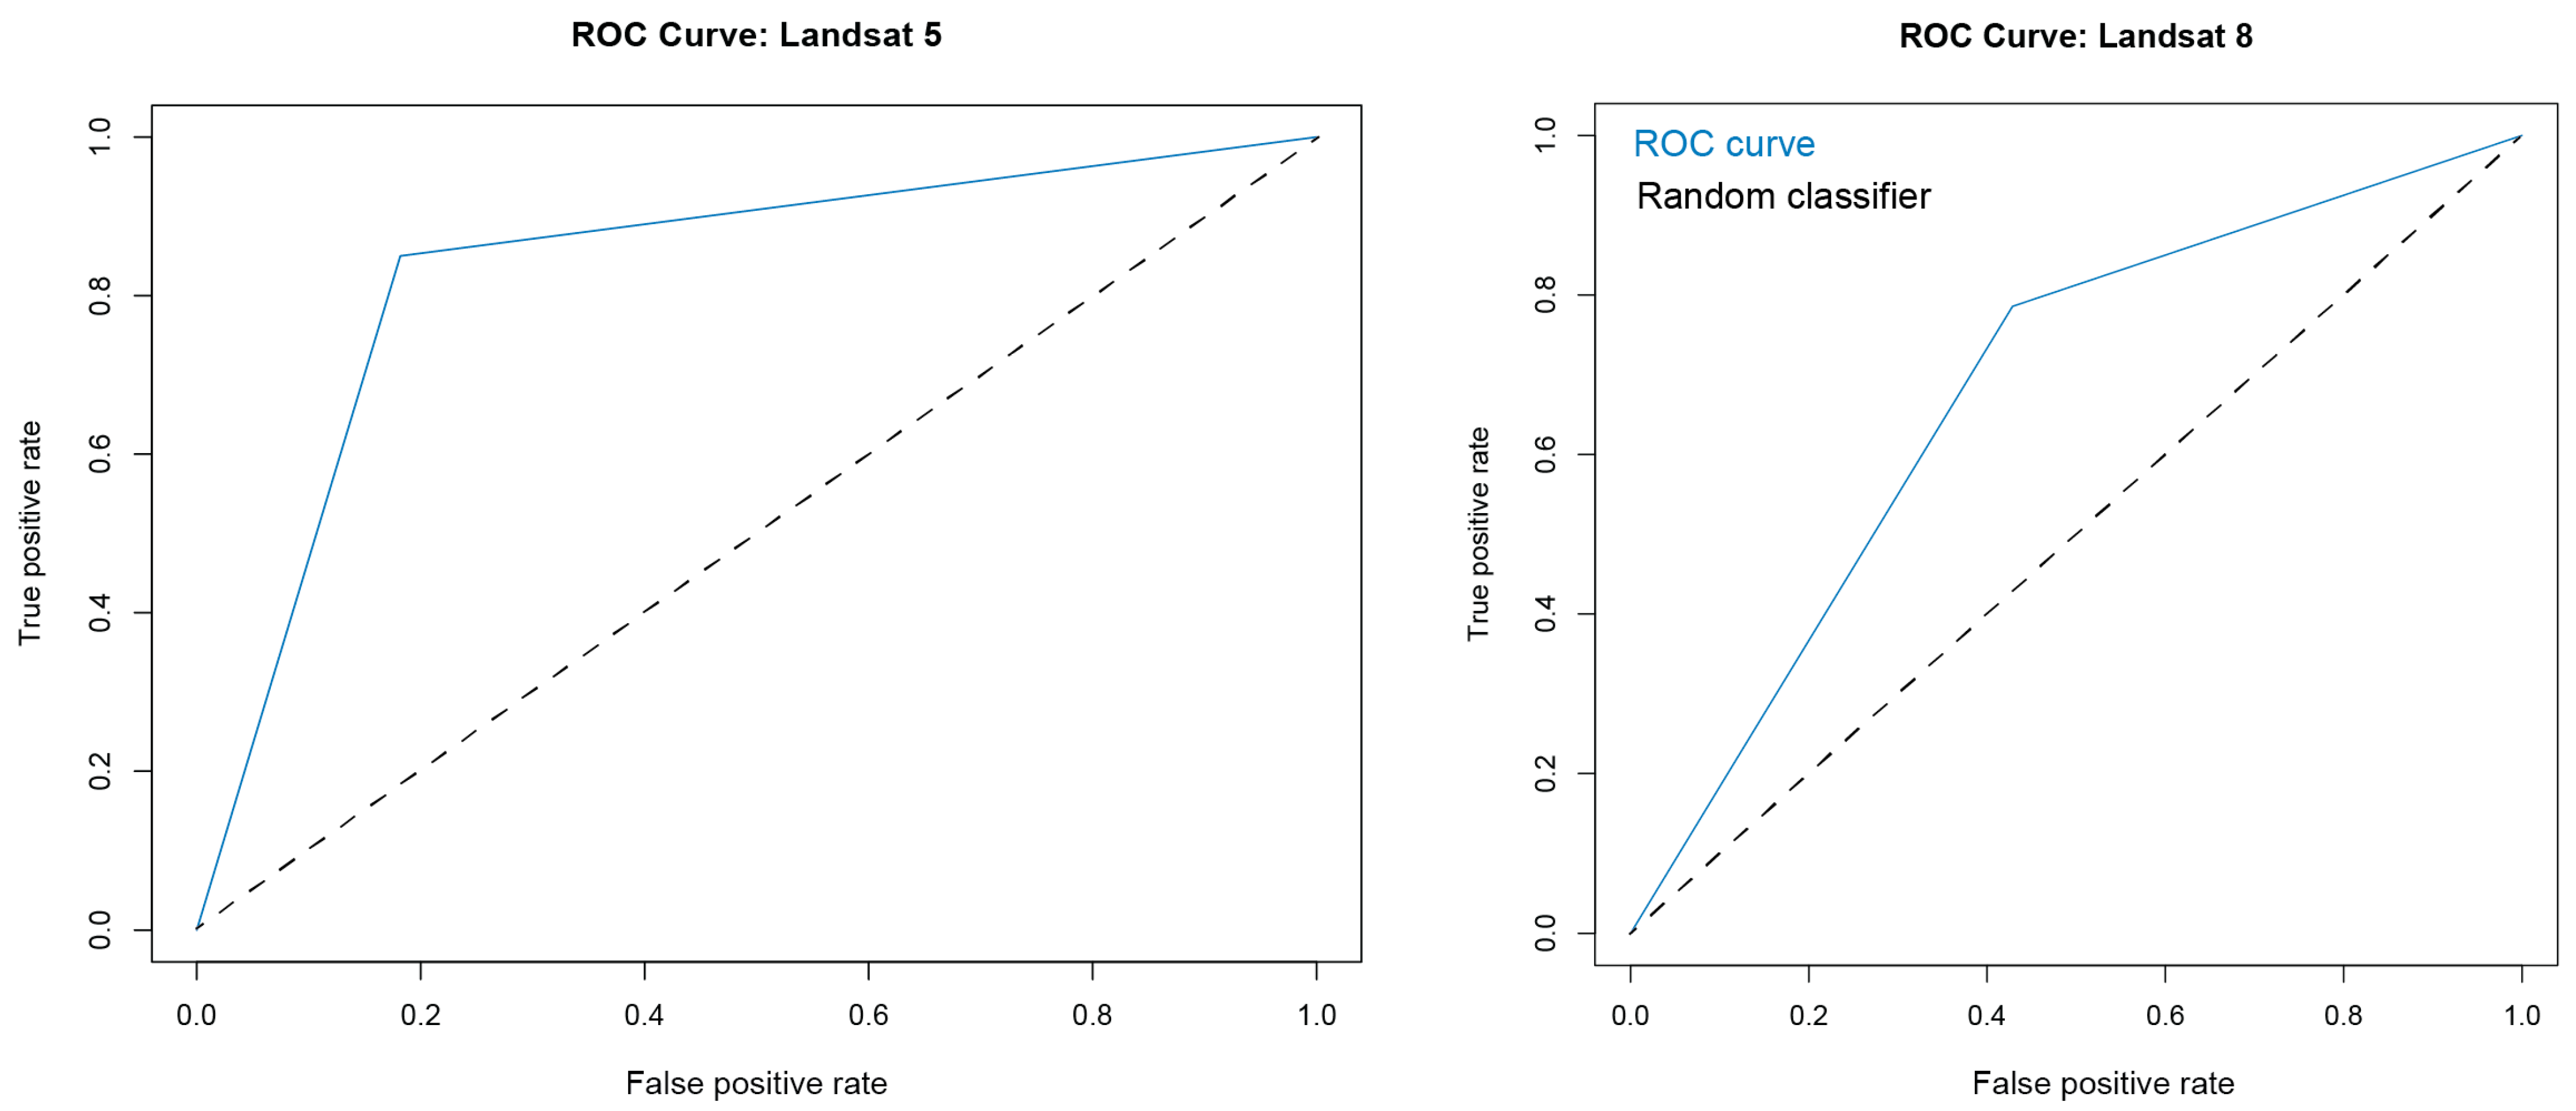
The cutoff between wet and dry channel conditions was determined via Receiver Operator Characteristic (ROC) curves, calculated for each satellite. Cutoffs aim to maximize the number of true positives, correctly identified flood events, while minimizing false positives. For each satellite, 10% of the evaluated imagery was randomly sampled and visually analyzed for inundation. Random samples maintained the same proportion of channel sections present in the evaluated imagery. ROC curves for each satellite were compared for both percentages and counts of water pixels per image to identify the cutoff value associated with the greatest sensitivity and specificity. Both percentage and counts were included to explore a greater number of classification thresholds in the random subsample. For Landsat 5, images with greater than 0.55% water pixels were determined to represent flood conditions within the channel (TPR = 0.85, FPR = 0.18). For Landsat 8, images with more than 1200 pixels were identified as flood conditions (TPR = 0.71, FPR = 0.24) (Figure 4).
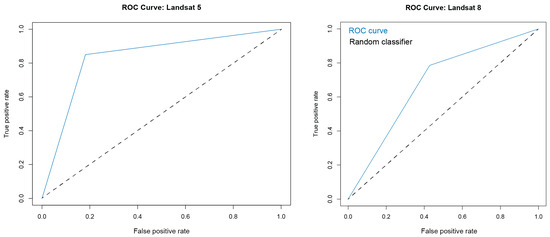
Figure 4.
ROC curves for Landsat 5 and Landsat 8 flood cutoffs. ROC curves for both counts and water pixel percentages were compared for each satellite. For all satellites, the majority of images have water pixel values which cluster near zero percent. This is consistent with our understanding of a default dry channel, with intermittent periods of surface flow.
The Landsat 7 satellite sustained a failure in its scan line corrector in mid-2003, resulting in a scan line error and artifact within the subsequent imagery. As a result, the number of pixels per image was reduced by approximately 20% [53]. This artifact further significantly increased the number of edge pixels per image, pixels in which one or more bands lack a value. Due to these errors, use of Landsat 7 imagery was minimized to only the temporal period not covered by Landsat 5 and Landsat 8, December 2011 through April 2013. As a result, the small number of available images eliminates the need for automated image classification and instead enables visual analysis of flood presence. Additionally, the inconsistent exclusion of band values within the edge pixels is poorly suited for LDA construction and application, as this method assumes an equal number of variables within all cases.
2.4. Validation
Within the Souss–Massa basin, precipitation gauging is limited and temporally variable. Gauges are further poorly spatially distributed and concentrated in the midstream and downstream sections of the channel, despite higher precipitation in channel uplands [46]. Due to its ephemeral nature, antecedent precipitation is considered necessary for surface flow within the Souss basin. Satellite-based precipitation estimates thus may serve as a tool to validate flood presence. NASA and JAXA TRMM-TMPA (Daily Accumulated Precipitation, TRMM-3B42 V7) and GPM-IMERG (Daily Accumulated Precipitation—Final Run V06) products were used for validation of channel inundation from January 1998 through August 2021. Estimates from the TRMM-TMPA satellite were used from 1998 to 1999, while 2000 to 2021 utilizes the GPM-IMERG algorithm which fuses TRMM and GPM estimates across the overlap period from 2000 to 2015. Precipitation estimates were aggregated into a cumulative total precipitation across the seven-day period prior to a satellite image. Estimates of less than 10 mm per seven-day period were excluded, as previous work has identified elevated error in estimation of light precipitation events, including false precipitation [54].
The utility of the TRMM product for precipitation estimates across Morocco has demonstrated accuracy at elevations less than 1000 m [12,55]. This is in line with global observations of reduced estimate accuracy over variable topography. Within the Souss–Massa basin, TRMM-TMPA was found to provide accurate estimates of daily precipitation, outperforming similar precipitation estimates (CHIRPS, and PERSIANN) when compared to in situ measurements [46]. Precipitation estimates were further improved with the launch of the GPM satellite in 2014, equipped with a dual-frequency precipitation radar capable of better distinguishing the light precipitation events characteristic of arid environments [56]. Evaluation of GPM estimate accuracy in a mountainous Moroccan basin found strong agreement with observed precipitation, improved in lower elevation sections of the basin [56]. Though GPM-IMERG Final Run is regarded as a research-level product, it is important to note the potential for introduced biases from retrospective processing [57]. Research focused on the resampled period (2000–2015), however, found suitable accuracy at the daily scale, with increased accuracy moving from 2001 to 2018 through the addition of passive microwave samples [57]. Studies in arid environments further indicate GPM-IMERG Final Run suitability for precipitation estimates [58].
Following flood validation, Mann–Kendall trend analysis was applied to identify statistically significant monotonic trends in flood events across the time period. Trend analysis was explored at monthly, seasonal, and annual flood occurrence aggregations across individual and grouped channel sections.
3. Results
3.1. LDA Training
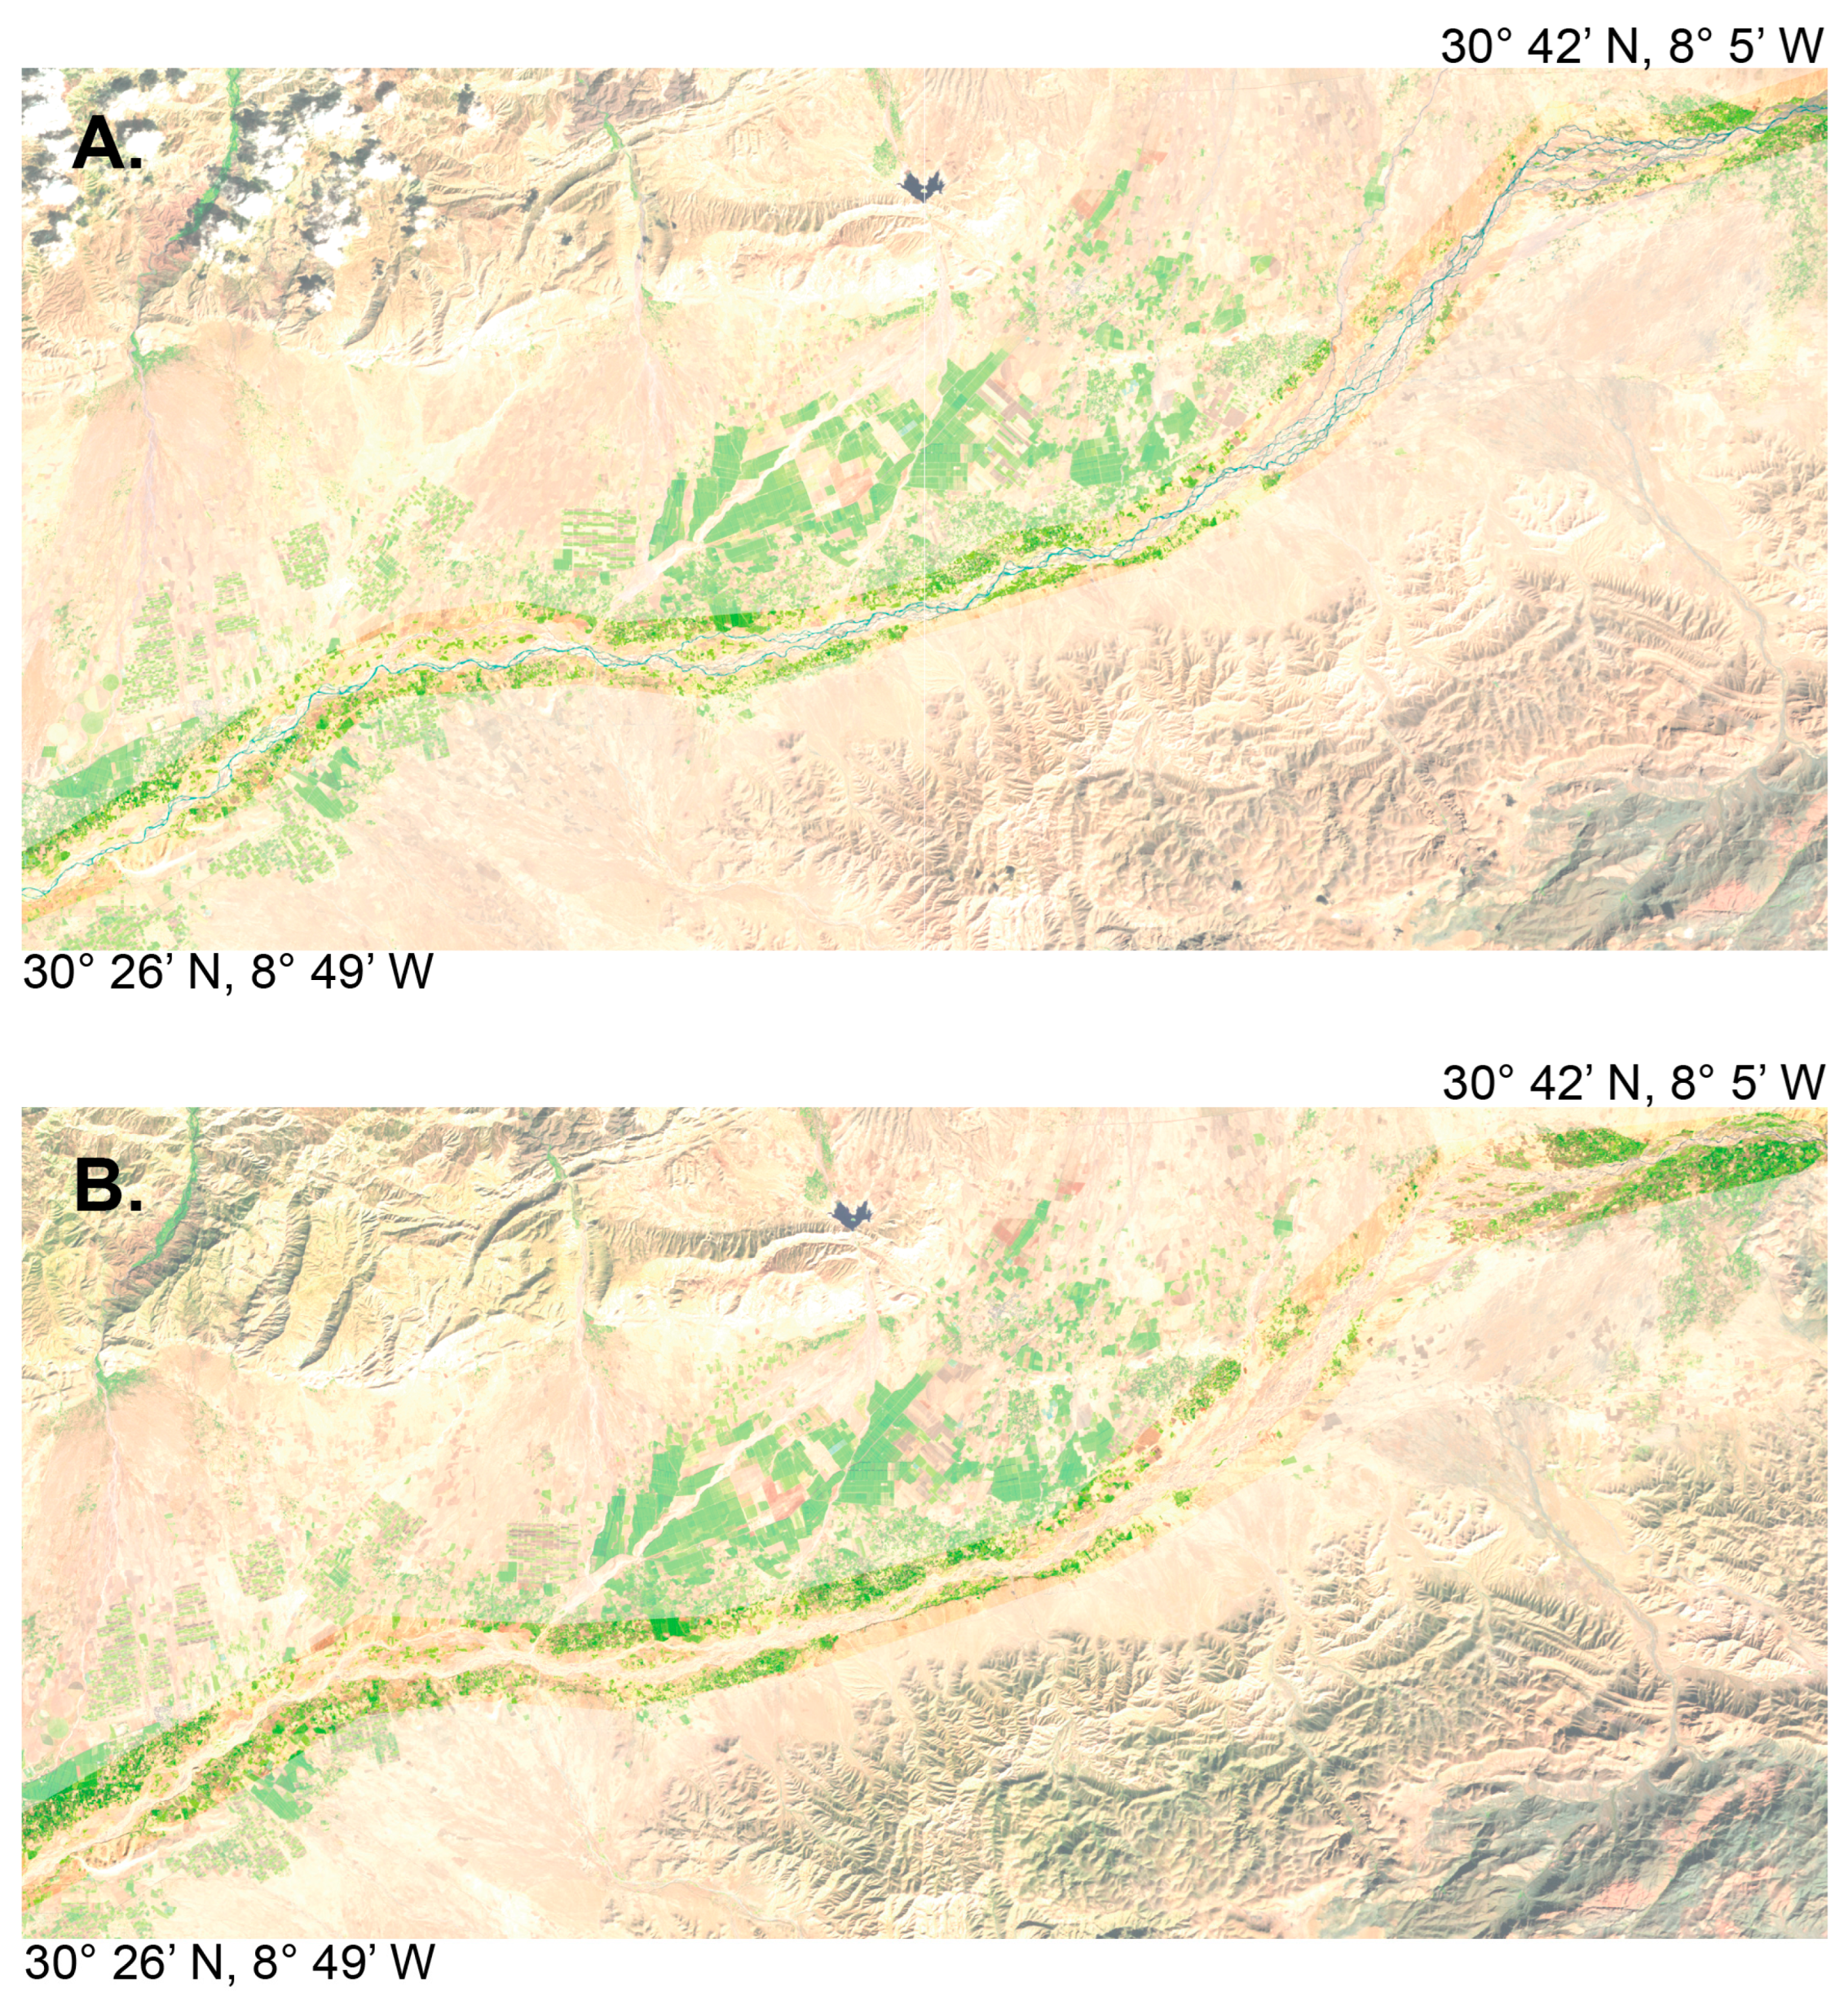
The Landsat 5 LDA was trained on the midstream section of a flood image from 30 September 1997 (Figure 5). This LDA has high predictive accuracy when applied to the training dataset, with 100% accuracy in group classification with and without jackknife validation (Table 2). The resulting LDA demonstrates similar classification success when applied to unknown pixels in images with and without channel flooding (Table 2). Plotted, this LDA supports distinct group classification without overlap, with loadings that indicate that the Red (0.63–0.69 μm) and SWIR 2 (2.08–2.35 μm) bands have the greatest influence on the linear function (Table 3) (Figure 6).
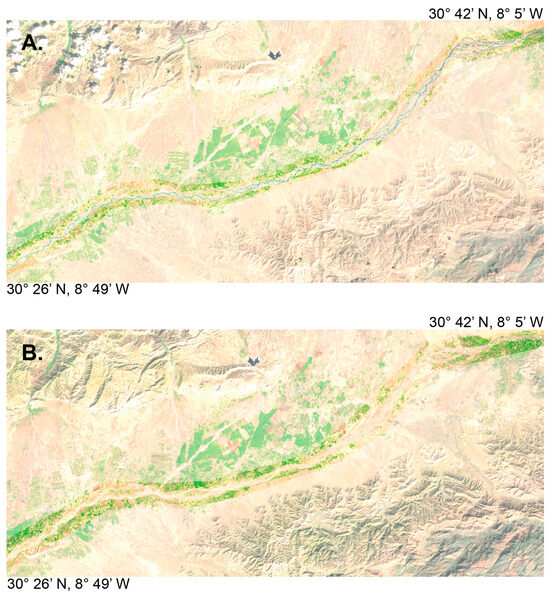
Figure 5.
(A) Landsat 5 image of a midstream channel flood, 30 September 1997. (B) Landsat 5 image of midstream channel without surface flow, 17 November 1997.
Table 2.
Predictive accuracies calculated for the training dataset used to construct the LDA. Both achieve 100% accuracy in classifying test pixels correctly into the two groups. Classification was then tested on unknown pixels within a flood and non-flood image in the midstream channel region. The classifier correctly infers a much greater number of water pixels (5.80% vs. 0.20%) in the flood image.
Table 3.
Landsat 5 LDA loadings. Bolded values signify bands which have the greatest contribution.
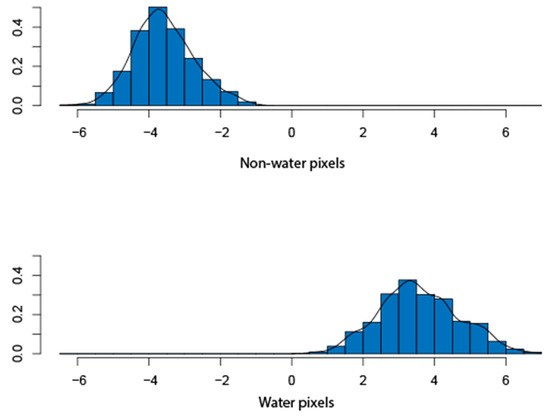
Figure 6.
Graphical distribution of Landsat 5 discriminant function analysis for water vs. non-water pixels. Lack of overlap, as well as tight within-group pixel distribution indicates strong group separation and a successful LDA.
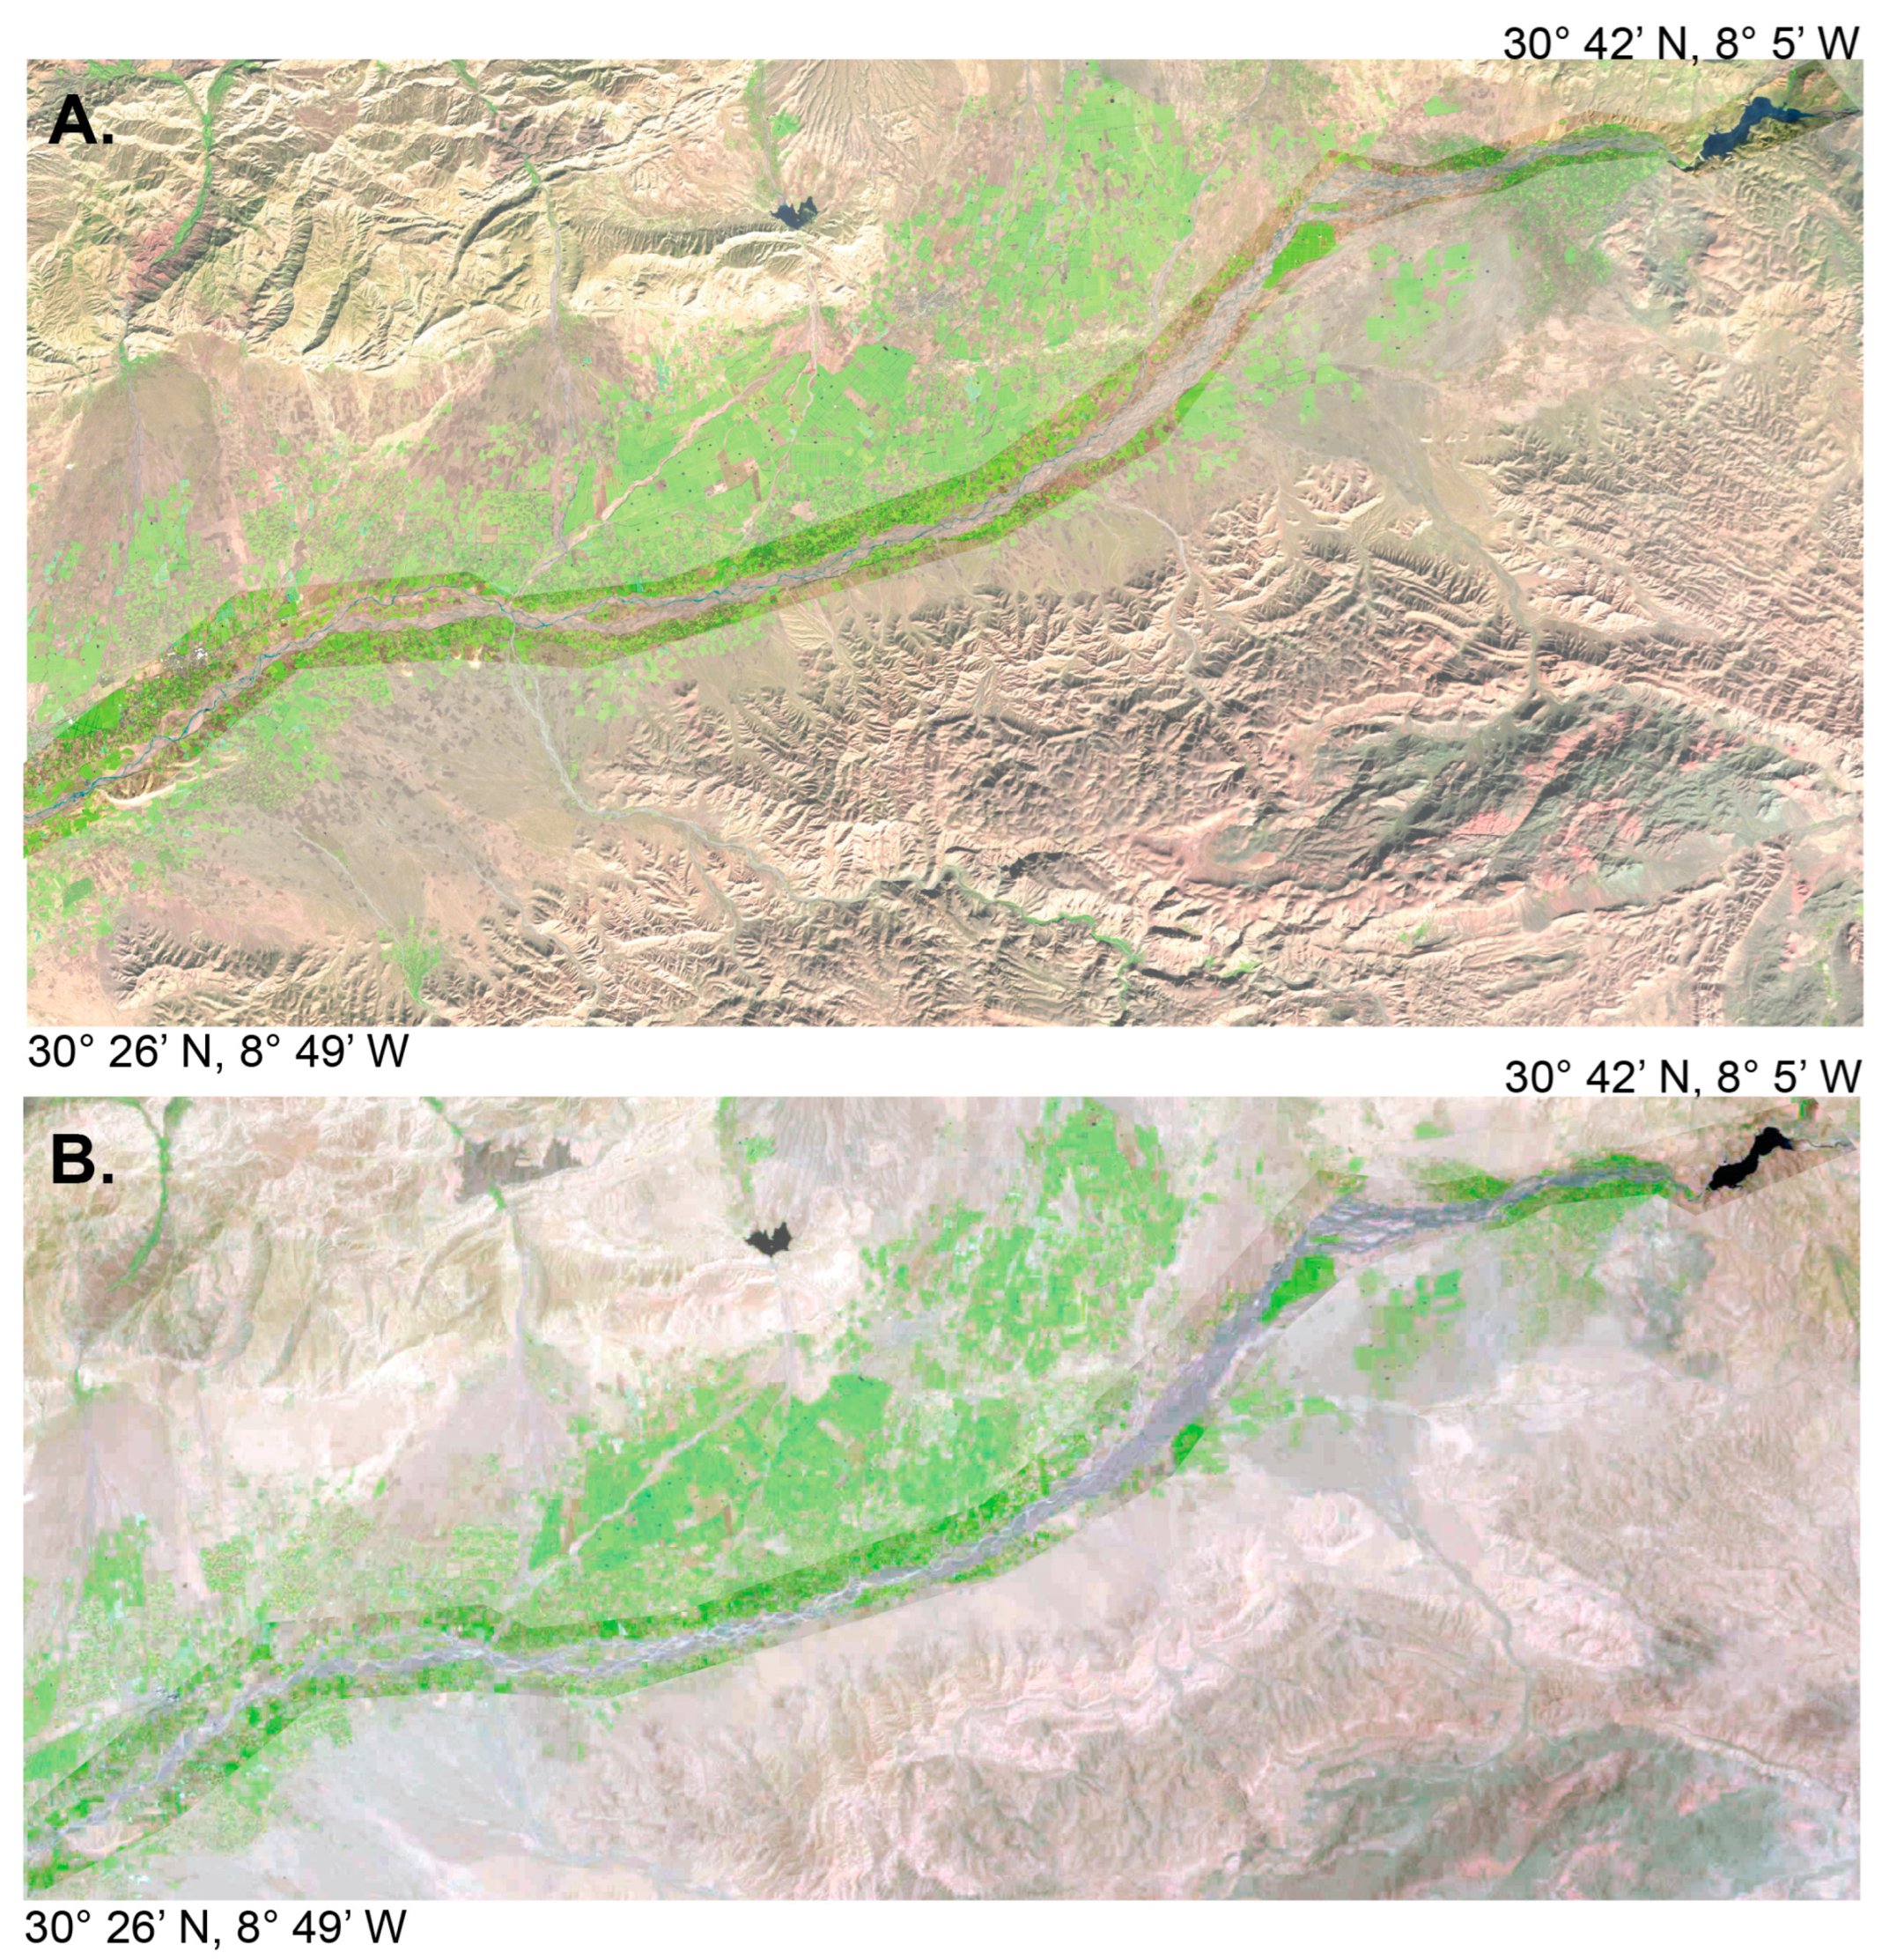
The Landsat 8 LDA was constructed using a midstream flood image from 7 December 2016 (Figure 7). High predictive accuracy was achieved with the training dataset, yielding a 98.13% and 98.75% accuracy for the water and non-water pixels, respectively (Table 4). This LDA demonstrates successful group classification with minimal overlap, with loadings which identify the Blue (0.45–0.51 μm) and Coastal aerosol bands (0.43–0.45 μm) as most significant to the discriminant function (Table 5) (Figure 8). Application to unknown pixels within flood and non-flood images (12 July 2016 and 16 July 2016, respectively) align with these observations; water pixels are predicted to comprise 11.68% of the flood image and 0.71% of the non-flood image (Figure 7) (Table 4).

Figure 7.
(A) Landsat 8 image of a channel flood across the midstream section, 7 December 2016. (B) Landsat 8 image without surface flow, midstream section, 16 July 2016. Images were used for testing LDA classification on unknown pixels.
Table 4.
Predictive accuracies calculated for the training dataset of the Landsat 8 DFA. Both achieve near 100% accuracy in classifying the pixels correctly into the two groups. Classification testing of water pixel predictions for flood vs. non-flood images successfully identified higher water pixel percentages with known water presence (11.68% vs. 0.71%).
Table 5.
Landsat 8 LDA loadings. Bolded values signify bands with the greatest contribution.
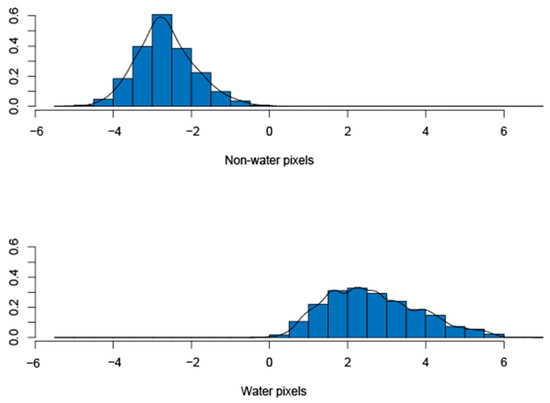
Figure 8.
Graphical depiction of group classification for Landsat 8 LDA, indicating successful delineation with minimal overlap.
Due to the scan line artifact and minimal imagery spanning from December 2011 through April 2013, Landsat 7 imagery was visually analyzed. With only 14 images in the upstream and midstream sections, respectively, and six images in the downstream section, only one upstream image displayed channel surface flow (26 March 2013). This Landsat 7 flood image was assigned a value of 5.01% water pixels, the average water pixel percent for Landsat 5 and Landsat 8 upstream flood imagery.
3.2. Modified NDWI Comparison
Predictions from the LDA pixel classifications were compared to a widely accepted and commonly used classification index, the Modified Normalized Difference Water Index (modified NDWI) [23]. Developed to minimize built-up land noise in water pixel extraction, the modified NDWI has proven successful in open water delineation through the use of the SWIR and green bands [23]. It has been further shown to effectively identify turbid water bodies, a feature particularly suited to ephemeral channels [23]. The modified NDWI was applied to the Landsat 5 and 8 LDA training datasets, as well as flood and non-flood test imagery. Using the commonly applied threshold of zero, positive values are characterized as water pixels, while zero and negative values are considered land [23]. Across both the Landsat 5 and 8 LDAs, the modified NDWI proved to be less sensitive in its identification of water pixels, misclassifying 9.38% (Landsat 5) and 98.06% (Landsat 8) of the training dataset’s water pixels as non-water (Table 6). In contrast, the index had high accuracy in identification of non-water pixels, with 100% (Landsat 5) and 99.94% (Landsat 8) non-water pixels correctly classified. For both satellites, the modified NDWI leaned heavily toward over classification of land pixels while failing to identify observed water. This further supports our concern that commonly utilized water classification indices may be poor classifiers of the water features within ephemeral channels, failing to accurately quantify water presence in these systems.
Table 6.
Comparison of Landsat 5 and 8 LDA classifications to modified NDWI.
3.3. Validation
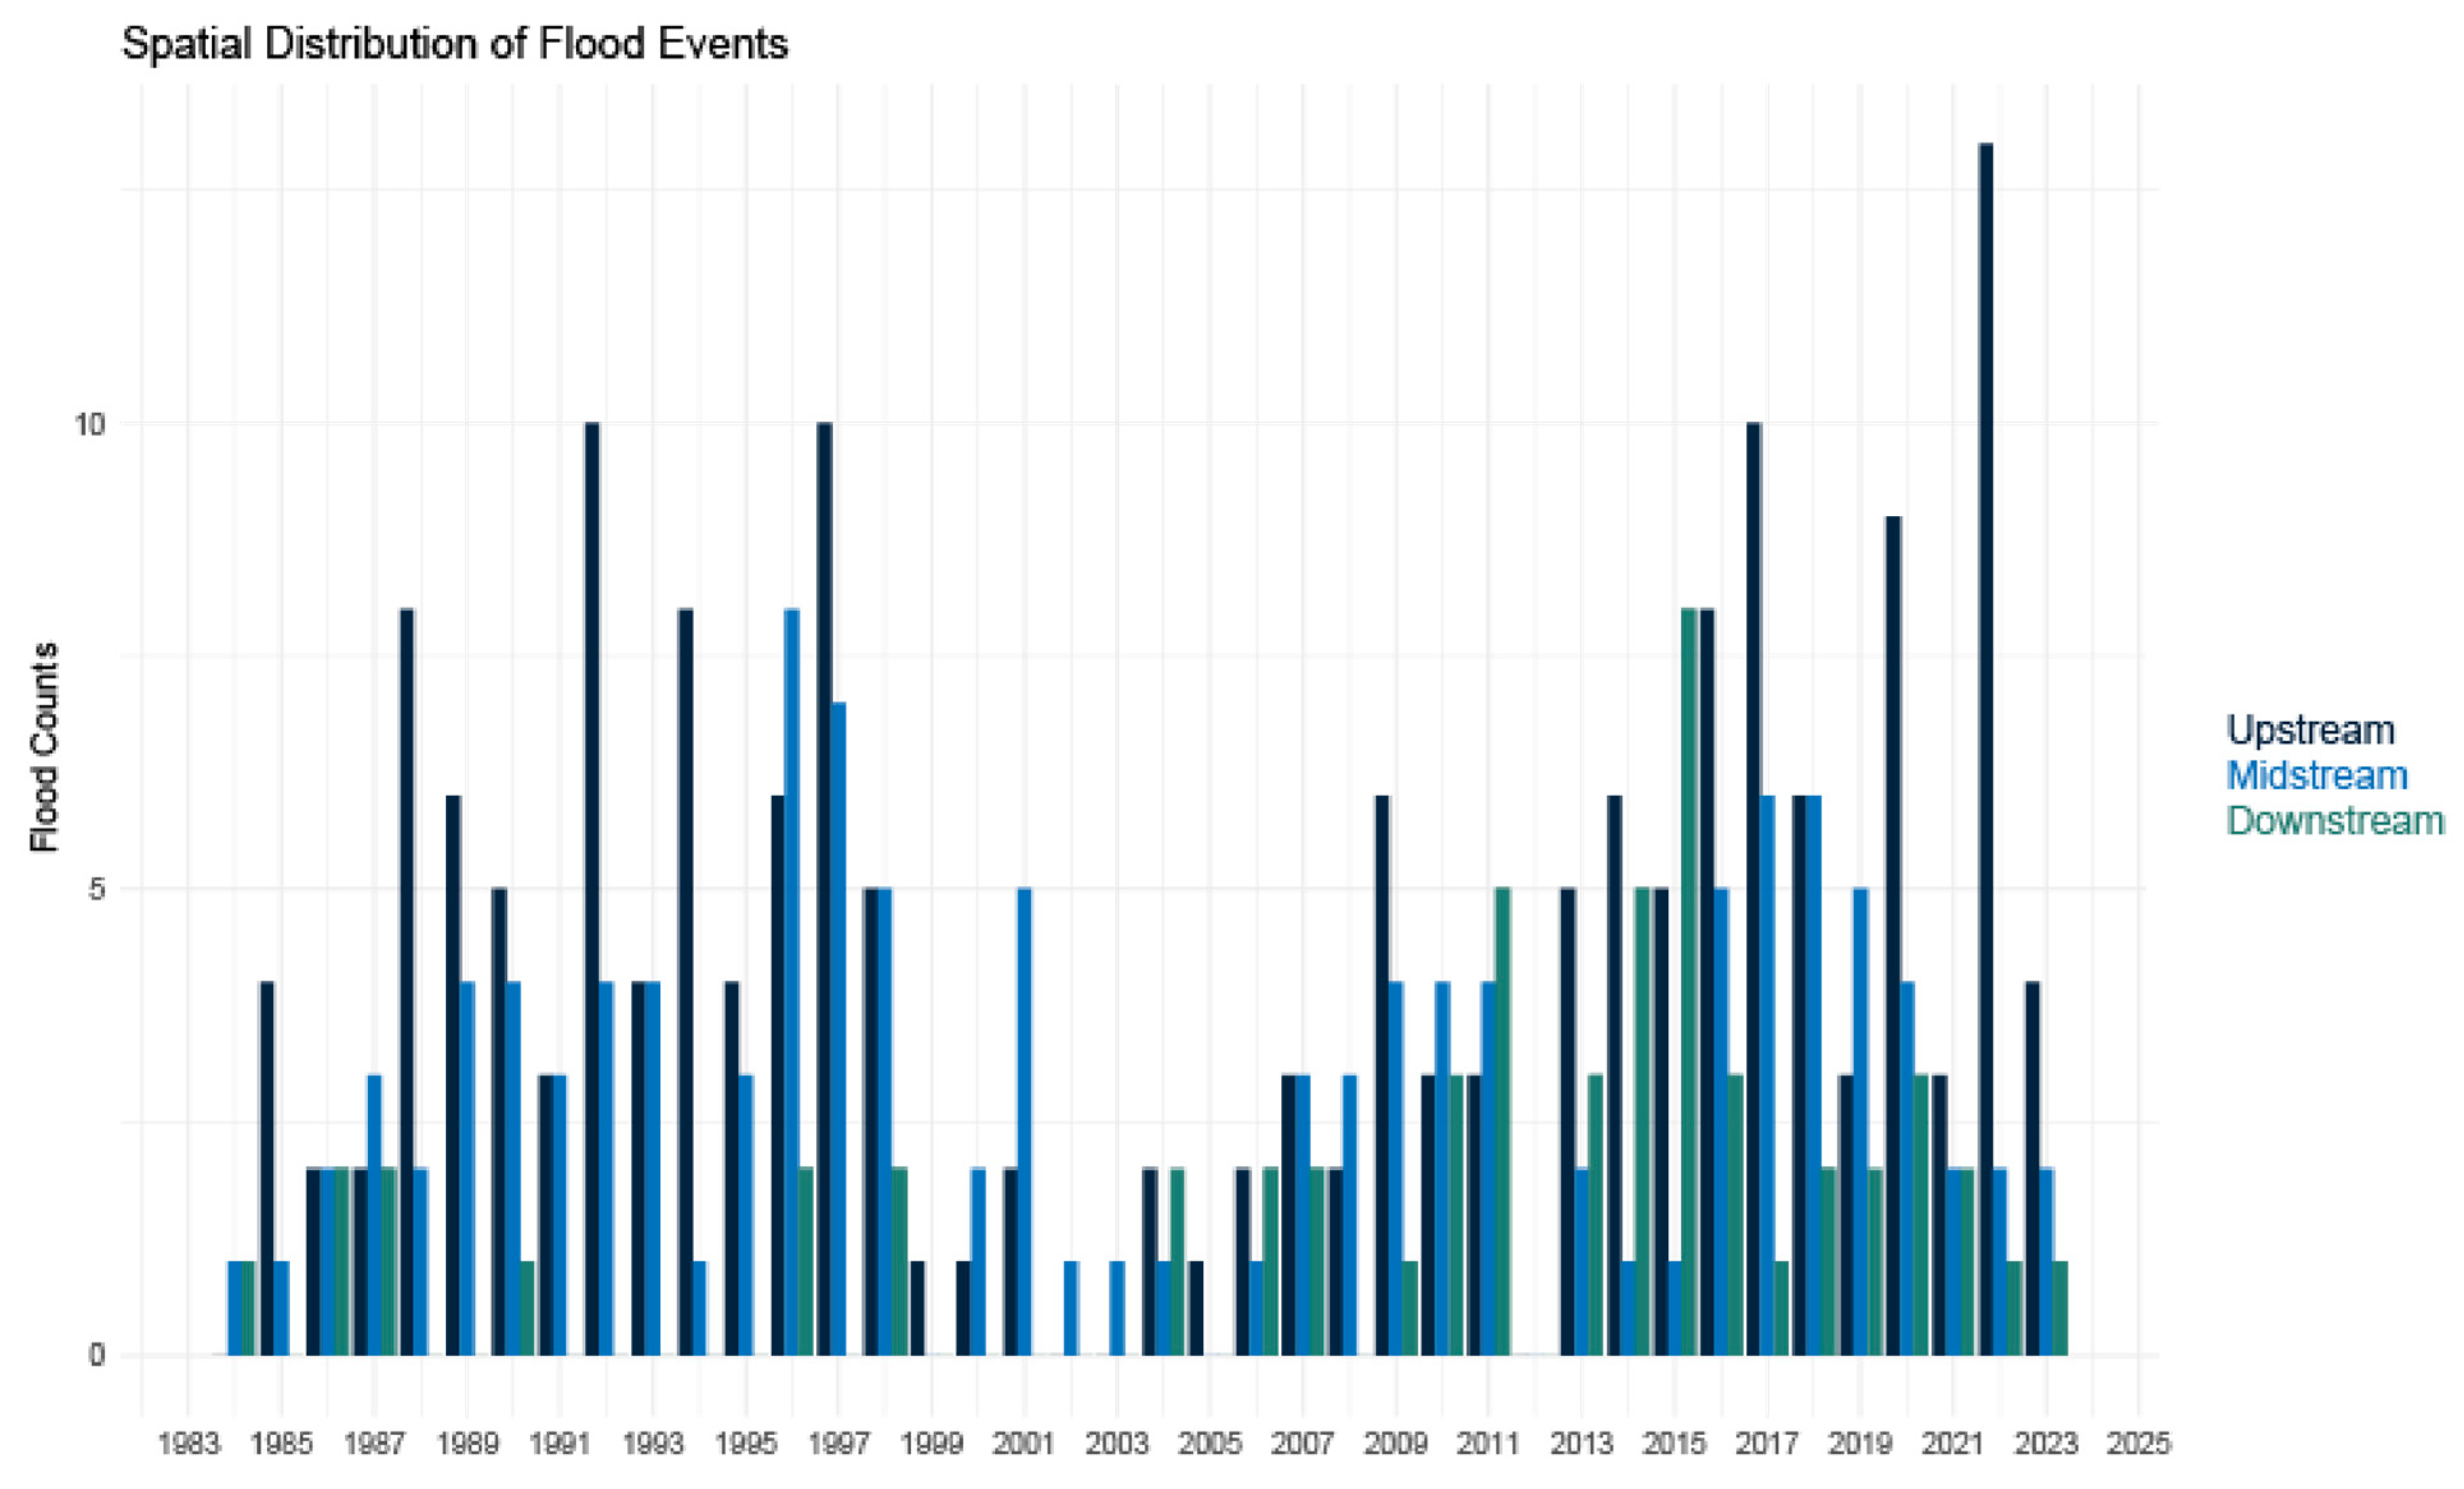
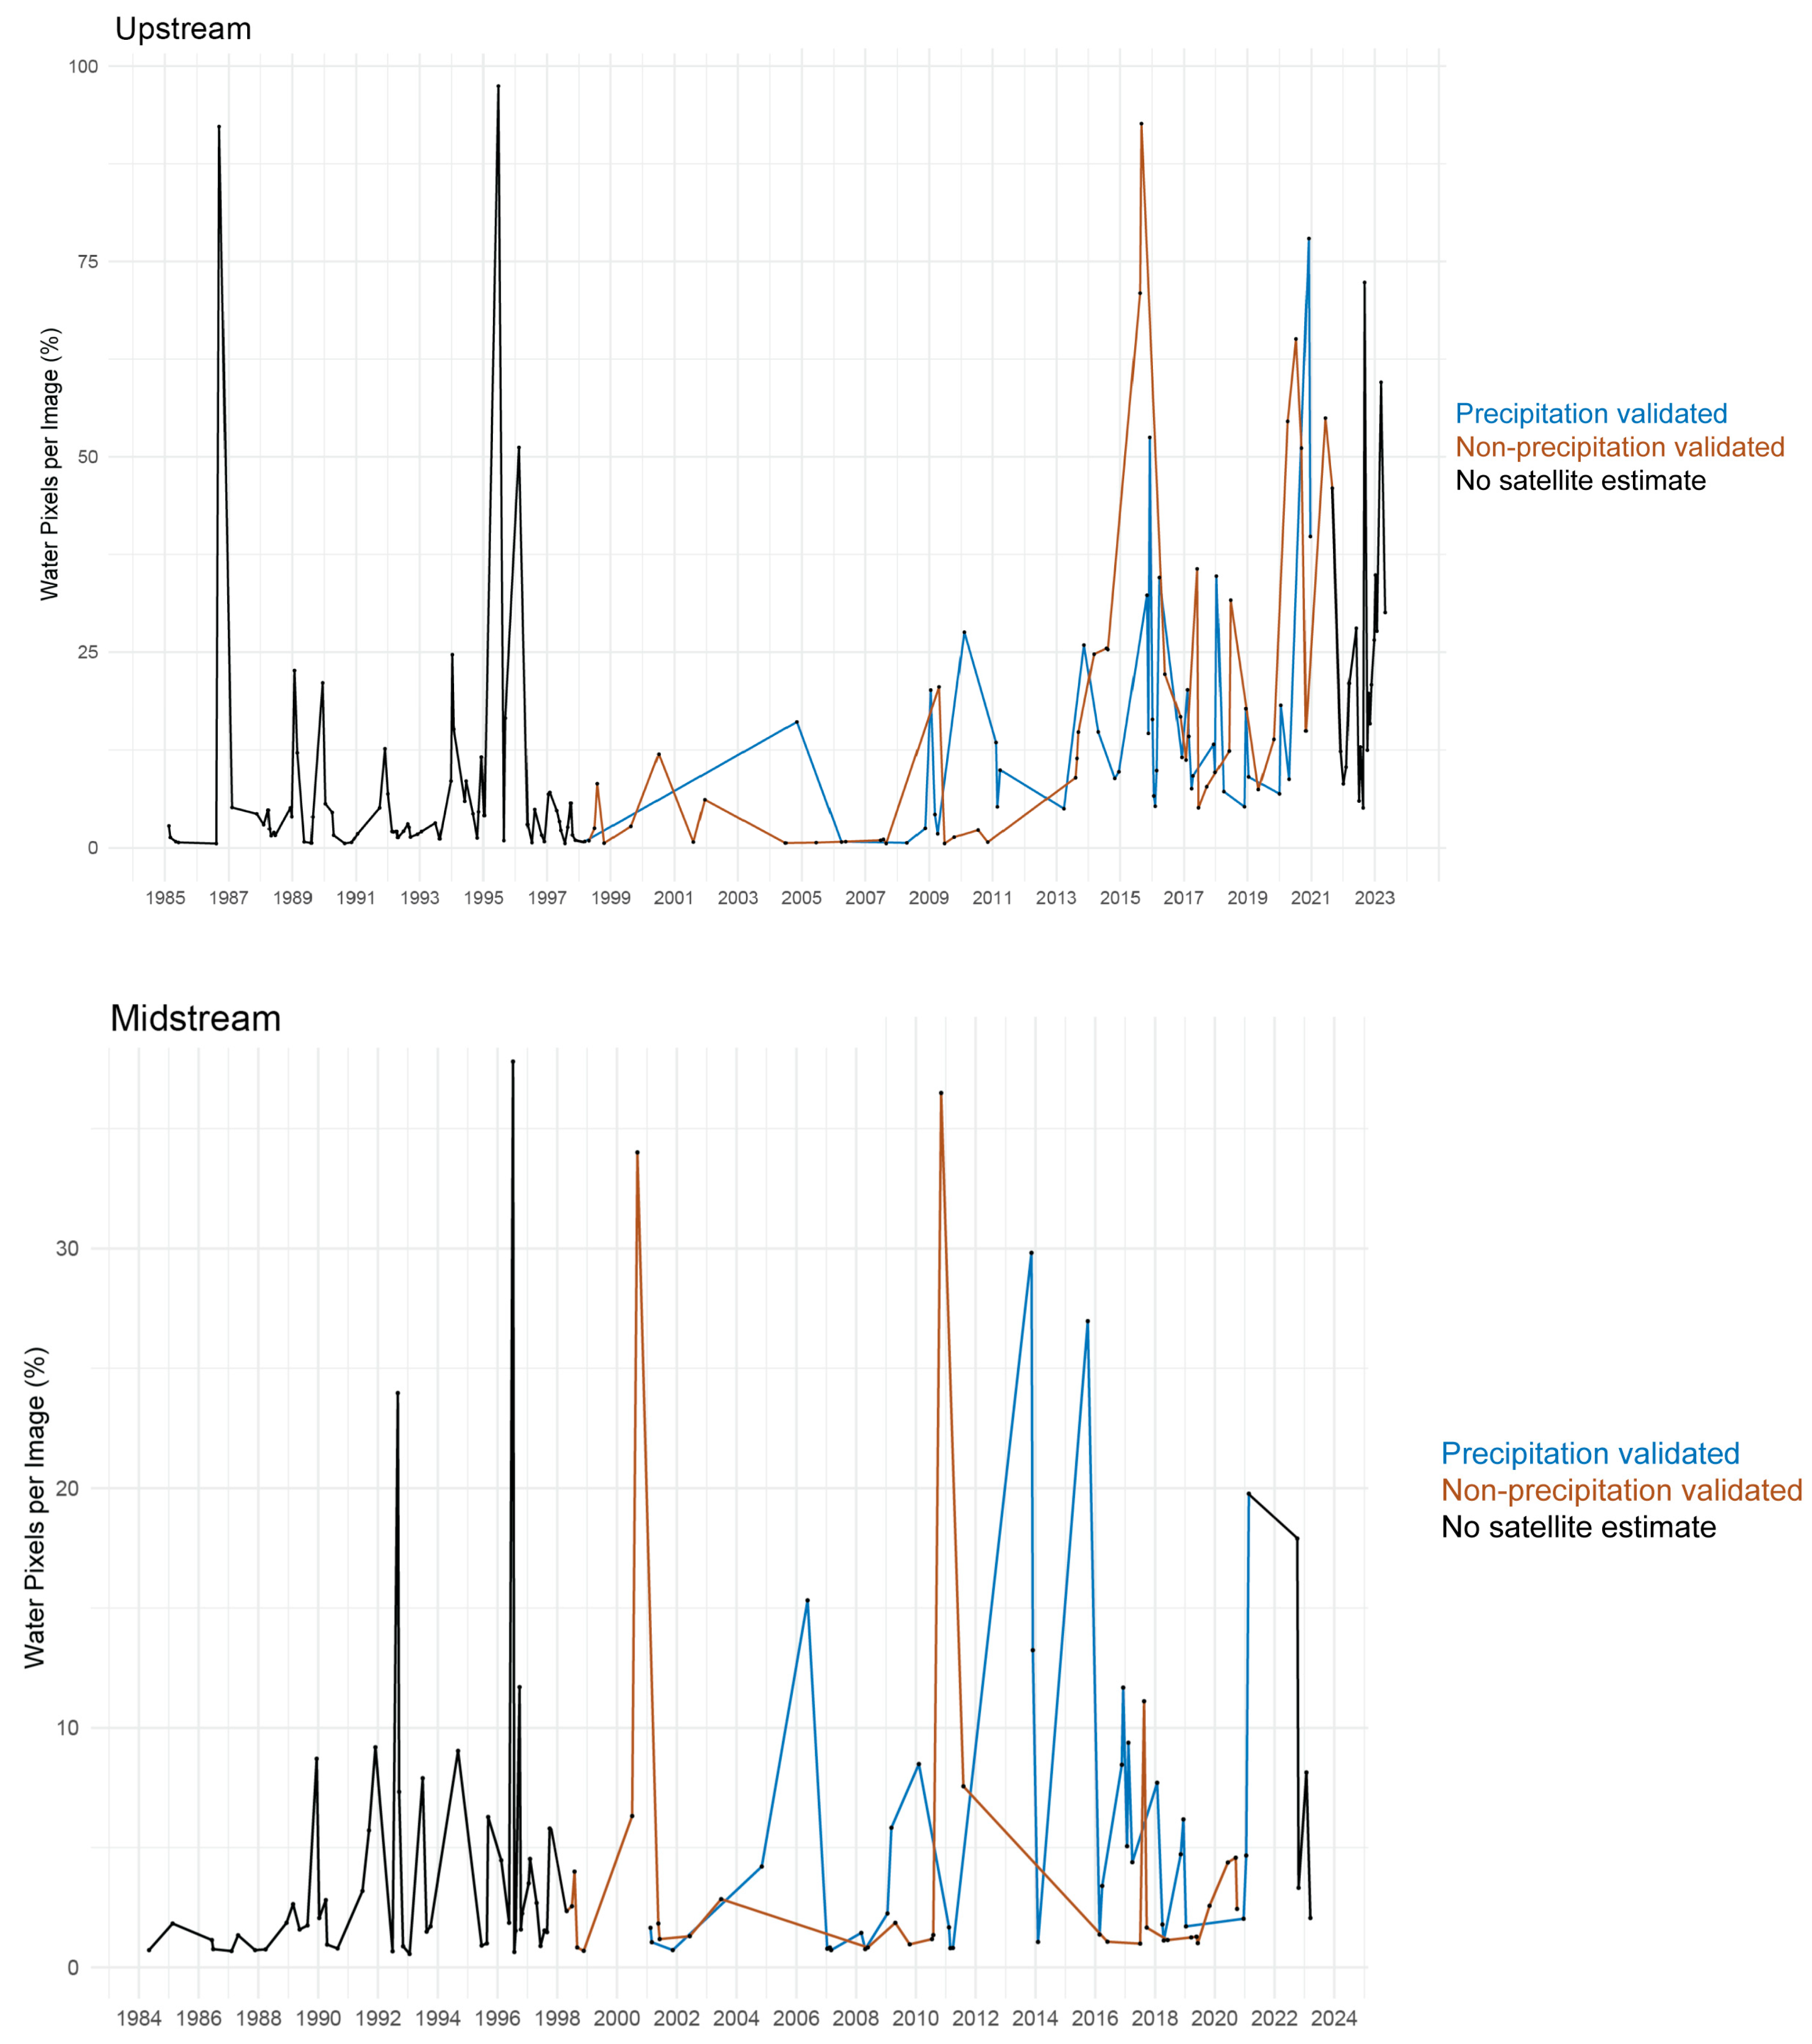
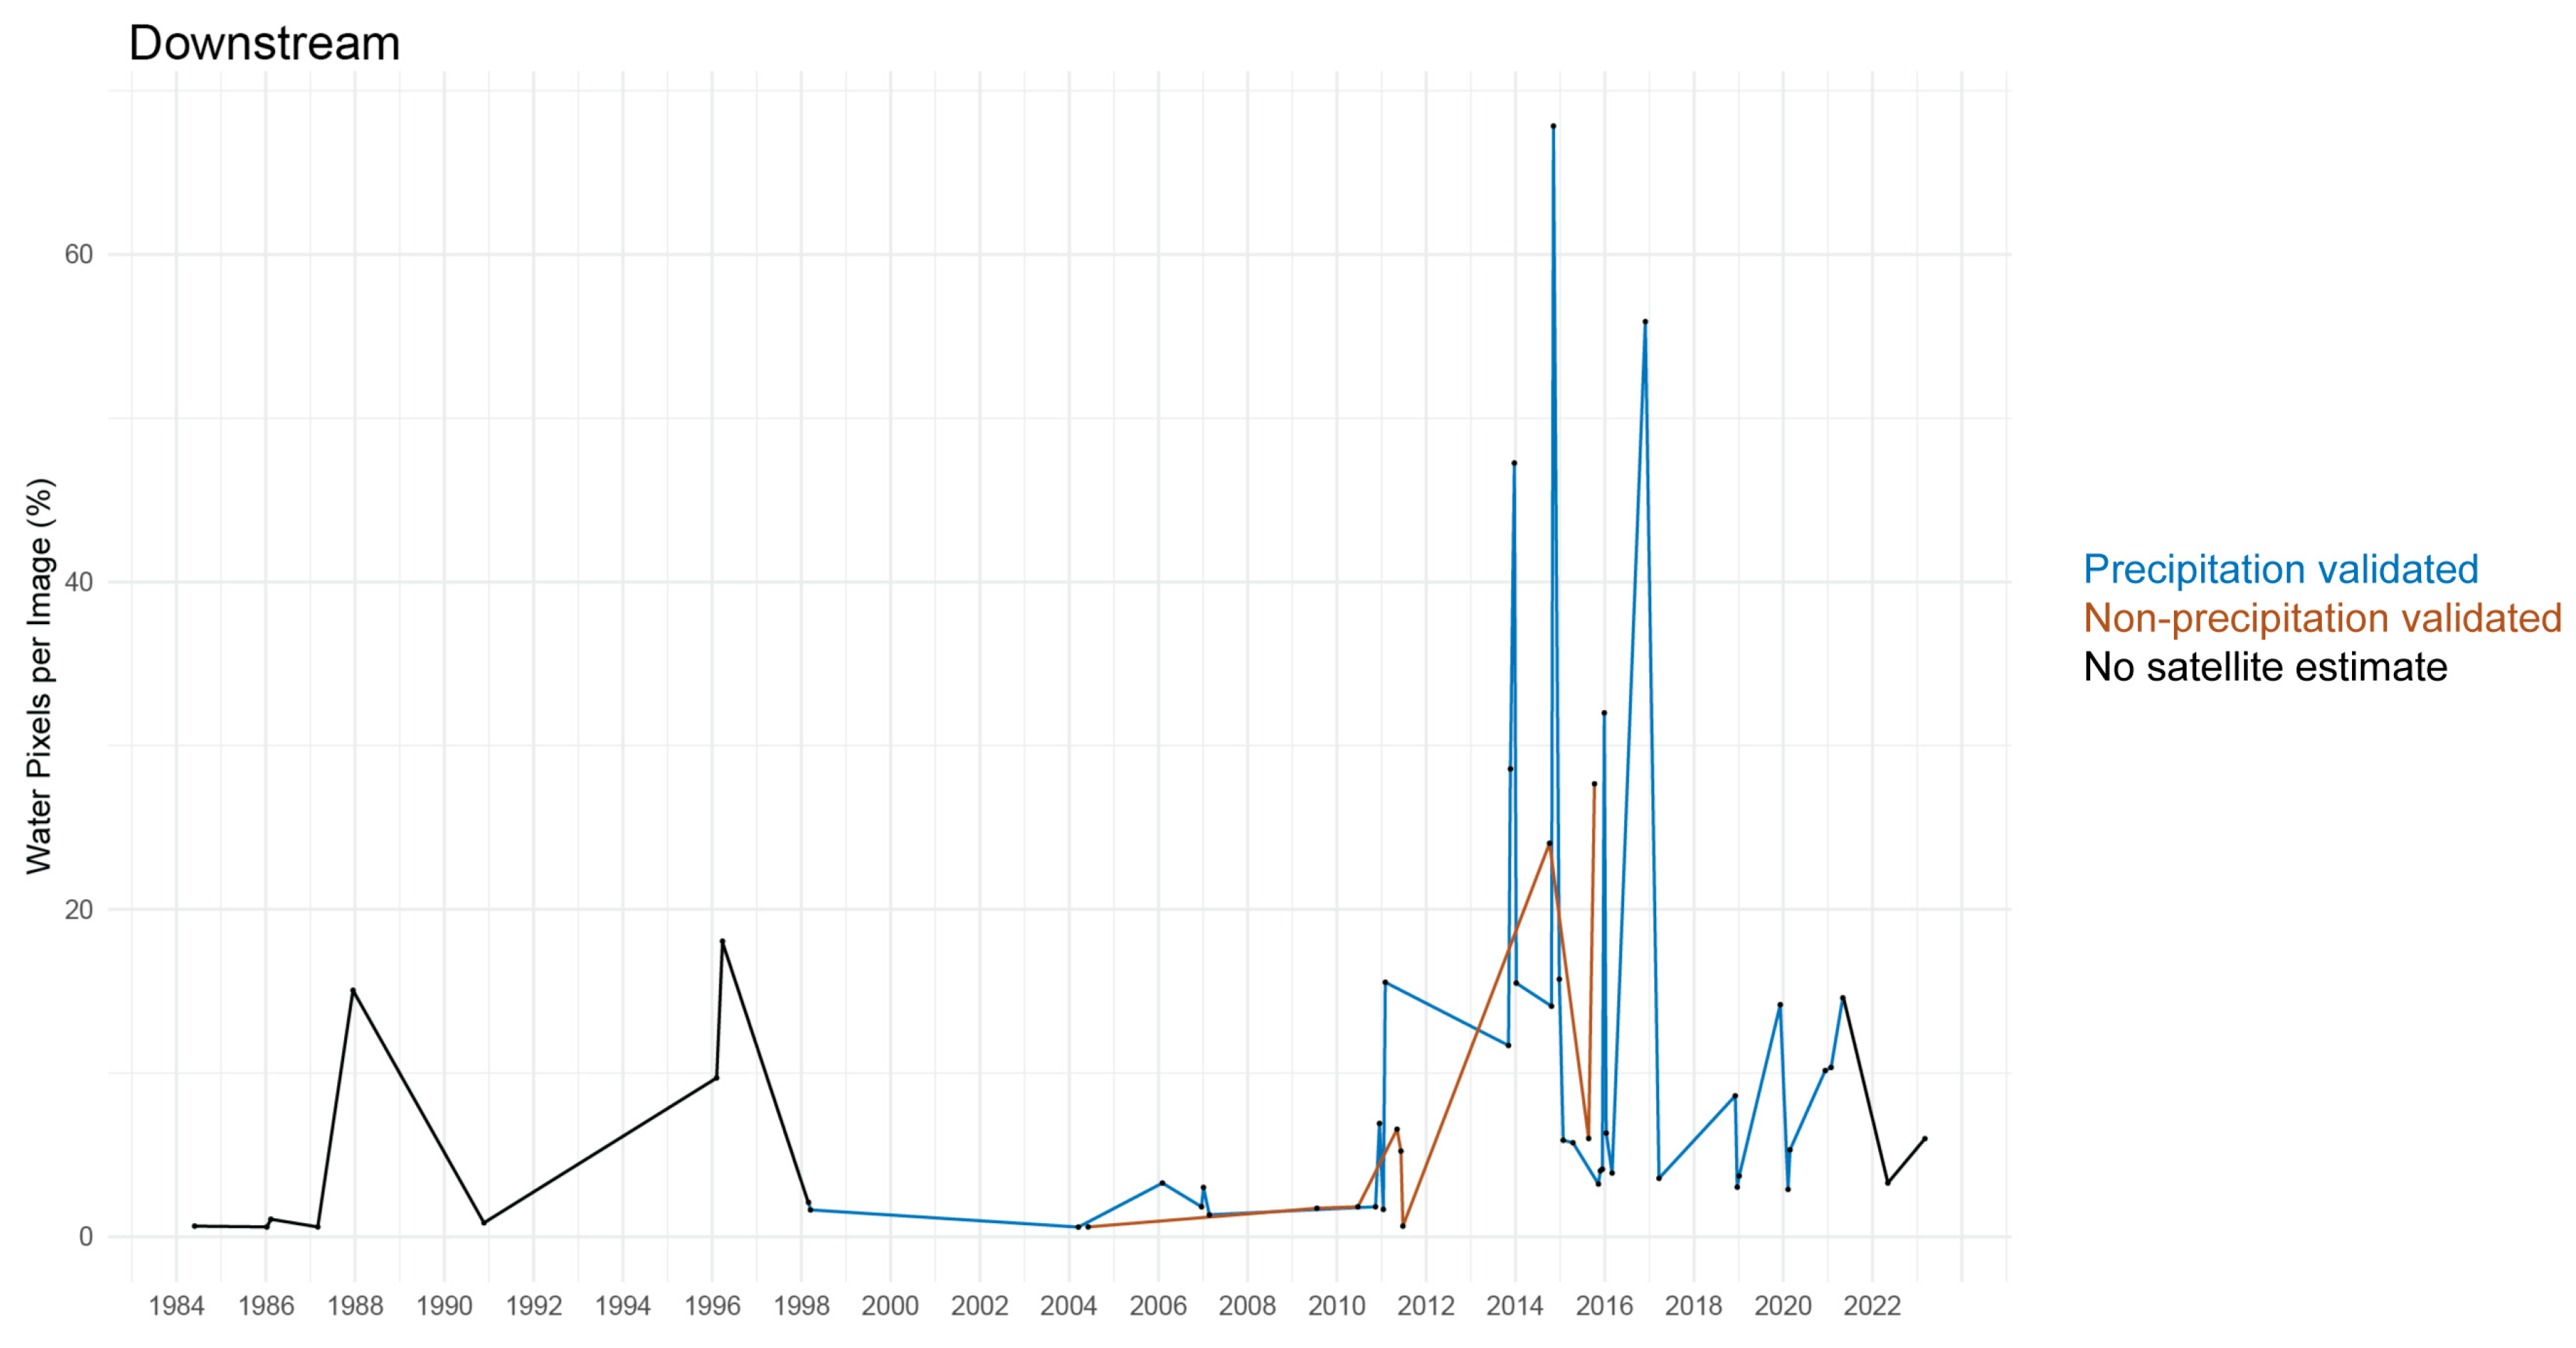
For images correlated to the period of TRMM-TMPA and GPM-IMERG estimates, flood presence as identified by ROC curve cutoff values (>0.55% water pixels for Landsat 5, >1200 water pixels for Landsat 8) was validated through combined precipitation estimates of 10 mm or greater for the preceding seven-day period (Figure A1). Results indicate a higher number of non-precipitation-validated floods further upstream in the channel, with the number of precipitation-validated events increasing moving further downstream (Table 7) (Figure 9). As the Souss channel is an ephemeral system supported by surface runoff and experiencing transmission losses, increased distance from the headwaters would be expected to correlate with an increase in precipitation-linked flow. Surface flow is further frequently observed in the upstream section of the channel, likely supported by precipitation and runoff in the adjacent mountain block, and less tied to precipitation adjacent to the channel. Orographic precipitation may not directly translate to precipitation (and thus satellite estimates) on the plain. This may additionally highlight increased error in satellite precipitation estimates with increasing elevation [58]. Several minor tributary channels originating in the adjacent mountain block may further be supported by this precipitation, with confluences in the midstream and downstream sections contributing to non-precipitation-validated flow. In addition, dam installation at the channel headwaters post-1990 has resulted in infrequent dam releases uncorrelated to precipitation. Dam releases may produce limited surface flow in the channel upstream and midstream sections, and account for instances of non-precipitation-validated flow.
Table 7.
Validation of flood presence through prior precipitation, separated by channel section.
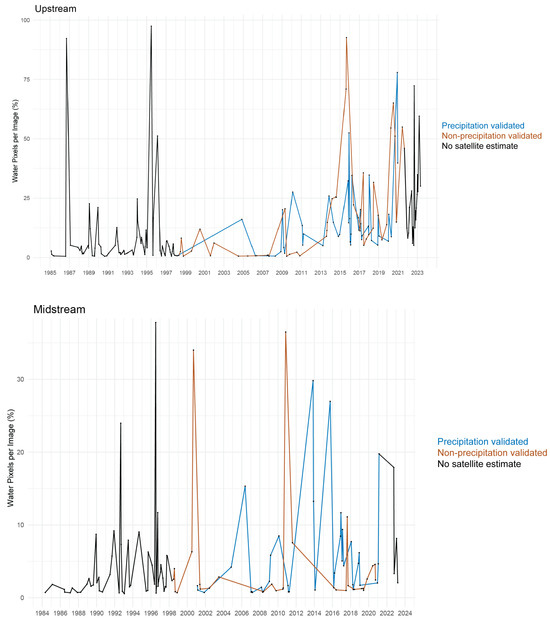

Figure 9.
Flood events across the observation period, separated by channel section and satellite precipitation validation. Periods in black indicate events which fall outside the range of available TRMM-TMPA and GPM-IMERG estimates. The majority of non-precipitation-validated events (blue) are observed in the upstream section of the channel, decreasing further downstream. This is consistent with runoff patterns which support flow within an ephemeral system.
3.4. Flood Assessment
Across the three channel sections, a cumulative 336 upstream, 336 midstream, and 122 downstream images were evaluated, spanning from 1984 through 2023. Of these images, 43.88% percent were identified as containing channel surface flow, while 56.17% represent dry conditions. Separated by section, the highest frequency of surface flow is observed within the upstream channel (50.28%), which is consistent with visual observation. The midstream and downstream sections demonstrate notably fewer flood events (33.62%, 16.09%), with the least occurring downstream (Table 8).
Table 8.
Flood event frequency across channel sections and satellite images.
3.5. Temporal Variability
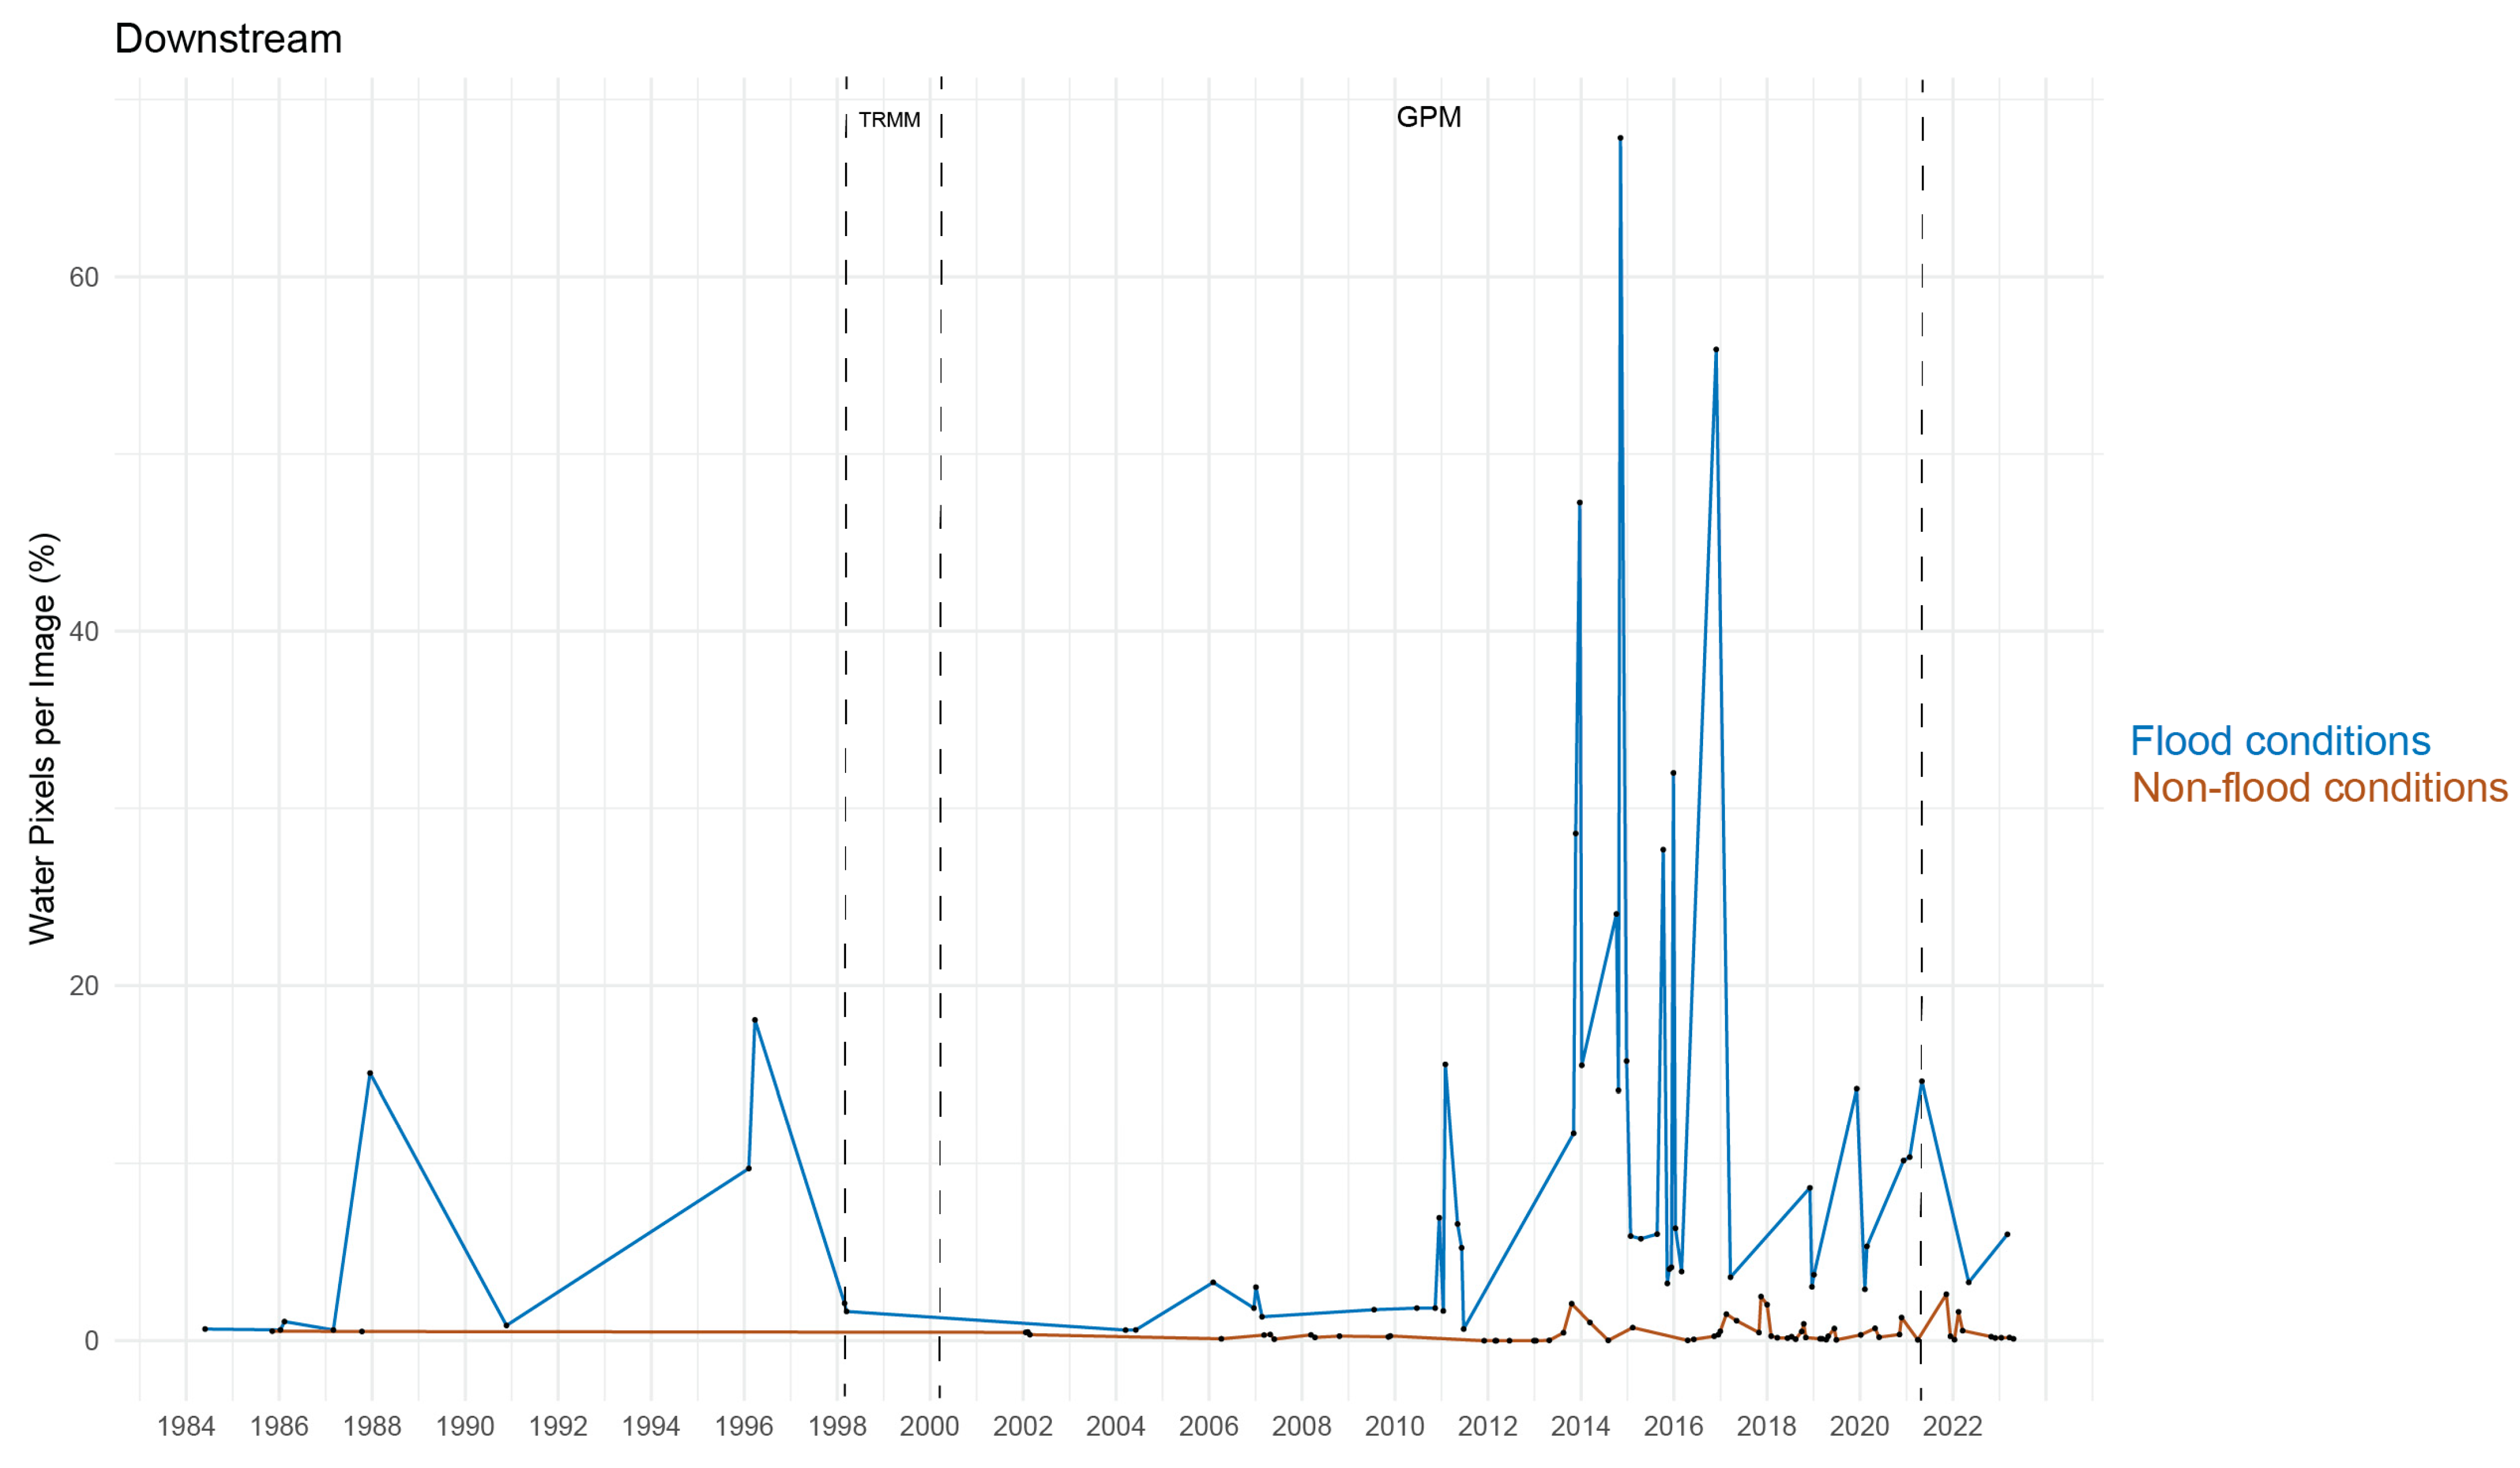
Across the observation period, the temporal frequency of flood events remained relatively consistent, with surface flow representing a sporadic, but regular event within the Souss channel (Figure 10). From 1998 to 2008, however, a period of reduced flow frequency was observed across all channel sections. Evaluation of seasonal patterns of channel inundation further highlight the overall reduction in both wet and dry season events during this period (Figure 11). This is consistent with significant droughts, which occurred from 1998 to 2001, 2005, and in 2007 [59]. Pre-1998, dry season flood events are observed as a significant proportion of all channel inundation. Post-2008, however, the contribution of dry season events decreases, while wet season floods increase in overall occurrence.
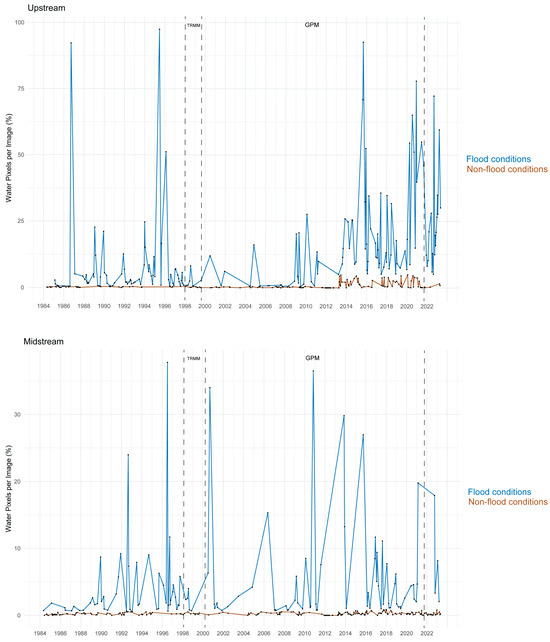
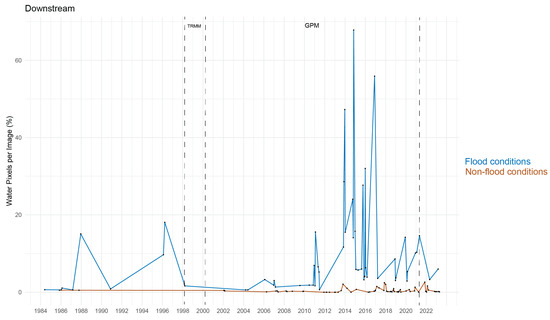
Figure 10.
Flood frequency across the observation period, separated by channel section. Events are delineated as flood (blue) or non-flood conditions (brown). Monotonic trends in water pixels per image for flood events across the period are not observed.
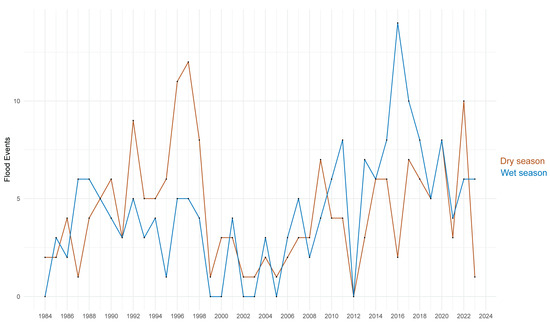
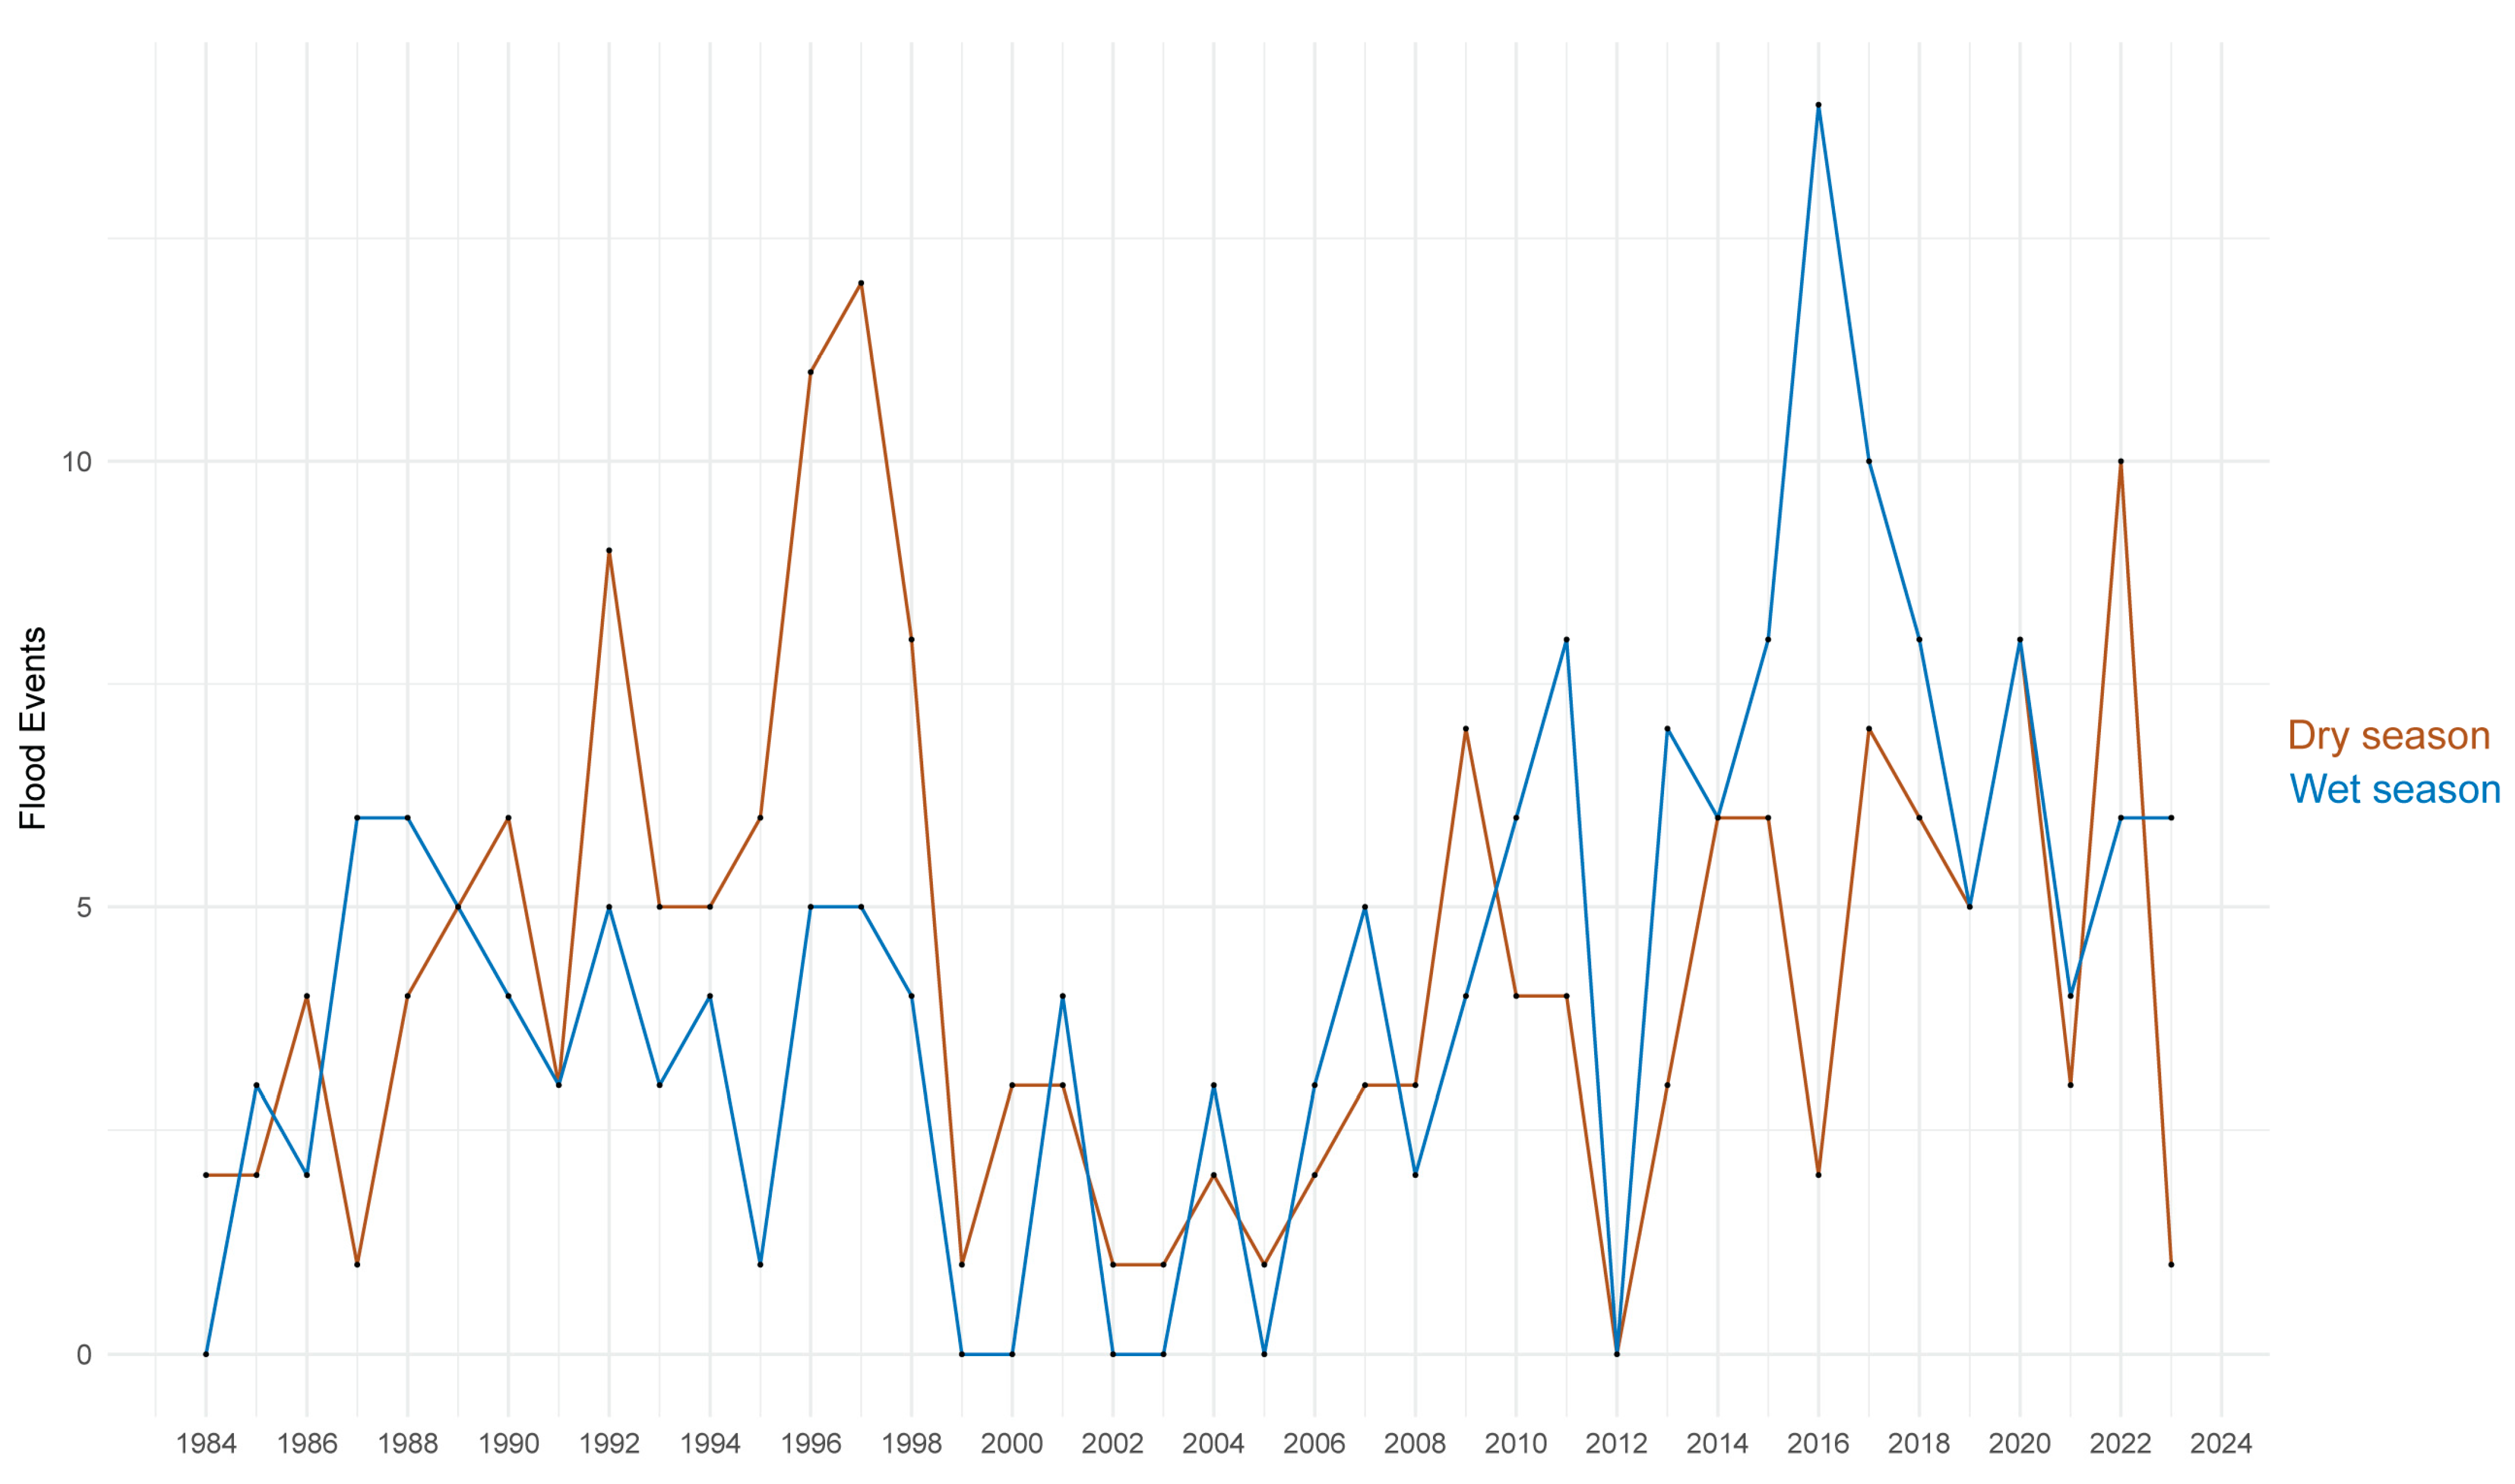
Figure 11.
Seasonal flood frequency across the observation period. From 1984 to 2023, the dominant season of flood contribution shifts from the dry season (April–October) to the wet season (November–March). This shift begins to occur in 2001, correlated with the same period of reduced channel flooding from 2001 to 2008.
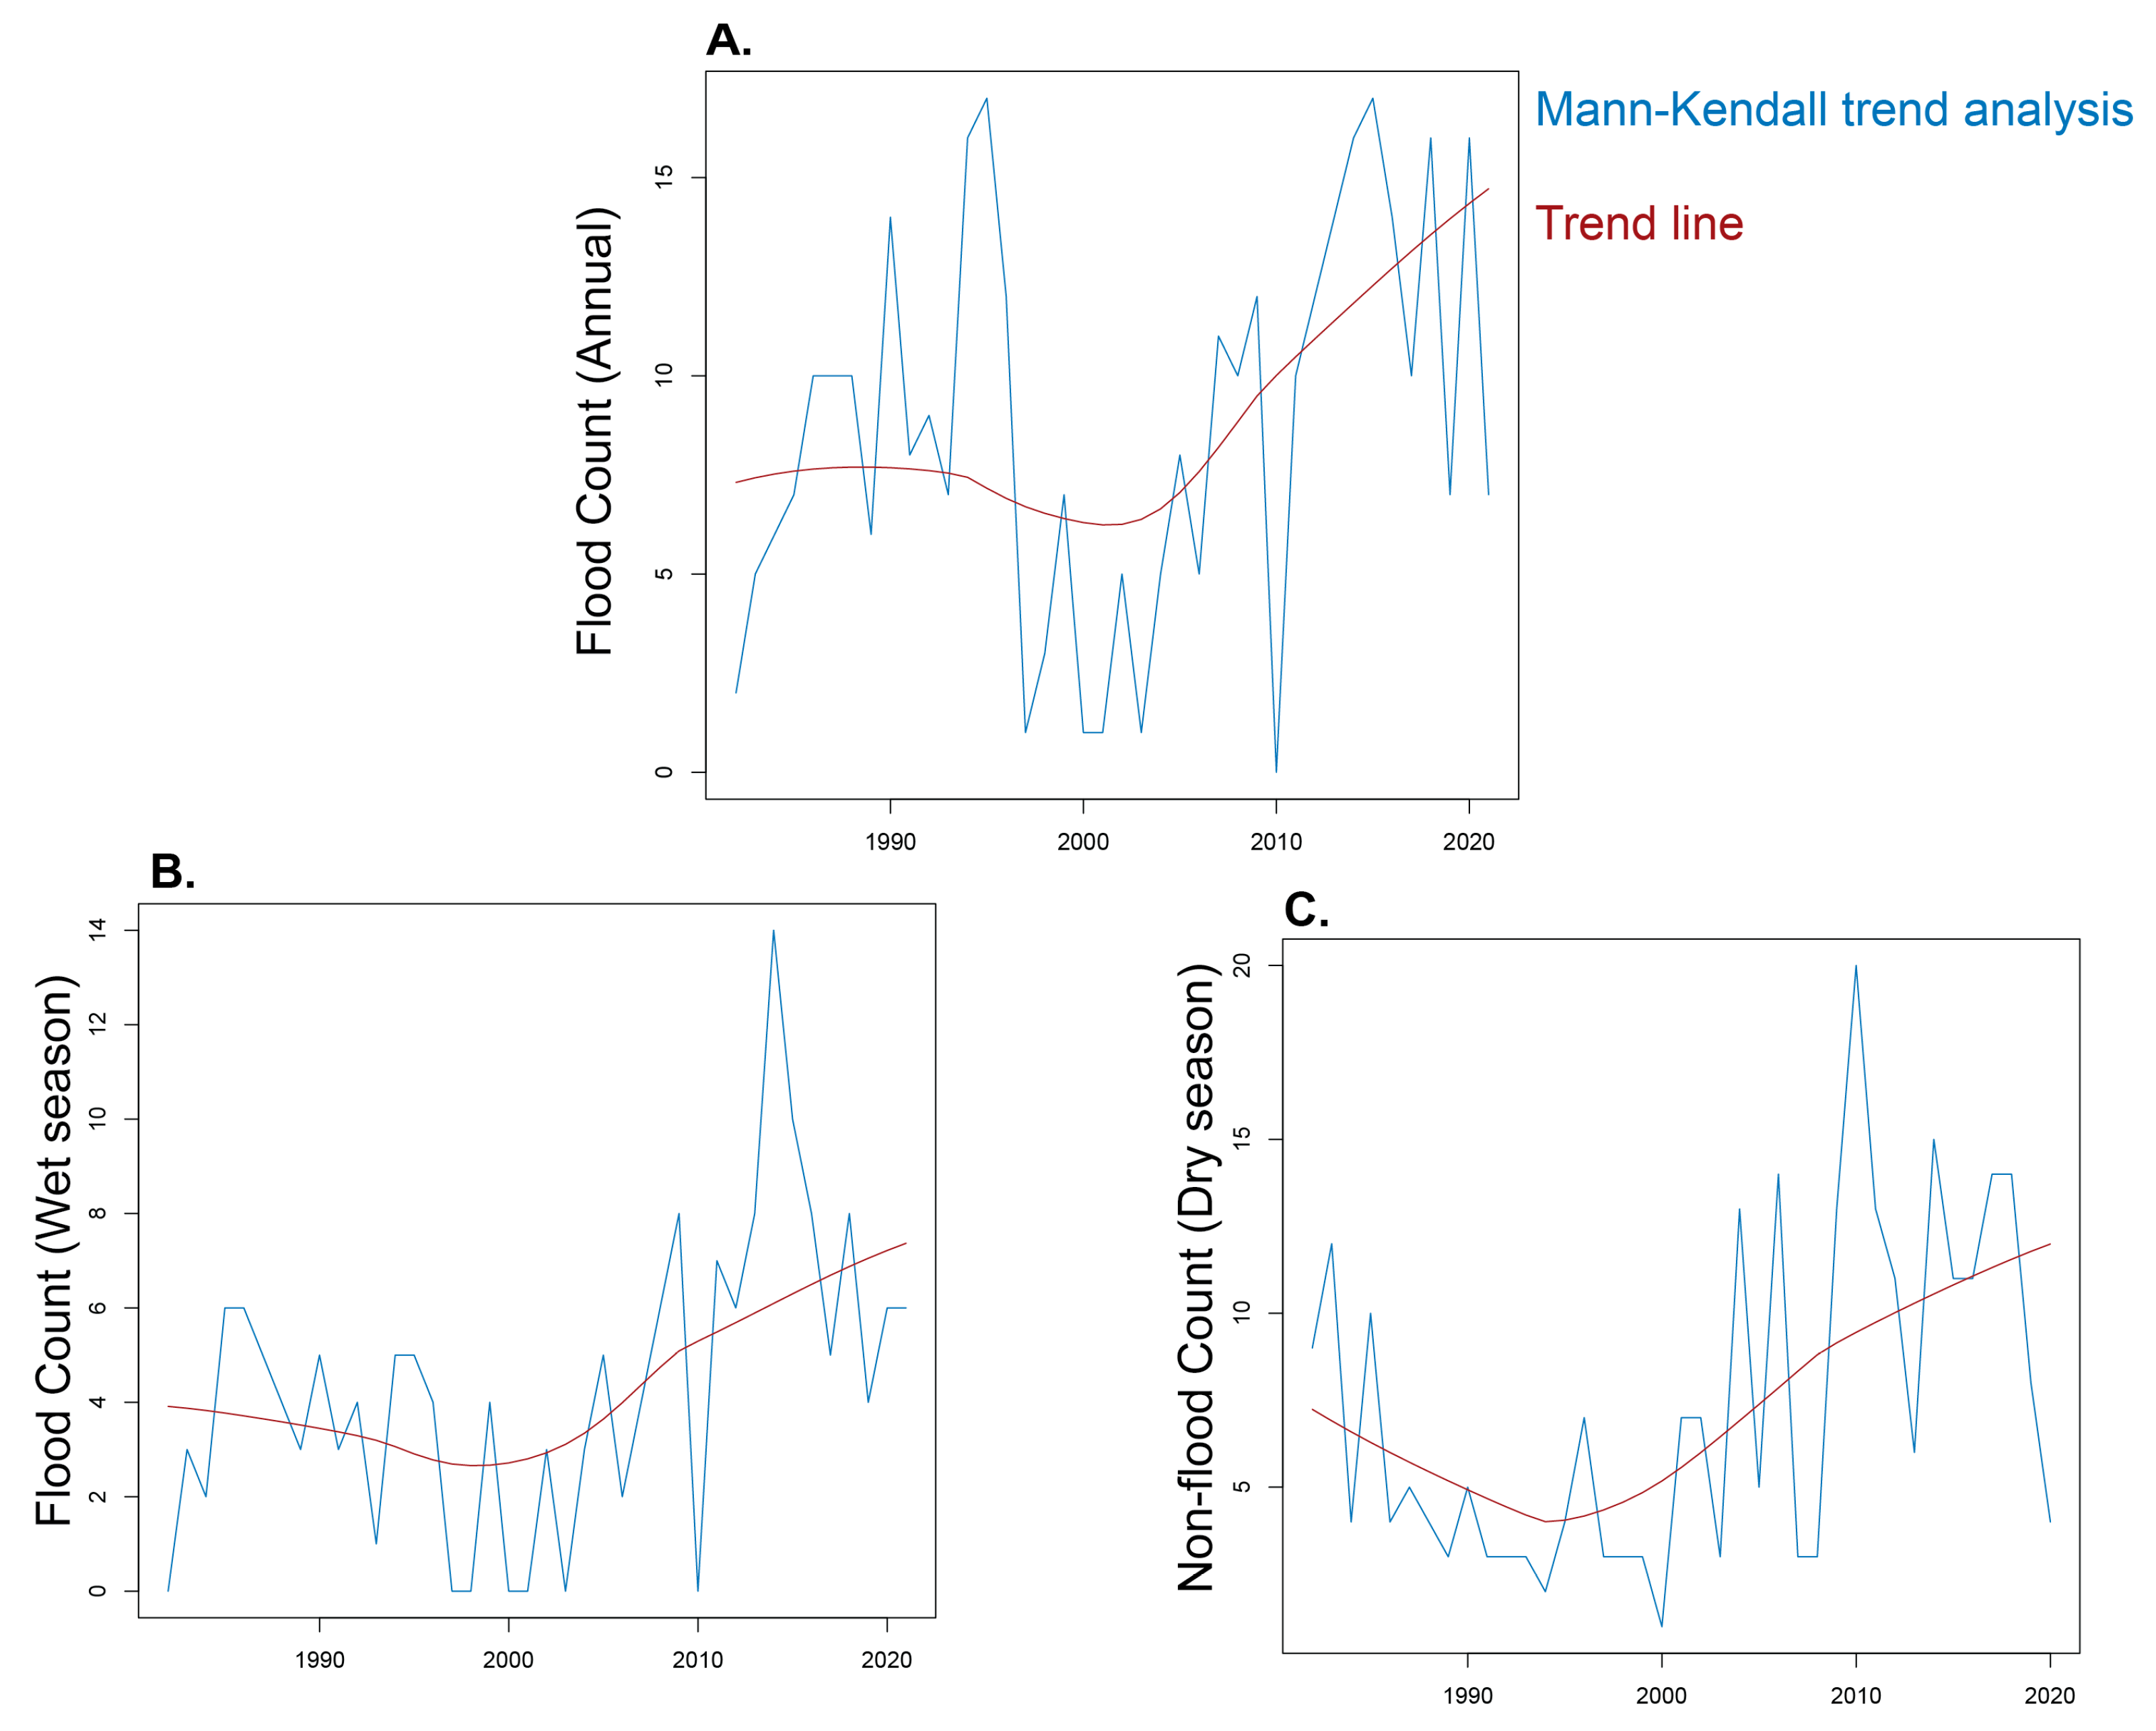
Mann–Kendall trend analysis was applied to assess monotonic trends in the number of flood events from 1984 through 2023 (Table 9) (Figure 12). With flood occurrence aggregated annually, Mann–Kendall analysis identified statistically significant (i.e., non-zero) positive trends in flood events across the observation period for a combination of all three sections, and the downstream section individually. For non-flood events, statistically significant positive trends were observed for all channel sections, both grouped and individually. It further identified a statistically significant positive trend in the number of flood events across all sections when aggregated monthly, and for the wet season specifically. No statistically significant trend, either positive or negative, was observed for flood events during the dry seasons. For non-flood events, a statistically significant positive trend in the number of flood events was found when aggregated monthly, and for both wet and dry seasons.
Table 9.
Mann–Kendall trend analysis.
Figure 12.
Mann–Kendall trend analysis. Aggregations vary, however each represents analysis of all three channel sections. (A) Annual aggregation for all
flood events. (B) Wet season aggregation for all flood events. (C) Dry season aggregation for non-flood events.
3.6. Spatial Variability
Due to the twice-monthly return of the Landsat satellites, quantifying the spatial connectivity of surface flow for a specific inundation event is challenging via satellite imagery. The assessment of larger trends in the spatial variability of flood events across the Souss upstream, midstream, and downstream sections, however, demonstrates a decreased frequency of inundation moving downstream (Table 10) (Figure A2). This is consistent with visual observation, in which flow rarely extends to downstream reaches and instead fluctuates between upstream and midstream sections. It is further logical within an arid, ephemeral system, in which surface water is lost to evapotranspiration and transmission losses. Across the observation period, occurrence of flood events within the downstream section of the channel is observed to increase following 2004, in tandem with the previously observed increased frequency of wet season inundation events (Figure 12). Across the wet season, flood frequency is observed as relatively balanced across the midstream and downstream channel sections, with approximately half of all events occurring within the upstream section (Table 10). In contrast, however, the proportion of flood events occurring within the downstream section drops significantly during the dry season, shifting from 24.28% to only 8.00% of all flood events. The upstream section continues to represent approximately half of all events during this season.
Table 10.
Spatial distribution of flood events by season.
4. Discussion
4.1. LDA Classification
Commonly used water classification indices are broadly tailored to identify clear, consistent, open water bodies, the antithesis of the shallow, turbid, and temporal pixels observed within ephemeral channels. As a result, the application of these indices for the assessment of surface water presence within intermittent systems may fail to capture the reality of flow within the channel. The high predictive accuracy of linear discriminant function analysis (LDA) when applied to both the Landsat 5 and Landsat 8 imagery presents a novel solution to this challenge. As a highly flexible and exploratory statistical method, LDA classification allows for tailoring to site-specific features, both spectral and physical. Within the Souss basin, the Red and SWIR 2 bands (Landsat 5), and Blue and Coastal aerosol bands (Landsat 8) were identified as key parameters in the distinction between water and non-water pixels for each group of satellite imagery. For Landsat 5, identification of the Red band may highlight the relevance of bare soil, a dominant component of a landscape with minimal vegetation. The SWIR 2 band has previously been identified as effectively distinguishing water from the landscape, particularly adjacent agricultural fields. For Landsat 8, the Blue band is commonly associated with the reflectance of surface water, while the Coastal aerosol band may capture heavily turbid water pixels, a key characteristic of ephemeral systems like the Souss. Though these bands have been identified as the dominant contributors to their respective LDAs, it is important to recognize that the remaining five bands additionally play an important role in the linear function.
The overall poor performance of the modified NDWI confirms the previous intuition that existing classifiers may be poorly suited to ephemeral and intermittent systems. The modified NDWI index utilizes the Green and SWIR 1 bands, both of which did not appear as primary factors in differentiating water and non-water pixels in this channel. Of the loadings for each LDA, the Green band ranked fifth (both for Landsat 5 and 8) and the SWIR 1 band ranking third and fourth (Landsat 5 and Landsat 8, respectively). This may indicate the minimized significance of vegetation and soil moisture when differentiating surface water presence in this system. For the Green band, this is somewhat intuitive within an arid basin like the Souss–Massa, where riparian vegetation is minimal. SWIR 1 reflectance, however, is understood to increase with drier soil, a common feature in this basin. Interestingly, the mid-ranking of the SWIR 1 band for both LDAs indicates that this band likely does play some role, though is not the dominant factor, in distinguishing water and non-water pixels.
Optimizing water classification schemes is critical for improved estimates of large-scale hydrologic processes within data-scarce environments. This is specifically relevant in ephemeral systems, where improved understanding of surface flow directly informs estimates of transmission loss, groundwater storage, and shifting flow patterns as a result of climate and anthropogenic influence. With minimal gauging, remotely sensed imagery and precipitation estimates are the primary means of understanding the variability of these hydrologic processes across time. Satellite imagery, however, does present specific challenges to time-series analysis. The infrequent, bi-monthly return of Landsat imagery, paired with filtering for cloud cover and image quality, significantly reduces the number of images available for analysis. The offset image collection dates for the upstream–midstream channel sections and the downstream section further make it difficult to track the progression of an individual flood event within the system. Instead, the analysis of patterns of surface water within the Souss is forced to focus more broadly on temporal and spatial shifts in flow across the time period. The spatial resolution of Landsat pixels may further fail to capture variations in braided flow commonly observed in the Souss and other ephemeral systems. Spatial resolution may lack the detail necessary to distinguish the shifting fluvial geomorphology of a system, resulting in mixed pixels. Additional physical features of the landscape and riparian vegetation may result in shadowing; however, impacts are likely minimized within similarly arid systems which are frequently topographically uniform and vegetation sparse.
The use of satellite precipitation estimates for validation presents additional challenges, particularly with spatial resolution. TRMM-TMPA (0.25° × 0.25°) and GPM-IMERG (0.1° × 0.1°) grid cells are significantly coarser than Landsat pixels and further aggregated to an average precipitation upstream of the channel section of interest. Estimates may fail to capture the spatial heterogeneity of precipitation across the basin. TRMM-TMPA and GPM-IMERG have further demonstrated varied estimation accuracy with elevation and aridity, factors which may introduce error into precipitation estimates for the Souss [12]. Additionally, from 2000 to 2021, precipitation estimates are derived from fusion of TRMM-TMPA and GPM-IMERG, retrospective processing which may introduce an additional layer of error for estimates over this period [54]. Despite these considerations, remotely sensed precipitation estimates are an effective comparative tool for the assessment of precipitation-driven ephemeral channel flow. Results from this work identify the increasing percentage of precipitation-validated flood events moving downstream within the channel (upstream = 5.59%, midstream = 54.55%, downstream = 80.43%). This is in line with the previous understanding of regional flow processes, in which channel flow is predominantly derived from precipitation and surface runoff. As the ephemeral system moves downstream, an increasing proportion of surface water is hypothesized to be transferred to the subsurface via transmission losses. To support flow in the downstream section, an increasing input of precipitation is needed. The upstream section of the basin may additionally derive runoff form the adjacent mountain block, resulting in the reduced need for prior precipitation adjacent to the channel.
4.2. Temporal and Spatial Variability
The optimized LDA classification was applied to the Souss channel to analyze temporal and spatial patterns of flow intermittency. Mann–Kendall analysis initially identified a positive trend in the number of flood events when aggregated annually, monthly, and by wet season. This trend, however, is identifying the increase in available imagery for the Landsat 8 period. For this study, Landsat 5 imagery spans 27 years, with an identified 209 floods out of 415 total images (50.36%). In contrast, Landsat 8 imagery spans only a 10-year period, with 138 floods out of 290 total images (47.59%). Though there is certainly a positive trend in increased image density over the time period, we can observe that, in fact, the percentage of flood events actually decreases by 2.77%.
Focused on non-flood events, Mann–Kendall analysis identified a similar statistically significant positive trend for the upstream, midstream, and downstream sections individually and grouped, when aggregated annually. This was additionally supported via aggregation monthly, and by wet and dry season. Of Landsat 5 imagery, 50.84% is observed to represent non-flood events, compared to 81.03% of Landsat 8 imagery. This increase in the temporal frequency of non-flood events further supports our understanding of decreased flooding across the time period.
In contrast to the channel as a whole, Mann–Kendall analysis of flood events by section identified a statistically significant positive trend within only the downstream section, aggregated annually. Within the downstream section of Landsat 5, 25 of 39 images were identified as flood events (64.10%), while Landsat 8 imagery identified 31 of 32 events as representative of surface flow (96.88%). This observation of increased temporal frequency of flooding is at odds with the results for the upstream and midstream sections, which display a trend toward decreased flooding. Increased frequency of surface flow within the downstream section of the channel may in fact be supported by tributary contribution, as opposed to source-derived flow. It may additionally indicate the increased occurrence and distance of saltwater intrusion, a phenomenon that has been frequently observed near the channel mouth [42].
Overall, decreased frequency of flood events within the channel from 1984 through 2023 is consistent with broad decadal warming trends for Morocco, in which precipitation is projected to decrease and temperatures are expected rise [59]. Decreased inputs paired with elevated evapotranspiration may result in the increased frequency of drought in dryland environments. Analyzed seasonally, flood frequency appears to shift around 1998, with the preceding period dominated by dry season flood events and the following period experiencing increased wet season flood frequency. Within the Souss–Massa basin, the sharpest seasonal increase in flood events occurs during the dry season from 1990 to 1998. This may be partially driven by the creation of the Aoulouz dam at the channel headwaters in 1990. The dam is intended to support irrigation needs and artificial recharge through channel infiltration, leading to dam releases when the channel lacks consistent flow [44]. Previous work on ephemeral channel transmission loss has identified prior sediment moisture as crucial for infiltration and sustained aquifer recharge [13]. Flood events concentrated within the wet season thus may have a higher likelihood of recharging the regional aquifer, as transmission losses have the potential for deeper percolation. Within the Souss, the trend toward increased flood events within the wet season represents a positive shift for regional water storage. Despite an overall decreasing trend in the frequency of channel flooding, the impact on the regional water balance may be mitigated if reductions are concentrated within the dry season.
Spatial characteristics of flood variability additionally play an important role in sustained groundwater recharge. Across the wet season, flood events are relatively balanced, with 46.8% occurring with the upstream, 28.90% the midstream, and 24.28% the downstream channel sections. The reduction between the upstream and midstream sections points to external factors likely impacting the extent of channel flow. Specifically, transmission loss may be partially responsible for the decreased flow frequency within the midstream and downstream sections. Over pumping and abstraction to support agriculture additionally occurs broadly across the plain adjacent to the channel midsection, and likely contributes to reduced surface flow [39,43]. Increased transmission loss during the wet season period has positive implications for aquifer recharge, with infiltration between the upstream–midstream sections reducing the overall time surface water remains on the landscape and potentially contributing to reductions in PET [13]. During the dry season, the majority of flood events are concentrated within the upstream section of the channel (53.71%). This may further be to the benefit of regional aquifer recharge, as the higher number of flood events within this section increase the likelihood of antecedent sediment moisture and sustained infiltration [13].
5. Conclusions
Within data-limited, ephemeral systems, remotely sensed imagery paired with linear discriminant function analysis has the potential to improve our understanding of large-scale hydrologic processes. Despite overall reductions in the frequency of flow within the Souss channel, the preservation of events within the wet seasons increases the likelihood that sustained aquifer recharge can persist. The spatial distribution of surface water further contributes to the potential for recharge, with the majority of events concentrated within the upstream reaches of the channel. The addition of in situ measurements of precipitation and related discharge across channel sections has the potential to further refine and validate these observations, at the scale of both pixel classification and flood variability. Future work focused on the details of flow seasonality, particularly the variability of wet and dry season onset and duration, will further clarify our understanding of temporal and spatial flow variability, and sustained groundwater recharge. The incorporation of subsurface monitors of infiltration and sustained recharge would further help connect this work to regional estimates of transmission loss and optimal conditions for aquifer recharge. Field measurements may ultimately help expand the application of this method to intermittent systems across varied environments, quantifying broad shifts in regional flow patterns. Paired with improved satellite imagery and estimates, this work has the potential to refine management decision making, particularly in water-limited environments faced with an uncertain climate future.
Author Contributions
L.J.D. was responsible for project conceptualization, method development, investigation, analysis, writing, and editing. A.M.M. supported project administration, supervision, conceptualization, review, and editing. S.M.H. supported method development, and software and statistical guidance. All authors have read and agreed to the published version of the manuscript.
Funding
This research was supported by the Department of Geology, University of Georgia.
Data Availability Statement
Data presented in this study are available on request from the corresponding author. All satellite imagery, satellite estimates, and processing software are publicly available.
Conflicts of Interest
The authors declare no conflict of interest.
Appendix A
Table A1.
Pixel comparison across training and test imagery.

Figure A1.
Average daily precipitation as estimated by the TRMM and GPM satellites, across the upstream section of the Souss channel. Due to its improved estimation capabilities, GPM-IMERG data were prioritized over TRMM-TMPA data, beginning in 2000.
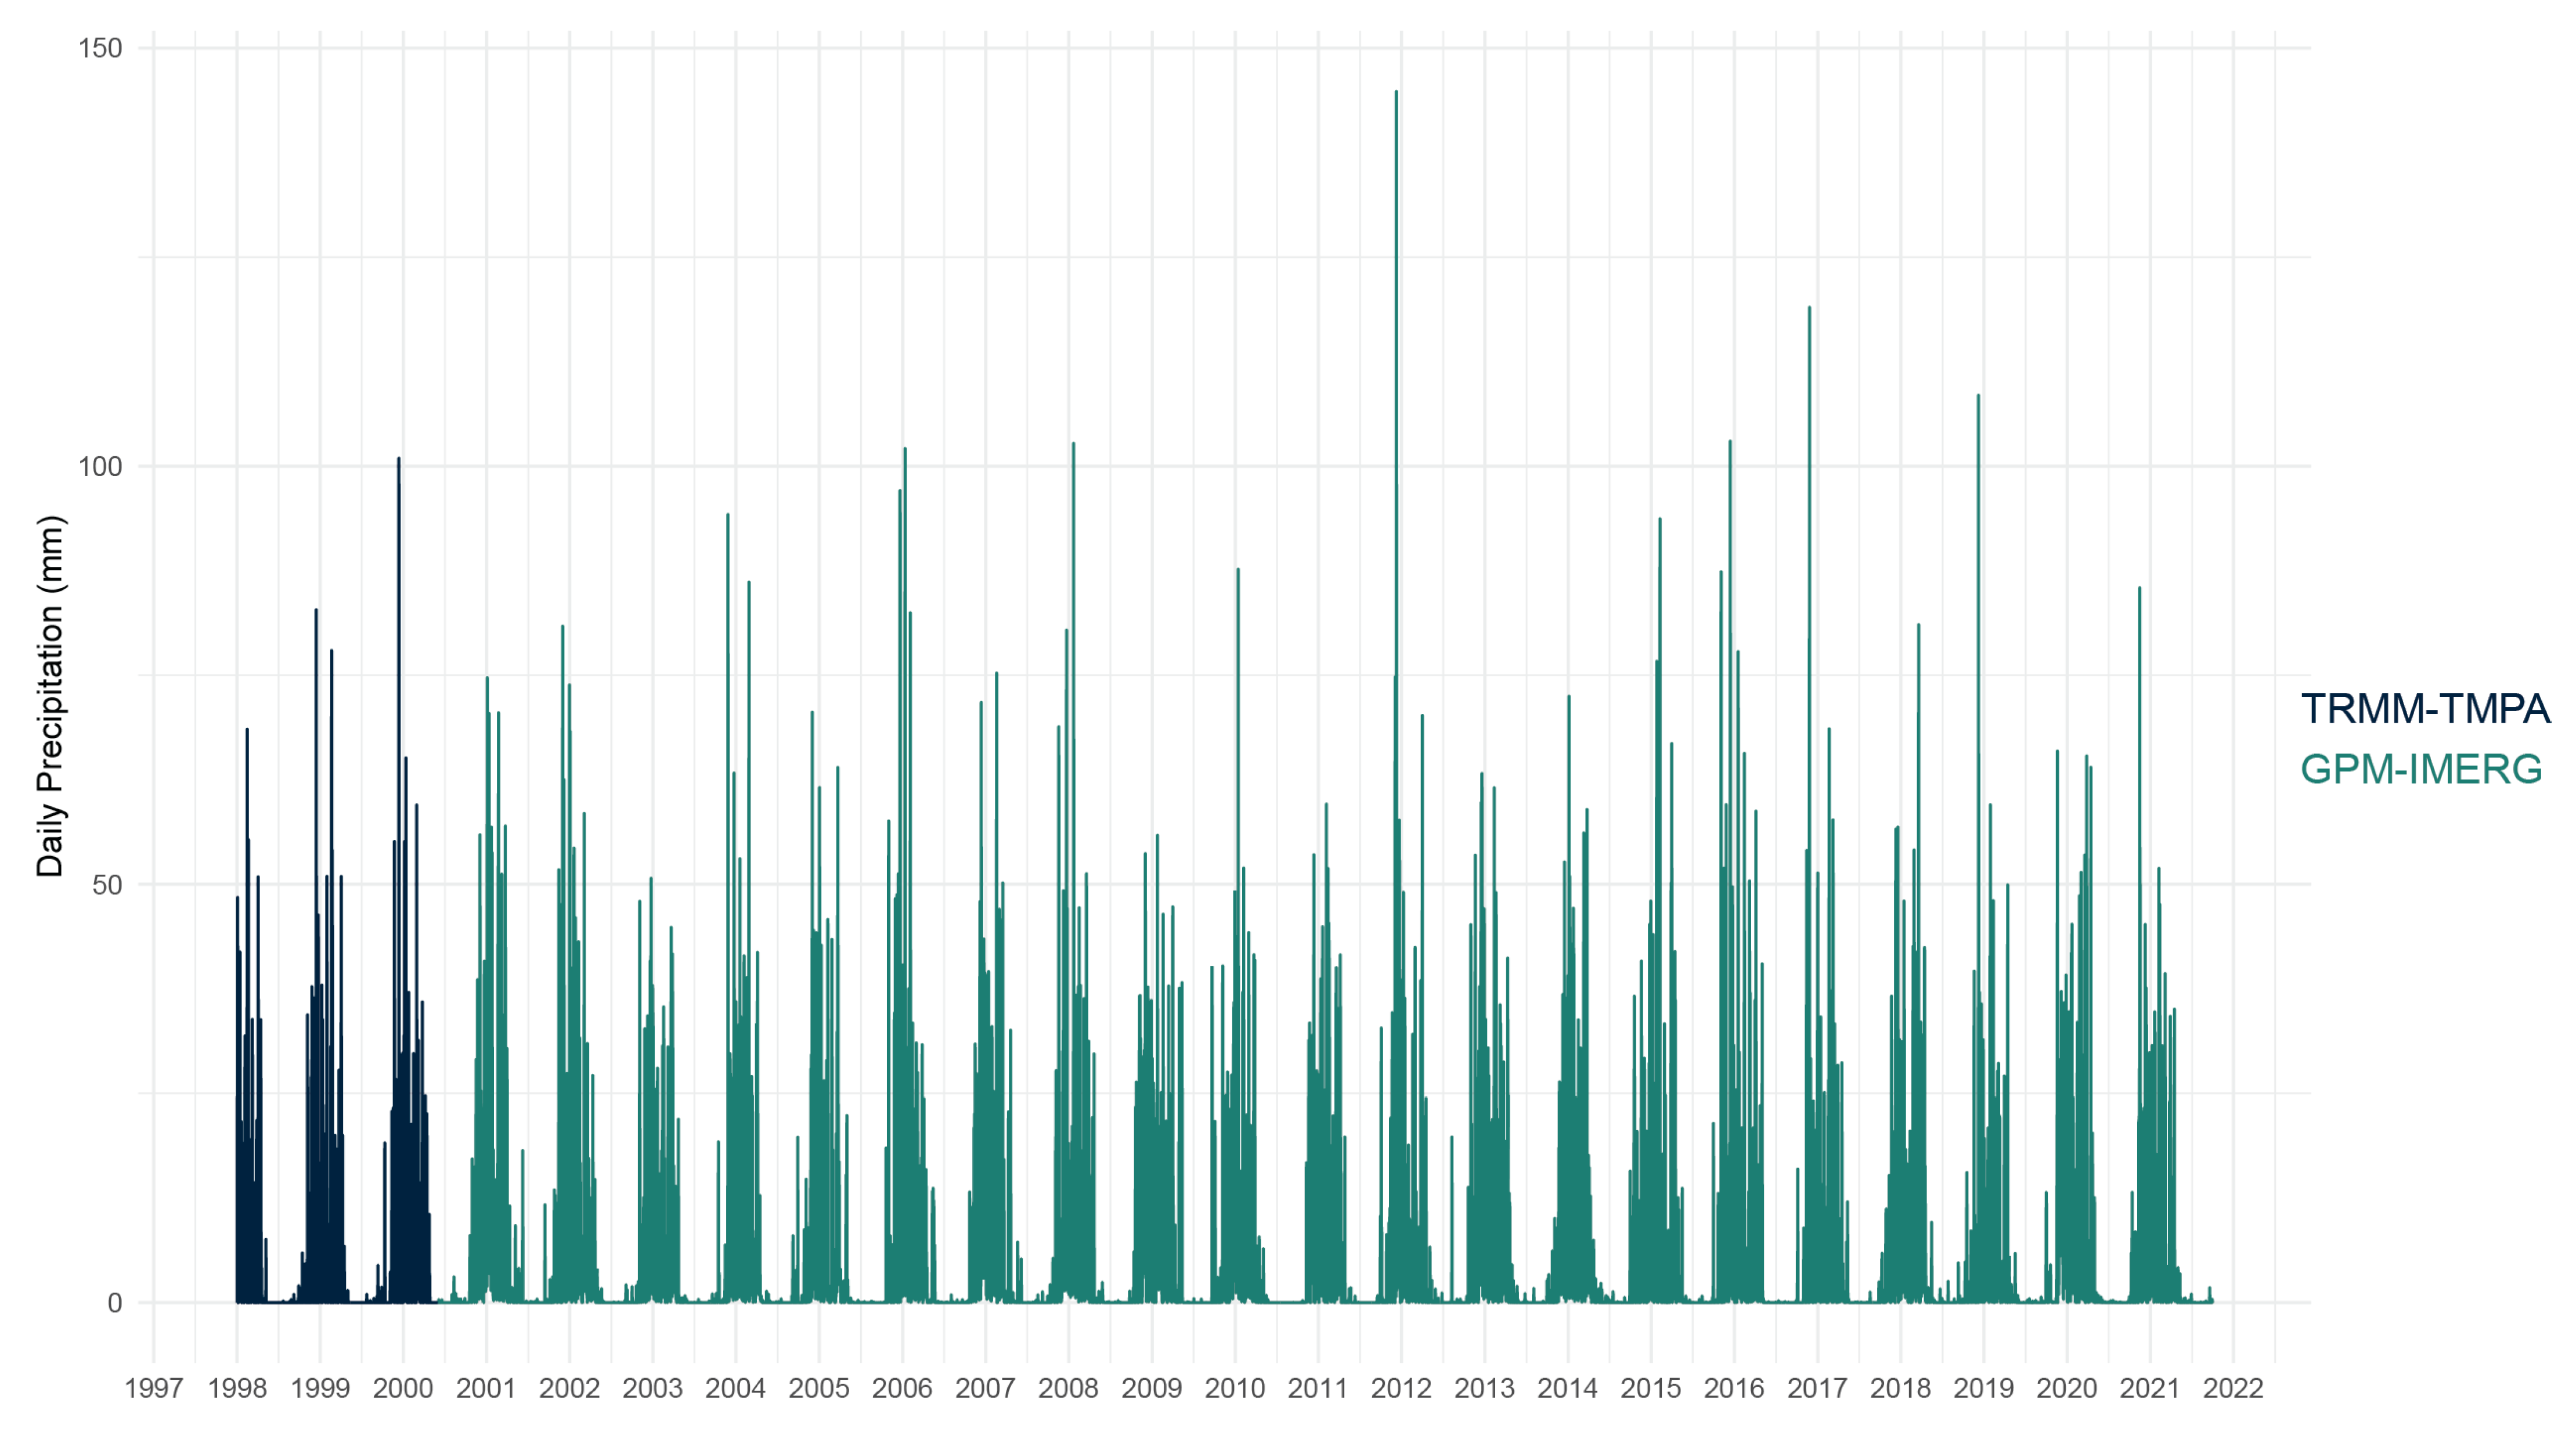

Figure A2.
Spatial distribution of flood events across the Souss channel.
References
- Datry, T.; Larned, S.T.; Tockner, K. Intermittent Rivers: A Challenge for Freshwater Ecology. BioScience 2014, 64, 229–235. [Google Scholar] [CrossRef]
- Messager, M.L.; Lehner, B.; Cockburn, C.; Lamouroux, N.; Pella, H.; Snelder, T.; Tockner, K.; Trautmann, T.; Watt, C.; Datry, T. Global Prevalence of Non-Perennial Rivers and Streams. Nature 2021, 594, 391–397. [Google Scholar] [CrossRef] [PubMed]
- Costigan, K.H.; Kennard, M.J.; Leigh, C.; Sauquet, E.; Datry, T.; Boulton, A.J. Chapter 2.2—Flow Regimes in Intermittent Rivers and Ephemeral Streams. In Intermittent Rivers and Ephemeral Streams; Datry, T., Bonada, N., Boulton, A., Eds.; Academic Press: Cambridge, MA, USA, 2017; pp. 51–78. ISBN 978-0-12-803835-2. [Google Scholar]
- Hammond, J.C.; Zimmer, M.; Shanafield, M.; Kaiser, K.; Godsey, S.E.; Mims, M.C.; Zipper, S.C.; Burrows, R.M.; Kampf, S.K.; Dodds, W.; et al. Spatial Patterns and Drivers of Nonperennial Flow Regimes in the Contiguous United States. Geophys. Res. Lett. 2021, 48, e2020GL090794. [Google Scholar] [CrossRef]
- Zipper, S.C.; Hammond, J.C.; Shanafield, M.; Zimmer, M.; Datry, T.; Jones, C.N.; Kaiser, K.E.; Godsey, S.E.; Burrows, R.M.; Blaszczak, J.R.; et al. Pervasive Changes in Stream Intermittency across the United States. Environ. Res. Lett. 2021, 16, 084033. [Google Scholar] [CrossRef]
- Costigan, K.H.; Jaeger, K.L.; Goss, C.W.; Fritz, K.M.; Goebel, P.C. Understanding Controls on Flow Permanence in Intermittent Rivers to Aid Ecological Research: Integrating Meteorology, Geology and Land Cover: Integrating Science to Understand Flow Intermittence. Ecohydrology 2016, 9, 1141–1153. [Google Scholar] [CrossRef]
- Stubbington, R.; Acreman, M.; Acuña, V.; Boon, P.J.; Boulton, A.J.; England, J.; Gilvear, D.; Sykes, T.; Wood, P.J. Ecosystem Services of Temporary Streams Differ between Wet and Dry Phases in Regions with Contrasting Climates and Economies. People Nat. 2020, 2, 660–677. [Google Scholar] [CrossRef]
- Stark, K.; Cadol, D.; Varyu, D.; Laronne, J.B. Direct, Continuous Measurements of Ultra-High Sediment Fluxes in a Sandy Gravel-Bed Ephemeral River. Geomorphology 2021, 382, 107682. [Google Scholar] [CrossRef]
- Zimmer, M.A.; Burgin, A.J.; Kaiser, K.; Hosen, J. The Unknown Biogeochemical Impacts of Drying Rivers and Streams. Nat. Commun. 2022, 13, 7213. [Google Scholar] [CrossRef]
- Zimmer, M.A.; Kaiser, K.E.; Blaszczak, J.R.; Zipper, S.C.; Hammond, J.C.; Fritz, K.M.; Costigan, K.H.; Hosen, J.; Godsey, S.E.; Allen, G.H.; et al. Zero or Not? Causes and Consequences of Zero-flow Stream Gage Readings. WIREs Water 2020, 7, e1436. [Google Scholar] [CrossRef]
- Milewski, A.; Sultan, M.; Yan, E.; Becker, R.; Abdeldayem, A.; Soliman, F.; Gelil, K.A. A Remote Sensing Solution for Estimating Runoff and Recharge in Arid Environments. J. Hydrol. 2009, 373, 1–14. [Google Scholar] [CrossRef]
- Milewski, A.; Elkadiri, R.; Durham, M. Assessment and Comparison of TMPA Satellite Precipitation Products in Varying Climatic and Topographic Regimes in Morocco. Remote Sens. 2015, 7, 5697–5717. [Google Scholar] [CrossRef]
- Fakir, Y.; Bouimouass, H.; Constantz, J. Seasonality in Intermittent Streamflow Losses Beneath a Semiarid Mediterranean Wadi. Water Resour. Res. 2021, 57, e2021WR029743. [Google Scholar] [CrossRef]
- Shentsis, I.; Rosenthal, E. Recharge of Aquifers by Flood Events in an Arid Region. Hydrol. Process. 2003, 17, 695–712. [Google Scholar] [CrossRef]
- Shanafield, M.; Cook, P.G. Transmission Losses, Infiltration and Groundwater Recharge through Ephemeral and Intermittent Streambeds: A Review of Applied Methods. J. Hydrol. 2014, 511, 518–529. [Google Scholar] [CrossRef]
- Levick, L.R.; Goodrich, D.C.; Hernandez, M.; Fonseca, J.; Semmens, D.J.; Stromberg, J.C.; Tluczek, M.; Leidy, R.A.; Scianni, M.; Guertin, D.P.; et al. The Ecological and Hydrological Significance of Ephemeral and Intermittent Streams in the Arid and Semi-Arid American Southwest; US Environmental Protection Agency, Office of Research and Development: Washington, DC, USA, 2008.
- Costa, A.C.; Foerster, S.; de Araújo, J.C.; Bronstert, A. Analysis of Channel Transmission Losses in a Dryland River Reach in North-Eastern Brazil Using Streamflow Series, Groundwater Level Series and Multi-Temporal Satellite Data. Hydrol. Process. 2013, 27, 1046–1060. [Google Scholar] [CrossRef]
- Krabbenhoft, C.A.; Allen, G.H.; Lin, P.; Godsey, S.E.; Allen, D.C.; Burrows, R.M.; DelVecchia, A.G.; Fritz, K.M.; Shanafield, M.; Burgin, A.J.; et al. Assessing Placement Bias of the Global River Gauge Network. Nat. Sustain. 2022, 5, 586–592. [Google Scholar] [CrossRef] [PubMed]
- Döll, P.; Schmied, H.M. How Is the Impact of Climate Change on River Flow Regimes Related to the Impact on Mean Annual Runoff? A Global-Scale Analysis. Environ. Res. Lett. 2012, 7, 014037. [Google Scholar] [CrossRef]
- Alsdorf, D.E.; Rodríguez, E.; Lettenmaier, D.P. Measuring Surface Water from Space. Rev. Geophys. 2007, 45, 2002. [Google Scholar] [CrossRef]
- Zhou, Y.; Dong, J.; Xiao, X.; Xiao, T.; Yang, Z.; Zhao, G.; Zou, Z.; Qin, Y. Open Surface Water Mapping Algorithms: A Comparison of Water-Related Spectral Indices and Sensors. Water 2017, 9, 256. [Google Scholar] [CrossRef]
- McFEETERS, S.K. The Use of the Normalized Difference Water Index (NDWI) in the Delineation of Open Water Features. Int. J. Remote Sens. 1996, 17, 1425–1432. [Google Scholar] [CrossRef]
- Xu, H. Modification of Normalised Difference Water Index (NDWI) to Enhance Open Water Features in Remotely Sensed Imagery. Int. J. Remote Sens. 2006, 27, 3025–3033. [Google Scholar] [CrossRef]
- Feyisa, G.L.; Meilby, H.; Fensholt, R.; Proud, S.R. Automated Water Extraction Index: A New Technique for Surface Water Mapping Using Landsat Imagery. Remote Sens. Environ. 2014, 140, 23–35. [Google Scholar] [CrossRef]
- Fisher, A.; Flood, N.; Danaher, T. Comparing Landsat Water Index Methods for Automated Water Classification in Eastern Australia. Remote Sens. Environ. 2016, 175, 167–182. [Google Scholar] [CrossRef]
- Seaton, D.; Mazvimavi, D. Use of Multi-Temporal Satellite Data for Monitoring Pool Surface Areas Occurring in Non-Perennial Rivers in Semi-Arid Environments of the Western Cape, South Africa. ISPRS J. Photogramm. Remote Sens. 2020, 167, 375–384. [Google Scholar] [CrossRef]
- Maswanganye, S.E. Remotely Sensed Applications in Monitoring the Spatio-Temporal Dynamics of Pools and Flows along Non-Perennial Rivers: A Review|South African Geographical Journal = Suid-Afrikaanse Geografiese Tydskrif. Available online: https://journals.co.za/doi/abs/10.1080/03736245.2021.1967774 (accessed on 10 August 2023).
- Tulbure, M.G.; Broich, M.; Stehman, S.V.; Kommareddy, A. Surface Water Extent Dynamics from Three Decades of Seasonally Continuous Landsat Time Series at Subcontinental Scale in a Semi-Arid Region. Remote Sens. Environ. 2016, 178, 142–157. [Google Scholar] [CrossRef]
- Borg Galea, A.; Sadler, J.P.; Hannah, D.M.; Datry, T.; Dugdale, S.J. Mediterranean Intermittent Rivers and Ephemeral Streams: Challenges in Monitoring Complexity. Ecohydrology 2019, 12, e2149. [Google Scholar] [CrossRef]
- Sun, F.; Sun, W.; Chen, J.; Gong, P. Comparison and Improvement of Methods for Identifying Waterbodies in Remotely Sensed Imagery. Int. J. Remote Sens. 2012, 33, 6854–6875. [Google Scholar] [CrossRef]
- Hamada, Y.; O’Connor, B.L.; Orr, A.B.; Wuthrich, K.K. Mapping Ephemeral Stream Networks in Desert Environments Using Very-High-Spatial-Resolution Multispectral Remote Sensing. J. Arid Environ. 2016, 130, 40–48. [Google Scholar] [CrossRef]
- Jacobberger, P.A.; Arvidson, R.E.; Rashka, D.L. Application of Landsat Multispectral Scanner Data and Sediment Spectral Reflectance Measurements to Mapping of the Meatiq Dome, Egypt. Geology 1983, 11, 587–591. [Google Scholar] [CrossRef]
- Isikdogan, F.; Bovik, A.C.; Passalacqua, P. Surface Water Mapping by Deep Learning. IEEE J. Sel. Top. Appl. Earth Obs. Remote Sens. 2017, 10, 4909–4918. [Google Scholar] [CrossRef]
- Fei, J.; Liu, J.; Ke, L.; Wang, W.; Wu, P.; Zhou, Y. A Deep Learning-Based Method for Mapping Alpine Intermittent Rivers and Ephemeral Streams of the Tibetan Plateau from Sentinel-1 Time Series and DEMs. Remote Sens. Environ. 2022, 282, 113271. [Google Scholar] [CrossRef]
- Malinowski, R.; Höfle, B.; Koenig, K.; Groom, G.; Schwanghart, W.; Heckrath, G. Local-Scale Flood Mapping on Vegetated Floodplains from Radiometrically Calibrated Airborne LiDAR Data. ISPRS J. Photogramm. Remote Sens. 2016, 119, 267–279. [Google Scholar] [CrossRef]
- Veh, G.; Korup, O.; Roessner, S.; Walz, A. Detecting Himalayan Glacial Lake Outburst Floods from Landsat Time Series. Remote Sens. Environ. 2018, 207, 84–97. [Google Scholar] [CrossRef]
- Chen, H.; Liang, Q.; Liang, Z.; Liu, Y.; Ren, T. Extraction of Connected River Networks from Multi-Temporal Remote Sensing Imagery Using a Path Tracking Technique. Remote Sens. Environ. 2020, 246, 111868. [Google Scholar] [CrossRef]
- World Meteorological Organization (WMO). Guidelines on the Calculation of Climate Normals; WMO: Geneva, Switzerland, 2017. [Google Scholar]
- Bouchaou, L.; Tagma, T.; Boutaleb, S.; Hssaisoune, M.; El Morjani, Z.E.A. Climate Change and Its Impacts on Groundwater Resources in Morocco: The Case of the Souss-Massa Basin. In Climate Change Effects on Groundwater Resources: A Global Synthesis of Findings and Recommendations; Taylor & Francis Group: London, UK, 2011; pp. 129–144. [Google Scholar]
- Hssaisoune, M.; Boutaleb, S.; Benssaou, M.; Bouaakkaz, B. Physical Geography, Geology, and Water Resource Availability of the Souss-Massa River Basin; Springer: Berlin/Heidelberg, Germany, 2016. [Google Scholar]
- Hssaisoune, M.; Bouchaou, L.; Matsumoto, T.; Araguas, L.; Kraml, M.; Aggarwal, P. New Evidences on Groundwater Dynamics from the Souss-Massa System (Morocco): Insights Gained from Dissolved Noble Gases. Appl. Geochem. 2019, 109, 104395. [Google Scholar] [CrossRef]
- Choukr-Allah, R.; Ragab, R.; Bouchaou, L.; Barcelo, D. The Souss-Massa River Basin, Morocco; Springer: Berlin, Germany, 2016; ISBN 978-3-319-51129-0. [Google Scholar]
- Ait Brahim, Y.; Seif-Ennasr, M.; Malki, M.; N’da, B.; Choukrallah, R.; El Morjani, Z.E.A.; Sifeddine, A.; Abahous, H.; Bouchaou, L. Assessment of Climate and Land Use Changes: Impacts on Groundwater Resources in the Souss-Massa River Basin. In The Souss-Massa River Basin, Morocco; Choukr-Allah, R., Ragab, R., Bouchaou, L., Barceló, D., Eds.; The Handbook of Environmental Chemistry; Springer International Publishing: Cham, Switzerland, 2017; pp. 121–142. ISBN 978-3-319-51131-3. [Google Scholar]
- Dindane, K.; Bouchaou, L.; Hsissou, Y.; Krimissa, M. Hydrochemical and Isotopic Characteristics of Groundwater in the Souss Upstream Basin, Southwestern Morocco. J. Afr. Earth Sci. 2003, 36, 315–327. [Google Scholar] [CrossRef]
- Bouragba, L.; Mudry, J.; Bouchaou, L.; Hsissou, Y.; Krimissa, M.; Tagma, T.; Michelot, J.L. Isotopes and Groundwater Management Strategies under Semi-Arid Area: Case of the Souss Upstream Basin (Morocco). Appl. Radiat. Isot. 2011, 69, 1084–1093. [Google Scholar] [CrossRef]
- Bouizrou, I.; Bouadila, A.; Aqnouy, M.; Gourfi, A. Assessment of Remotely Sensed Precipitation Products for Climatic and Hydrological Studies in Arid to Semi-Arid Data-Scarce Region, Central-Western Morocco. Remote Sens. Appl. Soc. Environ. 2023, 30, 100976. [Google Scholar] [CrossRef]
- Almulla, Y.; Ramirez, C.; Joyce, B.; Huber-Lee, A.; Fuso-Nerini, F. From Participatory Process to Robust Decision-Making: An Agriculture-Water-Energy Nexus Analysis for the Souss-Massa Basin in Morocco. Energy Sustain. Dev. 2022, 70, 314–338. [Google Scholar] [CrossRef]
- Chavez, P.S. An Improved Dark-Object Subtraction Technique for Atmospheric Scattering Correction of Multispectral Data. Remote Sens. Environ. 1988, 24, 459–479. [Google Scholar] [CrossRef]
- Davis, J.C. Statistics and Data Analysis in Geology, 3rd ed.; Wiley: New York, NY, USA, 2002; ISBN 0-47 1-1 7275-8. [Google Scholar]
- Maindonald, J.; Braun, W.J. Data Analysis and Graphics Using R—An Example-Based Approach, 3rd ed.; University Press: Cambridge, UK, 2003; ISBN 13 978-0-511-71286-9. [Google Scholar]
- R Core Team. R: A Language and Environment for Statistical Computing; R Foundation for Statistical Computing: Vienna, Austria, 2011. [Google Scholar]
- Venables, W.N.; Ripley, B.D. Modern Applied Statistics with S, 4th ed.; Springer: New York, NY, USA, 2002; ISBN 0-387-95457-0. [Google Scholar]
- Andrefouet, S.; Bindschadler, R.; Brown de Colstoun, E.; Choate, M. Preliminary Assessment of the Value of Landsat-7 ETM+ Data Following Scan Line Corrector Malfunction; US Geological Survey, EROS Data Center: Sioux Falls, SD, USA, 2003. [Google Scholar]
- Tian, Y.; Peters-Lidard, C.D.; Eylander, J.B.; Joyce, R.J.; Huffman, G.J.; Adler, R.F.; Hsu, K.; Turk, F.J.; Garcia, M.; Zeng, J. Component Analysis of Errors in Satellite-Based Precipitation Estimates. J. Geophys. Res. Atmos. 2009, 114, D24101. [Google Scholar] [CrossRef]
- Tramblay, Y.; Thiemig, V.; Dezetter, A.; Hanich, L. Evaluation of Satellite-Based Rainfall Products for Hydrological Modelling in Morocco. Hydrol. Sci. J. 2016, 61, 2509–2519. [Google Scholar] [CrossRef]
- Saouabe, T.; El Khalki, E.M.; Saidi, M.E.M.; Najmi, A.; Hadri, A.; Rachidi, S.; Jadoud, M.; Tramblay, Y. Evaluation of the GPM-IMERG Precipitation Product for Flood Modeling in a Semi-Arid Mountainous Basin in Morocco. Water 2020, 12, 2516. [Google Scholar] [CrossRef]
- Tang, G.; Clark, M.P.; Papalexiou, S.M.; Ma, Z.; Hong, Y. Have Satellite Precipitation Products Improved over Last Two Decades? A Comprehensive Comparison of GPM IMERG with Nine Satellite and Reanalysis Datasets. Remote Sens. Environ. 2020, 240, 111697. [Google Scholar] [CrossRef]
- Shawky, M.; Moussa, A.; Hassan, Q.K.; El-Sheimy, N. Performance Assessment of Sub-Daily and Daily Precipitation Estimates Derived from GPM and GSMaP Products over an Arid Environment. Remote Sens. 2019, 11, 2840. [Google Scholar] [CrossRef]
- Verner, D.; Treguer, D.; Redwood, J.; Christensen, J.; McDonnell, R.; Elbert, C.; Konishi, Y.; Belghazi, S. Climate Variability, Drought, and Drought Management in Morocco’s Agricultural Sector; World Bank: Washington, DC, USA, 2018. [Google Scholar]


Disclaimer/Publisher’s Note: The statements, opinions and data contained in all publications are solely those of the individual author(s) and contributor(s) and not of MDPI and/or the editor(s). MDPI and/or the editor(s) disclaim responsibility for any injury to people or property resulting from any ideas, methods, instructions or products referred to in the content. |
© 2023 by the authors. Licensee MDPI, Basel, Switzerland. This article is an open access article distributed under the terms and conditions of the Creative Commons Attribution (CC BY) license (https://creativecommons.org/licenses/by/4.0/).