Article

Mining Deformation Monitoring Based on Lutan-1 Monostatic and Bistatic Data

1
Land Satellite Remote Sensing Application Center, Ministry of Natural Resources, Beijing 100048, China
2
Jiangsu Key Laboratory of Resources and Environmental Information Engineering, China University of Mining and Technology, Xuzhou 221116, China
3
School of Geosciences and Info-Physics, Central South University, Changsha 410083, China
*
Author to whom correspondence should be addressed.
Remote Sens. 2023, 15(24), 5668; https://doi.org/10.3390/rs15245668
Submission received: 20 October 2023 / Revised: 30 November 2023 / Accepted: 4 December 2023 / Published: 8 December 2023
(This article belongs to the Topic Radar Signal and Data Processing with Applications)

Abstract

:
Coal mining leads to surface subsidence, landslides, soil erosion and other problems that seriously threaten the life and property safety of residents in mining areas, and it is urgent to obtain mining subsidence information using high-frequency, high-precision and large-scale monitoring methods. Therefore, this paper mainly studies the deformation monitoring of the Datong mining area using Lutan-1 monostatic and bistatic SAR data. Firstly, the latest Lutan-1 bistatic data are used to reconstruct the DSM, and the interferometric calibration method is used to improve the accuracy of the DSM. Then, the surface deformation monitoring of the mining area is implemented by using DInSAR, SBAS-InSAR and Stacking-InSAR with the reconstructed DSM data and Lutan-1 monostatic SAR data. Finally, the deformation monitoring results are compared with the surface deformation results based on the TanDEM data, and both the results are evaluated using the filed leveling data. Taking 20 images covering the Datong mining area as the data sources, the surface deformation results obtained using different InSAR methods in the mining area were quantitatively evaluated and analyzed. The results indicated that: (1) the DSM obtained using the Lutan-1 bistatic SAR data was assessed and demonstrated with the ICESat laser altimetry data an error of 2.8 m, which meets the Chinese 1:50,000 scale DEM cartographic accuracy standard, and the difference analysis with the TanDEM data shows that the terrain changes are mainly distributed in mountainous areas; (2) Due to the improvement in resolution, the registration accuracy of the SAR images and LT-DSM is higher than that of the TanDEM data in the range direction and azimuth direction; (3) Via evaluation with the filed leveling data, it is found that the surface deformation measurement results based on LT-DSM are less affected by terrain, and the accuracy of LT-DSM-SBAS and LT-DSM-DInSAR is improved by 11.5% and 16.3%, respectively, compared with TanDEM-SBAS and TanDEM-DInSAR, which demonstrates the effectiveness of the Lutan-1 bistatic and monostatic data for mine deformation monitoring.

1. Introduction

Datong in Shanxi Province is rich in coal resources. However, coal mining will lead to surface movement and deformation, which will cause damage to cultivated land, buildings, roads, etc., and even seriously affect the safety of residents’ lives and property. Therefore, it is of great significance to monitor the surface deformation of the mining area [1]. Traditional monitoring methods have a large workload and are susceptible to objective conditions such as weather. Interferometric Synthetic Aperture Radar (InSAR) has the advantages of penetrating clouds, rain, snow and fog, in all weathers and all day. In the 1970s, scholars proposed differential synthetic aperture radar interferometry (DInSAR) technology. DInSAR technology uses the phase information of two radar images covering the same area to quickly extract the elevation information and deformation information of the large-scale ground satellite line of sight. DInSAR technology is sensitive to vertical deformation, and can achieve long-term centimeter-level or even millimeter-level deformation monitoring of large-scale deformation fields [2]. However, DInSAR is prone to spatio-temporal incoherence and atmospheric inhomogeneity [3], and it cannot remove various error phases such as atmospheric delay and residual terrain phases in the interference phase, which also restricts the accuracy of monitoring the surface deformation [3]. In order to suppress the influence of noise such as the atmospheric phase, scholars have proposed Stacking-InSAR technology, which mainly uses the weighted average of the interferometric phase to calculate the deformation rate of the phase and then obtain the deformation rate of the surface along the line of sight. Wang et al. used the Stacking-InSAR method to obtain the average subsidence rate of Shanxi Province from 2017 to 2021, and evaluated the root mean square error with the global navigation satellite system data to be 2.90 mm/a [4]. Although Stacking-InSAR can obtain more accurate results, it still needs a high-precision model to reduce errors and solve the time-series surface deformation. Therefore, Berardino et al. proposed the small baseline subset InSAR (SBAS-InSAR) technology [5]. Using the spatio-temporal baseline threshold to filter the image pairs to form the baseline set can improve the coherence of the interferogram, improve the monitoring accuracy, and obtain long-term slow deformation information. Hejmanowski et al. used DInSAR technology to monitor the ground surface movements caused by mining-induced seismic tremors. The shape and extent of the local dynamic settlement trough caused by these earthquakes are determined, and the spatial and temporal distributions of the ground motion caused by the two earthquakes are analyzed [6]. Chen et al. used DInSAR and InSAR-SBAS to monitor the subsidence of a mining area in Shandong Province, and found that InSAR can accurately detect the subsidence range and subsidence trend, but the monitoring ability at the central position is insufficient, which deviates from the actual results [7]. Xu et al. used sentinel data to compare the applicability of DInSAR, Stacking-InSAR and SBAS-InSAR in Datong mining area monitoring, and monitored 218 mining area deformations [1].
In InSAR surface deformation monitoring, accurate removal of the terrain phase is an important factor to improve the accuracy of the deformation monitoring, and the terrain phase is usually calculated using external digital elevation model (DEM) elevation information. Because DEM data are affected by timeliness, it is usually necessary to quickly generate and frequently update DEM products to keep them up to date. There are many methods to generate DEMs, including traditional geodetic methods, photogrammetry and InSAR technology. Photogrammetry and InSAR are remote sensing technologies that provide high-spatial-resolution products at low cost compared to traditional geodetic methods. InSAR has the advantages of all-weather, full-time availability, a fast data processing speed, high precision and easy access to large-area high-resolution images. It is usually the preferred remote sensing technology for generating large-scale DEMs [8,9,10]. Airborne and spaceborne interferometric synthetic aperture radars are the main tools for DEM generation [11]. The Shuttle Radar Topography Mission (SRTM) [12] and TanDEM (TerraSAR-X add-on for Digital Elevation Measurement) missions are two typical successful cases of obtaining DEMs using InSAR technology [13], which truly realized spaceborne SAR interferometry [14]. TanDEM-X has achieved accurate measurement of global DEMs in just three years. The absolute elevation accuracy is 4 m, and its elevation accuracy is significantly better than that of the SRTM. At present, the TanDEM-X satellite has obtained DEM data on the Antarctic. The global accuracy of 99.5% of the region is within 10 m, and the accuracy of 90% of the region is within 3.49 m. In addition to the Antarctic, the accuracy of the DEM in 90% of the region is improved to 1.31 m [15]. Therefore, the TanDEM-X DEM is more accurate DEM data. However, due to the influence of timeliness, it will introduce different degrees of errors when it is used for surface deformation monitoring. In this paper, the newly acquired Lutan-1 monostatic data are used for digital terrain mapping to obtain high-precision and high-time-efficiency DEM data, and the practicability of using it for surface deformation monitoring is evaluated.
The Lutan-1 SAR satellite is composed of two L-band multi-polarization SAR satellites. It is the first civil L-band SAR satellite, mainly used for topographic mapping and deformation monitoring, in China [16]. It has five strip imaging modes and one scanning imaging mode, which can realize high-precision SAR data acquisition with 3–500 m resolution and 50–400 km width. After in-orbit testing and evaluation, the accuracy of Lutan-1 SAR satellite mapping meets the requirements of a 1:50,000 scale. The high spatial resolution, short revisit period, multi-polarization mode and multi-scanning mode of the Lutan-1 satellite can effectively reduce the spatio-temporal incoherence phase errors in the imaging process, improve the deformation phase unwrapping gradient threshold, and improve the deformation estimation accuracy, which is suitable for the monitoring of mining subsidence in mining areas. Lutan-1 satellites can provide more comprehensive and accurate surface deformation information for mining subsidence, which is of great significance for the safe and reasonable exploitation of underground resources and the expansion of research and application of the InSAR model.
In this study, two scenes of Lutan-1 bistatic data are used to reconstruct the DSM in the Datong area, and the accuracy of the reconstructed DSM is improved by using an interferometry calibration method. The accuracy is evaluated by using ICESat laser altimetry data and TanDEM data. The reconstructed DSM is used as the high-precision terrain data required for DInSAR, SBAS-InSAR and Stacking-InSAR surface deformation measurement, and the surface deformation monitoring of the Datong mining area is completed by combining this with the LuTan-1 monostatic SAR data. The surface deformation is compared with deformation monitoring using TanDEM as the terrain data. Finally, the deformation monitoring results for the Datong mining area are evaluated according to the measured level data on the ground, and the practicability and effectiveness of cooperative Lutan-1 bistatic and monostatic SAR data in mining area deformation monitoring are analyzed. The overall structure of this article is shown in Figure 1.

2. Methods

2.1. DSM Extraction Based on High-Precision Geometric Calibration and Interference Calibration

After a series of preprocessing steps for the raw SAR echo data to generate a single-look complex (SLC) image, the InSAR processing of DEM extraction can be performed. It mainly uses interference information and satellite parameters to solve the elevation and the position of the Earth’s surface [17]. The interference processing flow consists of 10 steps: geometric calibration, image registration and resampling, calculation of the interference fringe pattern and coherence coefficient map, removal of the flat and terrain phases, interferogram filtering, phase unwrapping, interferometry calibration, phase–height conversion, geocoding and DEM product accuracy evaluation. The data processing flow is shown in Figure 2.
(1)
Geometric calibration
The geo-positioning accuracy of SAR images is very important, and geometric calibration is an engineering method for SLC images. Geometric correction is performed by using high-precision control points to ensure the plane positioning accuracy of the SAR images.
(2)
Interferometric calibration
The elevation accuracy of an SAR image is improved using interferometry calibration. Interferometry calibration mainly includes two core parts: absolute phase error calculation and baseline error calculation. The absolute phase error calculation needs to use a large number of high-precision control points to determine the slant range difference in the main and auxiliary images to estimate the absolute phase error. The absolute phase of the interferometric phase can be recovered by re-adding the phase components that do not contain integer ambiguity. The baseline error calculation requires the use of high-precision control point data to construct a baseline calibration model to solve the baseline error, extract the baseline correction parameters, correct the horizontal and vertical baseline parameters and finally obtain high-precision DEM baseline products.

2.2. SBAS-InSAR

The SBAS-InSAR method is based on low-resolution and large-scale deformation, and is widely used in large-scale and long-term surface deformation monitoring. The SBAS InSAR technology uses a small threshold to constrain the spatio-temporal baseline of multi-scene SAR data. The set of interference combinations is constructed in accordance with the established spatio-temporal baseline to mitigate the impact of geometric incoherence [18]. The least squares estimation eliminates the error caused by unwrapping and reduces the impact of atmospheric interference and other factors [19,20], so as to obtain more accurate time-series cumulative deformation values on the surface. It is assumed that the surface deformation is linear in the time interval of the interference pair image. At this time, the solution of the phase time series can be transformed into the solution of the phase change rate, that is, the average deformation rate. Then, the least square method is used to solve the problem, and the singular value decomposition (SVD) is used to solve the rank defect problem caused by the joint solution between subsets, so as to obtain the time-series results of the deformation information.

2.3. Stacking-InSAR

Stacking-InSAR technology, namely interferogram stacking technology, is a relatively efficient and simple deformation detection technology. Compared with DInSAR technology, Stacking-InSAR technology can greatly weaken the atmospheric influence without relying on external data, and suppress the influence of DEM errors, so as to measure more accurate surface deformation information. It weighted-averages the unwrapped phase obtained over a period of time to weaken the influence of irrelevant noise, which includes atmospheric effects [21].
p h r a t e = i 1 n w i × p h i ÷ i 1 n w i
Among them, w i = Δ t 1 represents the weighting factor (Δt represents the time baseline corresponding to the interference pair, the unit is year), p h r a t e is used to represent the annual average deformation rate and p h i represents the unwrapping phase value of the interference pair. Stacking technology can theoretically weaken the impact of the atmospheric delay effect on the monitoring results to the original 1 / N , but it cannot be completely eliminated. Stacking technology is a very effective geological disaster monitoring method and plays a vital role.
The flow chart of deformation monitoring is shown in Figure 3.

3. Study Area and Datasets

3.1. Study Area

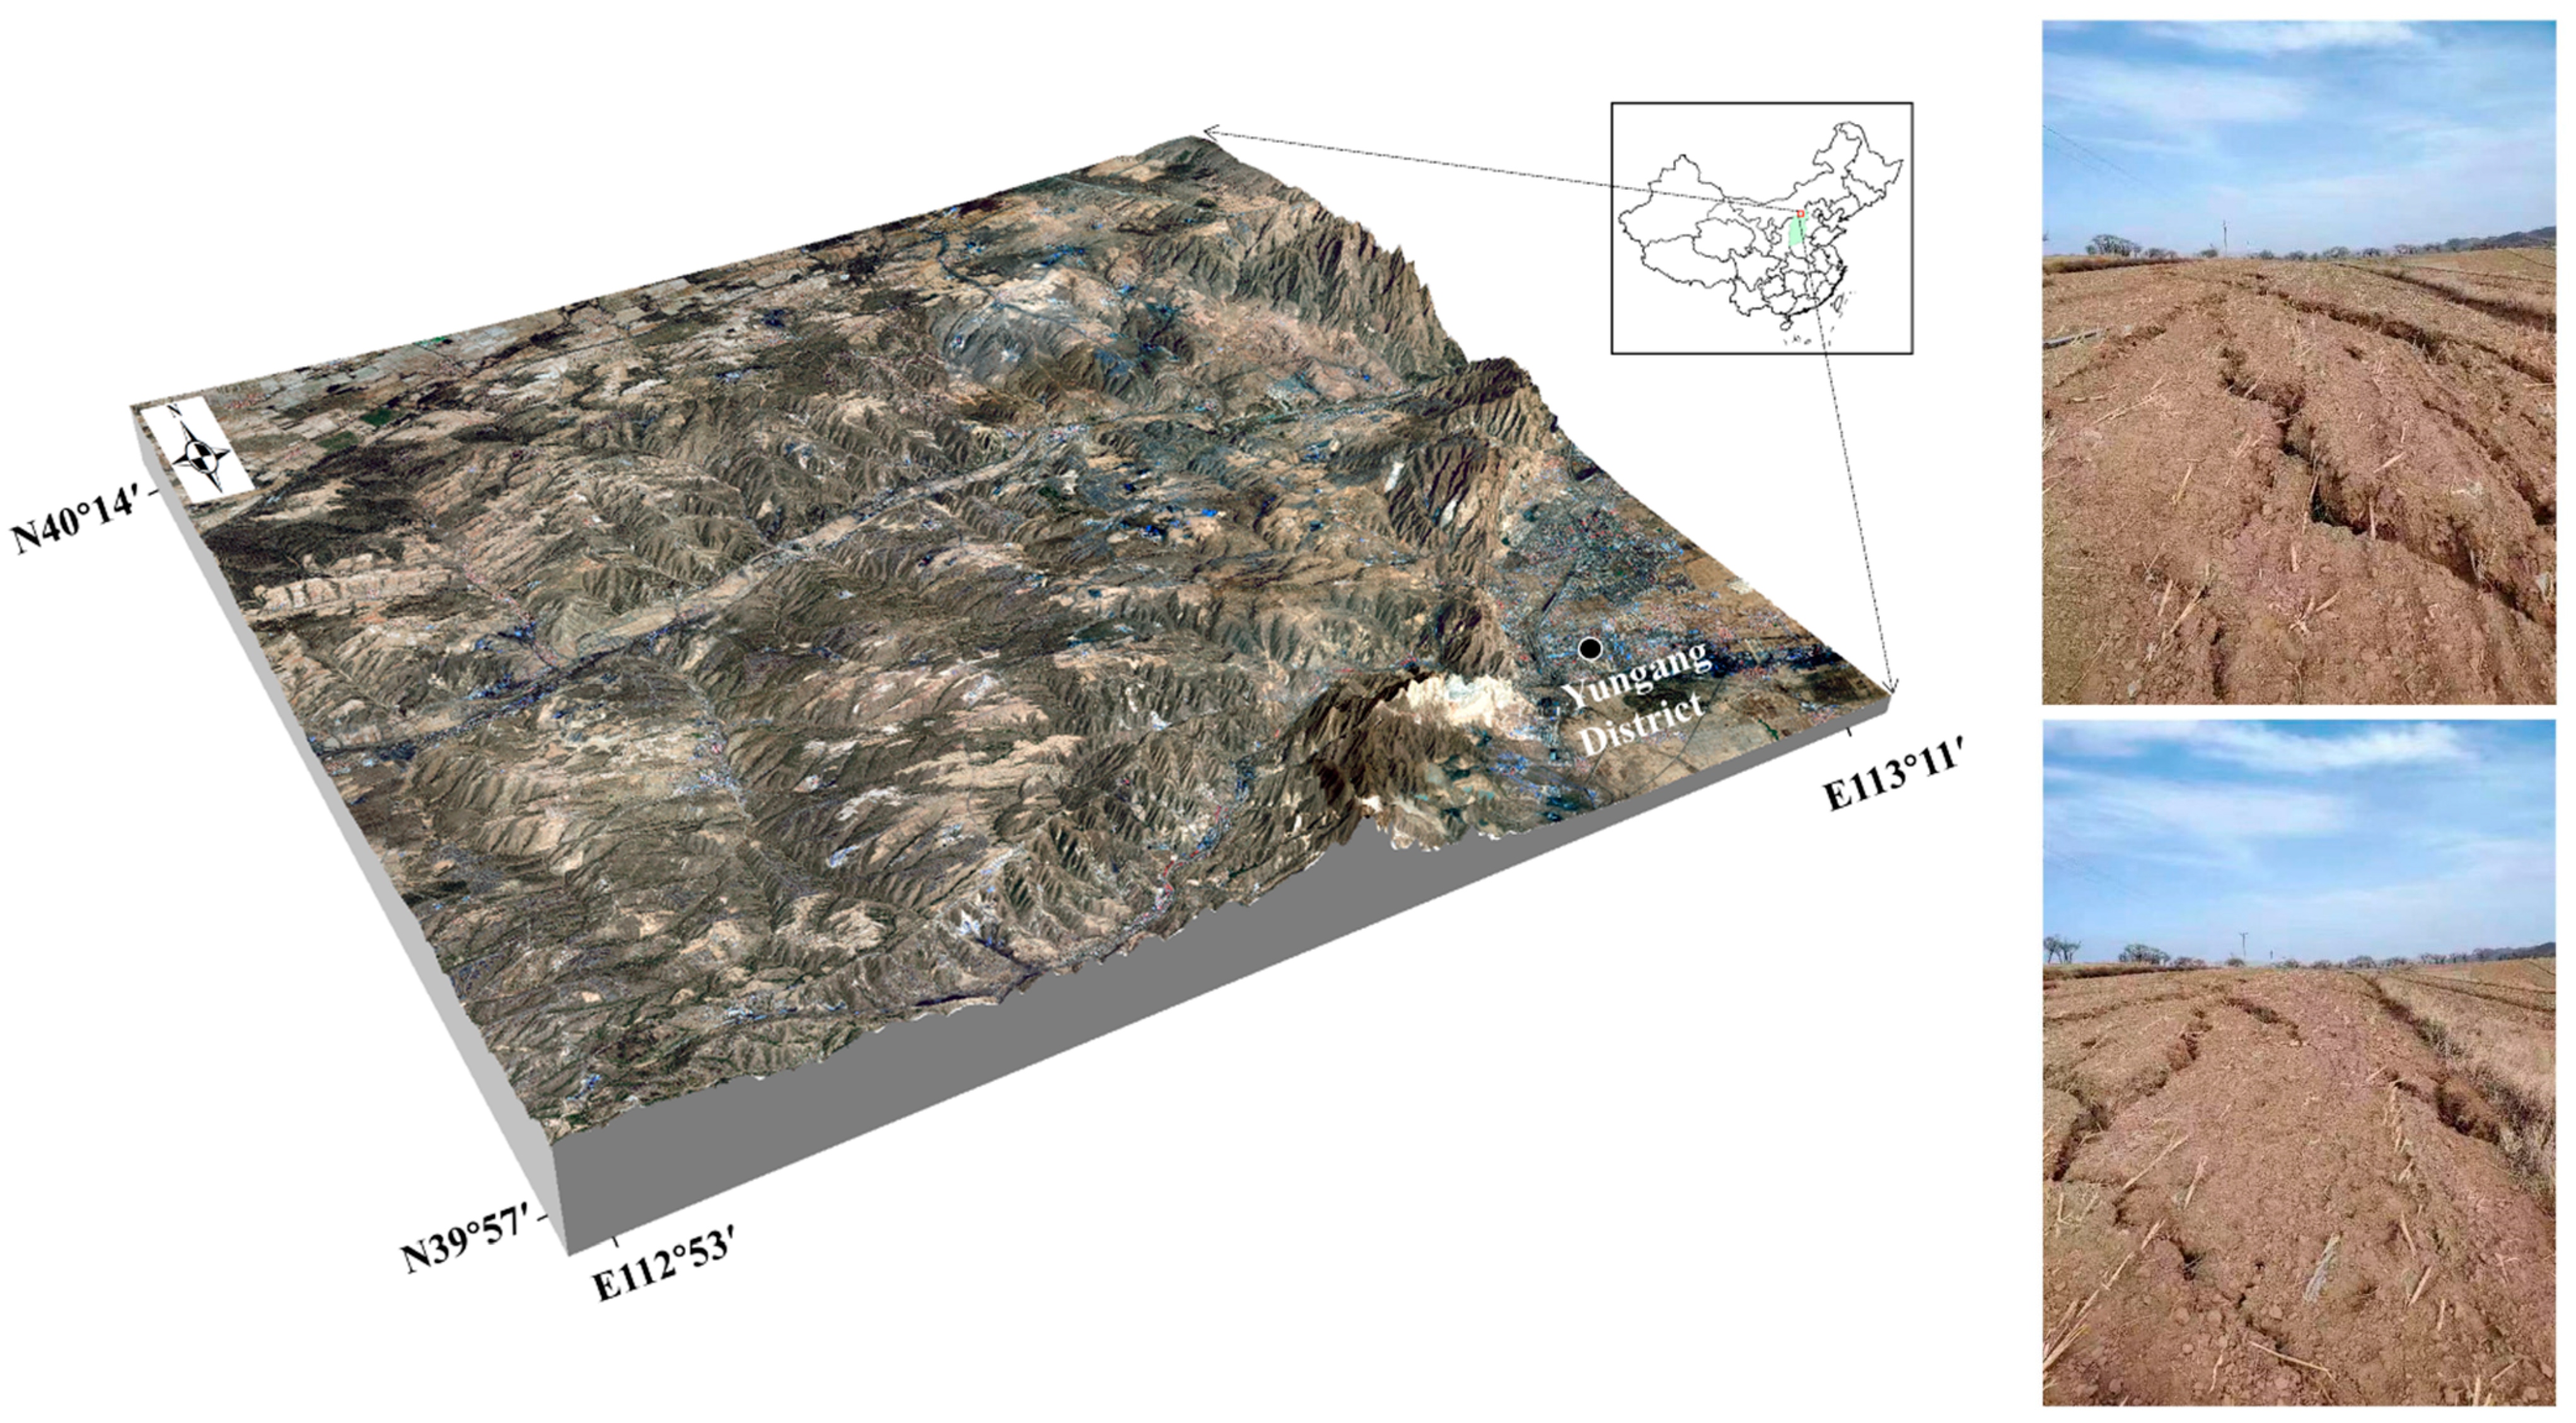
The study area is located in the Datong coalfield in the northern part of Shanxi Province. It is located at the boundary between Datong City and Shuozhou City. It is one of the six major coalfields in Shanxi Province and the second largest coal production base in China. The Datong coalfield is mainly located in the northwest region of Datong City. It is mainly mountainous and hilly. The main landforms are a loess gully area, loess hilly area and loess hilly gentle slope sandy area. Coal mining promotes rapid economic development, but also causes geological disasters such as surface subsidence, landslides and ground fissures, causing serious damage to surrounding arable land, roads and infrastructure [1], as shown in Figure 4.

3.2. Study Data

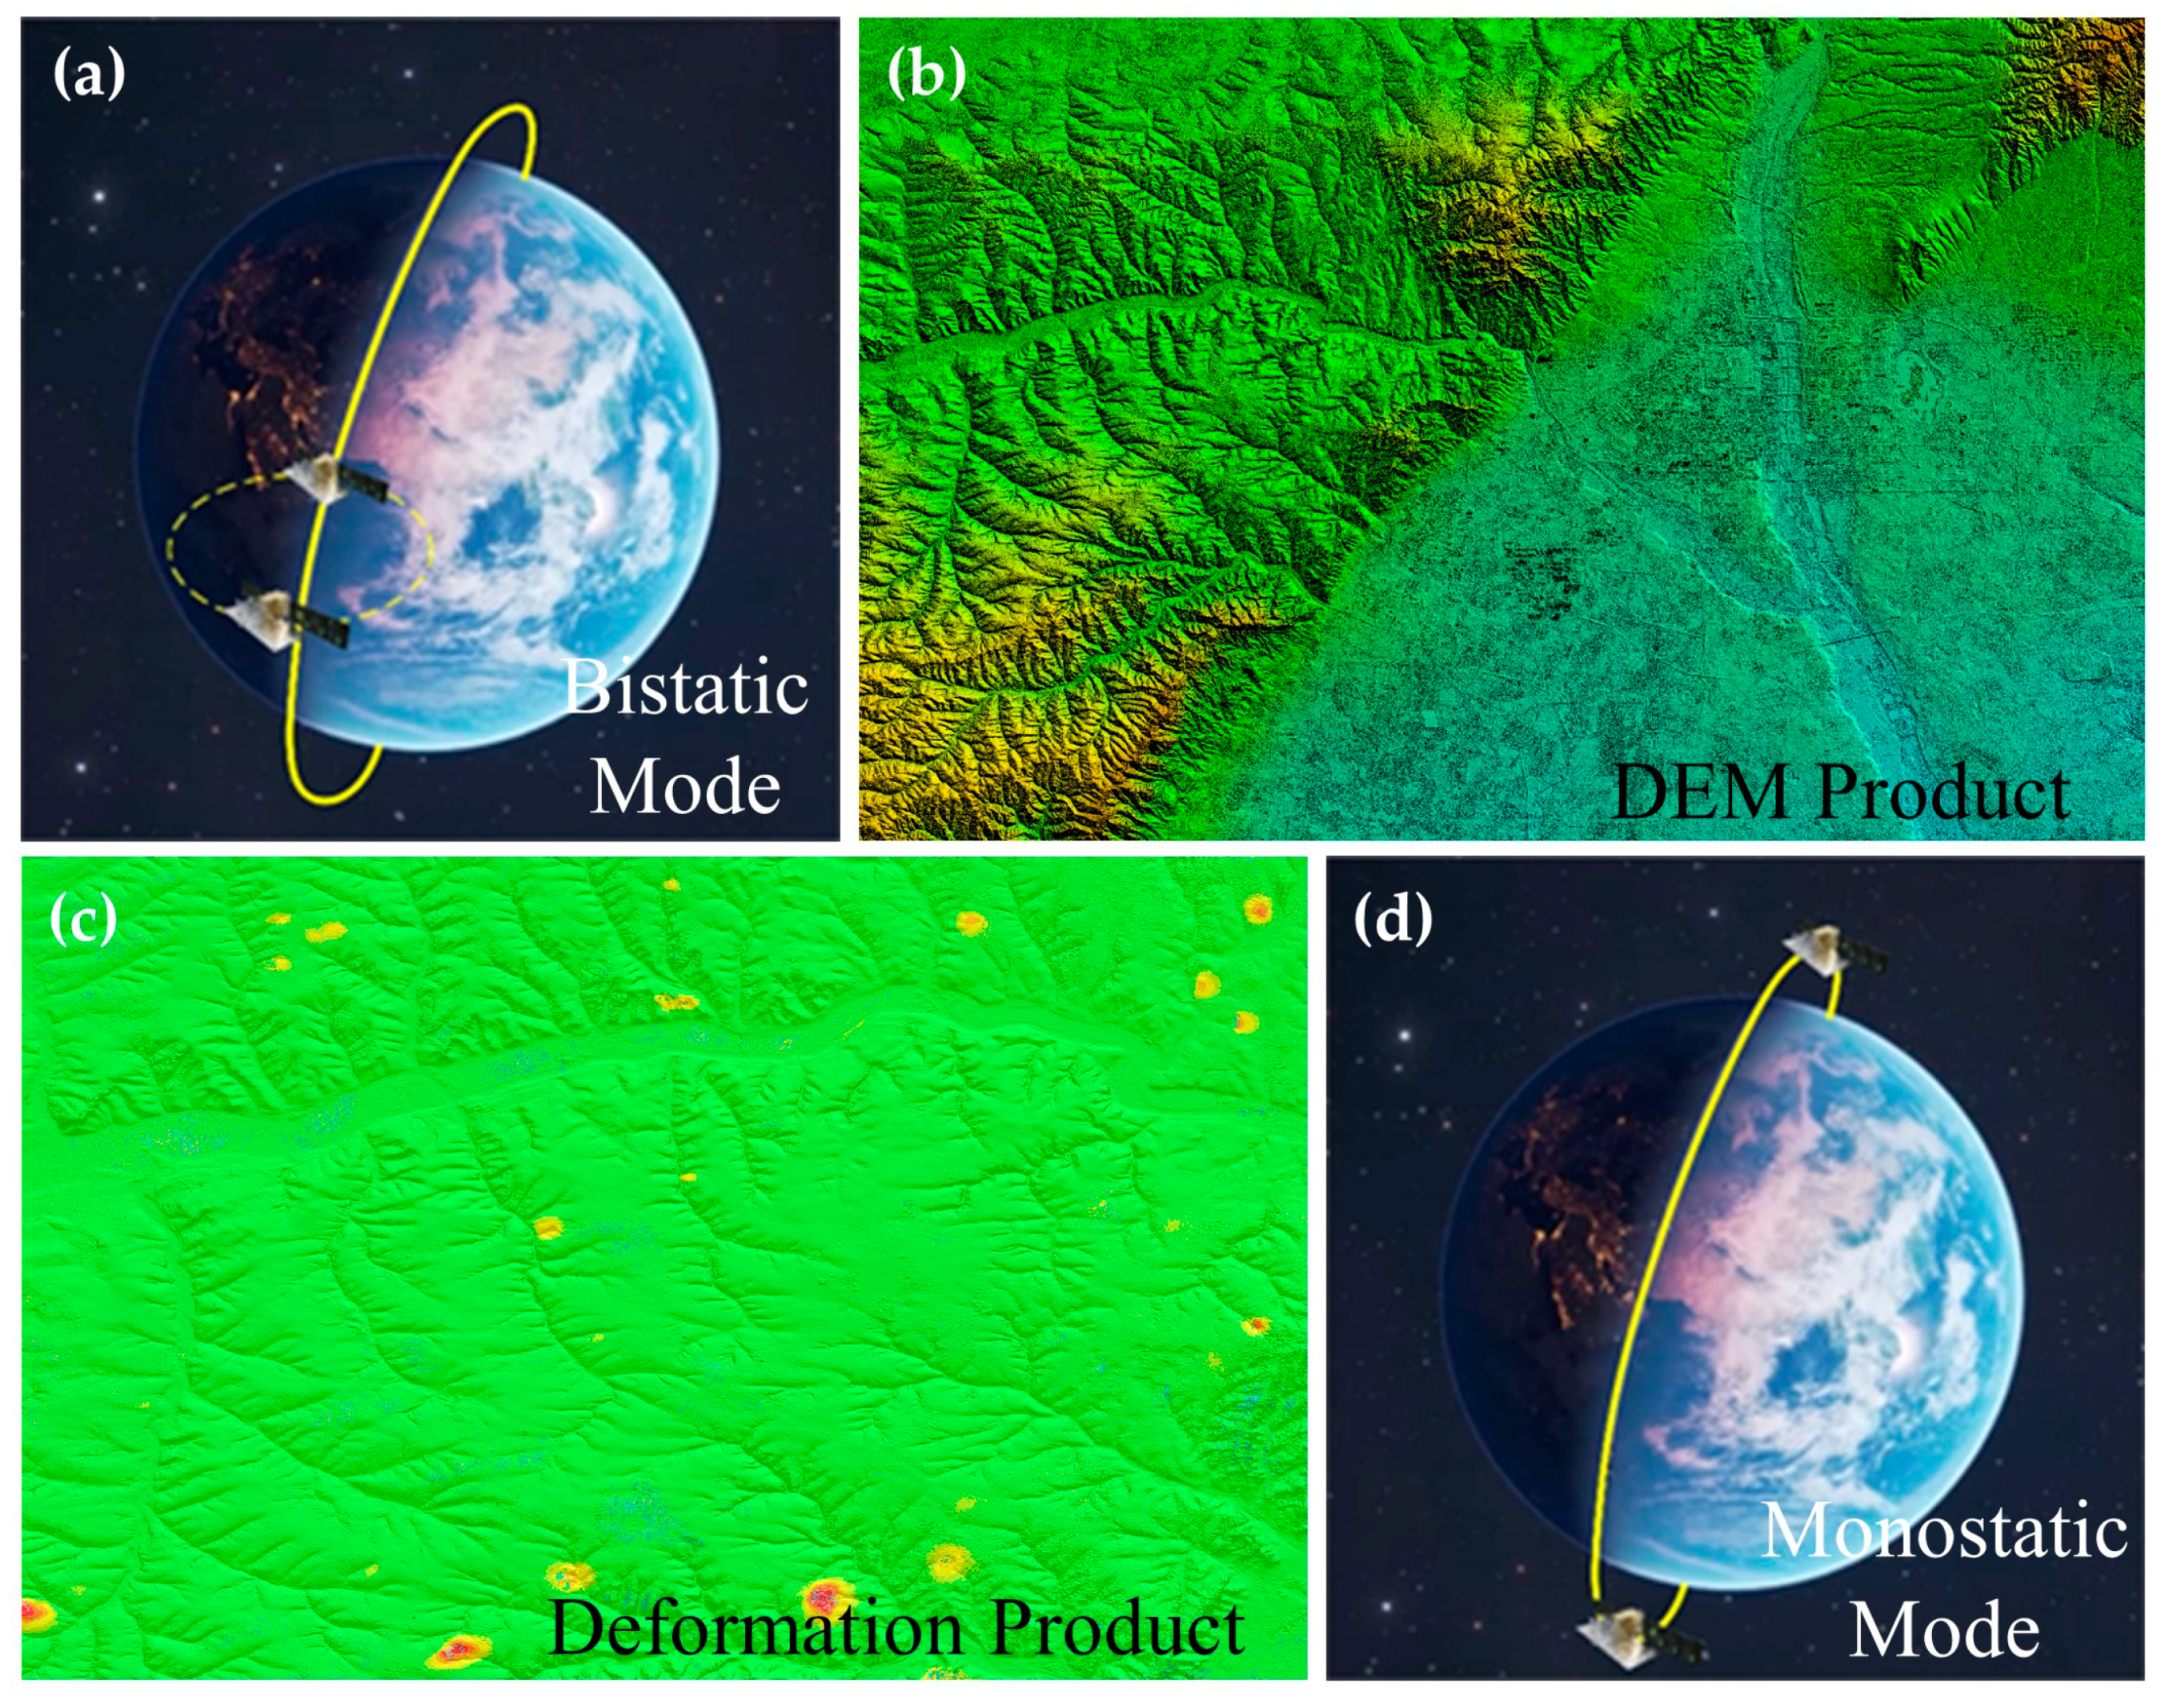
In January 2022, China successfully launched the first civilian L-band differential interferometric SAR01 satellite, the Lutan-1 A satellite. In February of the same year, the L-band differential interferometric SAR02 satellite Lutan-1 B satellite was also successfully launched into orbit, forming a dual constellation with the A satellite, which is China’s first civilian dual-satellite formation differential deformation measurement satellite [22]. Lutan-1 supports two formation modes, as shown in Figure 5. The first is the bistatic mode, which is only used in the in-orbit testing phase. The spatial baseline of the two satellites is maintained between 700 m and 7000 m to ensure high-quality completion of the corresponding data collection of 1:50,000 topographic mapping in China within 118 days, which can be used for subsequent high-precision digital elevation model (DEM) production tasks. The second mode is the monostatic mode, which provides single-satellite observation data for deformation monitoring by allowing the satellites to follow each other and keep the orbital phase difference at 180°. In view of the fact that both the InSAR and DInSAR techniques are based on phase interferometry, the Lutan-1 satellites use a variety of methods to suppress temporal and spatial incoherence. The Lutan-1 satellites have a wavelength of 23.5 cm. The time baseline of the two satellites in the monostatic mode is only 4 days, and the regression orbit control radius is 350 m, so as to ensure that the baseline coherence is greater than 0.9.
The SAR data processing software in this paper mainly uses LandSAR, which was independently developed by the Land Satellite Remote Sensing Application Center of the Ministry of Natural Resources. In the experiment, a total of 20 Lutan-1 SAR images covering the Datong mining area were selected as the data source for terrain DSM three-dimensional reconstruction and surface deformation measurement experiments. The acquisition time of the 18 scenes of monostatic SAR data is shown in Table 1, and the data aer used for surface subsidence monitoring, in which the minimum regression period is 4 days. The imaging mode is stripmap2, with an image width of 100 km × 100 km and an azimuth and range resolution of 1.46 m × 4.66 m. The incidence angle of the images ranges from 24.83° to 25.44°, and the polarization mode is HH. Among them, two scenes of bistatic SAR data were obtained on 12 November 2022, which are used for topographic mapping and DEM production. The imaging mode is stripmap1, with an image width of 50 km × 50 km and an azimuth and range resolution of 1.46 m × 1.66 m. The image incidence angle is 42.04°, and the polarization mode is HH.
In this experiment, the accuracy of the reconstructed DSM is evaluated using three methods: ICESat laser altimetry data, TanDEM data and the deformation monitoring results of bistatic SAR data and monostatic SAR data.

4. Results and Analysis

4.1. DSM Extraction and Accuracy Evaluation Results

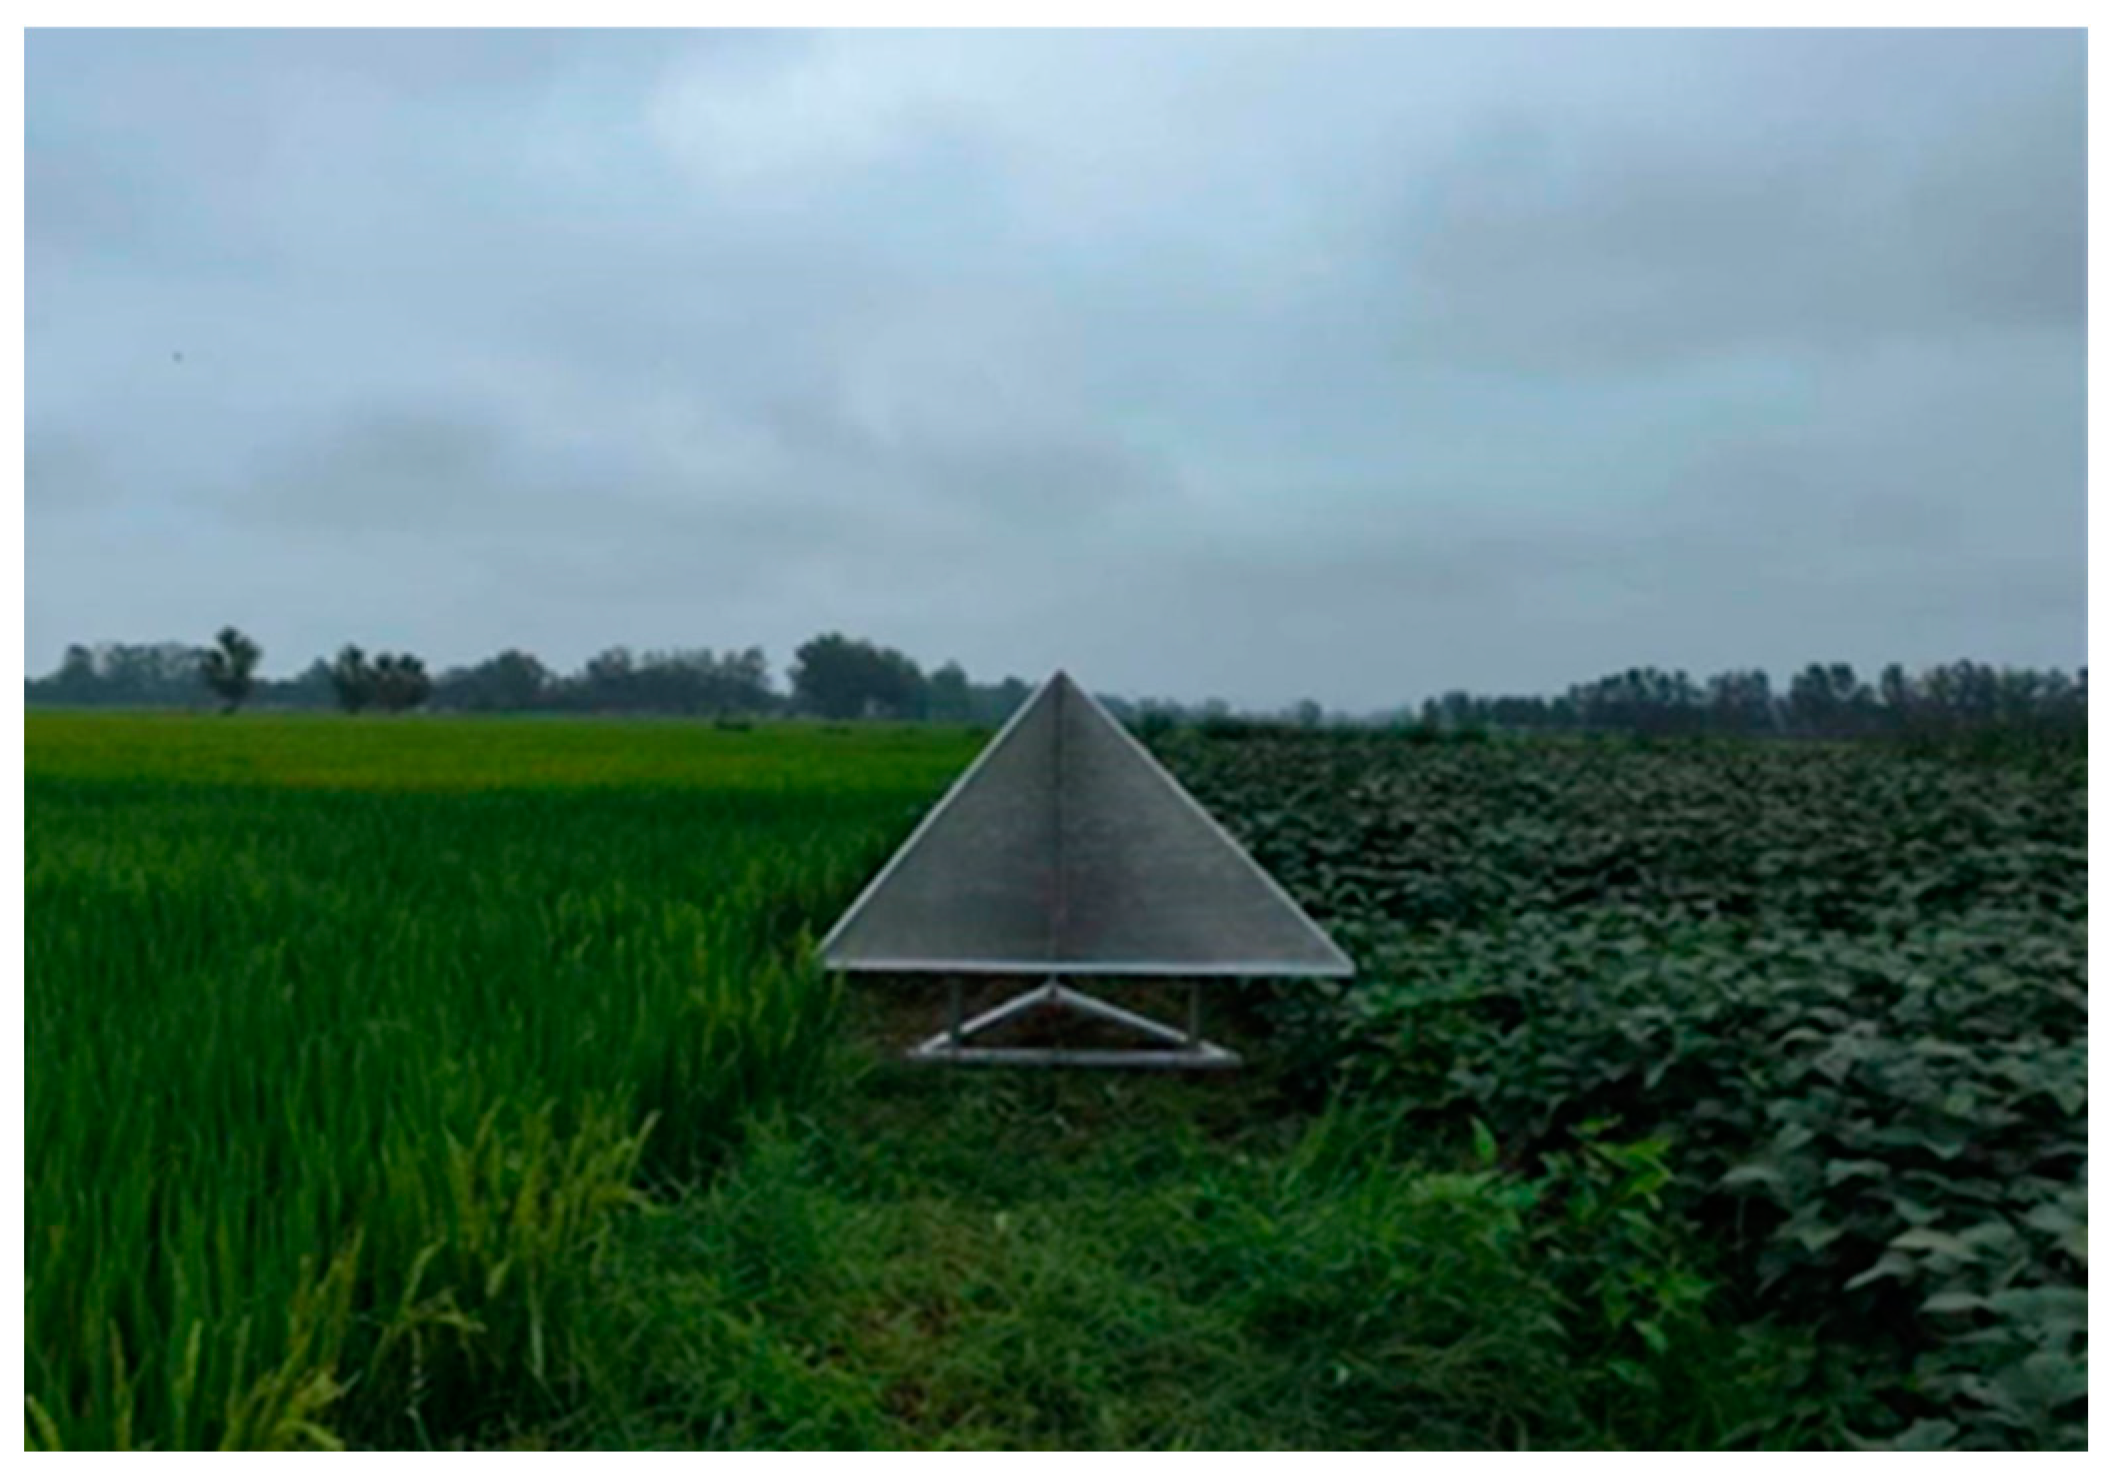
In this paper, two mobile calibration sites in Shangqiu City, Henan Province, and Suqian City, Jiangsu Province, China, are used to perform the geometric calibration and interferometry calibration on the Lutan-1 monostatic data. Each of the two calibration sites is evenly distributed with 16 corner reflectors (Figure 6). The sub-pixel corner reflector automatic extraction technology of the SAR precision imaging model is used to obtain high-precision control point coordinates. Using the coordinates of the control points to calibrate the geometric parameters, the time correction is −0.0019776 s, the slant distance correction is −38.087 m and the geometric positioning is corrected according to the correction. The comparison of the geometric positioning accuracy before and after calibration is shown in Table 2. Then, the control points are used to calibrate the interferometry, and the absolute phase error and baseline error are solved, respectively, so as to improve the elevation accuracy of LT-DSM. A comparison of the LT-DSM accuracy before and after calibration can be seen in Table 3. It can be seen that the accuracy of topographic mapping can be greatly improved after calibration.
The DSM results based on Lutan-1 bistatic SAR data reconstruction are shown in Figure 7a (LT-DSM). The reconstructed LT-DSM data have a resolution of 10 m × 10 m, which is much higher than the TanDEM data, with a resolution of 90 m × 90 m. The details are richer and the accuracy is higher. Firstly, the accuracy of LT-DSM is evaluated by using ICESat data. The number of effective points participating in the evaluation is 6062, and the average error is 1.3 m, of which the error is 2.8 m, which meets the mapping accuracy standard of a 1:50,000-scale DEM. The error distribution histogram (Figure 7c) conforms to the Gaussian error distribution law, and the error is mainly concentrated within ±10 m. Secondly, the LT-DSM is resampled to match the resolution of the TanDEM data, and then the accuracy is evaluated (Figure 7d). Among them, there are 29,850,659 valid evaluation points, with an average error of 0.168 m and a median error of 2.986 m. Via comparison, it is found that the topographic changes are mainly concentrated in the mountainous areas, while the topographic changes are relatively stable in the plain areas.

4.2. Deformation Monitoring and Analysis in the Mining Area

4.2.1. DInSAR Deformation Monitoring Analysis

Based on the theoretical accuracy evaluation of the reconstructed LT-DSM, this paper uses LT-DSM data and TanDEM data as external terrain information to cooperate with the LuTan-1 monostatic SAR data to complete the deformation monitoring of the Datong mining area using the DInSAR and multi-temporal InSAR (MTInSAR) methods. According to the deformation monitoring results, the accuracy of the two DEMs and the deformation monitoring ability of the DInSAR and MTInSAR methods in the Datong mining area are analyzed. Due to the limitation of the leveling data and spatio-temporal coherence, this paper selects six monostatic SAR data from the Lutan-1 satellites for DInSAR deformation measurement, which consists of four interference pairs. The data parameters are shown in Table 4, and the DInSAR results are shown in Figure 8.
Due to the improvement of the DEM resolution, the registration accuracy of the DEM and SAR images is also improved. When the LT-DSM data are used to simulate the terrain phase, the optimal range registration error can reach 0.1336 pixels and the azimuth registration error can reach 0.0821 pixels in the intensity map and DEM registration. When TanDEM is used to simulate the terrain phase, the range registration error can reach 0.2869 pixels and the azimuth registration error can reach 0.2587 pixels. Therefore, the range and azimuth registration accuracy can be improved one and three times over, respectively. It can be clearly seen from Figure 8 that there is a very large terrain error in the lower-right corner of the TanDEM-DInSAR results. Not only that but there is also a large terrain error near the valley, and the use of LT-DSM to simulate the terrain can effectively reduce the terrain error. It can be seen from the local profile that the LT-DSM-DInSAR surface monitoring results fluctuate around the 0 value. However, due to the influence of topographic errors, the TanDEM-DInSAR deformation results can be lifted by 0.1 m around 500 m from the A point, and the uplift is around 0.06 m around 1200 m from the A point. Therefore, the DInSAR results based on LT-DSM in removing the terrain phase are more accurate, which reflects the advantages of the high precision and high timeliness of LT-DSM, and can accurately characterize the ground elevation information. However, the influence of the terrain on LT-DSM-DInSAR is still not completely removed, and more accurate surface deformation measurement results can be further obtained using the MTInSAR method.

4.2.2. SBAS-InSAR Deformation Monitoring Analysis

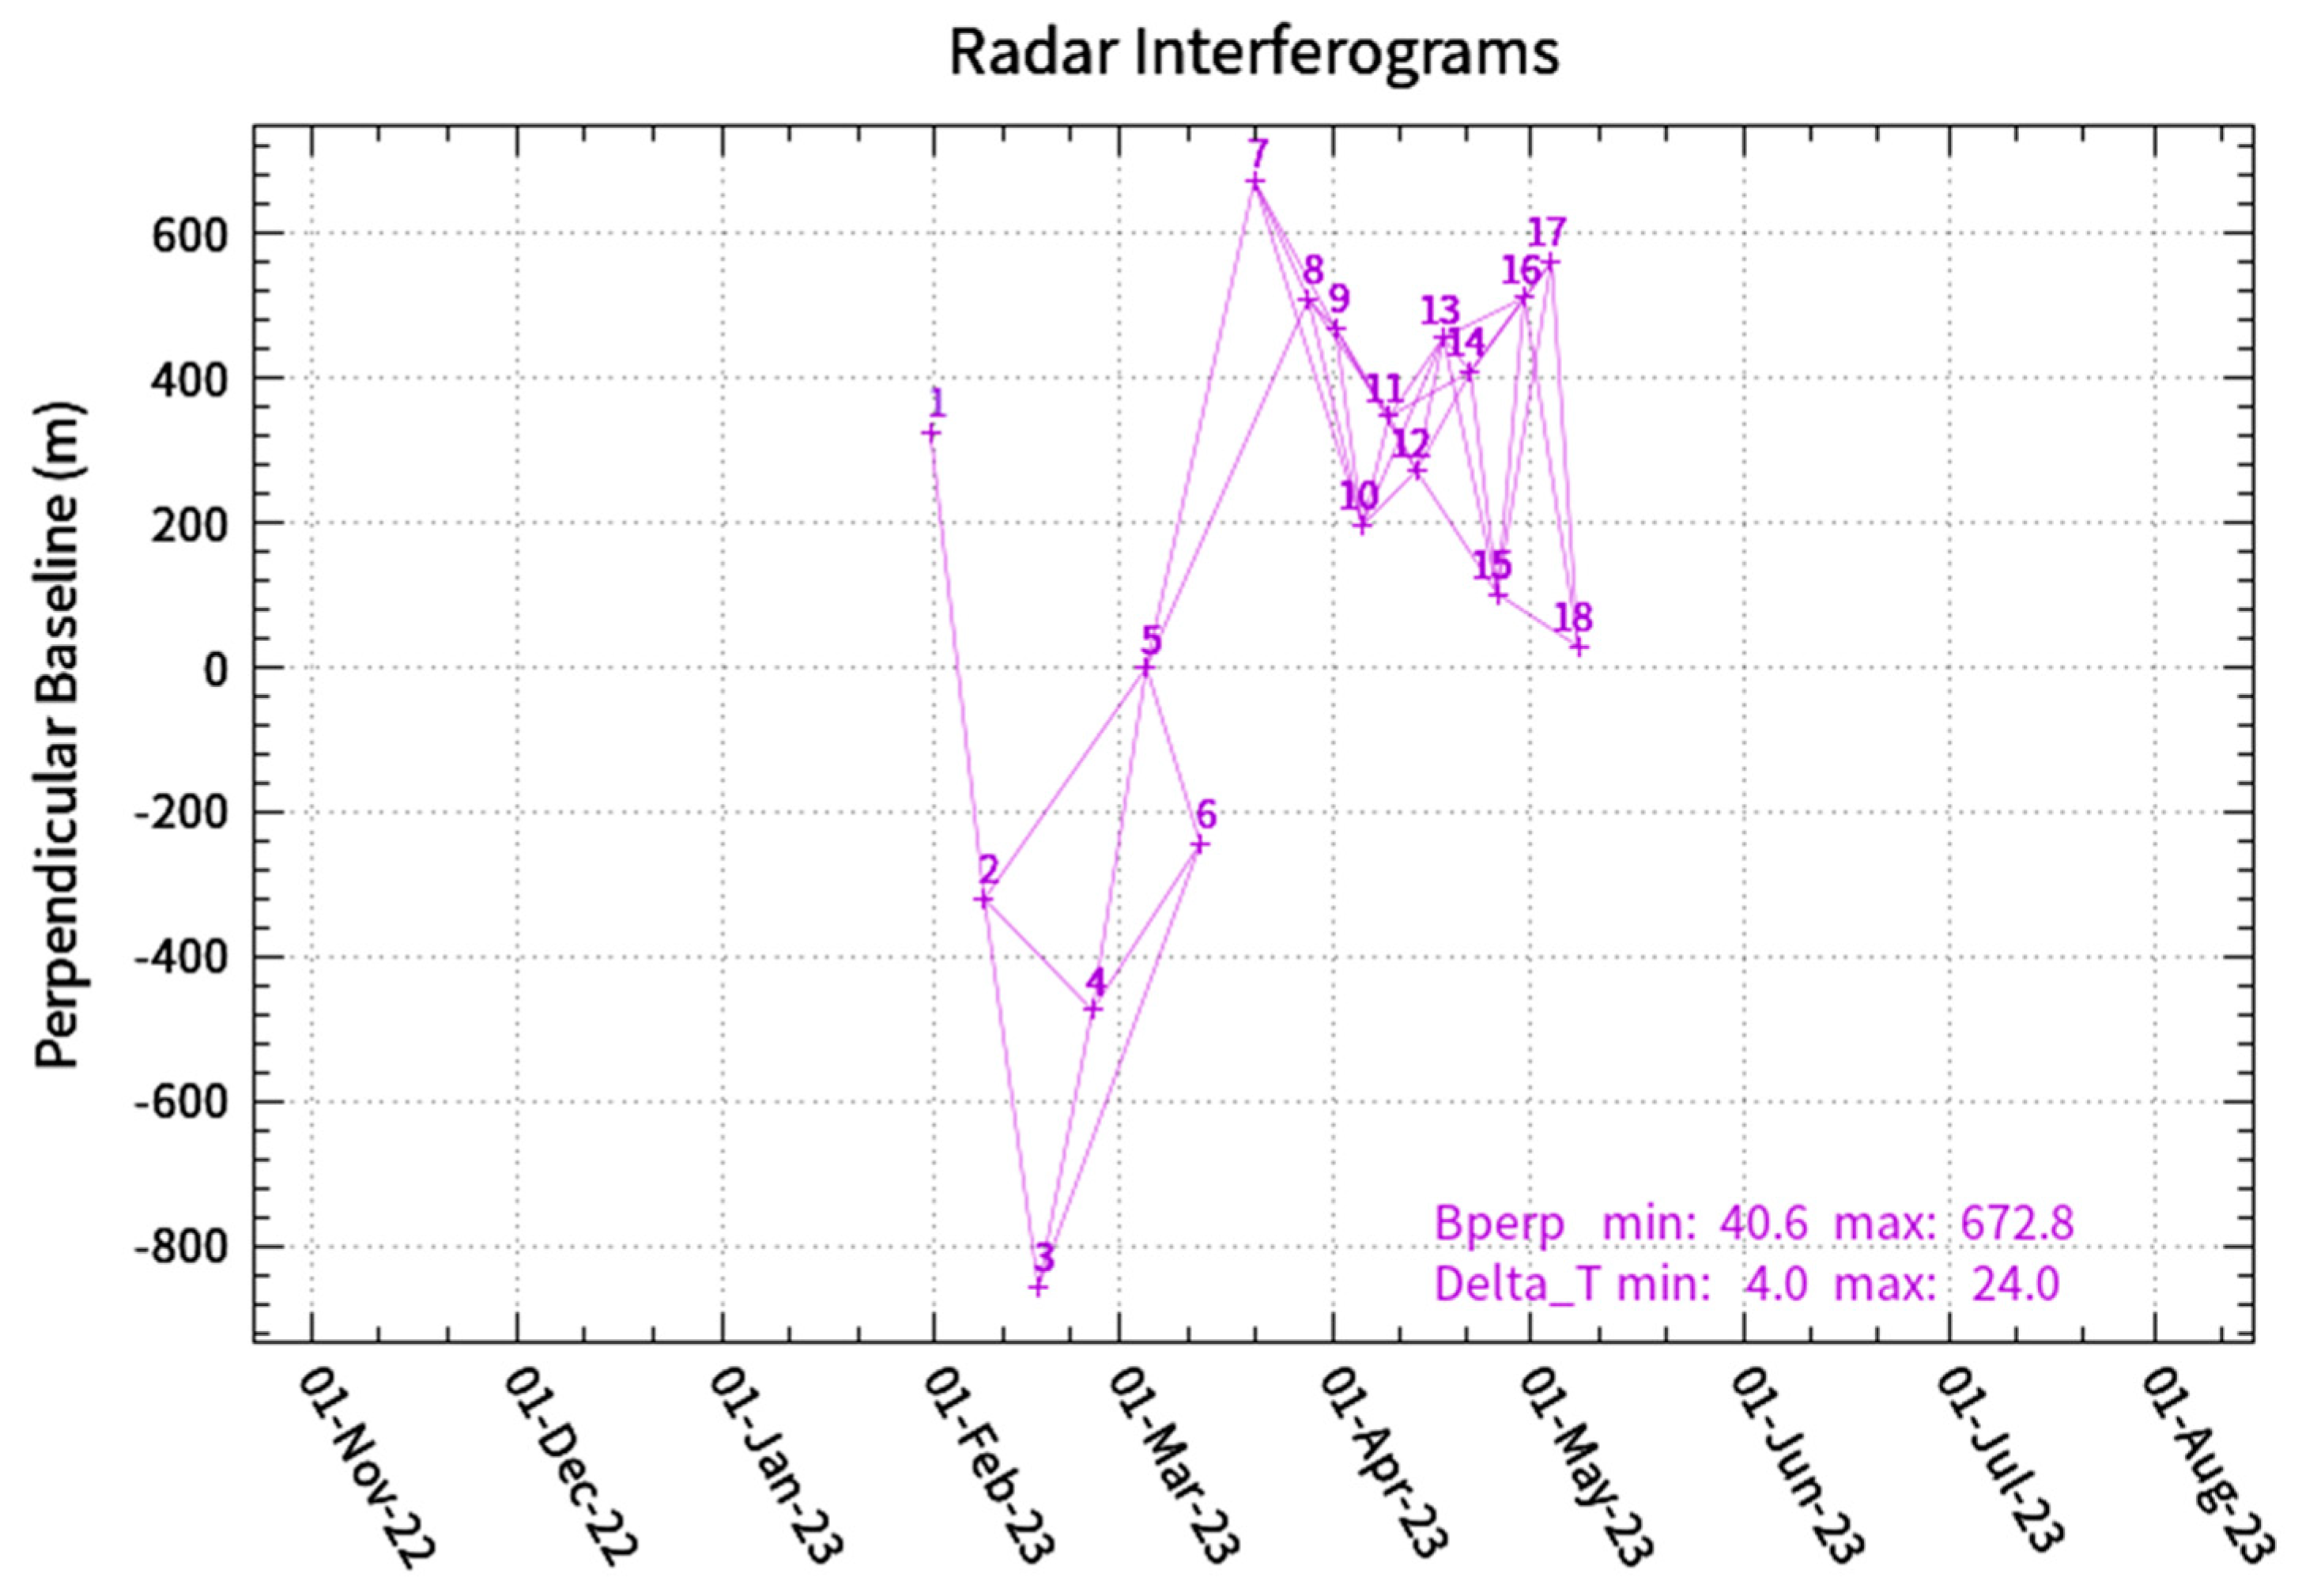
In this paper, 18 scenes of Lutan-1 SAR data similar to the leveling data are selected for Stacking-SBAS deformation measurement, forming 41 interferometry pairs (Figure 9), of which the maximum time baseline is 24 days and the minimum is 4 days, the maximum vertical space baseline is 672.8 m and the minimum is 40.6 m. The fifth SAR image (i.e., 20230305) with the time baseline and spatial baseline relatively centered is selected as the main image.
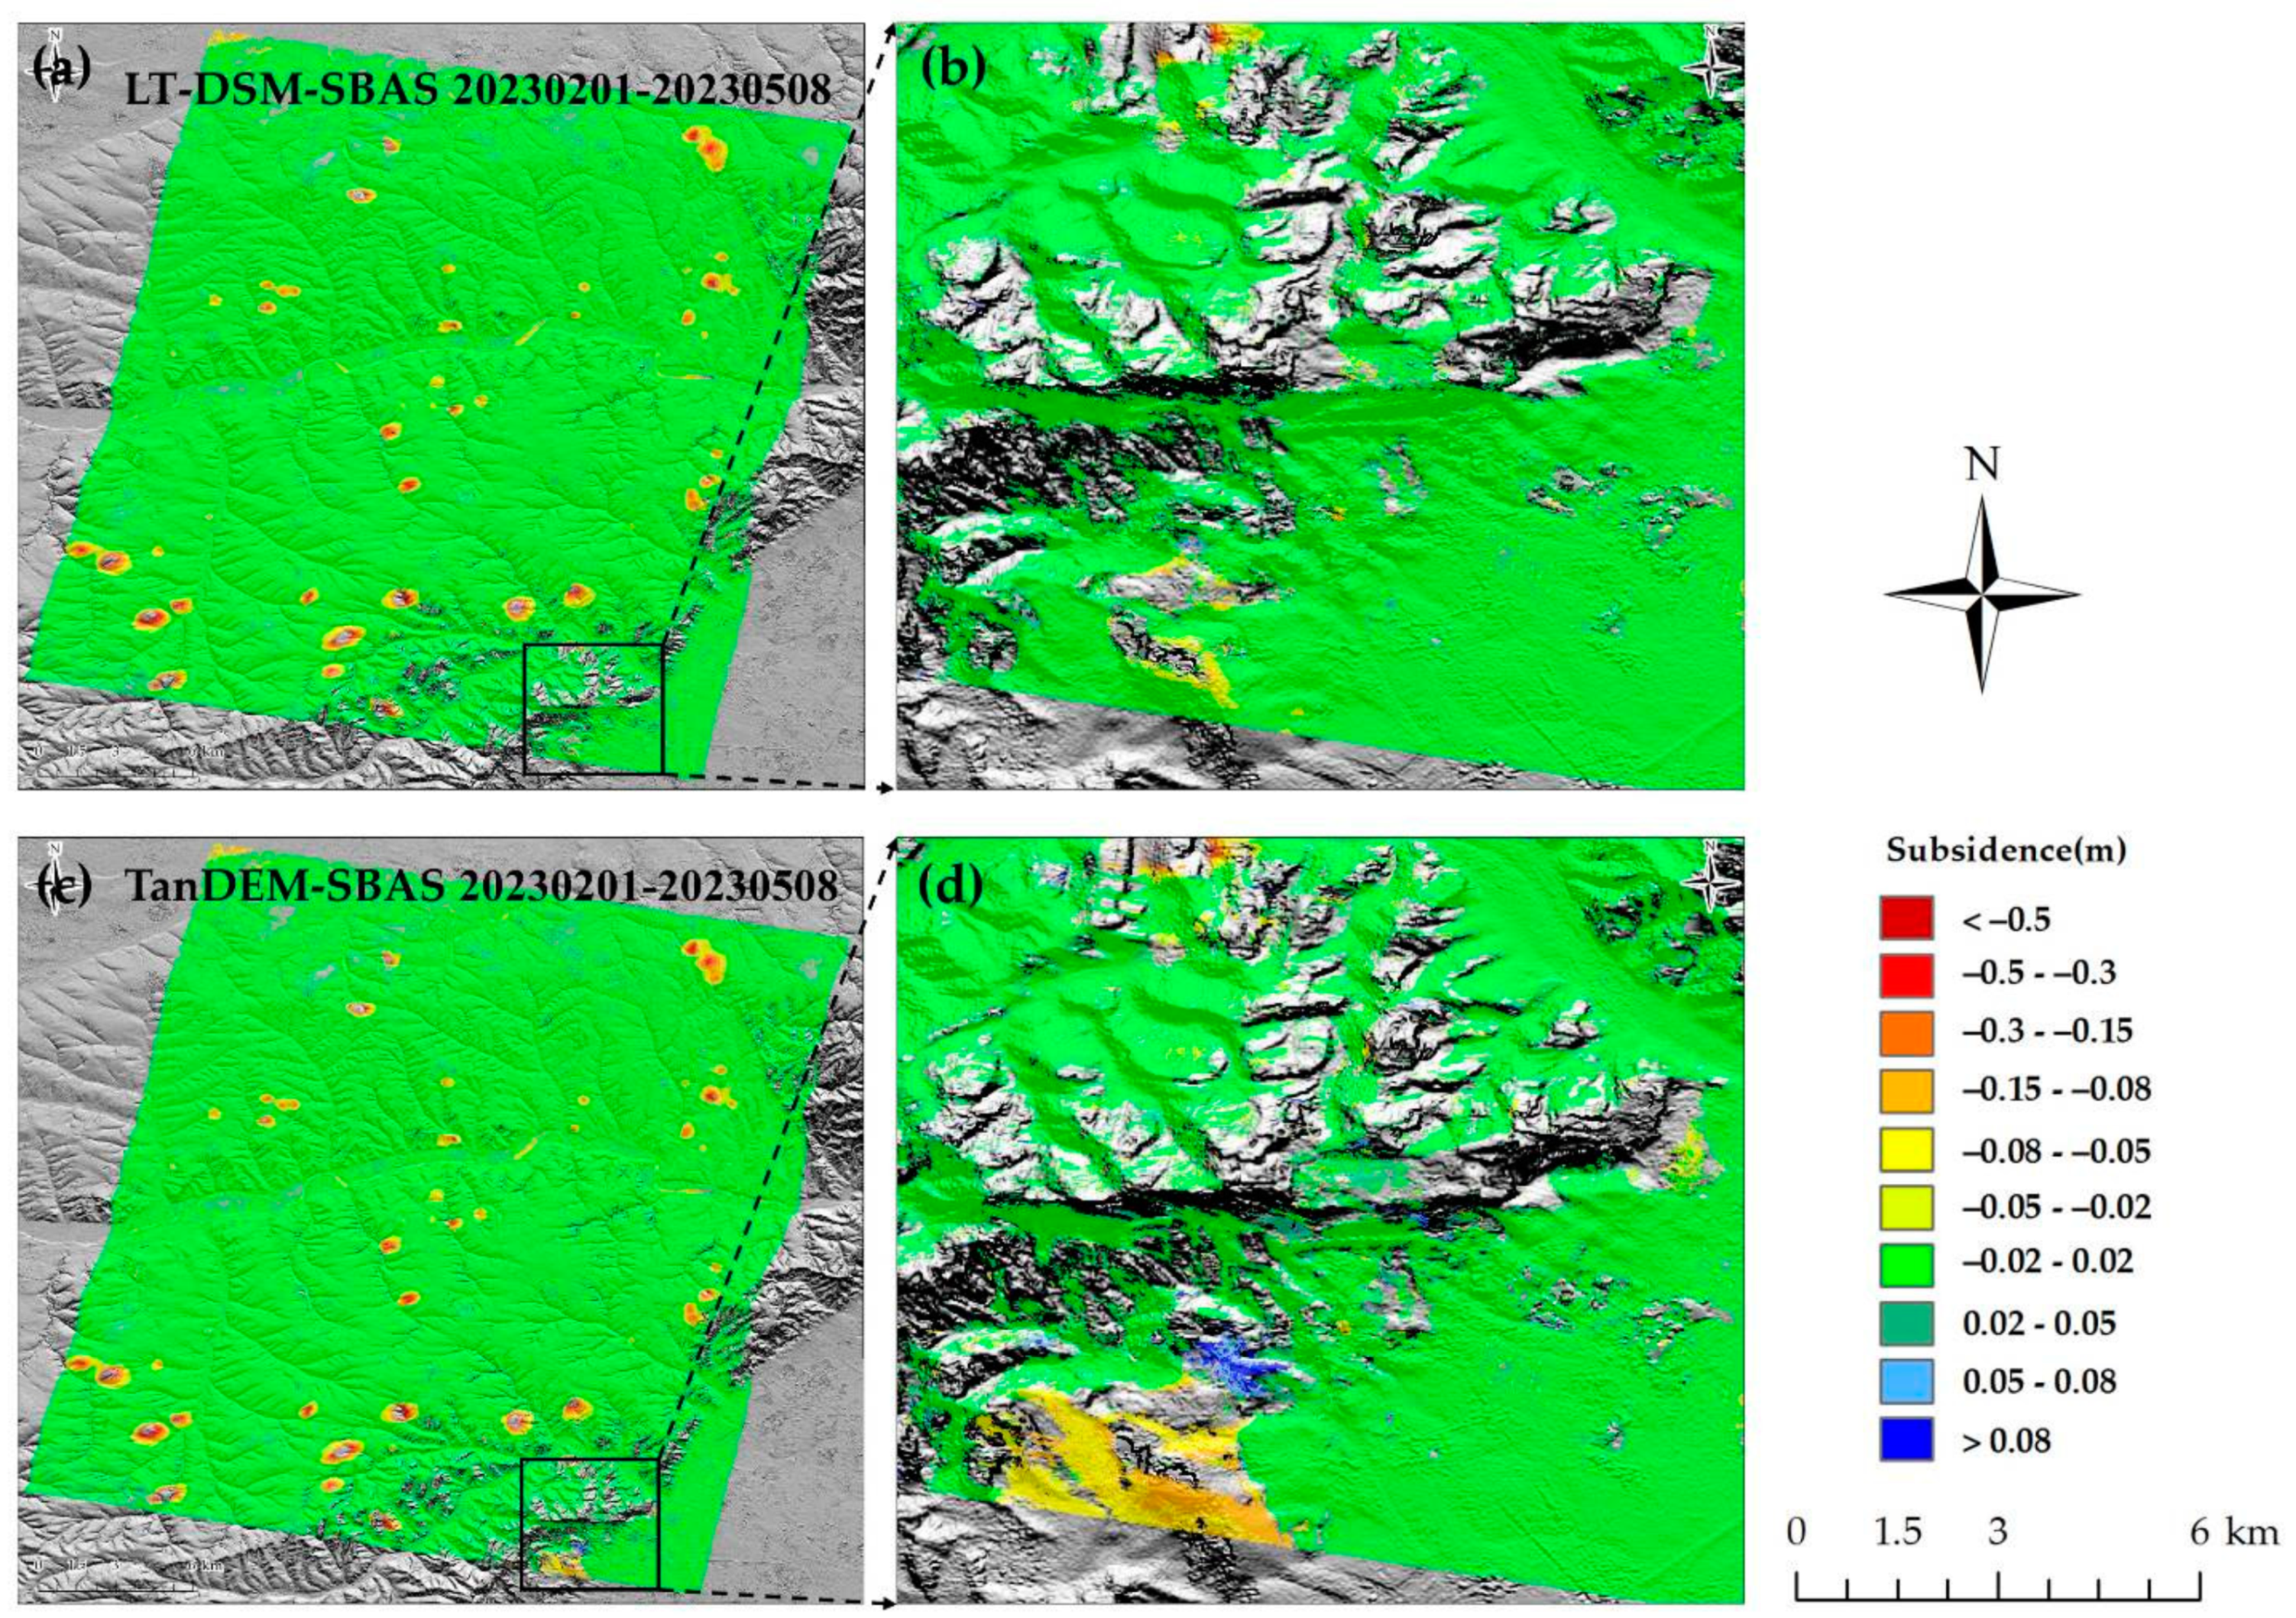
Due to the large subsidence of the mining area, some leveling data show that the subsidence reached 2.681 m from 27 February to 26 April, resulting in serious pixels offset and a loss of coherence near the center of the mining area, and it is difficult to monitor the subsidence near the center of the mining area. Among them, the cumulative maximum subsidence of the SBAS deformation monitoring time based on LT-DSM removing the terrain phase is 1.599 m and the maximum uplift is 0.132 m, and the cumulative maximum subsidence of TanDEM removing the terrain phase is 1.634 m and the maximum uplift is 0.166 m. By comparing the results of TanDEM-SBAS and TanDEM-DInSAR, it can be found that the SBAS method can significantly reduce the influence of topographic errors on deformation monitoring. However, there are still a small number of mountain topographic errors that cannot be effectively removed. By comparing the local results of Figure 10b,d, it is not difficult to find that the time-series cumulative subsidence results using LT-DSM-SBAS are better and the terrain error is smaller. We selected one of the mining areas with relatively complete measurements for profile comparison:
In Figure 11b, the cumulative subsidence profile of the SBAS time series based on TanDEM terrain removal reaches a maximum subsidence value of 655.5 mm at 524.190 m from point A, while the cumulative subsidence profile of LT-DSM-SBAS reaches a maximum subsidence value of 656.7 mm at 519.837 m from point A. At this time, the subsidence value of TanDEM-SBAS is −654.5 mm, and there is only a slight difference between the two. By comparing (c) and (d), it can be seen that the cumulative subsidence trend of the two is basically the same, but in contrast, the cumulative subsidence profile curve of LT-DSM-SBAS is smoother and closer to the funnel shape of the mining area.

4.2.3. Stacking-InSAR Deformation Monitoring Analysis

In the subsidence rate results, it can be seen that there are still some residuals that cannot be completely removed in the lower left. Because the terrain is removed based on the DEM of two different periods and the error between the two does not change significantly, they can be judged as non-terrain errors. In the subsidence rate profile, the LT-DSM-Stacking deformation rate curve is basically consistent with the TanDEM-Stacking deformation rate curve, but the maximum deformation rate position of the SBAS method is slightly delayed in Figure 12c, and the maximum subsidence rate is higher. The LT-DSM-Stacking and TanDEM-Stacking profiles reach maximum subsidence rates of −2.452 m/a and −2.404 m/a near 560 m from point A. At this time, TanDEM-SBAS reaches a maximum subsidence rate of −2.587 m/a, while the LT-DSM-SBAS profile reaches a maximum subsidence rate of −2.604 m/a near 569 m from point A. Finally, whether it is the Stacking method or the SBAS method, the subsidence rate profile curve based on LT-DSM is smoother than that based on TanDEM.

4.3. Leveling Data Validation

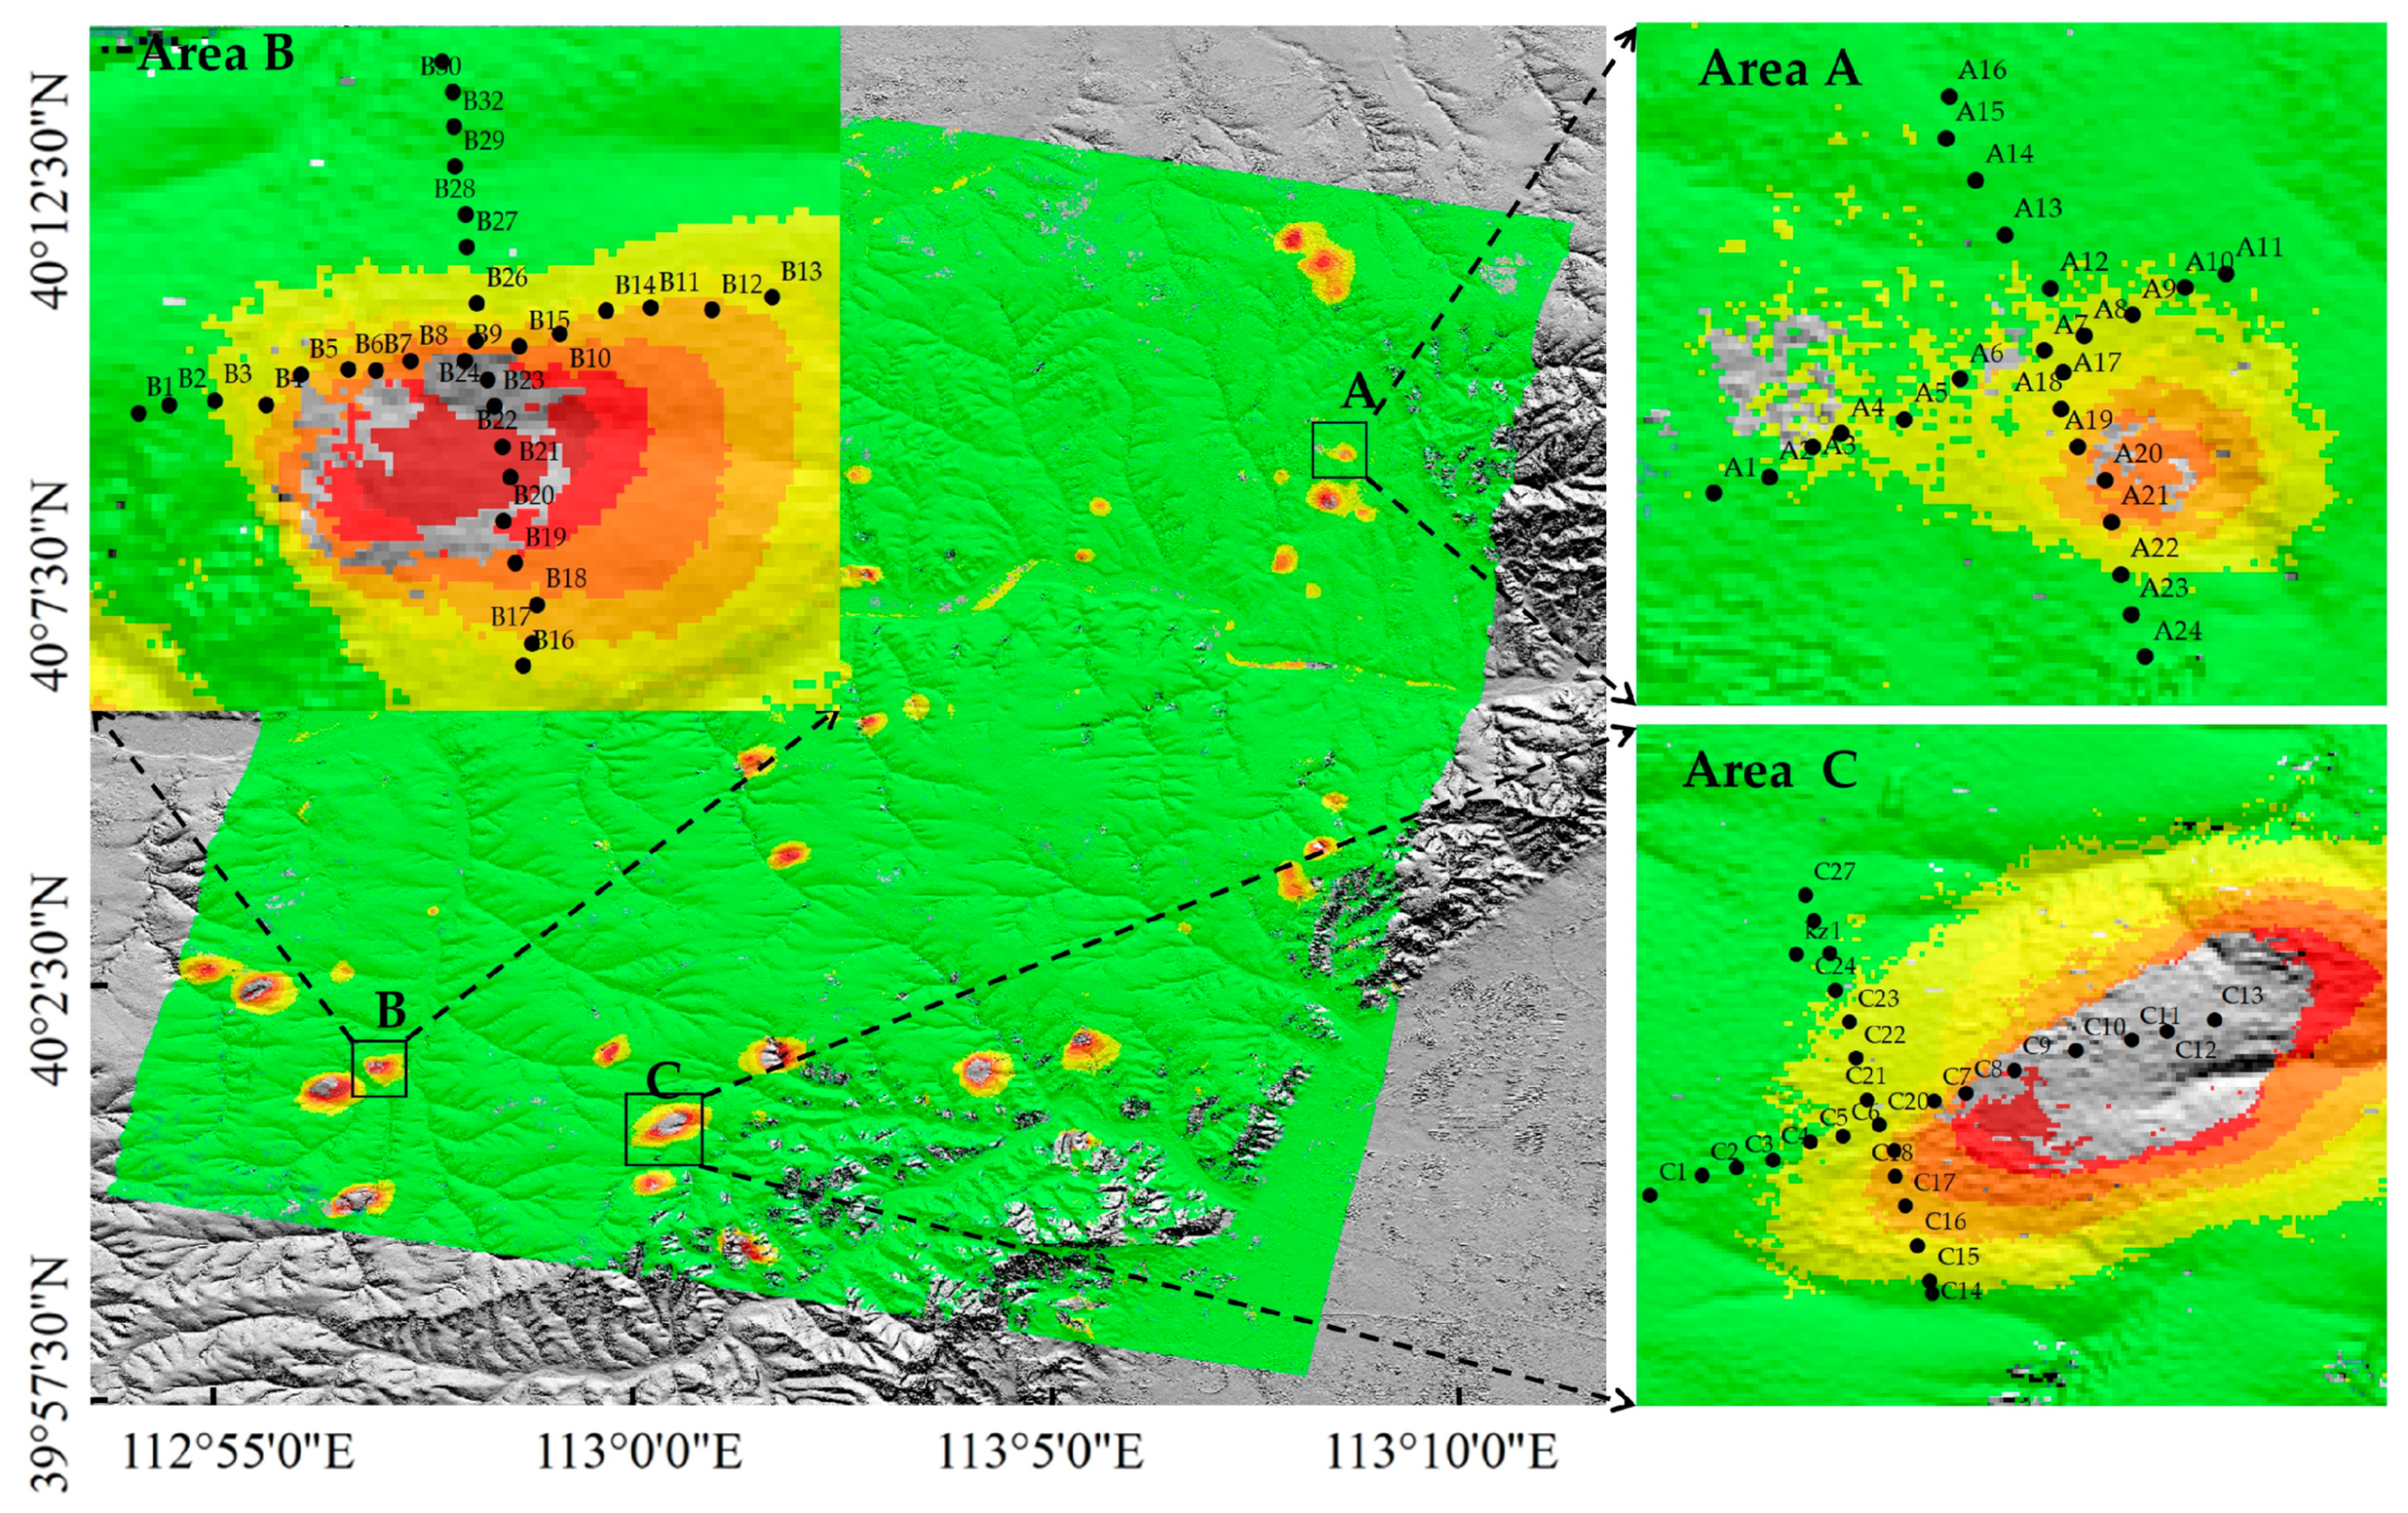
The leveling data evaluated using the InSAR deformation measurement results are mainly in three areas: A, B and C. The layout date is mainly around 24 February 2023, and its distribution is shown in Figure 13. Because most of the leveling points are located near the mining area, some leveling points are destroyed at the middle or late stages mainly due to the influence of subsidence factors and natural factors in the mining area. Especially in the two large subsidence areas of B and C, the leveling data show that significant subsidence can reach about 3 m. Therefore, this paper only selects some leveling data to verify in the spatial domain and time domain, respectively.
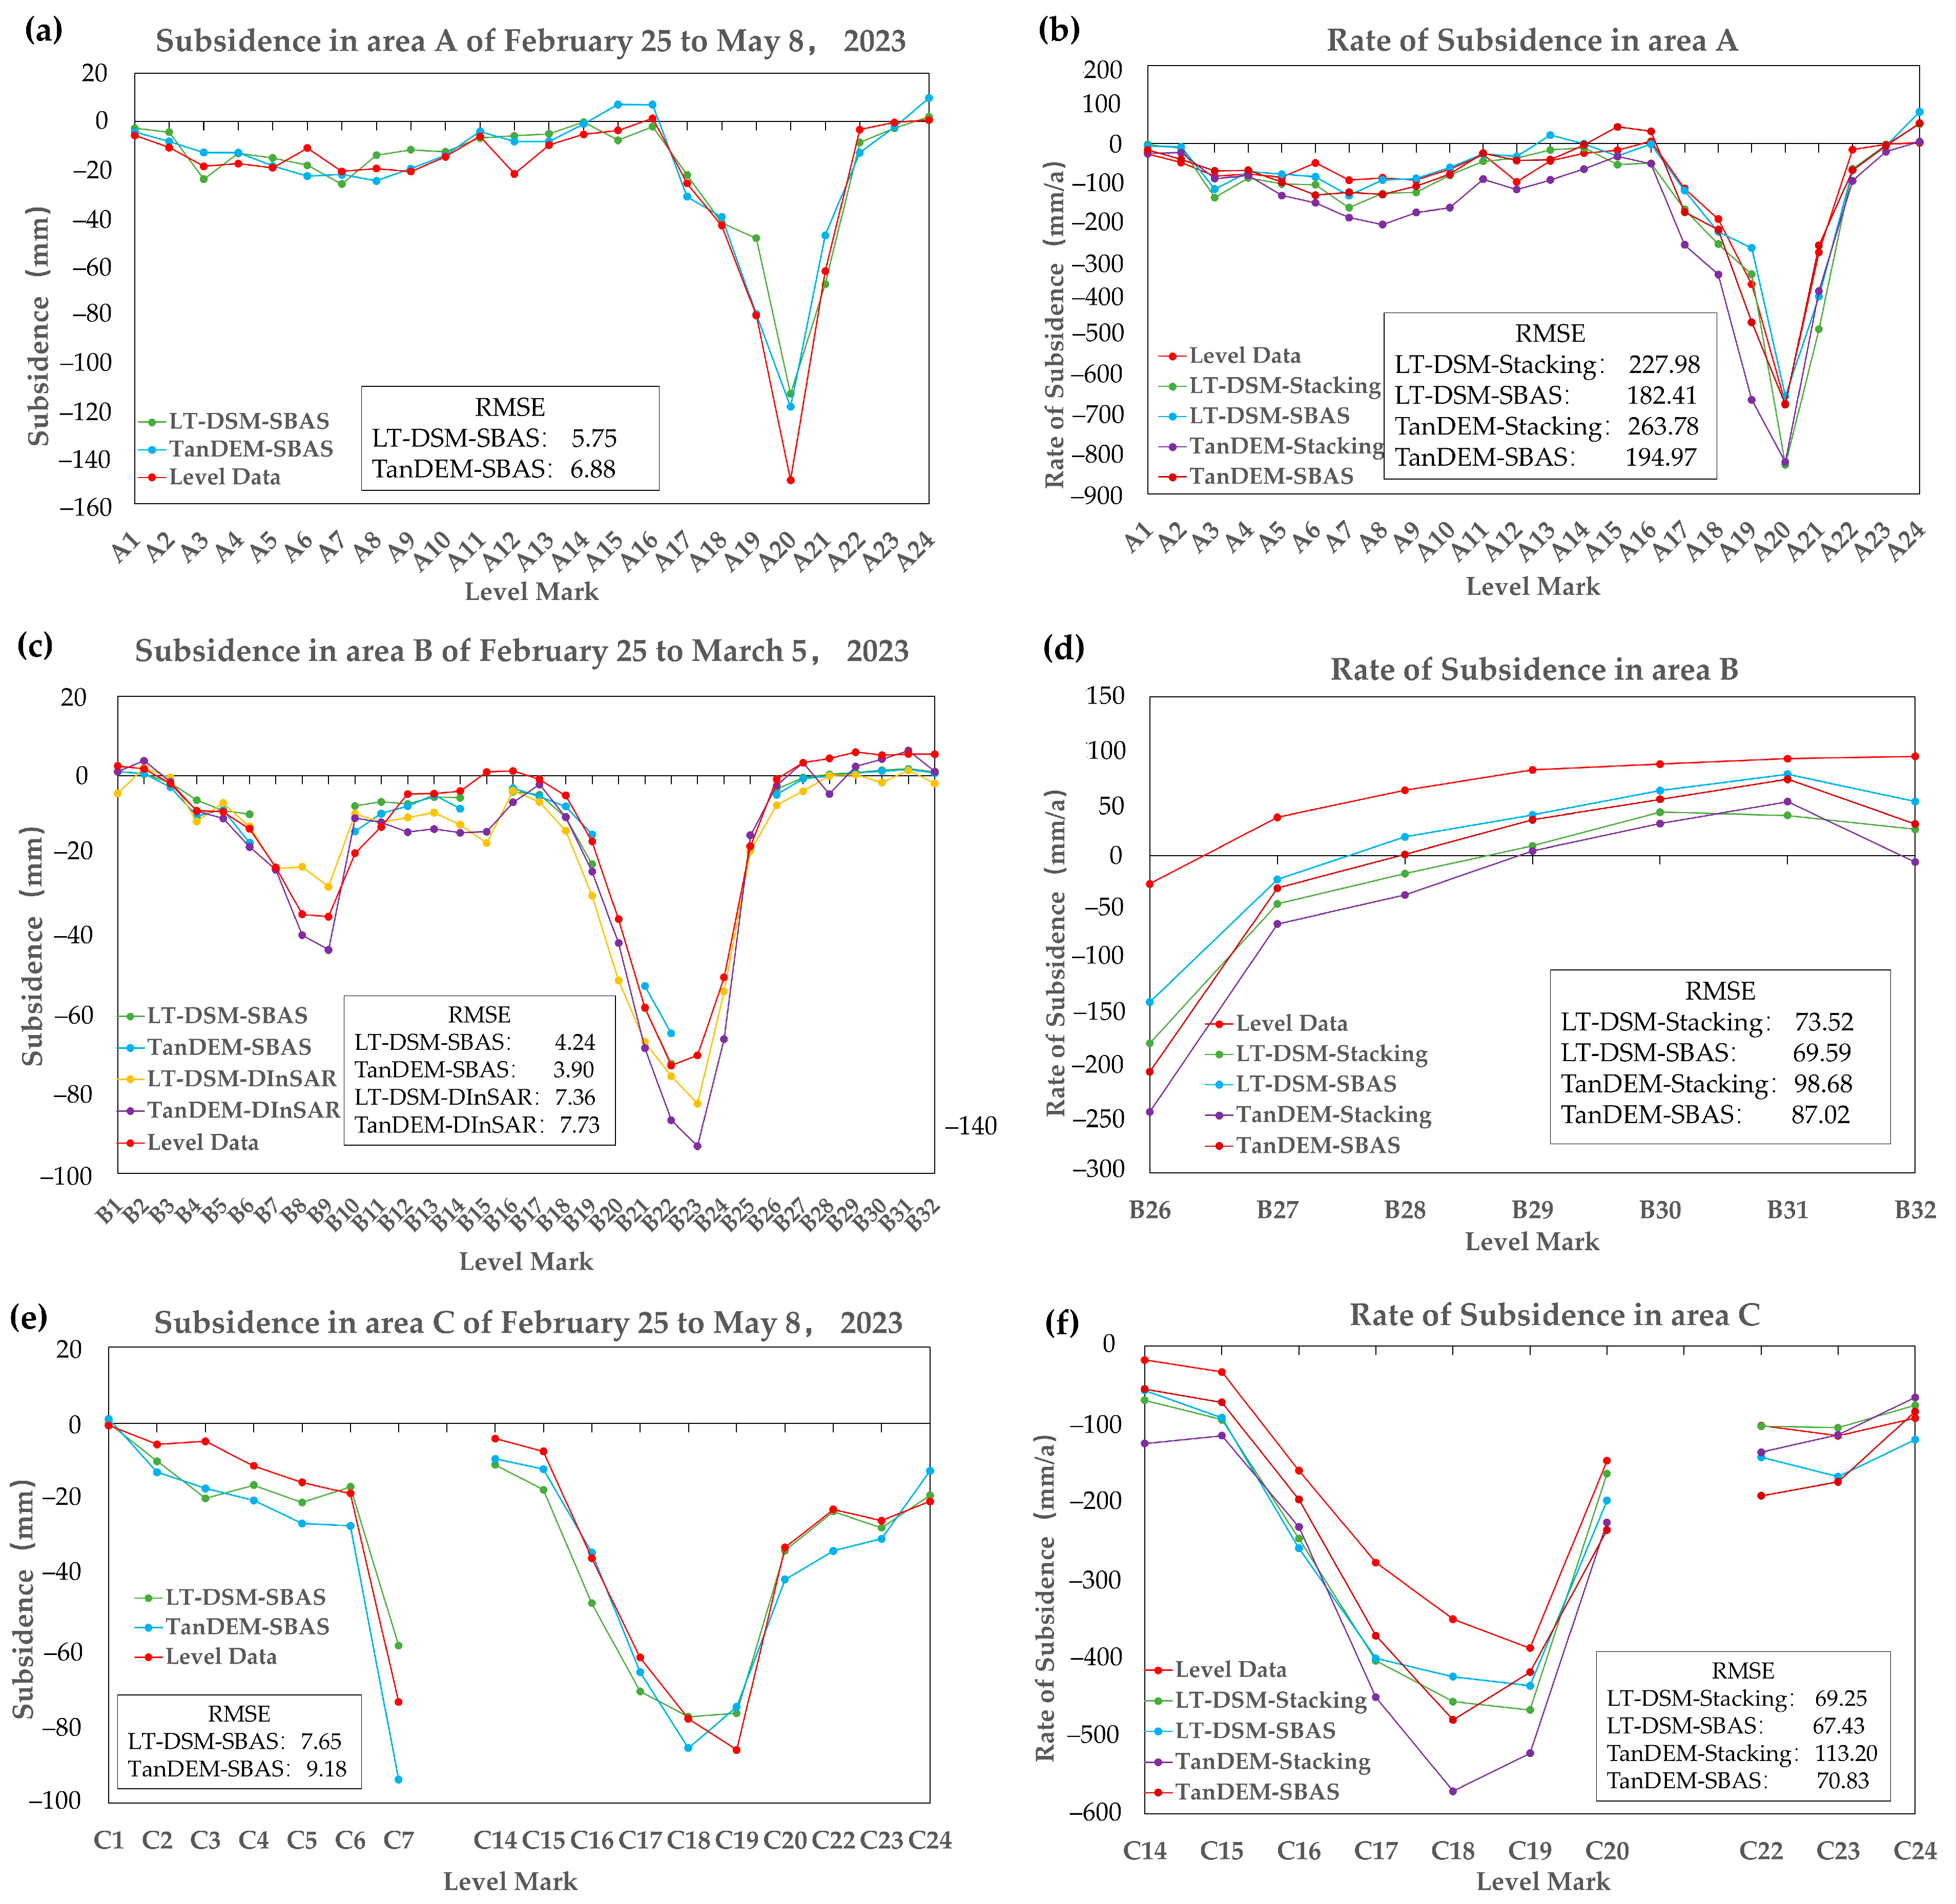
Evidently, from the spatial domain subsidence line diagram in Figure 14, the SBAS cumulative subsidence and DInSAR subsidence results are basically consistent with the subsidence trend of the leveling data. Comparing the root mean square error, it can be found that the deformation monitoring results based on LT-DSM terrain removal are better than the deformation monitoring results based on TanDEM terrain removal. It can be seen that the overall accuracy of LT-DSM is better than that of the TanDEM data. In the deformation rate monitoring in (b), (d), and (f), it can be seen that the monitoring results are basically consistent with the deformation rate trend of the leveling data, and the accuracy of the terrain removal results based on LT-DSM is higher, and the accuracy of the SBAS rate monitoring method is higher than that of the Stacking method. This is due to the fact that Stacking-InSAR only performs a simple solution of the weighted average, while SBAS-InSAR uses the least squares solution to obtain an overall optimal solution. By comparing Figure 14a–c, we see that the SAR results are sometimes higher or lower than the ground level data, mainly due to errors in atmosphere, noise and unwrapping. It is not difficult to see that the deviation between the deformation monitoring rate and the leveling rate is very large. Although both of them assume that the deformation is linear, the data involved in the leveling data are only the initial observation and the last observation data. The InSAR method involves all of the observation data in the solution, and the actual deformation rate is not constant. In addition, the time period for InSAR observation is longer than that for leveling observation.
In the time domain evaluation, two subsidence area level points, A21 and C18, and a stable area level point, A16, were mainly selected, as shown in Figure 15. It can be seen that the deformation results of TanDEM-SBAS are very different from the level point A16. In general, the deformation monitoring results based on LT-DSM are still more accurate. Via this experiment, it can be seen that both the three-dimensional reconstruction of the terrain based on the Lutan-1 data and the measurement of surface deformation have high accuracy. Therefore, using the Lutan-1 satellite for natural disaster monitoring is a good choice.

5. Discussion

In Figure 7, it can be seen that the terrain error increases gradually from top to bottom according to the vertical baseline. No matter which kind of DEM is used to remove the terrain phase, the deformation results of 20230225–20230321 are more seriously affected by the terrain, while the deformation results of 20230426–20230508 are less affected by the terrain, because the vertical baseline will affect the terrain phase component. The phase component of the terrain is proportional to the vertical baseline. The larger the vertical baseline is, the larger the absolute value of the terrain phase is, and the more seriously the deformation monitoring results are affected by the terrain, and vice versa. Therefore, when using the InSAR method to monitor the surface deformation, interference pairs with shorter vertical baselines should be selected as much as possible to reduce the influence of the terrain phase on the deformation monitoring results. At the same time, the influence of the terrain phase component can be reduced via the application of high-precision DEM data.
The root mean square errors of six groups of LT-DSM-SBAS and TanDEM-SBAS, four groups of LT-DSM-DInSAR and TanDEM-DInSAR are averaged to 5.41, 6.11, 4.89 and 5.84, respectively. By comparison, it is found that the accuracy of the DInSAR method is higher than that of the SBAS method. This is because although the SBAS method can be solved using least square estimation, it can eliminate the error caused by the solution and reduce the influence of atmospheric interference and other errors. However, because it is a linear solution of the time series of the surface subsidence results, it will lead to a slight error between the local time period and the actual subsidence; the DInSAR method directly solves the surface deformation in two time periods, so the accuracy of the DInSAR method is higher than that of the SBAS method. When calculated, the accuracy of LT-DSM-SBAS is 11.5% better than that of TanDEM-SBAS, and the accuracy of LT-DSM-DInSAR is 16.3% better than that of TanDEM-DInSAR. It can be seen that the accuracy improvement of the DInSAR results is higher than that of the SBAS-InSAR method, mainly because the DInSAR method is more dependent on accurate external DEM data than the SBAS-InSAR method. Although the timeliness of TanDEM is slightly worse than that of LT-DSM, its accuracy is not much worse than that of the SBAS monitoring results, indicating that the SBAS method can better suppress terrain errors. With the use of TanDEM to simulate the external terrain data for DInSAR deformation monitoring in the Datong mining area, as long as the monitoring area is not in the valley part, the accuracy is still high.
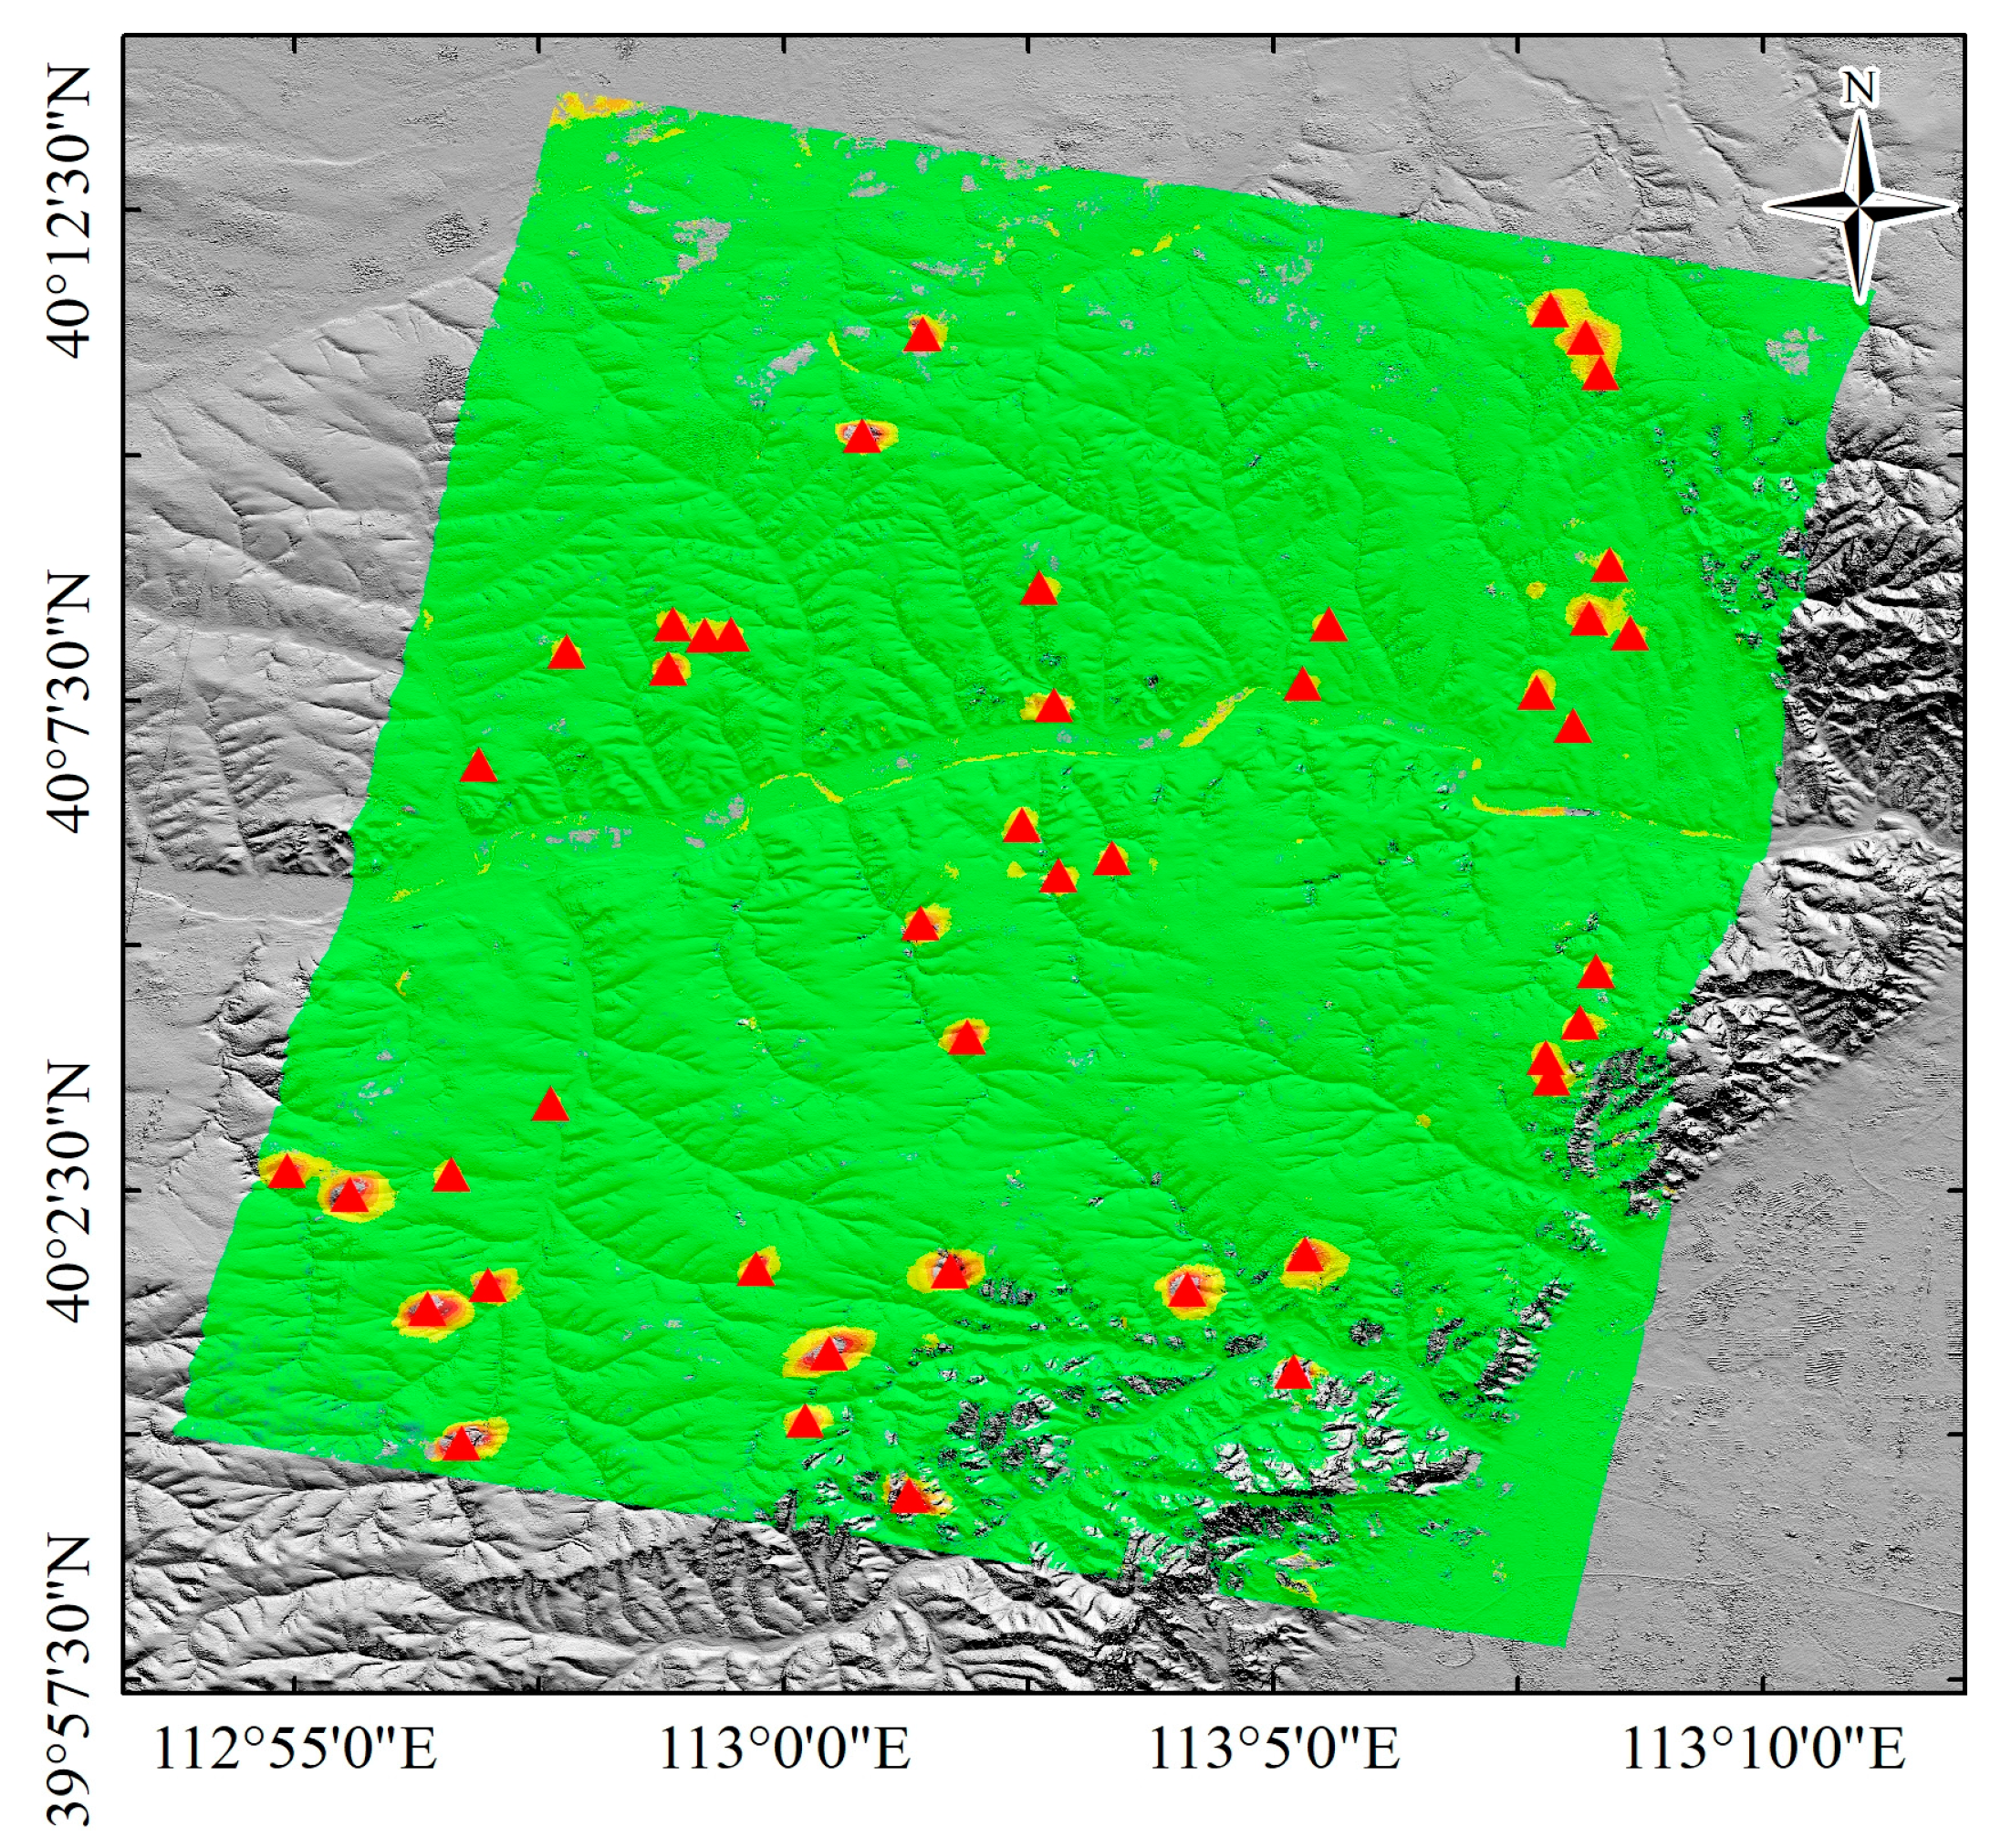
Via evaluation with the leveling data, it is shown that the LT-DSM-SBAS deformation monitoring results are more accurate. In the results of the study area, 43 mining area deformations can be obviously monitored (see Figure 16). Among them, only partial settlement of the mining area can be monitored in 2 mining areas due to the influence of complex terrain, and the central settlement of the mining area cannot be monitored in 14 mining areas due to the excessive settlement and the long time baseline. It is difficult to use the InSAR method to comprehensively monitor a large subsidence area beyond the monitorable deformation gradient. However, the subsidence of a mine can be monitored using the offset tracking method or periodic LIDAR. It can be seen that the settlement of many Datong mining areas is large, and some monitoring settlements can reach 1.443 m. It is recommended to take certain measures to avoid disasters and ensure the safety of people’s lives and property.

6. Conclusions

In order to accurately obtain the subsidence data of the Datong mining area, this paper uses Lutan-1 bistatic and monostatic SAR data to monitor the deformation of Datong. Firstly, the DSM is reconstructed using the bistatic SAR data, and the accuracy of the DSM is improved using the interferometry calibration method. Then, the accuracy is evaluated using ICESat laser altimetry data and TanDEM data. Secondly, combined with LT-DSM data and monostatic SAR data, surface deformation monitoring of the Datong mining area is carried out. Finally, the deformation monitoring results are compared with the surface deformation monitoring results based on the TanDEM data to simulate the terrain phase. The following results are obtained:
(1)
Using high-precision geometric calibration and interference calibration processing, high-precision DSM data with a resolution of 10 m × 10 m are extracted from the Lutan-1 bistatic data. The error is evaluated using the ICESat laser altimetry data to be 2.8 m, which meets the mapping accuracy standard of China’s 1:50,000 DEM and provides effective input data for subsequent surface deformation monitoring.
(2)
It is found that the registration accuracy of the SAR images and LT-DSM is higher than that of TanDEM in the range direction and azimuth direction via comparison with TanDEM. Combined with leveling data evaluation, it is found that the deformation measurement results based on LT-DSM are less affected by terrain, and more accurate. The deformation monitoring accuracy of LT-DSM-SBAS and LT-DSM-DInSAR are 11.5% and 16.3%, better than those of TanDEM-SBAS and TanDEM-DInSAR, respectively.
(3)
The deformation of 43 mining areas was monitored using LT-DSM-SBAS, and the subsidence of some mining areas was significant. The monitoring subsidence reached 1.443 m, which demonstrated the effectiveness of LT-1 SAR data for large-magnitude deformation monitoring.
(4)
The high-precision topographic mapping and surface deformation monitoring of Datong mining area were realized using Lutan-1 bistatic and monostatic SAR data, respectively, which provides strong support for high-precision surface deformation monitoring by cooperating with bistatic and monostatic SAR data.

Author Contributions

Conceptualization, Y.J. and X.Z.; Methodology, Y.J., X.Z., T.L. and H.F; Supervision, X.Z., T.L., H.F. and Y.X.; Visualization, P.L. and Z.T.; Writing—original draft, Y.J.; writing—review and editing, X.Z., T.L. and H.F.; visualization, Y.X., P.L. and Z.T. All authors have read and agreed to the published version of the manuscript.

Funding

This research was supported by the National Key R&D Programme of China (2021YFC3000405), National Natural Science Foundation of China (41901303), Civil Spaceflight Pre-Research Projects (D010206), Key Laboratory for Land Satellite Remote Sensing Applications (BN2302-8).

Data Availability Statement

Lutan-1 in-orbit testing was finished on June 2023. The LuTan-1 SAR data is not publicly available for the moment. Recently, we are working on data sharing applications for scientific research, and there will be a scientific data access channels in the future. On https://sasclouds.com/chinese/home/. Thank you for your attention for Lutan-1 SAR data.

Acknowledgments

The authors would like to thank the Land Satellite Remote Sensing Applications Center of the Ministry of Natural Resources for providing the data and platform.

Conflicts of Interest

The authors declare no conflict of interest.

References

  1. Xu, Y.Z.; Li, T.; Tang, X.M.; Zhang, X.; Fan, H.D.; Wang, Y.W. Research on the Applicability of DInSAR, Stacking-InSAR and SBAS-InSAR for Mining Region Subsidence Detection in the Datong Coalfield. Remote Sens. 2022, 14, 3314. [Google Scholar] [CrossRef]
  2. Sandwell, D.T.; Price, E.J. Phase gradient approach to stacking interferograms. J. Geophys. Res. Solid Earth 1998, 103, 30183–30204. [Google Scholar] [CrossRef]
  3. Sousa, J.J.; Ruiz, A.M.; Hanssen, R.F.; Bastos, L.; Gil, A.J.; Galindo-Zaldívar, J.; Sanz de Galdeano, C. PS-InSAR processing methodologies in the detection of field surface deformation—Study of the Granada basin (Central Betic Cordilleras, southern Spain). J. Geodyn. 2010, 49, 181–189. [Google Scholar] [CrossRef]
  4. Wang, S.Y.; Zhang, G.; Chen, Z.W.; Xu, Z.X.; Liu, Y.T.; Zhao, R.S. Evaluating expressway stability using interferometric synthetic aperture radar and measuring its impact on the occurrence of geohazards: A case study of Shanxi Province, China. Geosci. Remote Sens. 2023, 60, 2161200. [Google Scholar] [CrossRef]
  5. Berardino, P.; Fornaro, G.; Lanari, R.; Sansosti, E. A new algorithm for surface deformation monitoring based on small baseline differential SAR interferograms. IEEE Trans. Geosci. Remote Sens. 2002, 40, 2375–2383. [Google Scholar] [CrossRef]
  6. Hejmanowski, R.; Malinowska, A.A.; Witkowski, W.T.; Guzy, A. An Analysis Applying InSAR of Subsidence Caused by Nearby Mining-Induced Earthquakes. Geosciences 2019, 9, 49. [Google Scholar] [CrossRef]
  7. Chen, Y.; Yu, S.W.; Tao, Q.X.; Liu, G.L.; Wang, L.Y.; Wang, F.Y. Accuracy Verification and Correction of D-InSAR and SBAS-InSAR in Monitoring Mining Surface Subsidence. Remote Sens. 2021, 13, 4365. [Google Scholar] [CrossRef]
  8. Hanssen, R.F. Radar Interferometry: Data Interpretation and Error Analysis; Kluwer Academic Publishers: New York, NY, USA, 2001. [Google Scholar]
  9. Farr, T.G.; Rosen, P.A.; Caro, E.; Crippen, R.; Duren, R.; Hensley, S.; Kobrick, M.; Paller, M.; Rodriguez, E.; Roth, L. The shuttle radar topography mission. Rev. Geophys. 2007, 45. [Google Scholar] [CrossRef]
  10. Ferretti, A.; Prati, C.; Rocca, F. Multibaseline InSAR DEM reconstruction: The wavelet approach. IEEE Trans. Geosci. Remote Sens. 1999, 37, 705–715. [Google Scholar] [CrossRef]
  11. Yang, Z.F.; Zhang, Q.J.; Ding, X.L.; Chen, W. Analysis of the Quality of Daily DEM Generation with Geosynchronous InSAR. Engineering 2020, 6, 913–918. [Google Scholar] [CrossRef]
  12. Werner, M. Shuttle radar topography mission (SRTM) mission overview. Frequenz 2001, 55, 75–79. [Google Scholar] [CrossRef]
  13. Bartusch, M.; Miller, D.; Zink, M. TanDEM-X: Mission Overview and Status. In Proceedings of the 8th European Conference on Synthetic Aperture Radar, Aachen, Germany, 7–10 June 2010; pp. 1–4. [Google Scholar]
  14. Moreira, A.; Krieger, G.; Hajnsek, I.; Hounam, D.; Werner, M.; Riegger, S.; Settelmeyer, E. TanDEM-X: A TerraSAR-X add-on satellite for single-pass SAR interferometry, IGARSS 2004. In Proceedings of the 2004 IEEE International Geoscience and Remote Sensing Symposium, Anchorage, AK, USA, 20–24 September 2004; Volume 2, pp. 1000–1003. [Google Scholar]
  15. Wessel, B.; Huber, M.; Wohlfart, C.; Marschalk, U.; Kosmann, D.; Roth, A. Accuracy assessment of the global TanDEM-X Digital Elevation Model with GPS data. ISPRS J. Photogramm. Remote Sens. 2018, 139, 171–182. [Google Scholar] [CrossRef]
  16. Li, T.; Tang, X.; Zhou, X.; Zhang, X. LuTan-1 SAR main applications and products, EUSAR 2022. In Proceedings of the 14th European Conference on Synthetic Aperture Radar, VDE, Leipzig, Germany, 25–27 July 2022; pp. 1–4. [Google Scholar]
  17. Sun, Z.; Liang, D.; Dong, Z. Study on DEM Reconstruction for Spaceborne Parasitic InSAR. In Proceedings of the 2006 IEEE International Symposium on Geoscience and Remote Sensing, Denver, CO, USA, 31 July 2006–4 August 2006; IEEE: New York, NY, USA, 2006; pp. 3063–3065. [Google Scholar]
  18. Lanari, R.; Mora, O.; Manunta, M.; Mallorqui, J.J.; Berardino, P.; Sansosti, E. A small-baseline approach for investigating deformations on full-resolution differential SAR interferograms. IEEE Trans. Geosci. Remote Sens. 2004, 42, 1377–1386. [Google Scholar] [CrossRef]
  19. Huong, K.I.M.T.T.; Ha, T.H.; Luyen, B.U.I.K.; Tomasz, L. Mining-induced Land Subsidence Detected by Sentinel-1 SAR Images: An Example from the Historical Tadeusz Kościuszko Salt Mine at Wapno, Greater Poland Voivodeship, Poland. Inz. Miner. 2021, 48, 41–52. [Google Scholar]
  20. Bui, L.K.; Featherstone, W.E.; Filmer, M.S. Disruptive influences of residual noise, network configuration and data gaps on InSAR-derived land motion rates using the SBAS technique. Remote Sens. Environ. 2020, 247, 111941. [Google Scholar] [CrossRef]
  21. Jiang, X.; Min, X.; Ye, T.; Li, X.; Hu, X. Monitoring the subsidence at different periods in high underground water level coal mine areas using differential interferometric synthetic aperture radar (D-InSAR). Geocarto Int. 2023, 38, 2215730. [Google Scholar] [CrossRef]
  22. Lin, H.; Deng, Y.; Zhang, H.; Liu, D.; Liang, D.; Fang, T.; Wang, R. On the Processing of Dual-Channel Receiving Signals of the LuTan-1 SAR System. Remote Sens. 2022, 14, 515. [Google Scholar] [CrossRef]
Figure 1. Technique flow chart.
Remotesensing 15 05668 g001
Figure 2. Flow chart of spaceborne InSAR interference processing extraction DEM.
Remotesensing 15 05668 g002
Figure 3. The flow chart of mining displacement monitoring.
Remotesensing 15 05668 g003
Figure 4. Study area.
Remotesensing 15 05668 g004
Figure 5. Satellite flight modes and related products. (a) Bistatic mode. (b) The DEM product based on bistatic data. (c) Monostatic mode. (d) The deformation product based on monostatic data.
Remotesensing 15 05668 g005
Figure 6. Corner reflector.
Remotesensing 15 05668 g006
Figure 7. (a) is the result of LT-DSM, (b) TanDEM data, (c) the error distribution histogram with ICESat, (d) the difference between LT-DSM and TanDEM.
Remotesensing 15 05668 g007
Figure 8. DInSAR results (on the left is the DInSAR based on LT-DSM removal of the topography phase and on the right based on TanDEM).
Remotesensing 15 05668 g008
Figure 9. Baseline combination.
Remotesensing 15 05668 g009
Figure 10. The result of LT-DSM-SBAS and TanDEM-SBAS. (a,c) represents the overall cumulative subsidence results of LT-DSM-SBAS and TanDEM-SBAS methods, respectively; (b,d) represents the local cumulative subsidence results of the two methods, respectively.
Remotesensing 15 05668 g010
Figure 11. 20230201–20230508 SBAS deformation profile: (a) cumulative deformation profile position, (b) cumulative deformation profile curve, (c,d) time-series cumulative profile curve, where LT-DSM-SBAS and TanDEM-SBAS represent SBAS processing methods based on LT-DSM and TanDEM to remove terrain, respectively.
Remotesensing 15 05668 g011
Figure 12. Deformation rate and local profile: (a,b) are the SBAS deformation rate and profile position of terrain removal based on LT-DSM and TanDEM, respectively. (c) Subsidence rate profile curve, where LT-DSM-Stacking and TanDEM-Stacking represent the Stacking method based on LT-DSM and TanDEM to remove terrain, respectively. (d) is the legend of (a,b).
Remotesensing 15 05668 g012
Figure 13. Level point distribution(Areas A, B and C is the location where the leveling data is placed).
Remotesensing 15 05668 g013
Figure 14. Verification with level data in spatial domain (only part of the data is displayed): (a,c,e) are the result of comparing subsidence with the level in areas A, B and C. (b,d,f) are the result of comparing subsidence with the level in area A, area B and area C, where LT-DSM-DInSAR and TanDEM-DInSAR represent DInSAR deformation measurement methods (unit: mm) based on LT-DSM and TanDEM terrain removal, respectively.
Remotesensing 15 05668 g014
Figure 15. Verification with level data in the time domain. (ac) Displacement evaluation of SBAS at point A21, point A16 and point C18 and level data.
Remotesensing 15 05668 g015
Figure 16. Monitoring the location of mining areas (the red triangle is marked for the monitoring mine).
Remotesensing 15 05668 g016
Table 1. Image data.
ImagesAcquisition SatelliteImageAcquisition Satellite
20230201LT-A20230406LT-A
20230209LT-A20230410LT-B
20230217LT-A20230414LT-A
20230225LT-A20230418LT-B
20230305LT-A20230422LT-A
20230313LT-A20230426LT-B
20230321LT-A20230430LT-A
20230329LT-A20230504LT-B
20230402LT-B20230508LT-A
Table 2. Geometric positioning accuracy—comparison before and after calibration.
Geometric Positioning Accuracy before Calibration/mGeometric Positioning Accuracy after Calibration/m
LT-DSMRangeAzimuthTotal AccuracyRangeAzimuthTotal Accuracy
38.10513.90740.5630.3280.5670.655
Table 3. DSM elevation accuracy—comparison before and after calibration.
Evaluation IndicatorsBefore Calibration/mAfter Calibration/m
LT-DSMError Mean−6.169−1.284
RMSE7.3252.836
Table 4. Interference pair parameters.
Interference PairPerpendicular Baseline (m)Time Baseline (d)
20230426–20230508−73.978
20230321–20230410−325.5620
20230305–20230321686.7316
20230225–202303211164.2624
Disclaimer/Publisher’s Note: The statements, opinions and data contained in all publications are solely those of the individual author(s) and contributor(s) and not of MDPI and/or the editor(s). MDPI and/or the editor(s) disclaim responsibility for any injury to people or property resulting from any ideas, methods, instructions or products referred to in the content.