Article

Tracking the Vegetation Change Trajectory over Large-Surface Coal Mines in the Jungar Coalfield Using Landsat Time-Series Data

1
Hebei International Joint Research Center for Remote Sensing of Agricultural Drought Monitoring, School of Land Science and Space Planning, Hebei GEO University, Shijiazhuang 050031, China
2
Key Laboratory of Agricultural Water Resources, Hebei Key Laboratory of Agricultural Water-Saving, Center for Agricultural Resources Research, Institute of Genetics and Developmental Biology, Chinese Academy of Sciences, Shijiazhuang 050021, China
*
Author to whom correspondence should be addressed.
Remote Sens. 2023, 15(24), 5667; https://doi.org/10.3390/rs15245667
Submission received: 6 November 2023 / Revised: 4 December 2023 / Accepted: 5 December 2023 / Published: 7 December 2023

Abstract

:
Coal mining and ecological restoration activities significantly affect land surfaces, particularly vegetation. Long-term quantitative analyses of vegetation disturbance and restoration are crucial for effective mining management and ecological environmental supervision. In this study, using the Google Earth Engine and all available Landsat images from 1987 to 2020, we employed the Landsat-based Detection of Trends in Disturbance and Recovery (LandTrendr) algorithm and Support Vector Machine (SVM) to conduct a comprehensive analysis of the year, intensity, duration, and pattern of vegetation disturbance and restoration in the Heidaigou and Haerwusu open-pit coal mines (H-HOCMs) in the Jungar Coalfield of China. Our findings indicate that the overall accuracy for extractions of disturbance and restoration events in the H-HOCMs area is 83% and 84.5%, respectively, with kappa coefficients of 0.82 for both. Mining in Heidaigou has continued since its beginning in the 1990s, advancing toward the south and then eastward directions, and mining in the Haerwusu has advanced from west to east since 2010. The disturbance magnitude of the vegetation greenness in the mining area is relatively low, with a duration of about 4–5 years, and the restoration magnitude and duration vary considerably. The trajectory types show that vegetation restoration (R, 44%) occupies the largest area, followed by disturbance (D, 31%), restoration–disturbance (RD, 16%), disturbance–restoration (DR, 8%), restoration–disturbance–restoration (RDR), and no change (NC). The LandTrendr algorithm effectively detected changes in vegetation disturbance and restoration in H-HOCMs. Vegetation disturbance and restoration occurred in the study area, with a cumulative disturbance-to-restoration ratio of 61.79% since 1988. Significant restoration occurred primarily in the external dumps and continued ecological recovery occurred in the surrounding area.

1. Introduction

Mining plays an important role in the global economy but is accompanied by profound environmental consequences, such as the destruction of original vegetation, land degradation, air and water pollution, soil contamination with heavy metals, and biodiversity loss [1,2,3,4,5,6]. Coal is a commonly mined resource and is one of the main driving forces of land degradation in some regions worldwide [7,8]. The demand for coal resources in China has been increasing over the past 30 years owing to rapid economic development, and China has become the largest coal producer and consumer in the world [9,10]. Consequently, many ecological and environmental challenges have emerged [8]. Mine rehabilitation must be accomplished to achieve sustainable development. In recent years, various parts of China have actively carried out ecological restoration projects in mines and implemented the idea that “green waters and green mountains are golden mountains and silver mountains”. As mining operations are continuously being conducted, efforts are being made to establish “green mines” by increasing investments in ecological restoration in these areas.
The status and trends of vegetation conditions generally serve as a proxy for land degradation [11,12] and an important indicator for environmental change [5]. Both mining disturbances and restoration have driven the rapid dynamics of vegetation cover in mining areas [13], especially in opencast coal mines [14,15]. High-precision monitoring of vegetation greenness and quantification of vegetation disturbance and restoration are of great significance for the systematic control of disturbed land and minimization of the environmental effects of mining [16]. In recent decades, remote sensing has provided practical solutions for mining disturbance detection and environmental impact assessments [13]. It has numerous advantages, such as wide coverage, continuous data space, high observation frequency, and relatively low cost. As a result, it serves as an important means of surface observation and provides essential support for monitoring regional ecological environments. Long-term remotely sensed vegetation index (e.g., NDVI and EVI) data are suitable for detecting and characterizing trends in vegetation conditions over time [17], providing technical support for the management of production activities in mining areas [18].
Methods for detecting mining disturbances and reclamation activities based on remote sensing generally include visual interpretation, vegetation index discrimination, and classification and time-series analysis [4,19]. The traditional comparison of remote sensing images between different years by visual interpretation is insufficient to reflect the dynamic change characteristics of the ecology of a mining area. Quantitative monitoring and change pattern diagnosis of vegetation disturbance and restoration in open-pit coal mines are still lacking. In recent years, many excellent algorithms based on remote sensing time-series data for detecting changes in land cover by analyzing images in chronological order have emerged. These time-series algorithms utilize spectral vegetation indices for fitting and analysis, such as Breaks For Additive Season and Trend (BFAST) [20], Detecting Breakpoints and Estimating Segments in Trend (DBEST) [21], Continuous Change Detection and Classification (CCDC) [22], Land Change Monitoring, Assessment, and Projection (LCMAP) [23], the automated algorithm of vegetation change tracker (VCT) [24], and the Landsat-based Detection of Trends in Disturbance and Recovery (LandTrendr) algorithm [25]. Specific to mining disturbances and reclamation, Wang et al. (2021) proposed a mine landscape restoration index (MLRI) to simultaneously monitor the restoration of multiple mine sites [26]. Xu et al. (2023) proposed an automatic method (auto-VDR) to identify vegetation destruction and restoration in various open-pit mines [27].
LandTrendr is a set of processing and analysis algorithms that was proposed by Kennedy et al. (2010) [25]. It was developed based on the study of multi-temporal change detection methods using Landsat data and can flexibly capture long-term ecological changes. Since its inception, the LandTrendr algorithm has been widely applied in forest disturbance and recovery detection [28,29,30], marsh vegetation and hydrological disturbance and restoration [31], land cover change trajectories [32], surface water dynamics [33], as well as mining disturbance and restoration [13,34,35]. The previous studies illustrated the value of the trajectory-based LandTrendr algorithm for mine rehabilitation studies in South Africa, and vegetation disturbance and restoration in Australia and China. They demonstrated the reliability and efficiency of detecting the recovery process in a single mining area and provided detailed information on the restoration process. The applicability of the LandTrendr algorithm to different types of coal mines in different regions worldwide requires further analysis.
The objective of this study is to detect ecological disturbance and restoration of two large adjacent surface coal mines in the loess area, the Heidaigou and Haerwusu open-pit coal mines (H-HOCMs) in the Jungar Coalfield of China. The high-density Landsat remote sensing images over a 34-year time series were constructed utilizing the Google Earth Engine (GEE) remote sensing cloud computing platform. The annual maximum vegetation index was used as an indicator to detect changes in ecological disturbance and restoration in the area under consideration. The LandTrendr spectral–temporal segmentation algorithm and support vector machine (SVM) were then applied to analyze the timing and types of vegetation disturbance and restoration in the mining area. The findings of this analysis provide technical support for the scientific assessment of coal mining, ecological restoration, and promotion of green development in coal mines.

2. Materials and Methods

2.1. Region under Study

The Jungar coalfield, known as the largest surface coalfield in China, is located at the junction of the Inner Mongolia Autonomous Region, Shanxi Province, and Shannxi Province (Figure 1a,b). There are a dozen open-pit coal mines in Inner Mongolia, two-thirds of which are located in the Junge Banner of Inner Mongolia. Among them, the Heidaigou and Haerwusu open-pit coal mines are the two largest. They are linked closely and belong to the same geological structural unit. Therefore, we considered the main mining areas of these two open-pit coal mines in parallel. The Heidaigou and Haerwusu open-pit coal mines (H-HOCMs) are located in the central part of the Jungar open-pit mine and in the eastern part of Jungar Banner (Figure 1b,c). There are clear traces of coal mining from remote sensing images (Figure 1c,d).
The mining area is on the marginal area of the Loess Plateau, with rolling hills and ravines, which is known for being one of the most severely eroded areas in China. It has a continental, arid climate characterized by low annual rainfall, mostly concentrated in summer, and a high rate of evaporation. Before the mining activities began, the natural environment in the area was harsh, with a cross-network of gullies and severe wind erosion, with the sparse Stipa steppe comprising the main vegetation [36]. The geological structure of the mining area is simple, with a gentle dip angle of the stratum. The coal-bearing stratum is predominantly composed of hard rock layers. However, there are variations in the development of joints and cracks in the strata.
There are three open-pit mines in the studied region with an area of 9394.7 ha in total, namely Heidaigou, Haerwusu, and Cuiergeju. Construction on the Heidaigou mine began in 1990 and officially started production in 1999 [37]. The annual production of the Heidaigou open-pit coal mine reached 25 Mt/a in 2006 after capacity expansion and renovation, making it the largest open-pit coal mine in China [38]. The secondary expansion and renovation project of Heidaigou Coal Mine began construction in June 2011, and the raw coal production capacity was increased to 34 Mt/a. Construction of the Haerwusu Opencast Coal Mine, adjacent to the Heidaigou coal mine in the north, began in May 2006, and the mine was officially established in 2008. Its production capacity was 21.68 Mt/a in 2010. The capacity of the two coal mines reached 60 Mt/a after joint expansion and renovation projects. The construction of Cuiergeju Coal Mine began in 2013, with a design scale of 1.20 Mt/a.
The studied region was divided into three types (Figure 1c): A, the mine construction area, including the coal processing plant, washing plant, and maintenance center; B, the external soil discharge site; and C, the mining pits including the previous and current. Mining pits can be converted to internal waste dumps after mining. For example, the early pits in the northern part of Heidaigou became internal dumps a few years later and may become reclamation areas if ecological restoration is conducted. The tracks of vegetation disturbance and recovery in various sites can be observed clearly from multi-phase remote sensing images (Figure 1d).

2.2. Data

The Landsat 5, 7, 8, and 9 Collection 2 surface reflectance datasets for the years 1987–2020 over the H-HOCMs were selected as the main data sources for this study. Data were collected primarily using the Google Earth Engine (GEE) cloud platform. Utilizing the processing power of the GEE, image data can be directly retrieved from its database, allowing the creation of an extended-time-series Landsat remote sensing image dataset.
In this study, the normalized vegetation index (NDVI) was used to analyze the disturbance and restoration of vegetation in the mining area. To minimize the impact of noise, the maximum annual NDVI value was obtained using the maximum composite algorithm, and the time-series data of the maximum annual NDVI from 1987 to 2020 were obtained. The annual maximum NDVI, an important indicator of vegetation, can respond to changes in vegetation greenness in coal mine areas, and its change curve can express the disturbance and restoration of surface vegetation due to coal mining and ecological restoration projects. The segmentation parameters of the LandTrendr algorithm and kinds of change patterns were determined through data analysis.

2.3. Methods

2.3.1. Research Overview

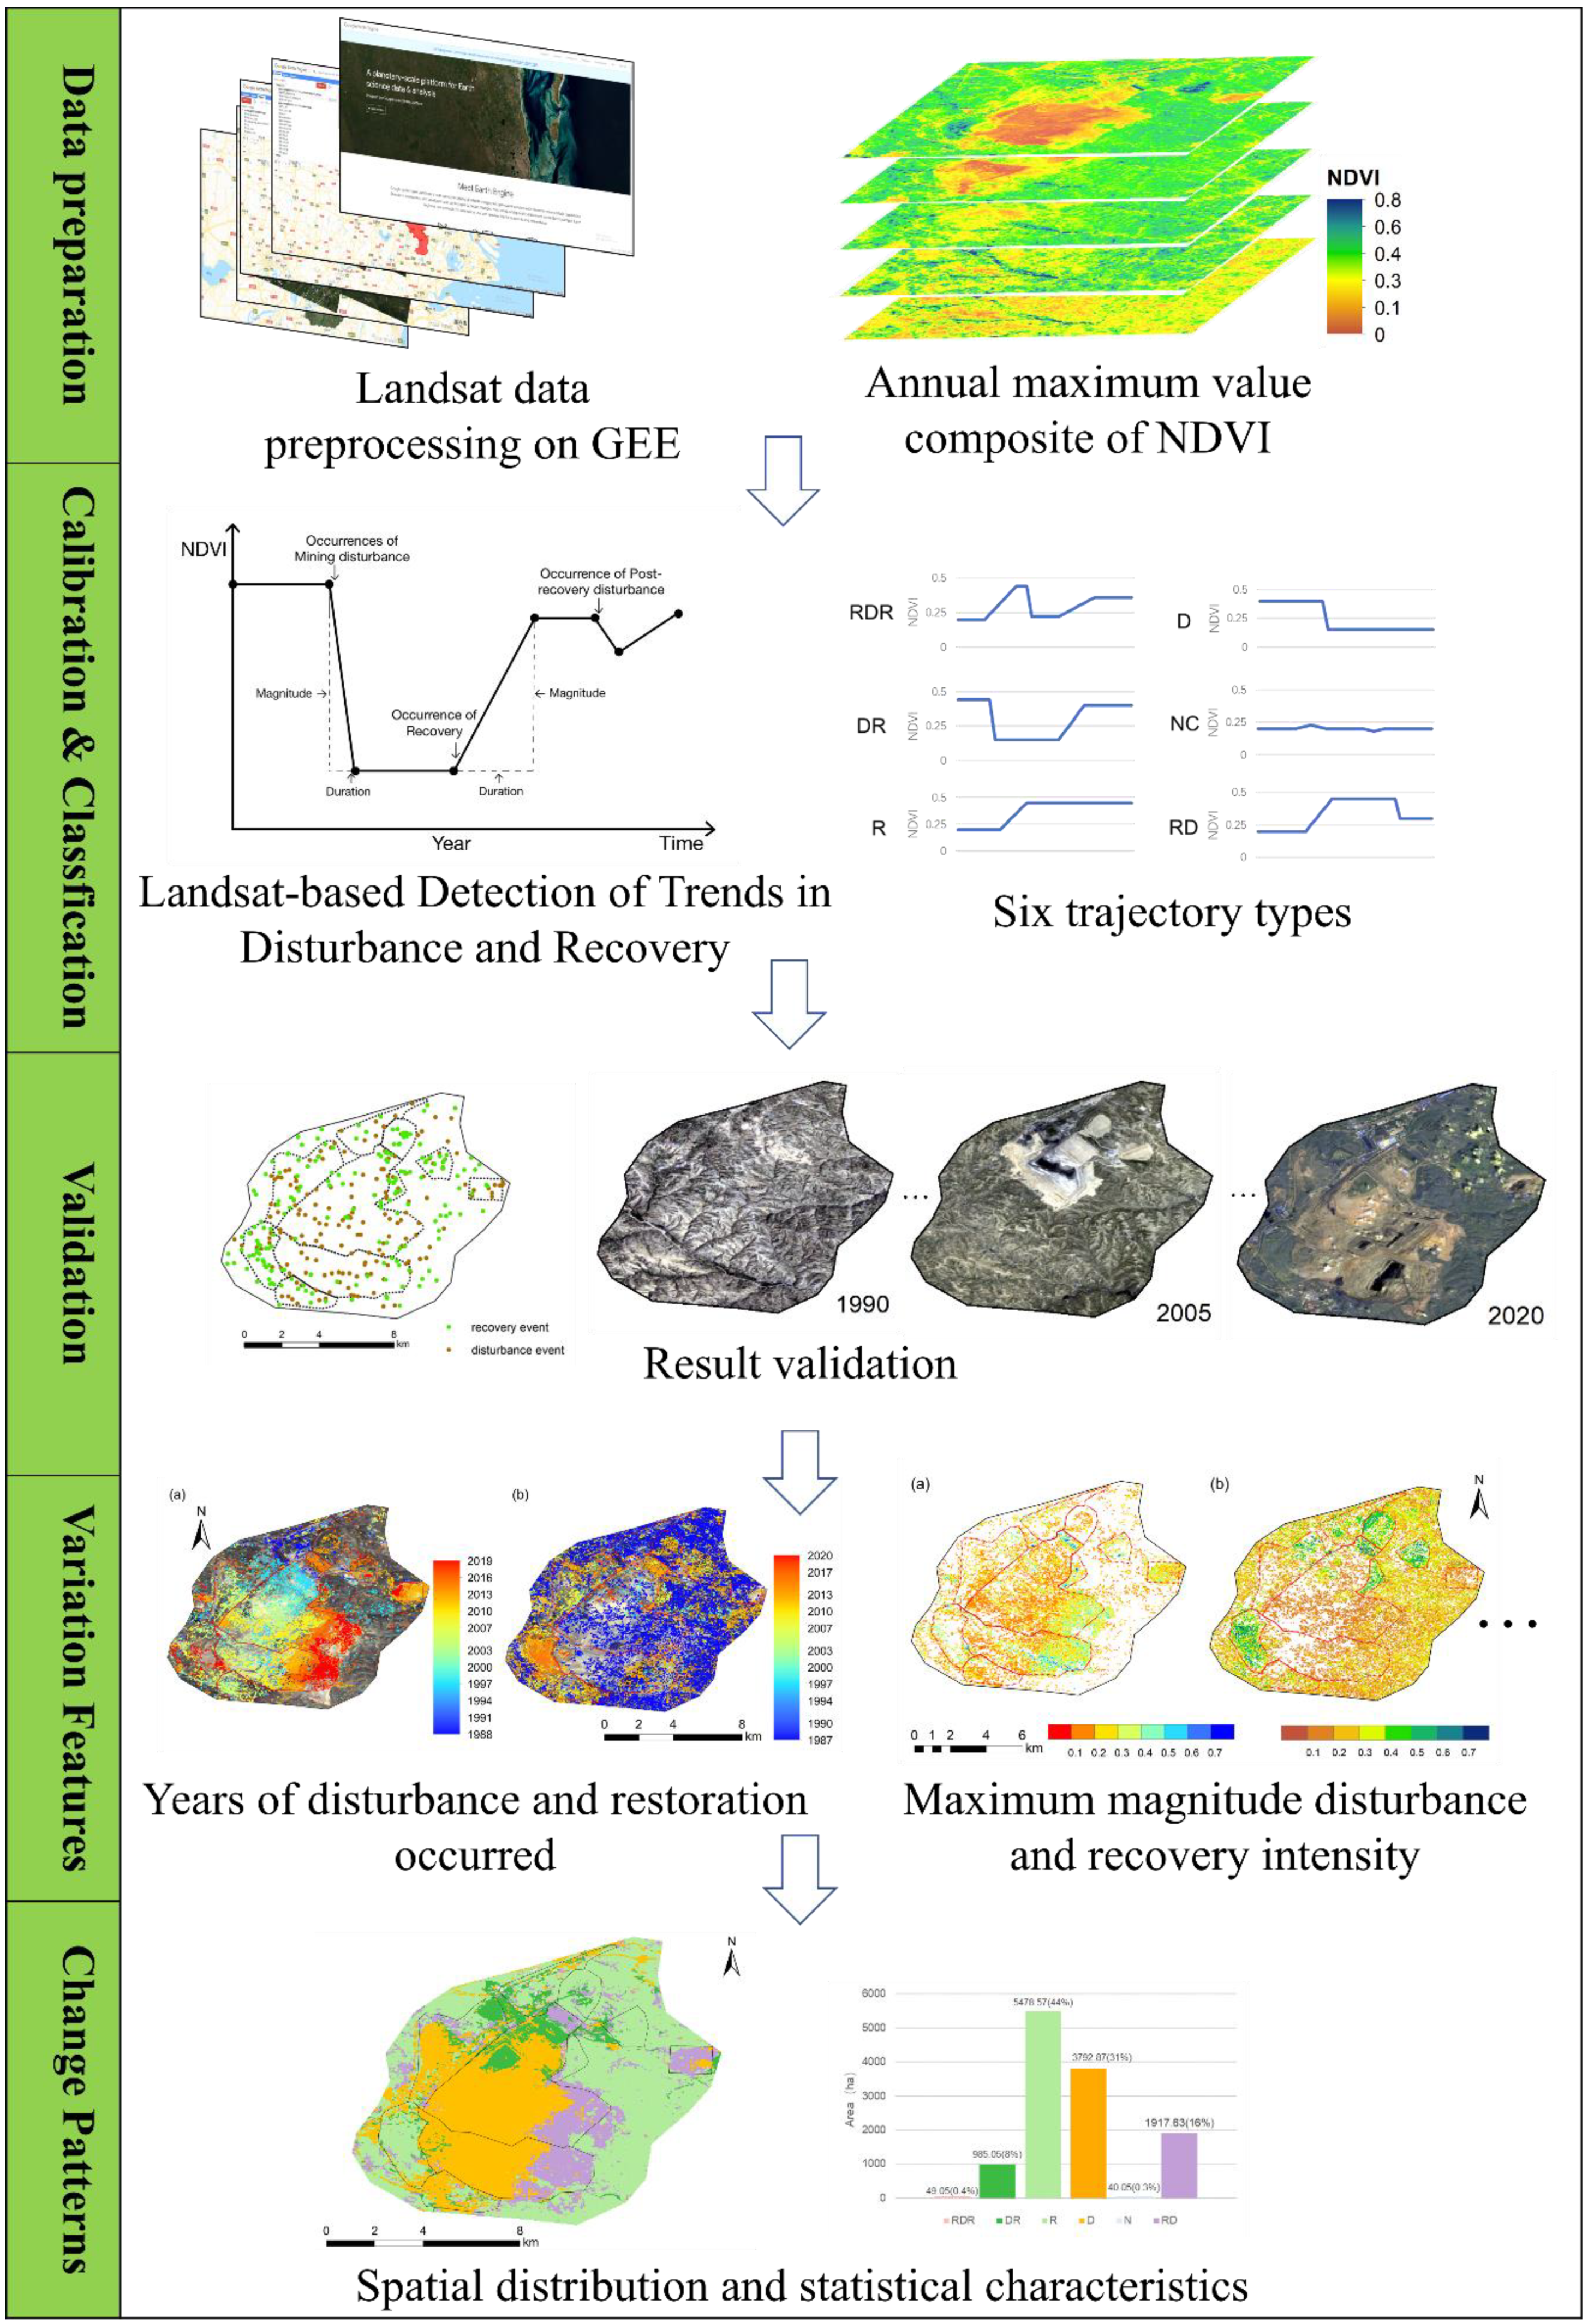
The overall flow diagram of the methodology is shown in Figure 2. First, in the data preparation stage, a Landsat NDVI dataset with a time series of 34 years was obtained from Landsat and pre-processed to extract the maximum annual NDVI value. Next, we designed a LandTrendr algorithm detection process on the GEE, and repeatedly debugged the spectral index NDVI and related parameters in the algorithm. Because the setting of the parameters is related to the research area, suitable results were obtained using the debugging parameters until the highly accurate numerical results were recorded. The results of ecological disturbance and vegetation recovery were then extracted, including the year of disturbance and restoration in the research area, the change amplitude of the spectral index, and the duration of the change event. Finally, the disturbance and restoration patterns were categorized using a supervised classification of SVM according to the trajectory of the annual NDVI, and related statistical analysis and mapping were performed.

2.3.2. The LandTrendr Algorithm

The LandTrendr algorithm does not specify changes at the beginning, but it is an arbitrary time segmentation method; that is, it uses straight lines to simulate important features of the trajectory and eliminates noise while retaining important details. Time-series segmentation, the core aspect of the LandTrendr algorithm, involves appropriate segmentation and linear fitting of time series trajectories and modeling of complex spectral time-series into a series of linear segments to display important signal information while eliminating noise interference. Specifically, it includes peak removal and time-series segmentation, time-series trajectory fitting, model simplification, and optimal model selection as indicated in the previous study [25].
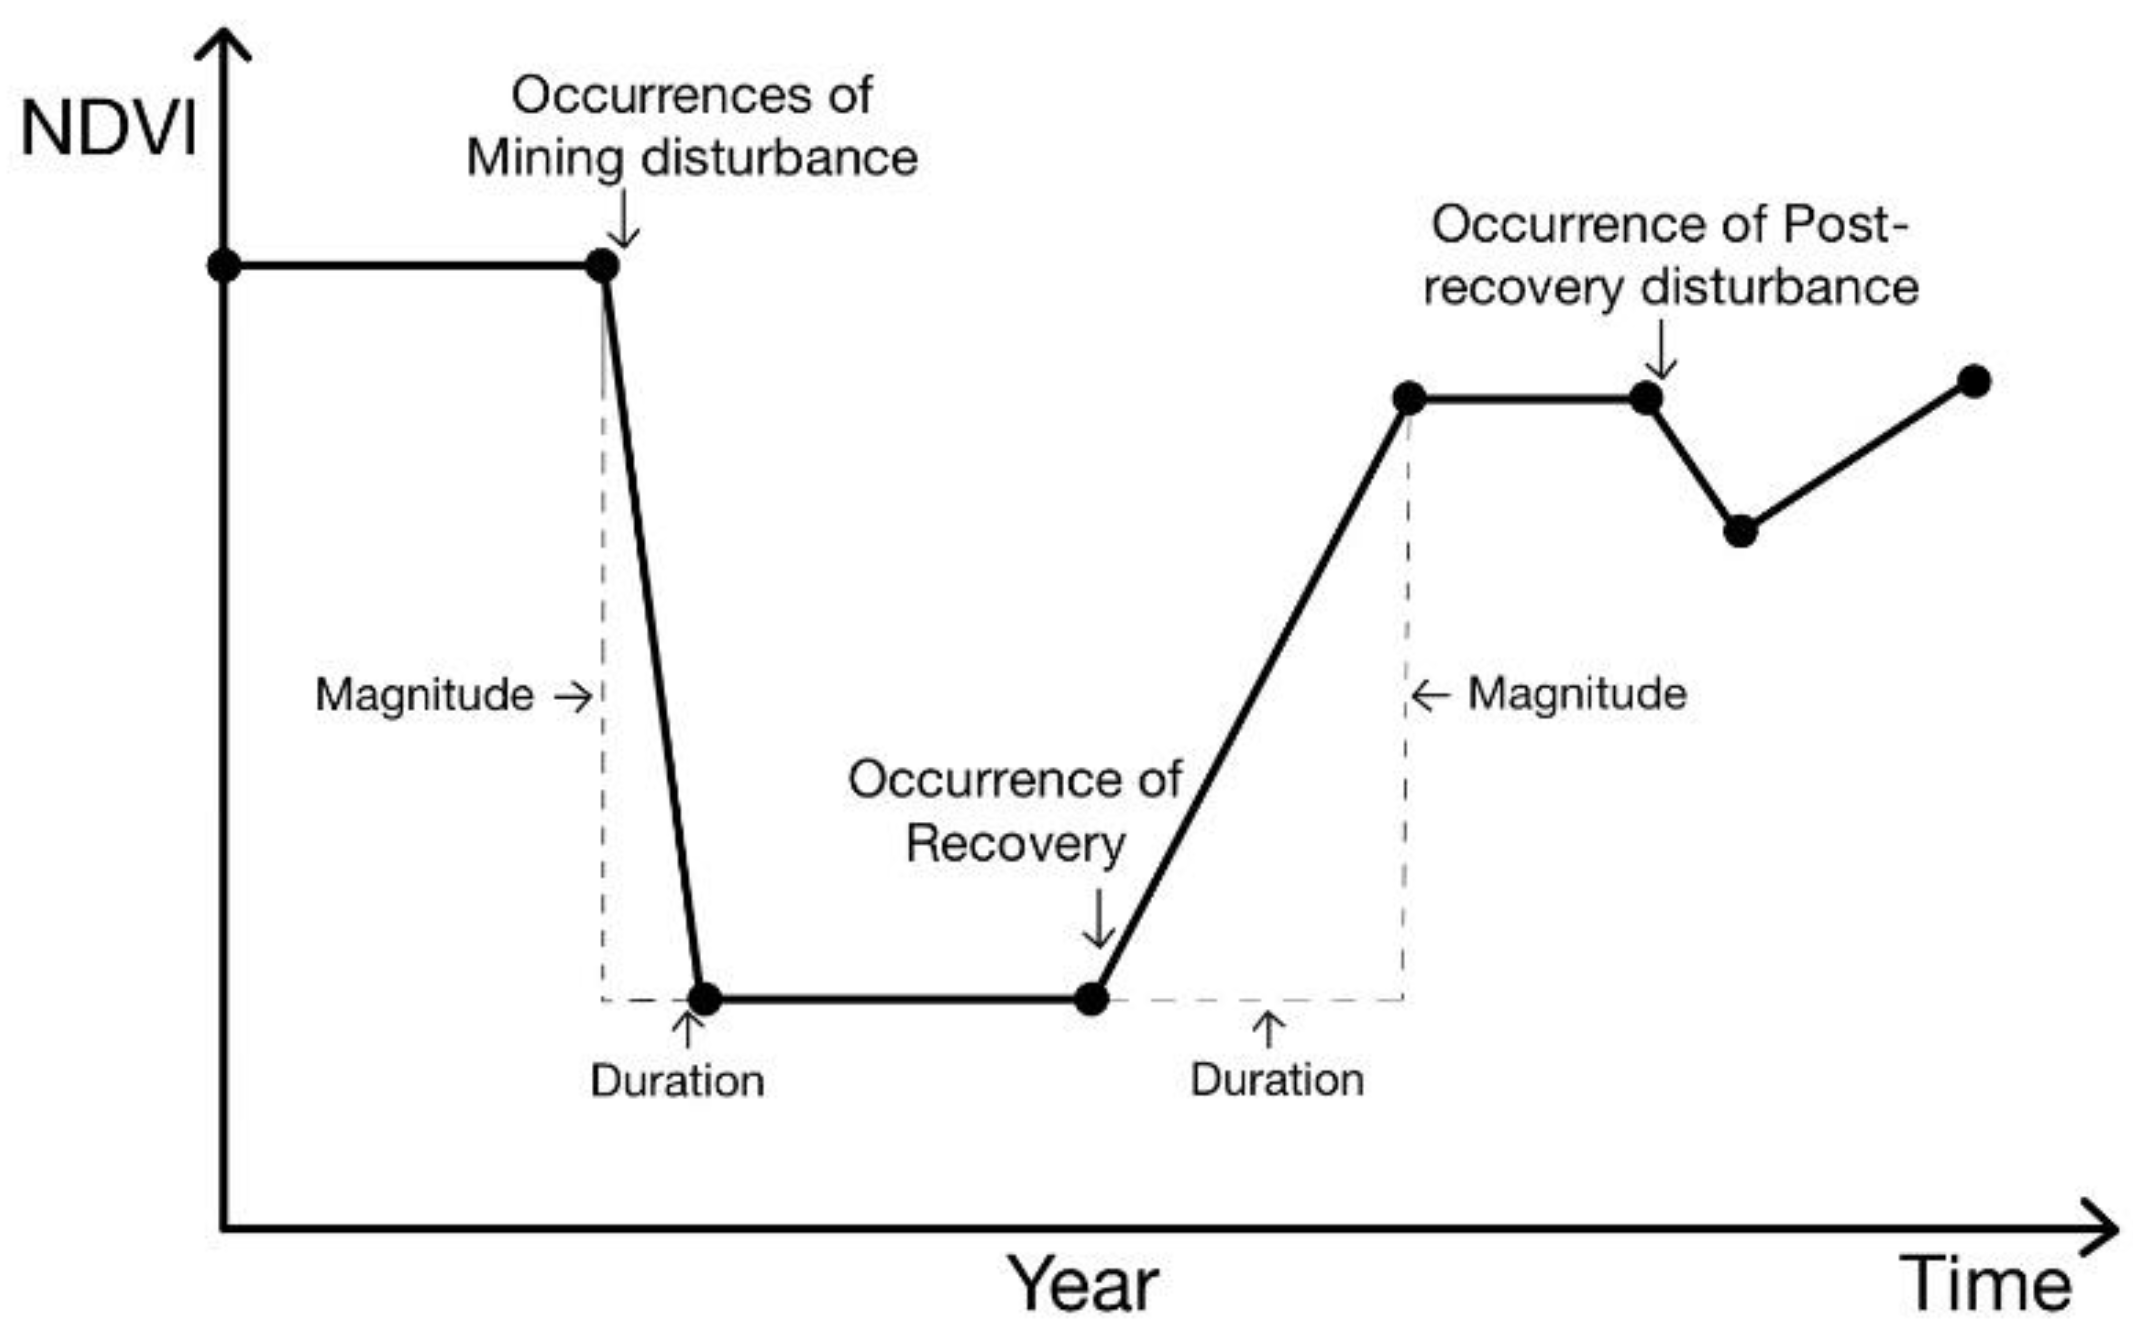
Both coal mining and vegetation restoration have led to changes in vegetation, which can affect the ecology of mining areas. Mining disturbances can lead to a rapid decrease in vegetation greenness, and the vegetation indicators of the pit and waste dump remain low until the restoration work or natural restoration; however, the restored vegetation indicators may also decrease due to the impact of disturbances. Notably, vegetation trajectories also change owing to factors such as phenology, climate change, acquisition time of remote sensing images, and image quality. In contrast, mining disturbances and vegetation restoration remain the main drivers of ecological change in coal mining areas.
Figure 3 shows a vegetation change trajectory model that represents the year of disturbance occurrence, time interval, and range of vegetation index changes in these two events with the attributes of disturbance occurrence, disturbance amplitude, and duration. Notably, the polyline in Figure 3 is the dynamic trajectory of the mining disturbance area, which is progressively repaired and disturbed after recovery. The shape and attributes of the trajectory are dependent on the background ecological conditions, mining process, and the impact of reclamation.

2.3.3. Support Vector Machine

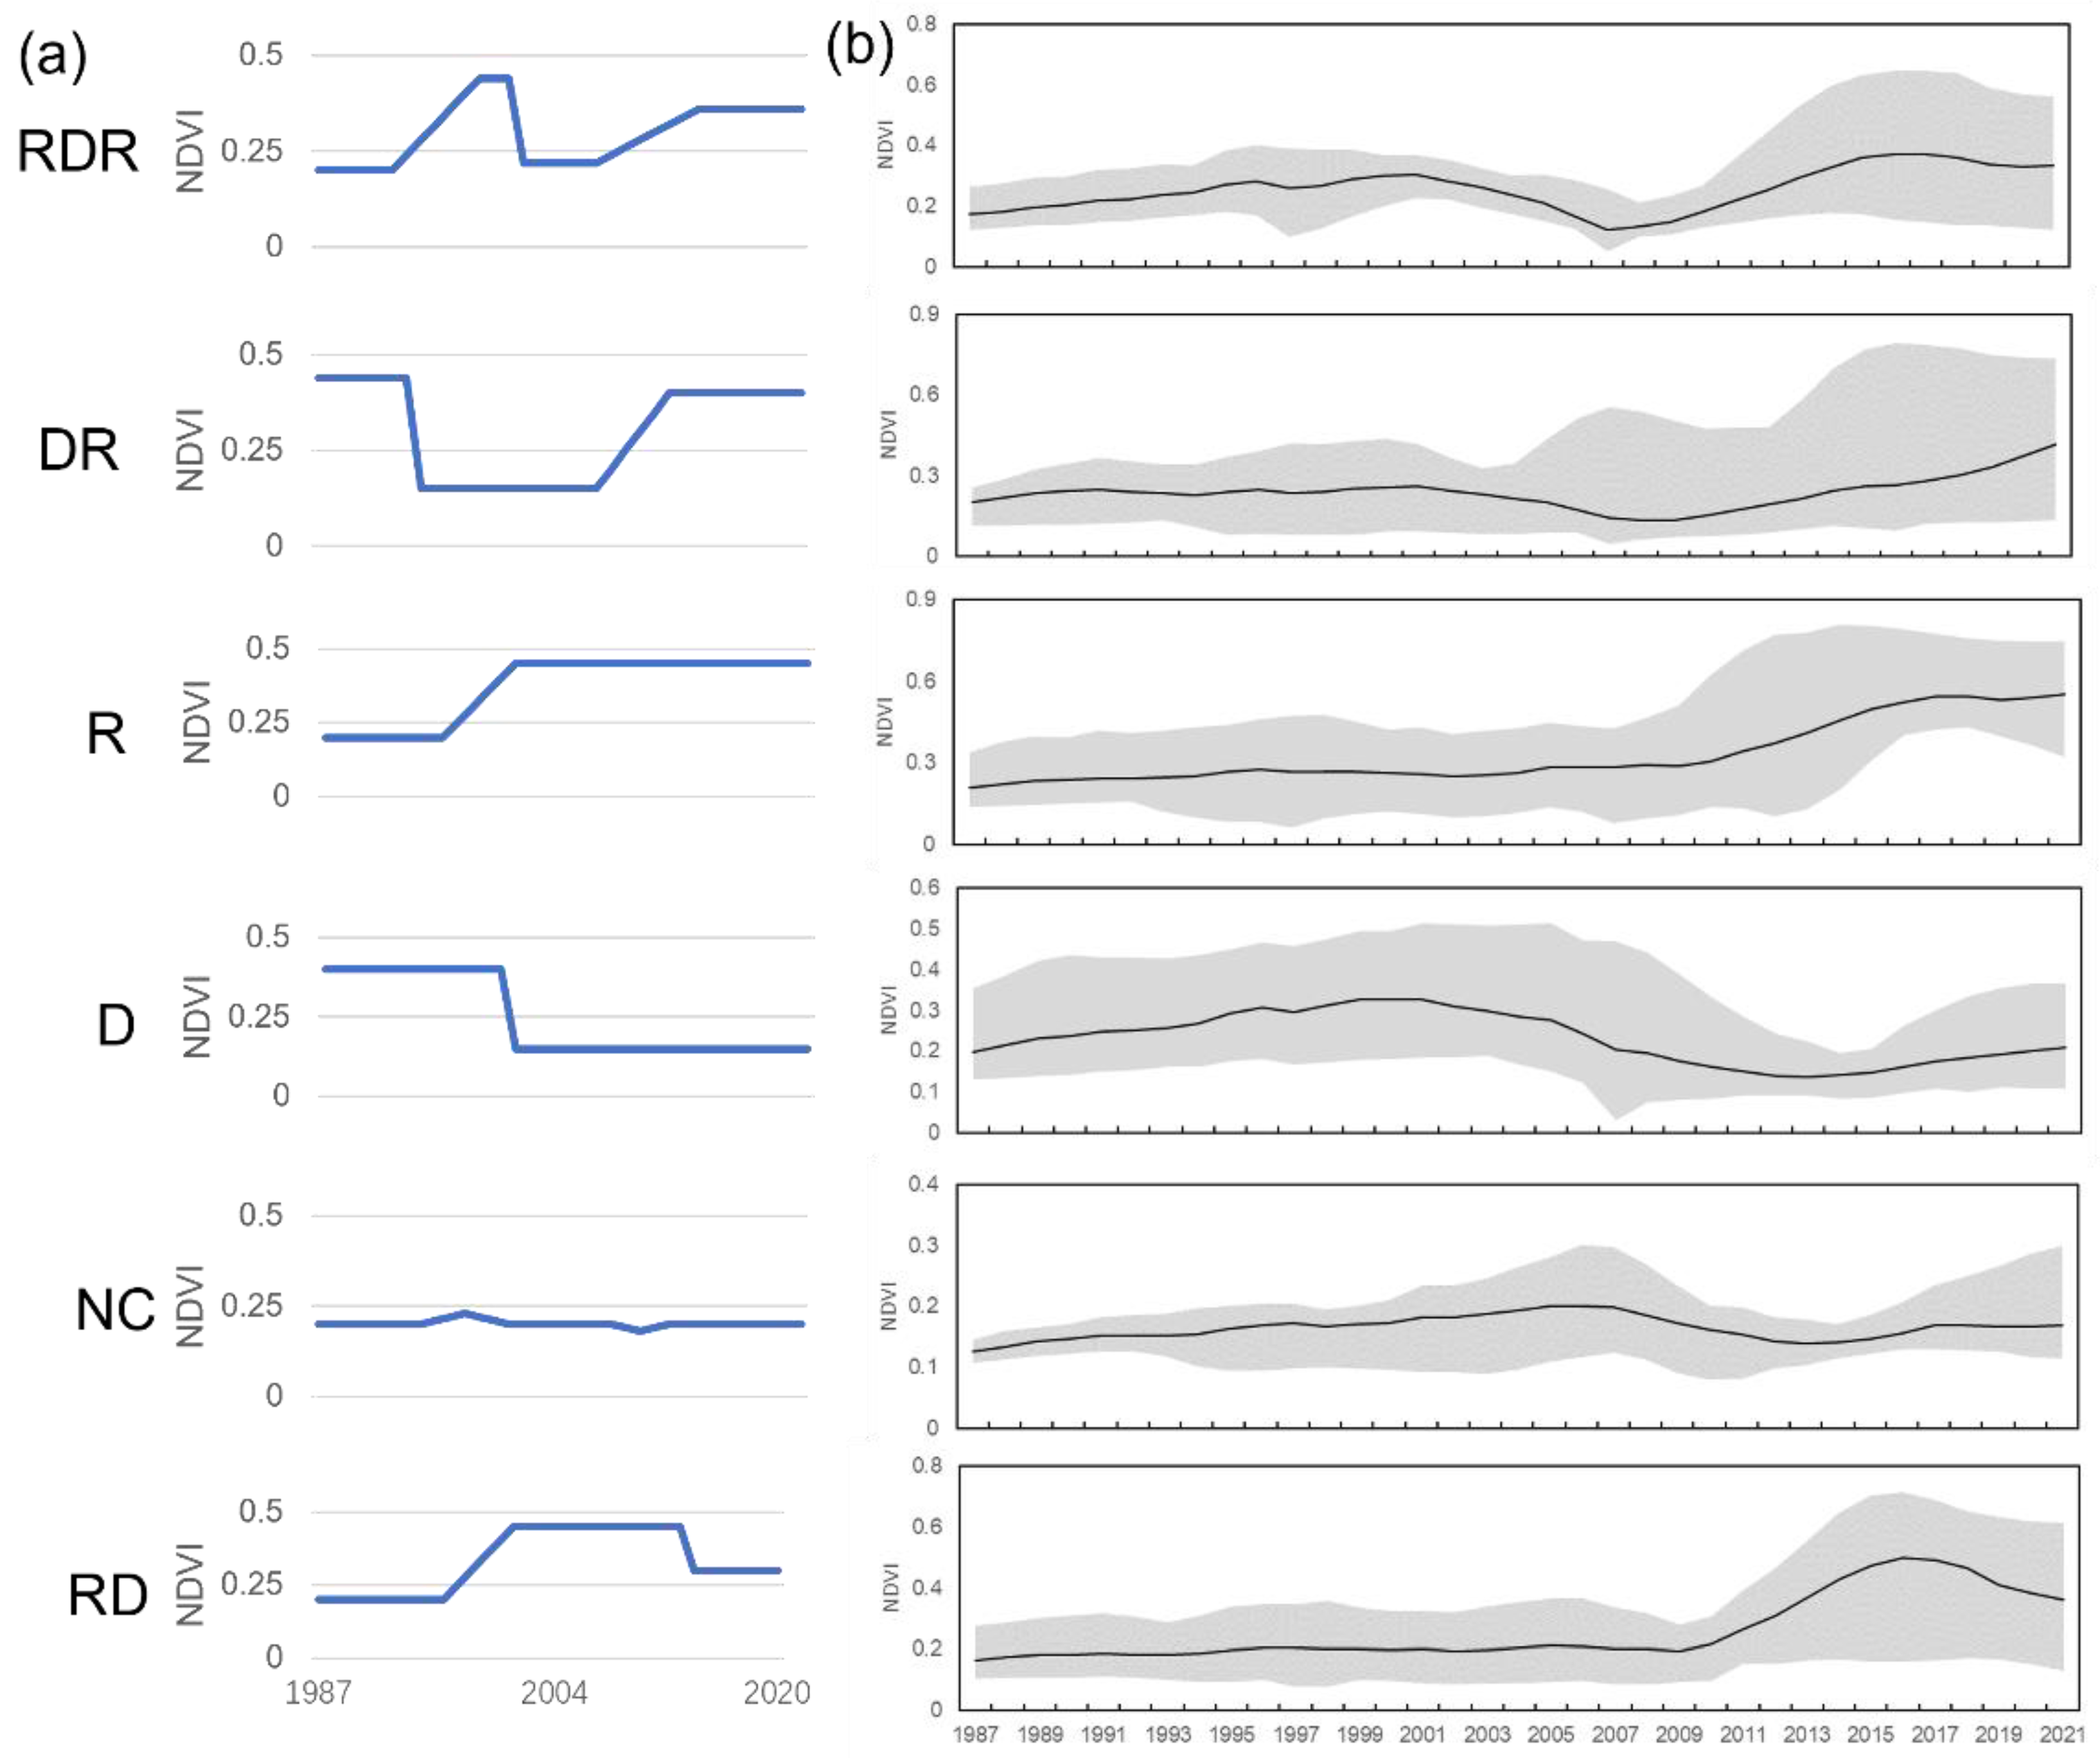
The support vector machine (SVM) is a powerful machine learning approach for data classification and regression problems with high dimensionality based on statistical learning theory and structural risk minimization principle [39,40]. It is one of the most successful supervised classifiers for remote sensing image classification [41], and can perform optimal classification on the basis of minimizing errors. The ability to extract different feature types from remote sensing images by selecting training samples has important applications in regional-scale research [42]. The SVM can still achieve classification results with small errors even when the training samples are insufficient [43,44]. In this study, the SVM was used to classify different change patterns over H-HOCMs according to different NDVI change trajectories. We divided the NDVI trajectory patterns into six categories, namely, no change (NC), disturbance (D), restoration (R), disturbance–restoration (DR), restoration–disturbance (RD), and restoration–disturbance–restoration (RDR) events. The theoretical schematic curves and statistical ones from samples are shown in Figure 4.

2.3.4. Validation

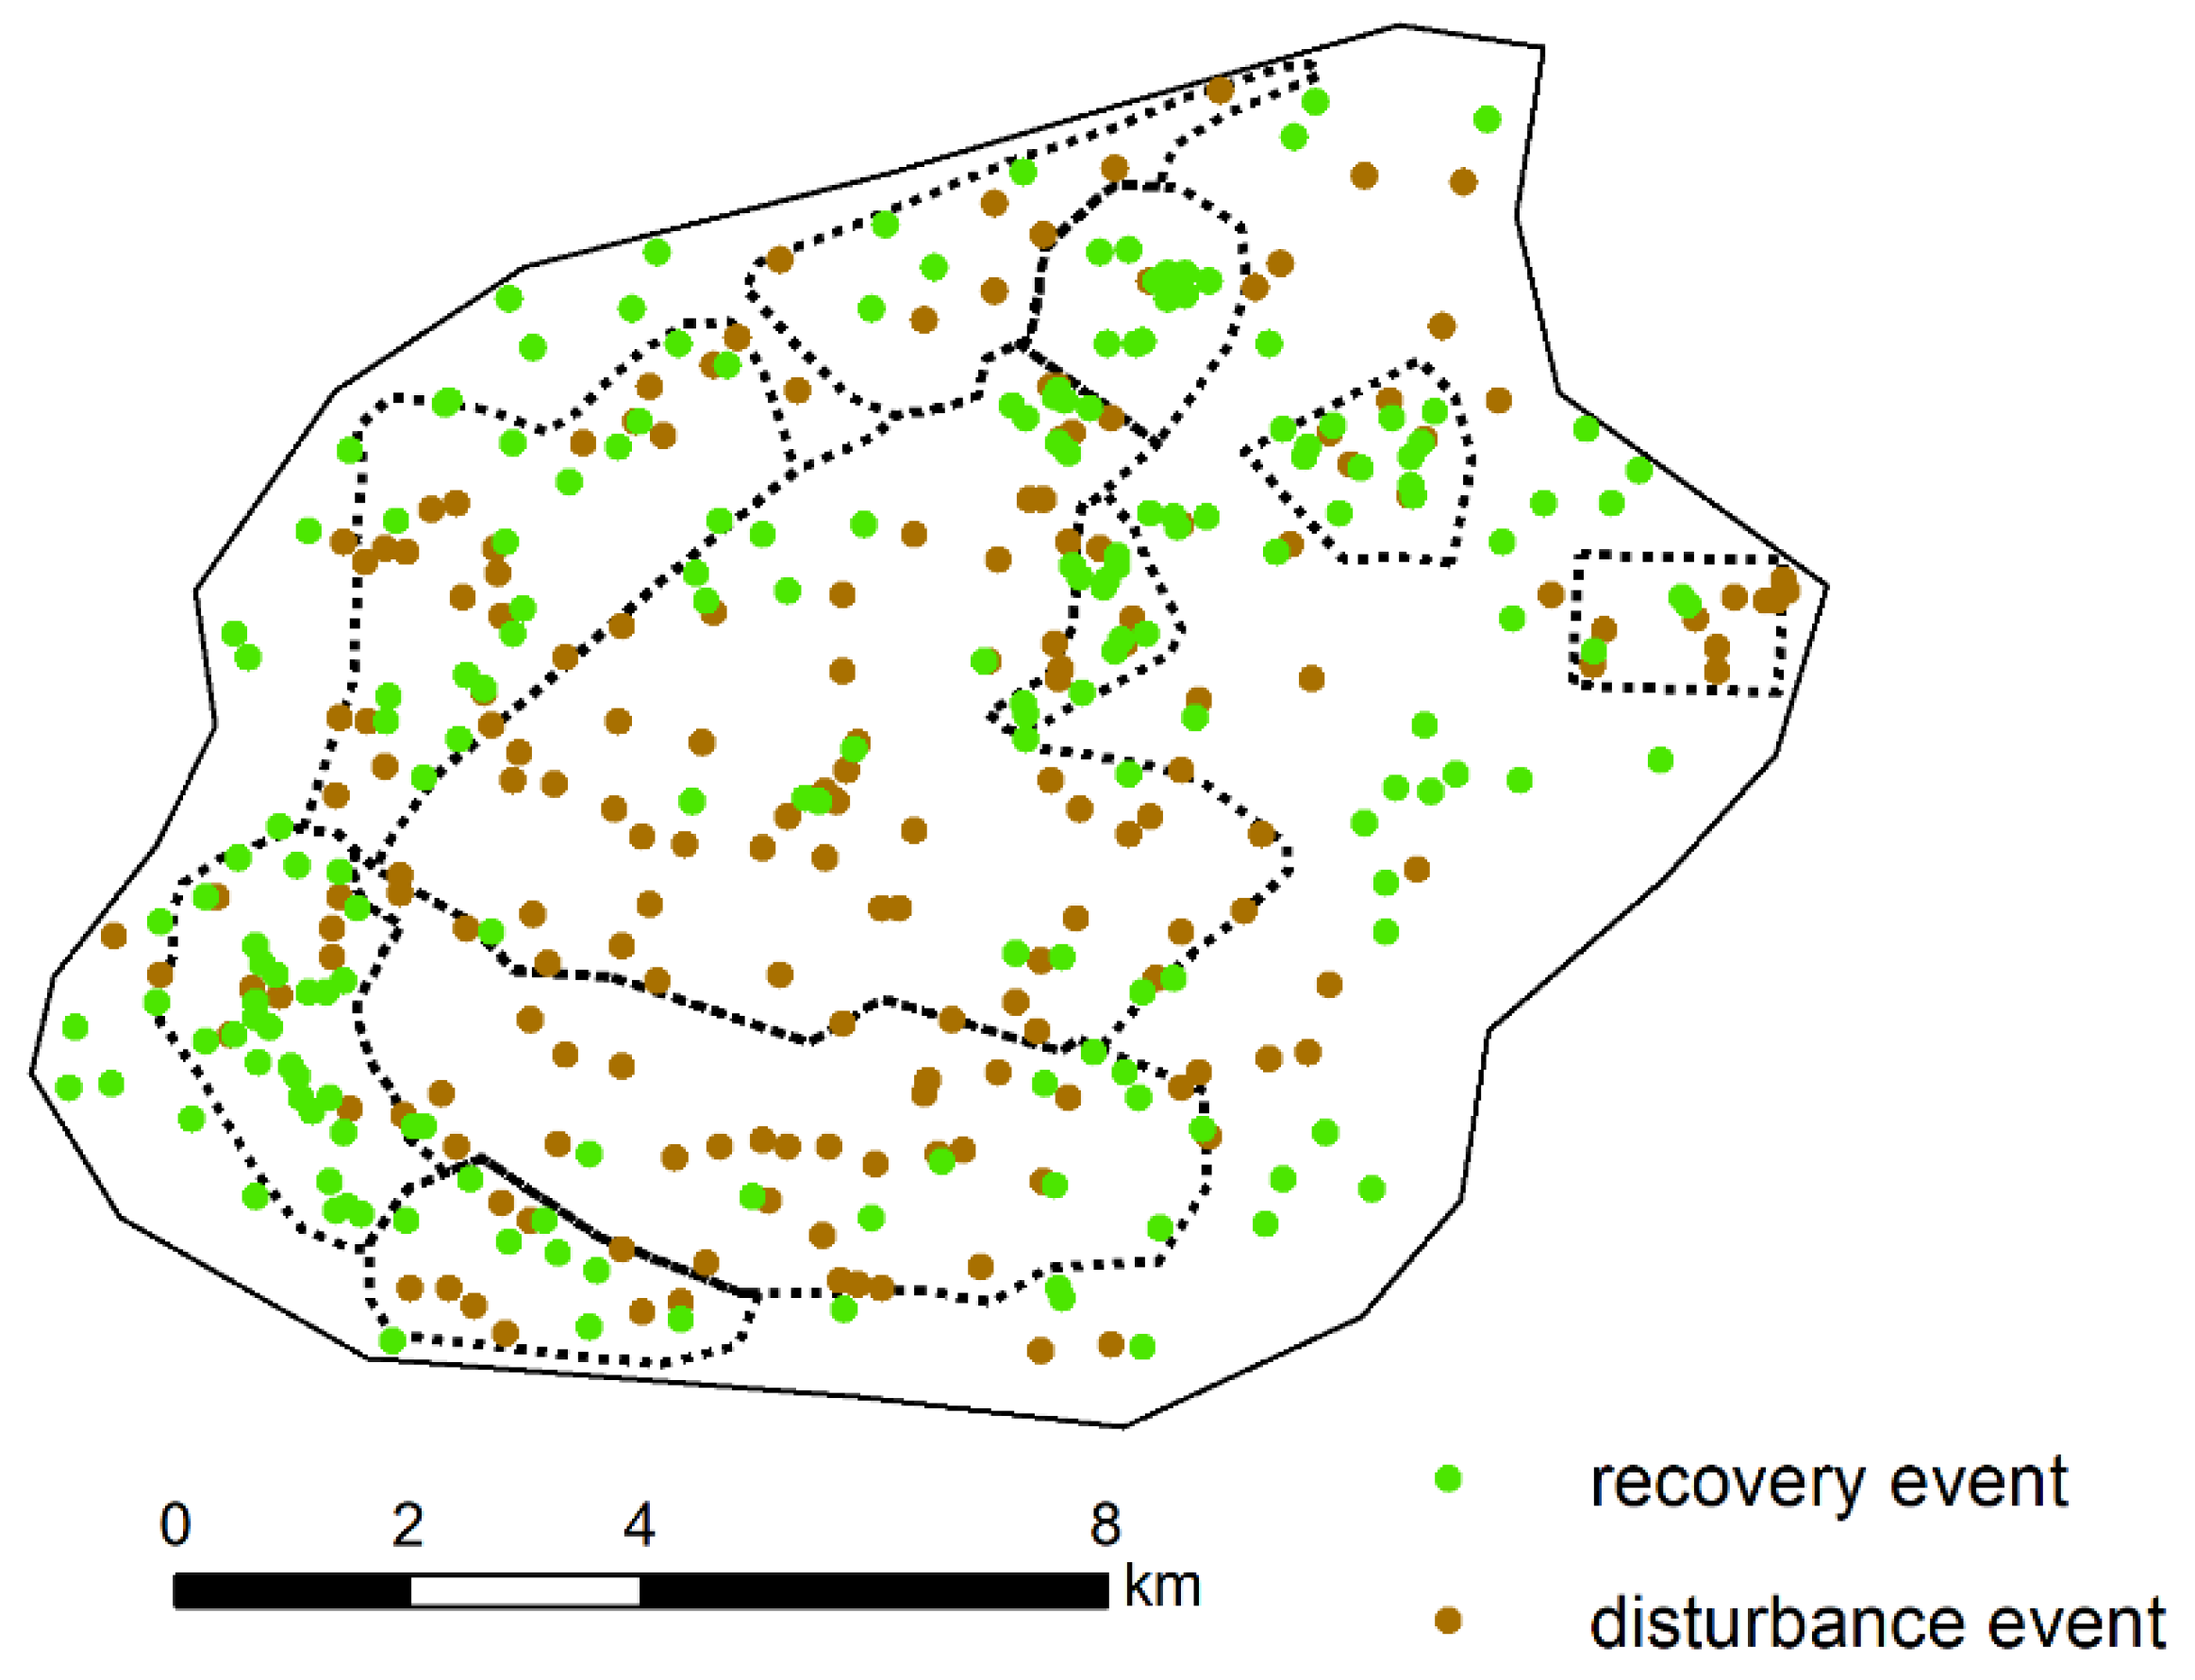
After employing LandTrendr and SVM, we selected a collection of 365 verification points by visual interpretation to validate the results. To ensure the reliability of the validation, we labeled various samples as extensively as possible within the region. The verification points, including the disturbance and restoration events are shown in Figure 5. A confusion matrix for the occurrence of events was generated to calculate kappa coefficients (K), user accuracy (UA), producer accuracy (PA), and overall classification accuracy (OA).
O A = i = 1 n x i i N
P A = x i i x + i
U A = x i i x i +
K = N i = 1 n x i i i = 1 n x i + x + i N 2 i = 1 n x i + x + i
Here, N is the total number of samples, n is the number of rows and columns in the confusion matrix, xii is the number of samples in row i, column i, and x(i+) and x(+i) are the total numbers of samples in row i and column i, respectively.

2.3.5. The Ratio of Cumulative Disturbance to Restoration (CDRR)

CDRR is defined as the ratio of cumulative areas of a disturbed field to restored one from the start year to the focus year of the monitoring period. This indicator can also be used to assess the sustainability performance of the study region in a given period.
C D R R = i = 1 n A r i = 1 n A d
n is the number of years from the beginning. Here, we set the beginning as 1988, which removed the disturbance errors, eliminated sustained natural recovery, and reflected the disturbance and restoration of vegetation caused by human activities. A r and A d are the cumulative area of restored and disturbed fields, respectively.

3. Results

3.1. Accuracy Verification

The confusion matrix shows the producer and user accuracies in Table 1 for each year. The disturbance and restoration years of most samples are consistent with visual interpretation, except for 2010, 2013, etc. The overall accuracy for extractions of restoration and disturbance events reached 84.5% and 83%, respectively, and all kappa coefficients reached 0.82. The accuracy of the two events indicates that the parameters are suitable and the results are reliable.
The results of supervised classification were evaluated by the sample numbers for D, RD, DR, R, NC, RDR patterns of 107, 72, 39, 142, 2, and 3, respectively. A confusion matrix was generated, and the K, UA, PA, and OA were calculated. The classification results of vegetation change trajectories by SVM showed a high PA and UA, with an OA of 81% and a kappa coefficient K of 0.73. The accuracy of NC and RDR trajectory types are relatively low because they are hard to distinguish.

3.2. Vegetation Disturbance and Restoration Results

Vegetation disturbance and restoration in the H-HOCMs over the period of 1987–2020 were obtained using the LandTrendr algorithm. The year of disturbance and restoration, spectral index change amplitude, and duration of disturbance and restoration in the studied region were extracted to reflect changes in mining ecological disturbance and vegetation restoration in the mining fields.

3.2.1. Occurrence of Vegetation Disturbance and Restoration

The occurrence of mining-related ecological disturbances and vegetation restoration in the region under observation, that is, the year of disturbance or restoration events on each pixel, is presented in a gradient to show the spatial and temporal distribution of change events (Figure 6). The different colors in Figure 6 represent the time of the event. In the LandTrendr algorithm, 1987 was considered as the starting point for disturbance or restoration. According to the actual situation of this mining area, the mining started in 1990; therefore, the disturbance occurrence year of 1987 was filtered out (Figure 6a). The hollow area in the disturbance and restoration maps indicates that there may not have been disturbance or restoration events during this period.
Vegetation disturbances mainly occurred in the core field of the mine, including the construction fields (A), external waste dumps (B), and pits (C). The occurrence of mining activities in the studied region has a strong regularity, spreading from the northwest (Figure 6a). The first layout of the Heidaigou open-pit mine advanced from the northeast to southwest, from the beginning of the 1990s to the 2010s. The second area of the Heidaigou open-pit mine extends from west to east, similar to the Haerwusu open-pit mining area. The occurrence of disturbances increased from 2010 in the west to 2019 in the east. In addition to the continuous mining disturbance areas directly related to coal seam mining, infrastructure mainly disturbed fragments A1 and A2 in 1990 for Heidaigou and 2006 for Haerwusu.
The occurrence of restoration indicates that the restoration situation is distributed throughout the region, unlike the disturbance, without a distinct advancement process or time course (Figure 6b). The vegetation in the surrounding environment is characterized by continuous greening since 1987. The restoration of waste dumps (B) occurred after 2000; specifically, the dump in Haerwusu (B5) has been mainly restored since 2012, and the restoration of the external dumps in Heidaigou (B1–B4) occurred earlier. Most of the pit areas did not have obvious restorations except for the inner dump north of the Heidaigou pit.
The annual disturbance and restoration areas from 1987 to 2020, and the ratio of CDRR are presented in Figure 6c. In 1987, there was a large mining disturbance area due to errors caused by the algorithm’s division of abrupt changes. Therefore, we excluded the starting year. Notably, the periods 1999, 2007, 2011, 2014, and 2017–2020 witnessed larger areas of vegetation disturbance due to mining operations. The disturbance area was 608.04 ha in 1999, suggesting that coal mining activities officially commenced during this period. This aligns with the social materials that mention the start of construction in 1990, followed by the official transition to production in 1999. The disturbed areas in 2007 and 2011 were also noteworthy, indicating possible expansion activities by the coal mine during those periods. This corresponds to the expansion and transformation mentioned in the related materials published in June 2006. While direct evidence of expansion in 2011 is lacking, social materials mention that this open-pit coal mine surpassed 31 million tons in 2011, becoming the largest in China. Therefore, the mining area likely experienced a new phase of expansion and transformation from 2010 to 2011 to facilitate increased production operations.
The total area of vegetation recovery since 1987 was 4331.79 ha, which indicates a greener outer environment. In mining areas, vegetation rehabilitation has occurred over large areas since in 2000, 2002, 2008, 2010, 2012, 2013, 2016, and 2020. The CDRR began to be significantly higher than in the previous years since 2012, which implies that the mining area implemented vegetation restoration measures in 2012 after the construction of China’s largest coal mine in 2011. The CDRR level was relatively high throughout 2018, with only a slight decline between 2018 and 2020, demonstrating that vegetation restoration measures were implemented vigorously and effectively.
The results of the above analysis show that during the nine years since construction of the mine began in 1990 to 1999, the degree of development was not high, and there was no obvious change in the natural recovery of vegetation. The scale and production of coal mines improved from 1999 to 2011, and many vegetation restoration projects were conducted after 2011. The total restored area from 2012 to 2020, as shown in Figure 6c, indicates the remarkable efficiency of ecological rehabilitation.

3.2.2. Magnitude of Vegetation Disturbance and Restoration

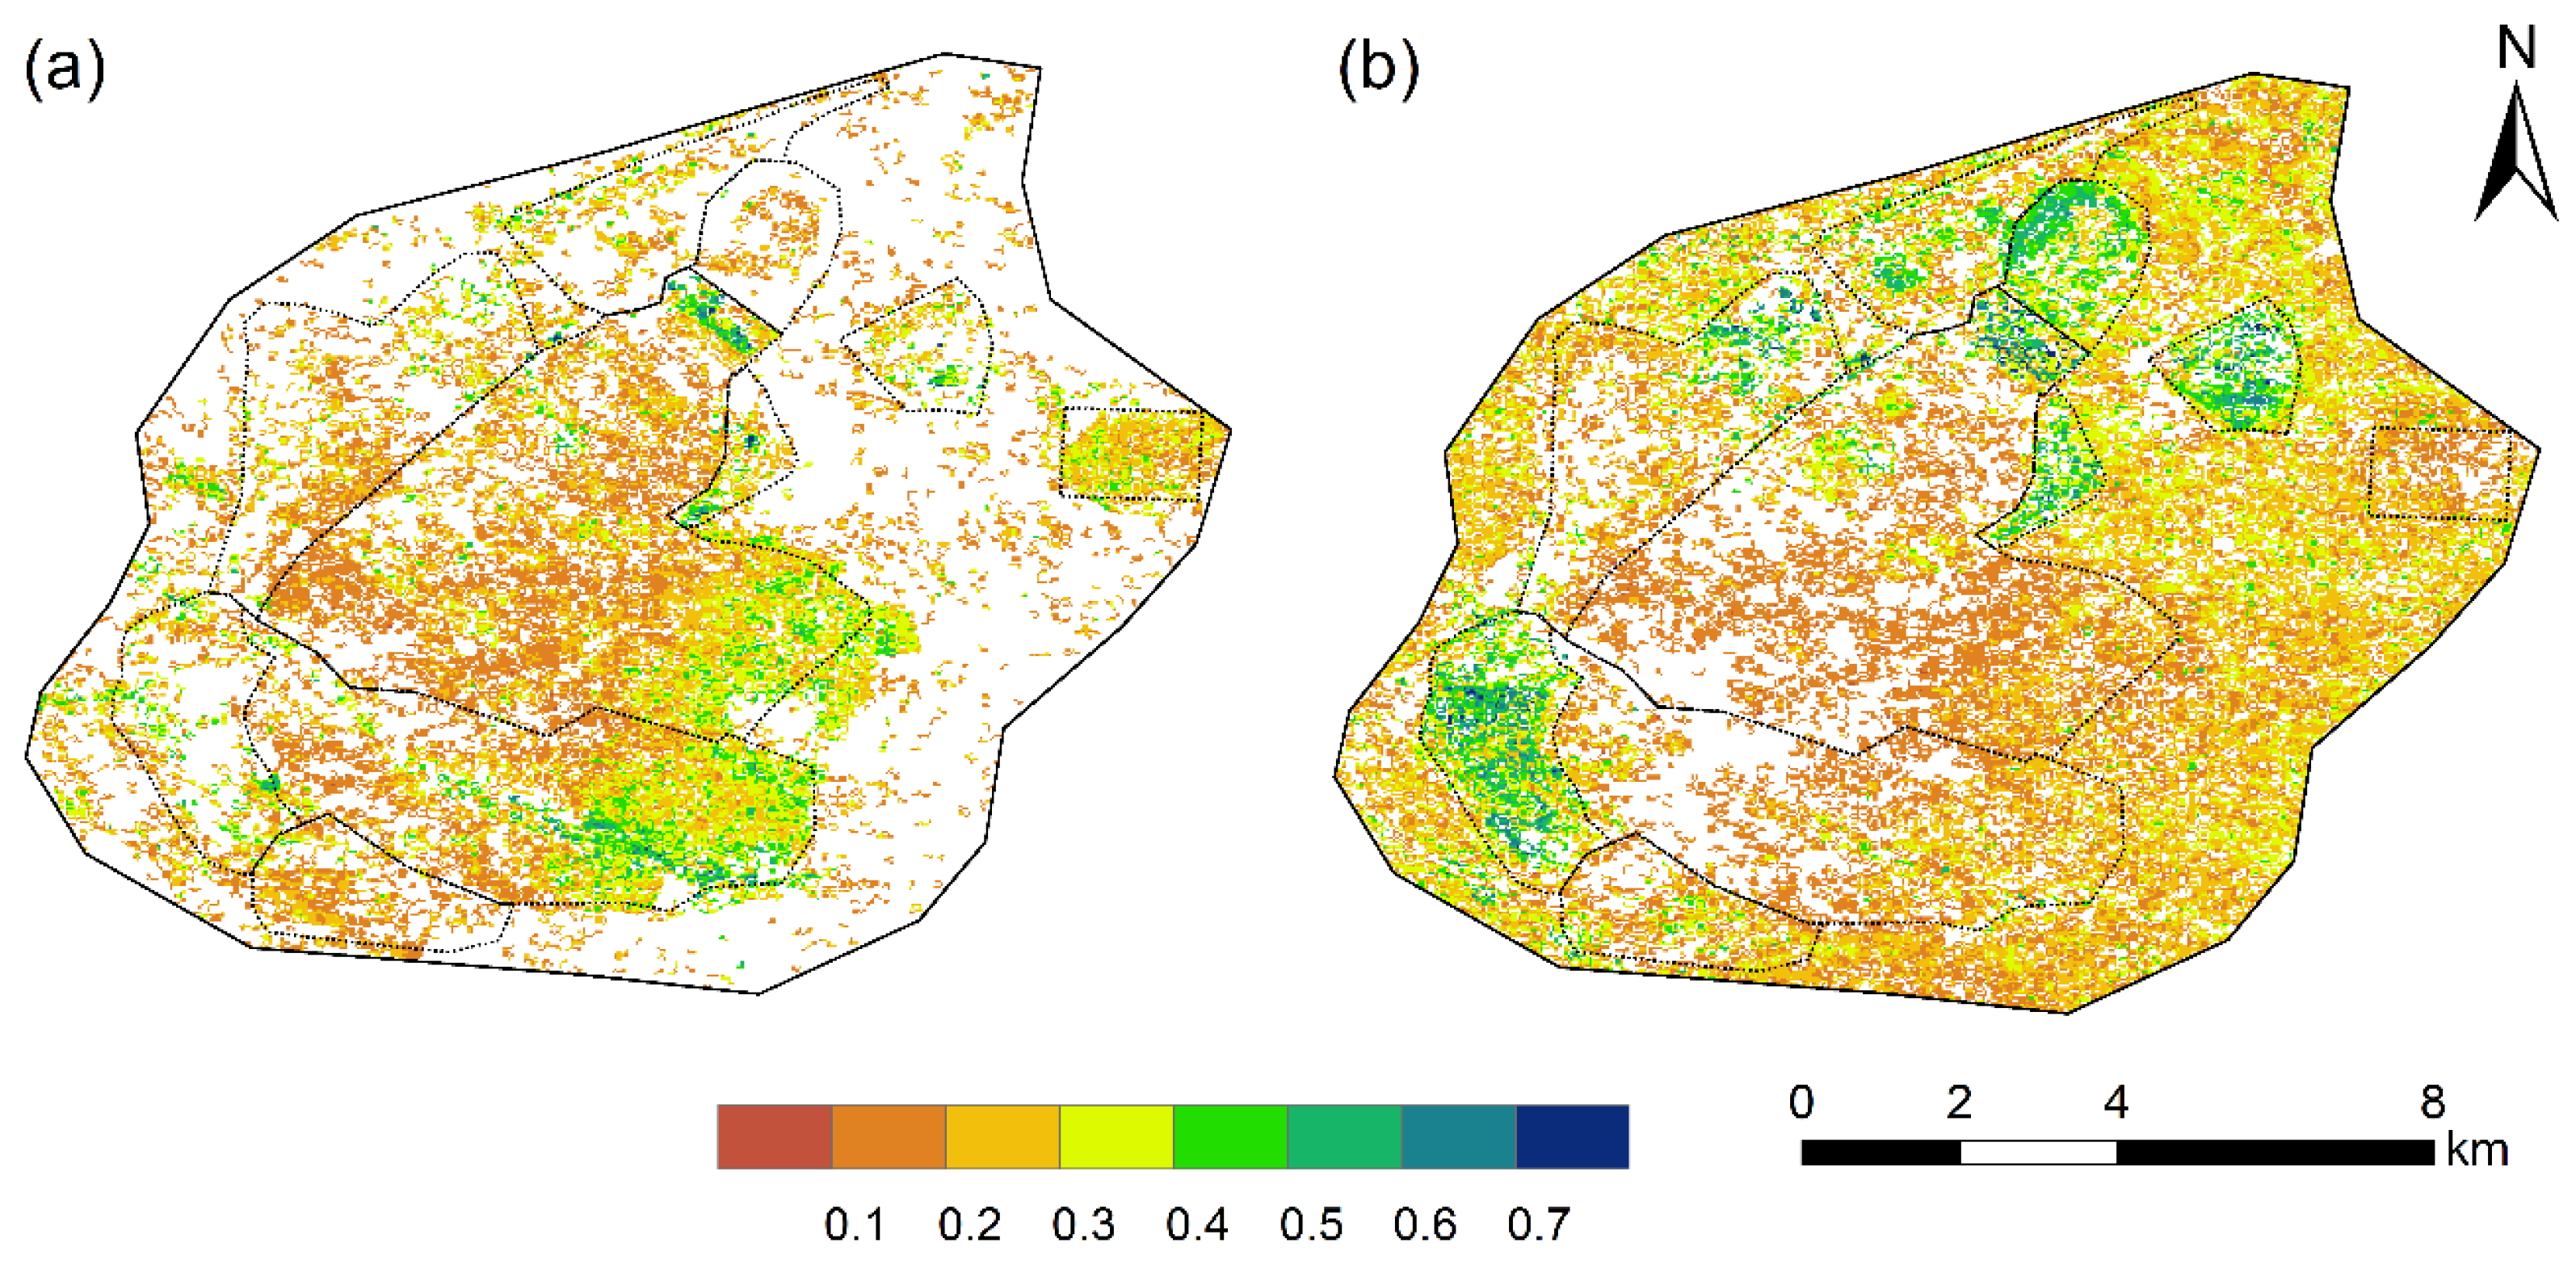
The spectral index change amplitudes of the mining ecological disturbance and vegetation restoration were extracted to reflect the change intensity. The spectral index (NDVI) change amplitude was computed, as shown in Figure 7. In recent years, the fields of greater vegetation disturbance have mainly been located in the pits, including the pits of Heidaigou Phase II, Haerwusu, and Cuiergeju in the northeast. The disturbance magnitude of recent pits can reach 0.5–0.6, which is larger than that of previous ones owing to the increasing natural vegetation. Disturbances in other areas, including construction land, dumps, and old pits, are very small because of the low vegetation cover of the previous areas. In addition to the direct disturbance caused by mining, other fragments were disturbed by related facilities.
The maximum vegetation restoration magnitude is 0.6–0.7, mainly in the external dumps of the two coal mines (B1–B5) and construction area of Heidaigou (A1). Most of the revegetation intensities in the external environment of the mine are within the range 0.2–0.4. Additionally, the inner dump built in the north part of the Heidaigou open pit has been reclaimed with restoration magnitudes of 0.3–0.5. Vegetation restoration is difficult in this mining area because of the high degree of soil damage caused by mining operations. However, the fields with larger disturbance amplitudes have relatively higher restoration amplitudes, which supports the inference that vegetation restoration measures were successfully implemented after 2011 in the mining region.

3.2.3. Duration of Vegetation Disturbance and restoration

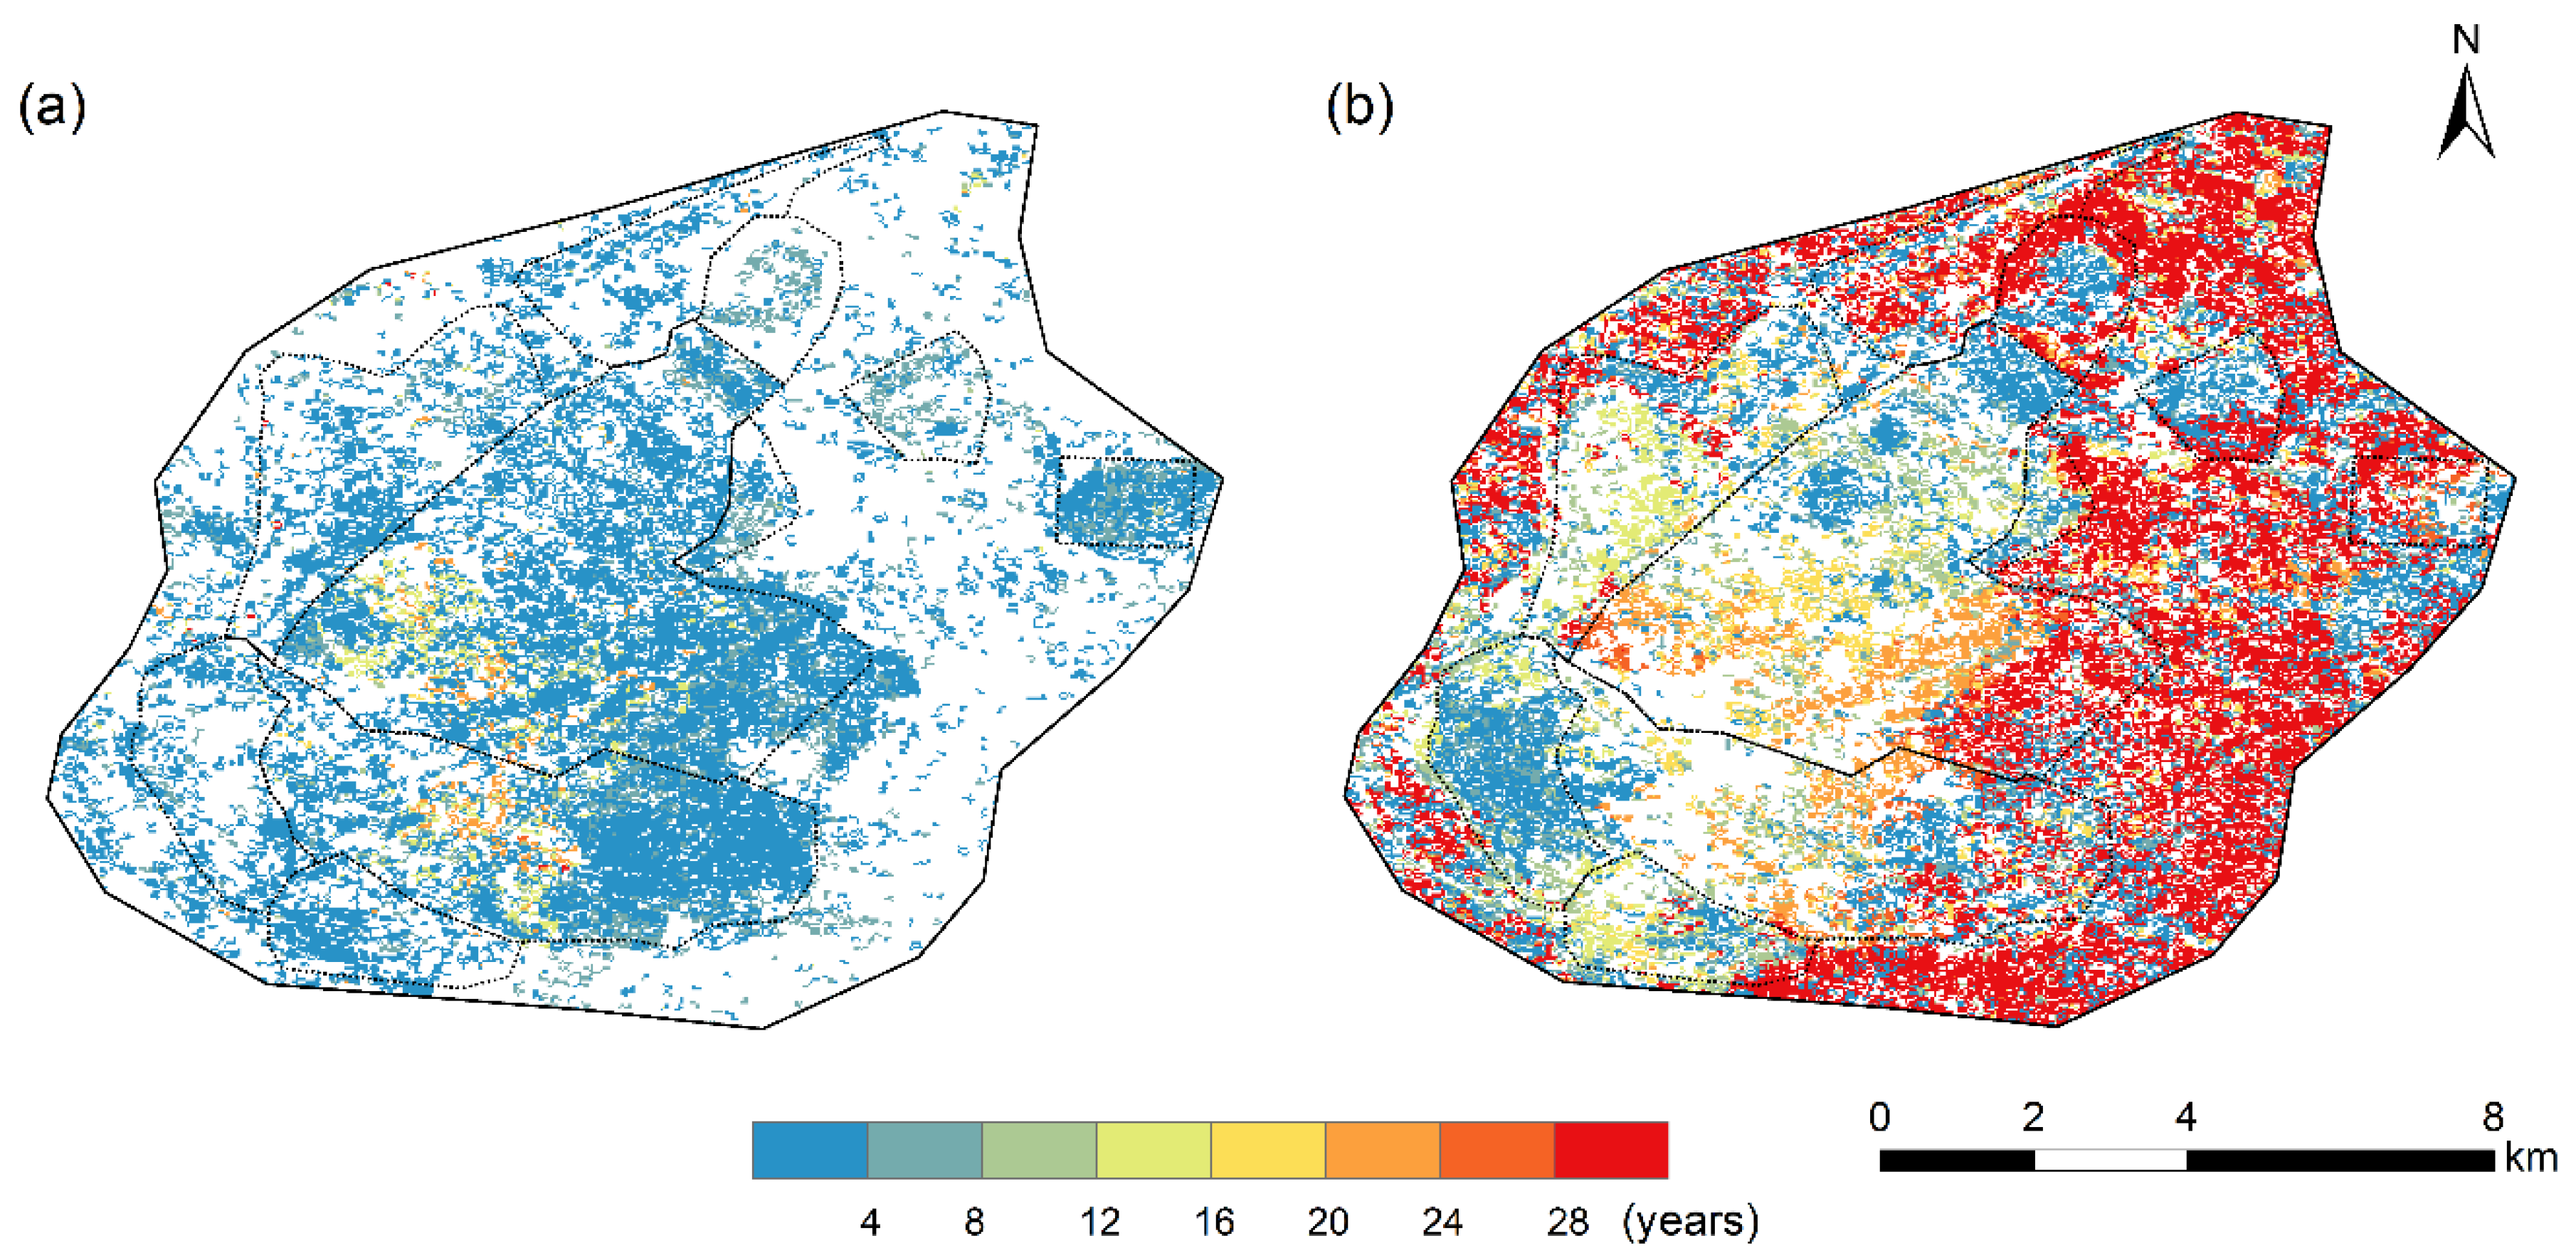
The duration of ecological disturbances and vegetation restoration events in the studied region ranged from 1 to 29 years (Figure 8). In the mining fields, the disturbance time was relatively short (<5 years) (Figure 8) because mining operations were more disruptive but faster in the deposit area and later mining operations were based on the disrupted surface. However, the areas southwest of the mining fields (C1 and C2) were used for stockpiling operations for many years, and therefore, they were disturbed for a longer period (approximately 20 years). Sporadic disturbances occurred in the outer environments of the two surface coal mines, and the duration of these disturbances was approximately four years.
The restoration duration was relatively long compared to the disturbance duration. The peripheral vegetation of the mine sites showed sustained greening without disturbance, with a recovery time of ≥28 years. The restoration time in dumps B1 and B2, north of B3, B4, and B5, and the inner dump of Heidaigou was ≤5 years. Combined with the vegetation restoration area statistics table, these restorations were mostly concentrated after 2011. The restoration duration for the pit areas of Heidaigou phase II, Haerwusu, and Cuiergeju lasted approximately 20 years because the pits were mined late, and the ground surface underwent restoration followed by disturbance.

3.3. Vegetation Disturbance and Restoration Pattern

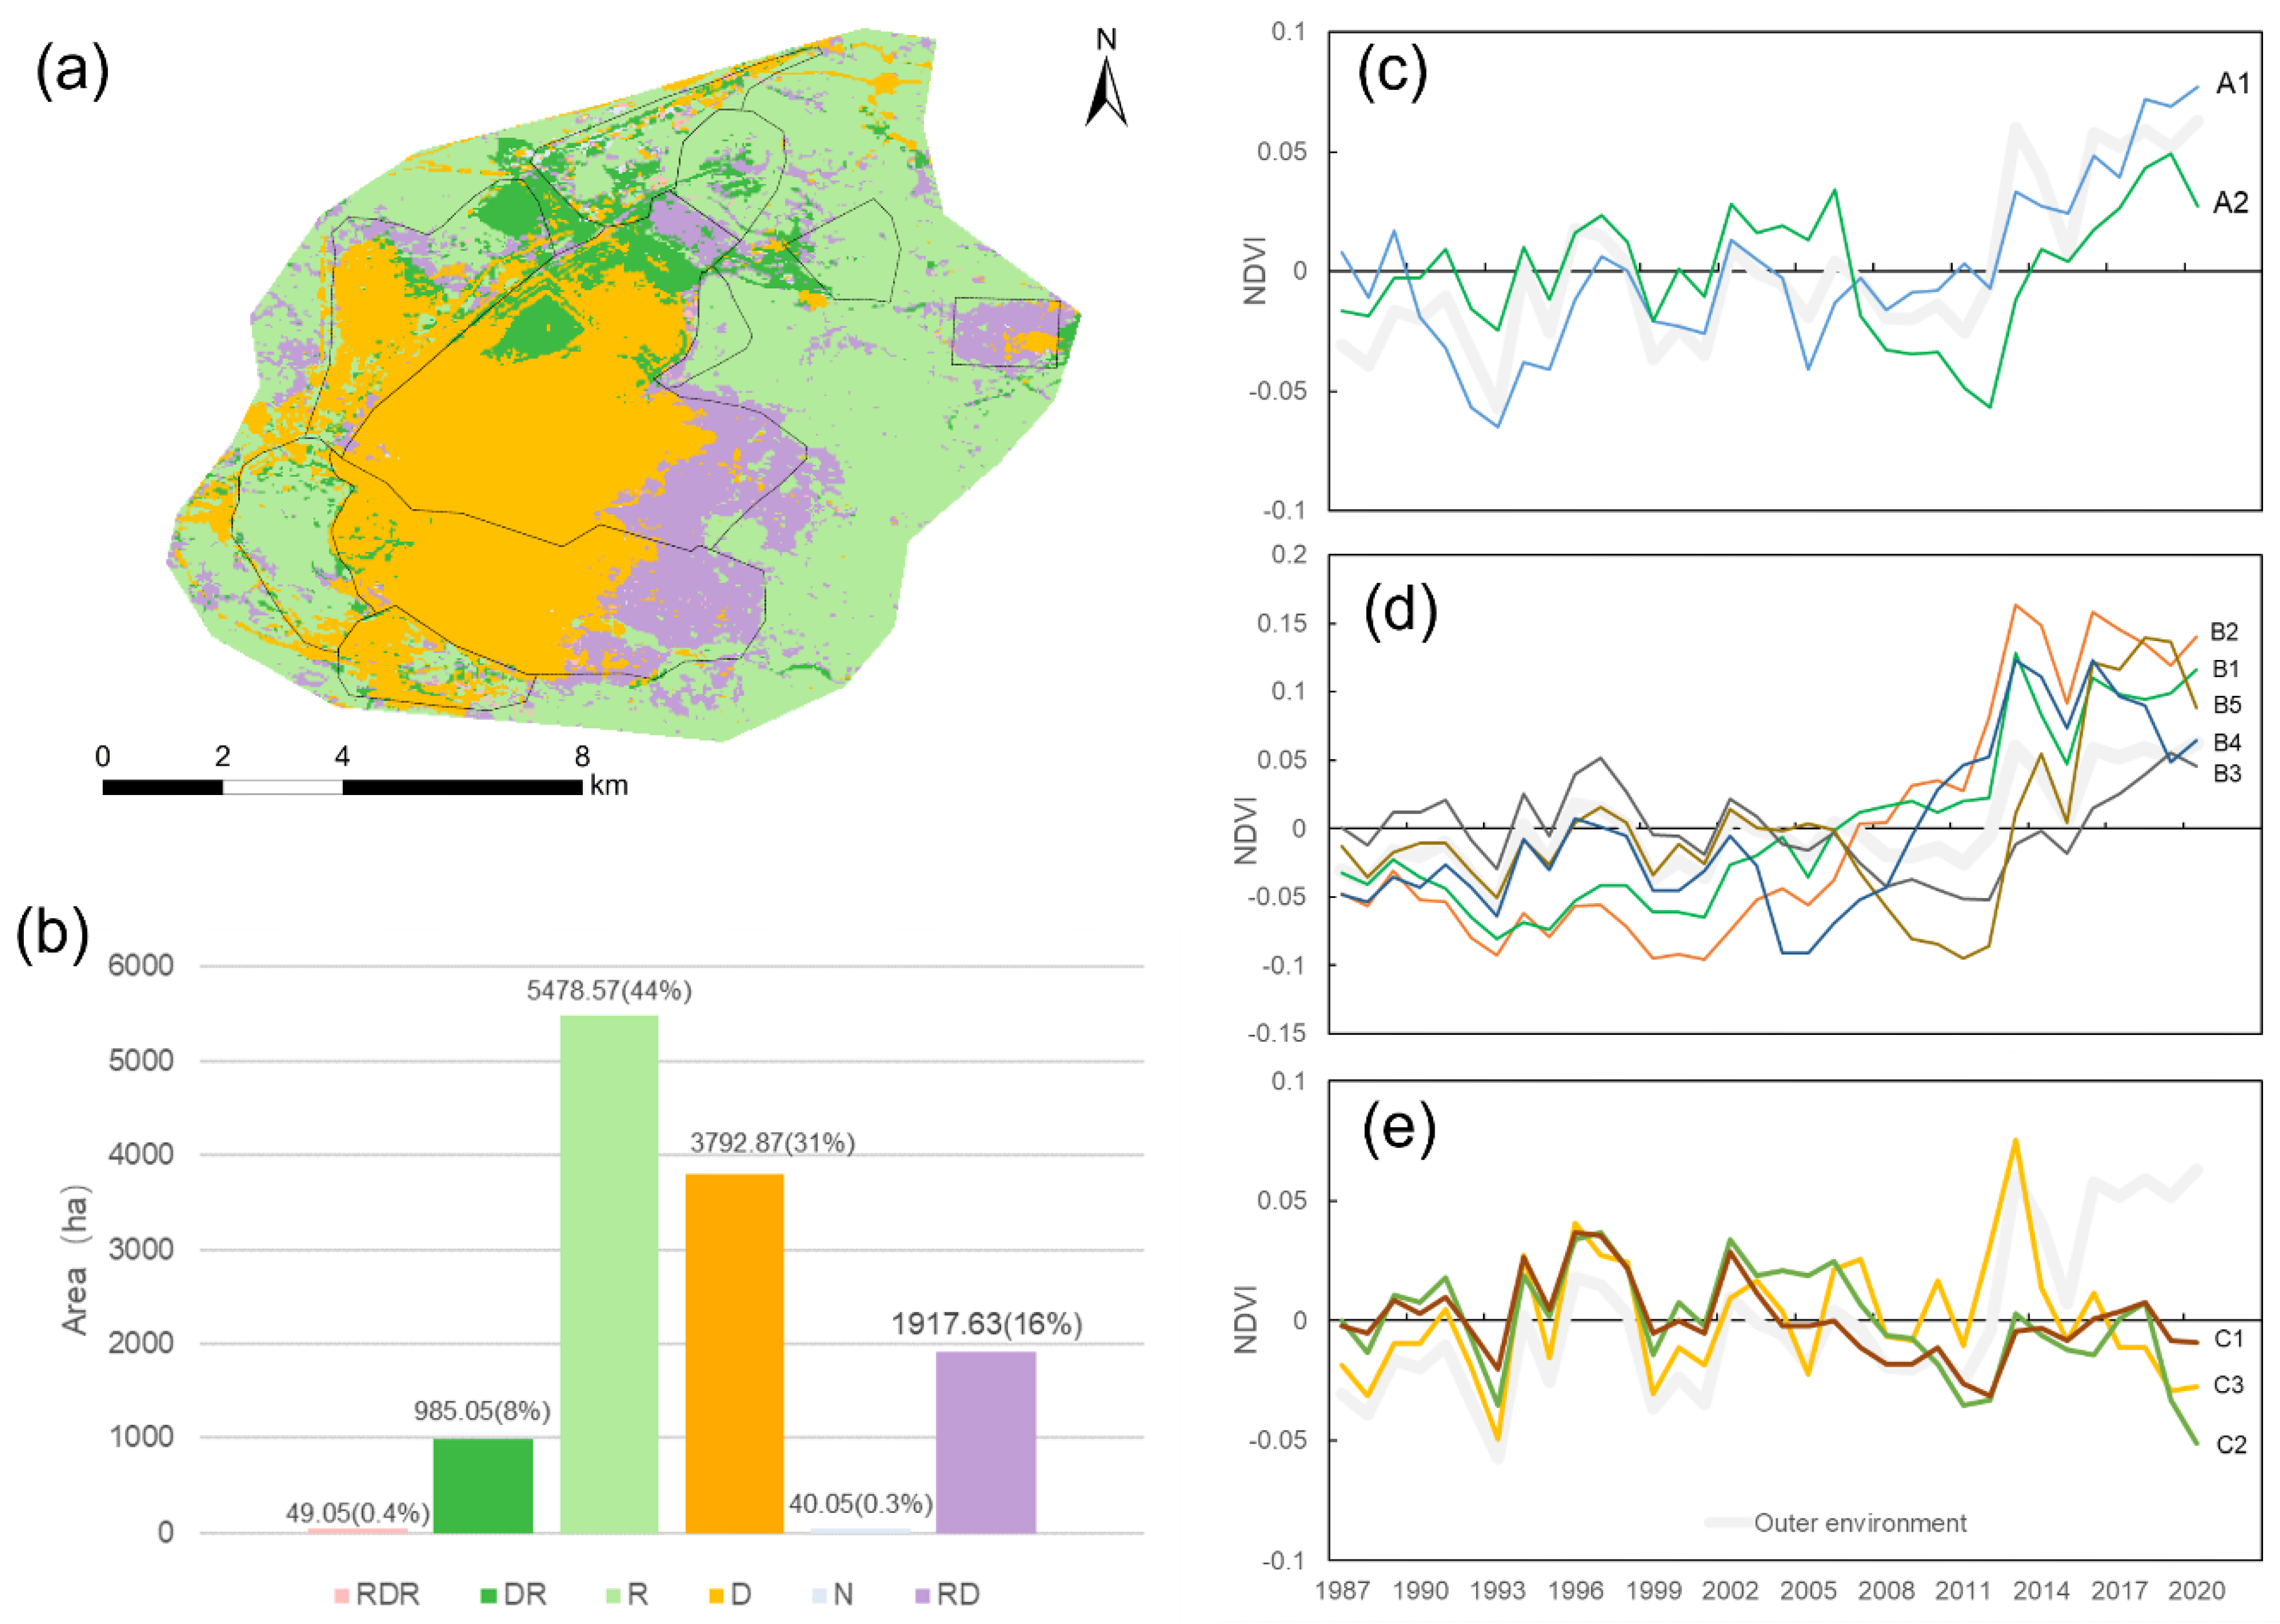
The change patterns showed that vegetation restoration occupied the largest area, followed by D, RD, DR, RDR, and NC (Figure 9a,b). The vegetation restoration was mostly located around the mining field, indicating that the outer environment around the mining field was not disturbed by mining activities on a large scale and that the increase in temperature and precipitation over the past 34 years greatly promoted vegetation growth in these fields. The mine site core is still dominated by disturbance patterns occupying approximately 31% of the studied region. Most of the Heidaigou open-pit field was disturbed during nearly 30 years of anthropogenic mining activities, with the northwestern field being disturbed first and then reclaimed. The changing pattern in the western field of the Heidaigou and Haerwusu open pits was RD mainly because it was mined in recent years, and there was a period of vegetation restoration before mining. The field where no events occurred was small, and it is located primarily near the A1 transportation facility. The RDR pattern was located at the intersection of the mining field and the spoil dump, and it is affected by the mining transition period of the Heidaigou mine, causing changes in vegetation disturbance and restoration patterns.
The NDVI anomalies for different sites of fields in H-HOCMs are shown in Figure 9c,e. Due to the influence of mining activities, each sub-area of the mining region also shows different vegetation change patterns. Vegetation in the outer environment shows a R pattern with consistent greening trend. The mine construction area (A1 and A2) indicates a DR pattern, in which disturbance of A1 mainly happened in 1990 and A2 in 2006 (Figure 9c). The vegetation in these areas restored a similar magnitude to that of the surrounding regions afterward. Vegetation in five outer dumps was disturbed at different periods of mining activities and restored dramatically in the past decade (Figure 9d). The restoration magnitude of most dumps is much higher than that of the surrounding environment. The vegetation change curves of the mining pits are the combined effect of long-term mining activities, especially the Heidaigou with a longer period of disturbance and restoration. The overall change curves of the three pits exhibited a disturbance pattern, and disturbance in Heidaigou (C1), Haerwusu (C2), and Cuiergeju (C3) pit mainly appeared in 2002, 2006, and 2015, respectively.

4. Discussion

4.1. Reliability of LandTrendr Algorithm

In the GEE, we applied the time-series Landsat dataset and the LandTrendr algorithm to comprehensively analyze the vegetation disturbance and restoration of H-HOCMs in the Jungar Coalfield. The findings revealed that the LandTrendr algorithm could detect long-term changes and sudden events, making it an important tool for quantitative analysis. Running on the GEE, the algorithm offers high analysis efficiency, simplifies the research process, and reduces the cost of obtaining relevant information. Moreover, it can track the progress of these disturbances and their recovery over time, thereby offering valuable support for the ecological environmental supervision of open-pit coal mines. Thus, the LandTrendr algorithm can efficiently capture mine-induced disturbances and is a practical tool for mine restoration management [35].
However, there are limitations to consider when applying the LandTrendr algorithm for the evaluation of mining detection. First, the algorithm detection results may be affected by non-mining factors, such as clear-cutting and drought, which must be independently verified. Second, the setting of parameters will affect the algorithm and result, and the parameters must be continuously adjusted according to the background conditions of regional surface vegetation and the degree of disturbance; in addition, due to non-field investigations or image data accuracy problems, there may be some errors, and the bias of visual interpretation may result in insufficiently accurate data on the disturbance or recovery events, leading to errors. Finally, in ecologically fragile areas, changes in the NDVI caused by mining disturbances may not be significant. For example, the dumps in Northern Heidaigou could not be detected as vegetation disturbance due to the low vegetation index of the land surface. Similarly, there is a risk of misidentifying NDVI reduction resulting from land degradation as a mining disturbance, which affects the algorithm’s evaluation accuracy. Therefore, when applying the LandTrendr algorithm in practical applications, all these issues must be comprehensively considered, and appropriate parameters should be selected to address specific problems effectively.
Meanwhile, the LandTrendr algorithm also has some limitations in tracking vegetation disturbance and restoration in mining areas. First, it is only applicable to surface mining points as it relies on changes in the surface spectral vegetation index, which means it cannot be used for underground mines that do not cause surface changes. Second, when it is applied to detect the ecological restoration process in a large range of multiple mining areas, the requirements for the optimal segmentation of different mines cannot be met simultaneously if only one group of parameters is used [27], and challenges may arise in terms of feasibility owing to the need to customize parameters for specific mining areas. Third, the algorithm has high requirements for remote sensing image quality; poor image quality can result in missed or false change detections.

4.2. Disturbance and Restoration in the Jungar Coalfield

Over the past 30 years, the rapid development of China’s economy and the increasing intensity and breadth of production and construction activities have inevitably disturbed its ecosystem. The process of mine extraction and reclamation affects the surface land, resulting in more rapid changes to the surface than other natural causes, such as climate, posing a threat to local ecology and the environment. In China, surface coal mines are mainly distributed in the central and western regions, such as arid and semi-arid areas in Shanxi and Inner Mongolia, where the ecological environment is relatively fragile [45,46]. According to public data released by the Ordos Municipal Government, by the end of March 2020, there were 134 coal mines in Junge Banner, of which 86 were in production, including 47 coal mines and 39 open-pit coal mines. Heidaigou and Haerwusu are the two largest open-pit coal mines in the region. Surface mining has a greater ecological impact, making it more difficult to conduct reconstruction and restoration [16].
Land reclamation in mining areas has gradually received attention from 1989 to the year the “Regulations on Land Reclamation” were implemented [46,47]. In 2006, land reclamation was included in China’s mining permit acquisition and approval processes [48]. In 2011, the State Council of China promulgated the “Land Reclamation Regulations”, which states that all land damaged or destroyed by production and construction activities must be reclaimed. In accordance with the principle of “whoever destroys the land should reclaim it”, the producer or builder is responsible for its reclamation [26]. The Heidaigou open-pit coal mine is one of the first batches of pilot green mines announced by the Ministry of Land and Resources in 2011. As presented in Figure 6c, most restoration efforts occurred in 2012 and 2013. Reclamation of the mined field adopts the method of “immediate mining and filling”, taking materials locally and backfilling locally. The entire process involves backfilling the rock and loess of the area currently being mined to the last mining area, ultimately forming a piece of the flat inner row of the soil field. The mined area in Northern Heidaigou was changed into an inner dump and was reclaimed as vegetated fields.
Reclamation takes a long time, usually 3–5 years from the backfilling with rock and loess to the natural settling and maturation of the land. The reclaimed vegetation in the artificial region of this study could recover from the mining disturbance in approximately 4 years, which is similar to the 3–5 years suggested by Li et al. (2019). However, vegetation in a shrub/grass community usually takes 15–30 years for natural succession [14,49]. Our study shows that the increase in greenness in the surrounding area takes over 20 years and that artificial vegetation restoration can greatly shorten the restoration time and enhance the intensity.
The Heidaigou and Haerwusu open-pit coal mines were selected from the National Green Mine List for 2020. With increasing awareness of environmental protection and the requirements of related regulations, the design and practice of reclamation projects run through the mining life cycle and continue for a long time after coal production [16]. Ecological mining planning for agriculture, forestry, grazingwas proposed according to the local natural and economic conditions in the H-HOCMs. The reclamation measures were carried out in the development design, mining, and practical land development stages of practical land. The reclamation field of the Heidaigou open-pit coal mine reached 1200 ha in 2020, and the reclamation rate of the external dumps is close to 100%. The vegetation coverage in the mining area has increased significantly, the structure of the ecosystem in the mining area has changed from simple to complex, and the vegetation population has changed from single to diverse, forming a natural landscape with greening in spring, flowers in summer, and fruits in autumn. Nevertheless, further ecological restoration is still needed for the internal dump transformed from the mine pit to achieve sustainable land use in the future.

5. Conclusions

We detected ecological disturbance and restoration details of large surface coal mines in the loess region, the Heidaigou and Haerwusu open-pit coal mines (H-HOCMs), using the Landsat images available from 1987 to 2020 and the LandTrendr algorithm on the Google Earth Engine cloud platform. A comprehensive analysis of the year, intensity, duration, and pattern of vegetation disturbance and restoration in the H-HOCMs was conducted. The main conclusions are as follows: (1) The LandTrendr algorithm is characterized by high accuracy in detecting ecological disturbance and restoration events in the H-HOCMs, with the overall accuracy of disturbance and restoration being 84.5% and 83%, respectively, and kappa coefficients of 0.82; (2) disturbance in the Heidaigou open-pit coal mine has continued since the beginning of the 1990s, in a north–south direction followed by an eastward advancement, and mining in the Haerwusu has advanced from west to east since 2010; (3) the vegetation greenness disturbance magnitude in the mining area is relatively low, and the duration is about 4–5 years, and the restoration magnitude and duration varied largely; and (4) the main trajectory type shows that vegetation restoration (R) occurring in the external waste dumps and outer surrounding area occupies the largest area (44%), followed by disturbance (D) of mining pits (31%), restoration–disturbance (RD, 16%), disturbance– restoration (DR, 8%), restoration–disturbance–restoration (RDR) and no change (NC).

Author Contributions

Conceptualization, Y.W.; Data curation, S.Z. and X.H.; Formal analysis, Y.W., H.Z. and X.H.; Funding acquisition, Y.G.; Methodology, S.Z.; Supervision, Y.G.; Validation, Y.C.; Visualization, D.H.; Writing—original draft, Y.W., S.Z. and H.Z.; Writing—review & editing, Y.G. All authors have read and agreed to the published version of the manuscript.

Funding

The study was supported by the National Natural Science Foundation of China (42041007-02, 42001009).

Data Availability Statement

The data that support the findings of this study are openly available.

Conflicts of Interest

The authors declare that they have no known competing financial interests or personal relationships that could have appeared to influence the work reported in this paper.

References

  1. Ranjan, A.K.; Sahoo, D.; Gorai, A. Quantitative assessment of landscape transformation due to coal mining activity using earth observation satellite data in Jharsuguda coal mining region, Odisha, India. Environ. Dev. Sustain. 2021, 23, 4484–4499. [Google Scholar] [CrossRef]
  2. Goparaju, L.; Prasad, P.R.C.; Ahmad, F. Geospatial technology perspectives for mining vis-a-vis sustainable forest ecosystems. Present Environ. Sustain. Dev. 2017, 11, 219–238. [Google Scholar] [CrossRef]
  3. Ranjan, A.K.; Parida, B.R.; Dash, J.; Gorai, A.K. Quantifying the impacts of opencast mining on vegetation dynamics over eastern India using the long-term Landsat-series satellite dataset. Ecol. Inf. 2022, 71, 101812. [Google Scholar] [CrossRef]
  4. Han, Y.; Ke, Y.; Zhu, L.; Feng, H.; Zhang, Q.; Sun, Z.; Zhu, L. Tracking vegetation degradation and recovery in multiple mining areas in Beijing, China, based on time-series Landsat imagery. GISci. Remote Sens. 2021, 58, 1477–1496. [Google Scholar] [CrossRef]
  5. Kuzevic, S.; Bobikova, D.; Kuzevicova, Z. Land Cover and Vegetation Coverage Changes in the Mining Area—A Case Study from Slovakia. Sustainability 2022, 14, 1180. [Google Scholar] [CrossRef]
  6. Atuchin, V.V.; Asyakina, L.K.; Serazetdinova, Y.R.; Frolova, A.S.; Velichkovich, N.S.; Prosekov, A.Y.J.M. Microorganisms for Bioremediation of Soils Contaminated with Heavy Metals. Microorganisms 2023, 11, 864. [Google Scholar] [CrossRef]
  7. Bruno Rocha Martins, W.; Douglas Roque Lima, M.; de Oliveira Barros Junior, U.; Sousa Villas-Boas Amorim, L.; de Assis Oliveira, F.; Schwartz, G. Ecological methods and indicators for recovering and monitoring ecosystems after mining: A global literature review. Ecol. Eng. 2020, 145, 105707. [Google Scholar] [CrossRef]
  8. Lechner, A.M.; Baumgartl, T.; Matthew, P.; Glenn, V. The impact of underground longwall mining on prime agricultural land: A review and research agenda. Land Degrad. Dev. 2016, 27, 1650–1663. [Google Scholar] [CrossRef]
  9. Li, Y.; Chiu, Y.-h.; Lin, T.-Y. Coal production efficiency and land destruction in China’s coal mining industry. Resour. Policy 2019, 63, 101449. [Google Scholar] [CrossRef]
  10. Lin, B.; Liu, J. Estimating coal production peak and trends of coal imports in China. Energy Policy 2010, 38, 512–519. [Google Scholar] [CrossRef]
  11. Teferi, E.; Uhlenbrook, S.; Bewket, W. Inter-annual and seasonal trends of vegetation condition in the Upper Blue Nile (Abay) Basin: Dual-scale time series analysis. Earth Syst. Dyn. 2015, 6, 617–636. [Google Scholar] [CrossRef]
  12. Metternicht, G.; Zinck, J.A.; Blanco, P.D.; del Valle, H.F. Remote sensing of land degradation: Experiences from Latin America and the Caribbean. J. Environ. Qual. 2010, 39, 42–61. [Google Scholar] [CrossRef] [PubMed]
  13. Yang, Y.; Erskine, P.D.; Lechner, A.M.; Mulligan, D.; Zhang, S.; Wang, Z. Detecting the dynamics of vegetation disturbance and recovery in surface mining area via Landsat imagery and LandTrendr algorithm. J. Clean. Prod. 2018, 178, 353–362. [Google Scholar] [CrossRef]
  14. Li, X.; Lei, S.; Cheng, W.; Liu, F.; Wang, W. Spatio-temporal dynamics of vegetation in Jungar Banner of China during 2000–2017. J. Arid Land 2019, 11, 837–854. [Google Scholar] [CrossRef]
  15. Guan, Y.; Wang, J.; Zhou, W.; Bai, Z.; Cao, Y. Identification of land reclamation stages based on succession characteristics of rehabilitated vegetation in the Pingshuo opencast coal mine. J. Environ. Manag. 2022, 305, 114352. [Google Scholar] [CrossRef] [PubMed]
  16. Xiao, W.; Deng, X.; He, T.; Guo, J. Using POI and time series Landsat data to identify and rebuilt surface mining, vegetation disturbance and land reclamation process based on Google Earth Engine. J. Environ. Manag. 2023, 327, 116920. [Google Scholar] [CrossRef]
  17. de Jong, R.; de Bruin, S.; de Wit, A.; Schaepman, M.E.; Dent, D.L. Analysis of monotonic greening and browning trends from global NDVI time-series. Remote Sens. Environ. 2011, 115, 692–702. [Google Scholar] [CrossRef]
  18. Song, W.; Song, W.; Gu, H.; Li, F. Progress in the Remote Sensing Monitoring of the Ecological Environment in Mining Areas. Int. J. Environ. Res. Public Health 2020, 17, 1846. [Google Scholar] [CrossRef]
  19. Hu, J.; Ye, B.; Bai, Z.; Hui, J. Comparison of the Vegetation Index of Reclamation Mining Areas Calculated by Multi-Source Remote Sensing Data. Land 2022, 11, 325. [Google Scholar] [CrossRef]
  20. Verbesselt, J.; Hyndman, R.; Newnham, G.; Culvenor, D. Detecting trend and seasonal changes in satellite image time series. Remote Sens. Environ. 2010, 114, 106–115. [Google Scholar] [CrossRef]
  21. Jamali, S.; Jönsson, P.; Eklundh, L.; Ardö, J.; Seaquist, J. Detecting changes in vegetation trends using time series segmentation. Remote Sens. Environ. 2015, 156, 182–195. [Google Scholar] [CrossRef]
  22. Zhu, Z.; Woodcock, C.E. Continuous change detection and classification of land cover using all available Landsat data. Remote Sens. Environ. 2014, 144, 152–171. [Google Scholar] [CrossRef]
  23. Brown, J.F.; Tollerud, H.J.; Barber, C.P.; Zhou, Q.; Dwyer, J.L.; Vogelmann, J.E.; Loveland, T.R.; Woodcock, C.E.; Stehman, S.V.; Zhu, Z. Lessons learned implementing an operational continuous United States national land change monitoring capability: The Land Change Monitoring, Assessment, and Projection (LCMAP) approach. Remote Sens. Environ. 2020, 238, 111356. [Google Scholar] [CrossRef]
  24. Huang, C.; Goward, S.N.; Masek, J.G.; Thomas, N.; Zhu, Z.; Vogelmann, J.E. An automated approach for reconstructing recent forest disturbance history using dense Landsat time series stacks. Remote Sens. Environ. 2010, 114, 183–198. [Google Scholar] [CrossRef]
  25. Kennedy, R.E.; Yang, Z.; Cohen, W.B. Detecting trends in forest disturbance and recovery using yearly Landsat time series: 1. LandTrendr—Temporal segmentation algorithms. Remote Sens. Environ. 2010, 114, 2897–2910. [Google Scholar] [CrossRef]
  26. Wang, H.; Xie, M.; Li, H.; Feng, Q.; Zhang, C.; Bai, Z. Monitoring ecosystem restoration of multiple surface coal mine sites in China via LANDSAT images using the Google Earth Engine. Land Degrad. Dev. 2021, 32, 2936–2950. [Google Scholar] [CrossRef]
  27. Xu, Y.; Guo, L.; Li, J.; Zhang, C.; Ran, W.; Hu, J.; Mao, H. Automatically identifying the vegetation destruction and restoration of various open-pit mines utilizing remotely sensed images: Auto-VDR. J. Clean. Prod. 2023, 414, 137490. [Google Scholar] [CrossRef]
  28. Qiu, D.; Liang, Y.; Shang, R.; Chen, J.M. Improving LandTrendr Forest Disturbance Mapping in China Using Multi-Season Observations and Multispectral Indices. Remote Sens. 2023, 15, 2381. [Google Scholar] [CrossRef]
  29. Li, M.; Zuo, S.; Su, Y.; Zheng, X.; Wang, W.; Chen, K.; Ren, Y. An Approach Integrating Multi-Source Data with LandTrendr Algorithm for Refining Forest Recovery Detection. Remote Sens. 2023, 15, 2667. [Google Scholar] [CrossRef]
  30. de Jong, S.M.; Shen, Y.; de Vries, J.; Bijnaar, G.; van Maanen, B.; Augustinus, P.; Verweij, P. Mapping mangrove dynamics and colonization patterns at the Suriname coast using historic satellite data and the LandTrendr algorithm. Int. J. Appl. Earth Obs. Geoinf. 2021, 97, 102293. [Google Scholar] [CrossRef]
  31. Fu, B.; Lan, F.; Xie, S.; Liu, M.; He, H.; Li, Y.; Liu, L.; Huang, L.; Fan, D.; Gao, E.; et al. Spatio-temporal coupling coordination analysis between marsh vegetation and hydrology change from 1985 to 2019 using LandTrendr algorithm and Google Earth Engine. Ecol. Indic. 2022, 137, 108763. [Google Scholar] [CrossRef]
  32. Mugiraneza, T.; Nascetti, A.; Ban, Y. Continuous monitoring of urban land cover change trajectories with landsat time series and landtrendr-google earth engine cloud computing. Remote Sens. 2020, 12, 2883. [Google Scholar] [CrossRef]
  33. Lothspeich, A.C.; Knight, J.F. The applicability of LandTrendr to surface water dynamics: A case study of Minnesota from 1984 to 2019 using Google Earth Engine. Remote Sens. 2022, 14, 2662. [Google Scholar] [CrossRef]
  34. Xiao, W.; Deng, X.; He, T.; Chen, W. Mapping annual land disturbance and reclamation in a surface coal mining region using google earth engine and the landtrendr algorithm: A case study of the shengli coalfield in Inner Mongolia, China. Remote Sens. 2020, 12, 1612. [Google Scholar] [CrossRef]
  35. Dlamini, L.Z.; Xulu, S. Monitoring mining disturbance and restoration over RBM site in South Africa using landtrendr algorithm and landsat data. Sustainability 2019, 11, 6916. [Google Scholar] [CrossRef]
  36. Huang, L.; Zhang, P.; Hu, Y.; Zhao, Y. Vegetation succession and soil infiltration characteristics under different aged refuse dumps at the Heidaigou opencast coal mine. Glob. Ecol. Conserv. 2015, 4, 255–263. [Google Scholar] [CrossRef]
  37. Wang, J.; Jiao, Z.; Bai, Z. Changes in carbon sink value based on RS and GIS in the Heidaigou opencast coal mine. Environ. Earth Sci. 2013, 71, 863–871. [Google Scholar] [CrossRef]
  38. Zhao, Y.; Wang, Y.; Zhang, Z.; Zhou, Y.; Huang, H.; Chang, M.-H. The Evolution of Landscape Patterns and Its Ecological Effects of Open-Pit Mining: A Case Study in the Heidaigou Mining Area, China. Int. J. Environ. Res. Public Health 2023, 20, 4394. [Google Scholar] [CrossRef]
  39. Wang, X.; Huang, F.; Cheng, Y. Computational performance optimization of support vector machine based on support vectors. Neurocomputing 2016, 211, 66–71. [Google Scholar] [CrossRef]
  40. Wang, M.; Wan, Y.; Ye, Z.; Lai, X. Remote sensing image classification based on the optimal support vector machine and modified binary coded ant colony optimization algorithm. Inf. Sci. 2017, 402, 50–68. [Google Scholar] [CrossRef]
  41. Lebrini, Y.; Boudhar, A.; Hadria, R.; Lionboui, H.; Elmansouri, L.; Arrach, R.; Ceccato, P.; Benabdelouahab, T. Identifying agricultural systems using SVM classification approach based on phenological metrics in a semi-arid region of Morocco. Earth Syst. Environ. 2019, 3, 277–288. [Google Scholar] [CrossRef]
  42. Shao, Y.; Lunetta, R.S. Comparison of support vector machine, neural network, and CART algorithms for the land-cover classification using limited training data points. ISPRS J. Photogramm. Remote Sens. 2012, 70, 78–87. [Google Scholar] [CrossRef]
  43. Liu, X.; Gao, C.; Li, P. A comparative analysis of support vector machines and extreme learning machines. Neural Netw. 2012, 33, 58–66. [Google Scholar] [CrossRef]
  44. Mountrakis, G.; Im, J.; Ogole, C. Support vector machines in remote sensing: A review. ISPRS J. Photogramm. Remote Sens. 2011, 66, 247–259. [Google Scholar] [CrossRef]
  45. Xiao, W.; Chen, W.; Deng, X. Coupling and coordination of coal mining intensity and social-ecological resilience in China. Ecol. Indic. 2021, 131, 108167. [Google Scholar] [CrossRef]
  46. Zhang, M.; Wang, J.; Feng, Y. Temporal and spatial change of land use in a large-scale opencast coal mine area: A complex network approach. Land Use Policy 2019, 86, 375–386. [Google Scholar] [CrossRef]
  47. Li, S.; Wang, J.; Zhang, M.; Tang, Q. Characterizing and attributing the vegetation coverage changes in North Shanxi coal base of China from 1987 to 2020. Resour. Policy 2021, 74, 102331. [Google Scholar] [CrossRef]
  48. Hu, Z. The 30 years’ land reclamation and ecological restoration in China: Review, rethinking and prospect. Coal Sci. Technol. 2019, 47, 25–35. [Google Scholar] [CrossRef]
  49. Lovich, J.E.; Bainbridge, D. Anthropogenic degradation of the southern California desert ecosystem and prospects for natural recovery and restoration. Environ. Manag. 1999, 24, 309–326. [Google Scholar] [CrossRef]
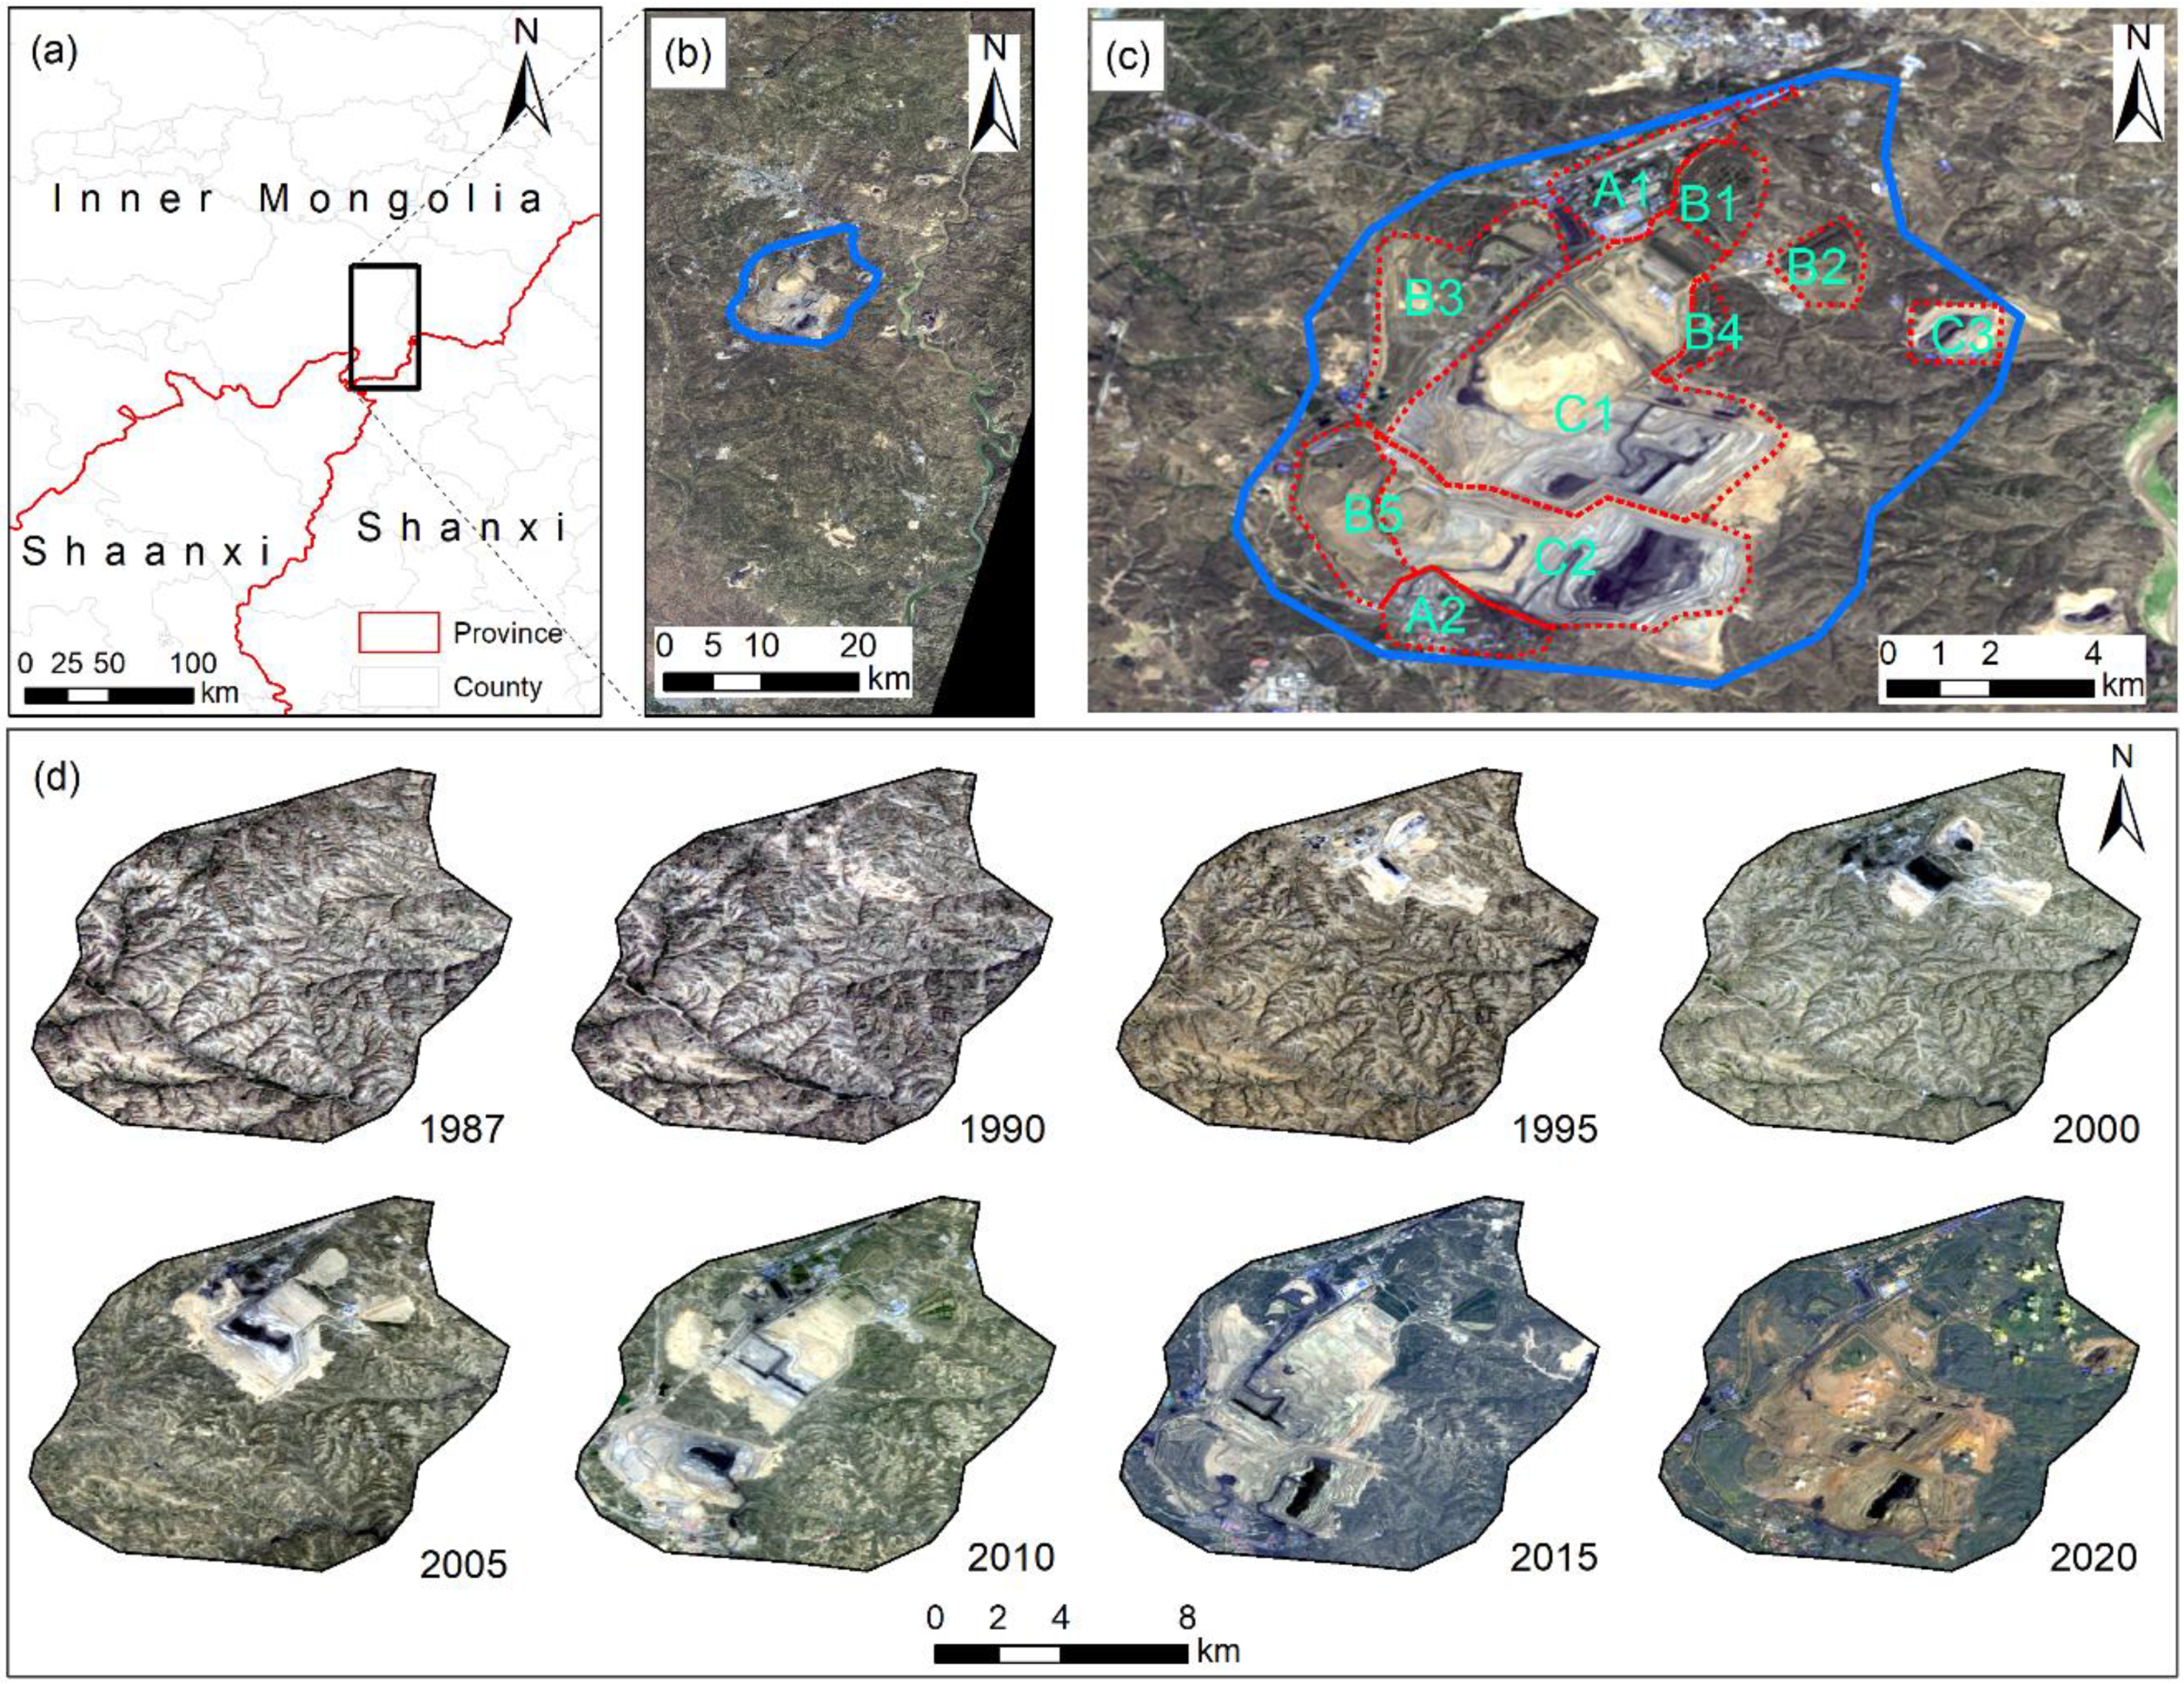
Figure 1. Location of the study area. (a) Location of Jungar open-pit mine; (b) remote sensing imagery of the Jungar open-pit mine in 2021 and location of H-HOCMs (blue line); (c) remote sensing imagery of the H-HOCMs in 2021. A, mine construction area (A1, Heidaigou; A2, Haerwusu); B, external waste dump (B1, Heidaigou North dump; B2, Heidaigou East dump; B3, Heidaigou Yinwan dump; B4, Dongyanbang dump; B5, Haerwusu dump); C, mining pits (former or current) (C1, Heidaigou pit; C2, Haerwusu pit; C3, Cuiergeju pit); (d) Landsat true color composite images for the study area in different years from 1987 to 2020.
Remotesensing 15 05667 g001
Figure 2. The flow diagram of the methodology.
Remotesensing 15 05667 g002
Figure 3. Vegetation change trajectory model.
Remotesensing 15 05667 g003
Figure 4. Vegetation change trajectory in the studied region 1987–2020: (a) Theoretical schematic curves; (b) NDVI curves from samples (The gray area is the range between the maximum and minimum values from all sample points of different vegetation change trajectories. The black line is the average curve for each type.).
Remotesensing 15 05667 g004
Figure 5. Map of validation points.
Remotesensing 15 05667 g005
Figure 6. Years of disturbance and restoration occurrence: (a) year of disturbance occurrence; (b) year of restoration occurrence; (c) percentage of disturbance and restoration and CDRR for each year.
Remotesensing 15 05667 g006
Figure 7. Distribution of (a) the maximum disturbance and (b) restoration magnitudes.
Remotesensing 15 05667 g007
Figure 8. Duration of (a) disturbance and (b) restoration.
Remotesensing 15 05667 g008
Figure 9. Changing patterns of ecological disturbance and restoration in the studied region 1987–2020 (a) spatial distribution of changing patterns; (b) statistics of area proportion; (c) NDVI anomaly of mine construction area; (d) NDVI anomaly of outer dumps; (e) NDVI anomaly of mining pits.
Remotesensing 15 05667 g009
Table 1. Precision evaluation of the occurrence of disturbance and restoration events.
Disturbance EventsRestoration Events
OccurrencePA (%)UA (%)OccurrencePA (%)UA (%)
1989100.00100.001993100.00100.00
1990100.00100.001996100.00100.00
1991100.00100.002000100.0080.00
1999100.0088.242002100.00100.00
2003100.00100.002003100.00100.00
2004100.00100.00200475.0075.00
2005100.00100.00200580.0080.00
2006100.00100.002007100.00100.00
200792.59100.00200885.71100.00
2008100.00100.00200966.67100.00
200966.67100.00201084.62100.00
201033.33100.002011100.00100.00
2011100.00100.00201280.7097.87
201333.33100.00201380.0092.31
201475.00100.002014100.00100.00
2015100.0085.712016100.00100.00
2017100.00100.002020100.00100.00
2018100.00100.00No-event50.0015.38
201991.67100.00
202084.62100.00
No-event48.3965.22
OA83.00% 84.50%
Kappa0.82 0.82
Disclaimer/Publisher’s Note: The statements, opinions and data contained in all publications are solely those of the individual author(s) and contributor(s) and not of MDPI and/or the editor(s). MDPI and/or the editor(s) disclaim responsibility for any injury to people or property resulting from any ideas, methods, instructions or products referred to in the content.