Abstract
Constructing and optimising ecological networks in high-density cities plays an important role in mitigating urban ecological problems. Our study uses comprehensive evaluation methods such as Morphological Spatial Pattern Analysis (MSPA), the Remote Sensing Ecological Index (RSEI), and Connectivity to identify ecological source areas in Fuzhou City, and constructs and optimises the network using the Minimum Cumulative Resistance (MCR) model, current theory, and other methods. Meanwhile, the changes in urban landscape connectivity under different development scenarios were explored. The results show that the following: (1) the identification of ecological source sites based on the integrated approach is better than the single MSPA method; (2) the ecological network of Fuzhou City consists of 44 ecological source sites and 92 corridors; and (3) among the various development modes, transforming the top 30% of the bare land patches in Fuzhou City into green spaces improves the overall connectivity of the ecological network the most. The results can provide auxiliary decision-making for ecological construction in high-density cities.
1. Introduction
Since China’s reform and opening up, rapid economic and population growth has led to accelerated urbanisation [1], with China’s urbanisation rate increasing from 17.9% in 1978 to 63.9% in 2020 [2], and the population of cities reaching 90,199,000,000 [3]. The rapid and massive urbanisation has caused China to face not only public service problems such as traffic congestion and strained medical facilities, but also ecological and environmental problems such as landscape fragmentation, environmental pollution, and declining ecosystem service functions [4,5,6]. Research shows that habitat fragmentation is one of the most important threats to urban biodiversity [7]. As a linear landscape element, the urban ecological network not only helps to promote material exchange between patches, but also has a significant role in enhancing land value and optimising the urban ecological environment [8,9]. However, cities have typical features such as large human interference and complex land cover, making urban ecological patches more fragmented and with larger landscape resistance values, causing many difficulties for the construction of urban ecological networks [10,11]. Therefore, as the main spatial place for human survival and development now and in the future, combining urban ecological networks with ecological planning in the process of urban development and renewal, through building and optimising urban ecological networks on limited land resources, is of practical significance to enhance the sustainable development of cities.
Because of the late and rapid urbanisation process in China, the environmental problems brought about by this process are prominent [12], and therefore more studies have focused on the city as the boundary. For example, Wuhan [13,14], Beijing [15,16], Shanghai [11,17], and Shenzhen [18,19] are cities in China. The urban ecological network is mainly used as a means of ecological planning, so as to improve the urban ecological environment and maintain the sustainable development of the city. However, different countries and regions have different emphases on the definition of ecological networks. For example, in Europe, ecologists mainly consider ecological networks from the perspective of biological conservation as the main way to protect and improve habitat connectivity and facilitate the movement of species between habitat patches [20]. And in North America, ecological networks can also be called greenways. Its connotation includes not only the principles of landscape ecology (patch–corridor), but also the concepts of landscape planning, principles of landscape architecture, and theories of conservation biology. This emphasises that greenways are corridors of different widths, connected together in a network [8]. In addition, in the book Greenways for America [21], ecological networks are defined as open spaces connecting parks, nature reserves, cultural landscapes, or historic sites and their communities, which shows that North America pays more attention to the comprehensive functioning of ecological networks. In conclusion, although the definitions of ecological networks have different emphases, they all emphasise the holistic nature, connectivity, and ecological service function of ecological networks [22].
Currently, urban ecological networks have produced fruitful research results and mature technical methods. The modelling framework of “source-resistance-network” has been developed [23,24,25]. The framework first identifies the ecological source sites where species may spread, then constructs a multi-factor integrated resistance surface based on the difficulty of species dispersal, then extracts the linear corridors between patches based on the influence of resistance, and finally forms a network. Therefore, the establishment of a scientific and reasonable evaluation system and the selection of appropriate resistance factors are the key to screening ecological source sites and constructing resistance surfaces [26]. This directly affects the accuracy of ecological network extraction [17]. Urban ecological source areas are defined as prioritised areas with good ecological environments that are capable of providing various ecosystem services. Currently, they are mainly identified in three ways: (1) based on past experience, selecting nature reserves, national forest parks, or natural scenic areas, etc. [9,27], (2) structurally assessed ecological source sites using Morphological Spatial Pattern Analysis (MSPA) to extract ecologically significant landscape types from land use type maps [28], and (3) ecological sensitivity and ecosystem service assessment. By quantifying the functions of different ecosystem services, such as carbon storage, habitat quality, food supply, recreational tourism, etc., it makes up for the shortcomings of the structural evaluation of MSPA from the perspective of functions [29,30,31]. The establishment of landscape resistance surfaces is likewise a critical step in measuring the magnitude of spatial barriers that need to be overcome for migration and movement between target patches [32]. In the related research, the landscape resistance mainly comes from the local interference of anthropogenic activities, topography and geomorphology, and the natural environment. For example, land use type, night lighting index, slope, vegetation cover, etc. The weight of each landscape resistance is determined by assigning values and scoring, etc., and the raster weighting is superimposed. Finally, the minimum cumulative resistance (MCR) model and circuit theory (circuitscape) are often used in the construction of ecological networks. MCR can determine an optimal pathway [33] and circuit theory can not only model the direction of biological flows, but also identify critical locations in the network based on current density [34]. They are two approaches to identifying corridors, and thus the two models complement rather than replace each other in simulation studies of landscape connectivity [35].
Although some progress has been made about the construction and optimisation of urban ecological networks in recent years, there are still some shortcomings. Considering the complexity of urban landscapes, a single evaluation method is no longer capable of accurately identifying ecological source areas. For example, MSPA can quantitatively analyse the landscapes of different land classes in terms of structure. Combined with ecosystem service evaluation, further screening from the perspective of function is currently a major method of source extraction. However, the ecosystem service functions of different regions are different, and the weights of each functional indicator are difficult to determine, which has caused great confusion in the extraction of ecological source areas. The Remote Sensing Ecological Index (RSEI), proposed by Xu et al. [36], is based on the Pressure-State-Response (PSR) framework and utilises Principal Component Analysis (PCA) to evaluate the ecological environment in general by calculating four metrics (greenness, humidity, heat, and dryness) representing climatic and terrestrial biophysical variables. Therefore, variations or errors in the definition of weights due to individual characteristics can be avoided in the extraction process of source sites [37]. Second, in terms of the construction of resistance surfaces, most of the studies are keen to utilise the nighttime lighting index for the correction of the composite resistance surface [38,39]. This is a good method to be able to distinguish between different resistance values for the same land class, but it is more difficult to be applied in urban centres due to the limitation of light data resolution. In addition, land use resources within the city limits are very tight, and existing studies often ignore the corridors that already exist, such as green belts, forest belts, and street-side green spaces [40,41]. They are used as an important carrier for building ecological networks in central urban areas, but often extracting this information requires images with sufficiently high resolution. The Green View Index (GVI), on the other hand, provides an alternative way of extracting street greening information from a human perspective by extracting the percentage of green pixels in street view images [42,43]. With the development of big data in recent years, streetscape data provides new perspectives and effective tools for assessing road greening at the urban scale [44,45,46]. At the same time, the rational use of a small amount of unused land in the city to carry out a certain degree of green enhancement and transformation will play an important role in improving the ecological environment and landscape connectivity of the city [47].
2. Materials and Methods
2.1. Work Flow
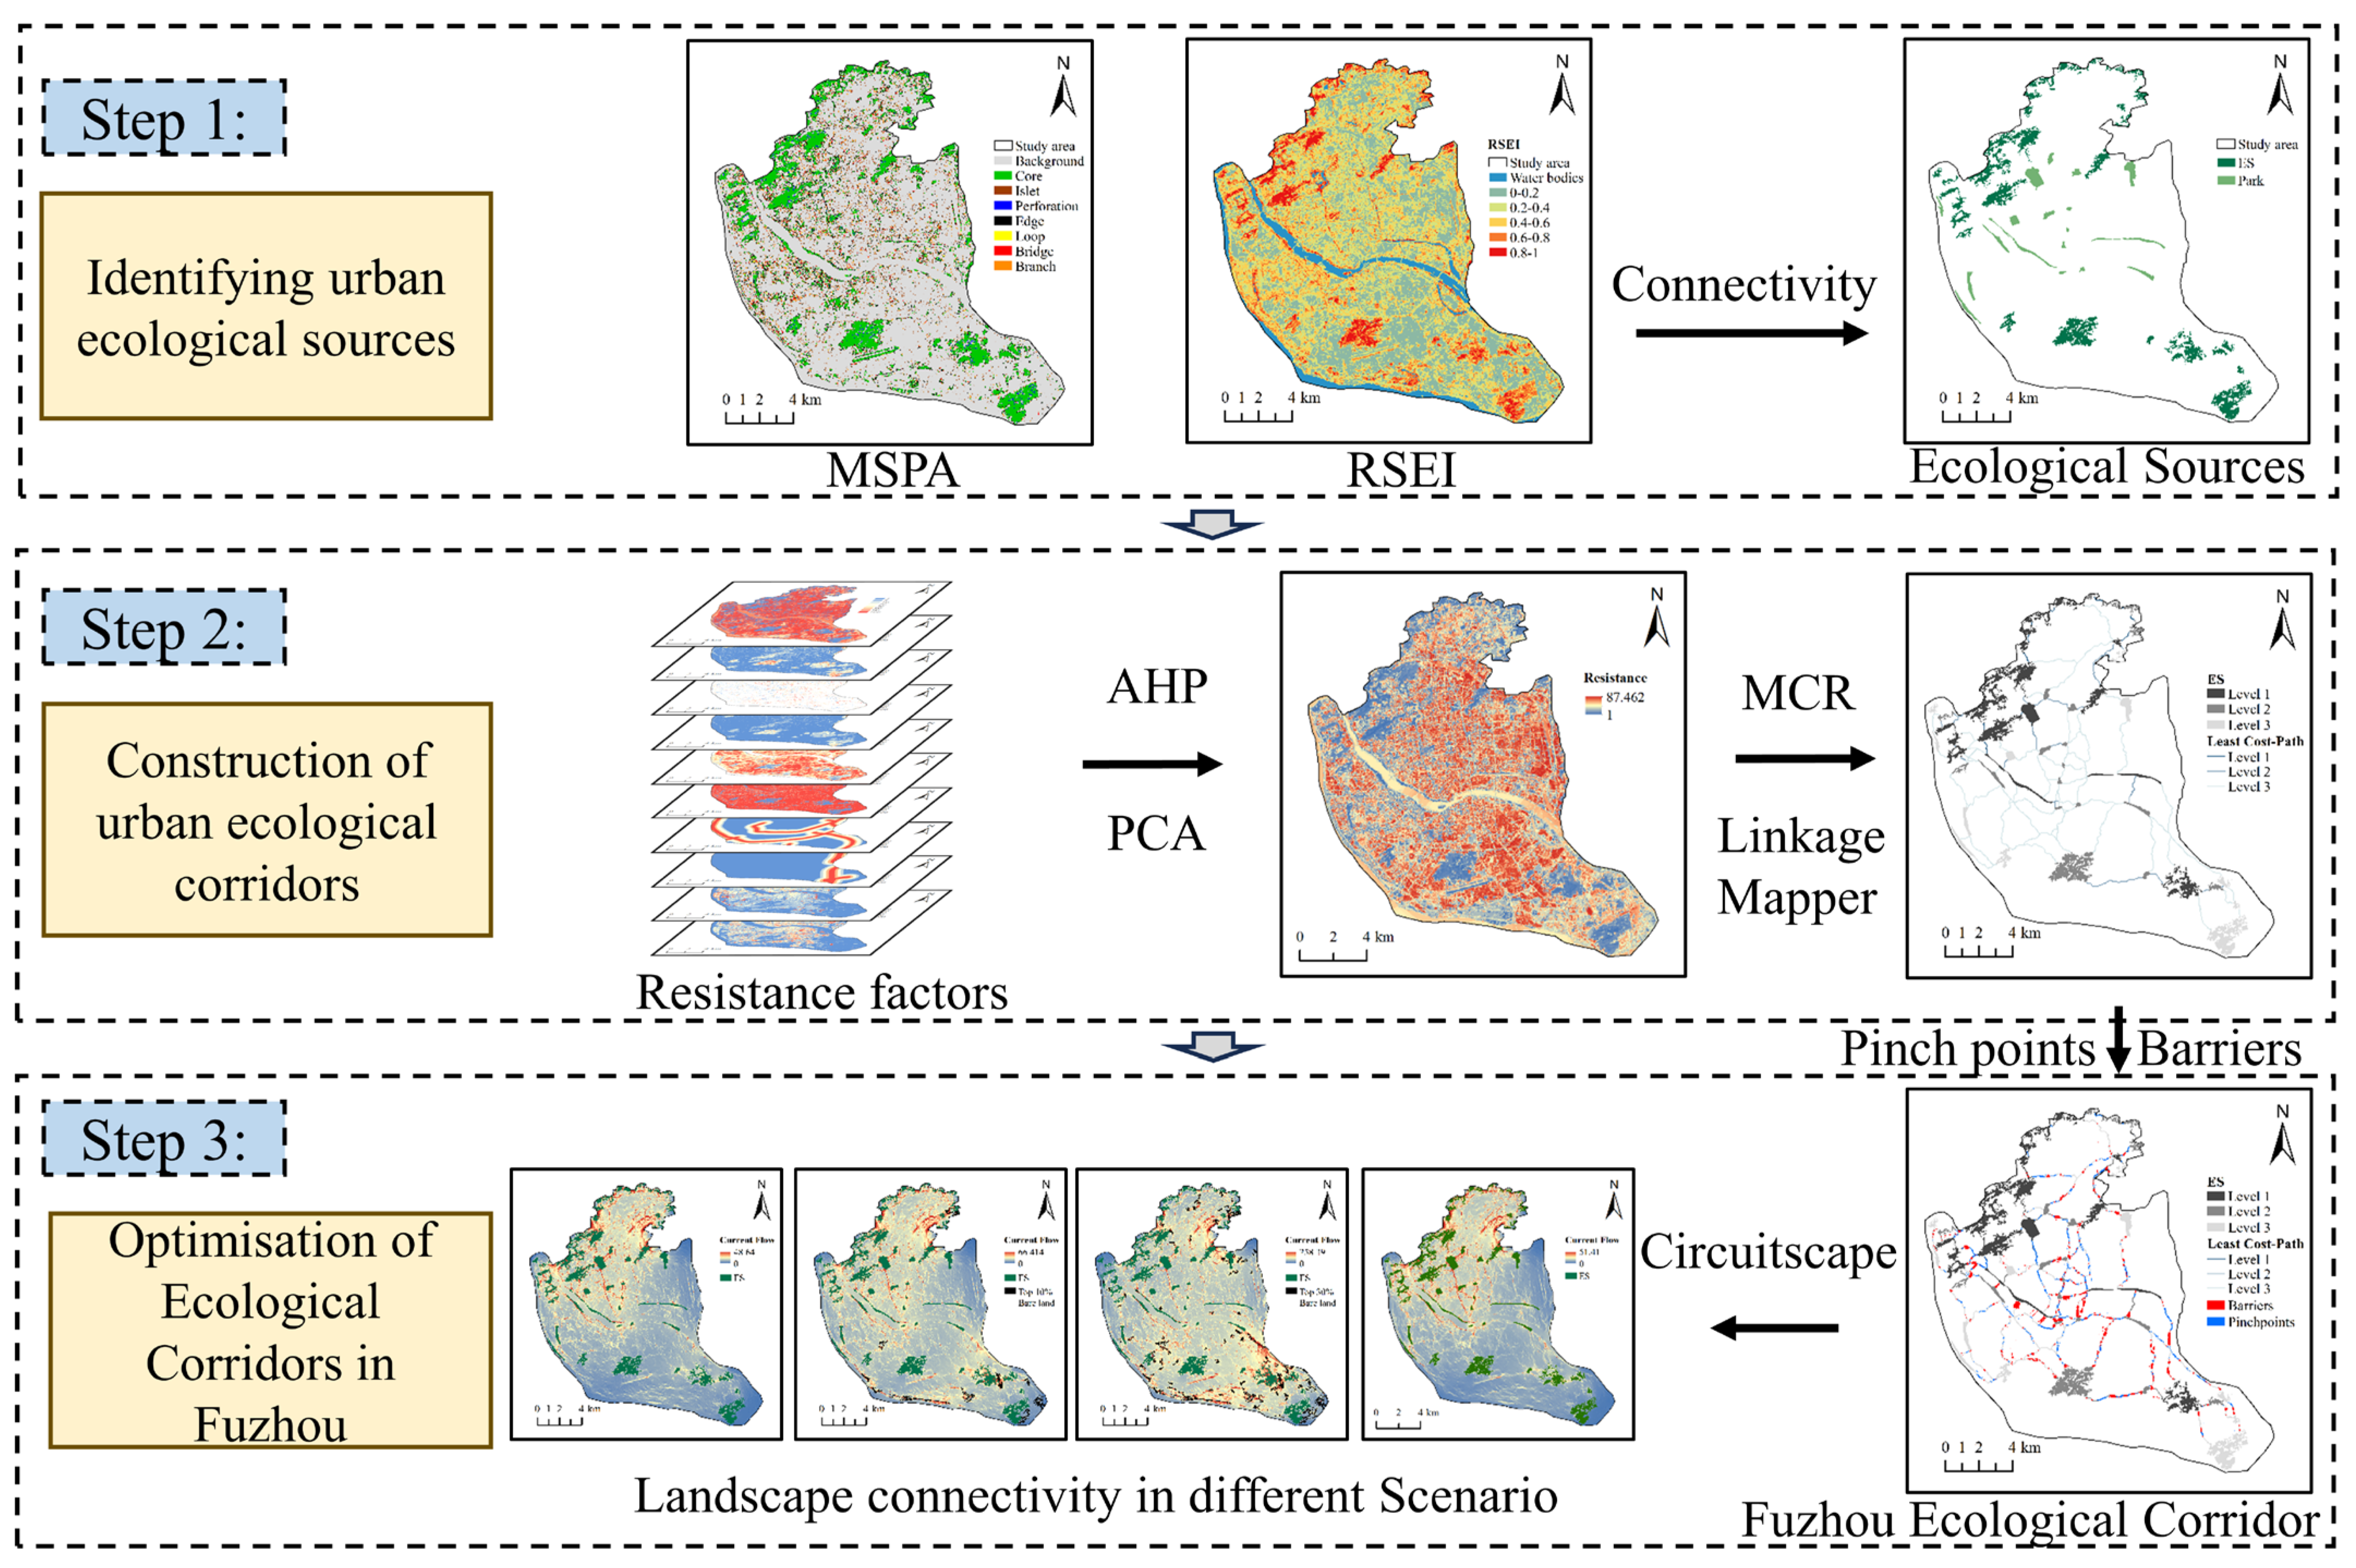
We chose the main urban area of Fuzhou City in southeastern China as the study area, and the flow of the study was as follows: (1) Define the urban ecological source and extract the urban ecological source by using the integrated method of the MSPA-RSEI-connectivity index. (2) Based on the reality of high-density cities, combined with the results of (1), we chose the GVI, which represents the greening level of the streets and the density of the buildings per unit area with height and other resistance factors to construct the landscape resistance surface of Fuzhou City. (3) Establish the ecological network of Fuzhou City based on the MCR model. (4) Use the circuit theory for the determination of ecological network priorities and the identification of ecological pinch points and barrier points. (5) Discuss the changes in the overall landscape connectivity of Fuzhou City under different development modes. Please see Figure 1 for the details of the process.
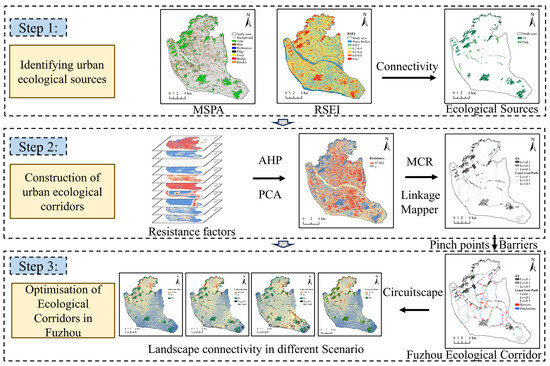
Figure 1.
Flow chart.
2.2. Study Area
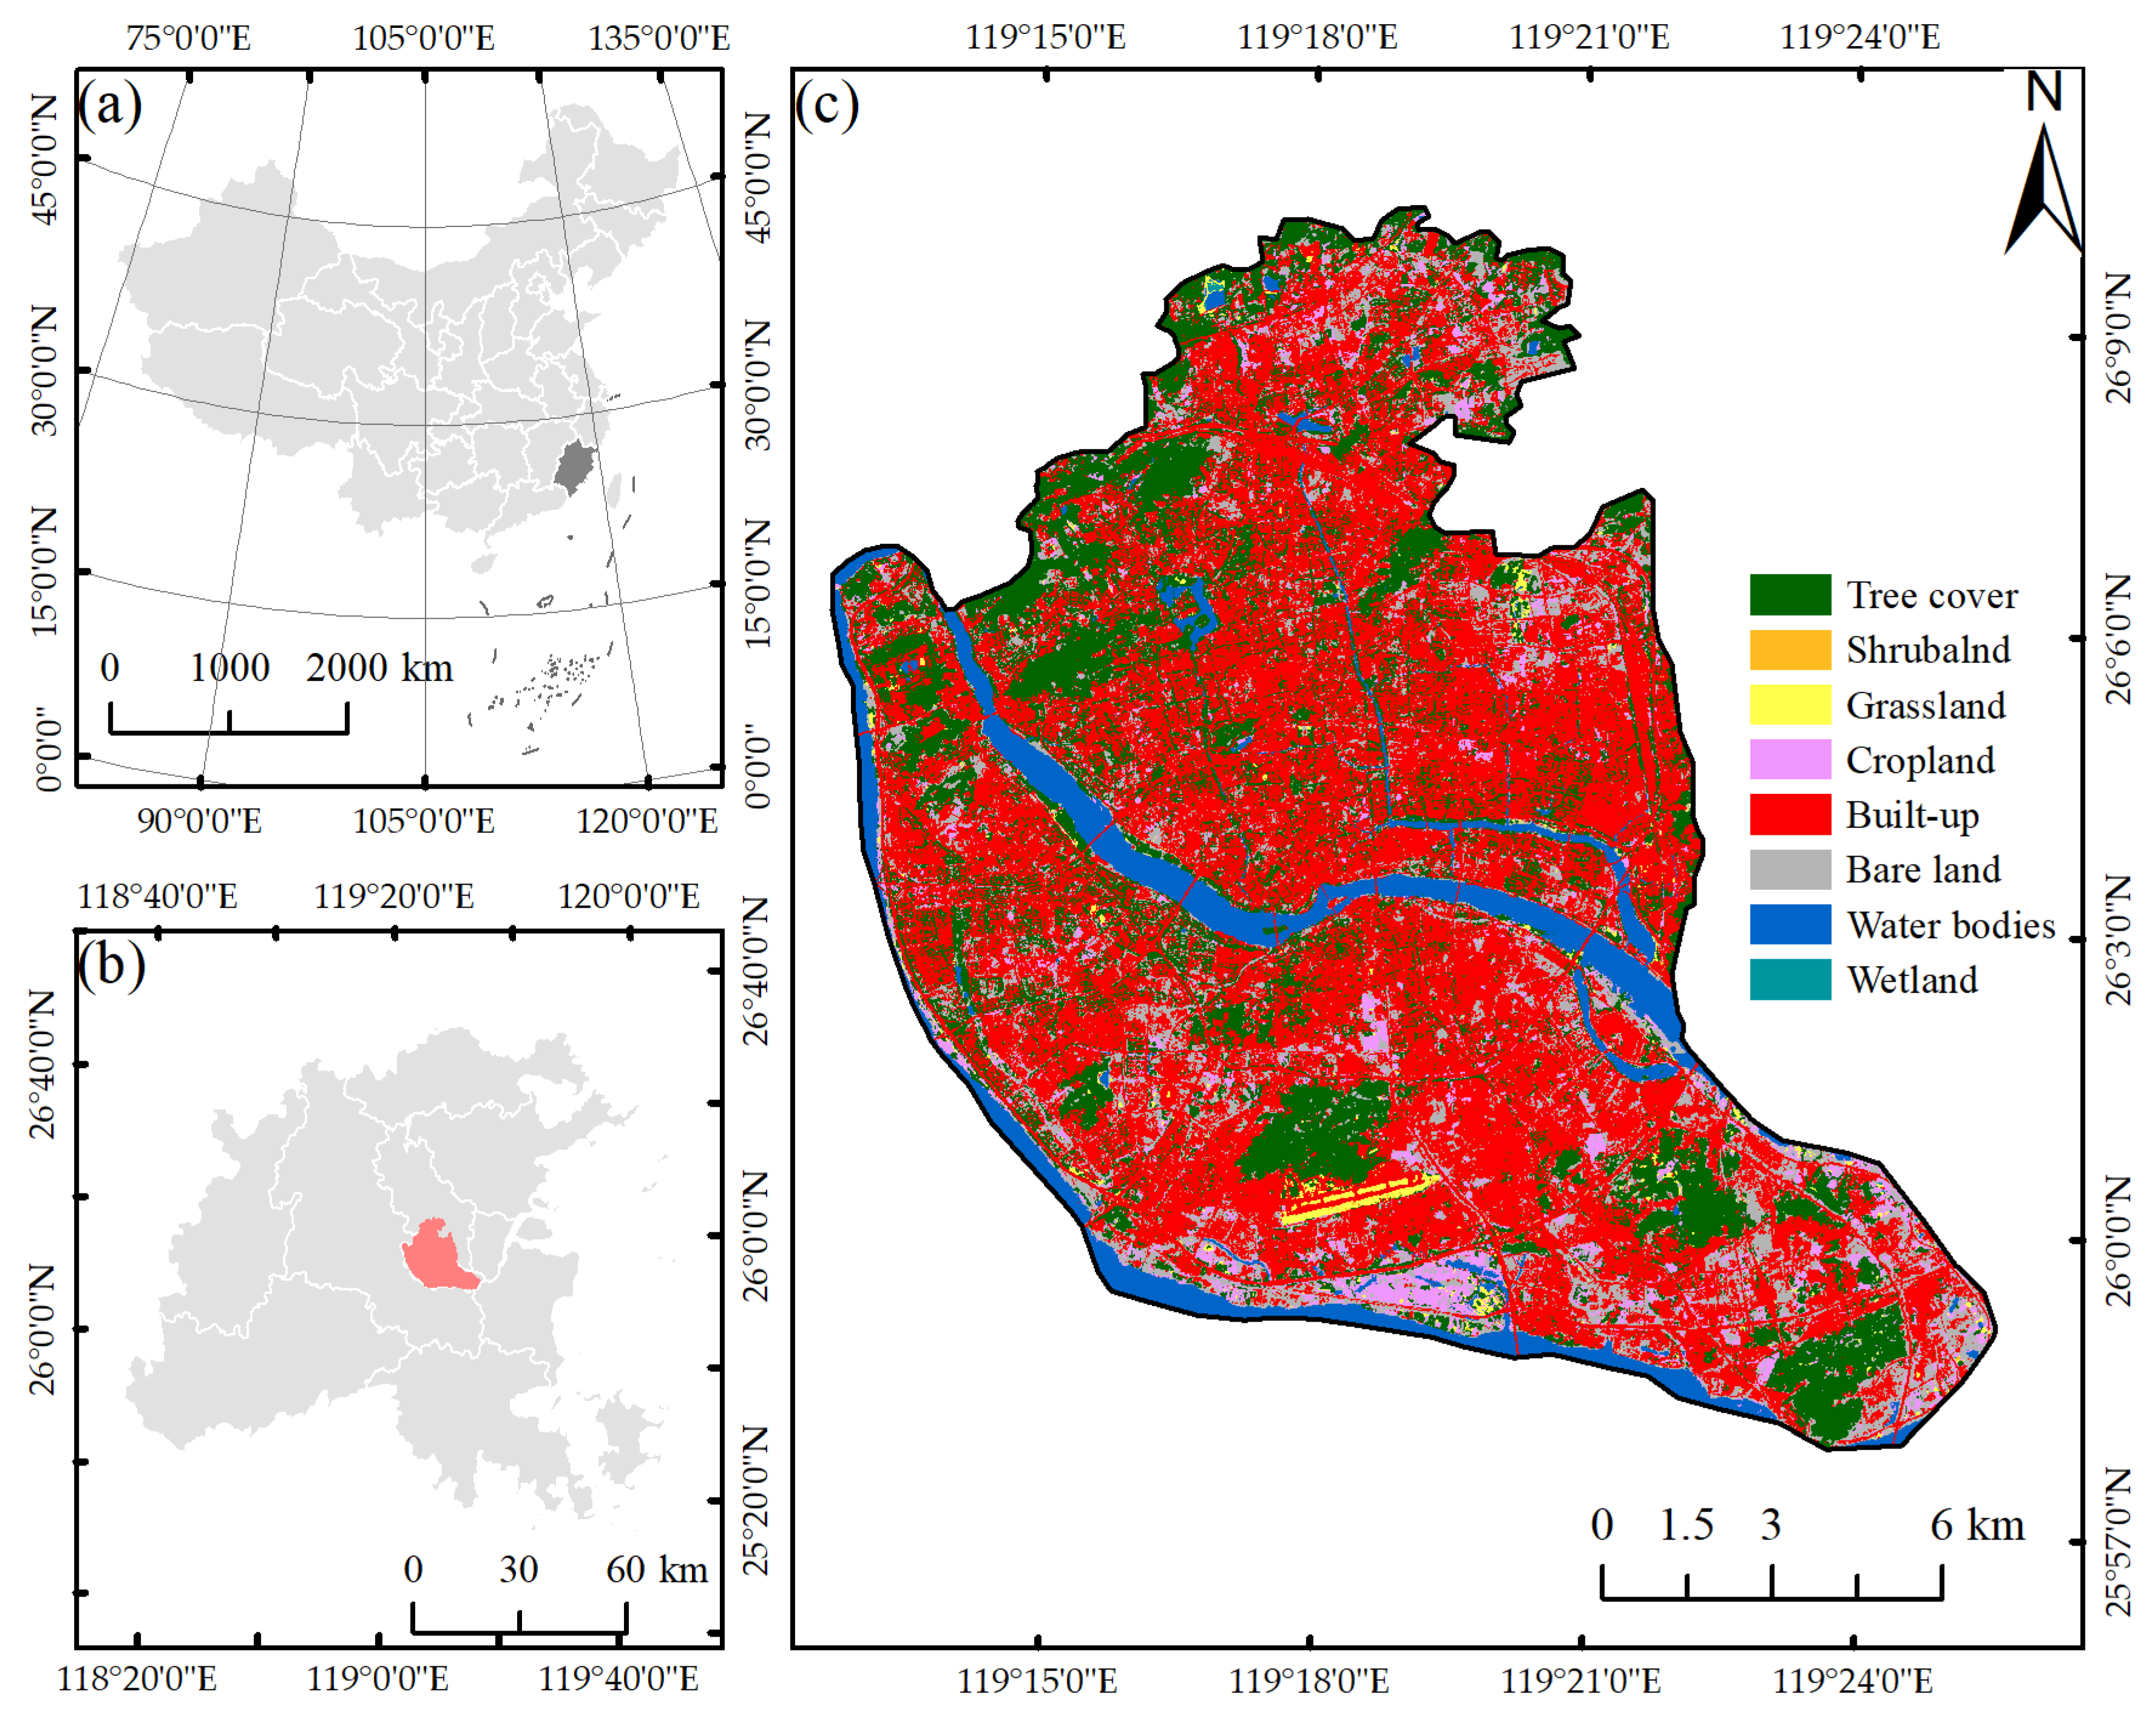
Fuzhou is located in the eastern part of Fujian Province, the lower reaches of the Minjiang River, and the coastal area (25°15′–26°39′N, 118°08′–120°31′E), with an average annual temperature of 20~25 °C and an average annual precipitation of 900~2100 mm, which is a typical subtropical monsoon climate. As an important city in the southeastern region of China, Fuzhou city centre (Figure 2c) covers an area of about 246.64 km2, with a relatively flat topography, and is rich in blue and green natural resources. It is also one of the most intensive construction land areas in Fujian Province with the most significant heat island effect [48,49]. Relevant studies have shown that the ecological quality of the study area has declined sharply in recent years, and the green space resources have decreased sharply. The study area has been a major source of green space resources in recent years [36,50]. Therefore, it is of practical significance to identify and construct urban ecological corridors in Fuzhou city centre as the study area.
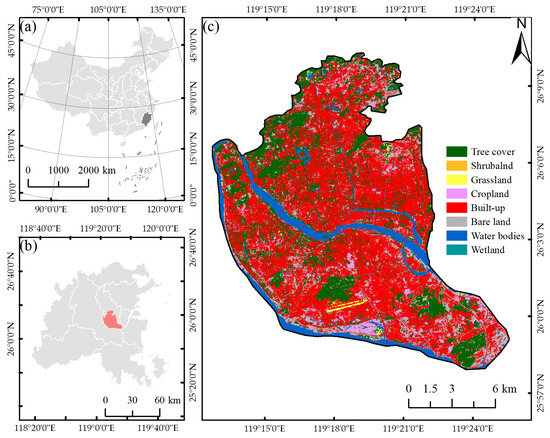
Figure 2.
Location of the study area: (a) Fujian Province; (b) Fuzhou City; (c) land use types in Fuzhou city centre.
2.3. Data Sources and Pre-Processing
Land use data from the European Space Agency’s WorldCover dataset [51] was used, where the spatial resolution is 10 m. A total of eight land use types were extracted from the study area, namely woodland, shrubland, grassland, cropland, built-up land, bare land, water bodies, and wetland. The ecological remote sensing index data were collected and processed through the Google Earth Engine (GEE) platform with LandsatOLI/TIRS imagery provided by the United States Geological Survey (USGS) (https://www.usgs.gov, accessed on 22 August 2023), with a spatial resolution of 30 m. In order to accurately assess the ecological quality of the study area, our study selected a total of 17 periods of remote sensing imagery from the above dataset during the season of better vegetation growth from April to October 2020 and synthesised them using the median method [52]. At the same time, to avoid the influence of large water areas on RSEI calculations, the water bodies in the study area were masked using the Normalised Difference Water Index (NDWI) [53].
Elevation data of the study area were obtained from the Distributed Activity Archive of the Alaska Satellite Facility, USA (https://asf.alaska.edu/, accessed on 22 August 2023) with a spatial resolution of 12.5 m, which was used to calculate the degree of topographic relief and slope factor. While its sensors can penetrate vegetation, they cannot penetrate buildings. Therefore, we subtracted the building height data from the elevation data in order to obtain the true terrain data. The topographic data were used to construct one of the resistance factors affecting the corridor. The road data in the study area were downloaded from OpenStreetMap, and the building distribution vector map and street view images were obtained from the Baidu map service platform (https://lbsyun.baidu.com/, accessed on 22 August 2023). The building vector data include the area and height information of the buildings, which is mainly used to calculate the average height and density of the buildings in the unit area and as one of the resistance factors affecting the construction of ecological corridors, while the streetscape data were crawled by collecting the coordinates of sample points on the road network (at 50 m intervals) and semantic image segmentation was performed by the full convolutional neural network FCN-8s to extract the GVI of the streets. All the final raster images were unified at 30 m resolution and projected to the WGS_1984_UTM_Zone_50N coordinate system.
2.4. Methods
Considering the basic connotation of highly urban ecological networks, this study uses Morphological Spatial Pattern Analysis (MSPA), the Remote Sensing Ecological Index (RSEI), and the Connectivity index and combines them with urban parks and green spaces to screen ecological source sites from three perspectives of structure–function–connectivity. Based on the least cumulative resistance model, the landscape resistance surface was constructed under the influence of 10 resistance factors, including land use type, landscape type of MSPA, Remote Sensing Ecological Index (RSEI), Green View Index (GVI), building density, building height, terrain undulation, slope, distance from railway, distance from highway, and the weight value of each factor was calculated using the integrated weight calculation method of AHP-PCA. Finally, Linkage Mapper (version 3.1) and Circuitscape were used to construct and optimise the high-density urban ecological network and to explore the changes in landscape connectivity under different urban development scenarios.
2.4.1. Morphological Spatial Pattern Analysis
MSPA is an image processing method based on the principles of mathematical morphology and spatial patterns of raster images by binarising ecologically valuable land classes (foreground) and other land classes (background) in land use data, and then classifying the foreground area into seven landscape types: Core, Islet, Perforation, Edge, Loop, Bridge, and Branch [54,55]. In our study, we used woodland, shrubland, grassland, and wetland in the study area as foreground data and other land types as background data, which were analysed by Guidos analysis software v2.8 using the 8-domain method with the edge width set to 1, i.e., 10 m, and extracted Core with greater ecological value.
2.4.2. Remote Sensing Ecological Index
In this study, the RSEI was used to carry out the overall evaluation of the ecological environment quality in Fuzhou City in 2020, and the four indicators involved in RSEI were greenness, humidity, heat, and dryness. The formulas are as follows:
where Greenness represents the Normalised Difference Vegetation Index (NDVI), Wetness represents Moisture (WET), Heat represents the Land Surface Temperature (LST), and Dryness represents the Dryness Index (NDBSI), which is a combination of the Index of Buildings (IBI) and the Soil Index (SI). For the formulae and meanings of the indicators, please see Appendix A.
The above metrics are coupled by Principal Component Analysis (PCA), and the first principal component (PCA1) is used to construct the RSEI, because the first principal component usually explains more than 80% of the total variation in the dataset and avoids bias of the results due to the subjective setting of the weights in the calculation process. Please refer to the relevant literature for the specific formulae of each indicator [52,56].
2.4.3. Identifying Urban Ecological Sources
Due to the complexity of the urban landscape, the selection of ecological source patches should firstly ensure that they have a good ecological environment with sufficient area, and secondly, their connectivity should also be considered. At the same time, some important semi-natural spaces in the city, such as urban parks and waterfront green spaces, can not only provide recreational functions, but also provide certain ecological values, such as mitigating heat islands and promoting biodiversity [57,58,59]. Therefore, the selection of ecological source patches should include some urban parks in addition to the comprehensive consideration of structure–function–connectivity. Secondly, too centralised distribution of ecological source patches will also lead to a reduction in the ecological benefits of the ecological network. Therefore, after many instances of screening and referring to previous research results, we first extracted the core area in the MSPA results and the patches larger than 0.8 in the RSEI results, and after intersecting them, we used the Conefor software v2.2 to conduct the connectivity analysis, with the connectivity distance threshold and the connectivity probability set to 1000 m and 0.5 m, respectively [60,61]. Finally, the patches with areas greater than 0.1 km2 and dPC greater than 0.2 were selected as natural ecological source sites, while the duplicated extracts were deleted. In addition, the ecological and social functions of parks have led to a layout that includes not only woodlands with ecological value, but also some open spaces such as squares. However, the mean RSEI value is slightly lower than that of natural ecological sources due to the influence of square spaces and garden buildings. For this reason, the study selected urban parks with RSEI values greater than 0.6 as semi-natural ecological sources, and together they form the ecological sources in downtown Fuzhou.
2.4.4. Construction of Resistance Surfaces
The spatial dispersal and migration of ecological material is conducive to increasing biodiversity and plays an important role in maintaining ecosystem stability. However, the flow of energy is affected by landscape resistance [26]. Therefore, selecting appropriate resistance factors to construct the resistance surface is one of the keys to extract the ecological network. The complexity and fragmentation of the urban area landscape is higher, which makes its spatial resistance is often greater than that of nature reserves and scenic areas. Therefore, in the selection of factors, our study extracted ten resistance factors including land use type, MSPA landscape type, Remote Sensing Ecological Index (RSEI), GVI, building density, building height, terrain undulation, slope, distance from railroad, and distance from highway. Among them, land use type and MSPA landscape type are used as the status quo of the spatial distribution of ecological resources in the study area, and banded ecological land such as forest land, grassland, banded parks, and bridging areas in the MSPA landscape type provide an important carrier for the construction of ecological corridors [11,61]. The RSEI as a parameter for quantitative assessment of regional ecological environment quality, should be attached to regions with better ecological environment quality as much as possible in the construction of ecological corridors [36,62]. As an important indicator for assessing the level of street greening from a human perspective, the greening rate can well quantify the degree of road greening [45] and can quantify the impervious surface with high ecological value in the land category of construction land [63,64]. As human interference factors, such as building height, building density, and distance from high speeds, they have a certain negative impact on the stability of the ecological corridor function, i.e., the higher the building density and the higher the building height, the larger the area of impervious surface, which is more unfavourable to the construction of ecological corridors [19]. Highways and railroads, as major transportation routes for daily commuting of urban residents, also pose a certain degree of mortality risk to the migration and movement of species [13,65]. The degree of terrain undulation and slope, as topographic factors, will directly affect the growth of vegetation and the difficulty of building ecological corridors. Finally, the AHP and PCA methods were utilised to determine the weights of each factor in order to construct a comprehensive resistance surface. The specific grading method is shown in Table 1 [13,14,15,16,17,18,19].

Table 1.
Resistance values and weights.
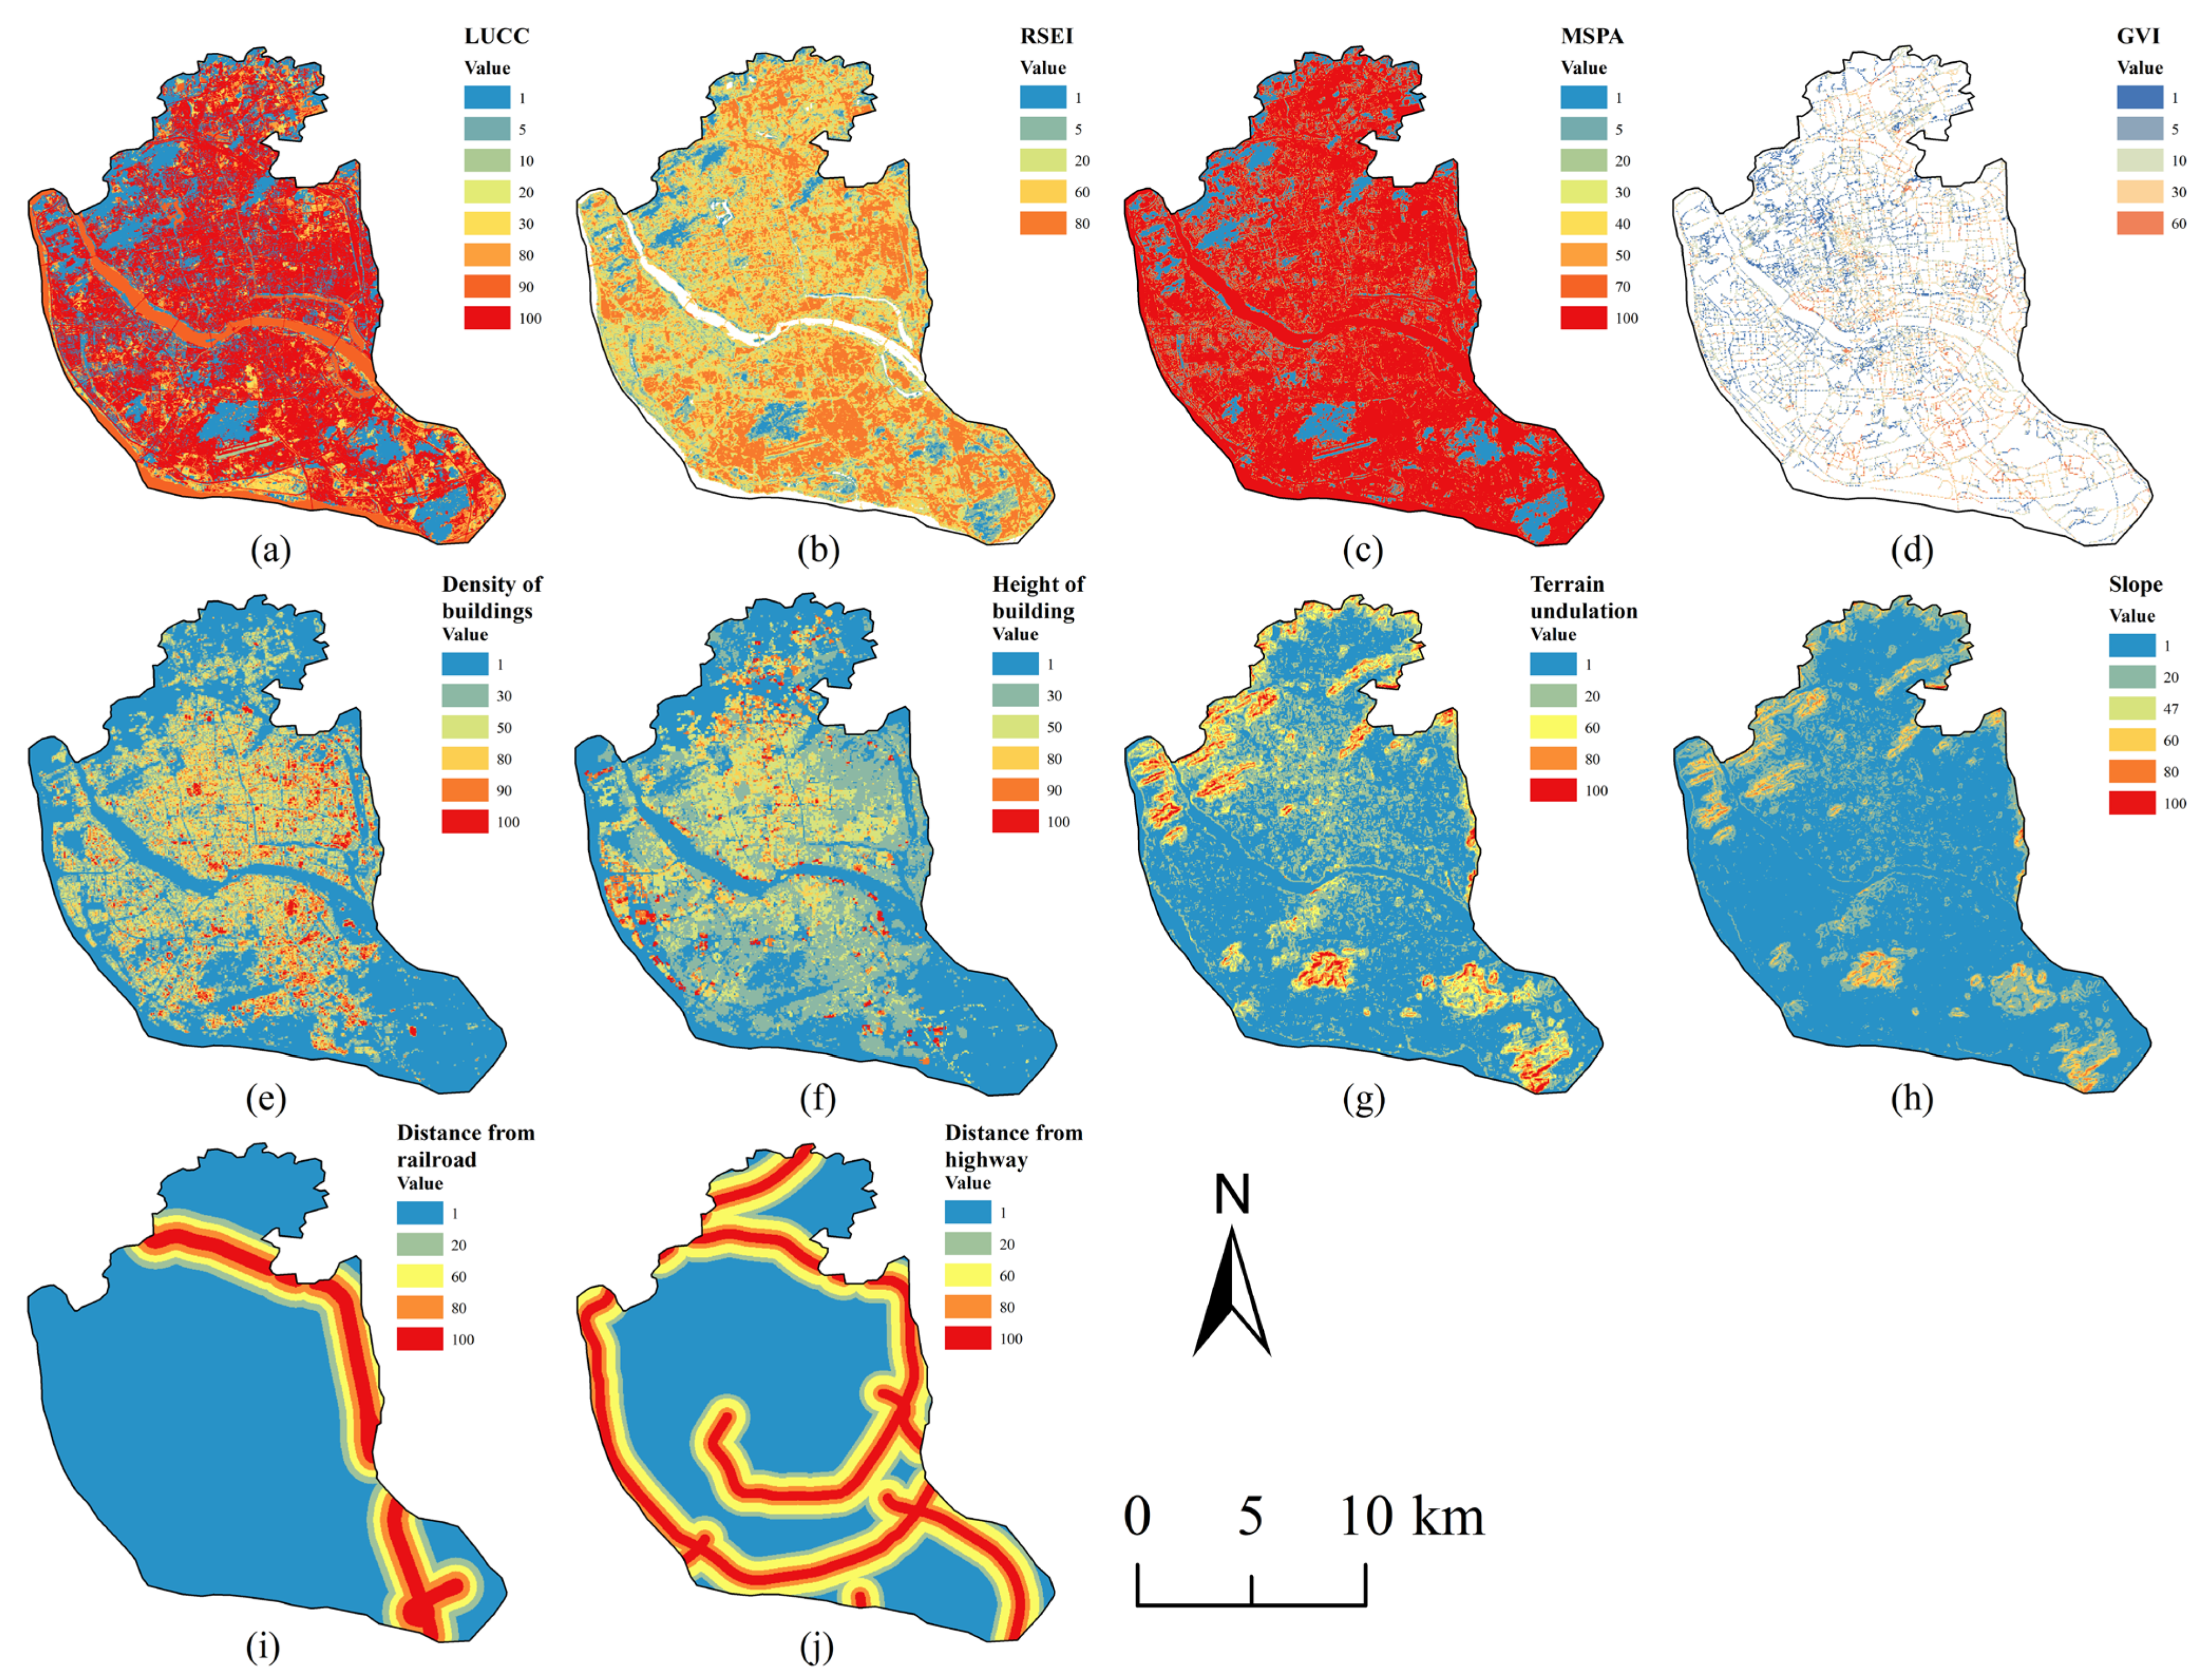
In particular, the building density and building height resistance surfaces are obtained by constructing a 30 × 30 m fishing net and rasterising the building vector data after aggregating the statistics. The green visibility resistance surface is also obtained by sampling a 30 m resolution fishing net and extracting the mean GVI values within the net for rasterisation. The distances to the railway and the highway were rasterised using the Euclidean distance tool (Figure 3).
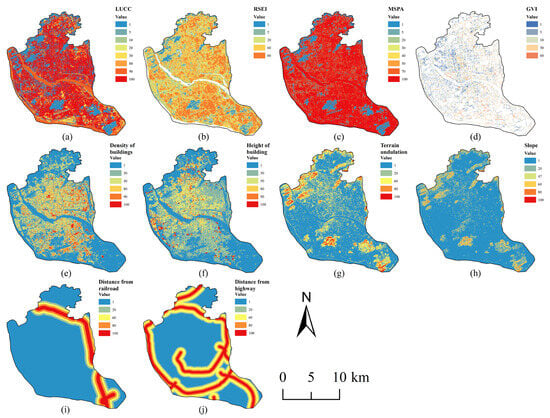
Figure 3.
Spatial distribution of each resistance factor. (a) Land use type resistance surface; (b) Remote Sensing Ecological Index resistance surface; (c) MSPA landscape type resistance surface; (d) Green View Index resistance surface; (e) building density resistance surface; (f) building height resistance surface; (g) terrain undulation resistance surface; (h) slope resistance surface; (i) distance from railway resistance surface; (j) distance from highway resistance surface.
2.4.5. Identifying Urban Ecological Networks Based on MCR Models
Urban ecological corridors are important carriers for the exchange of material and energy between ecological sources within the city [8]. The Minimum Cumulative Resistance (MCR) model is a common method for the construction of ecological networks [33]. Based on the integrated resistance surface constructed above, the minimum cost of moving between ecological sources is calculated and a path with the lowest risk and cost is drawn. The formula of the MCR model is as follows:
where MCR is the minimum cumulative resistance, is the positive correlation between the minimum cumulative resistance and the ecological process, refers to the spatial distance from patch to , and denotes the resistance coefficient of spatial expansion of patch .
In this study, we used the Linkage Mapper toolkit developed by McRae to perform calculations to determine the spatial layout of the ecological network [66].
2.4.6. Circuitscape-Based Urban Ecological Network Optimisation
The Circuitscape model is a widely used method for studying functional landscape connectivity [67]. The model utilises the random wandering properties of electrical charges to link circuit theory to movement ecology. In the modelling process, landscapes are treated as electrically conductive surfaces, with lower resistance being assigned to landscape types that are permeable to species movement or that promote ecological processes, and higher resistance representing landscape components that impede species movement.
Based on the Circuitscape principle, we used the Centrality Mapper tool for the description of ecological network centrality, which calculates centrality by simulating currents in the diffusion process of ecological flows, and therefore quantifies the importance of patches and corridors in maintaining the connectivity of the whole network. In this study, based on the centrality results we classified the ecological sources and networks into three levels according to the natural breakpoint method.
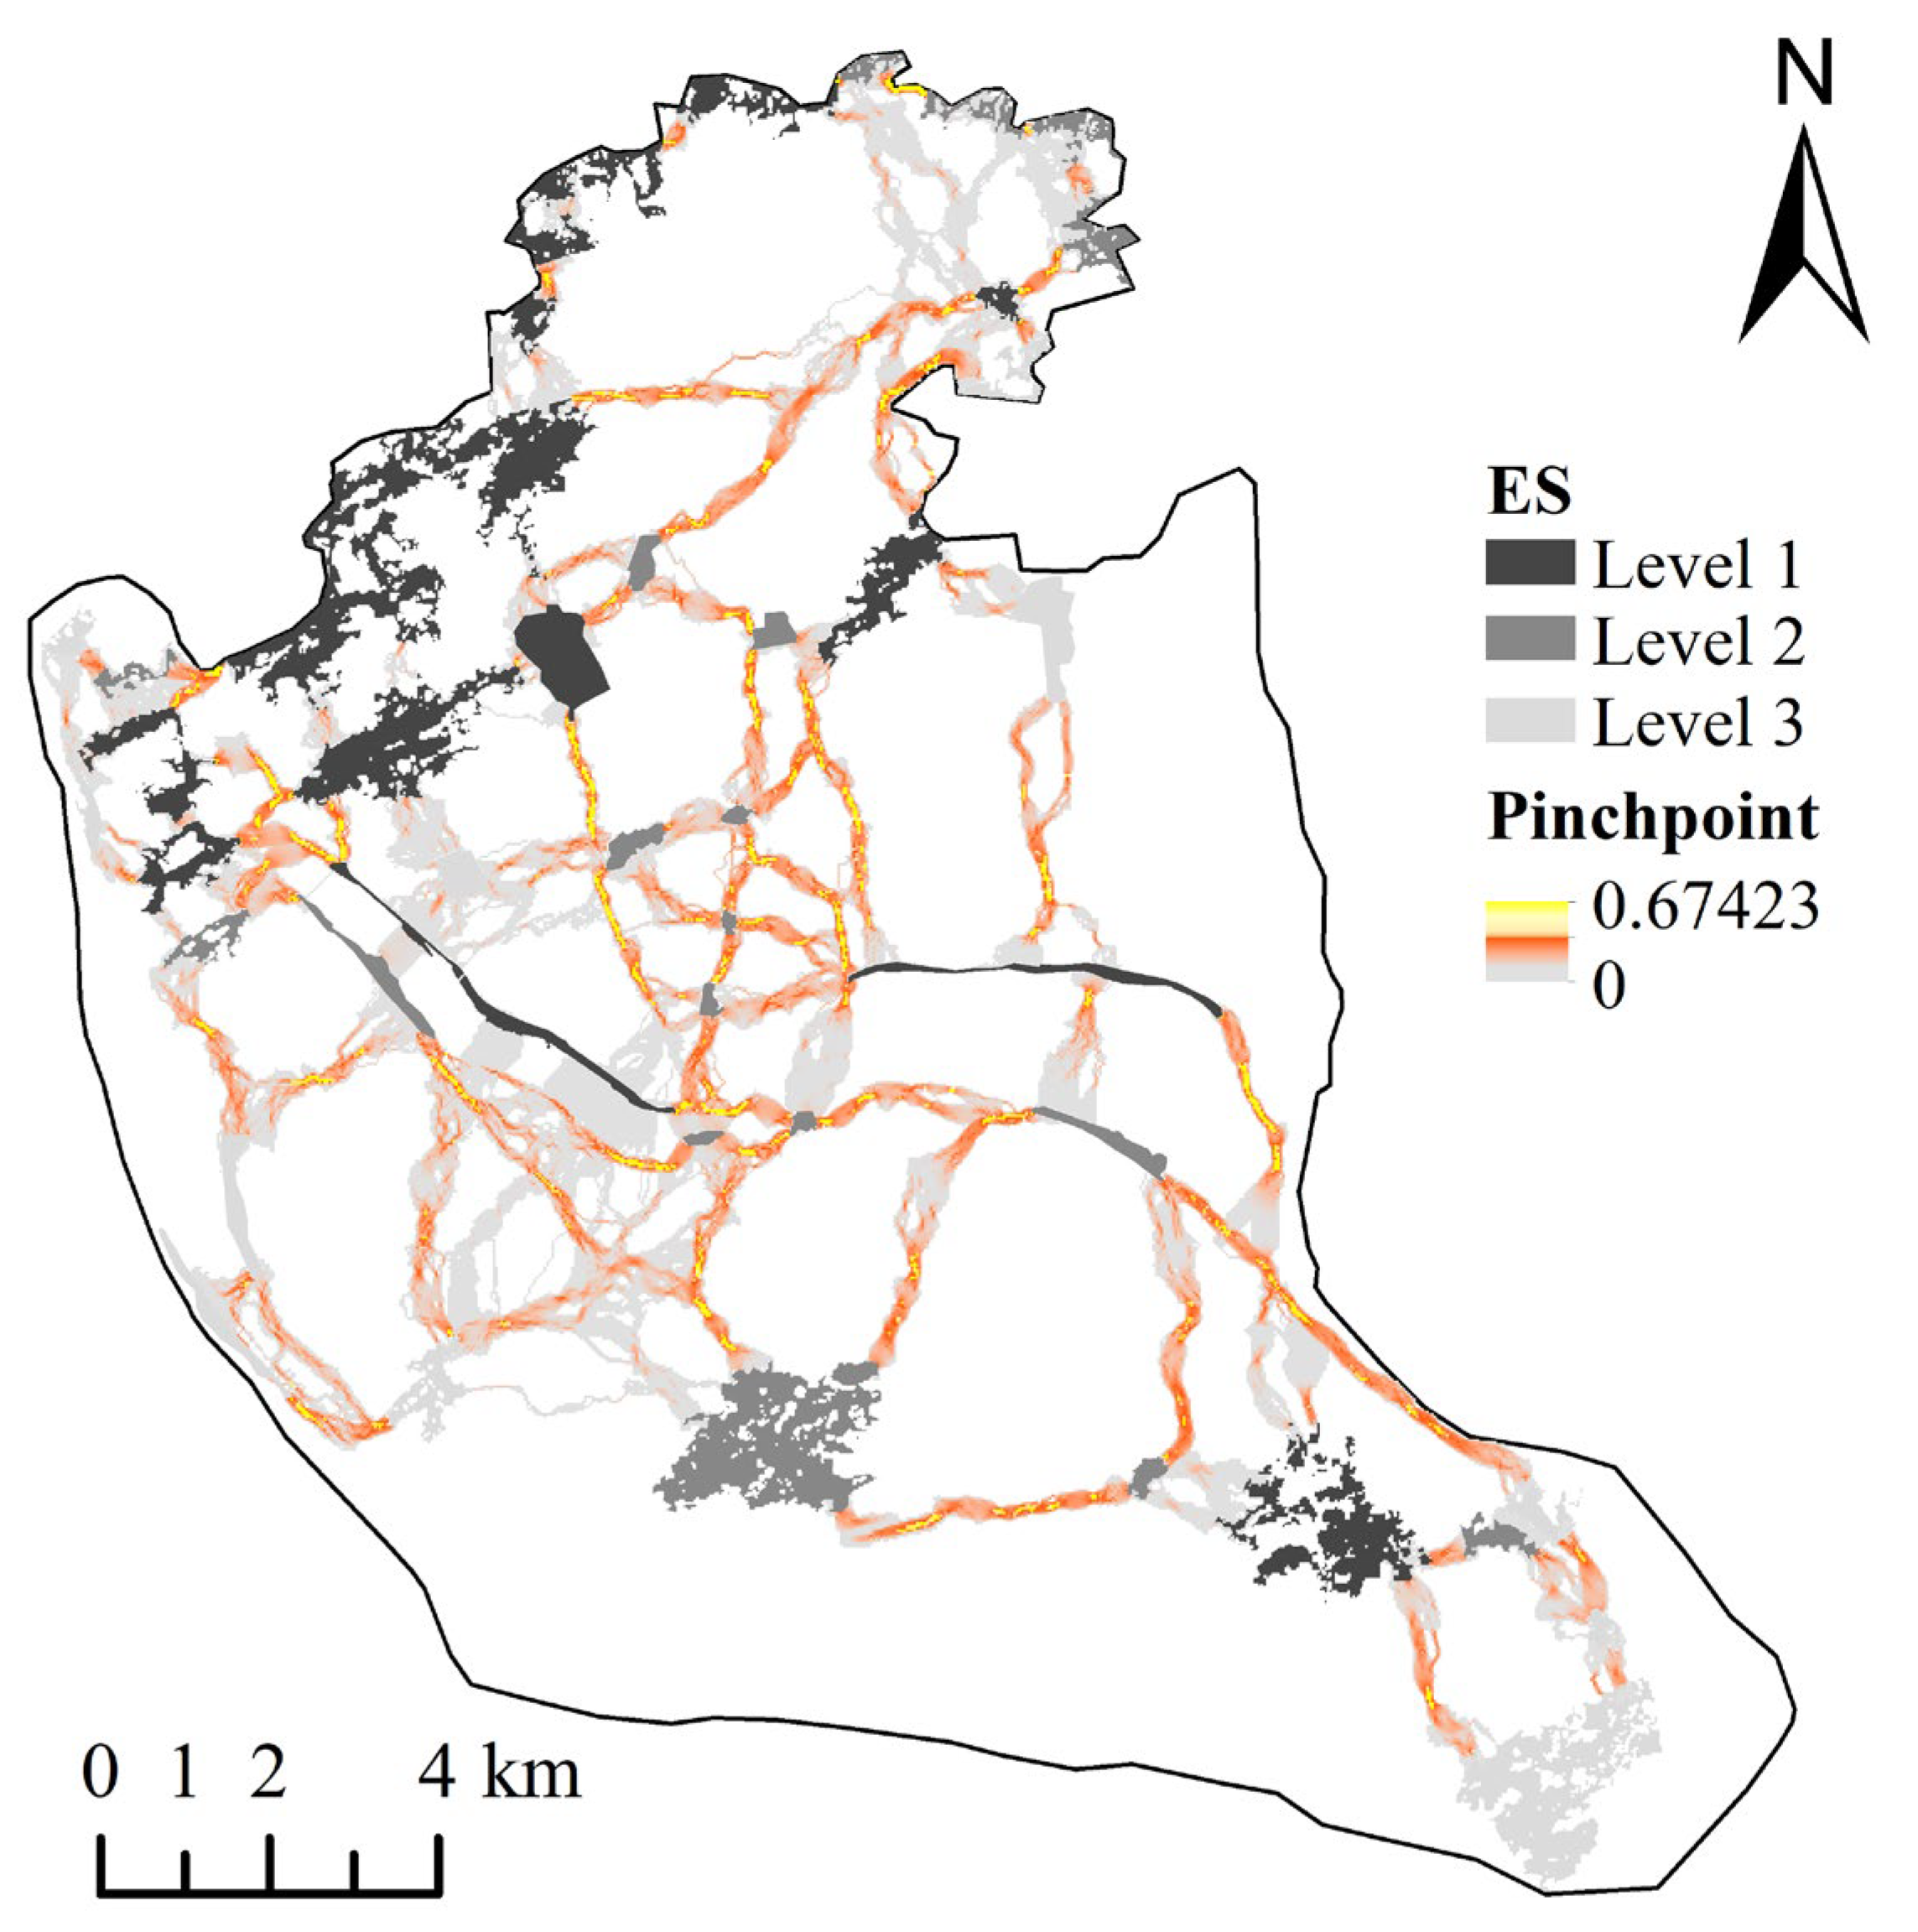
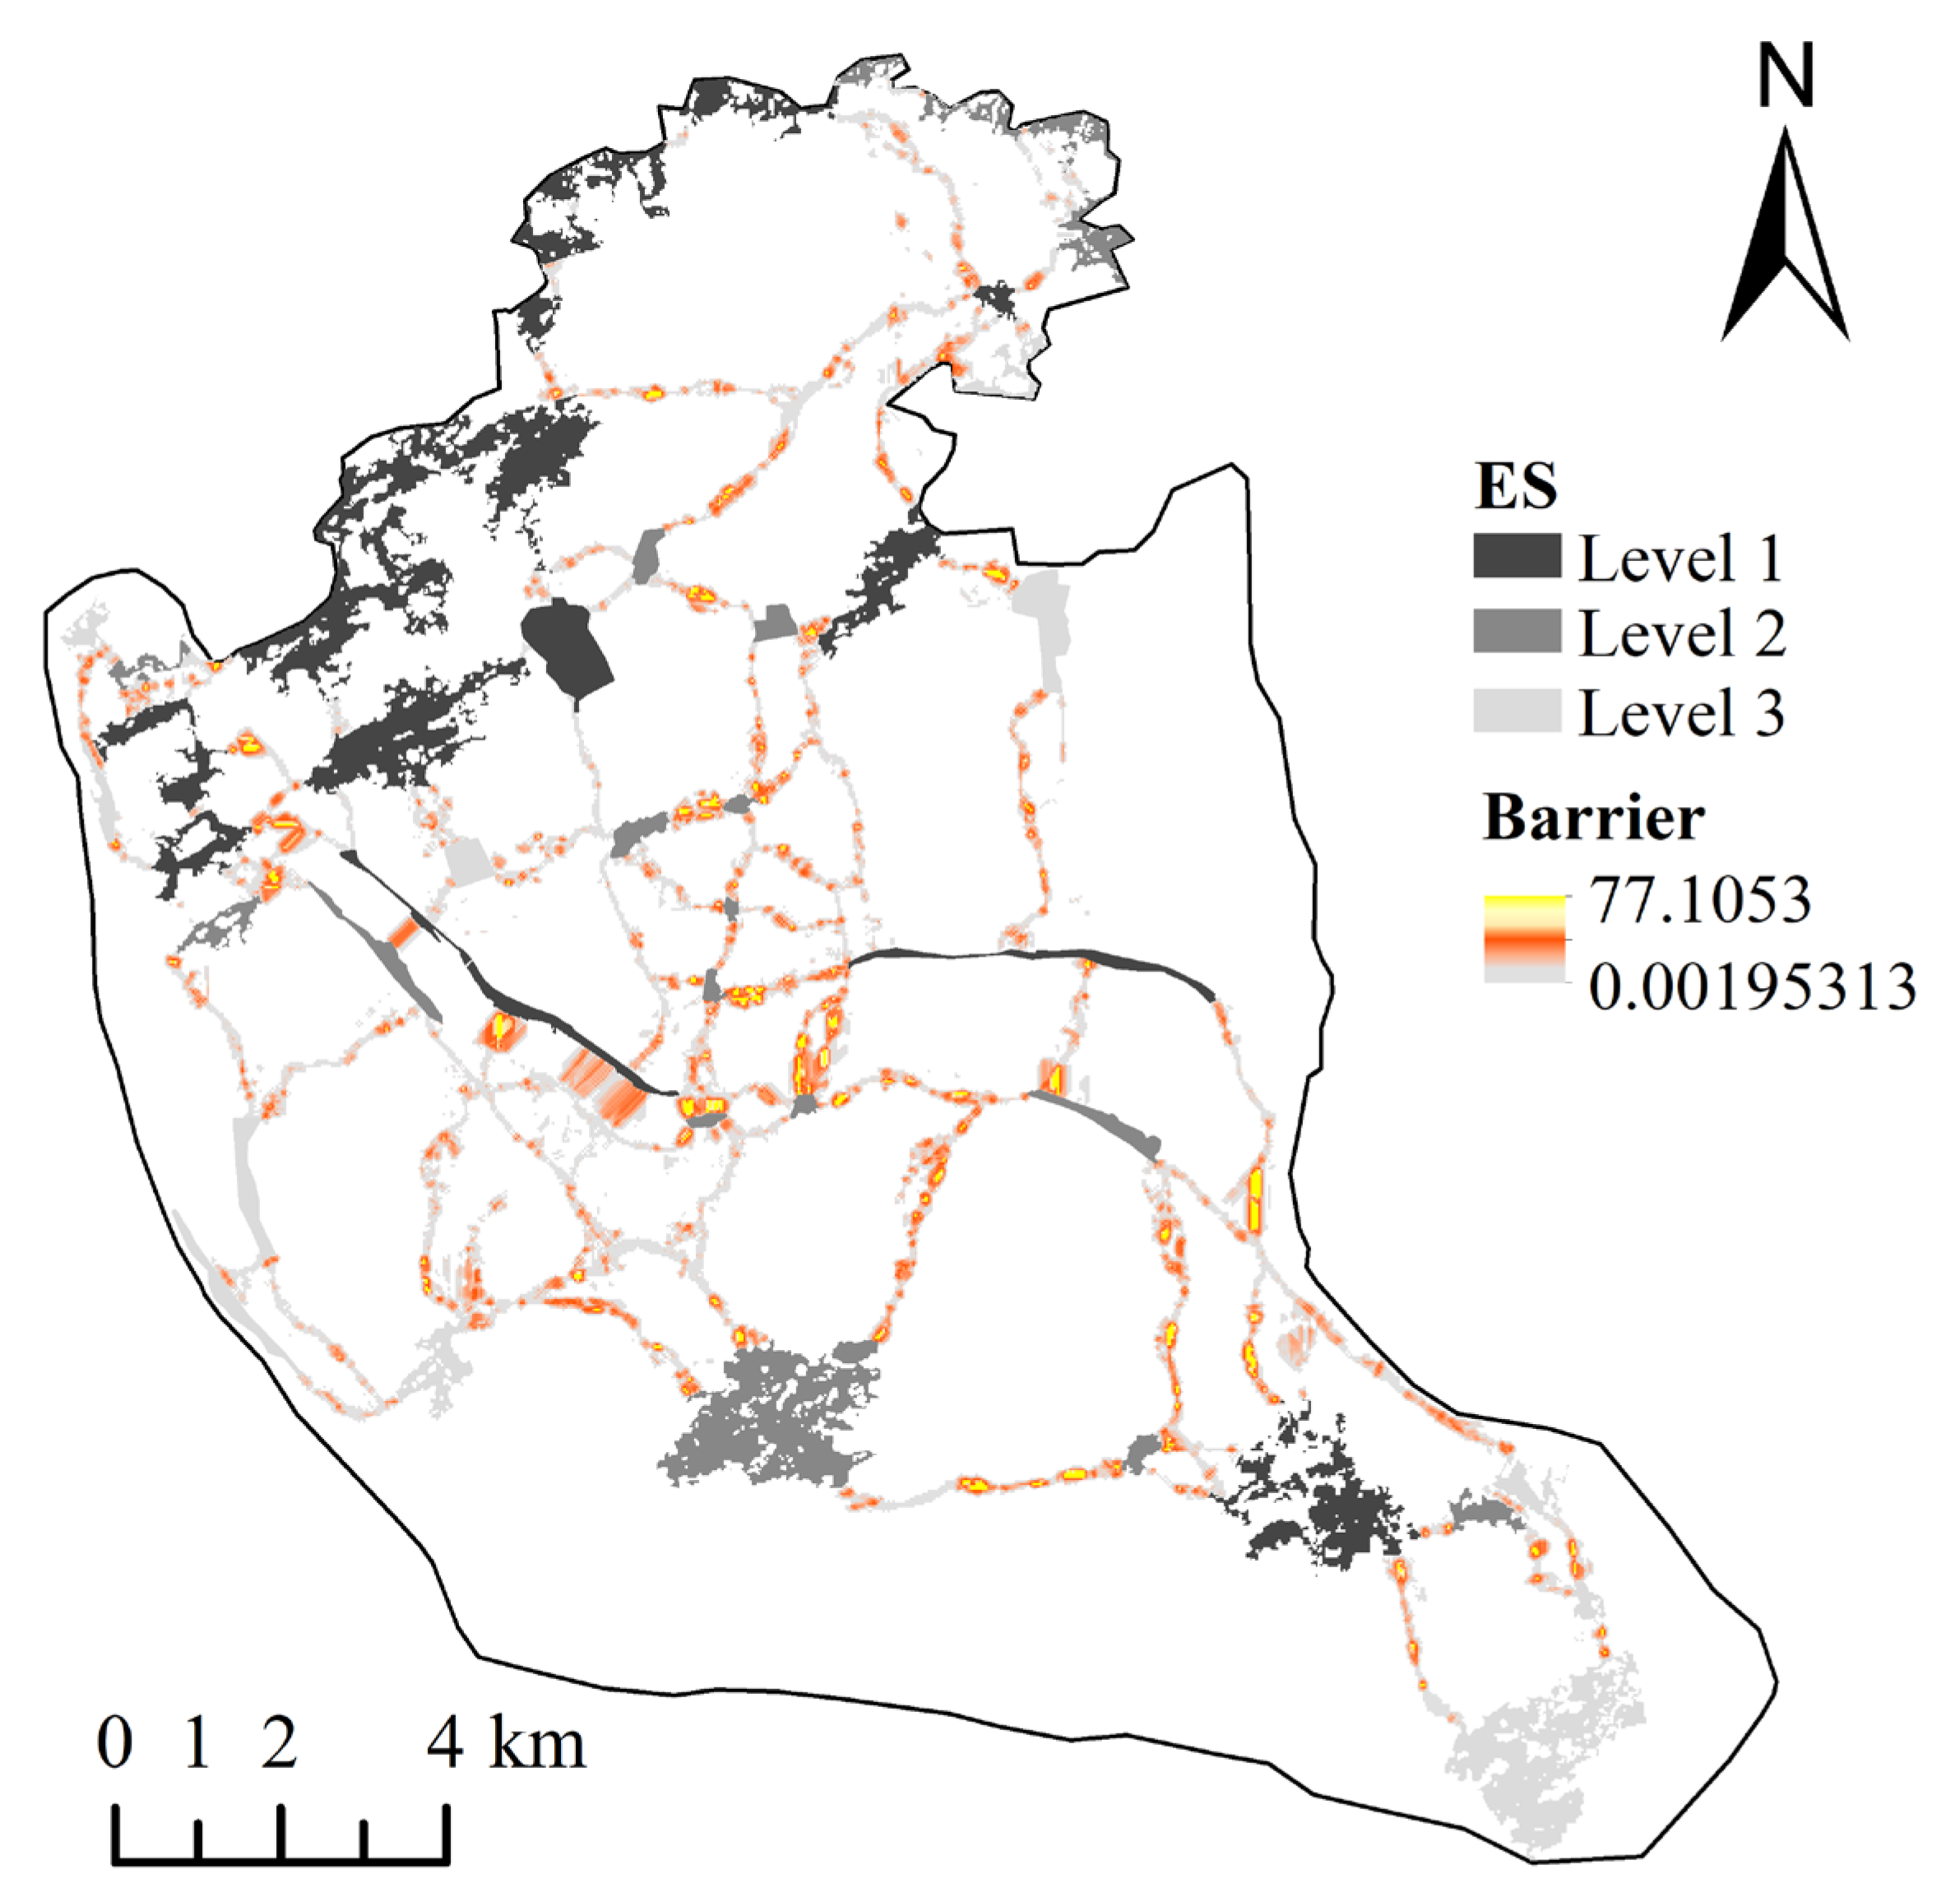
Based on the integrated resistance surface set up in the previous section, we used the Pinchpoint Mapper and Barrier Mapper tools to identify “pinch points” and barrier points in the urban ecological network [68]. We used Pinchpoint Mapper and Barrier Mapper to identify the “pinch points” and barrier points in urban ecological networks. Pinchpoints are the areas with the highest current density, i.e., the areas with the most frequent material exchange and migration between ecological sources, which are the key nodes to maintain the ecological network. Barrier points are areas in the ecological network that impede the flow of species and information, and restoration of these areas will improve the connectivity of the ecological network.
It has been shown that the width does not change the position of the “pinch point” [29,35]. Therefore, in the process of calculating the “pinch point”, we set the “width” to 1000 for the convenience of display, divided the final result into three levels according to the natural breakpoint method, and extracted the highest level as the important “pinch point” in this study. In the calculation of barrier points, we set the minimum search radius to 30 m, the maximum search radius to 90 m, the step size to 60 m, and choose the default “Maximum” mode for iteration. We then divided the final result into three levels according to the natural breakpoint method, and extracted the highest level as the barrier point in this study. For the calculation formula, please refer to the literature [69].
2.4.7. Evaluation of Ecological Network Connectivity under Different Development Scenarios
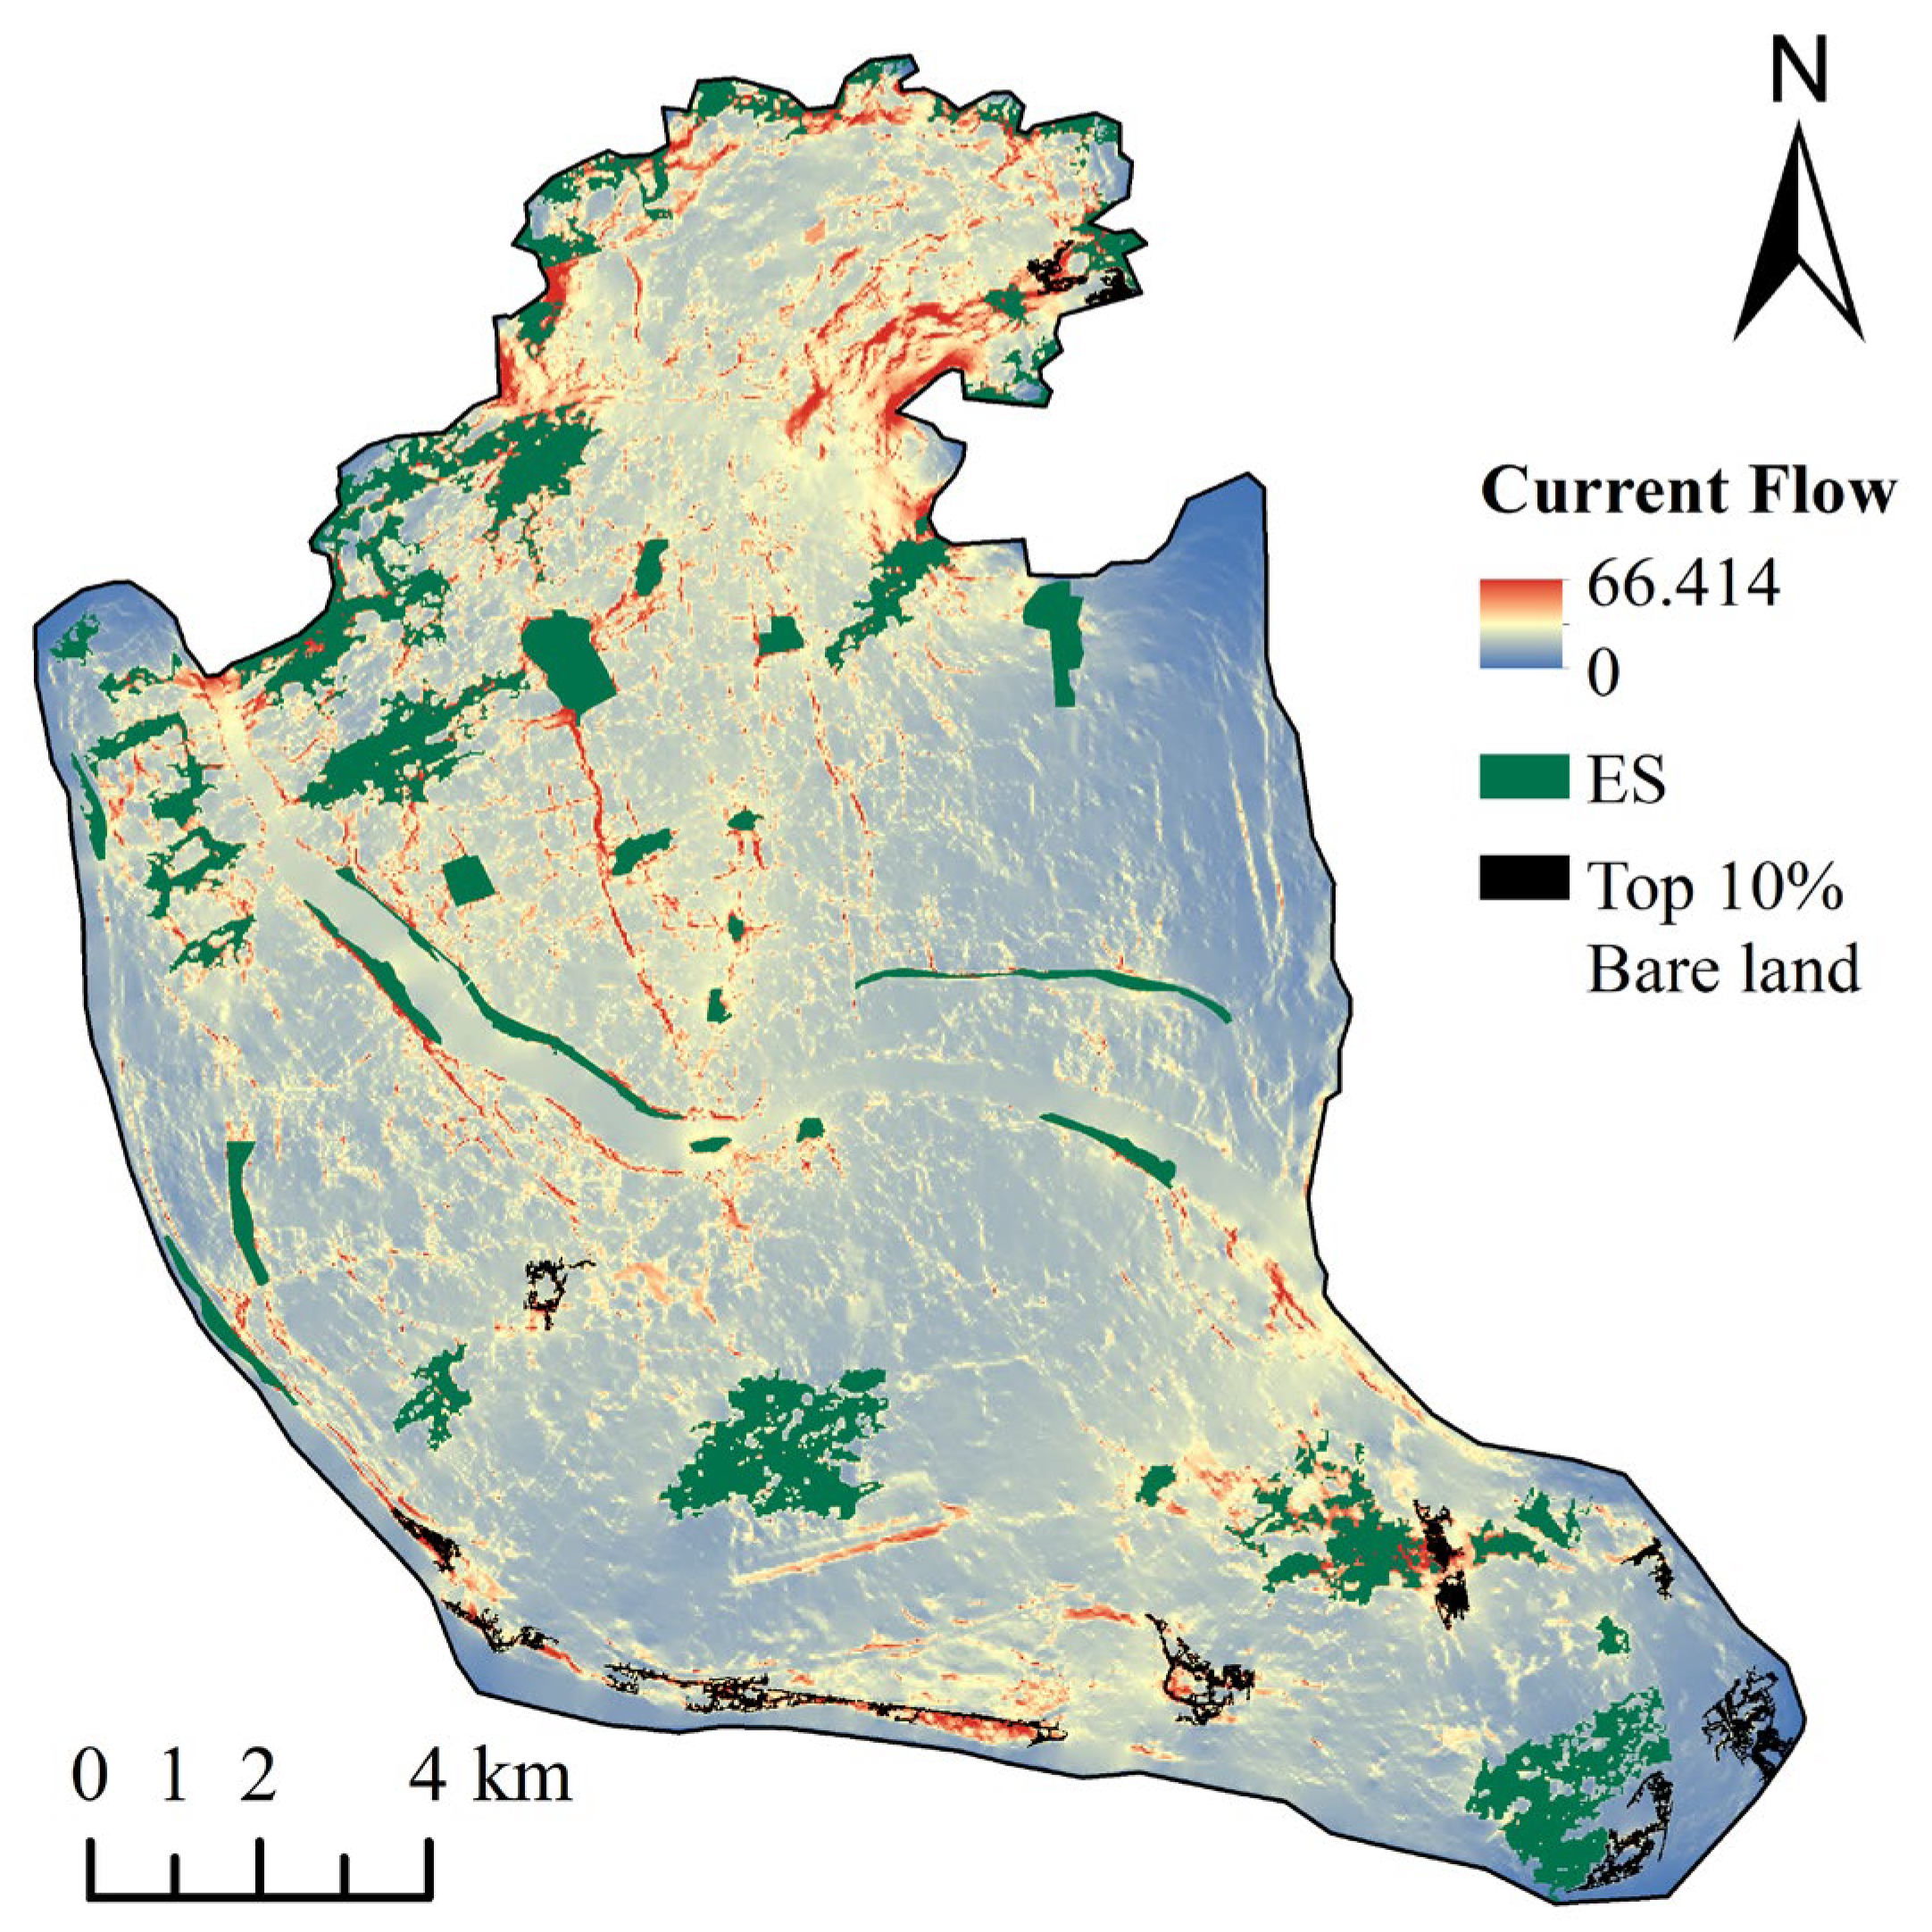
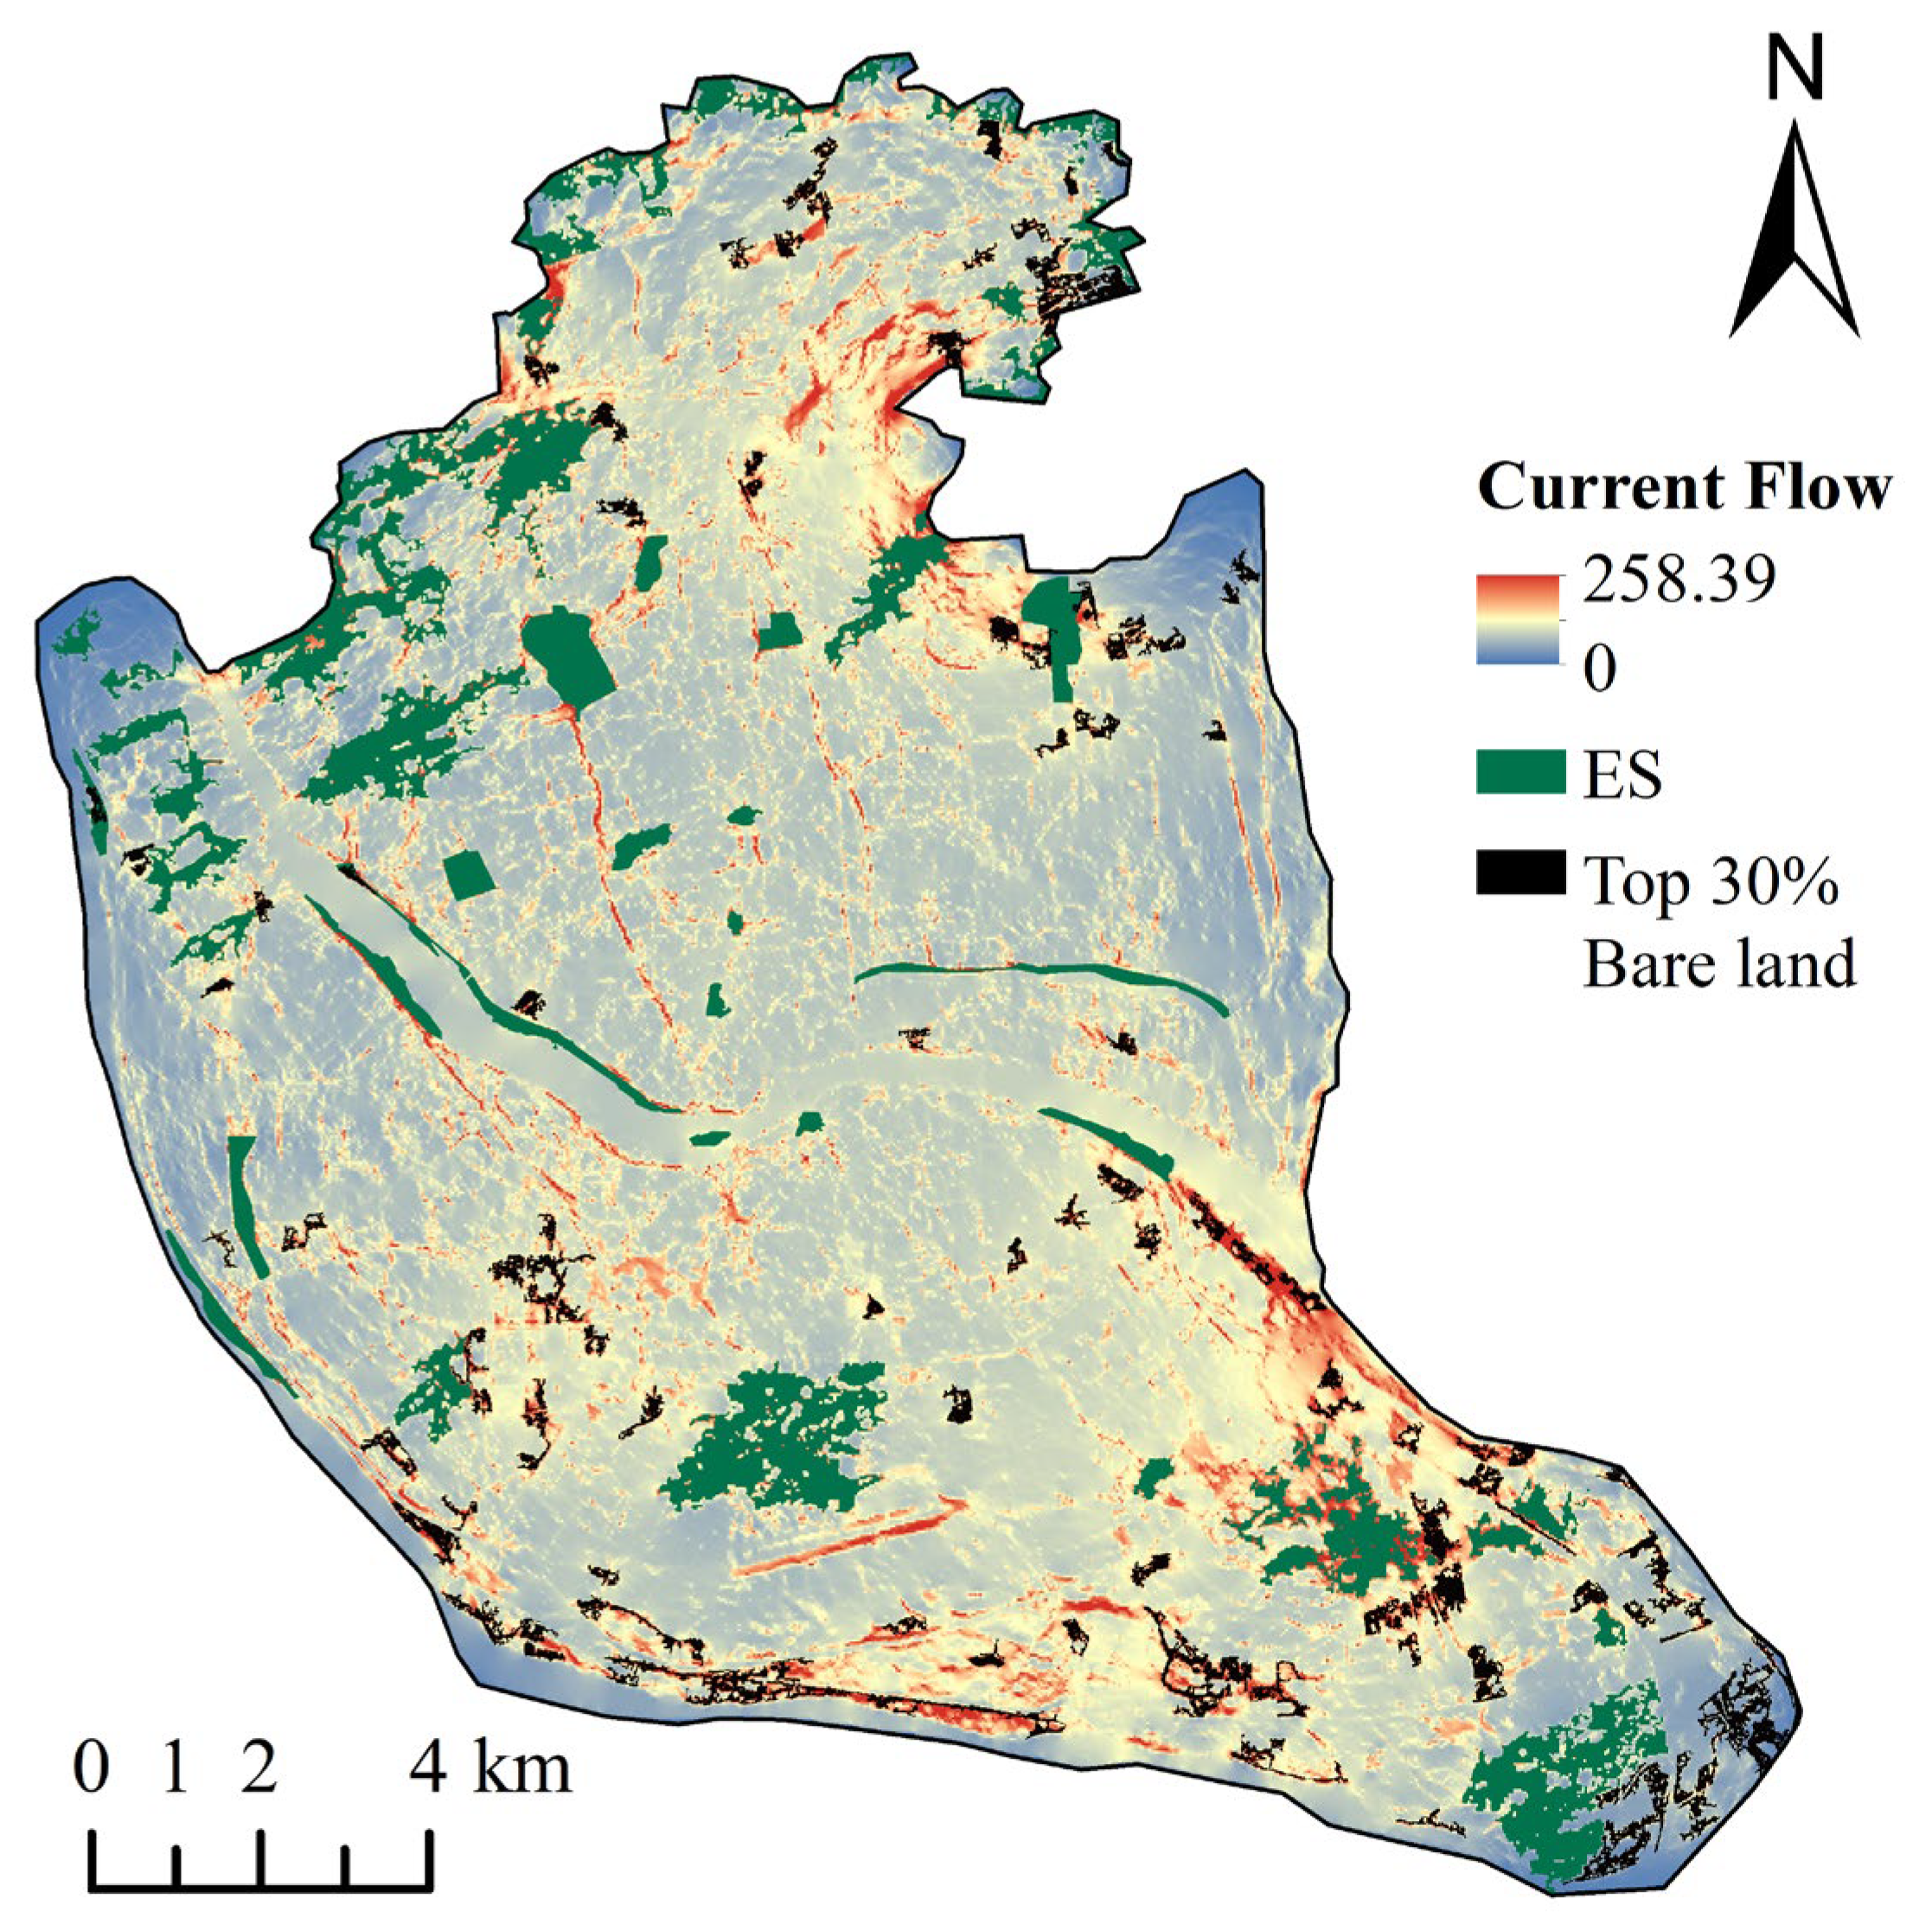
The rational use and transformation of urban unused land plays an important role in improving the urban green space landscape and enhancing the overall landscape connectivity. In order to concentrate resources and ensure that important areas within the city are improved, we extracted the top 10% and top 30% of bare land patches as areas for greening enhancement to simulate different development scenarios. The extracted bare land resistance values were modified using tessellation to a new raster tool. Here, we have assumed that these bare lands have been developed as urban green spaces or parks, and therefore appropriate adjustments need to be made to the current resistance values of these bare lands. Specifically, in the land use resistance surface, the resistance of bare land was changed to 1, which is equivalent to forest land. This is because the vegetation coverage of parklands in Fuzhou City is generally high. Secondly, in the MSPA resistance surface, the resistance of bare land was changed to 1, which is equivalent to the resistance value of Core. In addition, in the resistance surface of RSEI, the resistance value of the extracted bare ground area was modified to 5, which is equivalent to the resistance value of RSEI 0.6~0.8, and other resistances remained unchanged. Finally, the weighted superposition of the raster was performed again, and two new resistance surface data were obtained. The evaluation of ecological network connectivity was carried out using the pairwise mode in Circuitscape v4.0 software.
3. Results
3.1. Results of MSPA
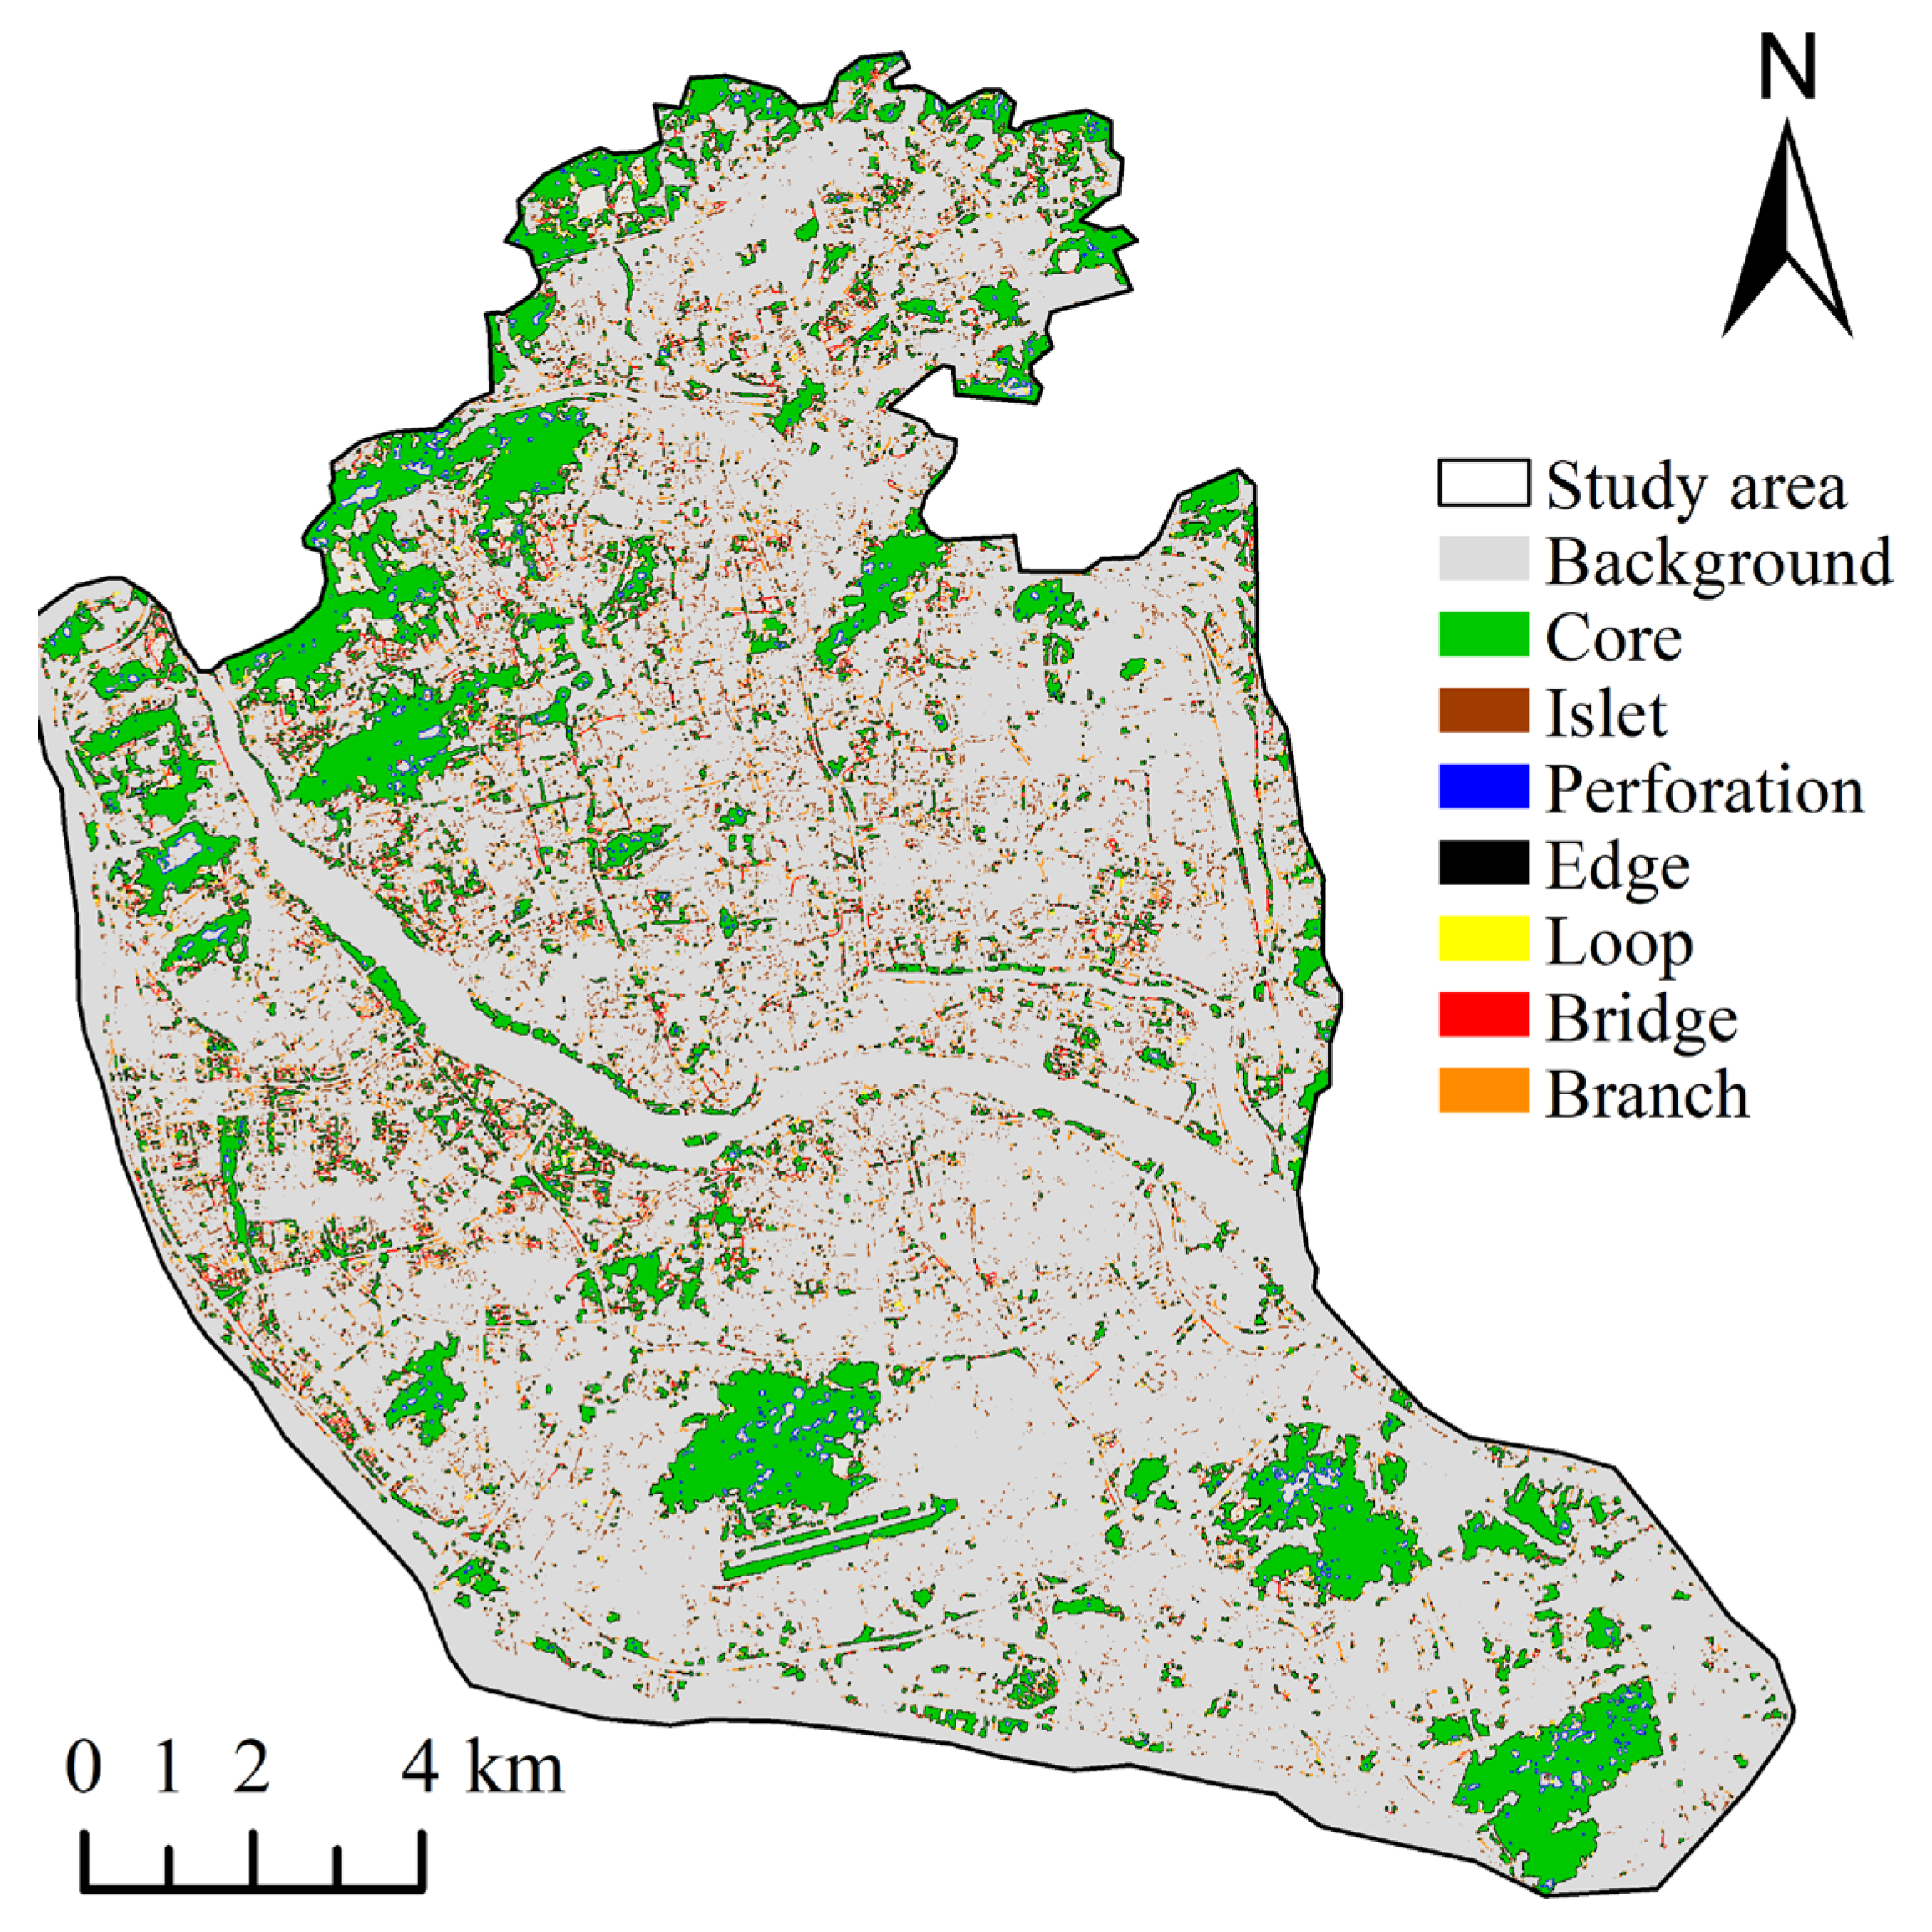
In this study, woodland, shrubland, grassland, and wetland were used as the foreground for the calculation of MSPA, and the results are shown in Figure 4. It can be seen that the landscape type of Fuzhou city centre is mainly dominated by the core area and is fragmented. It is mainly concentrated in the northwest corner of the study area as well as the southeast area. We counted the area of each landscape type and the proportion of ecological resources it accounts for (Table 2), and it can be seen that the area of the Core is the largest, while the proportion of Branch, Bridge, and Loop as important landscape types connecting to the Core is low, indicating that the core patches in the study area are more fragmented and have poor connectivity.
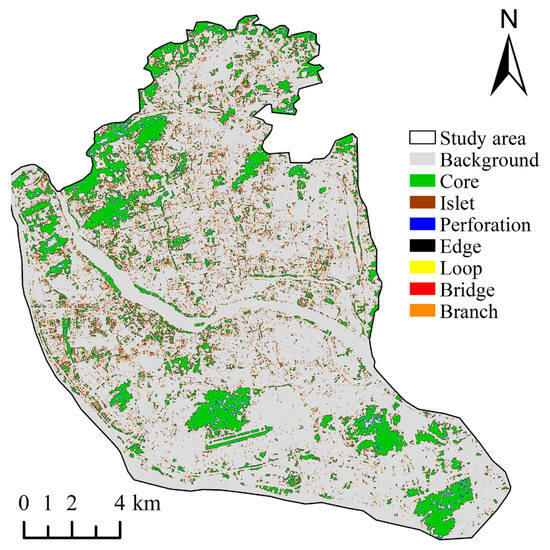
Figure 4.
Spatial distribution of landscape types in the study area based on MSPA.

Table 2.
Statistics on MSPA results.
3.2. Remote Sensing Ecological Index Calculation Results
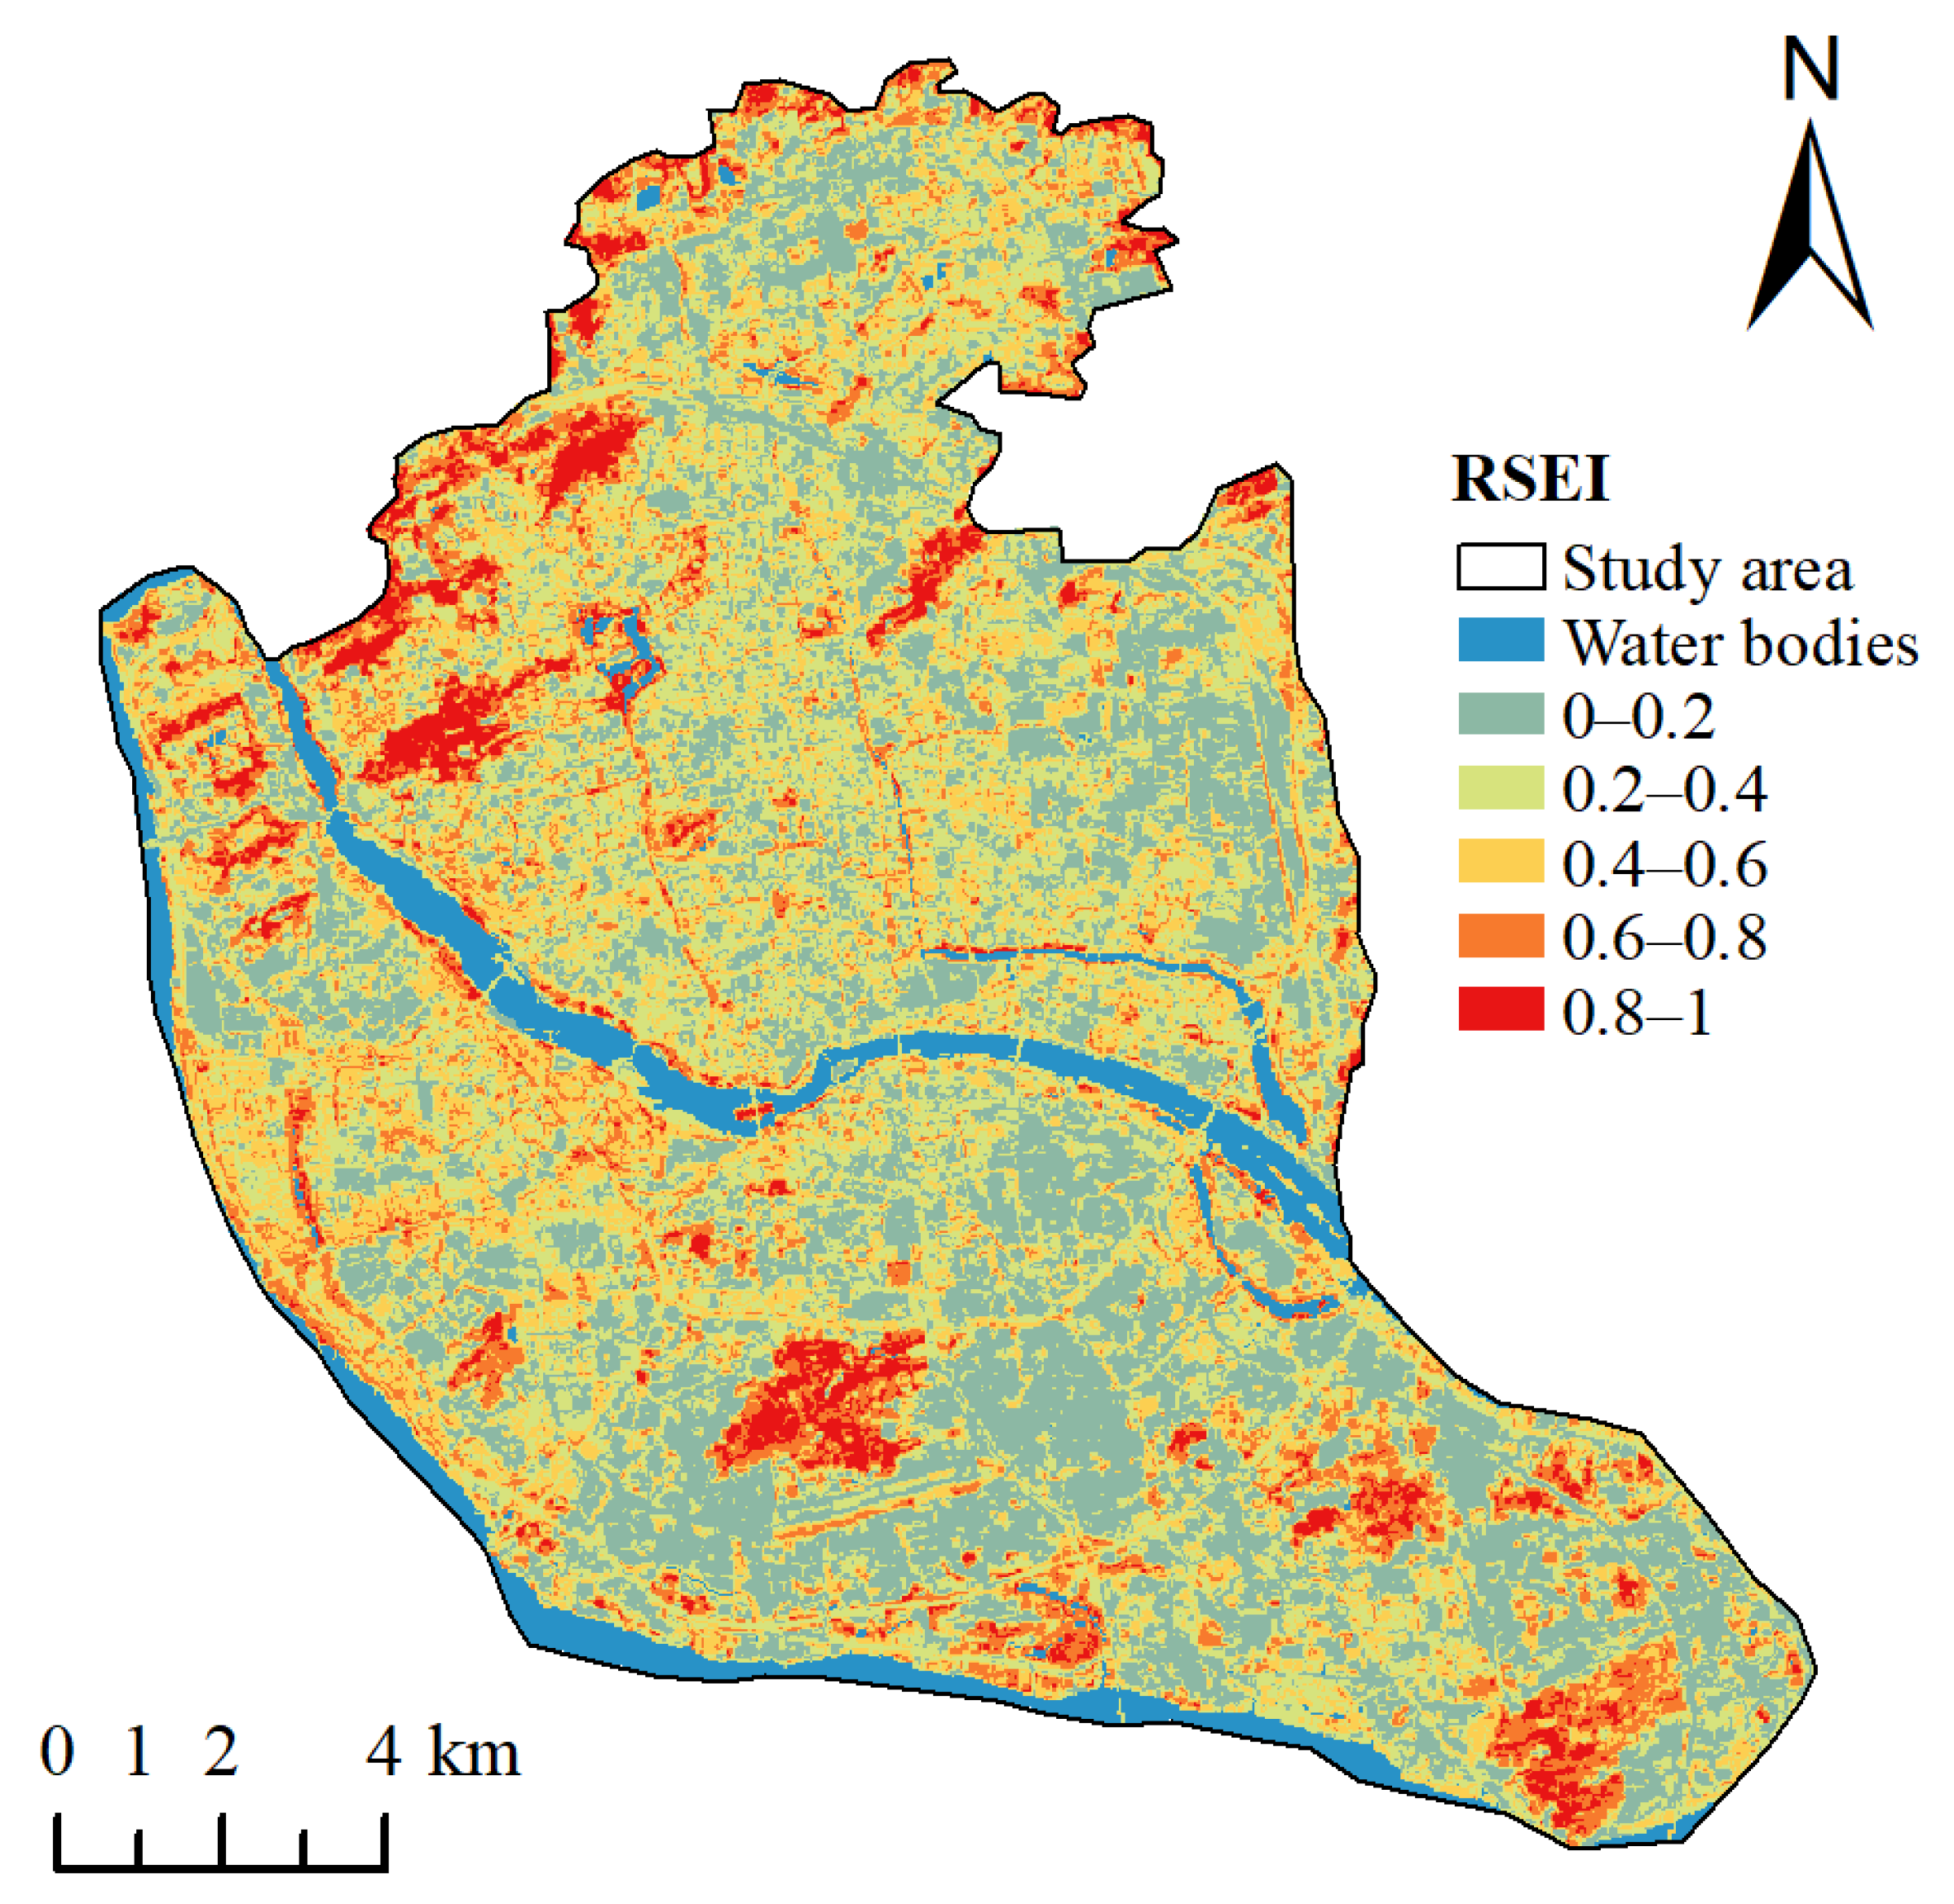
As can be seen from Table 3, the contribution of PC1 reaches 90.40%, indicating that PC1 concentrates most of the features of the four indicators. Among them, the NDVI and WET are positive indicators, and the LST and NDBSI are negative indicators. Meanwhile, we classified the RSEI according to the classification criteria of related literature, where the RSEI was classified into a total of five classes (Figure 5). Overall, the ecological environment in Fuzhou City is poor, with a mean RSEI value of 0.3544. Areas with high quality ecological environment (RSEI > 0.8) are mainly scattered and in the mountains in the study area. In contrast, in the centre of the city, the ecological environment quality is more average.

Table 3.
RSEI principal component analysis results.
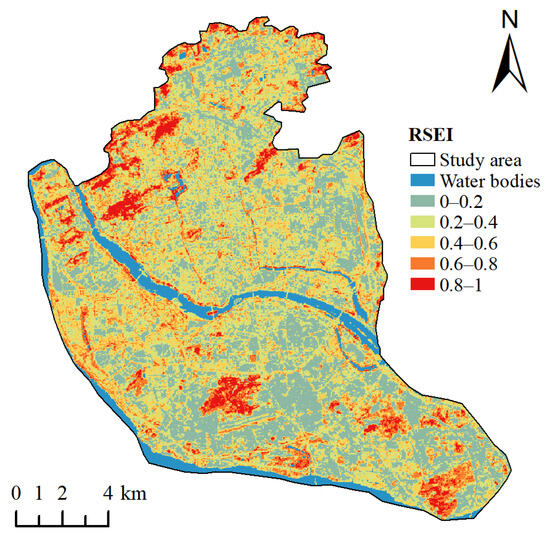
Figure 5.
Evaluation results of ecological environment quality based on RSEI.
3.3. Extraction of Urban Ecological Sources
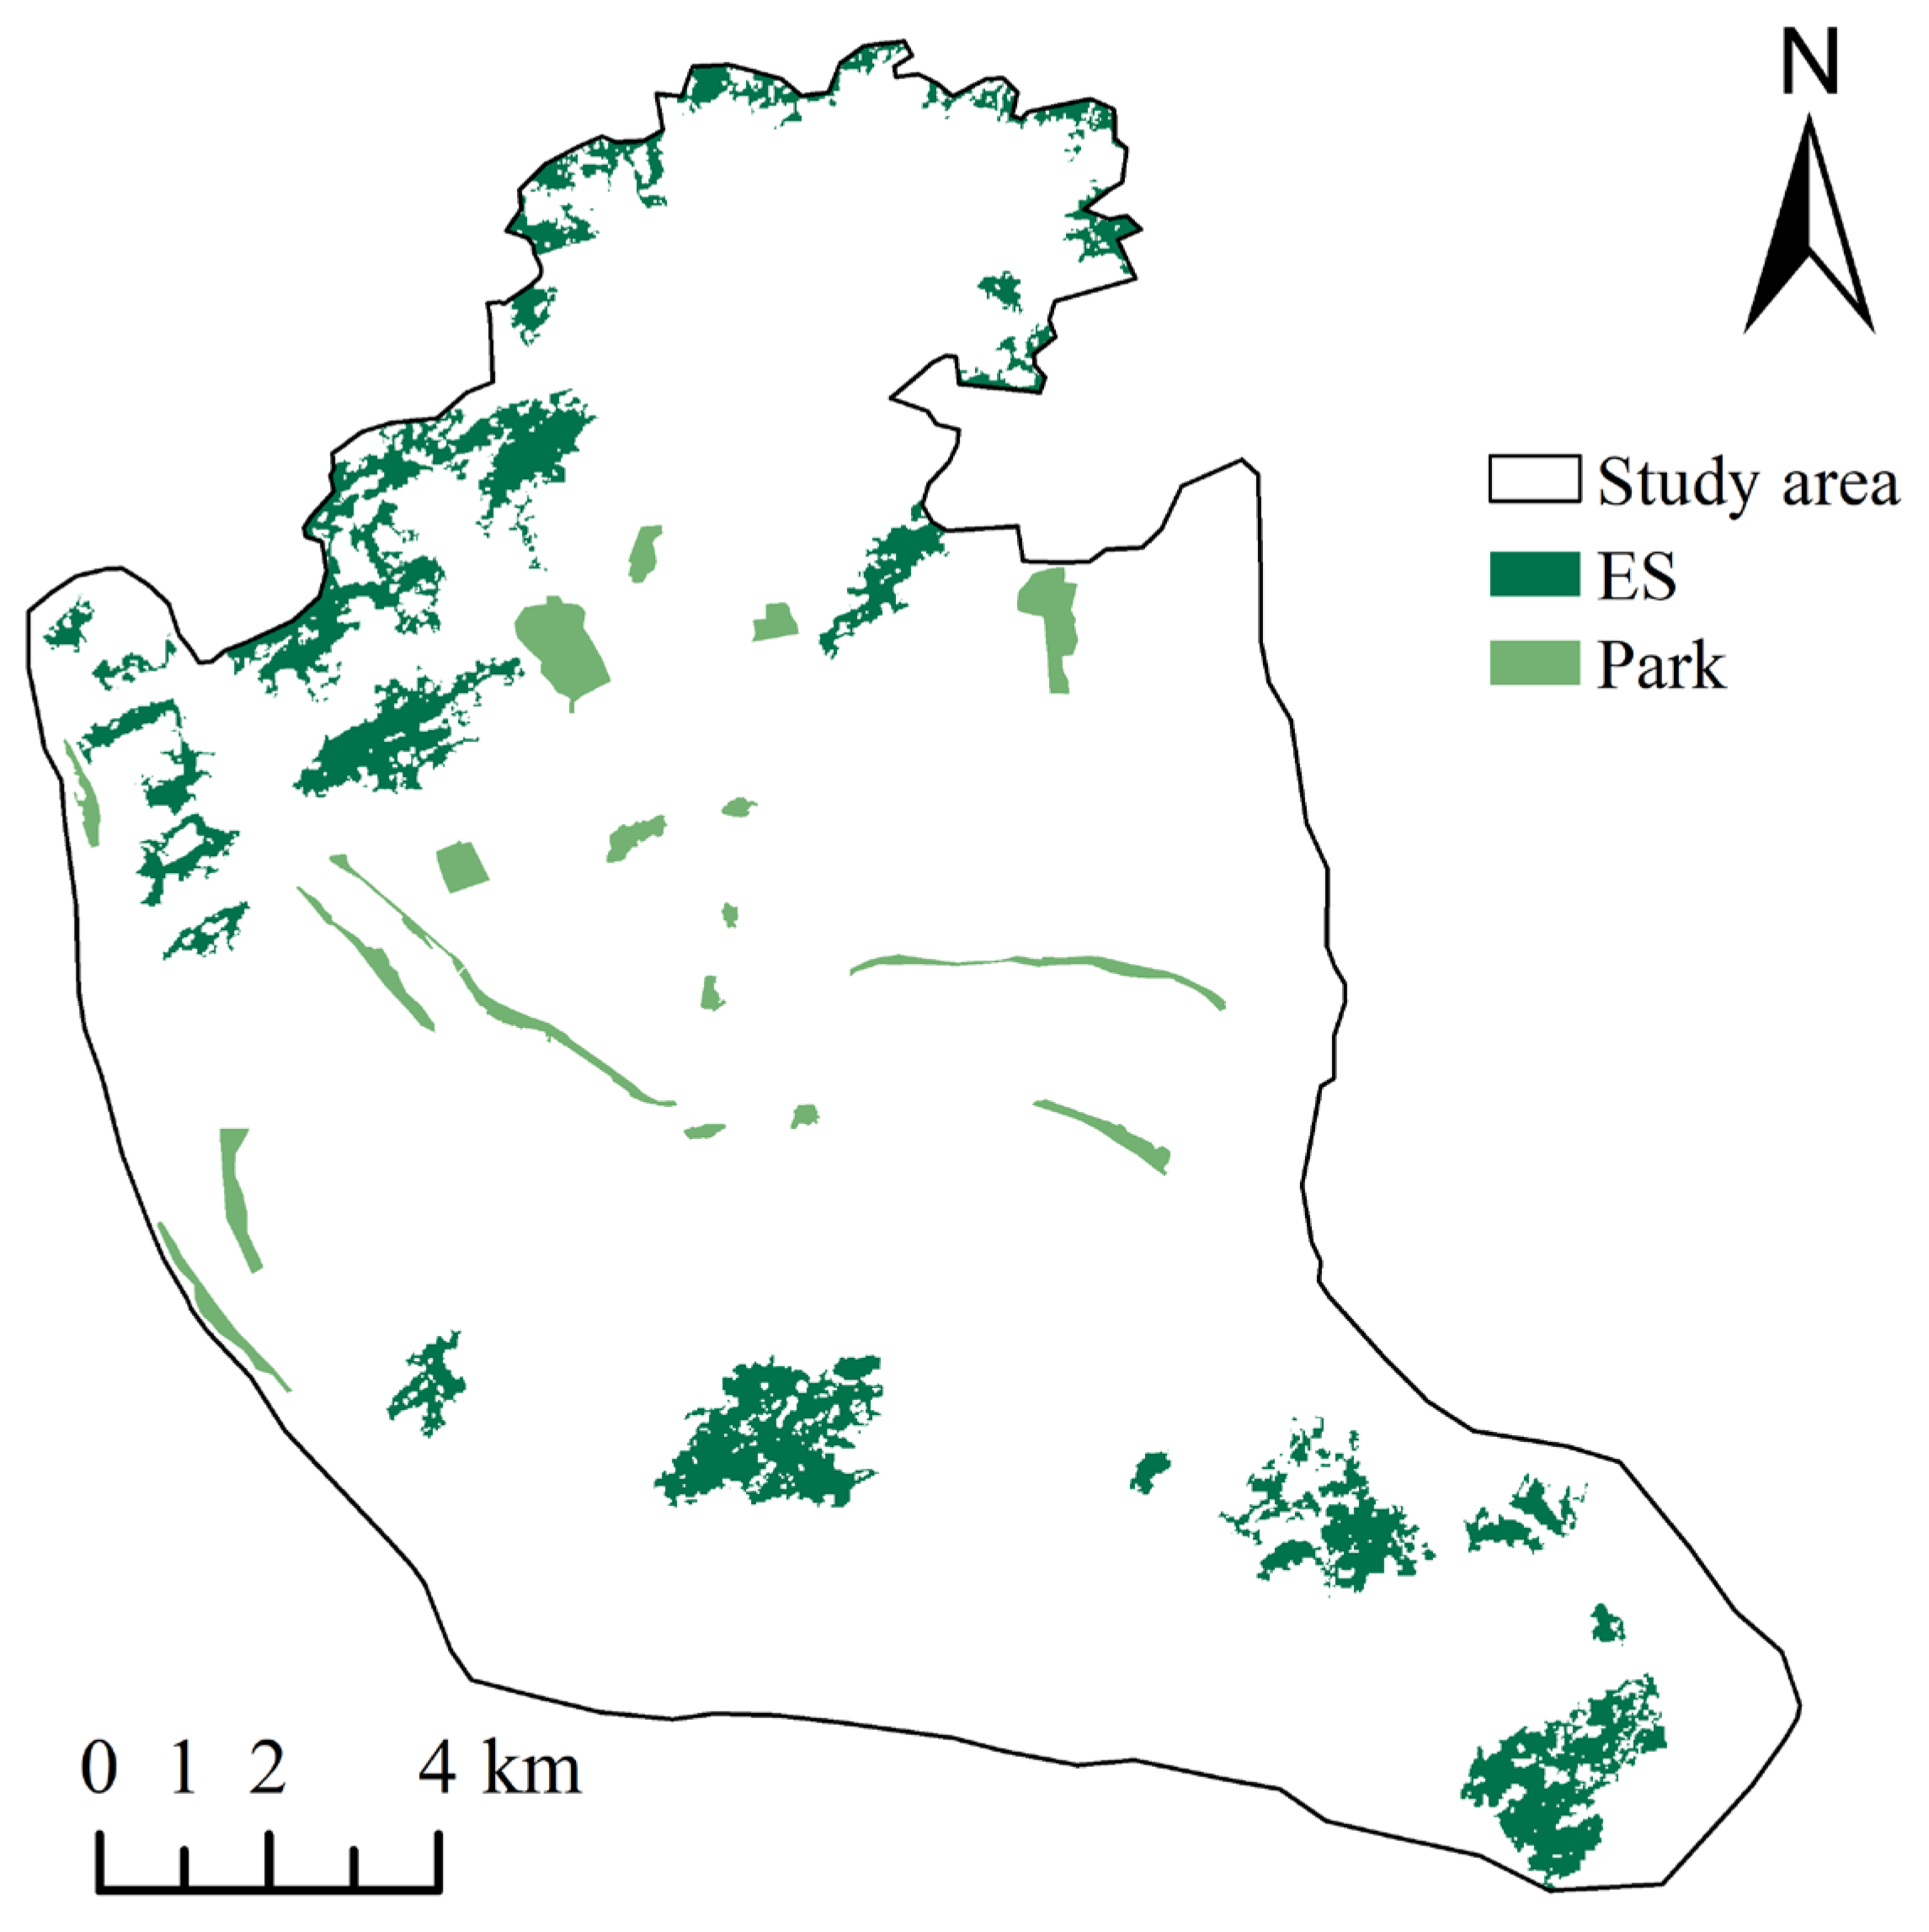
Based on the results of the above analyses, we screened and extracted the urban ecological sources, ES (Figure 6), taking into account the ecological role of urban parks, and supplemented the urban integrated parks that were not extracted due to their size and other reasons. A total of 44 ecological source sites were extracted, including 26 ecological sources selected by the above method and 18 urban parks (Table A2). Altogether, they accounted for 8.55% of the total area of the study area. Together, they constitute the ecological source sites in Fuzhou City. In terms of spatial distribution, the large ecological sources are mainly concentrated in the northwestern, southern, and southeastern parts of the study area. In the centre of the city, there are fewer large source sites and they mainly consist of urban parks due to the tighter land resources. They play a key role in promoting overall landscape connectivity.
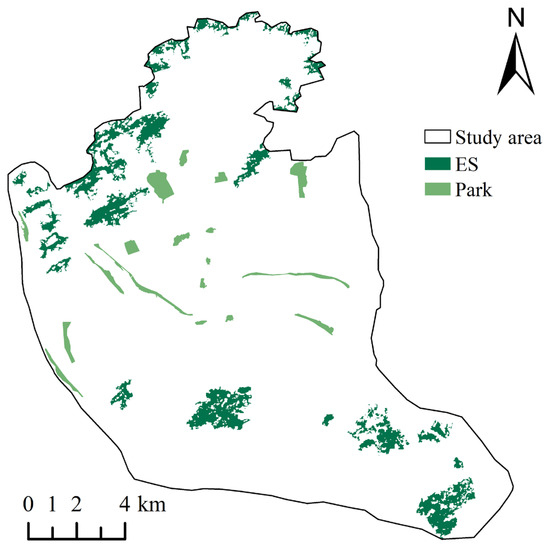
Figure 6.
Spatial Distribution of Ecological Sources in Fuzhou City.
3.4. Resistance Surface Construction Results
The PCA results showed that the cumulative contribution of the first four principal components reached 83.7772%, which effectively summarised the combined resistance to species migration. The loadings of each principal component on the original indicators are shown in Table 4. Among them, in PC1, the loadings of distance from highway and railway are larger, which indicates that the disturbance of roads is an important factor causing ecological resistance; in PC2, the loadings of LUCC, RSEI, and MSPA are larger, which can reflect the current situation of the distribution of landscape resources in Fuzhou City; in PC3, the loadings of the factors of building density and building height are larger, which reflect the impacts of human activities; and the loadings of the GVI in PC4 has the largest loading, which indicates that urban street greening has some influence on the comprehensive resistance. Terrain undulation and slope have the largest loadings in PC10. In general, the most critical indicators affecting the integrated resistance value of Fuzhou city centre can be summarised into three types of impacts. One is the disturbance from human activities, followed by the current distribution of ecological resources in the study area, including the level of street greening. The last is the influence of topography and geomorphology.

Table 4.
Resistance surface principal component analysis results.
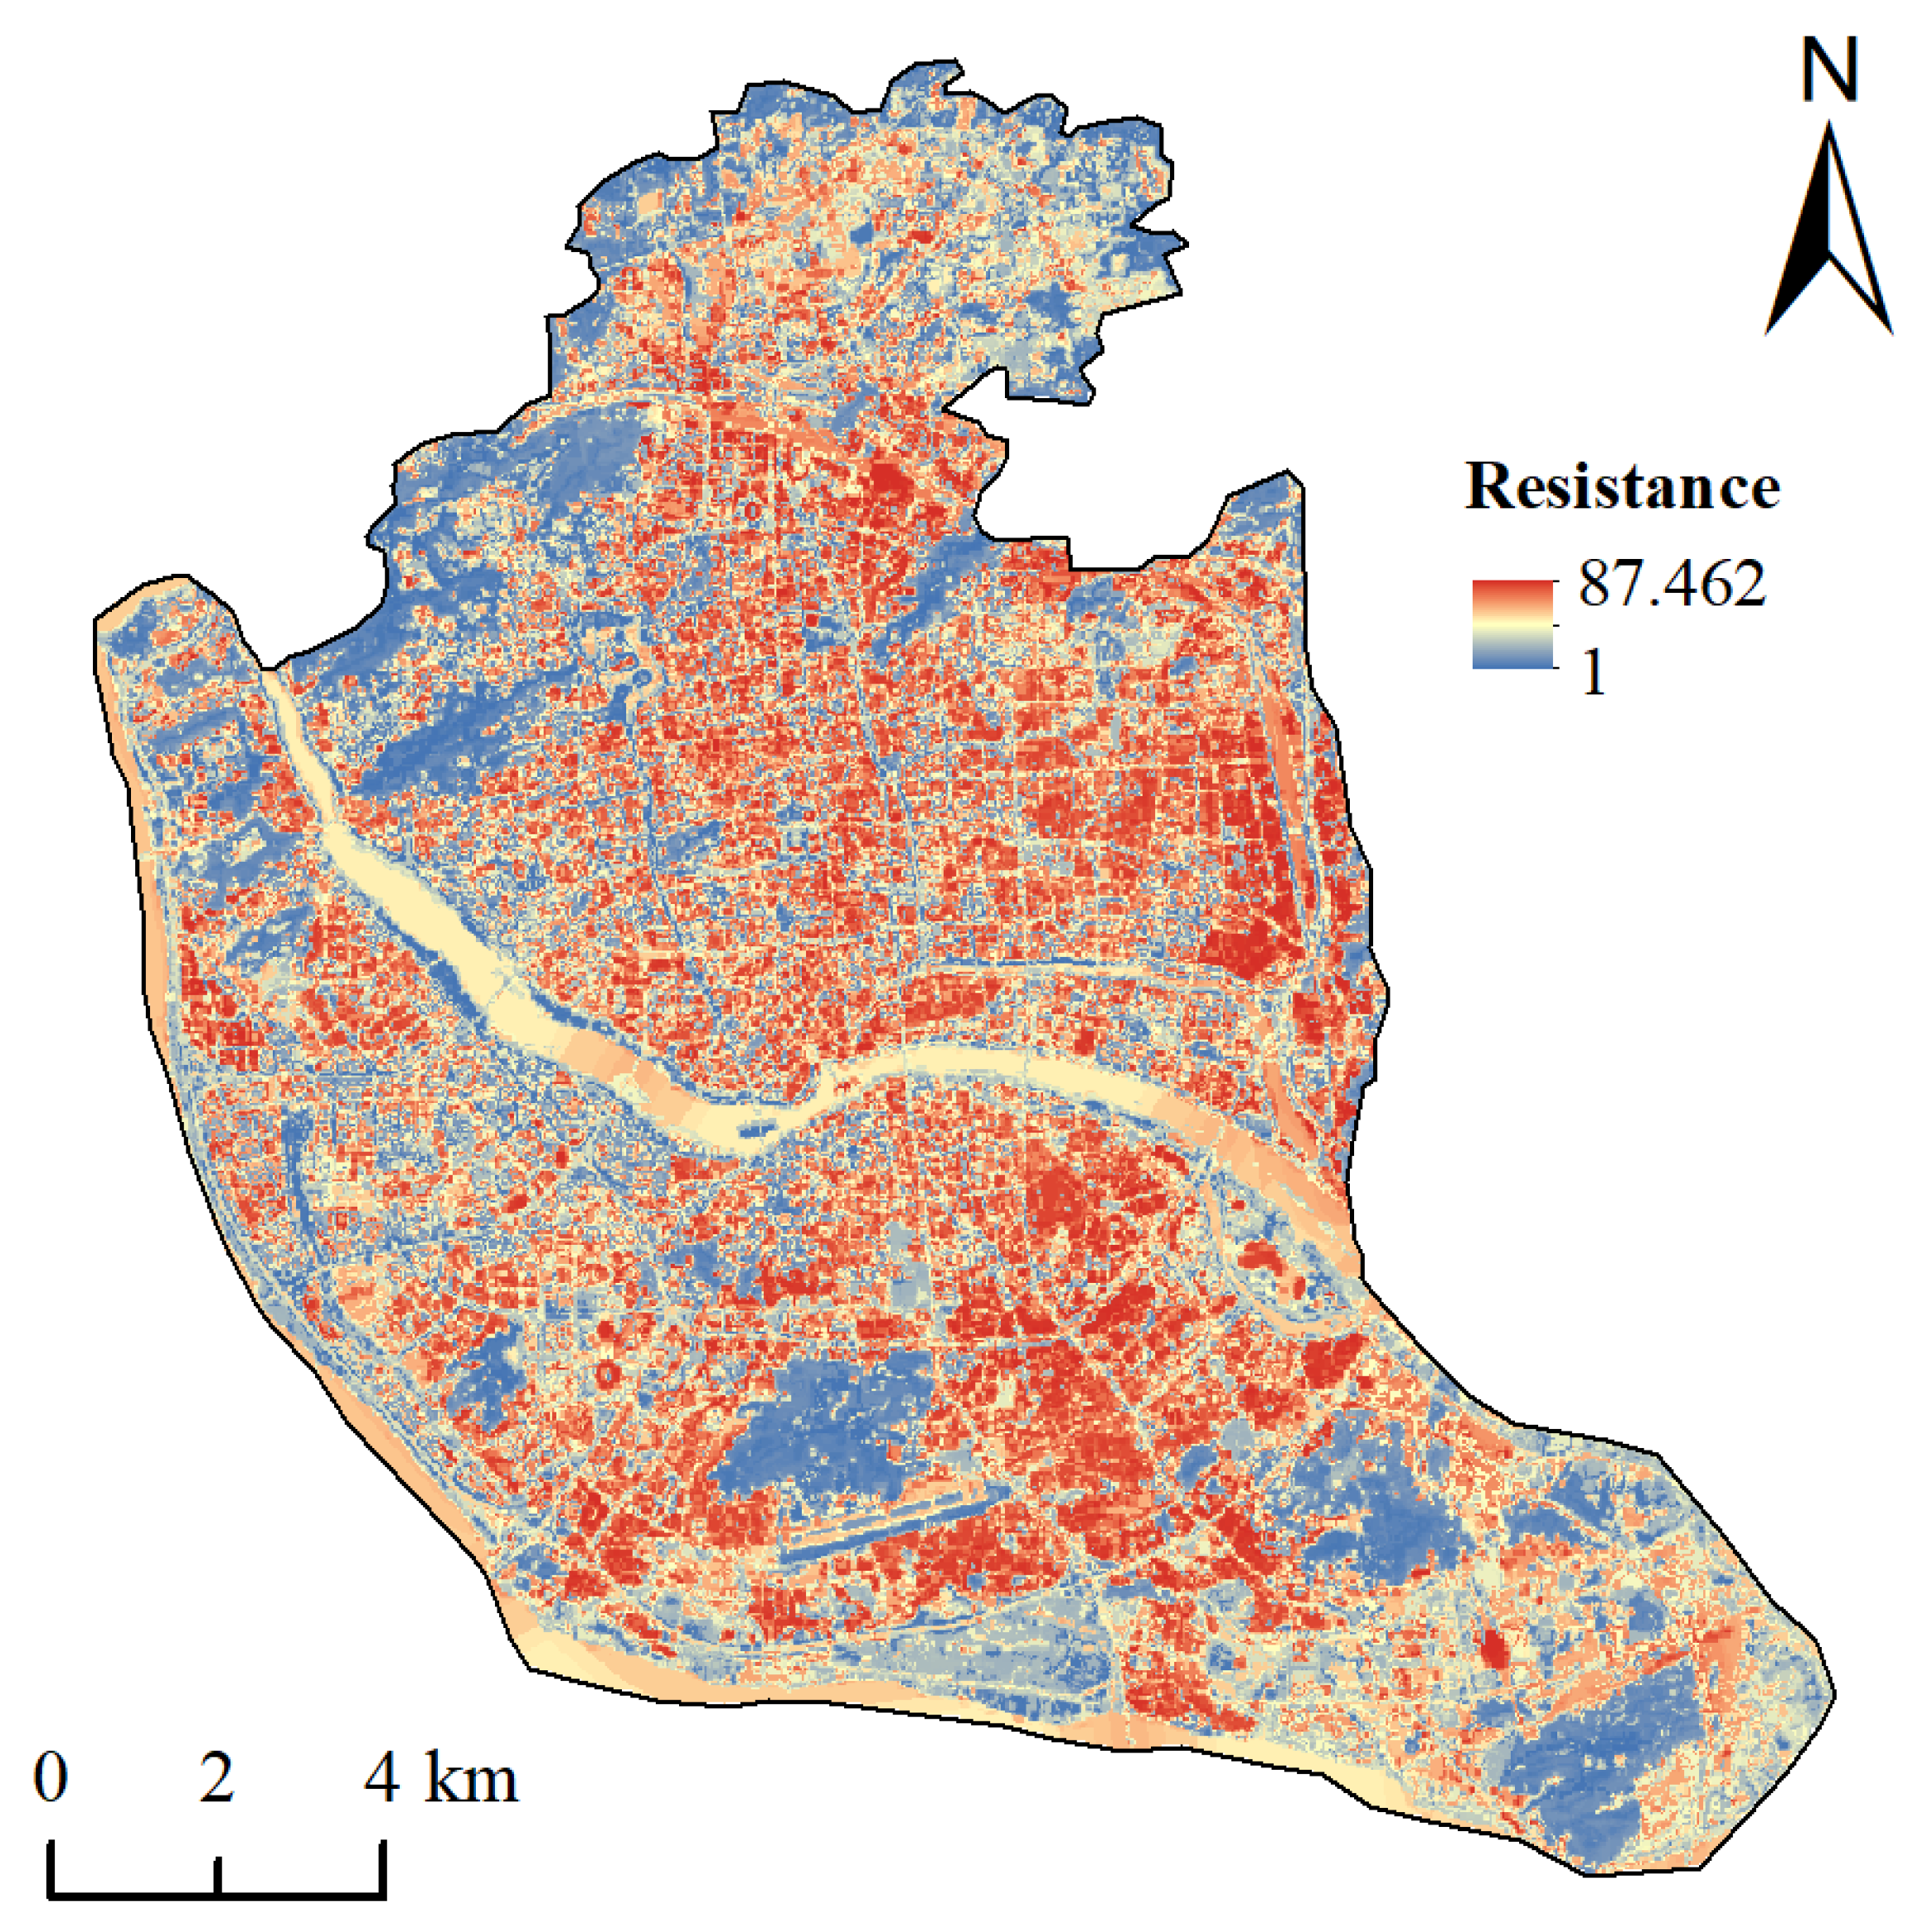
The integrated resistance surface was constructed by weighted superposition of a total of ten resistance factors (Figure 7); the weights of each factor were calculated using AHP-PCA, and the mean value was taken as its final weight. Spatially, the low resistance value areas are mainly located in the mountains of Fuzhou City, the banded green areas along the river, and the city parks. The high resistance value areas are mainly concentrated in the east-central and southern parts of the study area. This is mainly due to the higher building density and lower ecological quality in this area.
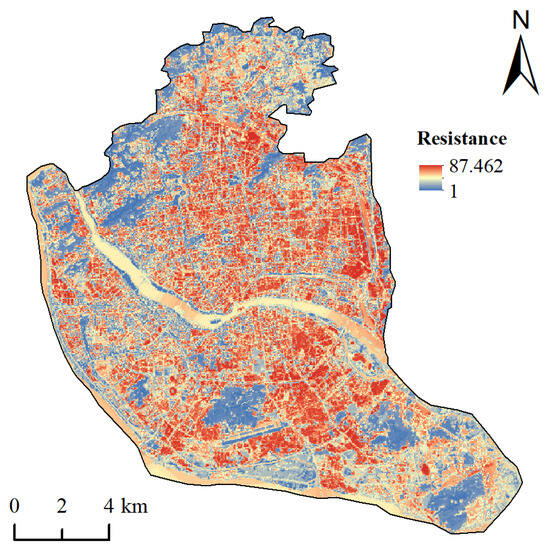
Figure 7.
Integrated resistance surfaces in the study area.
3.5. Construction of Ecological Network in Fuzhou City
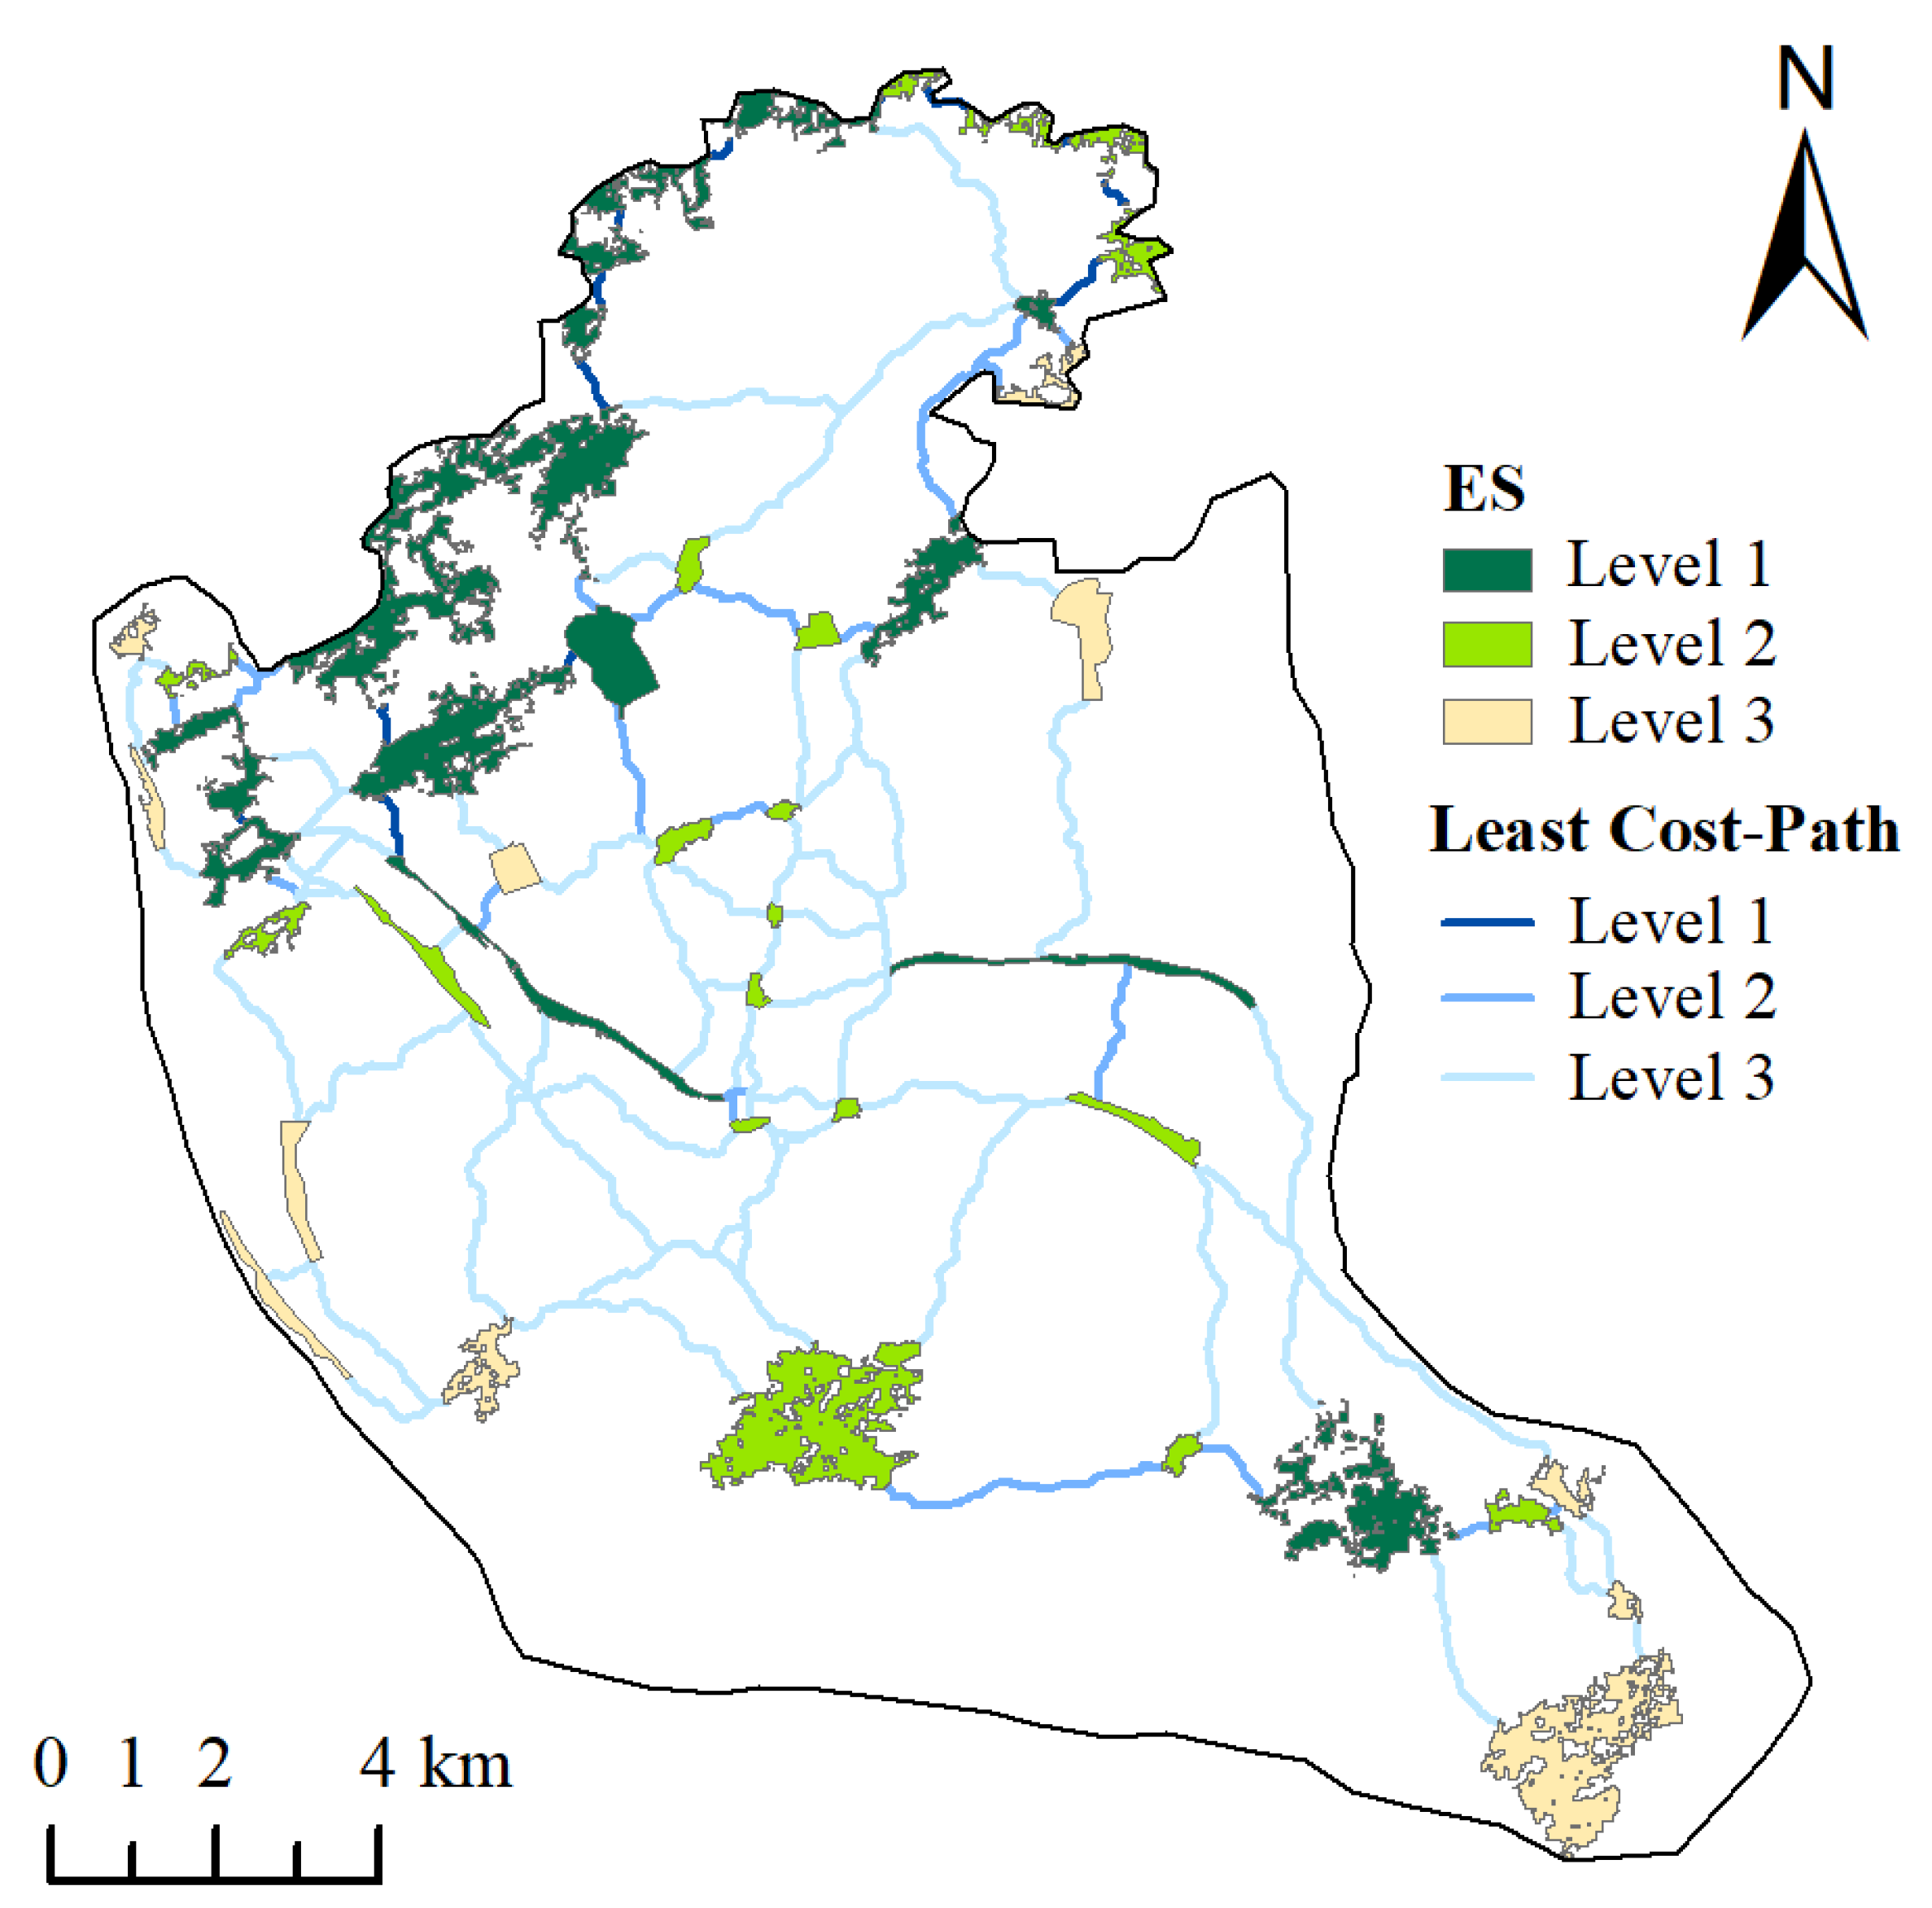
Based on the results of the above analyses, we used the Linkage Mapper tool to construct the ecological network of Fuzhou City under the influence of a total of ten factors (Figure 8). These corridors were mainly distributed in the central and northwestern regions of the study area, because the central and western regions have more urban parks and green spaces. We extracted a total of 92 corridors, with an average length of 1.99 km, with the longest being 7.89 km and the shortest being only 0.08 km. This reflects that the ecological sources in Fuzhou City are close to each other but lack certain connections.
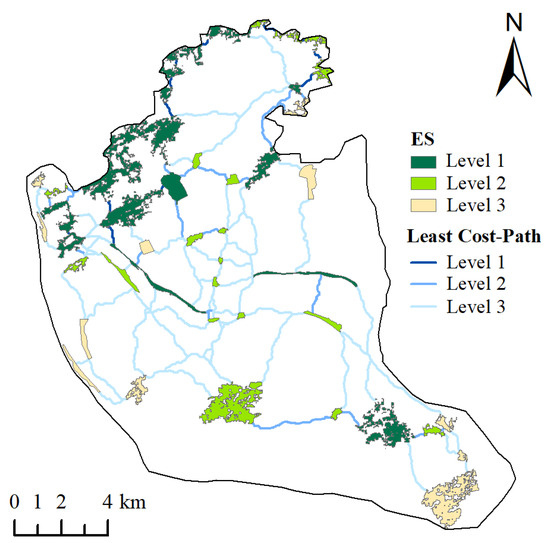
Figure 8.
Ecological network of Fuzhou City.
Meanwhile, we used Centrality Mapper to conduct centrality analysis of ecological sources and corridors to identify important corridors. The 92 extracted corridors and 44 ecological sources were classified into three levels based on current centrality, including 13 first-level corridors, 21 second-level corridors, and 58 third-level corridors and 14 first-level ecological sources, 19 second-level ecological sources, and 11 third-level ecological sources. Spatially, the Grade 1 corridors and Grade 1 ecological source areas are mainly distributed in the northwestern area, which bear the responsibility of maintaining the ecological security of the whole of Fuzhou City. Anthropogenic development should be restricted and protected to reduce anthropogenic interference. On the other hand, the secondary corridors have relatively weak currents and are distributed in the central area of the city, which is an important carrier connecting the primary and secondary patches, and plays an important role in enhancing the biodiversity of the city. Tertiary corridors are the corridors with the lowest current density, which are mainly concentrated in the central area of the city. They should be attached to the existing roads and should be renovated and upgraded with street greening in order to promote the connectivity of the overall network.
3.6. Identification of Ecological Network Pinch Points and Barrier Points
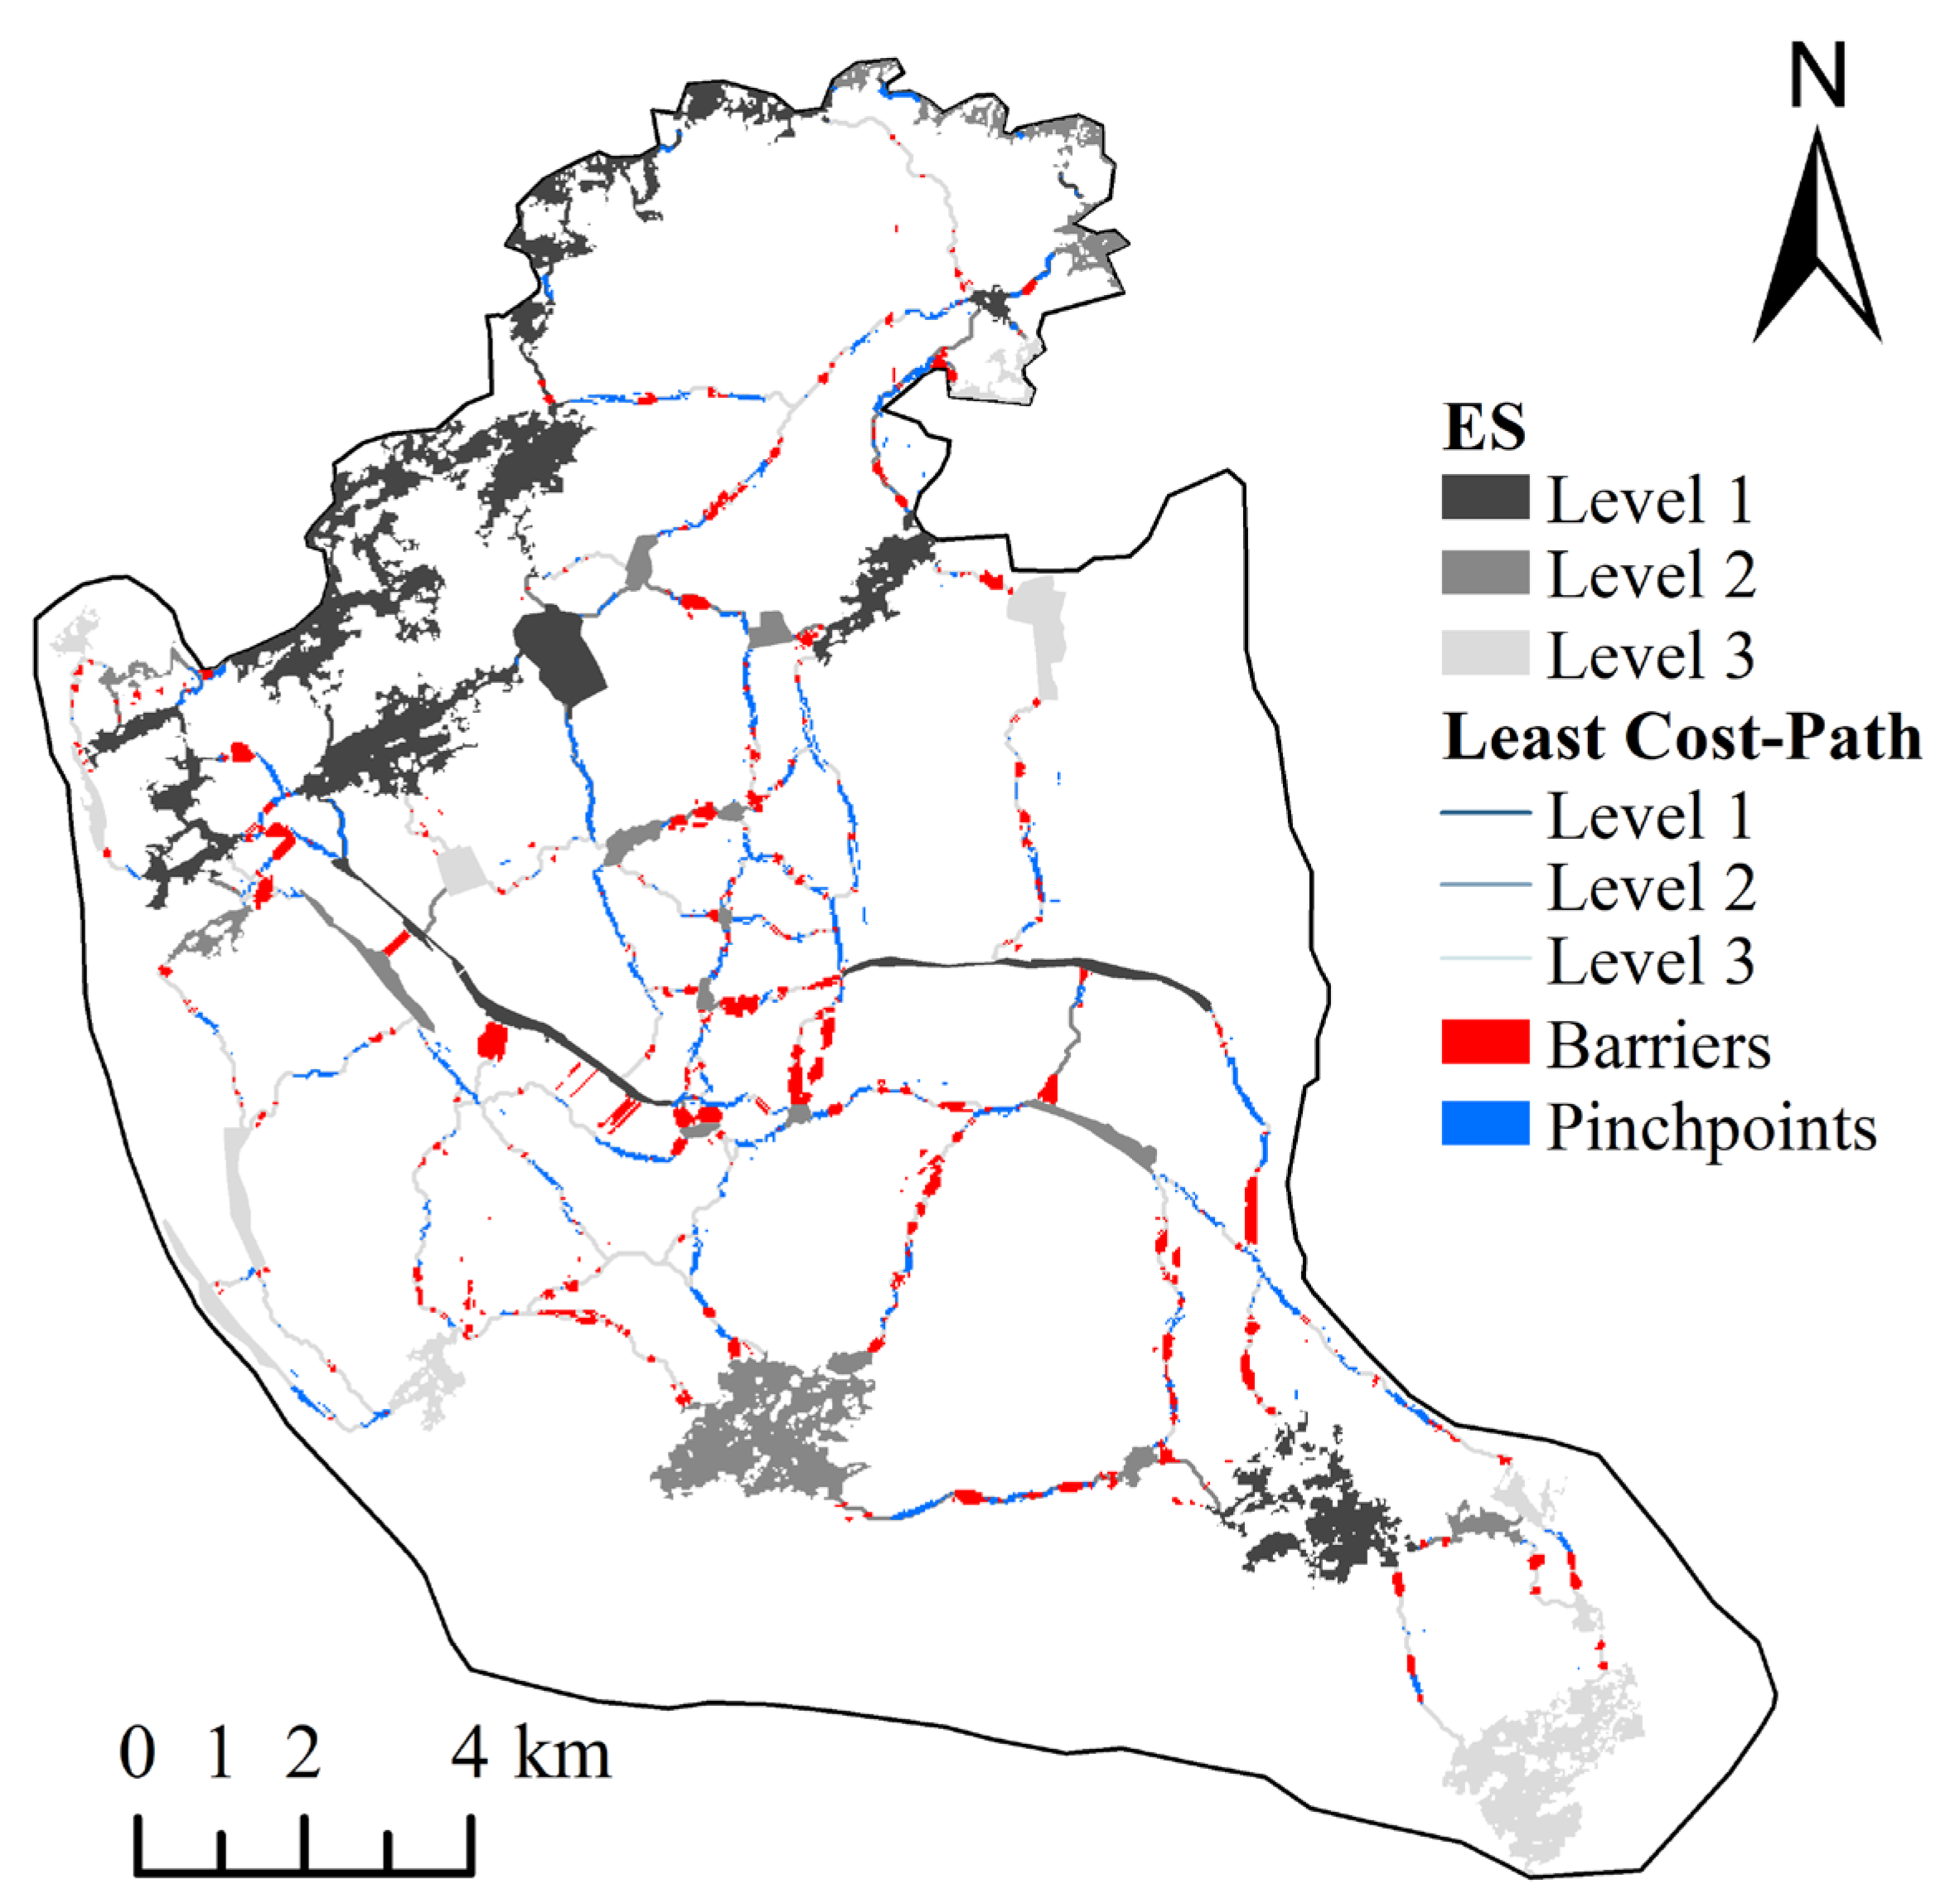
By using the Circuitscape programme, we identified the “pinch points” and barrier points in the study area using the Pinchpoint Mapper and Barrier Mapper (Figure 9 and Figure 10). A “pinch point” means that the current mobility is high in that area, which plays an important role in the overall connectivity of the network. Barrier points mean that the barriers in the area are high and need to be repaired and improved.
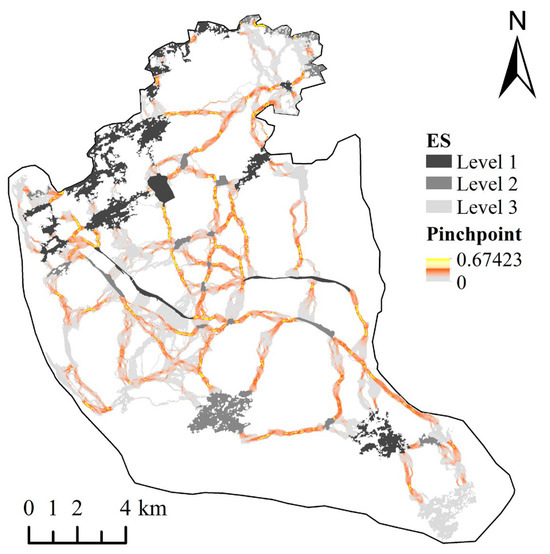
Figure 9.
Pinchpoint Mapper-based “pinch point” recognition.
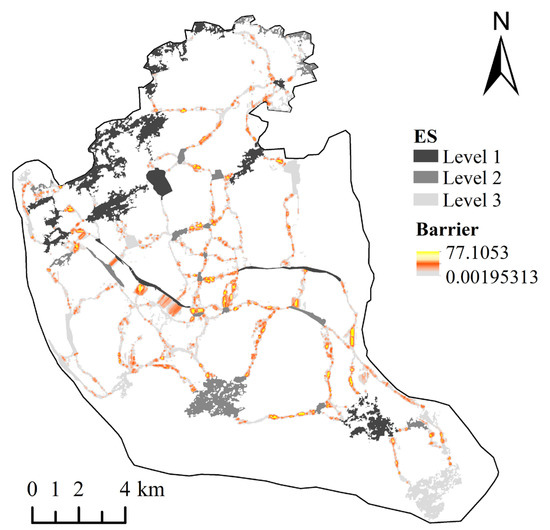
Figure 10.
Barrier Mapper-based barrier point identification.
We classified the “pinch points” and barrier points into three levels using the natural breakpoint method, and extracted the highest level as the priority area for improvement (Figure 11). The “pinch points” and barrier points are mainly located in the second- and third-level corridors in the city centre, of which the area of the “pinch points” is 2.56 km2 and the area of the barrier points is 3.54 km2. In addition, we counted the land use types in the areas where the “pinch points” and barrier points are located, and the land use types in the areas where the “pinch points” and barrier points are located. In addition, we counted the land use types in the areas where the “pinch points” and barrier points are located (Table 5), and the contribution of forest land to the connectivity of the overall ecological network is greater, while built-up land and excessively wide water bodies are more important barrier points to the ecological network.
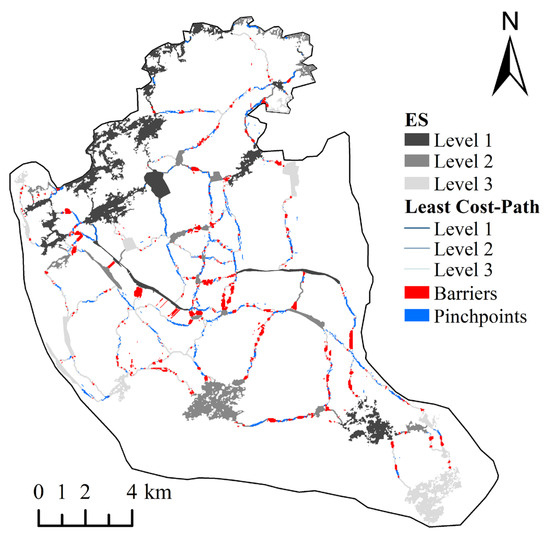
Figure 11.
Spatial distribution of ecological networks, barrier points, and “pinch points” in Fuzhou City.

Table 5.
Land use composition of “pinch points” and barrier points.
3.7. Changes in Landscape Connectivity under Different Development Scenarios
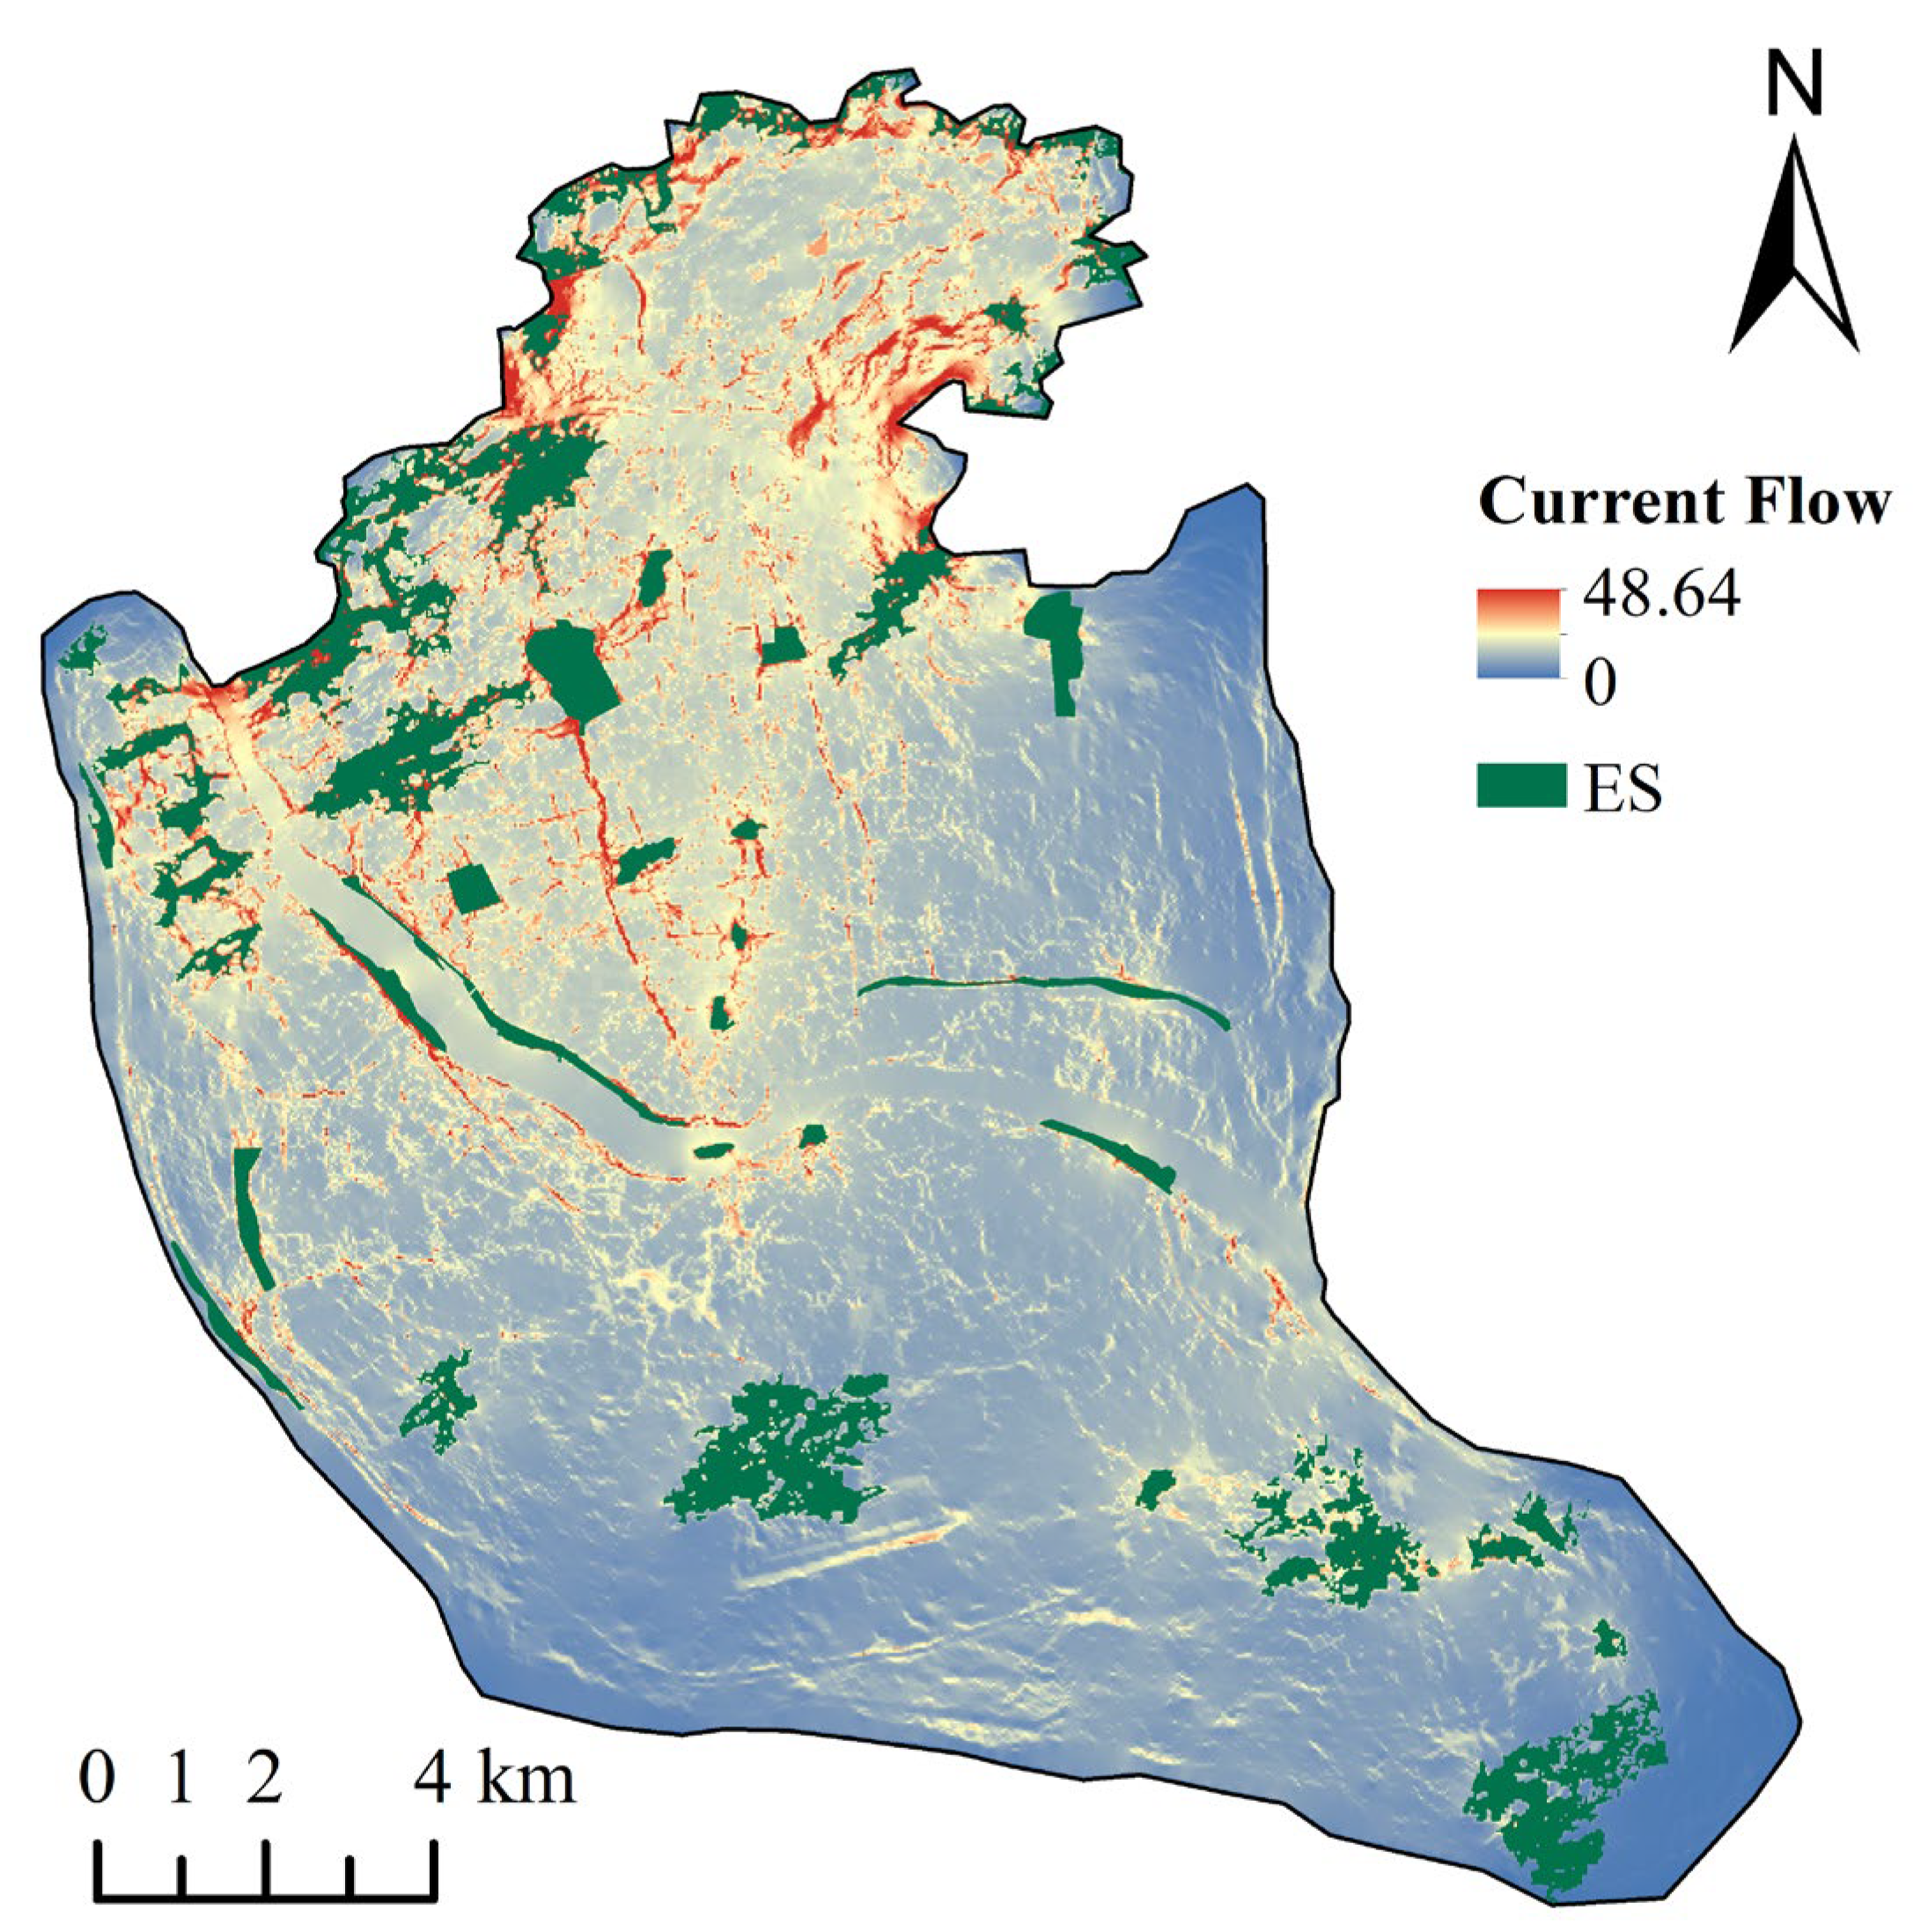
We defined the current status of the ecological network as Scenario I, the bare land before 10% improvement as Scenario II, and the bare land before 30% improvement as Scenario III. Landscape connectivity simulations under different development modes were carried out using Circuitscape software (Figure 12, Figure 13 and Figure 14). Among them, Scenario II planned to convert 26.02 km2 of bare land into green space, and the area to be improved was mainly distributed in the southern part of the study area; Scenario III planned to convert 74.78 km2 of bare land into green space, and the area to be improved was mainly distributed in the southern and northern parts of the study area. The mean values of current density under the three scenarios of different development modes are 1.73, 3.17, and 23.62, respectively; it can be seen that Scenario III has the highest current density and the best connectivity.
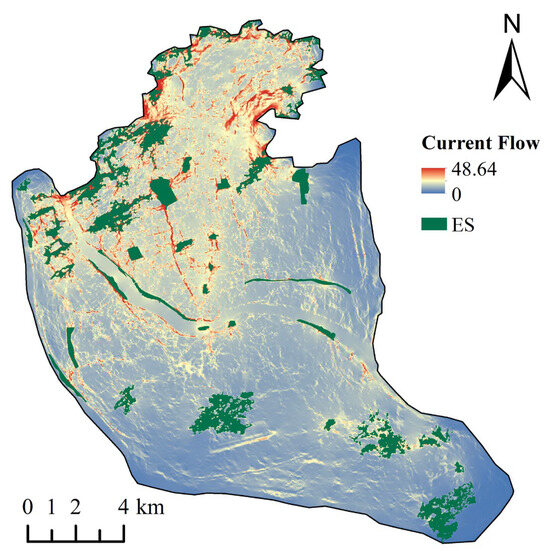
Figure 12.
Scenario I current density.
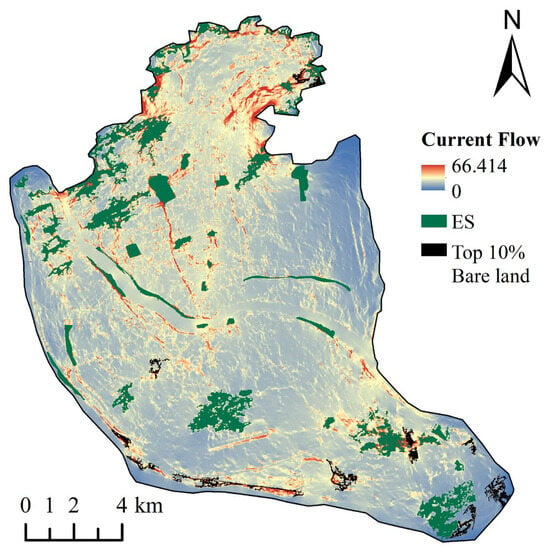
Figure 13.
Scenario II current density.
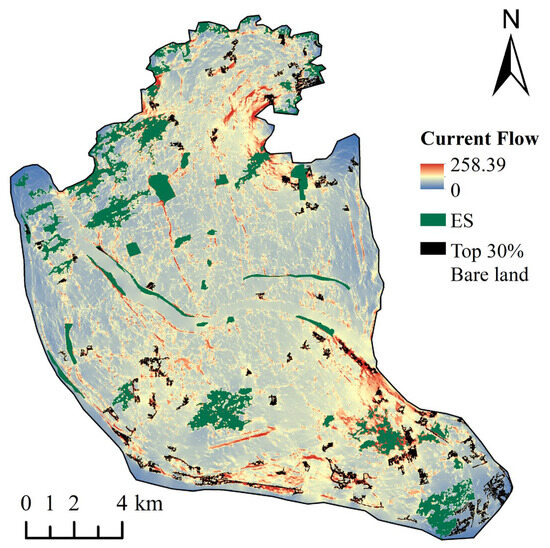
Figure 14.
Scenario III current density.
4. Discussion
4.1. Methodology for the Construction of High-Density Urban Ecological Networks
Building ecological networks in high-density urban areas is one of the most important ways to enhance the urban ecological environment and promote sustainable urban development [11,70]. However, the complex landscape types and unavoidable anthropogenic disturbances within the city have led to the fragmentation of the ecological land in the city. Therefore, relying only on MSPA to identify ecological sources is not comprehensive enough. We used the Remote Sensing Ecological Index to assess the ecological environment of the study area, which can effectively identify the source of the “quality” [36]. As can be seen from Figure 3, MSPA identifies ecological sources based on land use, so any area that meets the prospected value is basically extracted. In Figure 4, there are fewer areas with higher RSEI values (0.8~1). This indicates that although it is a core area, there is still a large gap in “quality”. Similarly, as can be seen in Appendix A, Figure A1 and Table A3, the area with higher RSEI values is much smaller compared to the area extracted by MSPA. The blue box in the figure indicates where the Yixu Airport is in Fuzhou City, and the large area of grassland in the middle is considered to be an ecological source land by MSPA. However, RSEI can effectively identify the ecological value of the airport’s grassland by using the integrated evaluation method of greenness, humidity, dryness, and heat, and the results show that its RSEI value is lower than 0.8, so the study of the combination of the MSPA and the RSEI integrated evaluation method for identifying the urban ecological source land has certain superiority.
Secondly, the selection and construction of resistance factors is an important step in the construction research of high-density urban ecological networks. However, related studies only considered factors such as MSPA landscape type, NDVI, and distance from the highway in the selection of resistance factors [13,71]. It did not highlight the main characteristics of high-density cities. Related studies have shown that building density and height in cities are important factors affecting species migration [72]. Therefore, in our study, building density and height were included in the construction of resistance surfaces. On the other hand, although roads are a source of macrofauna mortality and a barrier to movement [73], street greening does provide habitats for some small animals and insects [74]. Therefore, considering the tight land resources in the city and in order to make full use of the existing road green space, this study quantified the greening level of urban roads using streetscape data and added it to the construction of resistance surfaces, which made the integrated resistance surfaces more in line with the connotation of high-density cities.
In addition, in the optimisation of ecological networks, most scholars use gravity models to grade and screen corridors [75]; however, this method only considers the area and distance of ecological sources, which hides the material flow in ecological networks [11]. In this study, the current theory is used to grade the importance of ecological networks and source areas, and the results are conducive to decision makers to take appropriate ecological protection measures. Meanwhile, scholars have proposed the optimisation of high-density urban ecological networks by using “potential green roofs” [15], and the optimisation of urban ecological networks by increasing ecological resources, returning farmland to forests, and repairing barrier sites [76]. This is feasible but costly. Our study investigates the changes in ecological network connectivity under different bare land development modes, and the results show the important role of rational development of bare land on the overall landscape connectivity.
4.2. Integration of Ecological Network Structure and Function
Based on the framework of “source-resistance-network”, this study focuses on the construction and optimisation of ecological networks in high-density central cities. However, when the scope of the study is extended to city clusters, provinces, and larger scales, it is crucial to link the functions of ecological corridors within cities with those of cross-city regions [70]. While studies have been conducted to demonstrate the spatial consistency of different approaches at multiple scales, the areas of consistency mainly cover those dominant habitats at larger scales. Therefore, the authors encourage more refined assessments at sub-scale [77]. Our study focused on the main urban part of Fuzhou City, and in future studies, we can further explore how to achieve the coupling and articulation of the ecological network between the main urban area of Fuzhou City and the provincial scale.
At the same time, the land resources in the city are so expensive that they inevitably lead to the diversity of functions carried out by the urban ecological network. Currently, greenways or ecological corridors in cities are overly pursuing aesthetic and recreational effects, while neglecting ecological benefits [78]. In the present study, we have used greenways and ecological corridors in cities to pursue aesthetic and recreational effects at the expense of ecological benefits. Therefore, in this study, the greenness factor can be used not only to quantify human visual perception and promote visual equity, but also to quantify the level of street greening and provide migratory sites for small species.
The identification and construction of ecological networks is now more mature. However, corridor width criteria are currently unclear. In high-density central urban areas especially, the construction cost of ecological networks needs to be taken into account [79]. Currently, there have been related studies using buffer zones combined with gradient analysis to judge the cost of transformation by measuring the land use composition within different buffer zones. However, high-density urban ecological networks should have composite functions and the corresponding corridor width should be changed due to the different levels, locations, lengths, etc., of the corridors [70].
4.3. Landscape Connectivity of Ecological Corridors
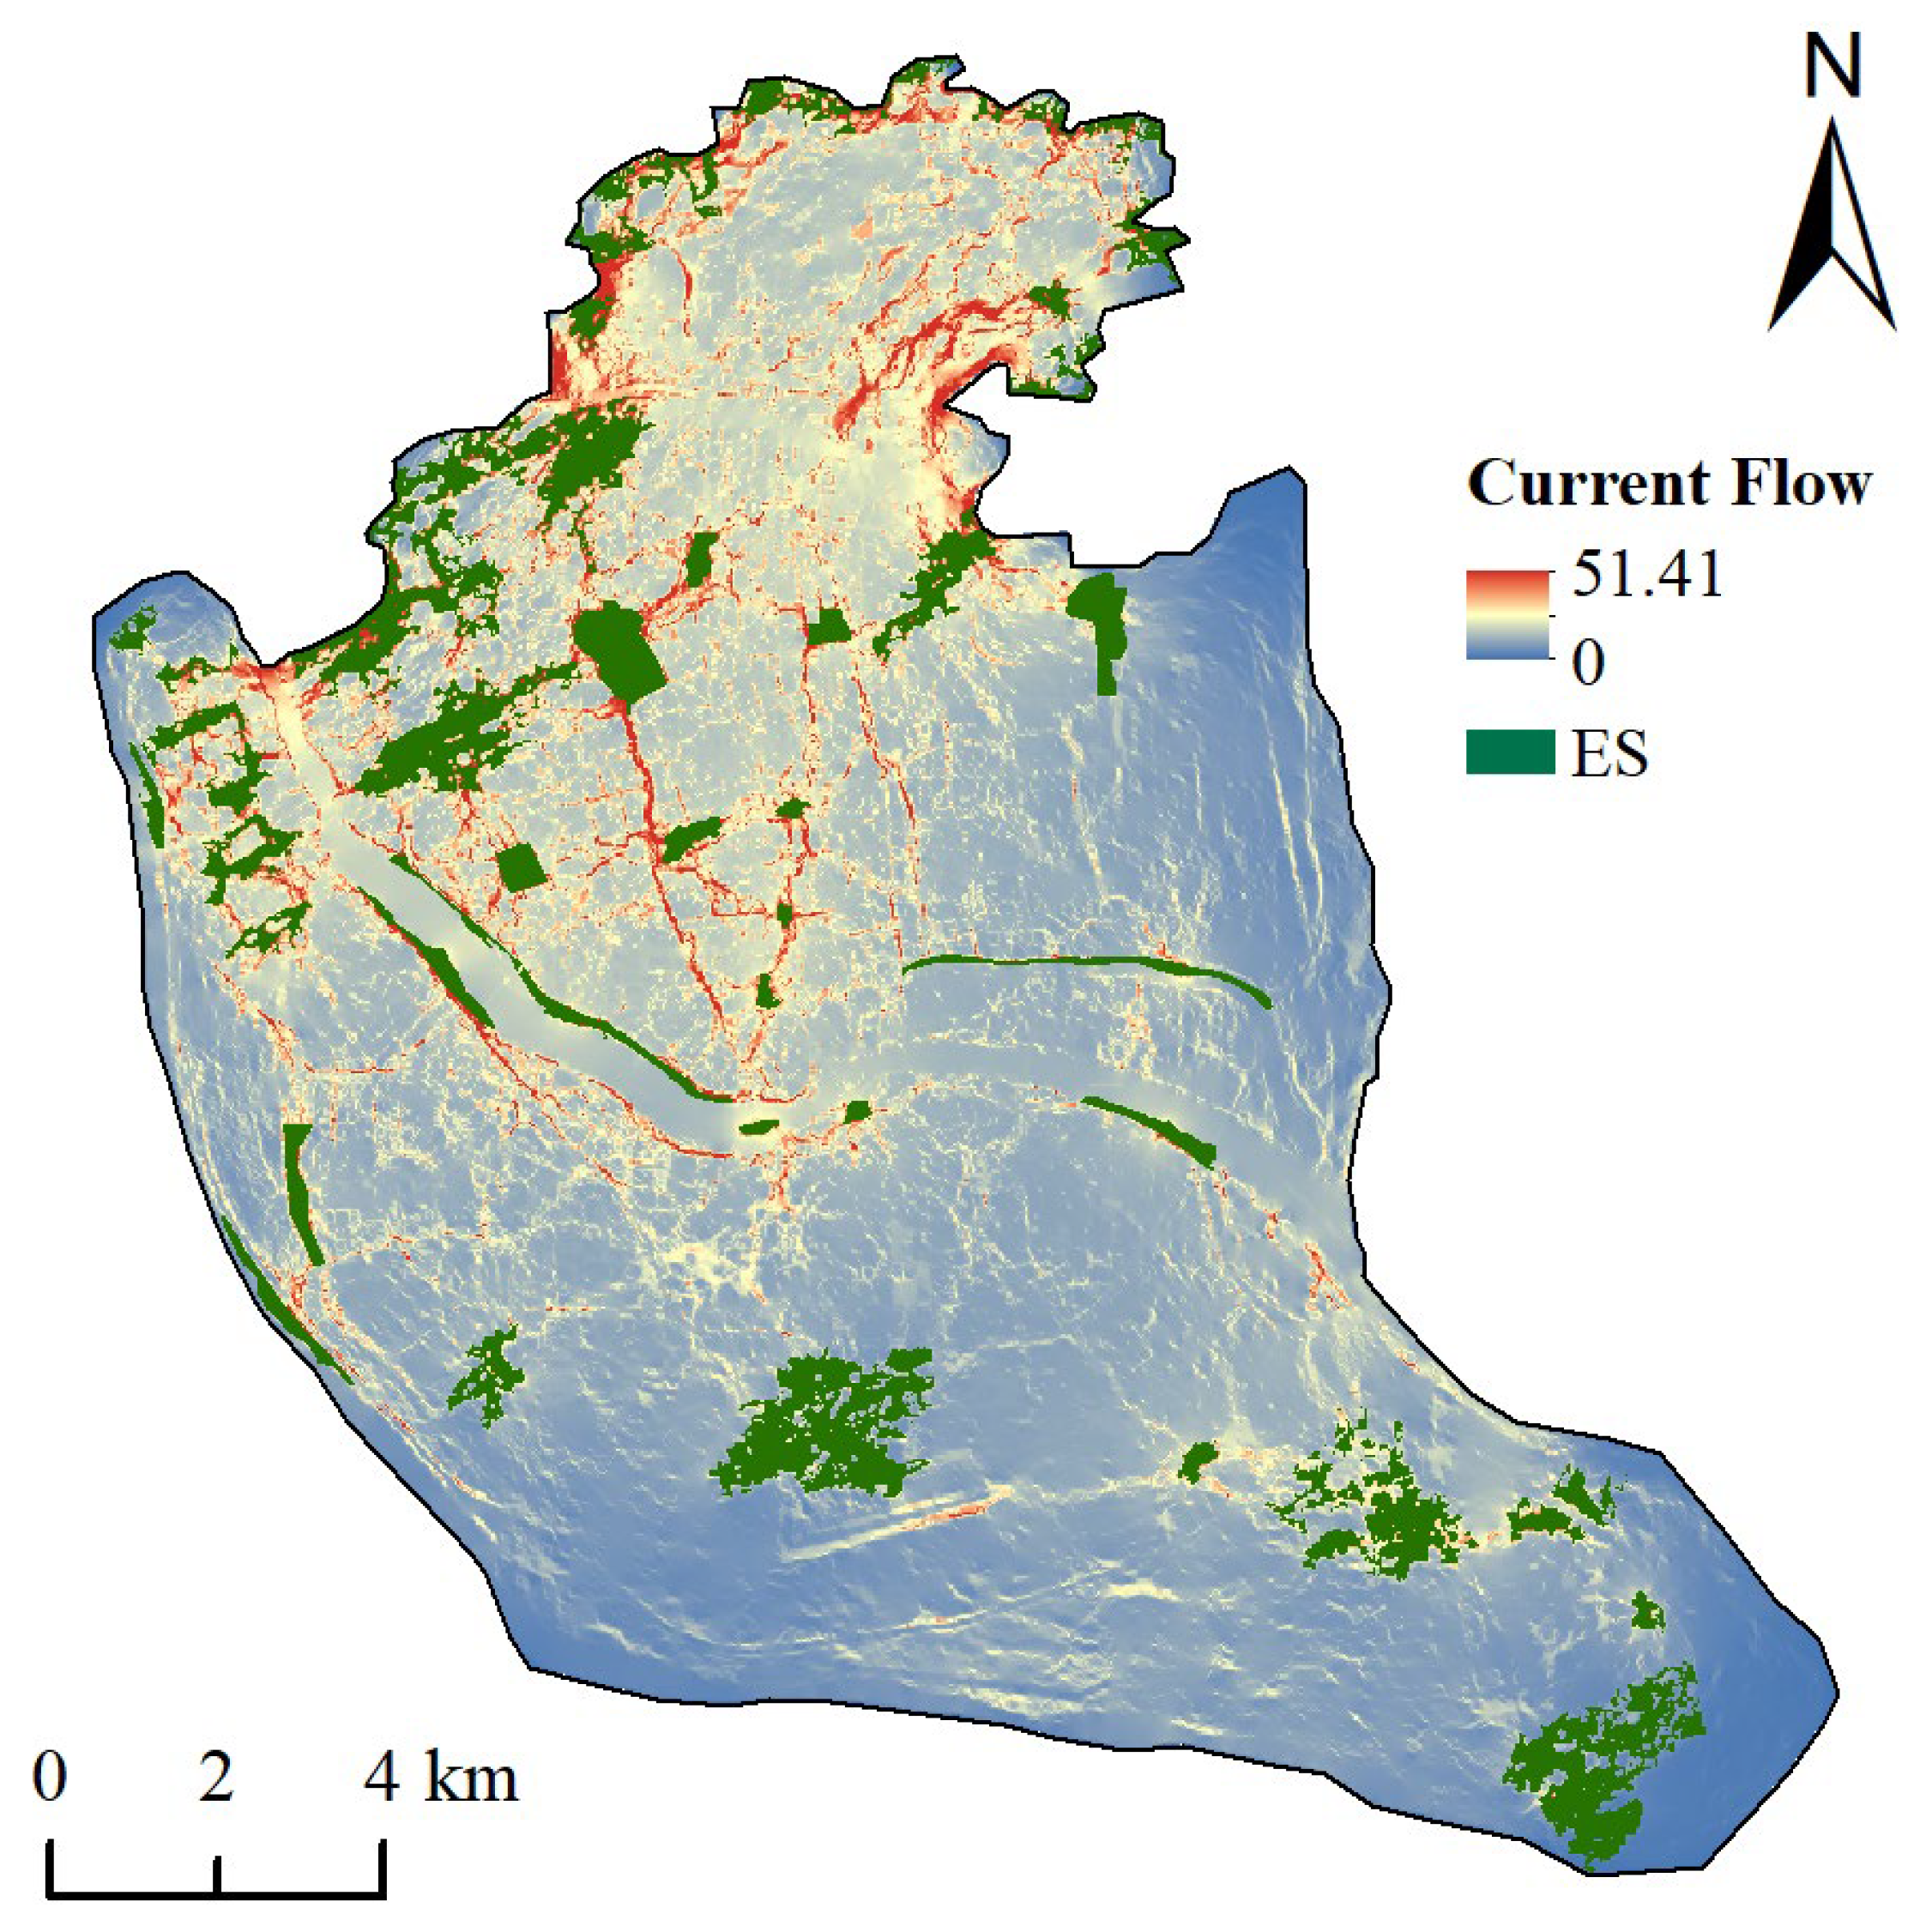
Landscape connectivity of ecological corridors refers to the physical and ecological links between natural as well as artificial landscapes. In cities with fragmented landscape patches, strengthening connectivity between landscape patches is important for maintaining urban biodiversity and alleviating urban ecological problems [80,81]. Urban development and construction have led to the reduction in green patches, and how to improve landscape connectivity in cities is a hot issue nowadays. A case study of a typical high-density urban area within the fifth ring road in Beijing, China, demonstrated that green rooves with high landscape connectivity can effectively improve urban landscape connectivity [15], and a study from Wuhan showed that converting some areas of arable land into forests had the best effect on landscape connectivity after comparing several optimisation models [76]. In our study, we developed bare land into parkland and demonstrated its effect on connectivity. Similarly, we identified some barrier points in the ecological network and assumed that we had carried out ecological restoration of the barrier points, i.e., converting non-ecological land in the area of the barrier points into woodland, which was found to be less effective than the development of bare land as an ecological source, i.e., under Scenario III, through the simulation study of connectivity (Figure A2).
4.4. Limitations and Prospects
Taking Fuzhou City in China as an example, our study proposes a way to identify ecological source sites that combines landscape structure and ecological function. Meanwhile, we constructed and optimised the ecological network of Fuzhou City by combining the characteristics of a high-density city, but there are still some shortcomings. For example, the parameter settings of MSPA as well as the connectivity index mainly refer to relevant research results. In future studies, the different identification results brought by different threshold settings should be further analysed. In addition, combining the simulation and prediction of land use/cover to analyse the changes in landscape patterns before and after the construction of ecological networks, so as to further quantify the ecological value of ecological networks, should be the focus of our attention.
5. Conclusions
Considering the contradiction between the construction of ecological networks in high-density urban areas and the intensification of land resources, this study provides a new approach for the construction and optimisation of urban ecological networks from the selection of source sites and the construction of resistance surfaces, and it explores the changes in landscape connectivity under different development scenarios. It also provides new ideas for the construction and optimisation of urban ecological networks by taking the central city of Fuzhou as an example. The main conclusions are as follows:
- I.
- Compared with a single evaluation method, an integrated method based on landscape structure and ecological function can better identify urban ecological source areas.
- II.
- The ecological network of Fuzhou city centre consists of 44 ecological source sites and 92 corridors.
- III.
- By comparing multiple optimisation options, transforming the top 30% of bare land patches into green spaces or parks has the greatest effect on improving the connectivity of the ecological network in Fuzhou City. This study can provide decision-making assistance and a reference for urban landscape and ecological planning.
Author Contributions
Conceptualisation, J.G.; methodology, J.G., Z.X. and Q.Z; software, J.G. and Z.X.; validation, M.S., J.G. and K.Y.; formal analysis, J.G. and Z.X.; investigation, J.G. and Z.X.; resources, K.Y. and Q.Z.; data curation, Y.W. and R.H.; writing—original draft preparation, J.G.; writing—review and editing, M.S., K.Y. and J.L.; visualisation, M.S., J.G., Z.X., Y.W. and R.H.; supervision, J.L.; project administration, J.L.; funding acquisition, J.L. All authors have read and agreed to the published version of the manuscript.
Funding
This work was supported by the Reconstructing NDVI and Remote Sensing Quantifying Net Primary Production Based on The Spatial Vertical Structure of “Canopy-Shrub-Herb” (32271876).
Data Availability Statement
The data that support the findings of this study are available from the author upon reasonable request.
Conflicts of Interest
The authors declare no conflict of interest.
Appendix A

Table A1.
NDVI, WET, LST, and NDBSI calculation formulae and explanations.
Table A1.
NDVI, WET, LST, and NDBSI calculation formulae and explanations.
| Indicator | Calculation Method | Explanation |
|---|---|---|
| NDVI | and for the near-infrared band and the red band, respectively. | |
| WET | correspond to the reflectance of TM and OLI remote sensing images in the blue, green, red, near-infrared, short-wave infrared 1, and short-wave infrared 2 bands, respectively. | |
| LST | Gain and bias are the transmittance of the atmosphere in the thermal infrared band, the central wavelength (λ) is 11.48 μm, α is 1.438 × 10⁻² mK, ε6 is the surface emissivity of band 6, and K1 and K2 are the scaling coefficients obtained in the metadata of the image. are the scaling coefficients obtained in the metadata of the image. | |
| NDBSI | IBI is the index-based build-up index, SI is the soil index, and the other bands are interpreted as above. |

Table A2.
Area, DPC, and RSEI mean values for each park.
Table A2.
Area, DPC, and RSEI mean values for each park.
| Number | Park Name | Area/km2 | DPC | RSEI Mean |
|---|---|---|---|---|
| 1 | Niugangshan Park | 0.5715 | 11.1296 | 0.6395 |
| 2 | Huahai Rark | 0.2727 | 2.5342 | 0.6143 |
| 3 | Guangminggang Park | 0.3998 | 5.4456 | 0.6040 |
| 4 | Wenquan Park | 0.1679 | 0.961 | 0.6941 |
| 5 | Pingshan Park | 0.1680 | 6.9882 | 0.7268 |
| 6 | Xihu Park | 0.8281 | 29.3922 | 0.7261 |
| 7 | Minjiang Park | 0.2863 | 13.9258 | 0.7166 |
| 8 | Jinshan Park | 0.3368 | 8.868 | 0.8646 |
| 9 | Yushan Park | 0.0615 | 0.6269 | 0.7410 |
| 10 | Wushan Park | 0.1877 | 1.6985 | 0.7890 |
| 11 | Xichansi | 0.2489 | 11.4256 | 0.6931 |
| 12 | Jiangbing Park | 0.4910 | 28.7833 | 0.6851 |
| 13 | Jiangxin Park | 0.0614 | 5.1491 | 0.7834 |
| 14 | Qiulong Park | 0.0714 | 0.2999 | 0.6394 |
| 15 | Chating Park | 0.0391 | 0.2185 | 0.8208 |
| 16 | Shatan Park | 0.1658 | 0.9366 | 0.6144 |
| 17 | Wulongjian Park | 0.3195 | 8.4819 | 0.7705 |
| 18 | Yantaishan Park | 0.0644 | 2.1617 | 0.6100 |
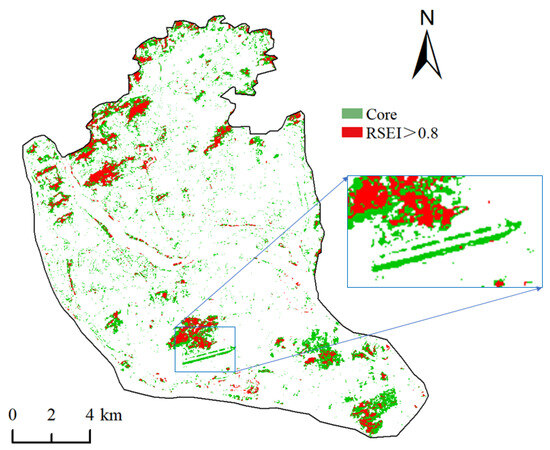
Figure A1.
Localised enlargement of MSPA and RSEI results.
Figure A1.
Localised enlargement of MSPA and RSEI results.
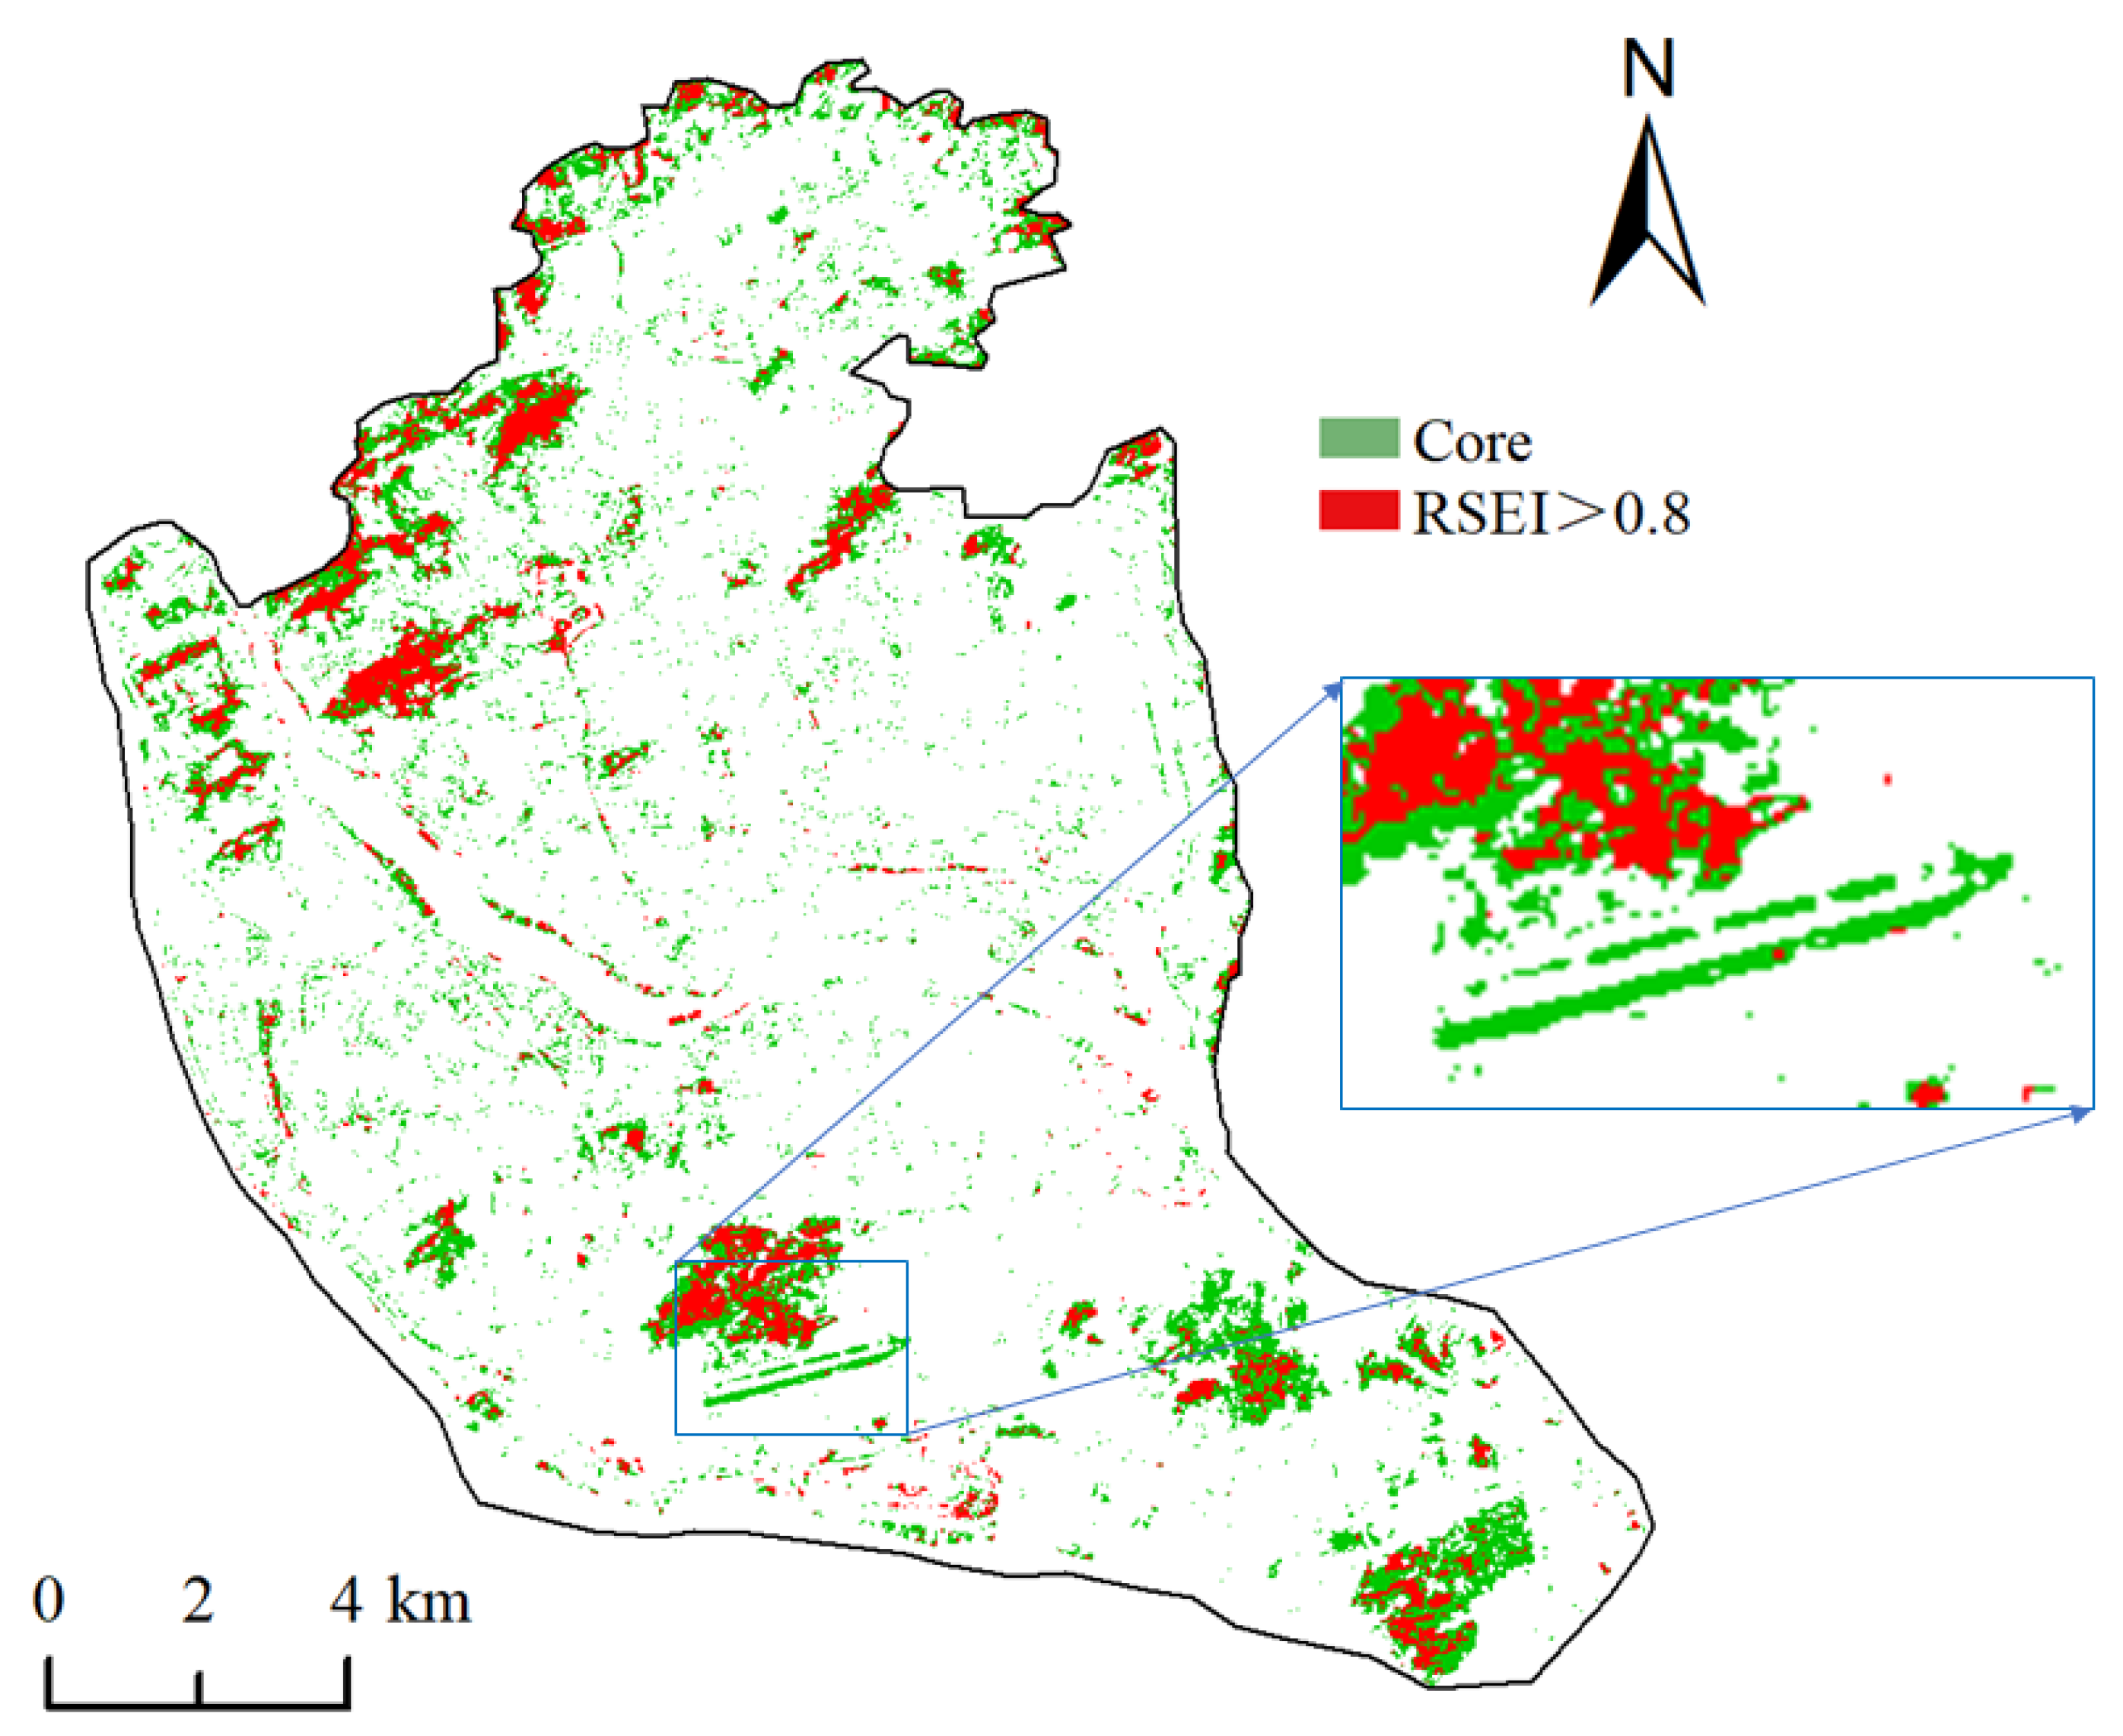

Table A3.
Area statistics for MSPA core areas and areas with RSEI greater than 0.8.
Table A3.
Area statistics for MSPA core areas and areas with RSEI greater than 0.8.
| Types | Area/km2 |
|---|---|
| Core | 30.6102 |
| RSEI > 0.8 | 10.7127 |
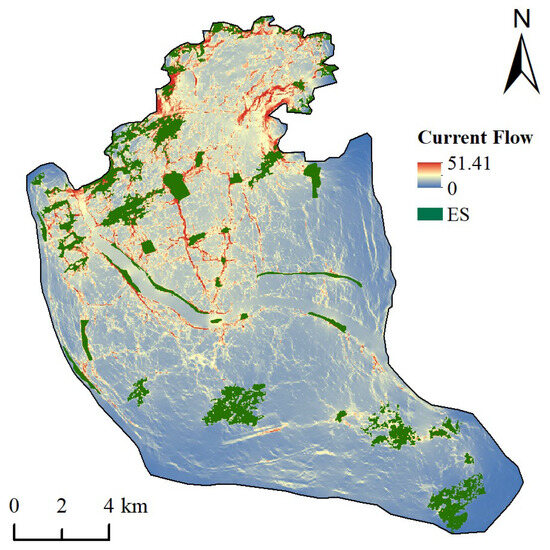
Figure A2.
Current density after repairing barrier points.
Figure A2.
Current density after repairing barrier points.
References
- Chan, R.C.; Shimou, Y. Urbanization and sustainable metropolitan development in China: Patterns, problems and prospects. Geojournal 1999, 49, 269–277. [Google Scholar] [CrossRef]
- Feng, Y.; He, S.; Li, G. Interaction between urbanization and the eco-environment in the Pan-Third Pole region. Sci. Total Environ. 2021, 789, 148011. [Google Scholar] [CrossRef]
- People’s Republic of China; National Bureau of Statistics. China Statistical Yearbook 2002; (Chinese-English Edition); China Statistics Press: Beijing, China, 2002. [Google Scholar]
- Rajé, F.; Tight, M.; Pope, F.D. Traffic pollution: A search for solutions for a city like Nairobi. Cities 2018, 82, 100–107. [Google Scholar] [CrossRef]
- Narh, S.N.; Takyi, S.A.; Asibey, M.O.; Amponsah, O. Garden city without parks: An assessment of the availability and conditions of parks in Kumasi. Urban For. Urban Green. 2020, 55, 126819. [Google Scholar] [CrossRef]
- Gandy, M. Cities in deep time: Bio-diversity, metabolic rift, and the urban question. City 2018, 22, 96–105. [Google Scholar] [CrossRef]
- Fahrig, L. Effects of habitat fragmentation on biodiversity. Annu. Rev. Ecol. Evol. Syst. 2003, 34, 487–515. [Google Scholar] [CrossRef]
- Ignatieva, M.; Stewart, G.H.; Meurk, C. Planning and design of ecological networks in urban areas. Landsc. Ecol. Eng. 2011, 7, 17–25. [Google Scholar] [CrossRef]
- Aminzadeh, B.; Khansefid, M. A case study of urban ecological networks and a sustainable city: Tehran’s metropolitan area. Urban Ecosyst. 2010, 13, 23–36. [Google Scholar] [CrossRef]
- Cui, L.; Wang, J.; Sun, L.; Lv, C. Construction and optimization of green space ecological networks in urban fringe areas: A case study with the urban fringe area of Tongzhou district in Beijing. J. Clean. Prod. 2020, 276, 124266. [Google Scholar] [CrossRef]
- Wang, Y.; Qu, Z.; Zhong, Q.; Zhang, Q.; Zhang, L.; Zhang, R.; Yi, Y.; Zhang, G.; Li, X.; Liu, J. Delimitation of ecological corridors in a highly urbanizing region based on circuit theory and MSPA. Ecol. Indic. 2022, 142, 109258. [Google Scholar] [CrossRef]
- Zhu, Y. Environmental impacts of rapid urbanization in China: A showcase of recent research developments. Environ. Sci. Pollut. Res. 2012, 19, 1351. [Google Scholar] [CrossRef]
- Huang, X.; Wang, H.; Shan, L.; Xiao, F. Constructing and optimizing urban ecological network in the context of rapid urbanization for improving landscape connectivity. Ecol. Indic. 2021, 132, 108319. [Google Scholar] [CrossRef]
- Wang, T.; Li, H.; Huang, Y. The complex ecological network’s resilience of the Wuhan metropolitan area. Ecol. Indic. 2021, 130, 108101. [Google Scholar] [CrossRef]
- Dong, J.; Guo, F.; Lin, M.; Zhang, H.; Zhu, P. Optimization of green infrastructure networks based on potential green roof integration in a high-density urban area—A case study of Beijing, China. Sci. Total Environ. 2022, 834, 155307. [Google Scholar] [CrossRef]
- Dong, J.; Peng, J.; Liu, Y.; Qiu, S.; Han, Y. Integrating spatial continuous wavelet transform and kernel density estimation to identify ecological corridors in megacities. Landsc. Urban Plan. 2020, 199, 103815. [Google Scholar] [CrossRef]
- Zhang, R.; Zhang, Q.; Zhang, L.; Zhong, Q.; Liu, J.; Wang, Z. Identification and extraction of a current urban ecological network in Minhang District of Shanghai based on an optimization method. Ecol. Indic. 2022, 136, 108647. [Google Scholar] [CrossRef]
- Wang, S.; Wu, M.; Hu, M.; Fan, C.; Wang, T.; Xia, B. Promoting landscape connectivity of highly urbanized area: An ecological network approach. Ecol. Indic. 2021, 125, 107487. [Google Scholar] [CrossRef]
- Hong, W.; Guo, R.; Li, X.; Liao, C. Measuring urban ecological network resilience: A disturbance scenario simulation method. Cities 2022, 131, 104057. [Google Scholar] [CrossRef]
- App, M.; Strohbach, M.W.; Schneider, A.; Schroeder, B. Making the case for gardens: Estimating the contribution of urban gardens to habitat provision and connectivity based on hedgehogs (Erinaceus europaeus). Landsc. Urban Plan. 2022, 220, 104347. [Google Scholar] [CrossRef]
- Little, C.E. Greenways for America; JHU Press: Baltimore, MA, USA, 1995. [Google Scholar]
- Liu, S.L.; Hou, X.Y.; Yin, Y.J.; Cheng, F.Y.; Zhang, Y.Q.; Dong, S.K. Research progress on landscape ecological networks. Acta Ecol. Sin. 2017, 37, 3947–3956. [Google Scholar]
- Chen, C.; Shi, L.; Lu, Y.; Yang, S.; Liu, S. The optimization of urban ecological network planning based on the minimum cumulative resistance model and granularity reverse method: A case study of Haikou, China. IEEE Access 2020, 8, 43592–43605. [Google Scholar] [CrossRef]
- Li, Y. Research Progress of Landscape Ecology. J. Landsc. Res. 2021, 13, 67–72. [Google Scholar] [CrossRef]
- Liquete, C.; Kleeschulte, S.; Dige, G.; Maes, J.; Grizzetti, B.; Olah, B.; Zulian, G. Mapping green infrastructure based on ecosystem services and ecological networks: A Pan-European case study. Environ. Sci. Policy 2015, 54, 268–280. [Google Scholar] [CrossRef]
- Zeller, K.A.; McGarigal, K.; Whiteley, A.R. Estimating landscape resistance to movement: A review. Landsc. Ecol. 2012, 27, 777–797. [Google Scholar] [CrossRef]
- Huang, H.; Zhang, M.; Yu, K.; Gao, Y.; Liu, J. Construction of complex network of green infrastructure in smart city under spatial differentiation of landscape. Comput. Commun. 2020, 154, 380–389. [Google Scholar] [CrossRef]
- An, Y.; Liu, S.; Sun, Y.; Shi, F.; Beazley, R. Construction and optimization of an ecological network based on morphological spatial pattern analysis and circuit theory. Landsc. Ecol. 2021, 36, 2059–2076. [Google Scholar] [CrossRef]
- Peng, J.; Yang, Y.; Liu, Y.; Du, Y.; Meersmans, J.; Qiu, S. Linking ecosystem services and circuit theory to identify ecological security patterns. Sci. Total Environ. 2018, 644, 781–790. [Google Scholar] [CrossRef]
- Ma, Q.; Li, Y.; Xu, L. Identification of green infrastructure networks based on ecosystem services in a rapidly urbanizing area. J. Clean. Prod. 2021, 300, 126945. [Google Scholar] [CrossRef]
- Gao, J.; Du, F.; Zuo, L.; Jiang, Y. Integrating ecosystem services and rocky desertification into identification of karst ecological security pattern. Landsc. Ecol. 2021, 36, 2113–2133. [Google Scholar] [CrossRef]
- Avon, C.; Bergès, L. Prioritization of habitat patches for landscape connectivity conservation differs between least-cost and resistance distances. Landsc. Ecol. 2016, 31, 1551–1565. [Google Scholar] [CrossRef]
- Knaapen, J.P.; Scheffer, M.; Harms, B. Estimating habitat isolation in landscape planning. Landsc. Urban Plan. 1992, 23, 1–16. [Google Scholar] [CrossRef]
- McRae, B.H.; Dickson, B.G.; Keitt, T.H.; Shah, V.B. Using circuit theory to model connectivity in ecology, evolution, and conservation. Ecology 2008, 89, 2712–2724. [Google Scholar] [CrossRef] [PubMed]
- Song, L.L.; Qin, M.Z. Identification of ecological corridors and its importance by integrating circuit theory. Ying Yong Sheng Tai Xue Bao J. Appl. Ecol. 2016, 27, 3344–3352. [Google Scholar]
- Hu, X.; Xu, H. A new remote sensing index for assessing the spatial heterogeneity in urban ecological quality: A case from Fuzhou City, China. Ecol. Indic. 2018, 89, 11–21. [Google Scholar] [CrossRef]
- Xu, H.Q. A remote sensing urban ecological index and its application. Acta Ecol. Sin. 2013, 33, 7853–7862. [Google Scholar]
- Hu, C.; Wang, Z.; Wang, Y.; Sun, D.; Zhang, J. Combining MSPA-MCR model to evaluate the ecological network in Wuhan, China. Land 2022, 11, 213. [Google Scholar] [CrossRef]
- Guo, R.; Wu, T.; Wu, X.; Luigi, S.; Wang, Y. Simulation of urban land expansion under ecological constraints in Harbin-Changchun urban agglomeration, China. Chin. Geogr. Sci. 2022, 32, 438–455. [Google Scholar] [CrossRef]
- Tan, K.W. A greenway network for Singapore. Landsc. Urban Plan. 2006, 76, 45–66. [Google Scholar] [CrossRef]
- Jim, C.Y.; Chen, S.S. Comprehensive greenspace planning based on landscape ecology principles in compact Nanjing city, China. Landsc. Urban Plan. 2003, 65, 95–116. [Google Scholar] [CrossRef]
- Aoki, Y. Relationship between perceived greenery and width of visual fields. J. Jpn. Inst. Landsc. Archit. 1987, 51, 1–10. [Google Scholar]
- Yang, J.; Zhao, L.; Mcbride, J.; Gong, P. Can you see green? Assessing the visibility of urban forests in cities. Landsc. Urban Plan. 2009, 91, 97–104. [Google Scholar] [CrossRef]
- Anguelov, D.; Dulong, C.; Filip, D.; Frueh, C.; Lafon, S.; Lyon, R.; Ogale, A.; Vincent, L.; Weaver, J. Google street view: Capturing the world at street level. Computer 2010, 43, 32–38. [Google Scholar] [CrossRef]
- Li, X.; Zhang, C.; Li, W.; Ricard, R.; Meng, Q.; Zhang, W. Assessing street-level urban greenery using Google Street View and a modified green view index. Urban For. Urban Green. 2015, 14, 675–685. [Google Scholar] [CrossRef]
- Zhu, J.; Qiu, L.; Su, Y.; Guo, Q.; Hu, T.; Bao, H.; Luo, J.; Wu, S.; Xu, Q.; Wang, Z. Disentangling the effects of the surrounding environment on street-side greenery: Evidence from Hangzhou. Ecol. Indic. 2022, 143, 109153. [Google Scholar] [CrossRef]
- Song, Y.; Kirkwood, N.; Maksimović, Č.; Zheng, X.; O’Connor, D.; Jin, Y.; Hou, D. Nature based solutions for contaminated land remediation and brownfield redevelopment in cities: A review. Sci. Total Environ. 2019, 663, 568–579. [Google Scholar] [CrossRef] [PubMed]
- Yang, L.; Yu, K.; Ai, J.; Liu, Y.; Lin, L.; Lin, L.; Liu, J. The influence of green space patterns on land surface temperature in different seasons: A case study of Fuzhou City, China. Remote Sens. 2021, 13, 5114. [Google Scholar] [CrossRef]
- Yu, Z.; Guo, X.; Zeng, Y.; Koga, M.; Vejre, H. Variations in land surface temperature and cooling efficiency of green space in rapid urbanization: The case of Fuzhou city, China. Urban for. Urban Green. 2018, 29, 113–121. [Google Scholar] [CrossRef]
- Lai, S.; Sha, J.; Eladawy, A.; Li, X.; Wang, J.; Kurbanov, E.; Lin, Z.; Wu, L.; Han, R.; Su, Y. Evaluation of ecological security and ecological maintenance based on pressure-state-response (PSR) model, case study: Fuzhou city, China. Hum. Ecol. Risk Assess. Int. J. 2022, 28, 734–761. [Google Scholar] [CrossRef]
- Zanaga, D.; Van De Kerchove, R.; Daems, D.; De Keersmaecker, W.; Brockmann, C.; Kirches, G.; Wevers, J.; Cartus, O.; Santoro, M.; Fritz, S.; et al. ESA WorldCover 10 m 2021 v200 (v200) [Data Set]. Zenodo. 2022. Available online: https://zenodo.org/records/7254221 (accessed on 22 August 2023).
- Geng, J.; Yu, K.; Xie, Z.; Zhao, G.; Ai, J.; Yang, L.; Yang, H.; Liu, J. Analysis of spatiotemporal variation and drivers of ecological quality in Fuzhou based on RSEI. Remote Sens. 2022, 14, 4900. [Google Scholar] [CrossRef]
- Xu, H. Modification of normalised difference water index (NDWI) to enhance open water features in remotely sensed imagery. Int. J. Remote Sens. 2006, 27, 3025–3033. [Google Scholar] [CrossRef]
- Soille, P.; Vogt, P. Morphological segmentation of binary patterns. Pattern Recognit. Lett. 2009, 30, 456–459. [Google Scholar] [CrossRef]
- Vogt, P.; Ferrari, J.R.; Lookingbill, T.R.; Gardner, R.H.; Riitters, K.H.; Ostapowicz, K. Mapping functional connectivity. Ecol. Indic. 2009, 9, 64–71. [Google Scholar] [CrossRef]
- Yuan, B.; Fu, L.; Zou, Y.; Zhang, S.; Chen, X.; Li, F.; Deng, Z.; Xie, Y. Spatiotemporal change detection of ecological quality and the associated affecting factors in Dongting Lake Basin, based on RSEI. J. Clean. Prod. 2021, 302, 126995. [Google Scholar] [CrossRef]
- Chang, C.; Li, M.; Chang, S. A preliminary study on the local cool-island intensity of Taipei city parks. Landsc. Urban Plan. 2007, 80, 386–395. [Google Scholar] [CrossRef]
- Luo, F.; Liu, Y.; Peng, J.; Wu, J. Assessing urban landscape ecological risk through an adaptive cycle framework. Landsc. Urban Plan. 2018, 180, 125–134. [Google Scholar] [CrossRef]
- Yang, X.; Tan, X.; Chen, C.; Wang, Y. The influence of urban park characteristics on bird diversity in Nanjing, China. Avian Res. 2020, 11, 45. [Google Scholar] [CrossRef]
- He, K.; Lin, T.; Wu, J.; Sui, M.; Liu, L.; Ding, G. Construction of green infrastructure network based on spatial priority in downtown of Fuzhou, China. Ying Yong Sheng Tai Xue Bao J. Appl. Ecol. 2021, 32, 1424–1432. [Google Scholar]
- Huang, H.; Yu, K.; Gao, Y.; Liu, J. Building green infrastructure network of Fuzhou using MSPA. Chin. Landsc. Archit. 2019, 35, 70–75. [Google Scholar]
- Mu, H.; Li, X.; Ma, H.; Du, X.; Huang, J.; Su, W.; Yu, Z.; Xu, C.; Liu, H.; Yin, D. Evaluation of the policy-driven ecological network in the Three-North Shelterbelt region of China. Landsc. Urban Plan. 2022, 218, 104305. [Google Scholar] [CrossRef]
- Coffin, A.W. From roadkill to road ecology: A review of the ecological effects of roads. J. Transp. Geogr. 2007, 15, 396–406. [Google Scholar] [CrossRef]
- Van Der Ree, R.; Smith, D.J.; Grilo, C. The ecological effects of linear infrastructure and traffic: Challenges and opportunities of rapid global growth. In Handbook of Road Ecology; John Wiley & Sons, Ltd.: Hoboken, NJ, USA, 2015; pp. 1–9. [Google Scholar]
- Yang, Y.; Zhou, Y.; Feng, Z.; Wu, K. Making the case for parks: Construction of an ecological network of urban parks based on birds. Land 2022, 11, 1144. [Google Scholar] [CrossRef]
- McRae, B.H.; Kavanagh, D.M. Linkage Mapper Connectivity Analysis Software; The Nature Conservancy: Seattle WA, USA, 2011. [Google Scholar]
- McRae, B.H. Isolation by resistance. Evolution 2006, 60, 1551–1561. [Google Scholar] [PubMed]
- McRae, B.H.; Hall, S.A.; Beier, P.; Theobald, D.M. Where to restore ecological connectivity? Detecting barriers and quantifying restoration benefits. PLoS ONE 2012, 7, e52604. [Google Scholar] [CrossRef]
- Gao, M.; Hu, Y.; Bai, Y. Construction of ecological security pattern in national land space from the perspective of the community of life in mountain, water, forest, field, lake and grass: A case study in Guangxi Hechi, China. Ecol. Indic. 2022, 139, 108867. [Google Scholar] [CrossRef]
- Peng, J.; Zhao, H.; Liu, Y. Urban ecological corridors construction: A review. Acta Ecol. Sin. 2017, 37, 23–30. [Google Scholar] [CrossRef]
- Zhang, R.; Zhang, L.; Zhong, Q.; Zhang, Q.; Ji, Y.; Song, P.; Wang, Q. An optimized evaluation method of an urban ecological network: The case of the Minhang District of Shanghai. Urban For. Urban Green. 2021, 62, 127158. [Google Scholar] [CrossRef]
- Liu, D.; Zhou, S.; Wang, L.; Chi, Q.; Zhu, M.; Tang, W.; Zhao, X.; Xu, S.; Ye, S.; Lee, J. Research on the planning of an urban ventilation corridor based on the urban underlying surface taking Kaifeng city as an example. Land 2022, 11, 206. [Google Scholar] [CrossRef]
- Forman, R.T.; Alexander, L.E. Roads and their major ecological effects. Annu. Rev. Ecol. Syst. 1998, 29, 207–231. [Google Scholar] [CrossRef]
- Oxley, D.J.; Fenton, M.B.; Carmody, G.R. The effects of roads on populations of small mammals. J. Appl. Ecol. 1974, 11, 51–59. [Google Scholar] [CrossRef]
- Nie, W.; Shi, Y.; Siaw, M.J.; Yang, F.; Wu, R.; Wu, X.; Zheng, X.; Bao, Z. Constructing and optimizing ecological network at county and town Scale: The case of Anji County, China. Ecol. Indic. 2021, 132, 108294. [Google Scholar] [CrossRef]
- Fan, F.; Wen, X.; Feng, Z.; Gao, Y.; Li, W. Optimizing urban ecological space based on the scenario of ecological security patterns: The case of central Wuhan, China. Appl. Geogr. 2022, 138, 102619. [Google Scholar] [CrossRef]
- Shen, Z.; Wu, W.; Tian, S.; Wang, J. A multi-scale analysis framework of different methods used in establishing ecological networks. Landsc. Urban Plan. 2022, 228, 104579. [Google Scholar] [CrossRef]
- Hongfeng, B.; Wei, Z.; Lianxi, S.; Yang, G. Landscape-ecological planning and design of urban ecological corridors. In Proceedings of the 2010 International Conference on Mechanic Automation and Control Engineering, Wuhan, China, 26–28 June 2010; IEEE: Hoboken, NJ, USA, 2010; pp. 1283–1287. [Google Scholar]
- Li, P.; Cao, H.; Sun, W.; Chen, X. Quantitative evaluation of the rebuilding costs of ecological corridors in a highly urbanized city: The perspective of land use adjustment. Ecol. Indic. 2022, 141, 109130. [Google Scholar] [CrossRef]
- LaPoint, S.; Balkenhol, N.; Hale, J.; Sadler, J.; van der Ree, R. Ecological connectivity research in urban areas. Funct. Ecol. 2015, 29, 868–878. [Google Scholar] [CrossRef]
- Urban, D.; Keitt, T. Landscape connectivity: A graph-theoretic perspective. Ecology 2001, 82, 1205–1218. [Google Scholar] [CrossRef]
Disclaimer/Publisher’s Note: The statements, opinions and data contained in all publications are solely those of the individual author(s) and contributor(s) and not of MDPI and/or the editor(s). MDPI and/or the editor(s) disclaim responsibility for any injury to people or property resulting from any ideas, methods, instructions or products referred to in the content. |
© 2023 by the authors. Licensee MDPI, Basel, Switzerland. This article is an open access article distributed under the terms and conditions of the Creative Commons Attribution (CC BY) license (https://creativecommons.org/licenses/by/4.0/).

