Article

Municipal and Urban Renewal Development Index System: A Data-Driven Digital Analysis Framework

1
Department of Automation, Tsinghua University, Beijing 100084, China
2
AI for Earth Laboratory, Cross-Strait Research Institute, Tsinghua University, Beijing 100084, China
3
Tsinghua Urban Institute, Tsinghua University, Beijing 100084, China
4
College of Land Science and Technology, China Agricultural University, Beijing 100084, China
5
School of Architecture, Tsinghua University, Beijing 100084, China
6
Urban Systems Institute, Social Infrastructure for Equity and Wellbeing (SIEW) Laboratory, Department of Urban Planning and Design, The University of Hong Kong, Hong Kong SAR, China
7
Future Urbanity & Sustainable Environment (FUSE) Laboratory, Division of Landscape Architecture, Faculty of Architecture, The University of Hong Kong, Hong Kong SAR, China
8
Beijing Municipal Institute of City Planning and Design, Beijing 100045, China
9
School of Architecture and Civil Engineering, Xiamen University, Xiamen 361005, China
10
Peng Cheng Laboratory, Shenzhen 518000, China
11
2861 Data Technology, Tsinghua Science Park, Beijing 100084, China
12
Urban Systems Institute, Department of Geography, and Department of Earth Sciences, The University of Hong Kong, Hong Kong SAR, China
*
Author to whom correspondence should be addressed.
Remote Sens. 2024, 16(3), 456; https://doi.org/10.3390/rs16030456
Submission received: 17 December 2023 / Revised: 22 January 2024 / Accepted: 22 January 2024 / Published: 24 January 2024
(This article belongs to the Special Issue Urban Planning Supported by Remote Sensing Technology II)

Abstract

:
Urban renewal planning and development are vital for enhancing the living quality of city residents. However, such improvement activities are often expensive, time-consuming, and in need of standardization. The convergence of remote sensing technologies, social big data, and artificial intelligence solutions has created unprecedented opportunities for comprehensive digital planning and analysis in urban renewal development and management. However, fast interdisciplinary development imposes some challenges because the data collected and the solutions built are defined piece by piece and require further fusion and integration of knowledge, evaluation standards, systematic analyses, and new methodologies. To address these challenges, we propose a municipal and urban renewal development index (MUDI) system with data modeling and mathematical analysis models. The MUDI system is applied and studied in three circumstances: (1) at regional level, 337 cities are selected in China to demonstrate the MUDI system’s comparable analysis capabilities on a large scale across cities; (2) at city level, 285 residential communities are selected in Xiamen to demonstrate the use of remote sensing data as key MUDIs for a temporal urban land change analysis; and (3) at the level of residential neighborhoods’ urban renewal practices, Xiamen’s Yingping District is selected to demonstrate the MUDI system’s project management capabilities. We find that the MUDI system is highly effective in municipal and urban data model building through the abstraction and summation of grid-based satellite and social big data. Secondly, the MUDI system enables comprehension of the high dimensionality and complexity of multisource datasets for municipal and urban renewal development. Thirdly, the system is applied to enable the use of the newly developed UMAP algorithm, a model based on Riemannian geometry and algebraic topology, and the carrying out of a principal component analysis for the key dimensions and an index correlation analysis. Fourthly, various artificial intelligence-driven algorithms can be developed for urban renewal analyses based on the MUDIs. The MUDI system is a new and effective method for urban renewal planning and management that can be flexibly extended and applied to various cities and urban districts.

1. Introduction

Over the past half-century, global urbanization has profoundly changed the built environment [1]. Rapid growth and development have led to increased complexity in the mix of environments and ecology [2]. Urban populations grow at a fast pace, and, by 2050, the global population residing in cities is projected to reach 70% of the total population, a figure currently standing at approximately 55% [3,4]. Urban areas, some with aging buildings, consume about 78% of the global energy and account for 60% of greenhouse gas emissions [5]. In China, urbanization has gained an unprecedented speed, with more than half of the world’s building materials being used in construction [6]. Given pressing challenges such as the heat island threat [7], environmental pollution, and renewable energy usage [8], urban renewal and sustainable development [9] have become increasingly important. For urban planning and management, interdisciplinary urban research converges rapidly, requiring further in-depth studies. These converging areas include remote sensing and satellite technologies, planning and development from municipal organizations and urban communities, and, more recently, social big data and artificial intelligence solutions [10], which we will review next.
With the advancement of remote sensing technologies and improved AI algorithms, land use and land change have been studied extensively over the last half century [11], and satellite applications with multiple spatial resolutions are available, ranging from coarse resolutions to finer resolutions, from classical mapping classifiers to advanced convolutional neural networks (CNNs) algorithms [12,13]. For example, resolutions vary from the 1 km International Geosphere Biosphere Programme data and information system cover (IGBP-DISCover) map [14] to the 300 m European Space Agency (ESA) Climate Change Initiative (CCI) land cover maps from 1992 to 2015 [15] (UCL-Geomatics, 2017) and the 30 m global land cover data product [16]. As for the AI algorithms, in addition to random forest (RF) [17], cart [18], etc., machine learning algorithms such as the support vector machine (SVM) [19] and CNNs are explored for urban studies. These advancements have greatly facilitated various applications, including image segmentation, object recognition, and land use classification.
Municipal planners have an increasing need for urban renewal planning and management [20,21]. In a sense, how city planners and stakeholders see and plan the city will shape the city’s future. As cities are expressed by their defined characters, their heritage includes almost anything inherited from the past and destined for the future, fabricated through the combinations of history interpretation, memory consolidation, and collection of relics [20]. Therefore, municipal planning reflecting accurately such complexities is essential for urban renewal [21]. These characteristics of a city can be defined as indicators or indexes. Examples include the following: (1) the International Green Example New Town Standard 3.0 issued by the Global Habitat Environment Forum in 2016 [22]; (2) the “European Green City” indicators launched by the European Environment Commission [23]; (3) the annual report of New York [24]; and (4) the annual planning report (AMR) of London [25]. These studies have laid a good foundation for urban renewal development from a social science perspective. The above-mentioned urban renewal practices are commonly applied in urban neighborhood areas with planned budgets. For this reason, in this paper, urban renewal studies are assumed to be destined for residential neighborhood urban renewal or regeneration efforts.
Social big data have become increasingly important for urban planning and management due to the need of modeling and analyzing of different data types, including social media and internet content [26]. Research teams worldwide have initiated studies by combining urban design and policy making with digital technologies. In Israel, a research team has set up a multiparametric framework to analyze urban regeneration quality and present different scenarios of neighborhood renewal alternatives [27]. A process-driven framework for Mediterranean historic city centers has been proposed [28]. In Budapest, digital planning is evaluated for the urban regeneration of a fragmented heterogeneous urban fabric environment [29]. Smart Cities Mission was launched in 2015 for 100 cities in India, a project in which ICT and digital technologies are particularly emphasized [30]. In Dresden, Germany, a population-weighted accessibility digital index for a 50 m grid has been used for four urban area regeneration studies [31]. Furthermore, digital placemaking for tourist attractions has been explored in several cities such as Riga, Kaunas, and Taipei [32]. In Beijing, urban regeneration plans have presented methodologies for conserving a thousand years of history and focusing on crucial urban areas’ regeneration [33]. More recently, the relationships between public service indicators and economic development for different regions in China have been studied [34].
Many scholars have proposed different indicator systems and measuring methods. Lucy et al. have classified public services into four categories to establish an indicator system [35]: routine services, protective services, developmental services, and social minimum services. Liao has considered the level of investment performance and constructed an indicator system consisting of five primary indicators and sixteen secondary indicators [36]. Ardeshiri et al. have paid attention to the impact of eight different indicators on residents’ lives and social development, including parks, local shopping centers, public transit, police stations, schools, medical centers, sports courts, and post offices [37]. A local economic system can be measured from different perspectives, such as the per capita GDP [38], the fiscal capacity of local governments [39], and the living standards of residents [40]. The relative levels of income and consumption are typical indicators of local economic system characteristics [41]. Existing research methods to determine the weight coefficient of the above-mentioned indicator systems include the analytic hierarchy process (AHP) [42], the expert evaluation method [43], data envelopment analysis (DEA) [44], principal component analysis (PCA) [45], etc.
As discussed above, the use of digital planning and management for urban renewal is relatively new and at an early stage of its technology development cycle. The following needs of policymakers and stakeholders are not satisfied. First, urban diversity and social fabrics are complex [46]. Parametric models for urban neighborhoods are relatively small in scale [27,28], and their data sources are limited. Large amounts of data processing work are needed to set up a high-dimensional digital model and accumulate historical data. Secondly, parametric models are limited to specific urban neighborhood and projects [29,47]. A comparable analysis of municipal planning and development is lacking across multiple cities and regions. Thirdly, the digital urban planning framework quantifies urban development objectives by their defined indicators. Up until now, such indicators have been relatively simple. The creation and specification of these indicators are often project-specific without systematically analyzing the indicators chosen and their correlations [27,32,47]. Comprehensive digital indicators or index systems with high dimensionalities are needed. Fourthly, the advancement of remote sensing and satellite technologies has provided new means for urban planning and management evaluations. For example, submeter satellite images can be used as data sources for urban renewal progress evaluations, and previously developed algorithms in remote sensing can be further used and enhanced for finer-scale applications. Fifthly, from a data perspective, the more data sources for the indicators, the better the data model. However, a mathematical analysis of the relationship among these indicators is needed for answering questions like the following: Out of hundreds of indicators, which are the most important for an analysis? What are the correlations between these indexes or indicators? Mathematical models and algorithms need to be studied and developed. Finally, applying the latest technologies to solve real-world urban problems within and across cities is greatly needed to add value for stakeholders.
In this study, we propose the municipal and urban renewal development index (MUDI) for municipal and urban development evaluation purposes. An MUDI system is developed with the following key components: (1) a data model; (2) MUDI specifications, MUDI dimensionality, and a correlation analysis; and (3) GIS- and AI-driven methodologies and algorithms. The data model is set up by leveraging the previously established city meta unit (CMU) modeling methodology [48]. We have applied the MUDI system in three circumstances for problem solving. First, at a regional level, 337 cities are selected in China to demonstrate the MUDI system’s comparable analysis capabilities across cities, which are important for regional planning and development. This analysis is based on mathematical models and algorithms including uniform manifold approximation and projection (UMAP) classifications, principal component analysis (PCA) components, and correlation analysis. Our MUDI analysis provides insightful observations by grouping cities based on the specific intrinsic characteristics and properties of each city. Secondly, at a city level, we apply the system to study 285 residential communities in Xiamen to demonstrate the use of remote sensing data as key MUDIs to monitor land change, taking advantage of historical data which are often readily available via satellite sensors. Thirdly, at the level of residential urban renewal practices, Xiamen’s Yingping District’s residential neighborhood is chosen to demonstrate the MUDI system’s functionalities, which take substantial amounts of time and development efforts from system setup to project completion. The rest of this paper is structured as follows: Section 2 introduces the MUDI system. Section 3 describes the study area and data sources in detail. Section 4 introduces the methodology and implementation of the system in detail. Section 5 illustrates the experimental results and analysis. Section 6 provides a discussion of the results and future works. Section 7 presents the conclusions of this study.

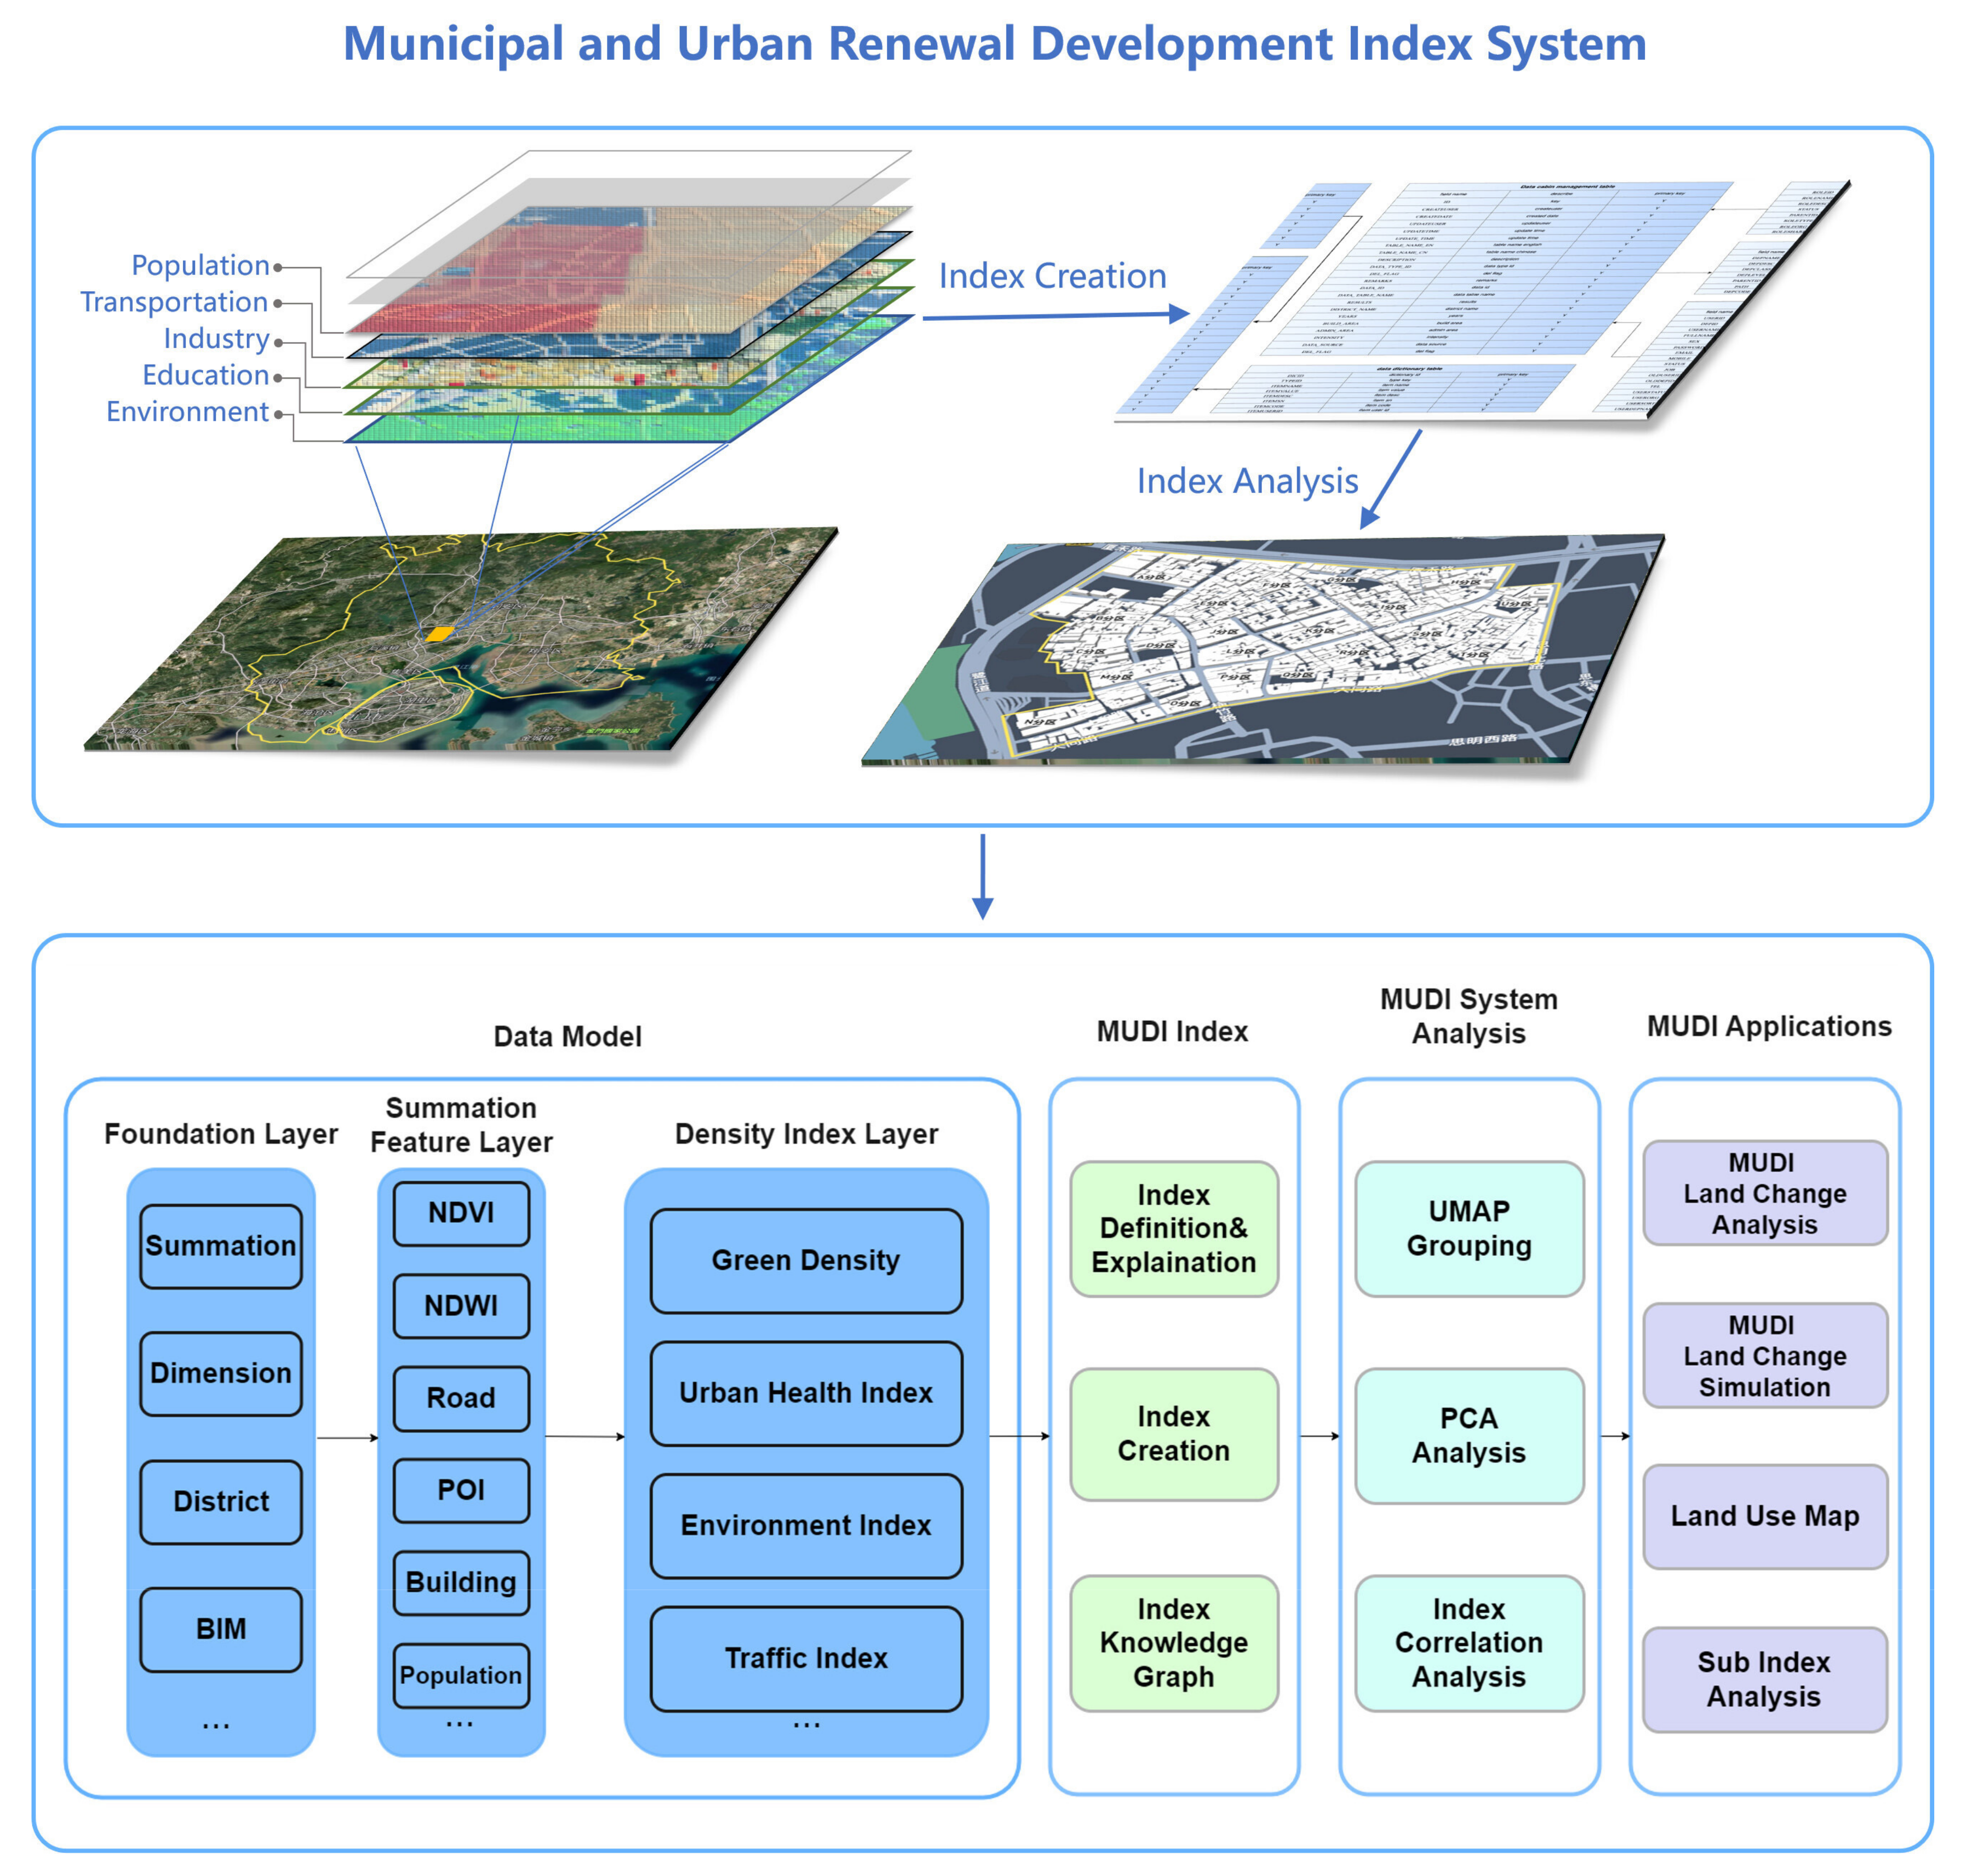
2. Municipal and Urban Renewal Development Index (MUDI) System

The MUDI system is an index system that we propose to systematically define, develop, analyze, and visualize the MUDIs for urban renewal evaluations. The MUDI system serves three primary purposes: (1) set up an urban area data model as the foundation for digital planning and management; (2) build up indexes or indicators to provide insightful and intrinsic evaluations for city and urban development efforts; and (3) apply various AI-driven technologies to urban studies. The MUDI system functional diagram is shown in Figure 1, which will be described in detail in this section.

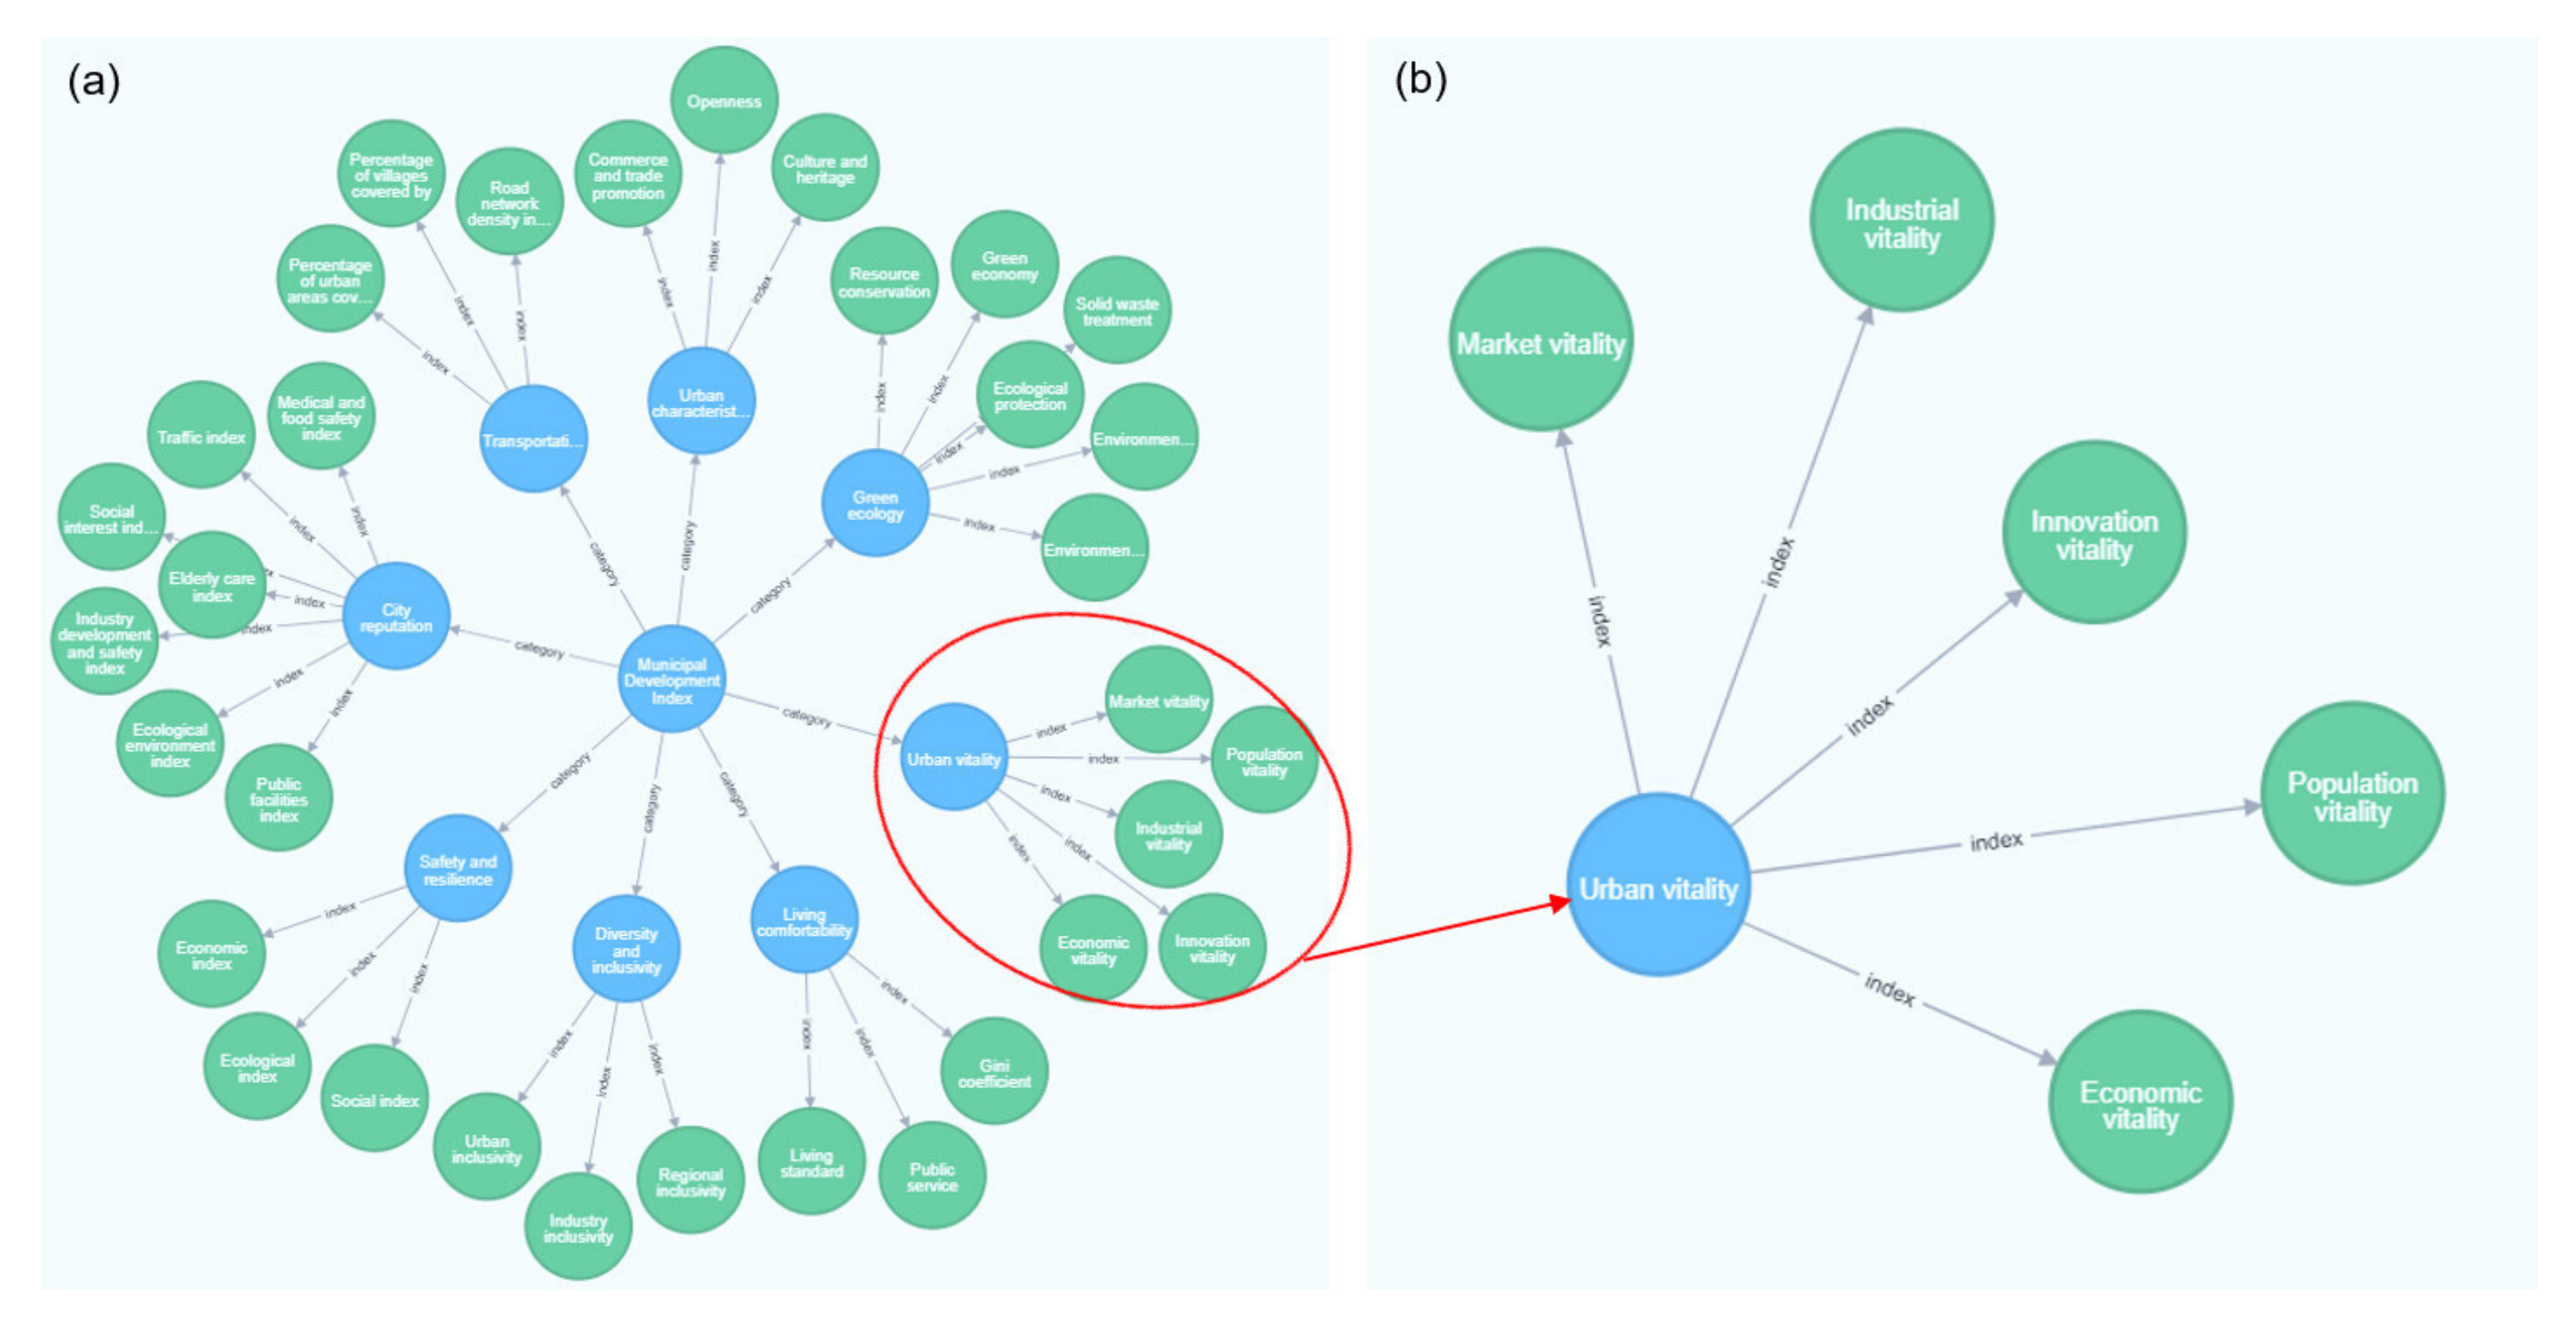
2.1. MUDI Data Model Building

The data model is based on the city meta unit (CMU) data model established previously in Xiamen [48]. The data model functionalities include the following: (1) scalable and traceable multi-dimensional meta-model for collecting, storing, describing, and grouping multisource data; (2) ability to process hierarchically grouped information and generate features and indexes based on the data collected.

2.2. MUDI Design and Specification

The MUDI system is designed to comprehensively quantify and evaluate the status of urban development and construction and formulate targeted solution measures. MUDI is proposed with the following principles: (1) scientificity, i.e., the need to construct the index system with data reflecting physical reality objectively; (2) operability, meaning that the indexes or indicators should be collectible and quantifiable; (3) all-inclusivity, recognizing that the city is an extensive complex system involving many aspects, such as environment and socioeconomic status. All dimensions of urban development should be fully considered to ensure the comprehensiveness and accuracy of urban examinations with layers of information.
The MUDIs include the determination of different index dimensions, data collection, data analysis, etc. Figure 2 is an example of the MUDIs we have specified for 337 cities in China.
MUDI comprises a broad range of city data and multiple high dimensions. It is essential to accumulate satellite and social big data across different regions on a finer scale. These data are stored in the MUDI data model.

2.3. MUDI System Dimensionality and Correlation Study

With the high dimensionality of the MUDI system, it is important to mathematically analyze the classifications, correlations, and main components of the MUDIs. In this study, we have attempted to apply UMAP, PCA, and K-means independently and jointly.
UMAP is a notable dimensionality reduction and presentation method used more recently [49] that originated from the theoretical framework based on Riemannian geometry and algebraic topology [50]. Assuming that the available data samples are uniformly distributed in the topological space (manifold), it is possible to approximate these limited data samples and map them to the low dimensional space (projection). UMAP can be divided into two main steps: (1) learn the various structure in a high-dimensional space; (2) map the approximate manifold in the high-dimensional space to a low-dimensional space. The UMAP algorithm aims to show the clusters of samples in a high-dimensional space and the relationship between sample points on low-dimensional images.
PCA is a commonly used dimension reduction method [51]. Principal component analysis transforms feature variables into main components resulting in dimension reduction with minimum information loss.
We propose a new method to combine PCA and UMAP to analyze index correlations from high dimensionalities to low-ranking dimension representations. First, PCA is applied for dimension reductions. Then, the feature variables reduced using PCA are taken as the input for UMAP, which can be further reduced to a lower three-dimensional space. The similarity score is calculated using K-means to visualize proximity between sample points in the low-dimensional space so that the dimension reduction results of the PCA can be more intuitively understood. Specifically, the following methods are applied: (a) UMAP classification into sub-groups; (b) PCA dimension reduction analysis for each sub-group; and (c) using UMAP again to classify each sub-group based on key components. A mathematical flow chart is shown in Figure 3 below.

2.4. AI-Driven Temporal Land Change Study by Applying MUDIs to Evaluate Urban Renewal Progress

There are many MUDIs for cities or urban communities, sometimes exceeding hundreds of indexes. In this study, we select green ecology subindexes to study land change and explore AI-driven technologies for such purposes. We use the semantic segmentation method for land classification and land change analysis of selected residential areas [52]. DeeplabV3+ [53] is a semantic segmentation AI model, as shown in Figure 4. The DeeplabV3+ model introduces many empty convolutions in the Encoder. It is realized using the spatial pyramid pool module and the encoder–decoder structure in a two-pronged manner. The attention mechanism [54] is applied to help improve the performance of the DeeplabV3+ model. The attention mechanism weighs different parts of the model for different geographical elements in residential communities. The DeeplabV3+ pretrained model is further trained in this study as described in detail in Section 4.2.5.

3. MUDI System Setup: Study Area and Datasets

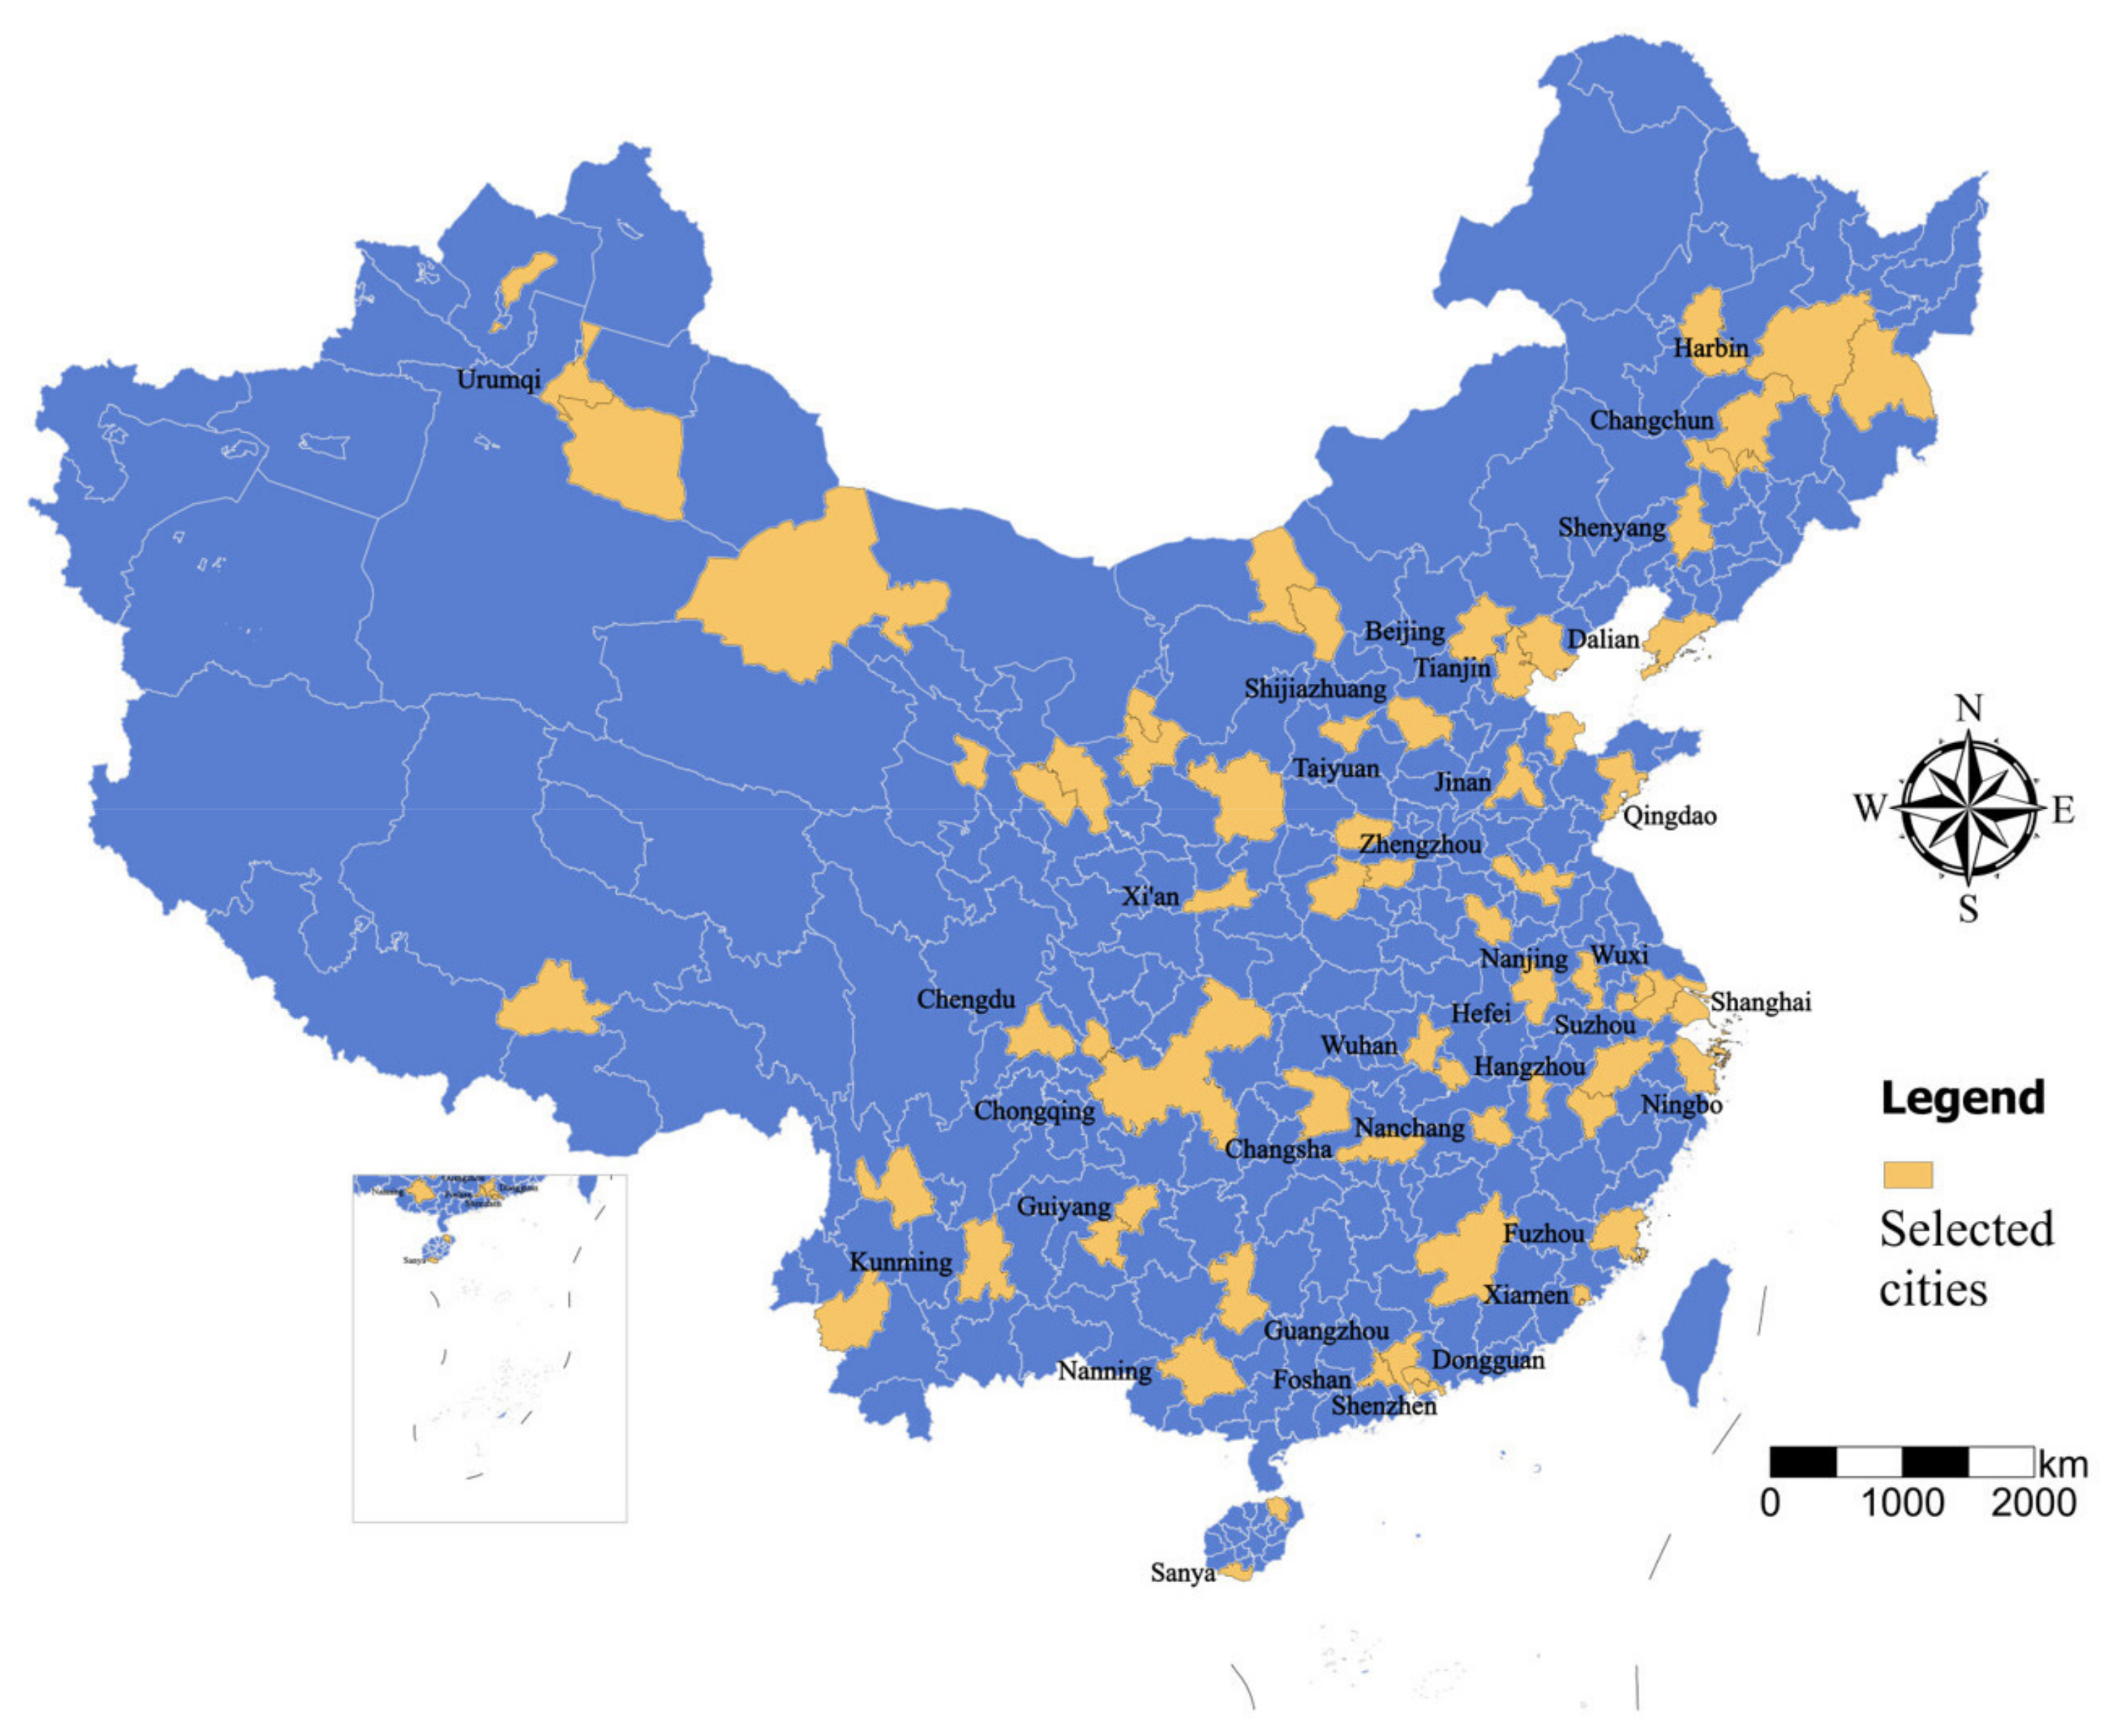
3.1. MUDI Study Area

First, we selected 337 cities in China for our MUDI setup and analysis, which included 333 prefecture-level administrative regions and four municipalities directly under the central government. For this study, 68 cities were further selected from 337 cities for a detailed analysis, as shown in Figure 5 below.
Secondly, we set up MUDI for the urban renewal planning and analysis of Xiamen’s Yingping District. Xiamen is a provincial city along the southeast coast of China. The Yingping Road–Kaiyuan Road historic district is located on the southwest coast of Xiamen Island, across the sea from Gulangyu Island. As the birthplace of Xiamen’s central districts, with historic block patterns, spatial textures, and continuous arcades combing Chinese and Western-style architecture, this district represents the essence of Xiamen as the birthplace of modern Minnan culture and the characteristics of urban development and construction in modern China. Yingping District comprises three communities, including Yingping, Datong, and Lujiang, with a population above 26,000. As time passes, the area with aging infrastructure needs urban renewal improvements. In this context, the area’s traditional style and historical memory are at risk of deteriorating. Therefore, it is vital to engage in urban renewal planning and development efforts and revive historical heritage and memories in such districts.

3.2. Datasets

We used multisource datasets, mainly categorized into two groups: (1) high-resolution satellite data from Gaofen-7; and (2) social data collected from publicly available internet resources and different companies, such as Tsinghua 2861 DaaS Project, Baidu, and Gaode. The Tsinghua 2861 DaaS Project aims to digitally represent every square kilometer grid in China. It includes a data processing engine with several layers, the foundation of which is an internet-based data collection system.
Regarding the satellite data, Gaofen-7 satellite images were collected for the identification and comparative analysis of green space, buildings, parking space, and other elements in residential areas in Xiamen, as shown in Figure 6b. The Gaofen-7 satellite provides high-resolution and refined images, with a resolution of 0.65 m after true-color image fusion. Gaofen-7 also includes high-resolution images in the red, green, blue, infrared, and near-infrared bands. The three-dimensional remote sensing information obtained by Gaofen-7 can extract DEM/DSM and variations in information from different time periods. Therefore, the images collected by Gaofen-7 that were used in this study can provide more on-site information when restoring urban details. Meanwhile, using the multiband images of Gaofen-7, remote sensing indexes such as NDVI, NDBI, and NDWI can be calculated. By using these indexes, we could obtain the land vegetation characteristics, building distribution, and water body distribution of Xiamen.
In addition to satellite images, different types of social data of Xiamen, especially from Yingping District, were collected. The data sources included POIs, 2861 DaaS index, street boundary, road network, population density, green space, 3D building model, detailed building information, oblique aerial images, BIM sample data for a specific building, etc. The POI data collected from 2019 to 2021 from Shuijingzhu datasets contained information including name, location coordinates, urban function attributes, etc. A total of 437,085 POIs were retained in Xiamen after data cleaning and filtering, as shown in Figure 6d. We checked the geospatial projection and mapped the POIs into four groups.

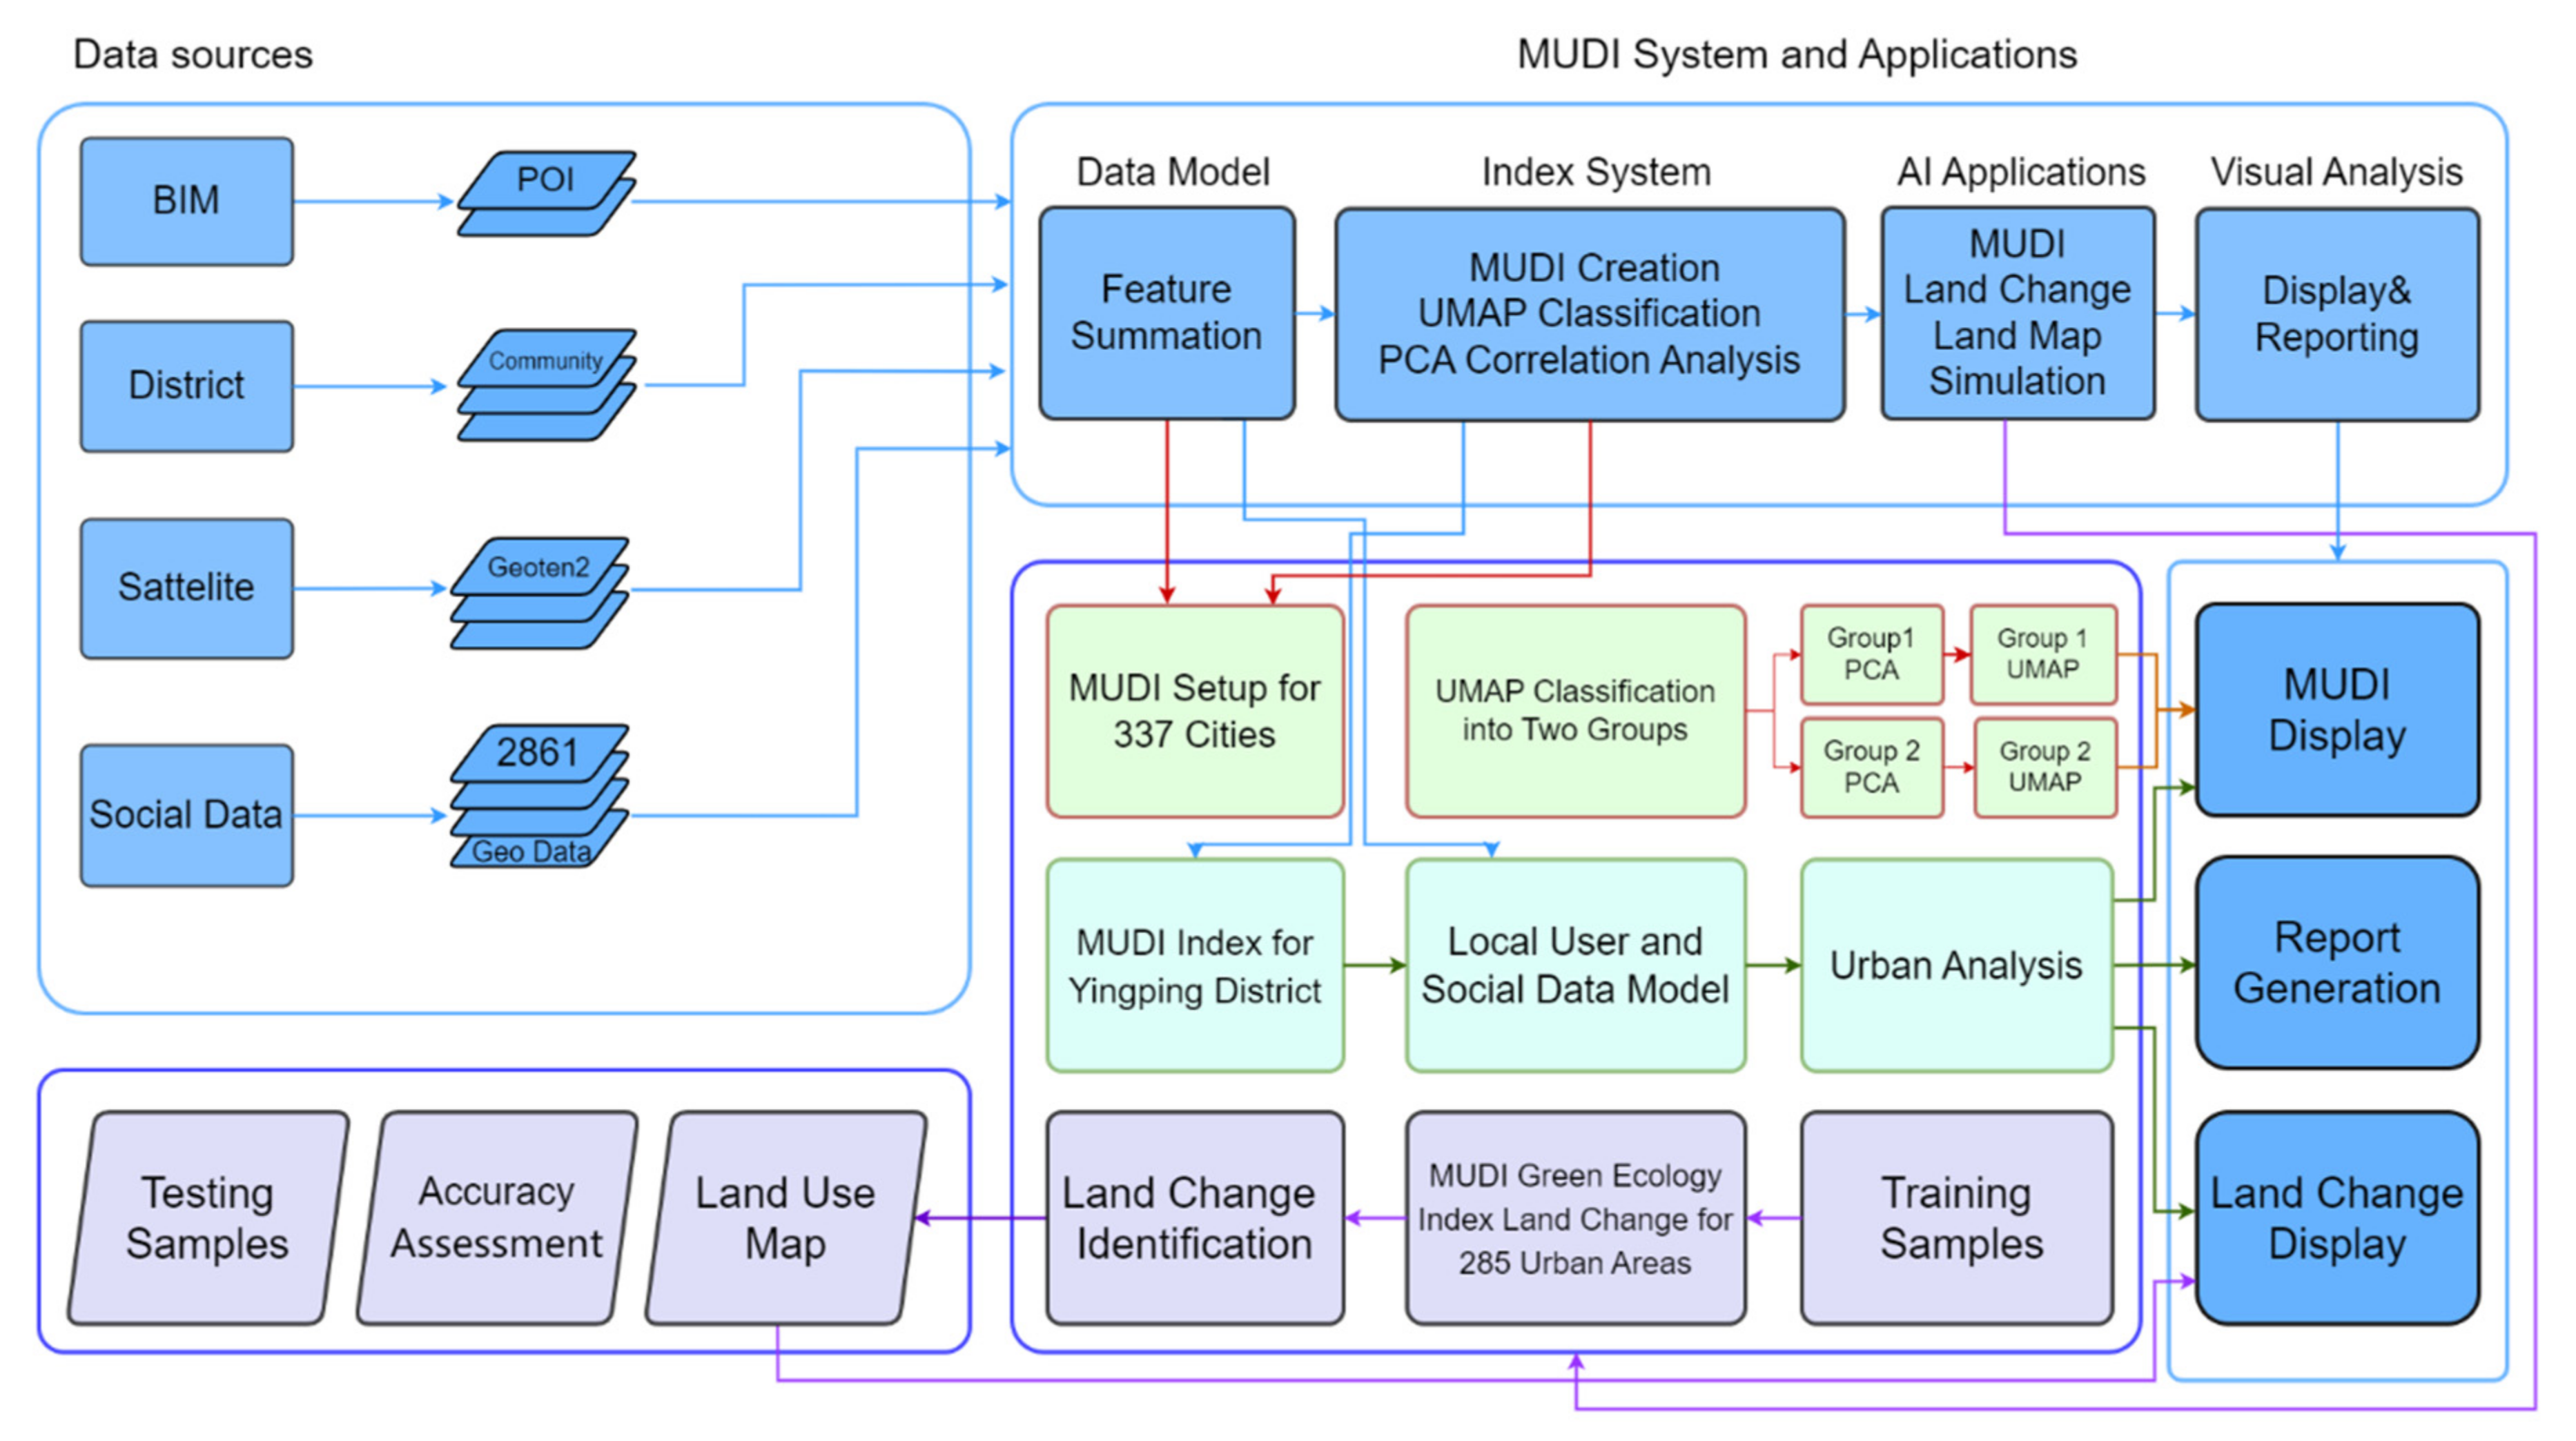
4. MUDI System Setup and Study for 337 Cities and Xiamen’s Yingping District and 285 Residential Communities

We set up the MUDI data model for processing multisource datasets into abstract feature layers for 337 cities and Xiamen’s Yingping District. Secondly, we developed MUDIs for both the cities and Yingping District. A UMAP analysis was applied to classify the cities. A dimension reduction analysis on the indexes was performed to extract their key components and analyze the correlation of different cities. Thirdly, we studied land classification and temporal land changes using semantic segmentation algorithms, identifying residential areas’ land changes. The implementation of the proposed method is shown in Figure 7.

4.1. MUDI Setup

MUDIs were set up for 337 cities in China, which consisted of eight categories and a total of 102 index dimensions. For Yingping District’s urban renewal project, the indexes comprised eight categories and a total of 55 index dimensions. The MUDIs will be described in detail in this section.

4.1.1. MUDIs for 337 Cities

The MUDIs for 337 cities are specified in Figure 8 below.
Taking the urban vitality category as an example, the index definition is shown in Table 1 below. The index data were originally produced based on the open social data from the Internet, following rigorous data processing based on the Tsinghua 2861 DaaS Project. The latter gathers remote sensing and crowdsourced internet data to compute monthly statistics for 55,000 categories for each of the 9.8 million grids in China. Monthly, over 3000 micro indicators are generated for each grid based on these statistics. Utilizing data algorithms and validation samples and the micro indicators of each grid of a city, we calculated 102 index values for each city in this study.

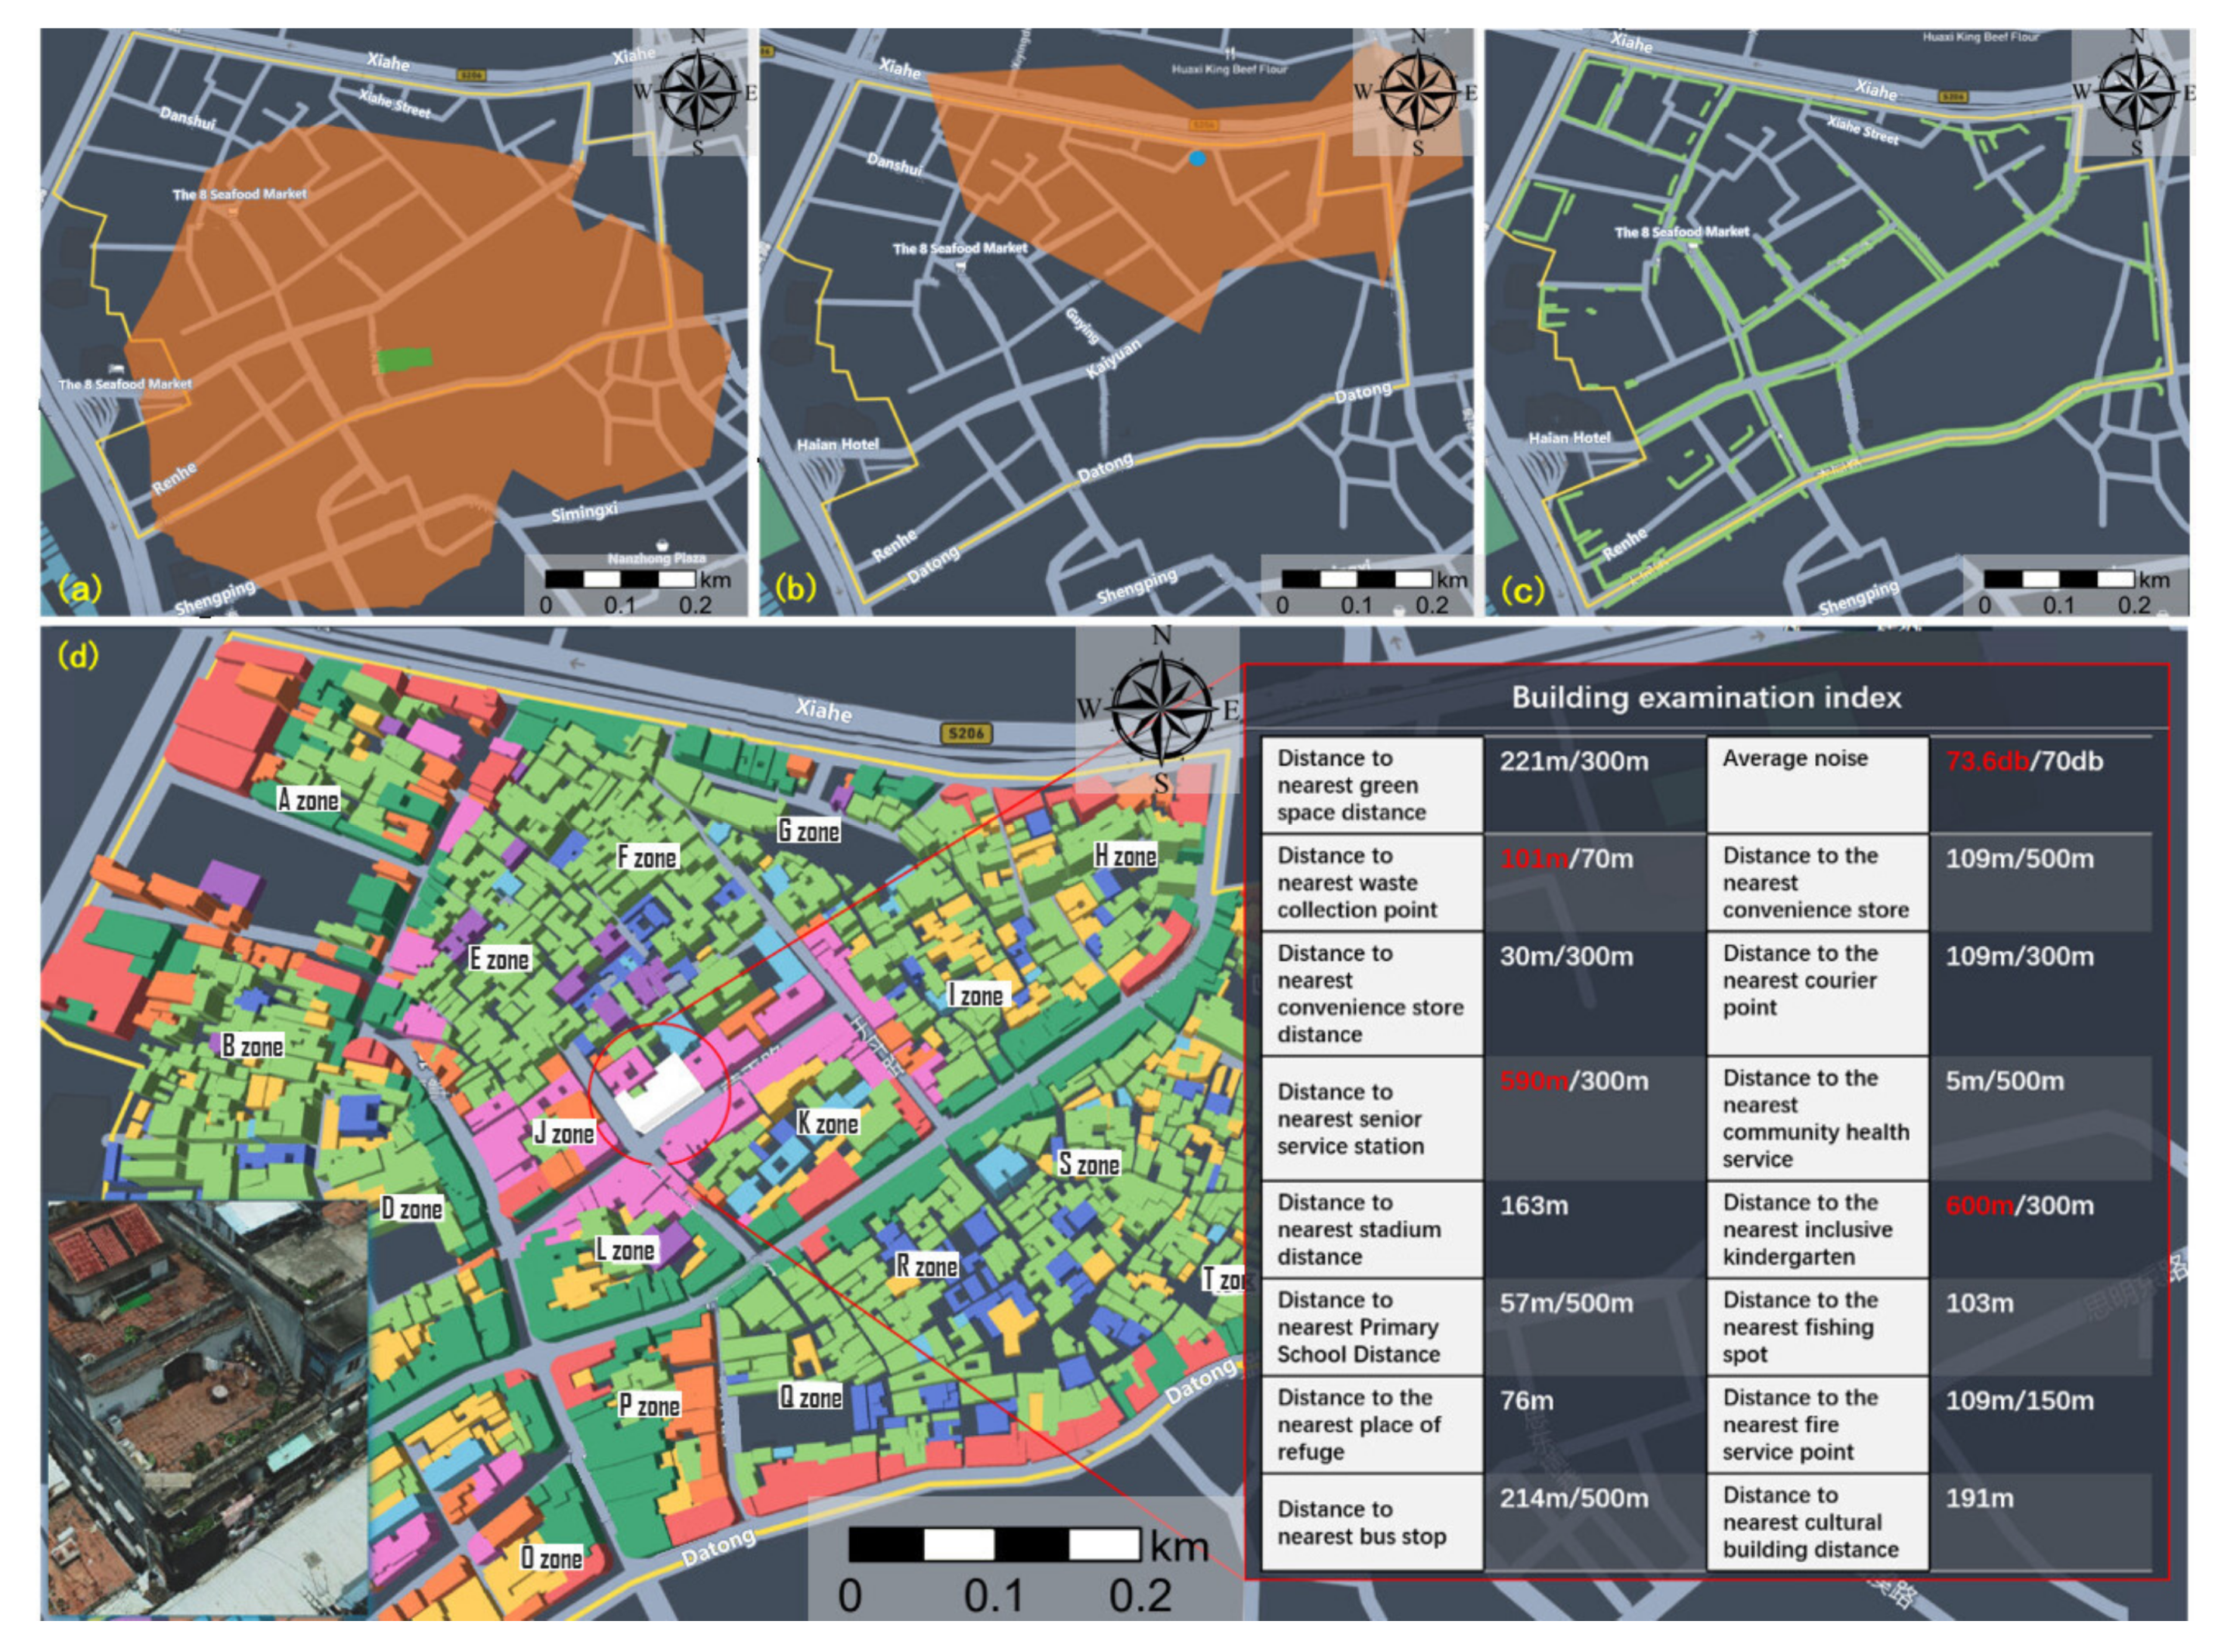
4.1.2. Yingping District’s Data Model and MUDI Setup

For the data model setup, 34 different data layers of 2062 objects were obtained, covering the three communities in Yingping District. The MUDIs for Yingping District consist of eight categories. The MUDIs of 337 cities in China are used as the base model, and additional specific indexes are added for Yingping District with systematic investigations and verifications. The MUDIs for Yingping District are shown in Table 2 below. Similarly, after data collection and processing, we used data algorithms to calculate the corresponding value for each index.

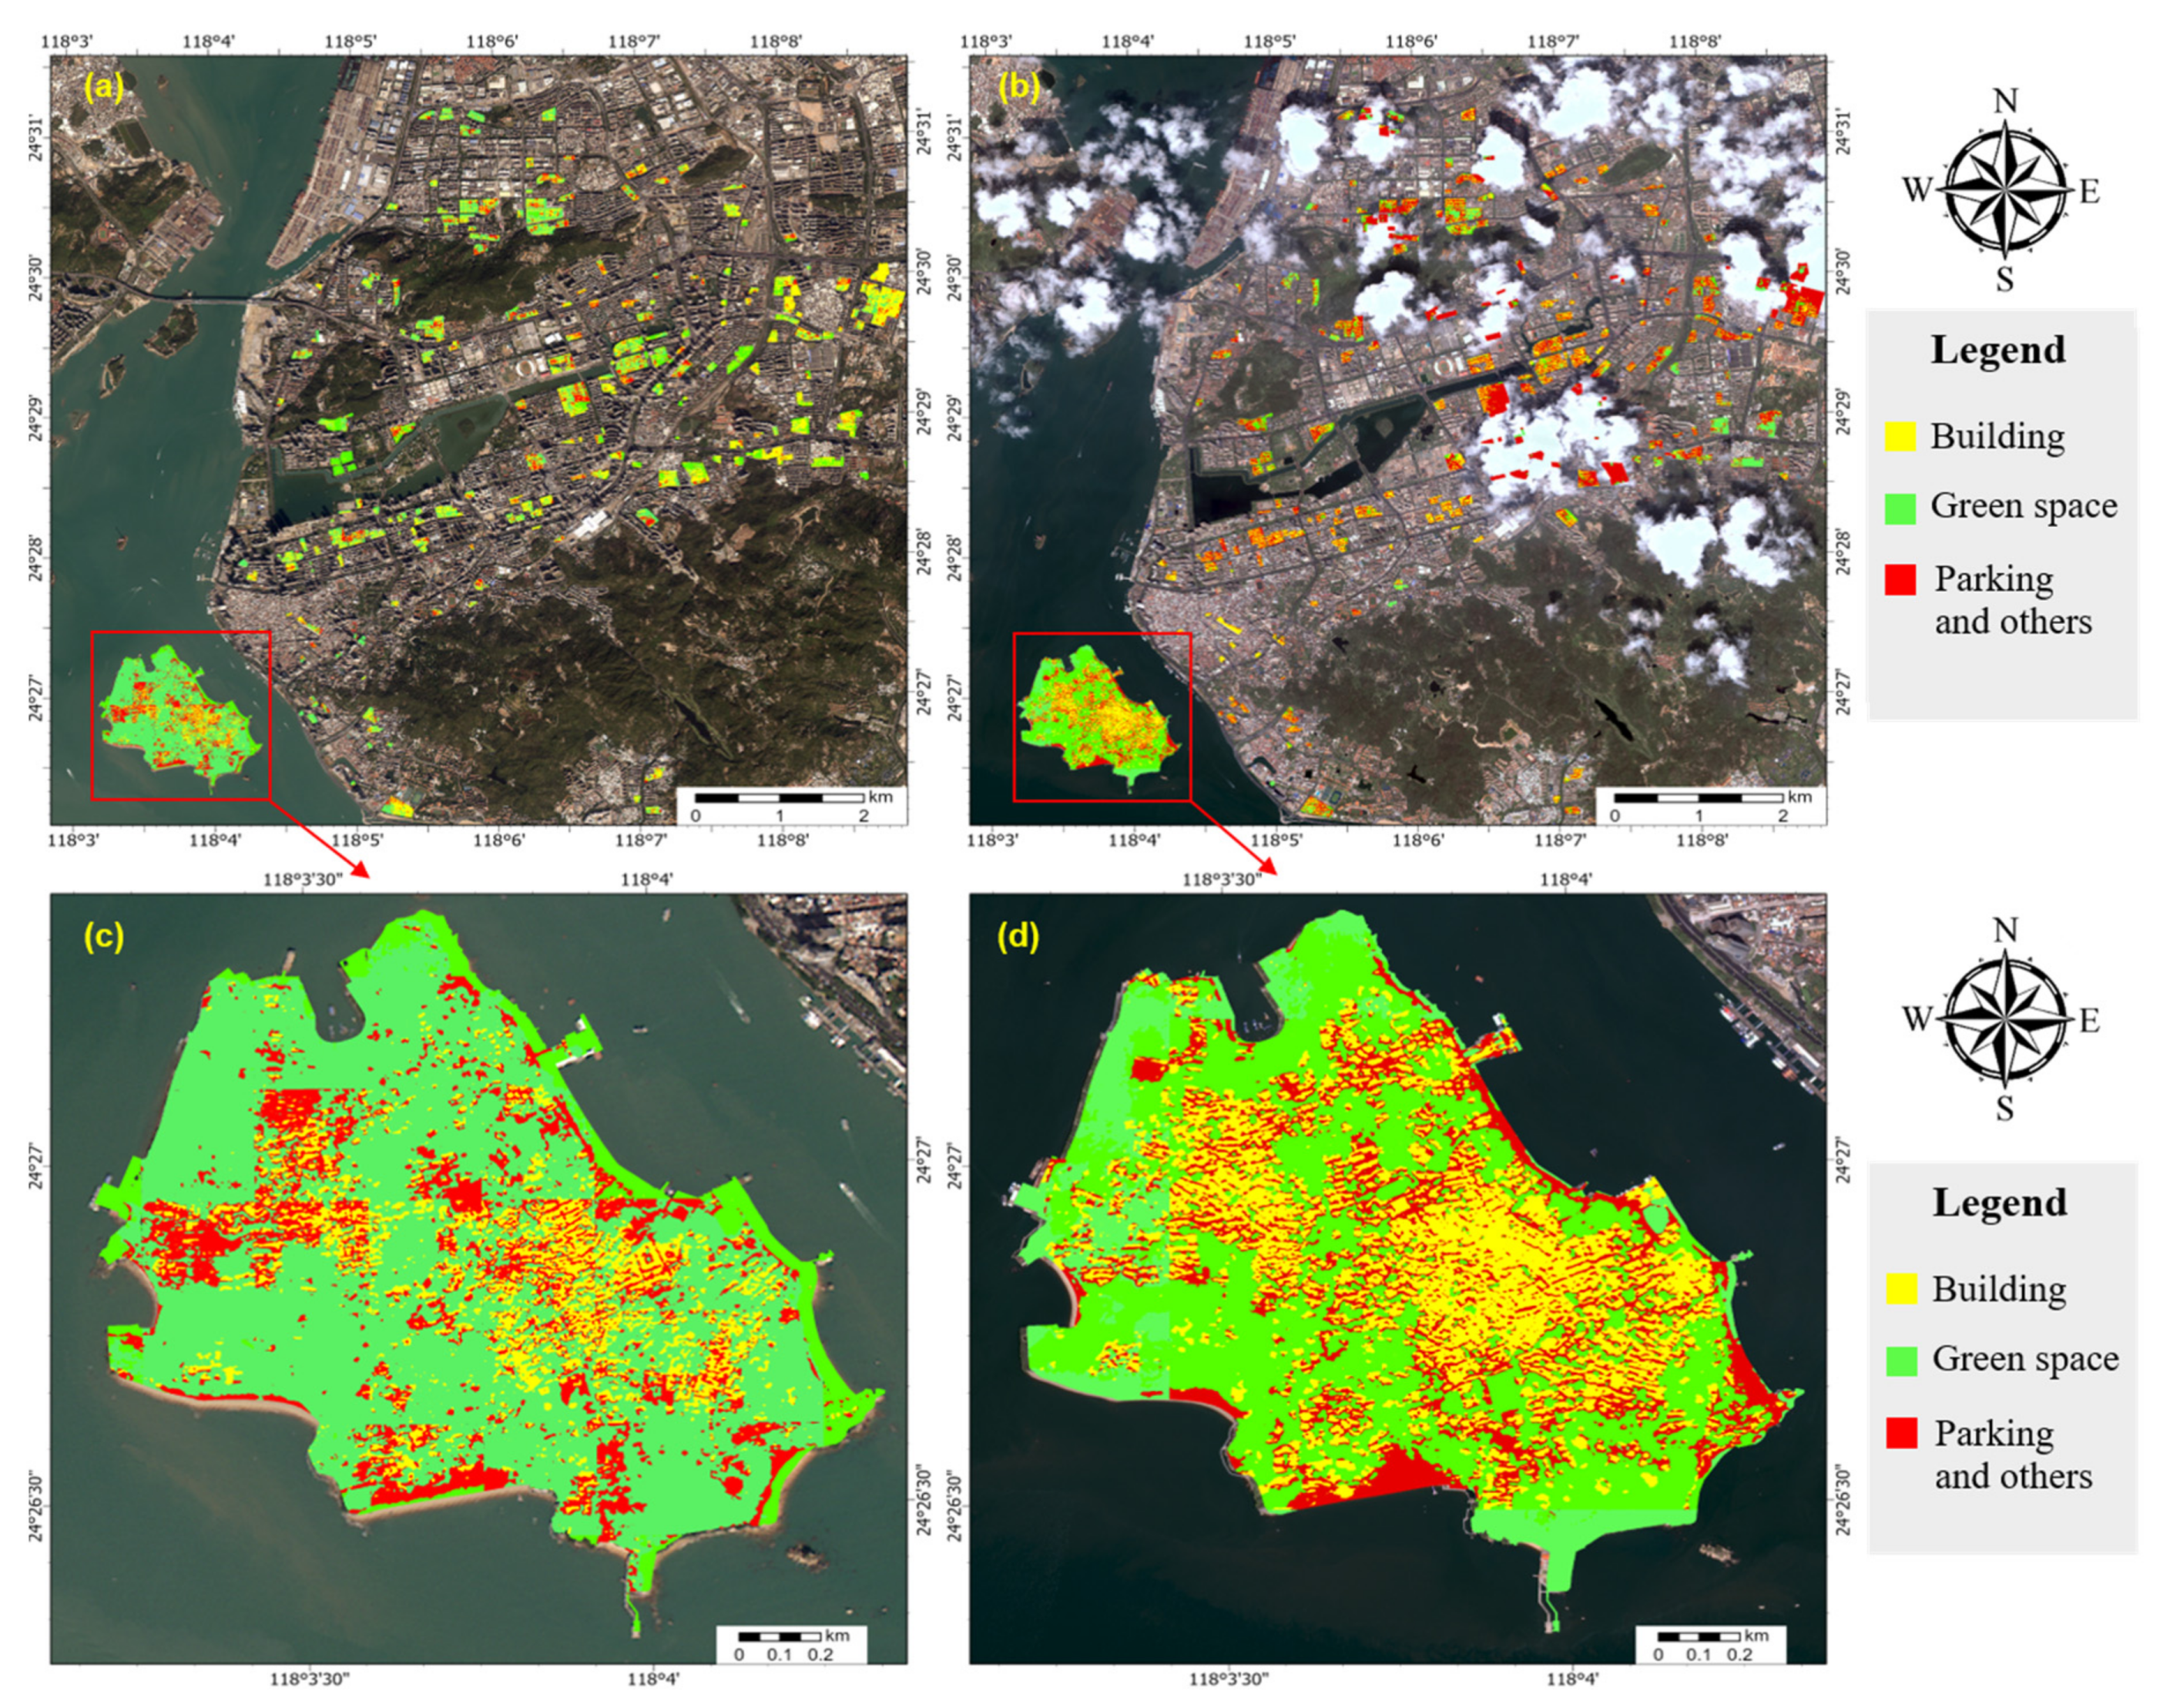
4.1.3. MUDI Green Ecology Index-Based Land Change Study for 285 Residential Communities

GF-7 satellite images were used for the land change analysis of residential areas. The ground control point (GCP), the orthophoto correction reference image, and the digital elevation model (DEM) were used for the orthophoto correction of GF-7 satellite images containing rational polynomial coefficients (RPC). By leveraging image fusion techniques, a low-resolution multiband satellite image was fused with a high-resolution panchromatic image to generate high-resolution multi-spectral data.
The labeling of the images of residential areas in different periods was processed manually. The year 2002 was selected as the benchmark year initiating the urban renewal development of the residential area, and 2021 was selected as the evaluation year for our temporal progress analysis. In this study, the following results were obtained: (1) the shapefile of the residential areas corresponding to the name of the community, the year of completion, the address, the current transformation status, etc.; (2) the green space boundary shapefile of the residential area, including the green space boundary of each residential area; (3) the boundary shapefile of the parking space in the residential area, including the boundary of the parking space (or open space) in each residential area; and (4) the building boundary shapefile of the residential area including the boundary of a single building in each residential area. On-site field surveys and verifications were carried out for 19 communities. Training samples were produced for semantic segmentations of the land change studies.

4.2. MUDI System Methodology and Analysis

We used the UMAP method described in Section 2.3 to group the cities. Second, the dimension reduction algorithms were applied to analyze two city groups classified using the UMAP method. Third, the MUDIs for Yingping District were used to evaluate its urban renewal progress. Finally, we used the semantic segmentation algorithm described in Section 2.3 to identify the MUDI Green Ecology Index for land changes in 285 residential areas in Xiamen.

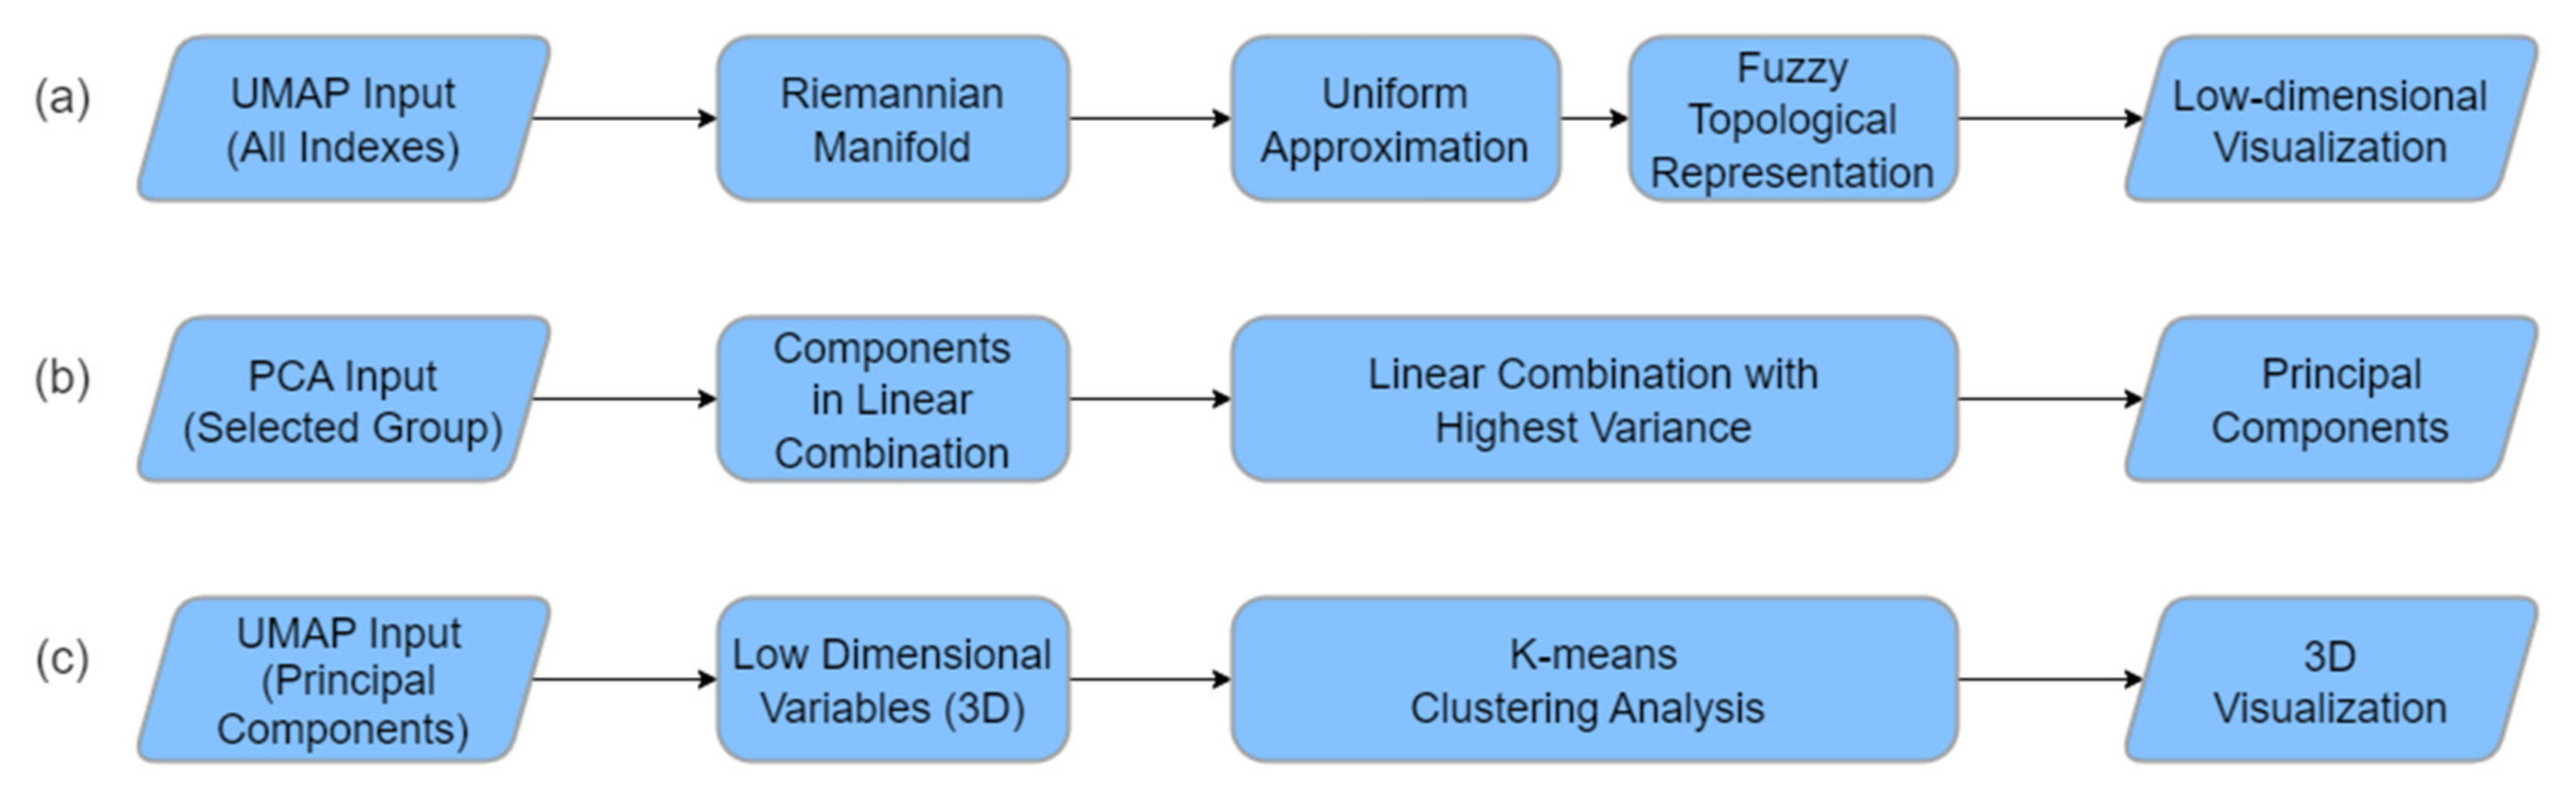
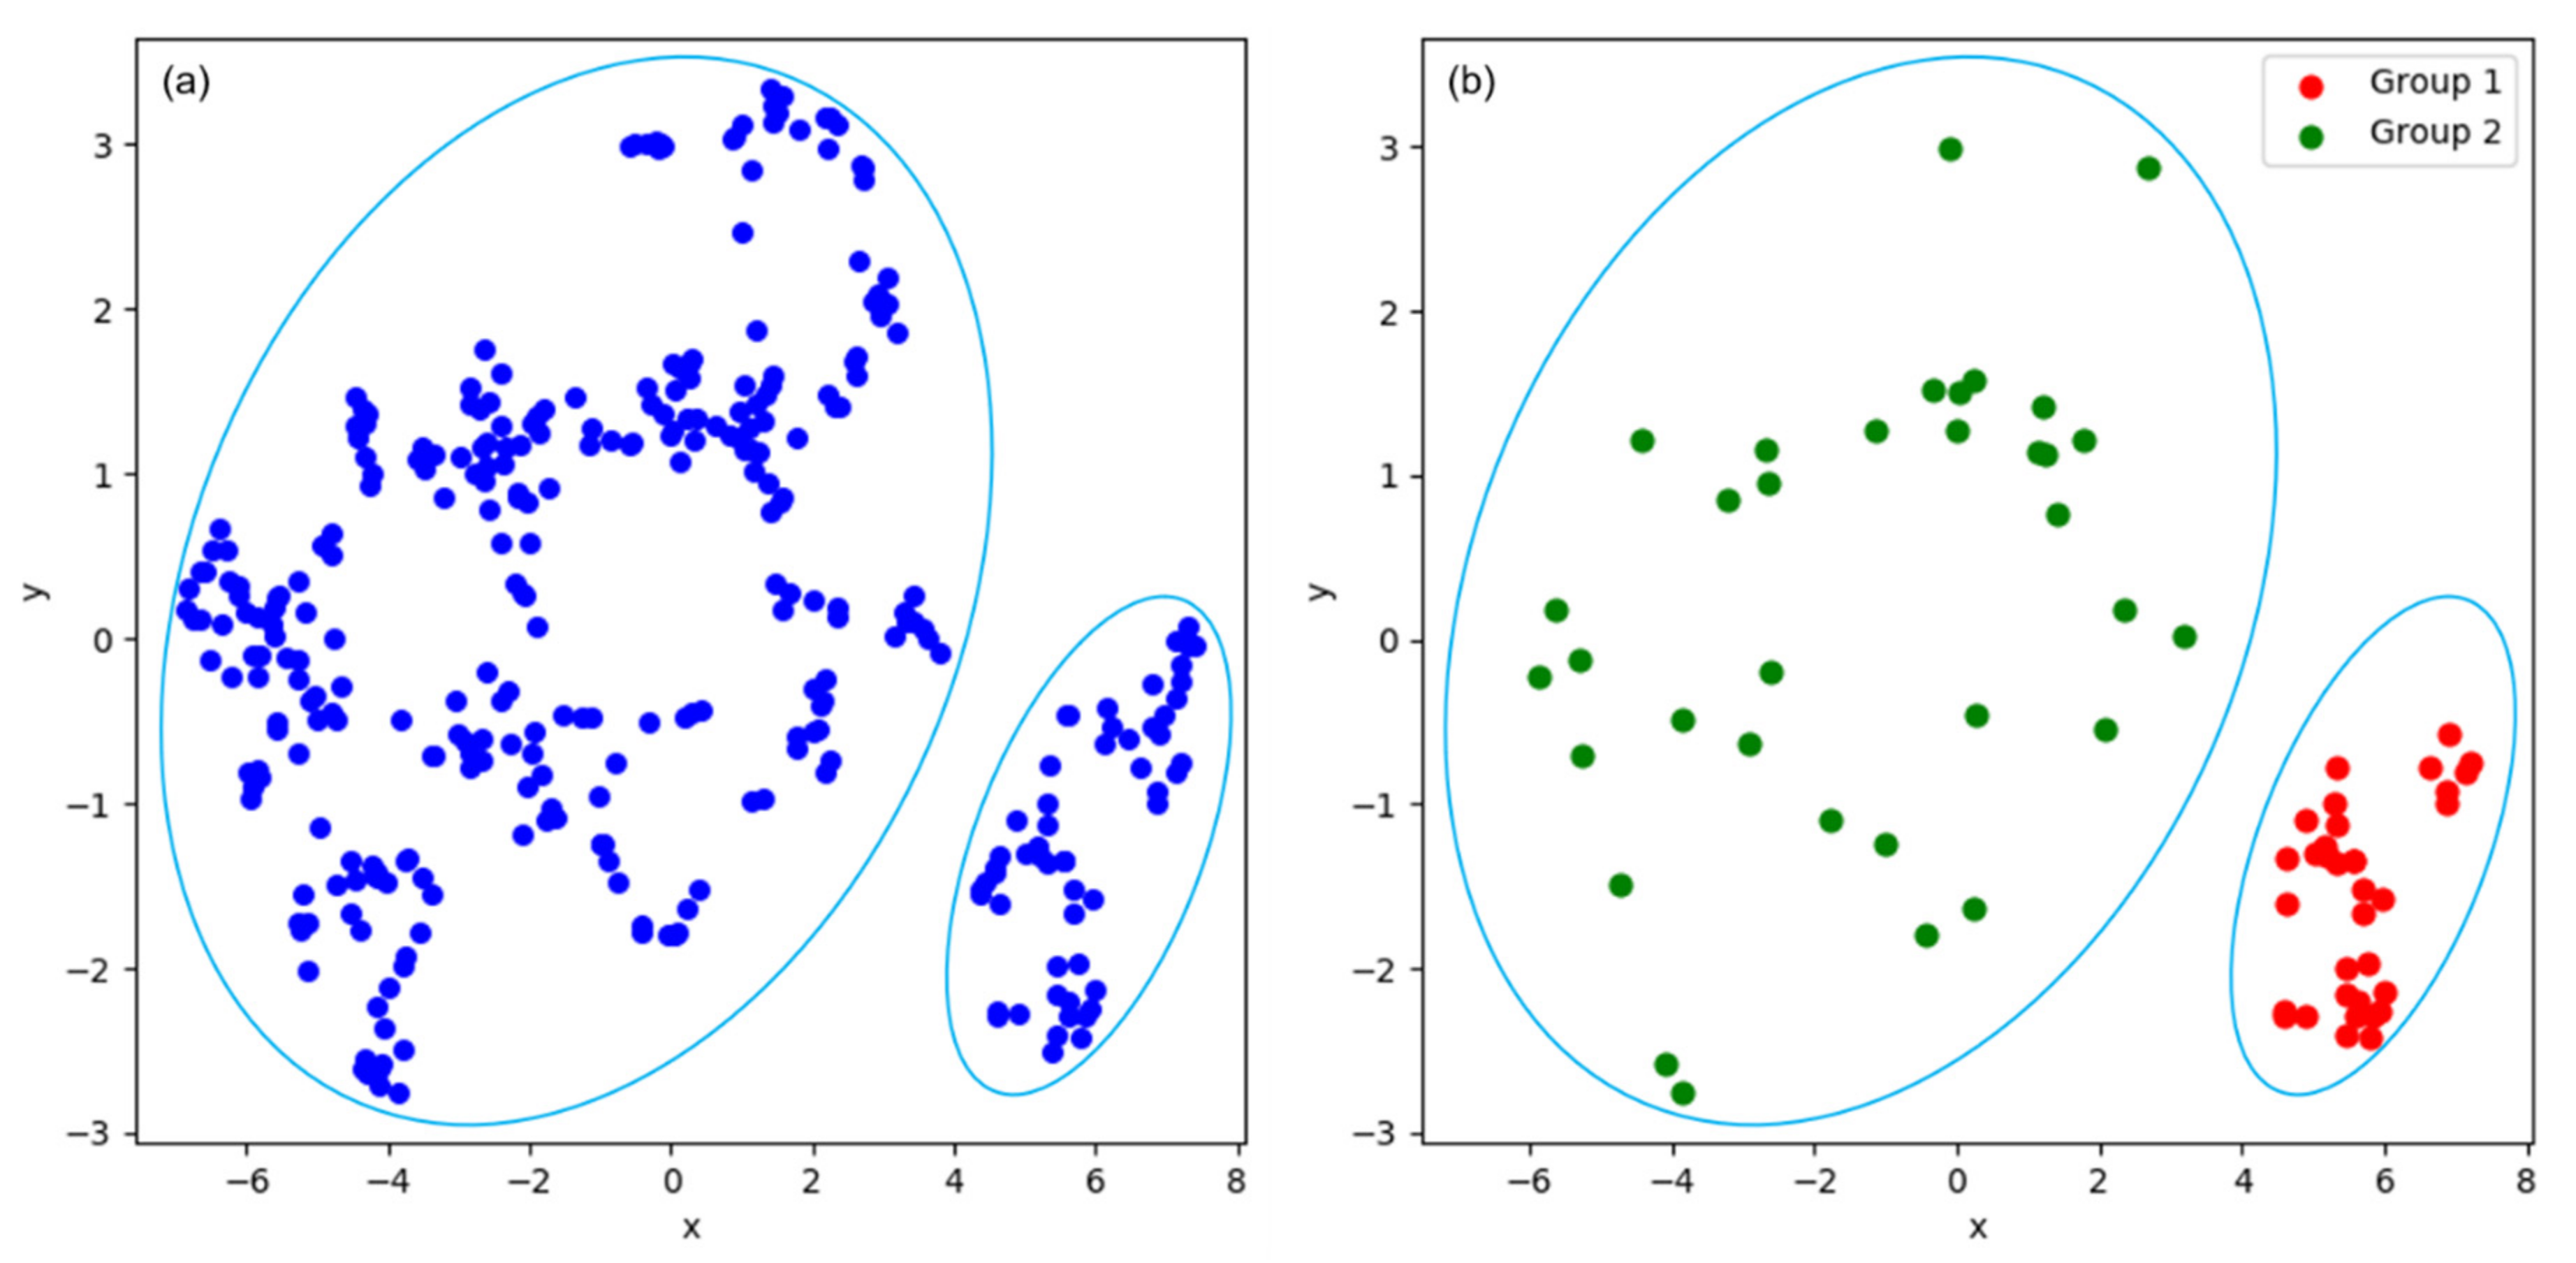
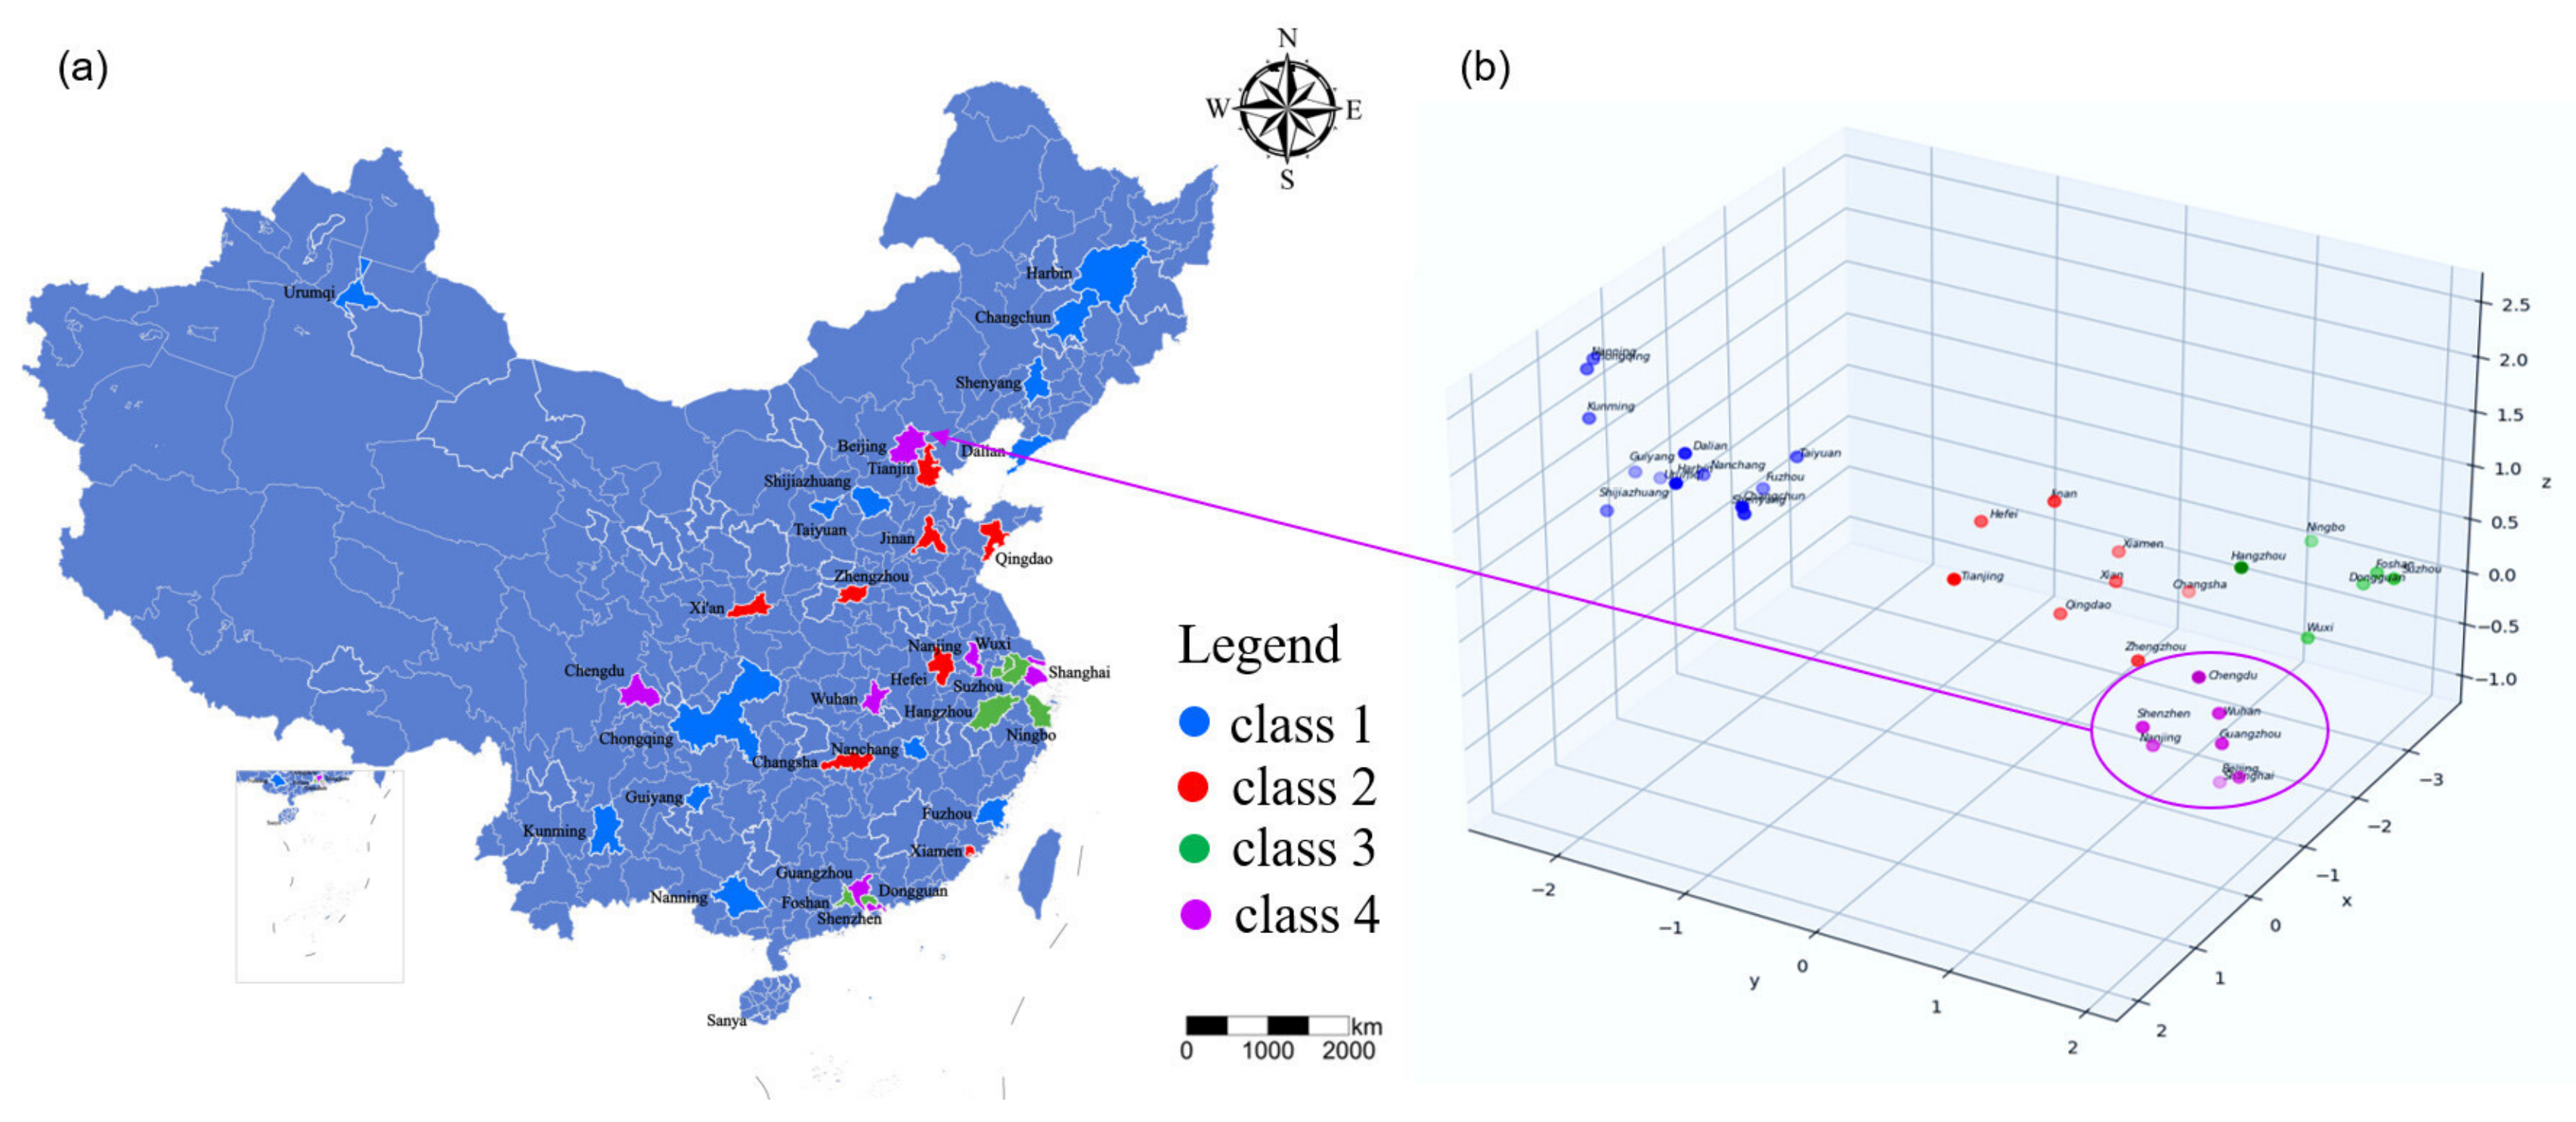
4.2.1. UMAP Classification and Correlation Study for 337 Cities

There are 337 cities in China, with 102 indexes for each city. We applied the UMAP algorithm to the data to classify 337 cities into different groups. The mathematical flowchart is shown in Figure 9 below, and the specific steps are as follows:
  • The original data were processed with missing values and standardization.
  • The UMAP algorithm was applied to the data, mapping high-dimension data to a 2D space and classifying the data.
  • We selected 34 group 1 cities and 34 group 2 cities based on the results. The data of the selected cities were further analyzed by means of a dimension reduction and main components study.
Figure 9. UMAP study of the MUDIs for 337 cities in China.
Remotesensing 16 00456 g009

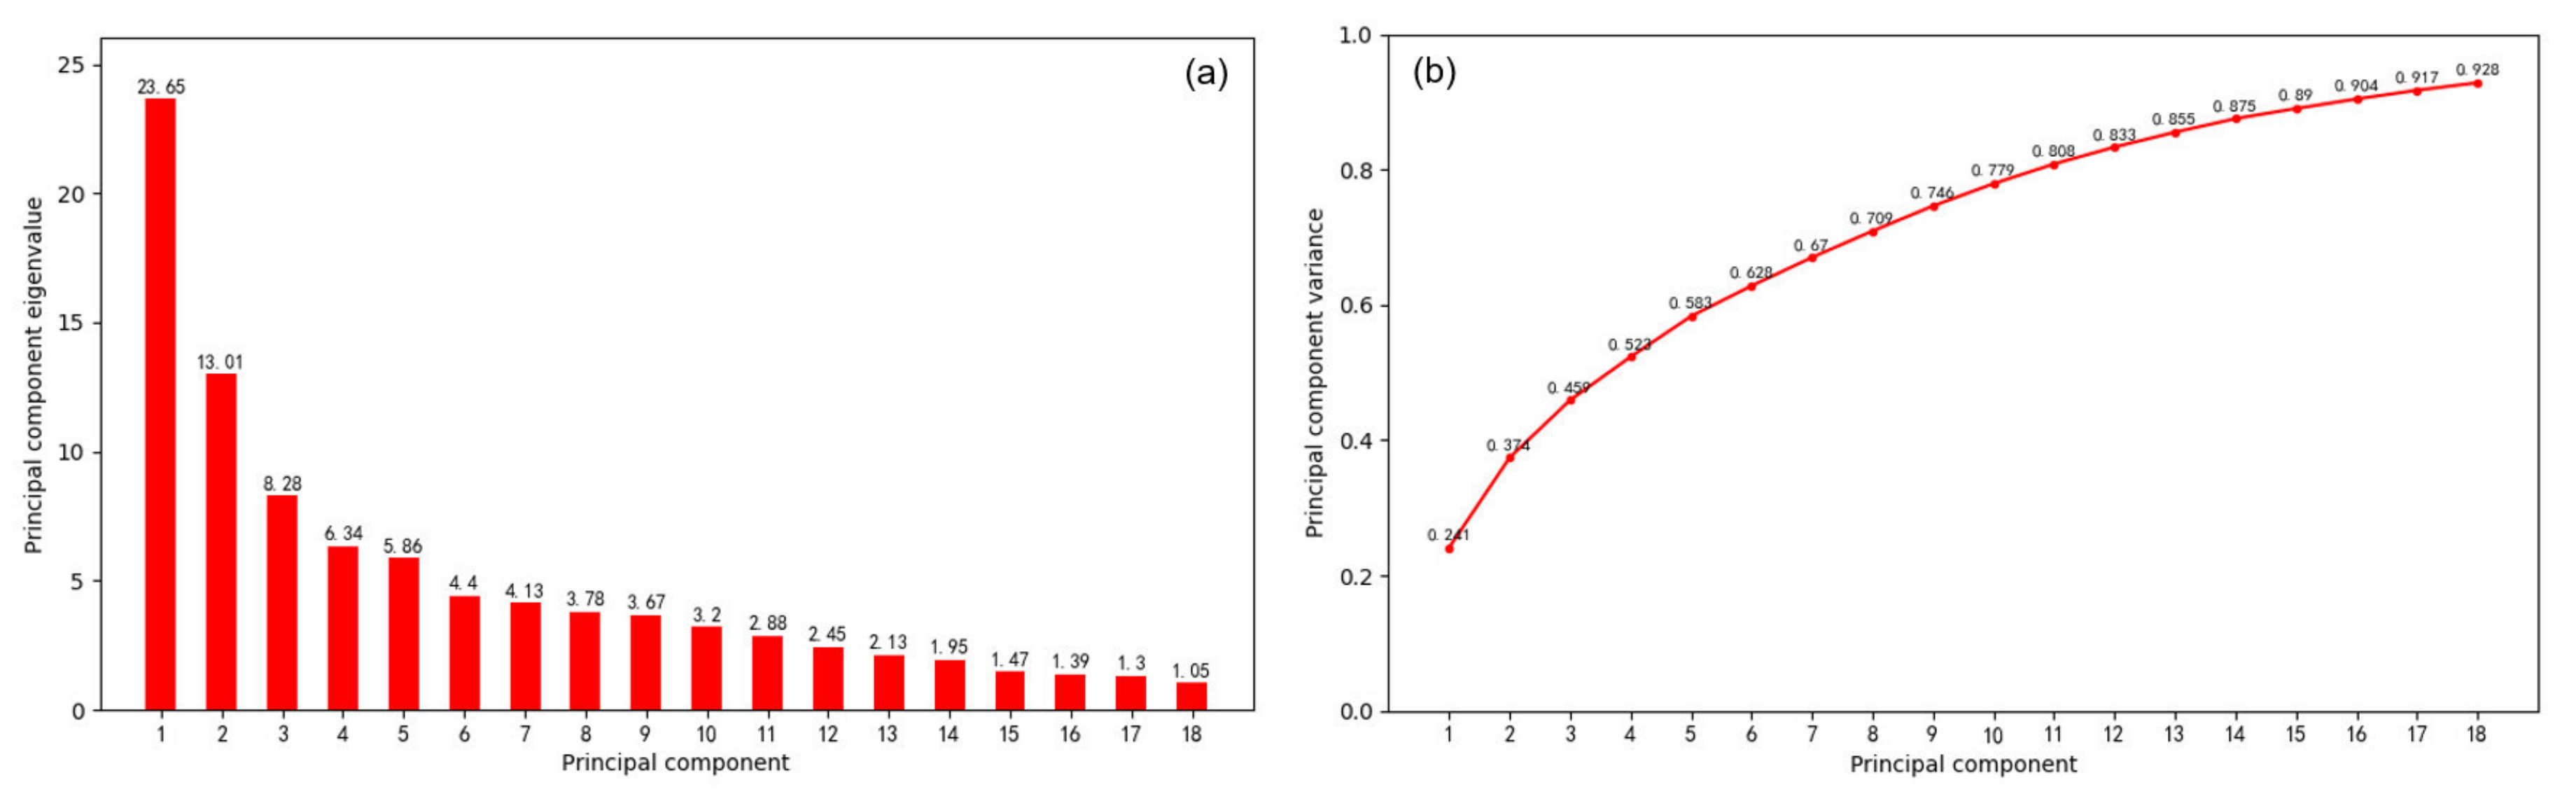
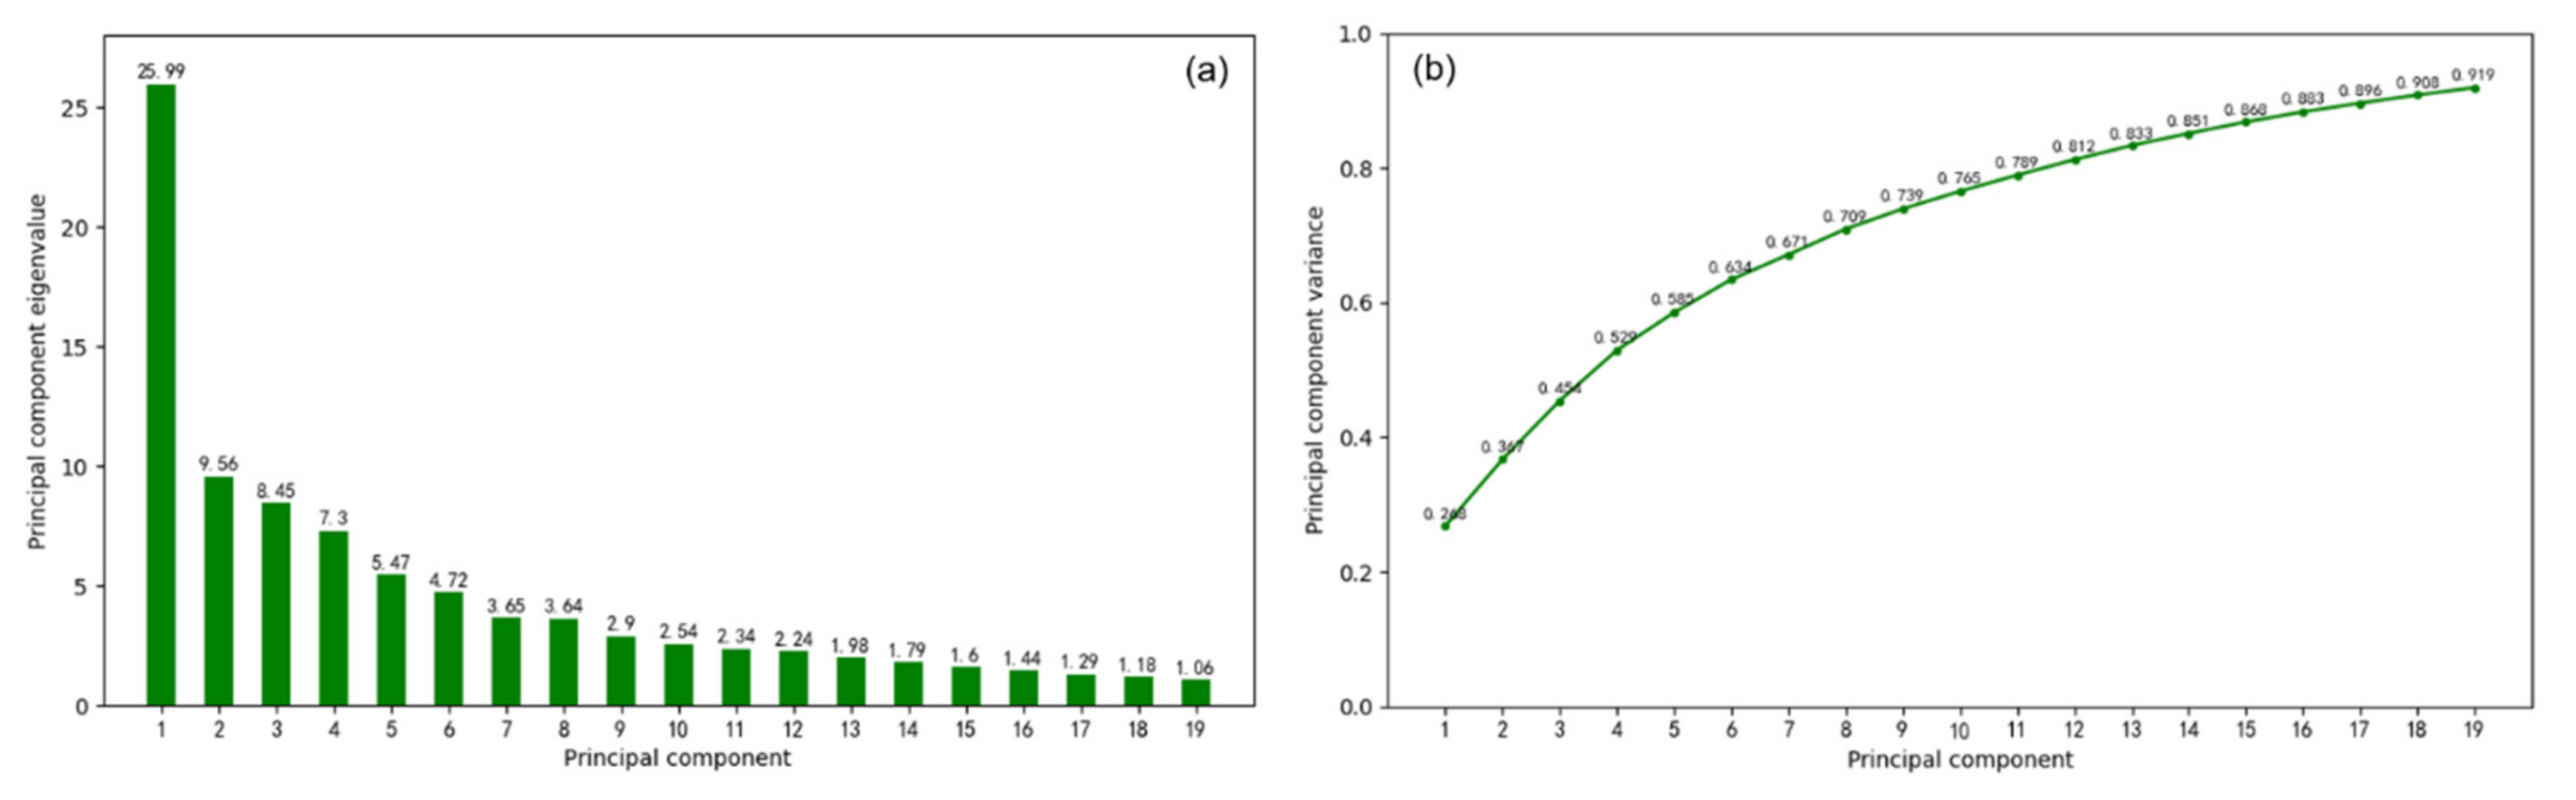
4.2.2. PCA Dimension Reduction and Main Components Study for Group 1 and 2 Cities

Two city groups were selected based on the results produced by the UMAP analysis. Then, we used the PCA dimension reduction algorithm to analyze the data. The specific steps were as follows:
4.
The original data were processed with missing values and standardization.
5.
The PCA algorithm was applied to the data, determining the number of principal components according to whether the eigenvalue was greater than 1.
6.
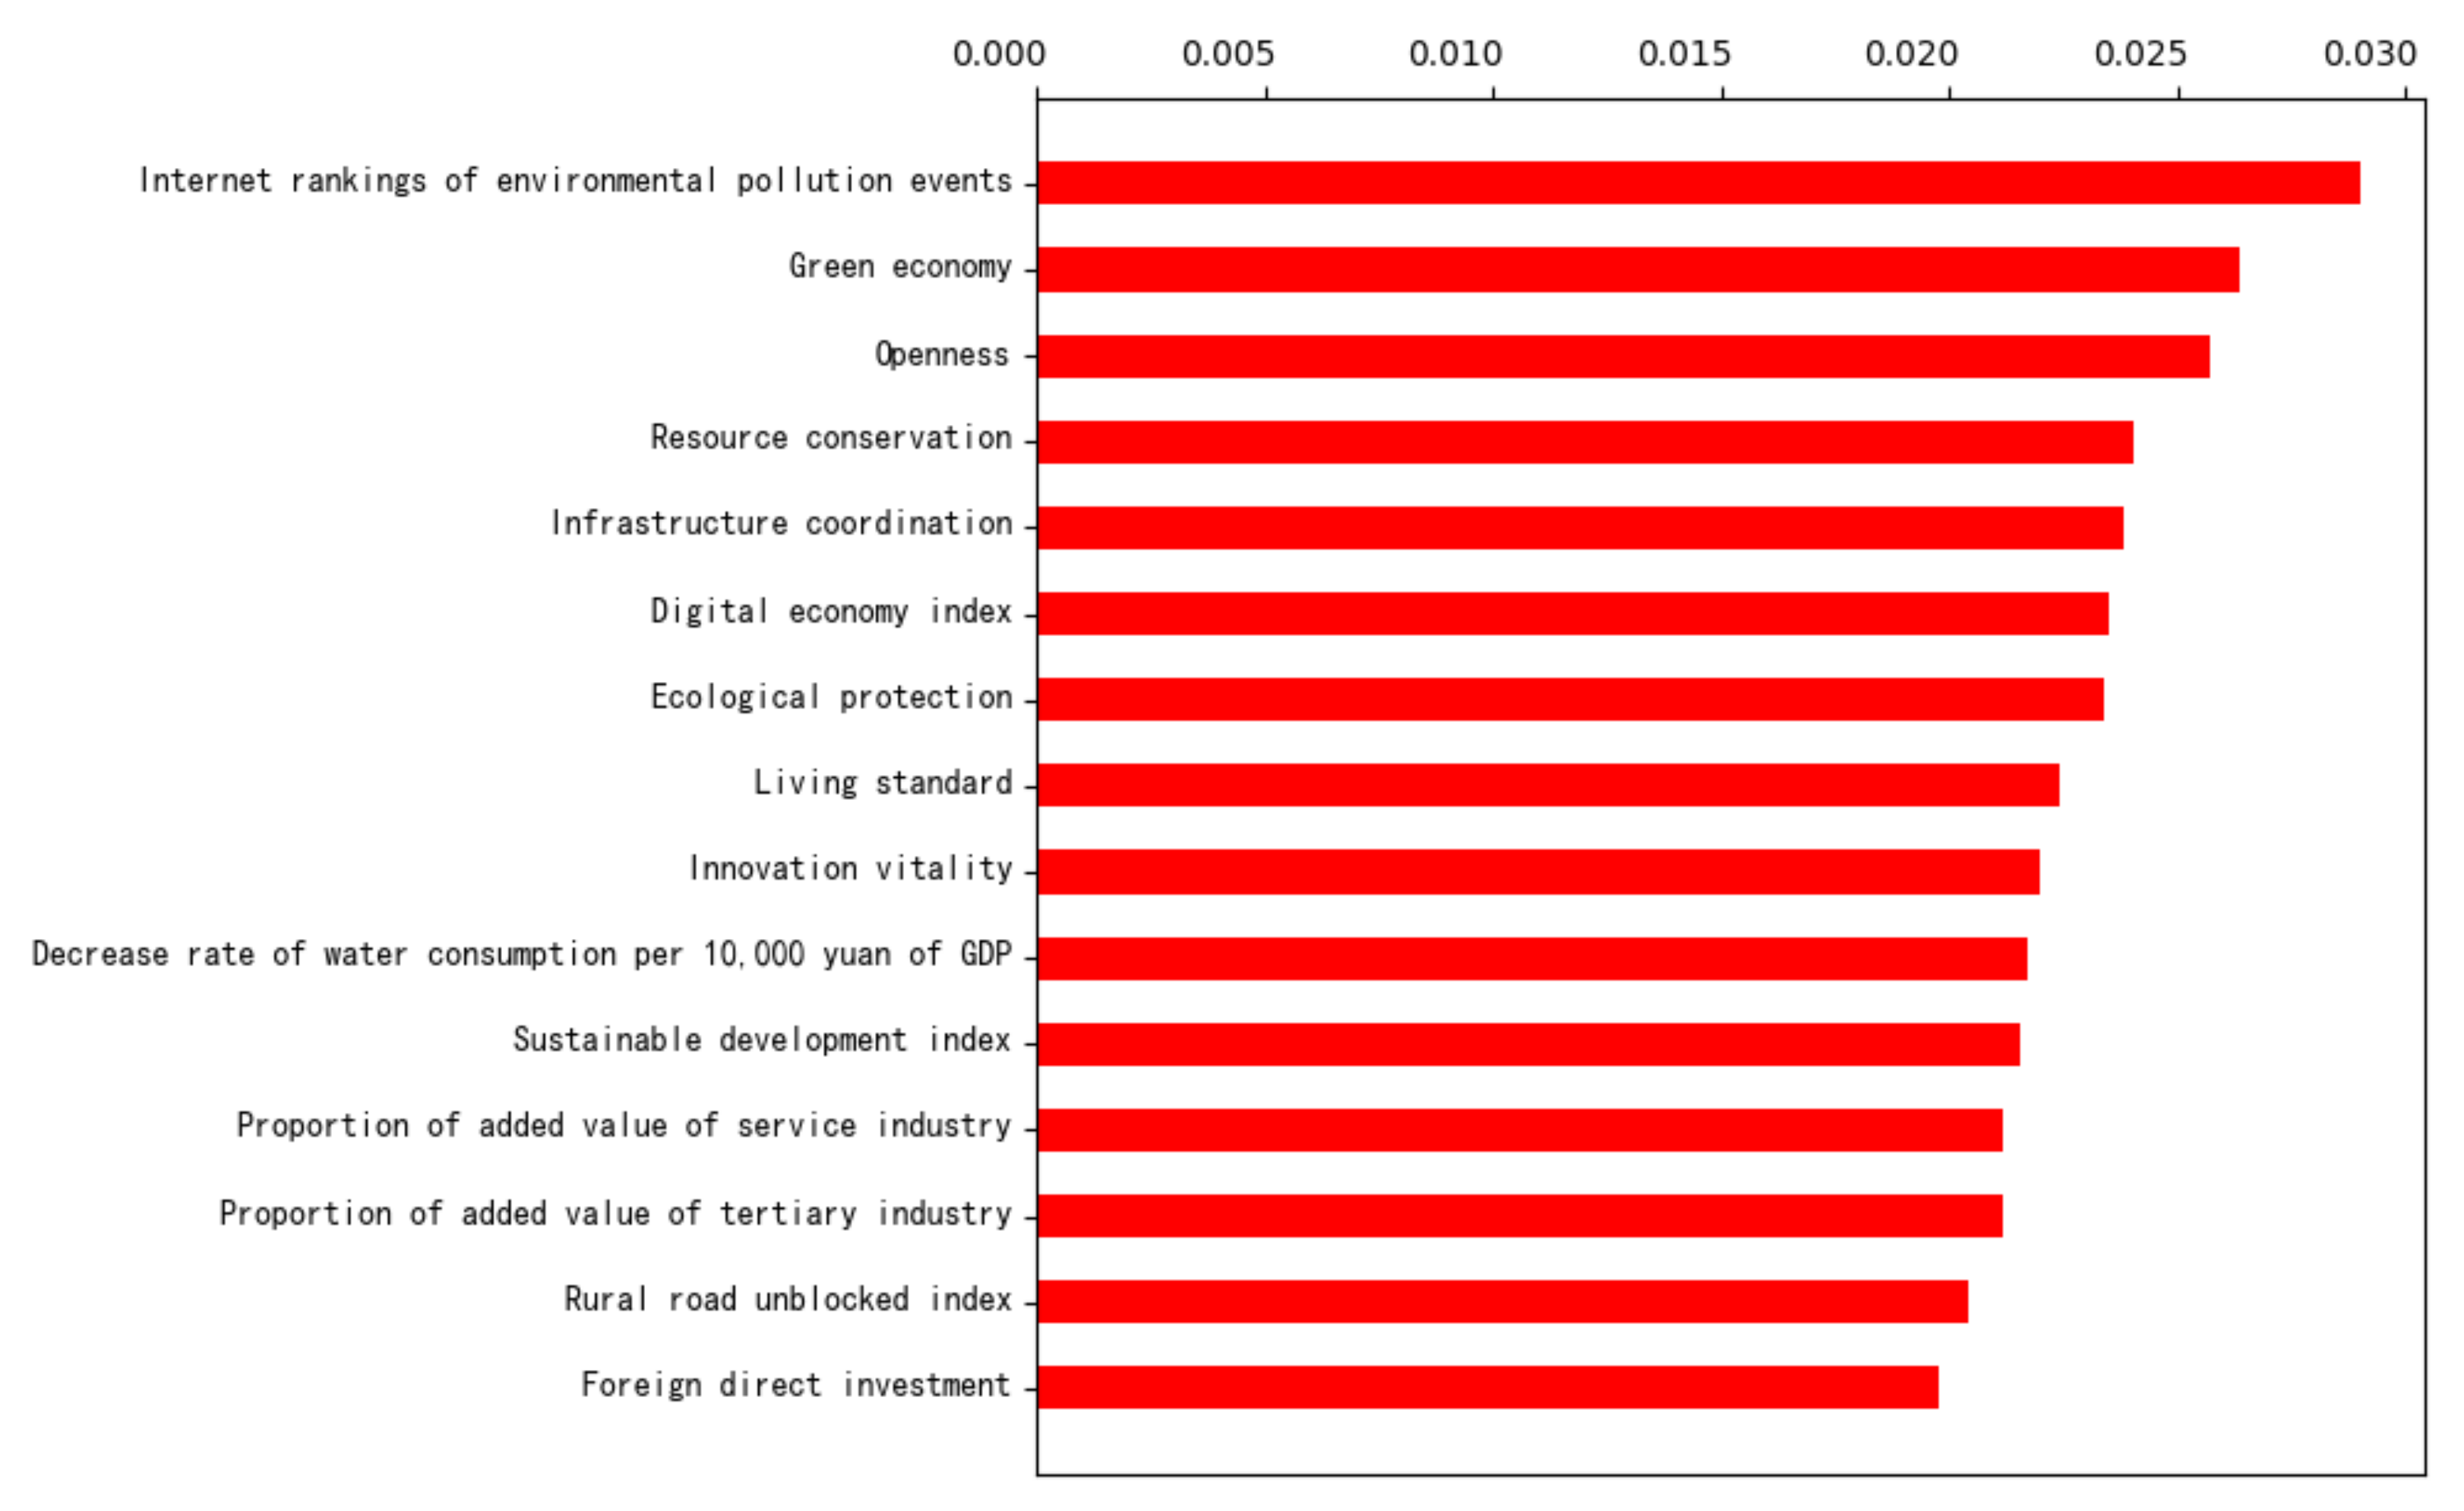
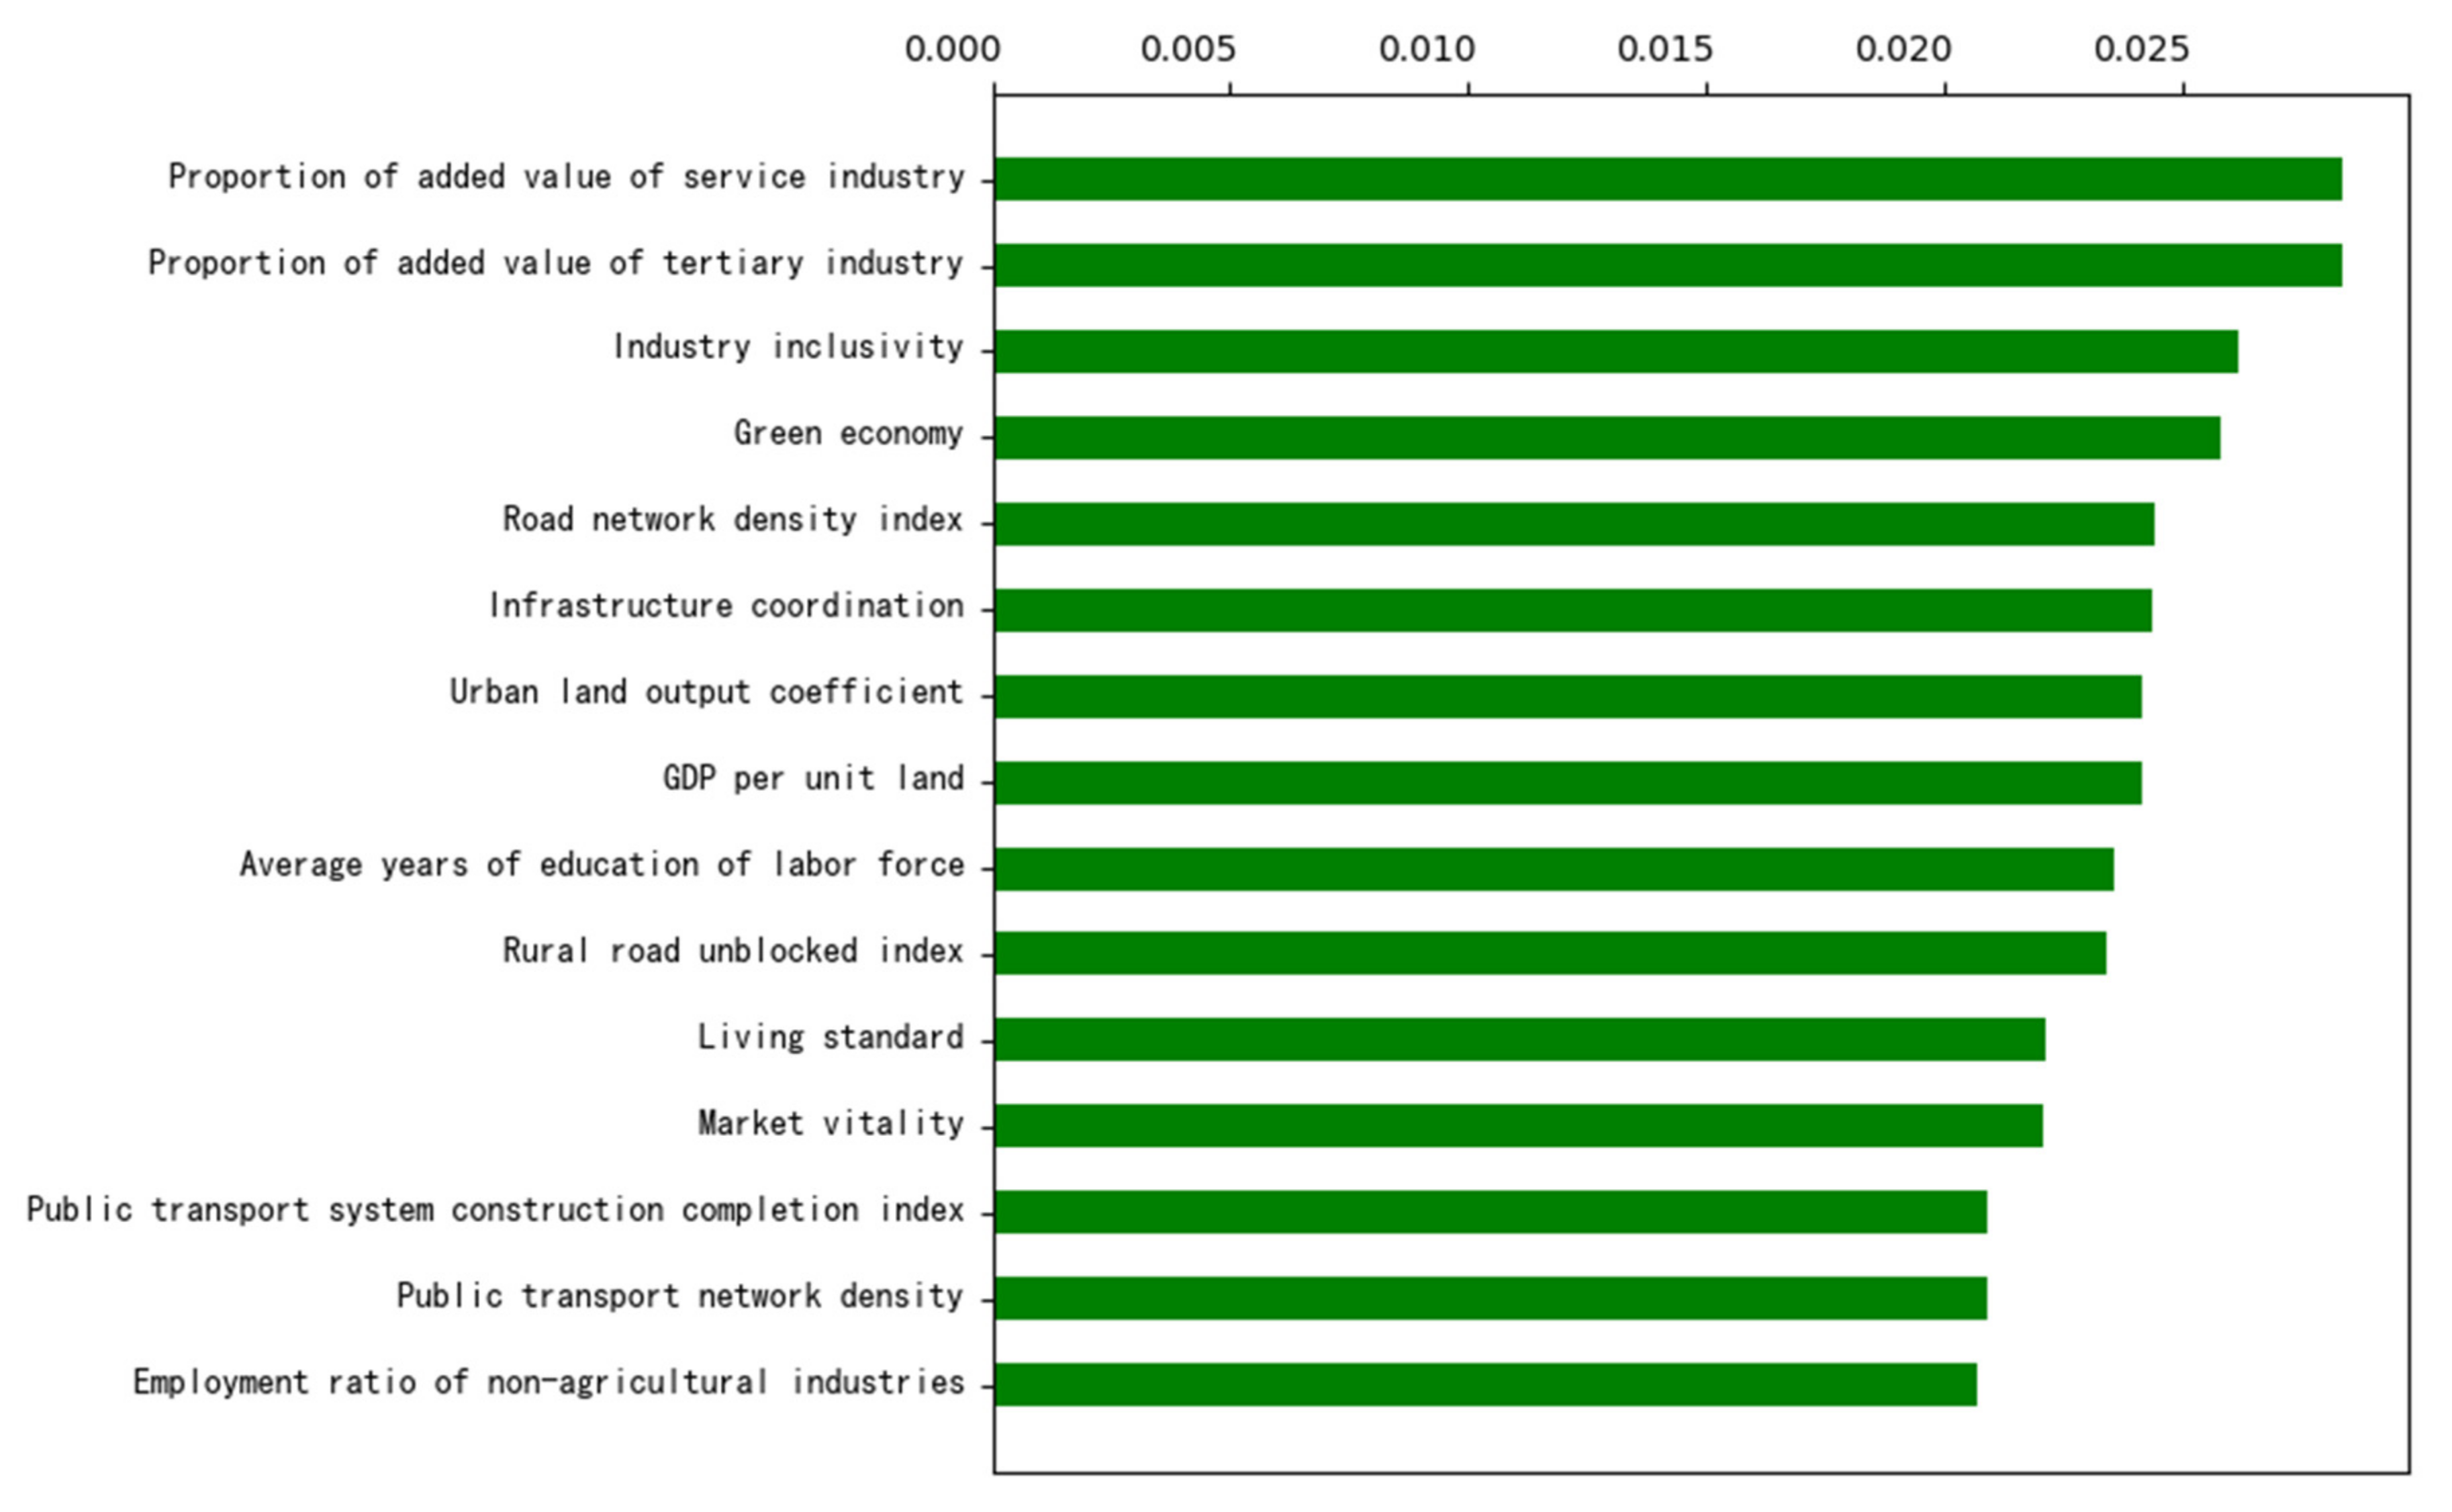
We calculated the index weights based on the principal components’ load matrixes, eigenvalues, and variances. Then, we rank the indexes from high to low to compare and analyze the importance of the MUDIs of the group 1 cities and group 2 cities.

4.2.3. PCA–UMAP Analysis for Group 1 and 2 Cities

After the PCA dimension reduction, we applied UMAP again to further map the main components into a 3D space. Based on the UMAP output results, we further classified the city groups into finer categories using the K-means clustering method.

4.2.4. MUDI Analysis for Yingping District’s Urban Renewal Development

First, we collected data based on the MUDIs for Yingping District as described in Table 2. Two types of data were collected, including data uploaded by users and data captured through social big data. Secondly, based on the collected data from Yingping District, the calculation of MUDIs was completed. Thirdly, for the MUDIs created, a GIS-based analysis was applied, which provided quantitative guidance for subsequent urban renewal efforts.

4.2.5. MUDI Green Ecology Index-Based Land Change Analysis for 285 Residential Communities in Xiamen

First, the image resolution was set to 0.26 m, and the label classification was set to a pixel level, including MUDI Green Ecology subindexes, green space, building, and “parking and others”. Second, to facilitate the AI algorithm’s training, the dataset was divided into 512 × 512 sub-images, with 3686 sub-images in total, and the ratio of the training set, verification set, and test set was 6:2:2. Third, the improved DeeplabV3+ semantic segmentation network was trained using the dataset to identify the green space, building, and “parking and others” elements.

5. Results and Analysis

5.1. MUDI Experiments and Analysis

As a result of the MUDI UMAP analysis, 337 cities in China were classified into two categories. A total of 34 cities were selected from each category.

5.1.1. MUDI Classification and Correlation Analysis for 337 Cities

The UMAP grouping analysis results are shown in Figure 10 below.
Two city groups were selected, as shown in Table 3 and Table 4. The group 1 cities included Beijing, Tianjin, Shanghai, Chongqing, Shijiazhuang, Taiyuan, Harbin, etc., which are more advanced in their administrative capacities, population sizes, built-up areas, economic levels, and other aspects. The group 2 cities included Tangshan, Jincheng, Hohhot, Baotou, Daqing, Siping, Dongying, etc., which fall behind the group 1 cities in those aspects mentioned above.

5.1.2. MUDI Component and Correlation Analysis

The PCA algorithm was used for analyzing the principal components and correlations of the MUDIs of the two city groups, separately.

Group 1 Cities Analysis

According to the method described in Section 4.2.2, a PCA dimension reduction analysis was conducted for the 34 group 1 cities. For an eigenvalue bigger than 1, 18 principal components were extracted, as shown in Figure 11. Among them, the first principal component contributed the most to the MUDIs, and its variance reached 24.14%.
By calculating the index weights based on the extracted principal components and ranking them from high to low, the top 15 most essential indexes of the group 1 cities are obtained, as shown in Figure 12.

Group 2 Cities Analysis

Similarly, a PCA dimension reduction analysis was conducted for the 34 group 2 cities. Figure 13 shows that, for an eigenvalue bigger than 1, 19 principal components are extracted. Among them, the first principal component contributed the most to MUDI, and its variance reached 26.79%.
By calculating the index weights based on the extracted principal components and ranking them from high to low, the top 15 most important indexes of the group 2 cities are obtained, as shown in Figure 14.

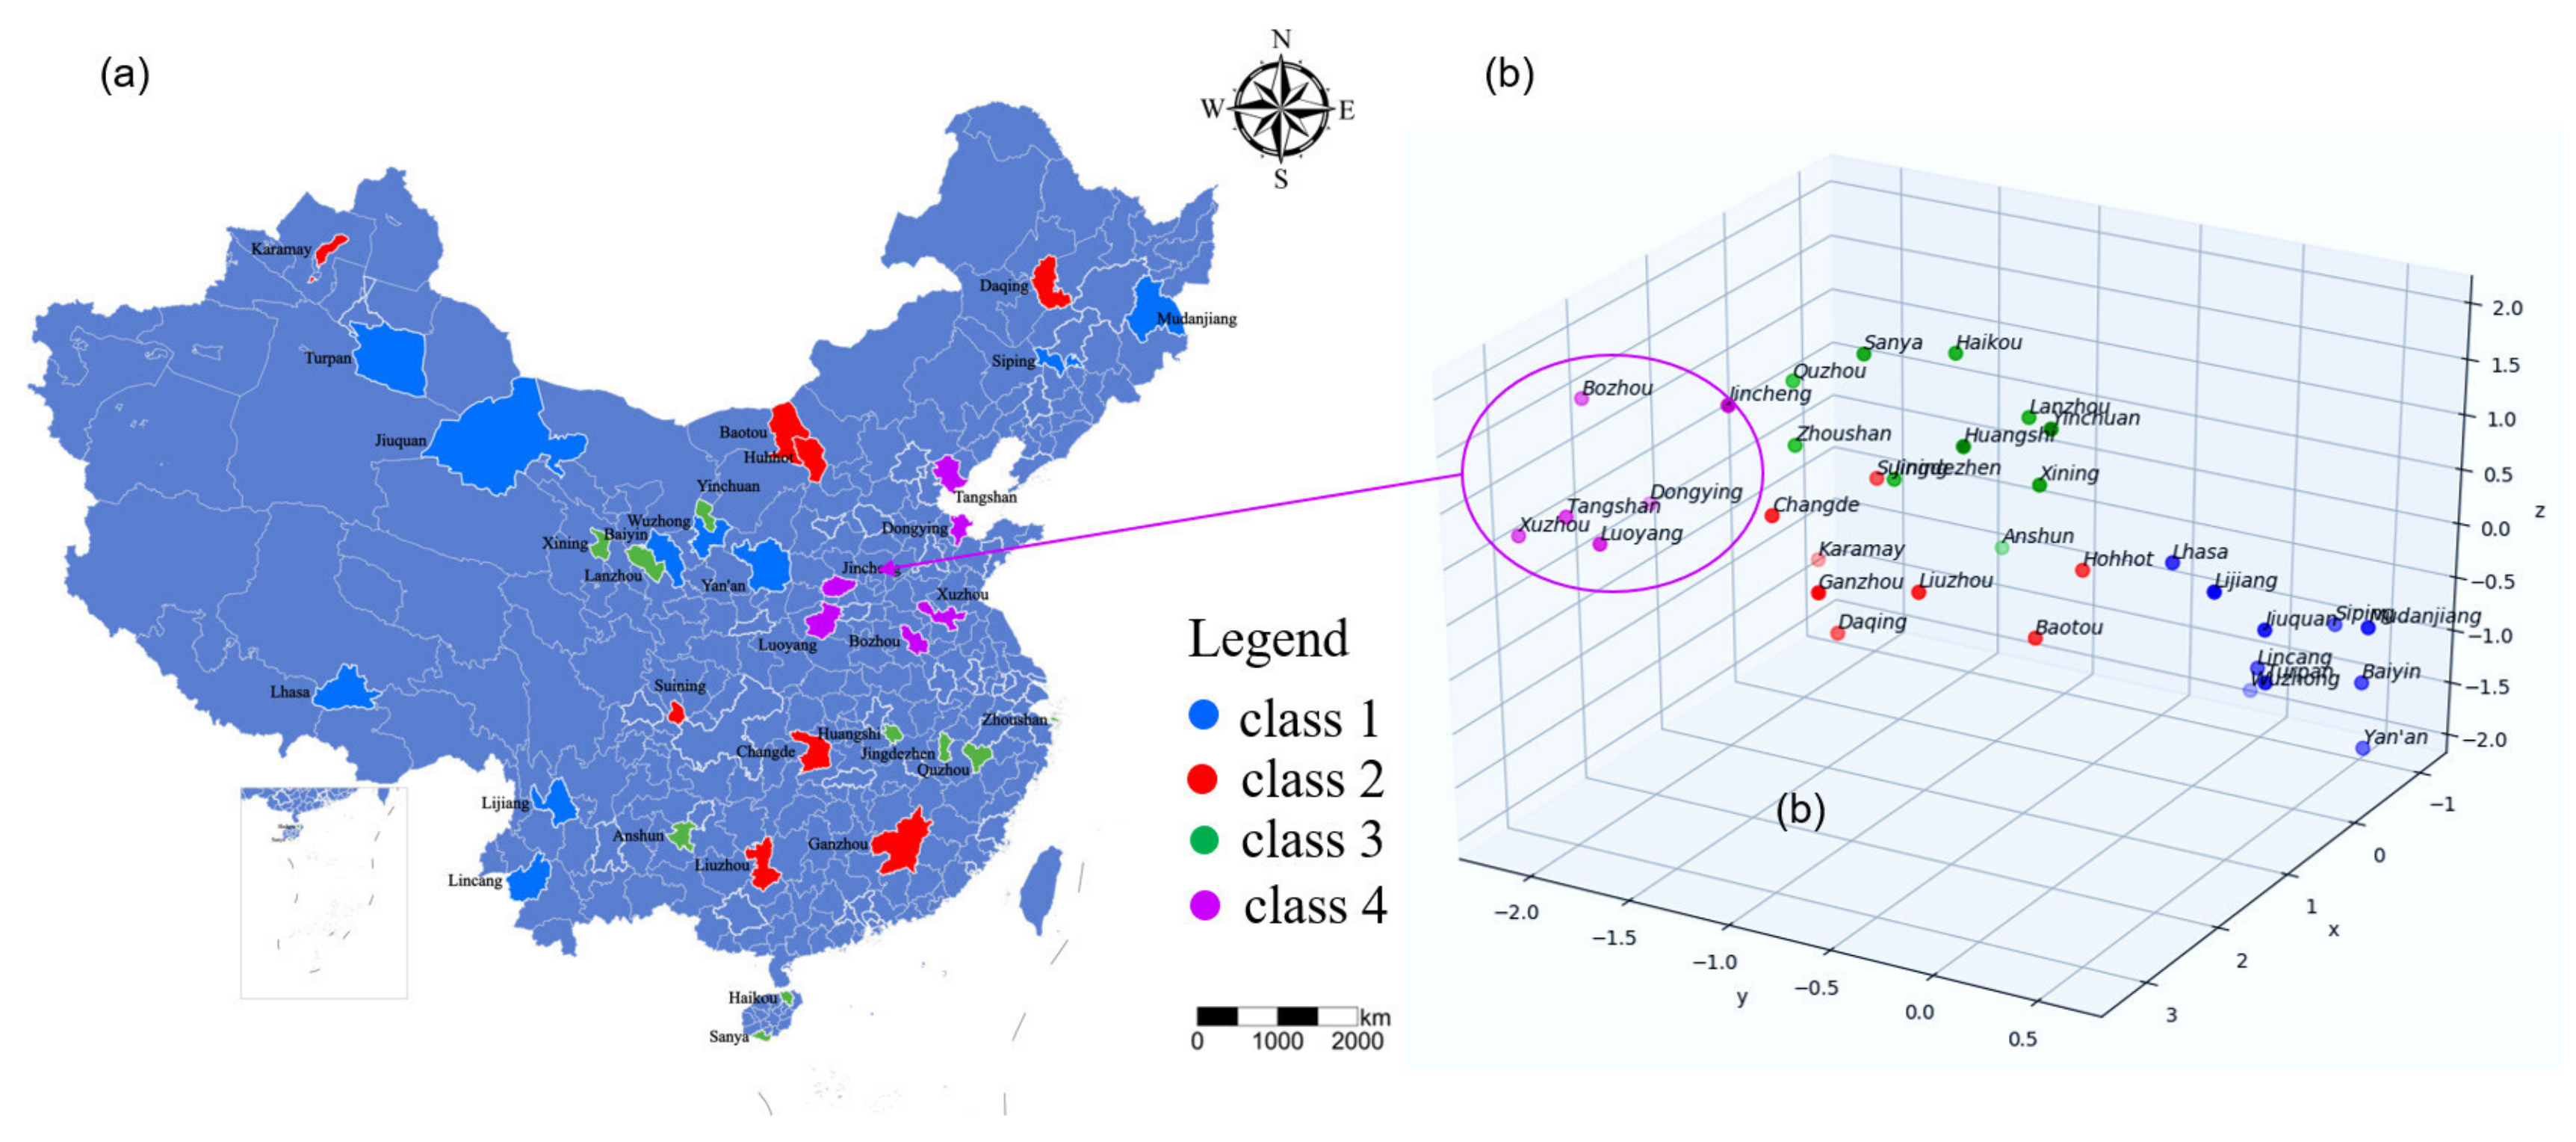
5.1.3. MUDI PCA Dimension Reduction and UMAP Finer Classification Analysis

After the PCA dimension reduction (18 dimensions for the group 1 cities and 19 dimensions for the group 2 cities), the remaining principal components were further reduced to a 3D space using the UMAP algorithm. We found that, by using the key component dimensions out of the 102 total dimensions, the method not only made understanding complex data structures and samples simpler but also reduced the data processing time and resources. After applying the UMAP algorithm, the distance similarity between the sample points in the 3D space was calculated using the K-means clustering algorithm to obtain four clusters. Thus, the group 1 cities and group 2 cities could be classified into finer categories. The categories and the associated relationship of sample cities’ visualizations are shown in Figure 15 and Figure 16 below, in which the classification results in the map of China are the same as the right 3D scatter chart corresponding to the specified colors.

5.2. MUDIs for Yingping District’s Urban Renewal Development Analysis in Xiamen

The GIS analysis results of Yingping District were as follows: (1) Through GIS analysis tools, MUDIs based on spatial data were analyzed. (2) MUDI visualization and interactive analyses were further applied. For example, to calculate the service coverage rate of a specific facility in a neighborhood, we used the GIS tool to find out the overall service coverage area of the facility with its service radius as the navigation distance, as shown in Figure 17a,b. (3) Then, we analyzed a building’s surrounding environment. This included, for example, analyzing the nearby noise, finding the nearest parcel delivery station, calculating the distance of the nearest green space, etc., as shown in Figure 17d. (4) Finally, we used an interactive analysis tool to sum up the number of buildings and building types within any specified area.

5.3. MUDI Green Ecology Index-Based Land Change Analysis for 285 Residential Communities

In Section 5.1 and Section 5.2, we described the MUDI analyses for both 337 cities and Xiamen’s Yingping District. In this section, we further demonstrate that, for each MUDI, such as the MUDI Green Ecology Index, AI-driven algorithms can be developed effectively to support city planners and builders. This further exemplifies the capabilities of the MUDI system in supporting various urban renewal needs. Take the MUDI Green Ecology Index as an example: a detailed historical land change analysis of 285 residential communities in Xiamen was performed in our study, which is in general very important for city planners to study green ecology-related changes in residential neighborhoods.
We used the method described in Section 4.2.5 to complete the training and testing of the semantic segmentation model. The results are shown in Table 5. The final OA of the DeeplabV3+ model for the test set was 72.79%, and the Kappa coefficient was 0.5839.
The land use predictions for the 285 residential community areas in Xiamen in 2002 and 2021 are shown in Figure 18. Due to insufficient labeled data and different times and imaging angles during the image acquisition processes in 2002 and 2021, the identification results for the buildings, green space, and “parking and others” categories could be further improved. Moreover, the image features of the building and “parking and others” categories on the RGB remote sensing images are relatively similar, so the two categories’ accuracy is less than that for the green space category.

6. Discussion

6.1. MUDI-Based Dimensionality and Correlation Analysis

We applied a UMAP analysis of 337 cities in China and classified the cities into adjacent groups. We observed that the city groups classified using UMAP had apparent differences in their administrative levels, population sizes, built-up areas, economic levels, and other aspects. This is in line with the actual situation. Secondly, the weighted results of the principal components analysis demonstrated the importance of the significant indexes selected for group 1 and group 2 cities. For the group 1 cities, important major indexes included internet rankings of environmental pollution events, green economy, openness, resource conservation, infrastructure coordination, digital economy index, etc. For the group 2 cities, important major indexes included the proportion of the added value of the service industry, tertiary industries, industry inclusivity, green economy, road network density index, infrastructure coordination, etc.
Among the top 15 most important indexes for the group 1 and group 2 cities, the co-occurring indexes were green economy, infrastructure coordination, living standard, the proportion of the added value of the service industry, the proportion of the added value of the tertiary industry, and the rural road unblocked index. These important indexes reflected the importance of green ecology, diversity and inclusivity, and living comfort in these cities. These indexes had a prominent impact in the group 1 and group 2 cities. In addition, the two types of cities also had specific indexes that stood out. For example, the openness of the group 1 cities was an important index reflecting city characteristics, and the road network density index of the group 2 cities was an important index reflecting the convenience of transportation in these cities.
There were both similarities and differences in the MUDIs emphasized by the group 1 cities and the group 2 cities. This is because the principal components are a linear combination of various index variables, which fully account for the correlation between the indexes. It is worth mentioning that we could further analyze the index correlations to explore the data distribution, which could help us understand the index weight results of the PCA. There were apparent differences between the group 1 and group 2 cities in population size, built-up area, economic development level, and other aspects, so the indexes that played an essential role in the urban development of these cities are different. This method can guide an in-depth analysis of the MUDI system, the evaluation of urban development, the discovery of urban problems, etc.

6.2. MUDI-Based City Finer Classification Analysis

After the MUDI dimension reduction and classification analysis, the group 1 and group 2 cities could be further classified into finer categories. We found more internal correlations among the selected cities through an in-depth analysis of the characteristics of cities in the same category. We found that cities with similar administrative levels or close to each other in geographical space were more likely to be classified into the same category. For example, among the group 1 cities, as shown in Figure 15, Beijing, Shanghai, Guangzhou, and Shenzhen belong to the same category. They are all first-tier cities in China. Changchun, Dalian, Harbin, and Shenyang belong to the same category, located in Northeast China. Ningbo, Hangzhou, Wuxi, and Suzhou fall into the same category; they are all located in the Yangtze River Delta in Eastern China. Among the group 2 cities, as shown in Figure 16, Yinchuan, Lanzhou, and Xining belong to the same category, located in Northwest China. Lincang, Lhasa, and Lijiang fall into the same category in Southwest China. This is in line with the actual situation. Cities in the same category are more likely to be at a similar stage of development in terms of economic conditions, policies, resource conditions, etc. There exist intrinsic correlations in the characteristics of MUDIs, which is worthy of further research.
By combining the PCA and UMAP algorithms, a secondary dimension reduction analysis of the MUDI data could be realized, simplifying and emphasizing key dimension reduction factors. At the same time, UMAP could be used to approximate the spatial distribution relationship of the data after PCA dimension reduction, which would help display the similar relationship between sample points in a high-dimensional space and those in a low-dimensional space, providing a more intuitive understanding of the correlation between sample cities and PCA dimension reduction results. The experiment results verified the thinking that running UMAP once would have presented grouping characteristics purely from the abstract mathematical space. However, after group 1 and 2 cities had been selected, by breaking down the 102 total dimensions to the key component dimensions for both groups, UMAP made understanding complex data structures and samples simpler by allowing us to observe the key indexes visually, reducing the data processing times and resources required at the same time.

6.3. MUDI-Based Yingping District’s Urban Renewal Analysis

Our quantitative evaluations objectively portrayed the urban renewal status of Yingping District. Based on the MUDI analysis, the following results provide guidance for urban renewal development: (1) Relevant industrial and service sectors are not in satisfactory conditions. (2) The safety measures for businesses and services need to improve. (3) Further research and analyses are needed to promote a business atmosphere with regional characteristics by improving historical buildings and focusing on regional heritage. (4) The progress of emerging new businesses and industries is satisfactory, with suggestions to build a business street with Yingping characteristics to attract more tourists and local citizens. (5) Green space is lacking. With a population of about 13,907 people, the per capita green space is 0.1532 per square meter, which is below the national standard. (6) There is only one elderly service station located in Yingping District with insufficient beds, which is not enough to meet the needs of the area. (7) The sanitary environment should also be improved for the commercial street.
By applying the MUDI system to urban renewal efforts for Yingping District, we found that the system can be applied as a comprehensive dynamic monitoring and evaluation framework for urban renewal planning and development, diagnosing urban development problems, supporting the realization of effective urban risk warnings, planning guidance, and development supervision. By integrating social big data, AI, remote sensing, visualization technologies, etc., insightful and noteworthy results were achieved through our MUDI evaluation and analysis, with scientific quantifications. As urban renewal development and management needs are critically important worldwide, the MUDI system can be further developed for and applied to such growing needs.

6.4. MUDI Green Ecology Index-Based Land Change Analysis for 285 Residential Communities

The land use prediction results for 285 residential community areas in 2002 and 2021 presented noticeable differences, as shown in Figure 18. During the past 20 years, the land changes in these residential areas have been large. In general, the areas occupied by buildings and “parking and others” are increasing, while the areas dedicated to green space are decreasing. Through the urban renewal development evaluation of the old residential areas in Xiamen, the following benefits were observed: (1) analysis of the residential areas before and after the urban reconstructions; (2) refined management and monitoring of the reconstruction process for the residential areas; and (3) objectively and accurately evaluation of the reconstruction effectiveness.
We now take the MUDI Green Ecology Index as an example to demonstrate that all 102 MUDIs can be studied using AI-driven technologies and algorithms, which exemplifies the effectiveness and broader applicability of the MUDI system for urban renewal planning and development.
The MUDI Green Ecology Index was set up using remote sensing data in the finer scale of submeter satellite images. In our study, we found that historical remote sensing data are readily available for cities and that using remote sensing sensors’ information as key components or dimensions in MUDI specifications adds value and additional means for urban planning and management.

6.5. Limitations and Future Research

First, the MUDI component and finer classification analysis in this study was conducted for two groups of cities selected from UMAP groupings of 337 cities in China. It may be beneficial to consider more cities to verify further the generality of the PCA and UMAP dimension reduction algorithms. Secondly, for land use prediction, more sample data, such as infrared features, are needed to use the transfer learning method to optimize the DeeplabV3+ algorithm to improve the accuracy of building, green space, and parking identification and improve further the reliability of land change analyses of residential areas.
We selected the green ecology subindexes and applied the semantic segmentation algorithm to study the land change in residential community areas in Xiamen. In the future, this methodology could be expanded for more MUDIs to explore AI-driven solutions.
We built a knowledge graph to visualize the MUDIs in this study. We also studied a dialogue system to help users query MUDI- and data-related information and obtain the corresponding knowledge. The human–computer dialogue realized using AI algorithms and knowledge graphs can be used to quickly search for answers and achieve real-time interactions with users. It is an essential direction for AI-driven studies for urban renewal. The system can also be integrated with large language models [55,56]. We believe that this is conducive to solving the information islands’ problems among different stakeholders and for effective information sharing.
Historical temporal data can be collected and processed based on MUDI specifications. By applying the data model and specific vertical industry MUDI specifications, the dynamic simulation of future urban and industrial growth can be projected and studied for Xiamen and other cities.
For our study of 337 cities in China, information was collected entirely from public internet domain data, which take time to collect and process. Such an effort can be extended internationally in the future for additional understanding in the selection of cities and regions and data collections.

7. Conclusions

Rapid urbanization over the past half-century has posed great challenges to global urban renewal and regeneration efforts. With the advancement of digital technologies, three main discipline research areas are converging; these are remote sensing technologies, planning and management for and by urban development organizations and communities, and social big data- and artificial intelligence-driven technologies. Empowered by newly developed technologies, comprehensive goal-oriented digital planning and analyses provide unprecedented benefits for urban renewal development and regeneration. We developed a municipal and urban renewal development index (MUDI) system with mathematical analysis models and a methodology and implementation framework for urban renewal and regeneration studies. The MUDI system consists of three main components: (1) a data model; (2) MUDI specifications, MUDI dimensionality, and a correlation analysis; and (3) GIS- and AI-driven technologies and algorithms. By applying the MUDI system to 337 cities in China and to 285 residential communities and the Yingping District in Xiamen, we found that the MUDI system is effective and inclusive for designing, managing, and monitoring urban renewal projects, meaning that it can be applied to urban renewal efforts across cities and regions. The MUDI system contributes to the existing studies in the following areas. First, the data model is extended and used for urban renewal processing by combining multisource datasets into abstract feature layers consisting of multi-level functions, including a foundation layer, a summation feature layer, a density index function, a visualization analysis layer, and an application solution layer. It supports large volumes of data with high dimensionalities and effectively stores temporal data. Secondly, the MUDI system is created with built-in mathematical analysis functionalities such as UMAP and PCA to provide insightful interpretations of multi-dimensional indexes and correlations. Thirdly, AI-driven technologies and algorithms can be built into the MUDI system for various indexes, adding additional capabilities for the MUDI solution layer. Such a system shall enable urban renewal planning and management more effectively by leveraging fast-advancing digital twin technology. This study presents a detailed demonstration of a data-driven analysis for cities and urban areas with rich experiments. Incorporating the MUDI system with additional AI-driven algorithms is a new and effective method for urban renewal development, which can be flexibly extended and applied to various cities and urban districts.

Author Contributions

Conceptualization, X.W.; methodology, X.W. and P.G.; formal analysis, X.W., X.L. (Xuecao Li), X.L. (Xianyao Ling), T.W., S.H., Y.Z., B.C., L.B., X.S., R.Z. and J.L.; writing—original draft preparation, X.W., Y.Z. and X.L. (Xianyao Ling); writing—review and editing, B.C. and X.L. (Xuecao Li); software, J.W. and Y.Z.; investigation, X.W., B.C. and X.L. (Xuecao Li); resources, X.W. and P.G.; data curation, J.W., L.Z. and X.L. (Xianyao Ling); visualization, X.W., Y.Z. and X.L. (Xianyao Ling); supervision, X.W.; funding acquisition, P.G. and X.W. All authors have read and agreed to the published version of the manuscript.

Funding

This research was funded by the City Digital Appraisal research project and the High-resolution GIS Study for the Urban Management Phase II project established by the Ministry of Housing and Urban Rural Development of the People’s Republic of China.

Data Availability Statement

The data presented in this study are available on request from the corresponding author. The data are not publicly available due to privacy.

Acknowledgments

This research was supported by the Department of Automation, AI for Earth Laboratory, Cross-strait Research Institute, Tsinghua University. We express our appreciation for our colleagues Linping Deng, Kun Li, and Yifan Liu in the laboratory for their support in field inspections and software preparation.

Conflicts of Interest

Author Li Zheng was employed by the company 2861 Data Technology. The remaining authors declare that the research was conducted in the absence of any commercial or financial relationships that could be construed as a potential conflict of interest.

References

  1. United Nations. World Urbanization Prospects: The 2014 Revision; United Nations: New York, NY, USA, 2015. [Google Scholar]
  2. Zhu, M.; Shen, L.; Tam, V.W.; Liu, Z.; Shu, T.; Luo, W. A load-carrier perspective examination on the change of ecological environment carrying capacity during urbanization process in China. Sci. Total Environ. 2020, 714, 136843. [Google Scholar] [CrossRef]
  3. The World Bank. Available online: https://www.worldbank.org/en/topic/urbandevelopment/overview (accessed on 16 July 2020).
  4. Angel, S.; Parent, J.; Civco, D.L.; Blei, A.; Potere, D.T. The dimensions of global urban expansion: Estimates and projections for all countries, 2000–2050. Prog. Plan. 2011, 75, 53–107. [Google Scholar] [CrossRef]
  5. Urban Climate Action—The Urban Content of the NDCs: Global Review. 2022. Available online: https://unhabitat.org/urban-climate-action-the-urban-content-of-the-ndcs-global-review-2022 (accessed on 10 January 2023).
  6. Fernández, J. Resource Consumption of New Urban Construction in China. J. Ind. Ecol. 2007, 11, 99–115. [Google Scholar] [CrossRef]
  7. Renard, F.; Alonso, L.; Fitts, Y.; Hadjiosif, A.; Comby, J. Evaluation of the Effect of Urban Redevelopment on Surface Urban Heat Islands. Remote Sens. 2019, 11, 299. [Google Scholar] [CrossRef]
  8. Maity, J.P.; Bundschuh, J.; Chen, C.; Bhattacharya, P. Microalgae for third generation biofuel production, mitigation of greenhouse gas emissions and wastewater treatment: Present and future perspectives—A mini review. Energy 2014, 78, 104–113. [Google Scholar] [CrossRef]
  9. Graymore, M.; Sipe, N.G.; Rickson, R.E. Sustaining Human Carrying Capacity: A tool for regional sustainability assessment. Ecol. Econ. 2010, 69, 459–468. [Google Scholar] [CrossRef]
  10. Jeon, J.; Suh, Y. Analyzing the Major Issues of the 4 th Industrial Revolution. Asian Soc. Innov. Policy 2017, 6, 262–273. [Google Scholar]
  11. Gong, P.; Yu, L.; Li, C.; Wang, J.; Liang, L.; Li, X.; Ji, L.; Bai, Y.; Cheng, Y.; Zhu, Z. A new research paradigm for global land cover mapping. Ann. GIS 2016, 22, 87–102. [Google Scholar] [CrossRef]
  12. Chen, B.; Xu, B.; Gong, P. Mapping essential urban land use categories (EULUC) using geospatial big data: Progress, challenges, and opportunities. Big Earth Data 2021, 5, 410–441. [Google Scholar] [CrossRef]
  13. LeCun, Y.; Bengio, Y.; Hinton, G. Deep learning. Nature 2015, 521, 436–444. [Google Scholar] [CrossRef]
  14. Loveland, T.R.; Reed, B.C.; Brown, J.F.; Ohlen, D.; Zhu, Z.; Yang, L.; Merchant, J.W. Development of a global land cover characteristics database and IGBP DISCover from 1 km AVHRR data. Int. J. Remote Sens. 2010, 21, 1303–1330. [Google Scholar] [CrossRef]
  15. UCL-Geomatics. Land Cover CCI Product User Guide Version 2.0. 2017. Available online: http://maps.elie.ucl.ac.be/CCI/viewer/download/ESACCI-LC-Ph2-PUGv2_2.0.pdf (accessed on 23 February 2023).
  16. Chen, J.; Chen, J.; Liao, A.; Cao, X.; Chen, L.; Chen, X.; He, C.; Han, G.; Peng, S.; Lu, M.; et al. Global land cover mapping at 30 m resolution: A POK-based operational approach. ISPRS J. Photogramm. Remote Sens. 2015, 103, 7–27. [Google Scholar] [CrossRef]
  17. Amini, S.; Saber, M.; Rabiei-Dastjerdi, H.; Homayouni, S. Urban Land Use and Land Cover Change Analysis Using Random Forest Classification of Landsat Time Series. Remote Sens. 2022, 14, 2654. [Google Scholar] [CrossRef]
  18. Yao, Y.; Li, J.; Zhang, X.; Duan, P.; Li, S.; Xu, Q. Investigation on the Expansion of Urban Construction Land Use Based on the CART-CA Model. ISPRS Int. J. Geo Inf. 2017, 6, 149. [Google Scholar] [CrossRef]
  19. Swetanisha, S.; Panda, A.R.; Behera, D.K. Land use/land cover classification using machine learning models. Int. J. Electr. Comput. Eng. 2022, 12, 2040–2046. [Google Scholar] [CrossRef]
  20. Pendlebury, J.; Porfyriou, H. Heritage, urban regeneration and place-making. J. Urban Des. 2017, 22, 429–432. [Google Scholar] [CrossRef]
  21. Landa, F. Actual Changes in System of Urban Planning in Post-Socialist City: The Case of Prague. J. Archit. Urban. 2016, 40, 303–310. [Google Scholar] [CrossRef]
  22. Global Forum on Human Settlements. Available online: https://gfhsforum.org/?_l=en (accessed on 18 December 2022).
  23. European Environment Agency. Available online: https://www.eea.europa.eu (accessed on 18 December 2022).
  24. PlaNYC Progress Report. Available online: https://climate.cityofnewyork.us/reports/planyc-reports/ (accessed on 5 January 2023).
  25. The Annual Planning Monitoring Report (AMR) in London. Available online: https://www.london.gov.uk/programmes-strategies/planning/implementing-london-plan/monitoring-london-plan (accessed on 11 January 2023).
  26. Shach-Pinsly, D. Digital Urban Regeneration and Its Impact on Urban Renewal Processes and Development. Urban Plan. 2021, 6, 135–138. [Google Scholar] [CrossRef]
  27. Shach-Pinsly, D.; Bindreiter, S.; Porat, I.; Sussman, S.; Forster, J.; Rinnerthaler, M. Multiparametric Analysis of Urban Environmental Quality for Estimating Neighborhood Renewal Alternatives. Urban Plan. 2021, 6, 172–188. [Google Scholar] [CrossRef]
  28. Tanrıkul, A.; Hoşkara, Ş. A New Framework for the Regeneration Process of Mediterranean Historic City Centres. Sustainability 2019, 11, 4483. [Google Scholar] [CrossRef]
  29. Benkő, M.; Bene, B.; Pirity, Á.; Szabó, Á.T.; Egedy, T. Real vs. Virtual City: Planning Issues in a Discontinuous Urban Area in Budapest’s Inner City. Urban Plan. 2021, 6, 150–163. [Google Scholar] [CrossRef]
  30. Praharaj, S. Area-Based Urban Renewal Approach for Smart Cities Development in India: Challenges of Inclusion and Sustainability. Urban Plan. 2021, 6, 202–215. [Google Scholar] [CrossRef]
  31. Gutting, R.; Gerhold, M.; Rößler, S. Spatial Accessibility in Urban Regeneration Areas: A Population-Weighted Method Assessing the Social Amenity Provision. Urban Plan. 2021, 6, 189–201. [Google Scholar] [CrossRef]
  32. Shih, C.; Treija, S.; Zaleckis, K.; Bratuškins, U.; Chen, C.; Chen, Y.H.; Chiang, C.T.; Jankauskaitė-Jurevičienė, L.; Kamičaitytė, J.; Koroļova, A.; et al. Digital Placemaking for Urban Regeneration: Identification of Historic Heritage Values in Taiwan and the Baltic States. Urban Plan. 2021, 6, 257–272. [Google Scholar] [CrossRef]
  33. Wand, F.; Shi, X.; Zheng, H.; Wu, Y. The Crucial Question and Ten Relationships: Reforming Exploration of Beijing Master Plan 2016–2035. Les Cahiers 176-Les villes changent le monde. L’institut Paris Region. Juillet 2020. [Google Scholar]
  34. Li, Z.; He, S.; Su, S.; Li, G.; Chen, F. Public Services Equalization in Urbanizing China: Indicators, Spatiotemporal Dynamics and Implications on Regional Economic Disparities. Soc. Indic. Res. 2020, 152, 1–65. [Google Scholar] [CrossRef]
  35. Lucy, W.H.; Gilbert, D.; Birkhead, G.S. Equity in local service distribution. Public Adm. Rev. 1977, 37, 687–697. [Google Scholar] [CrossRef]
  36. Liao, Z. The analysis of basic public service supply regional equalization in China’s provinces—Based on the Theil Index evaluation. IOP Conf. Ser. Earth Environ. Sci. 2017, 100, 012106. [Google Scholar] [CrossRef]
  37. Ardeshiri, A.; Willis, K.; Ardeshiri, M. Exploring preference homogeneity and heterogeneity for proximity to urban public services. Cities 2018, 81, 190–202. [Google Scholar] [CrossRef]
  38. Zhang, X.; Feng, Z. Spatial Correlation and Regional Convergence in per-capita GDP in China: 1978–2003. China Econ. Q. 2008, 7, 399. [Google Scholar]
  39. Schneider, M. Local fiscal equalisation based on fiscal capacity: The case of Austria. Fisc. Stud. 2002, 23, 105–133. [Google Scholar] [CrossRef]
  40. Li, P.; Lu, Y.; Wang, J. Does flattening government improve economic performance? Evidence from China. J. Dev. Econ. 2016, 123, 18–37. [Google Scholar] [CrossRef]
  41. Chen, J.; Fleisher, B.M. Regional income inequality and economic growth in China. J. Comp. Econ. 1996, 22, 141–164. [Google Scholar] [CrossRef]
  42. Saaty, T.L. The Analytic Hierarchy Process; RWS Publications: Pittsburgh, PA, USA; McGrew Hill: New York, NY, USA, 1980; Volume 9, pp. 19–22. [Google Scholar]
  43. Xie, G.D.; Zhen, L.; Lu, C.X.; Xiao, Y.; Chen, C. Expert knowledge based valuation method of ecosystem services in China. J. Nat. Resour. 2008, 23, 911–919. [Google Scholar]
  44. Benito, B.; Faura, Ú.; Guillamón, M.D.; Ríos, A.M. The efficiency of public services in small municipalities: The case of drinking water supply. Cities 2019, 93, 95–103. [Google Scholar] [CrossRef]
  45. Zere, E.; Mandlhate, C.; Mbeeli, T.; Shangula, K.; Mutirua, K.; Kapenambili, W. Equity in health care in Namibia: Developing a needs-based resource allocation formula using principal components analysis. Int. J. Equity Health 2017, 6, 3. [Google Scholar] [CrossRef]
  46. Hartmann, T.; Jehling, M. From diversity to justice—Unraveling pluralistic rationalities in urban design. Cities 2019, 91, 58–63. [Google Scholar] [CrossRef]
  47. Duch-Zebrowska, P.; Zielonko-Jung, K. Integrating Digital Twin Technology Into Large Panel System Estates Retrofit Projects. Urban Plan. 2021, 6, 164–171. [Google Scholar] [CrossRef]
  48. Wang, X.; Chen, B.; Li, X.; Zhang, Y.; Ling, X.; Wang, J.; Li, W.; Wen, W.; Gong, P. Grid-Based Essential Urban Land Use Classification: A Data and Model Driven Mapping Framework in Xiamen City. Remote Sens. 2022, 14, 6143. [Google Scholar] [CrossRef]
  49. McInnes, L.; Healy, J.; Saul, N.; Großberger, L. UMAP: Uniform Manifold Approximation and Projection. J. Open Source Softw. 2018, 3, 861. [Google Scholar] [CrossRef]
  50. Leland, M.; John, H. UMAP: Uniform Manifold Approximation and Projection for Dimension Reduction. arXiv 2020, arXiv:1802.03426. [Google Scholar]
  51. Jolliffe, I.T.; Cadima, J. Principal component analysis: A review and recent developments. Philos. Trans. A Math. Phys. Eng. Sci. 2016, 374, 20150202. [Google Scholar] [CrossRef] [PubMed]
  52. Bao, H.; Ming, D.; Guo, Y.; Zhang, K.; Zhou, K.; Du, S. DFCNN-Based Semantic Recognition of Urban Functional Zones by Integrating Remote Sensing Data and POI Data. Remote Sens. 2020, 12, 1088. [Google Scholar] [CrossRef]
  53. Du, S.; Du, S.; Liu, B.; Zhang, X. Incorporating DeepLabv3+ and object-based image analysis for semantic segmentation of very high resolution remote sensing images. Int. J. Digit. Earth 2020, 14, 357–378. [Google Scholar] [CrossRef]
  54. Guo, M.; Xu, T.; Liu, J.; Liu, Z.; Jiang, P.; Mu, T.-J.; Zhang, S.-H.; Martin, R.R.; Cheng, M.-M.; Hu, S.-M. Attention mechanisms in computer vision: A survey. Comput. Vis. Media 2022, 8, 331–368. [Google Scholar] [CrossRef]
  55. Radford, A.; Narasimhan, K. Improving Language Understanding by Generative Pre-Training. Comput. Sci. 2018. [Google Scholar]
  56. Vaswani, A.; Shazeer, N.M.; Parmar, N.; Uszkoreit, J.; Jones, L.; Gomez, A.N.; Kaiser, Ł.; Polosukhin, I. Attention is All you Need. Neural Inf. Process. Syst. 2017, 30, 5998–6008. [Google Scholar]
Figure 1. The MUDI system’s functional diagram for data model building, MUDI setup, and AI-driven technologies.
Remotesensing 16 00456 g001
Figure 2. 2022 MUDI for city studies.
Remotesensing 16 00456 g002
Figure 3. Dimension reduction methodology and analysis diagrams: (a) UMAP; (b) PCA; and (c) PCA–UMAP–K-means.
Remotesensing 16 00456 g003
Figure 4. DeeplabV3+ based AI land change functional diagram.
Remotesensing 16 00456 g004
Figure 5. A total of 68 cities selected from 337 cities in China.
Remotesensing 16 00456 g005
Figure 6. (a) Xiamen location; (b) 285 residential community areas; (c) Yingping District; and (d) POI data.
Remotesensing 16 00456 g006
Figure 7. Implementation process for the MUDI analyses of 337 cities and Xiamen’s Yingping District and the MUDI Green Ecology Index analysis of Xiamen’s 285 residential areas.
Remotesensing 16 00456 g007
Figure 8. (a) Ontology description of MUDI; and (b) zoomed-in area within the red frame.
Remotesensing 16 00456 g008
Figure 10. UMAP analysis of MUDIs for 337 cities in China: (a) 2D mapping result; and (b) two city groups selected from graph (a).
Remotesensing 16 00456 g010
Figure 11. MUDI PCA display for group 1 cities: (a) eigenvalue; and (b) cumulative variance.
Remotesensing 16 00456 g011
Figure 12. Importance ranking of MUDIs in group 1 cities.
Remotesensing 16 00456 g012
Figure 13. MUDI PCA display for group 2 cities: (a) eigenvalue; and (b) cumulative variance.
Remotesensing 16 00456 g013
Figure 14. Importance ranking of MUDIs in group 2 cities.
Remotesensing 16 00456 g014
Figure 15. Dimension reduction and classification analysis of group 1 cities: (a) four city classes; and (b) presentation in a 3D scatter chart.
Remotesensing 16 00456 g015
Figure 16. Dimension reduction and classification analysis of group 2 cities: (a) four city classes; and (b) presentation in a 3D scatter chart.
Remotesensing 16 00456 g016
Figure 17. Main MUDIs’ analysis: (a) park and green space coverage; (b) elderly service station coverage area; (c) proportion of streets with distinctive features in Yingping District; and (d) building information regarding the surrounding neighborhood.
Remotesensing 16 00456 g017
Figure 18. MUDI Green Ecology Index land change mappings of 285 urban communities in Xiamen: (a) in 2002; (b) in 2021; (c) zoomed-in area within the red frame in graph (a); and (d) zoomed-in area within the red frame in graph (b).
Remotesensing 16 00456 g018
Table 1. MUDI urban vitality index for 337 cities.
CategoryLevel I IndexLevel II Index
Urban
Vitality
Economic vitalityForeign direct investment
R&D expenditure ratio to GDP
Number of top 500 private-owned enterprises
Number of unicorn enterprises
Number of high-tech enterprises
Population vitalityWorking age population ratio
Working age average education level
Number of R&D personnel per 10,000 people
Full-time R&D equivalent of scientific researchers
Labor force demand ratio for higher education personnel
Innovation vitalityPatent applications
PCT patent applications
Certified ICT patents
Contract amount of technology transactions
Urban land output coefficient
Fixed assets investment output for GDP
Industrial vitalityValue increase in high-tech industry
Ration of value increase in high-tech industry
Exports ratio of high-tech product
Ratio of value increase in cultural and creative industries to GDP
Market
vitality
Number of universities and research institutions
Business environment index
Market economy index
Number of national free-trade zones
Number of market economy entities
Number of mobile phone users
Number of Internet users
Table 2. MUDIs for Yingping District.
CategoriesLevel I IndexLevel II Index
Ecological and Living EnvironmentEcological environmentCoverage rate of green space per neighborhood area
Coverage rate of building space per neighborhood area
Proportion of roads length with poor lighting
Proportion of roadway with wet ground
Proportion of roadways with environmental noise conforming to standard
Habitat sanitationNumber and coverage of garbage collection stations
Number and coverage of sanitation facilities
Health and
Comfort
Senior and elderly facilitiesNumber and coverage of convenient community commercial service facilities
Number and coverage of elderly community service stations
Proportion of the number of beds in elderly community service stations to the number of elderly people
Health careNumber and coverage of community medical service stations
Number of beds in community medical service station
Per capita area of community sports venues
Education facilitiesCoverage of inclusive kindergartens
Number of kindergarten student permissions per thousand
Primary school coverage
Number of primary school student permissions per thousand
Safety and ResilienceFacility
security
Intactness rate of important pipeline network
Density of waterlogging points in the neighborhood area
Area of emergency shelter per capita
Coverage of fire service stations
Annual number of safety accidents in the neighborhood
Residential safetyNumber of dilapidated houses in the neighborhood
Proportion of the area of dilapidated buildings to the total area of buildings
Transportation ConvenienceTransportation convenientPublic transport station coverage
Proportion of continuous pedestrian road facilities to the total number of roads
Proportion of cut-off roads to total roads
Parking
facilities
Parking area per capita
Proportion of residential parking space to total number of households in the neighborhood
Proportion of commercial and public parking spaces
Cultural
Characteristics
Cultural characteristicsCultural presenting building area per 10,000 people
Historical buildings protectionListing rate of historic buildings in the neighborhood
Vacancy rate of historic buildings in the neighborhood
Protection and repair rate of historic buildings in the neighborhood
Street styleProportion of streets with distinctive features in the neighborhood
Distinctive cultural area that is in poor-quality conditions
Area with well-preserved historical features
The largest single area of the neighborhood with well-preserved historical features
TidinessStreet
tidiness
Street pole and skyline regularity
Tidiness ratio of buildings
Orderliness of street vehicle parking
Diversity and InclusivityGroup inclusivityRate of barrier-free roads
Proportion of people living on subsistence allowances in the neighborhood
Proportion of migrant workers in the neighborhood
Elderly population ratio in the neighborhood
Proportion of the per capita housing area of public housing in the neighborhood is lower than the national standard
Housing guaranteeProportion of guaranteed housing in the neighborhood
Vitality and
Innovation
Existing commercial and industrial statusMain store types in the neighborhood
Emerging commercial and industrial
development
Proportion of special-characteristics shops in key commercial streets to total shops
Proportion of creative and innovative shops in key streets
Proportion of mobile street stalls in the neighborhood
Store customer flow
High-quality brand ratio
Number of business types
Shopping environment evaluation
Table 3. The 34 group 1 cities selected from the UMAP analysis.
BeijingTianjinShanghaiChongqingShijiazhuangTaiyuanHarbin
ChangchunShenyangDalianJinanQingdaoNanjingHefei
HangzhouNingboFuzhouXiamenZhengzhouWuhanChangsha
GuangzhouShenzhenNanningKunmingChengduXi’anUrumqi
NanchangGuiyangWuxiSuzhouFoshanDongguan
Table 4. The 34 group 2 cities selected from the UMAP analysis.
TangshanJinchengHohhotBaotouDaqingSipingDongying
XuzhouBozhouQuzhouJingdezhenGanzhouLuoyangHuangshi
ChangdeHaikouSanyaLiuzhouLincangAnshunSuining
Yan’anLanzhouBaiyinYinchuanWuzhongKaramayXining
LhasaMudanjiangZhoushanLijiangJiuquanTurpan
Table 5. Evaluation results of the DeeplabV3+ model.
BuildingGreen SpaceParking and OthersOAKappa
72.75%78.30%68.50%72.79%0.5839
Disclaimer/Publisher’s Note: The statements, opinions and data contained in all publications are solely those of the individual author(s) and contributor(s) and not of MDPI and/or the editor(s). MDPI and/or the editor(s) disclaim responsibility for any injury to people or property resulting from any ideas, methods, instructions or products referred to in the content.

