Article

Remote Sensing and GIS in Landslide Management: An Example from the Kravarsko Area, Croatia

Croatian Geological Survey, 10000 Zagreb, Croatia
*
Author to whom correspondence should be addressed.
Remote Sens. 2023, 15(23), 5519; https://doi.org/10.3390/rs15235519
Submission received: 17 October 2023 / Revised: 22 November 2023 / Accepted: 25 November 2023 / Published: 27 November 2023
(This article belongs to the Special Issue Advances in GIS and Remote Sensing Applications in Natural Hazards)

Abstract

:
The Kravarsko area is located in a hilly region of northern Croatia, where numerous landslides endanger and damage houses, roads, water systems, and power lines. Nevertheless, natural hazard management plans are practically non-existent. Therefore, during the initial research, a landslide inventory was developed for the Kravarsko pilot area based on remote sensing data (high-resolution digital elevation models), and some of the landslides were investigated in detail. However, due to the complexity and vulnerability of the area, additional zoning of landslide-susceptible areas was needed. As a result, a slope gradient map, a map of engineering geological units, and a land-cover map were developed as inputs for the landslide susceptibility map. Additionally, based on the available data and a landslide inventory, a terrain stability map was developed for landslide management. Analysis and map development were performed within a geographical information system environment, and the terrain stability map with key infrastructure data was determined to be the “most user-friendly and practically usable” resource for non-expert users in natural hazard management, for example, the local administration. At the same time, the terrain stability map can easily provide practical information for the local community and population about the expected landslide “risk” depending on the location of infrastructure, estates, or objects of interest or for the purposes of future planning.

1. Introduction

Natural hazards cover a wide range of phenomena that might have a negative effect on living and artificial things. Within the category of natural hazards, geohazards can occur as a result of active geologic processes or human activity [1]. Landslides are geohazards that frequently endanger safety and damage property in the ever-changing environment [2,3]. Landslides are usually described as mass movements [4,5,6] and are divided into categories according to the mechanical behavior of the movement [7,8,9]. Both natural and human factors contribute to the occurrence of landslides, and understanding these interactions is crucial for effective landslide risk management. Natural causes include seismic activities such as earthquakes [10], heavy rainfall [11], and volcanic eruptions [12], while human activities such as mining [13], construction [14], deforestation [15], and changes in land use [16] can significantly alter the landscape, making it more susceptible to landslides. One of the first steps in landslide research in a specific area is the development of a reliable landslide inventory [17,18,19]. A reliable landslide inventory of the area of the interest (at the local, regional, or state level) is a basis for successful landslide mitigation processes and assessments of susceptibility, hazards, and risk (which also depend on the other available data) [20,21,22]. On landslide inventory maps, the spatial distribution of landslides is presented with additional information [17,19,23] while, on landslide susceptibility maps, zones prone to landslides are distinguished [17,21,24,25]. As basic as they may be, landslide inventories and landslide susceptibility maps are of great value in planning and natural hazard (i.e., landslide) management [2,3,17,26,27].
Conventional landslide inventory development includes field mapping and remote sensing, i.e., the analysis of stereoscopic aerial photography [19,28]. This approach has its limitations, as the accessibility of the terrain can vary or vegetation cover can mask features in the photos [28,29]. However, with the rapid development of another remote sensing technique, light detection and ranging (LiDAR), the collection of reliable, accurate, and high-resolution terrain data has been enabled [30,31]. As a result of LiDAR point cloud data analysis, the development of high-resolution digital elevation models (hrDEMs) has been enabled. One such hrDEM with proven applicability in landslide research is the bare-ground model/digital terrain model (DTM) [19,22,32]. The main advantages of the use of this remote sensing product (hrDTM) are that there is no inaccessible terrain area, and land cover can be removed, providing a reliable and accurate basis for landslide feature mapping [31,32]. Nevertheless, in the development of a landslide inventory based on LiDAR data for any area, the field mapping aspect should not be neglected [19,32,33]. Landslide susceptibility mapping involves analyzing and mapping the spatial distribution of factors that contribute to landslide susceptibility, with the main goal being to identify areas that are prone to landslides, providing valuable information for land-use planning, risk assessment, and hazard mitigation [20,24,33]. In the development of landslide susceptibility maps, much depends on the available data and their quality and resolution [20,24,33]. In overcoming this obstacle (data availability and quality), different approaches are used (heuristic, probabilistic, or deterministic) [18,21,34]. Based on a review of articles employing diverse quantitative–statistical, multicriteria decision-making, and machine learning methods for landslide susceptibility mapping, Pourghasemi et al. [35] observed that logistic regression is the predominant technique, followed by frequency ratio and weights of evidence, while the slope gradient is considered the most important conditioning factor in landslide occurrence. In recent years, a variety of machine learning algorithms have emerged as essential tools in the field of landslide susceptibility mapping [36,37,38,39]. Regardless of the approach used, the developed landslide susceptibility map has its value, but the “final user” has to be informed about its limitations: the data analyzed, the methodology used, and its scale applicability [20,21].
In the Kravarsko settlement area (research area) in northern Croatia, landslides are common [32,40], and damage to private and public properties occurs (houses and infrastructure) [26,32,40,41]. However, the first acquisition of high-quality LiDAR data for the Kravarsko area occurred just five years ago in the spring of 2018; consequently, a landslide inventory was developed just three years ago in 2020 [32]. During data analysis, field work on the landslide inventory, and specific landslide research in the area, it became obvious that site-specific geological and anthropogenic conditions are important for landslide activation and development in Kravarsko, along with ongoing climate change [26,32,41]. The initial landslide susceptibility map for the Kravarsko area was developed in 2021, but it has not been published [42]. As landslides continue to occur or reactivate in the Kravarsko area and landslide data (the inventory and susceptibility map) provide important information for community mitigation plans and management, the aim of this paper is to present the perennial research results simply, reliably, and in a usable format, “all in one place”, with additional analysis, comments, and recommendations and a new landslide management map, i.e., a terrain stability map including key infrastructure.

2. Materials and Methods

2.1. Study Area

The Kravarsko pilot area (PA ≈ 61.7 km2) is in the Vukomeričke Gorice hilly area, ~25 km south of Zagreb in northern Croatia, as shown in Figure 1a. The geological development and structure of the investigated area in Vukomeričke Gorice are described in detail in [32]. Based on those data, it is clear that for PA, there are three main engineering geological units present on the area: alluvial sediments (the youngest Quaternary sediments from the Holocene, represented by gravel, sands, and clays), loess-type sediments (Quaternary sediments from the Pleistocene, represented by silts, sands, and clays), and the “problematic” informal lithostratigraphic unit—the Vrbova fm. (formation). The Vrbova fm. constitutes Tertiary Pliocene sediments represented by sands, clays, and gravels; in this unit, there are multiple records of landslides on the available 1:100,000- and 1:500,000-scale maps [43,44], as shown in Figure 1b. Regardless, the lack of available detailed landslide data and information for the wider Kravarsko area is surprising, as in 2014, for example, a natural disaster was declared for the area due to landslide phenomena [40]. Within Kravarsko PA, a smaller field validation area (VA ≈ 10.3 km2, ≈17% of the investigated PA) was defined, in accordance with recommendations from the literature [19,45], and the VA also included the Kravarsko settlement area (Figure 1b).

2.2. Site-Specific Geohazard Mapping

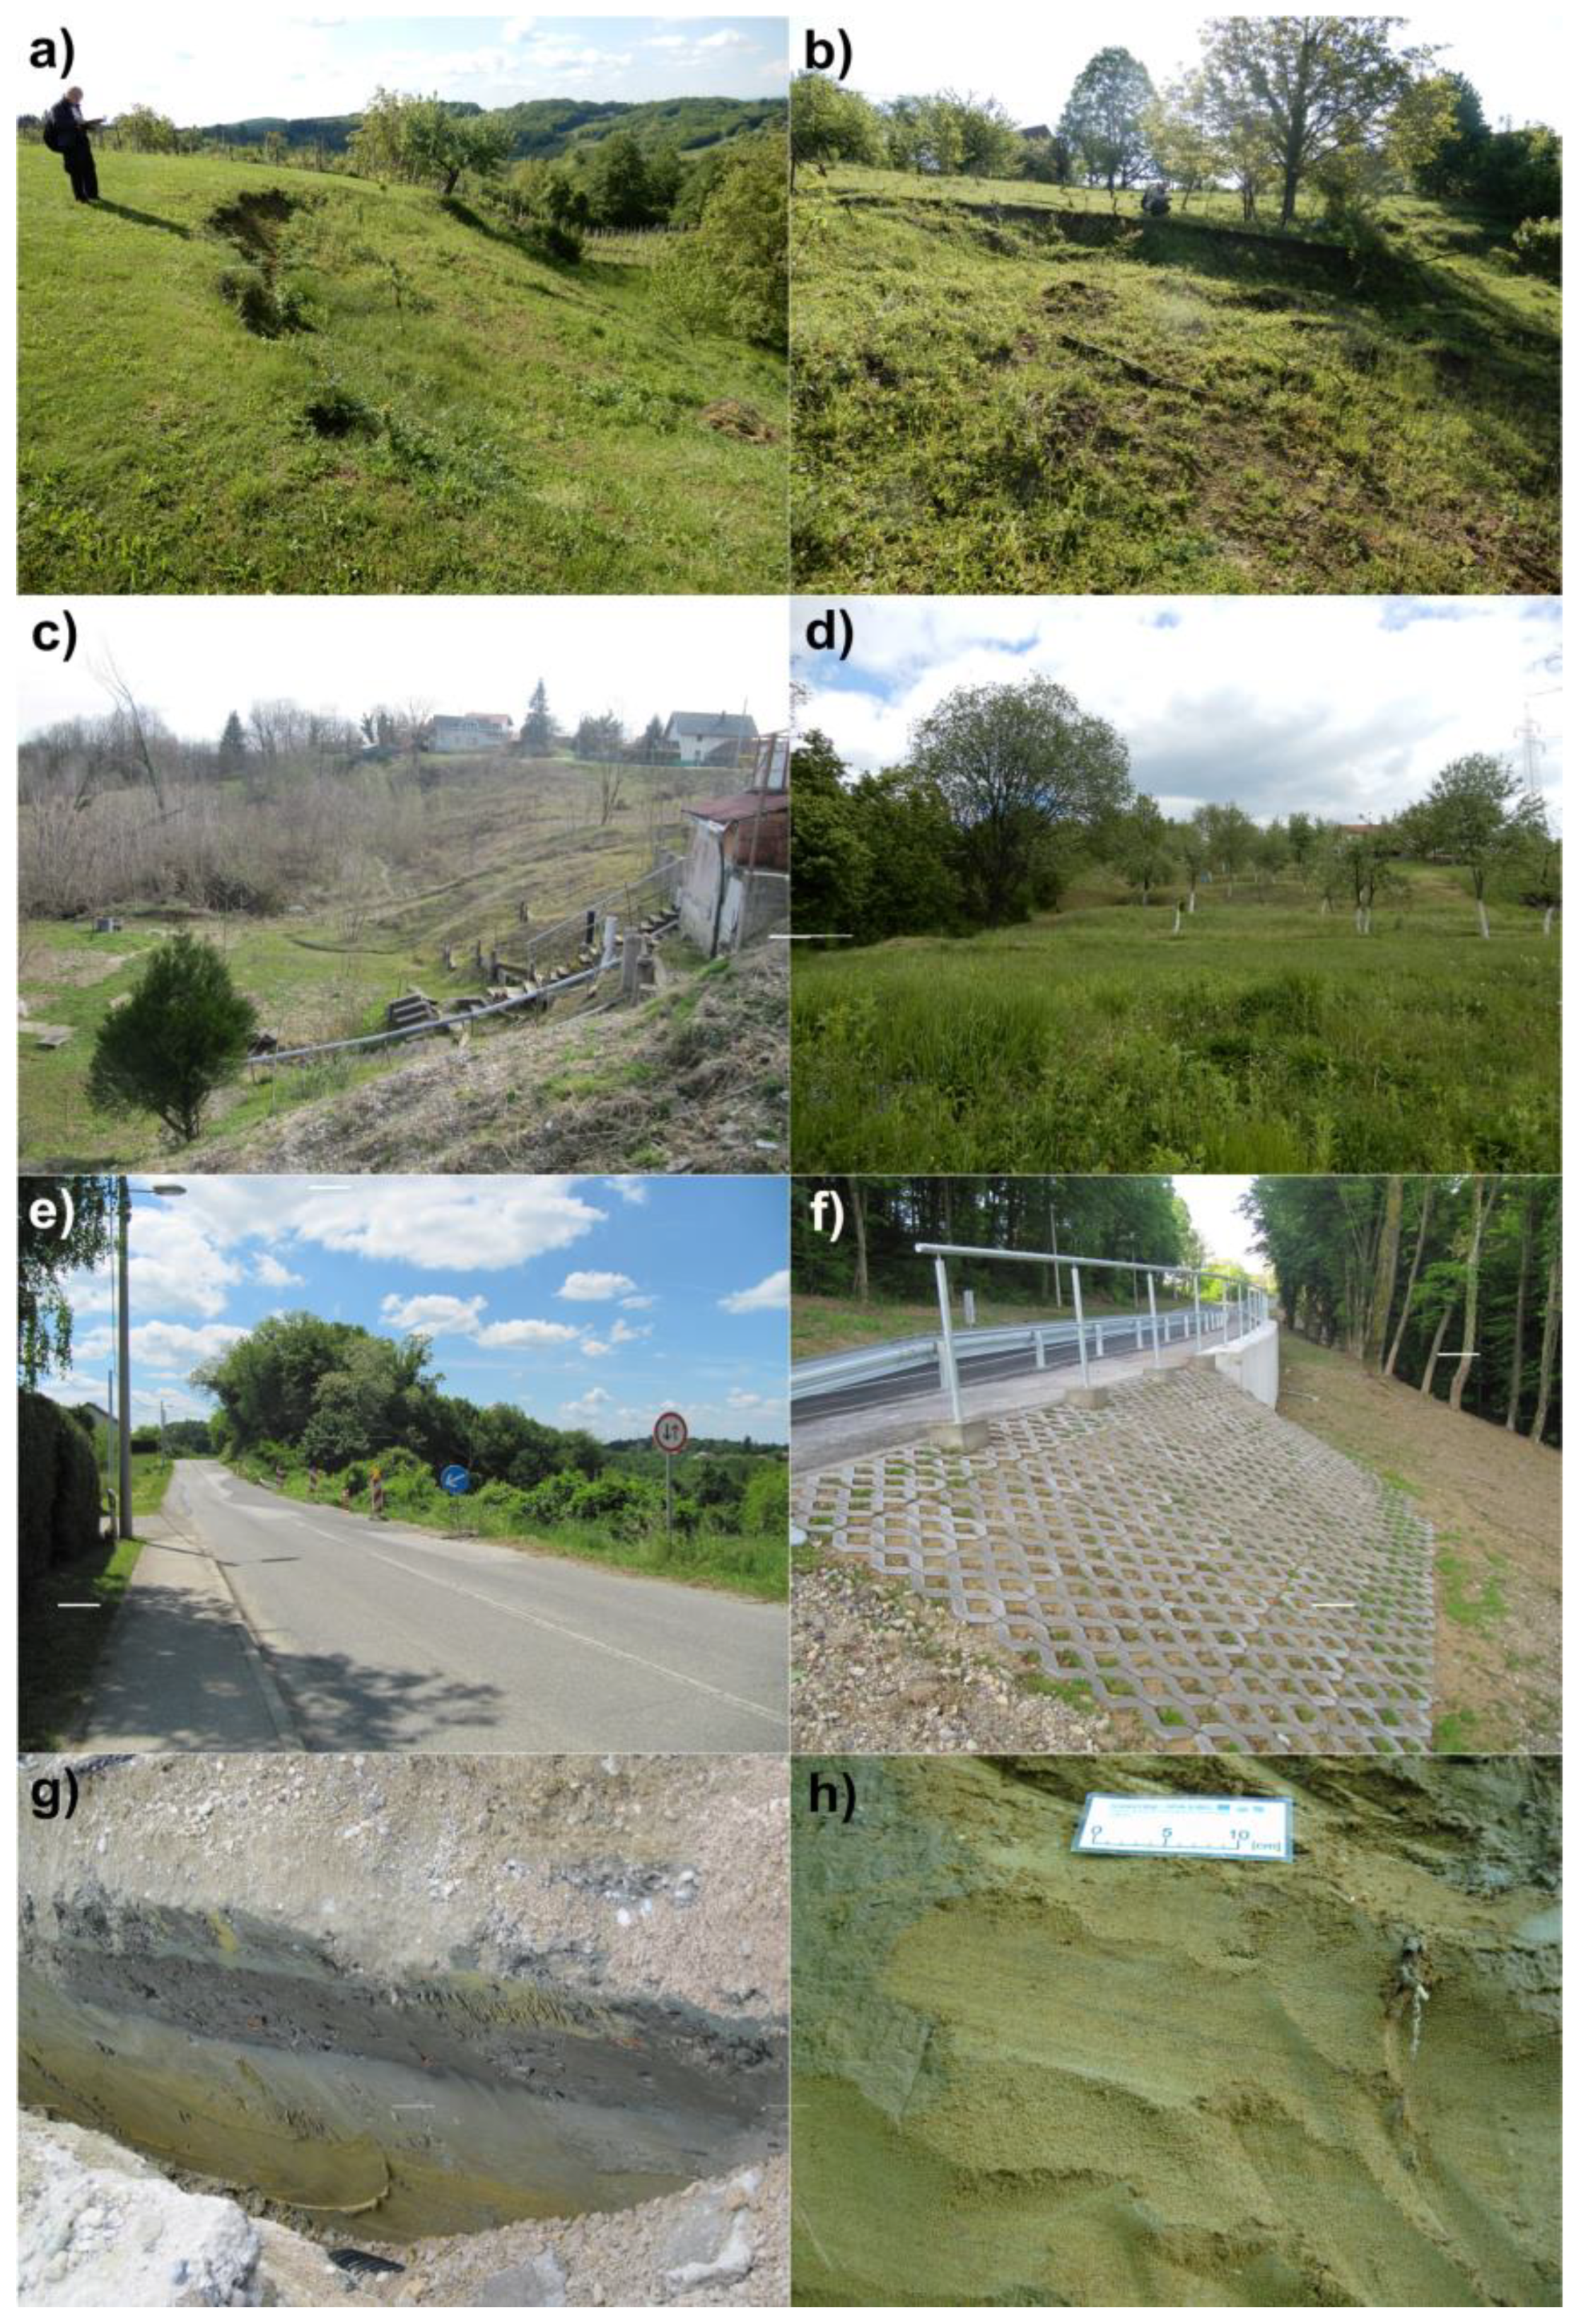
Geohazards [1,46,47,48] and landslides [6,7,8,9] can be classified. Based on the available landslide data [26,32,41], the most common geohazards in PA are slides in soil that can be described as rotational, planar, or compound slides in clays and silts or as debris slides in gravels and sands [49] (see Figure 2a–h). From here on, these soil slides and other mass movements in the PA will be referred to simply as landslides.
The available (historical) geological and remote sensing data (historical and new) were analyzed, as described in detail in [26,32,41]. Based on recent remote sensing data (20 points per m2 airborne LiDAR scan data from early spring 2018), high-resolution DEMs with a cell size of 0.5 × 0.5 m were developed: a digital surface model (DSM), a digital terrain model (DTM), and a hillshade digital terrain model (DTMh). The development of a reliable landslide inventory is possible based on these hrDEMs if distinct landslide features can be mapped on them [19,22,50] while the mapping criteria remain the same [31,32,51].

2.3. Developed Landslide Inventory

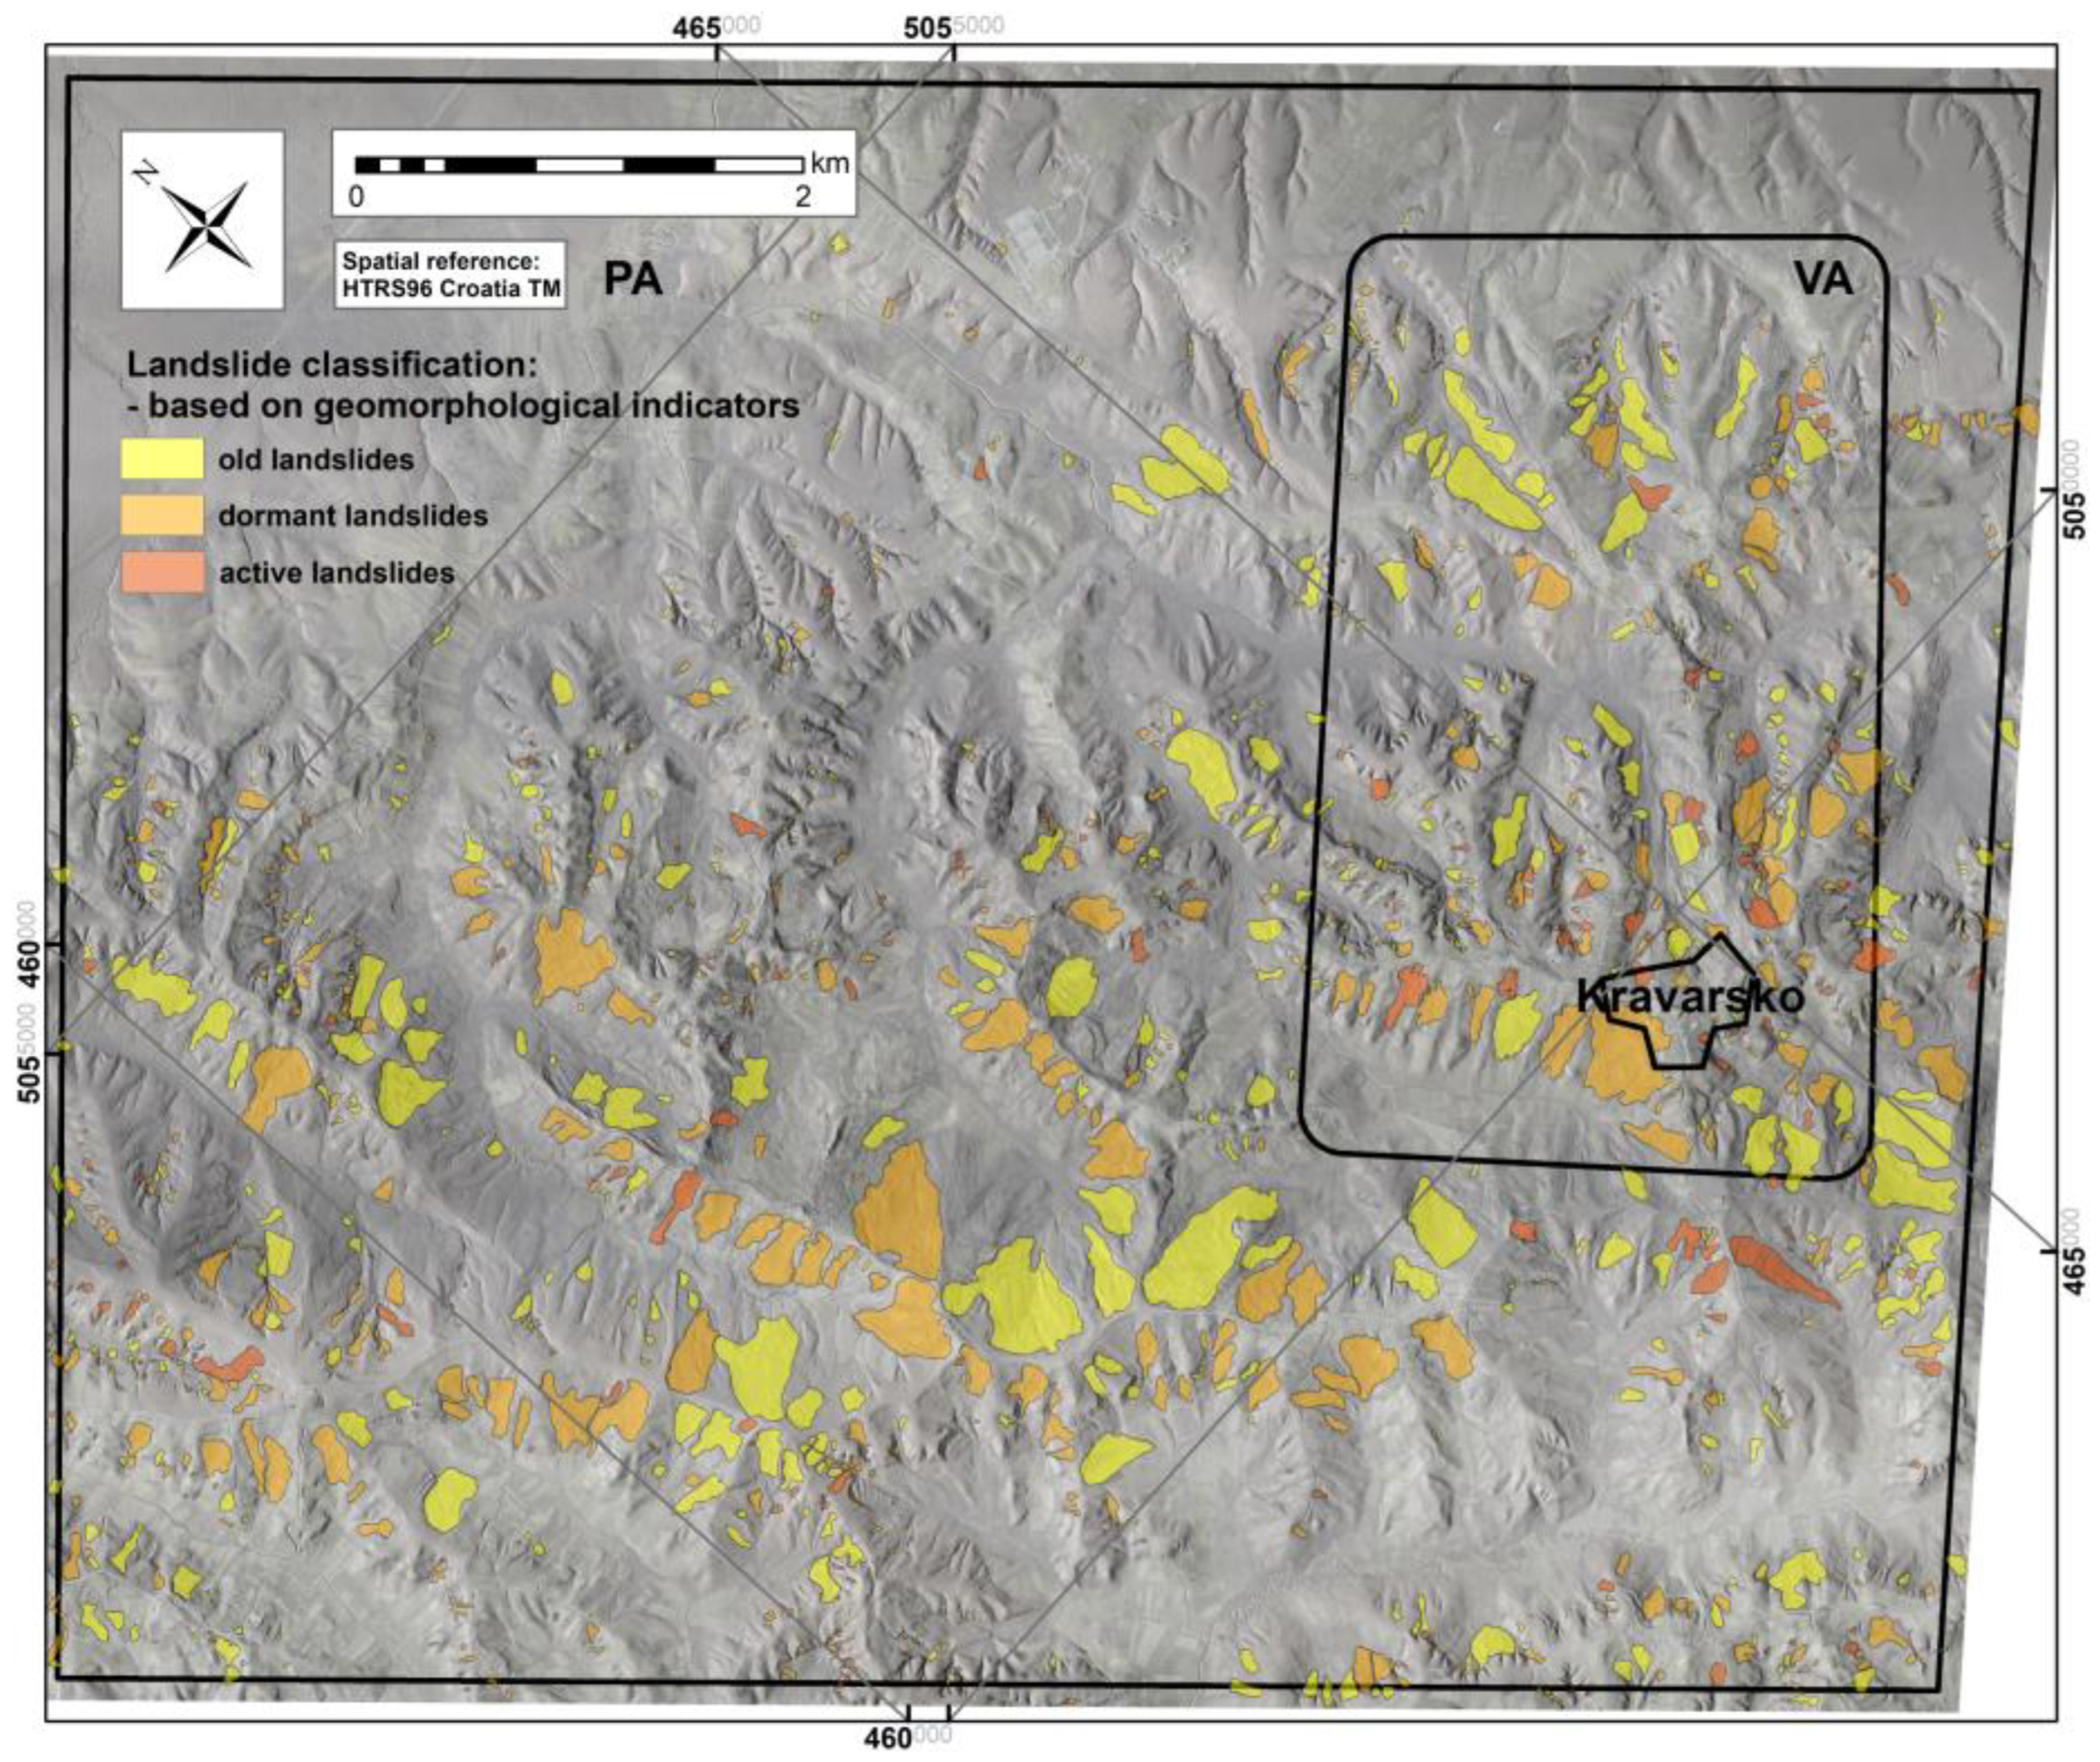
For the Kravarsko PA, a landslide inventory was developed based on high-resolution remote sensing data (hrDEMs) [32]. For the remotely mapped landslides (on hrDEMs), a scoring system was established based on the confidence of the identification of the geomorphological indicators and landslide features [32]. Essentially, if landslide features (head scarp, flanks, toe parts, and internal deformations) are present and can be mapped, the score is higher, and the landslide is mapped with greater confidence, as described in detail in [32]. At the same time, a low-score landslide can indicate an older landslide with some of the features degraded and hardly visible, even on hrDEMs. Therefore, the “state” of the landslide feature (visibility, clarity, and the possibility of identification) can also be considered an indicator of landslide activity and “age”: old, dormant, or active [52]. The landslide inventory was developed within the geographical information system environment (ArcGIS) and consists of 1430 mapped landslides for the Kravarsko PA with the following (simplified) classifications: 595 old landslides (42% of the mapped landslides), 648 dormant landslides (45% of the mapped landslides), and 187 active landslides (13% of the mapped landslides) (Figure 3). The total area (sum) of the mapped landslides is 6.5 km2 (11% of the PA), with 3.2 km2 of old landslides (49% of the mapped landslide area), 2.8 km2 of dormant landslides (43% of the mapped landslide area), and 0.5 km2 of active landslides (8% of the mapped landslide area). The developed landslide inventory was validated in the field on a smaller validation area (Figure 3), producing the following main conclusions: (i) landslide mapping is easier, quicker, and even more reliable on a detailed hrDEM due to the vegetation cover and gullies present in the field; (ii) shallow and slow slope movements (soil creeps) are difficult to map precisely in the field; and (iii) hrDEMs are a powerful tool in the development of reliable landslide inventories, but field mapping cannot be neglected, as it is essential for the calibration and fine tuning of the “scoring system” in order to reflect the specific aspects of the investigated area (geological, geomorphological, anthropogenic, etc. (more details are provided in [32]).

3. Results

For the Kravarsko area, the existing landslide susceptibility maps were on national (Republic of Croatia, [53]) and regional scales (Zagreb County, [54]). These maps are small-scale maps. The landslide susceptibility map for the Kravarsko PA presented herein was based on a heuristic approach, but the developed landslide inventory for the area was also reviewed, and field validation was performed on a smaller validation area; additionally, a terrain stability map was developed. For the development of the landslide susceptibility map, the following datasets were analyzed: a detailed slope gradient map (derived from detailed LIDAR data: hrDEMs with a 0.5 × 0.5 m pixel size), an engineering geological unit map based on the available geological data (mostly 1:100,000 scale), and land-cover data based on detailed orthophotos from 2018 (10 × 10 cm pixel size). All analysis was performed within the GIS environment with 1 × 1 m pixel-size raster format data for each layer: slope gradient data, engineering geological units, and land-cover data. The number of classes for each input layer set was based on the available dataset’s “quality” and “importance”. For the terrain stability map, the developed landslide inventory and landslide susceptibility map were analyzed, and the key infrastructure data were reviewed.

3.1. Slope Gradient Data

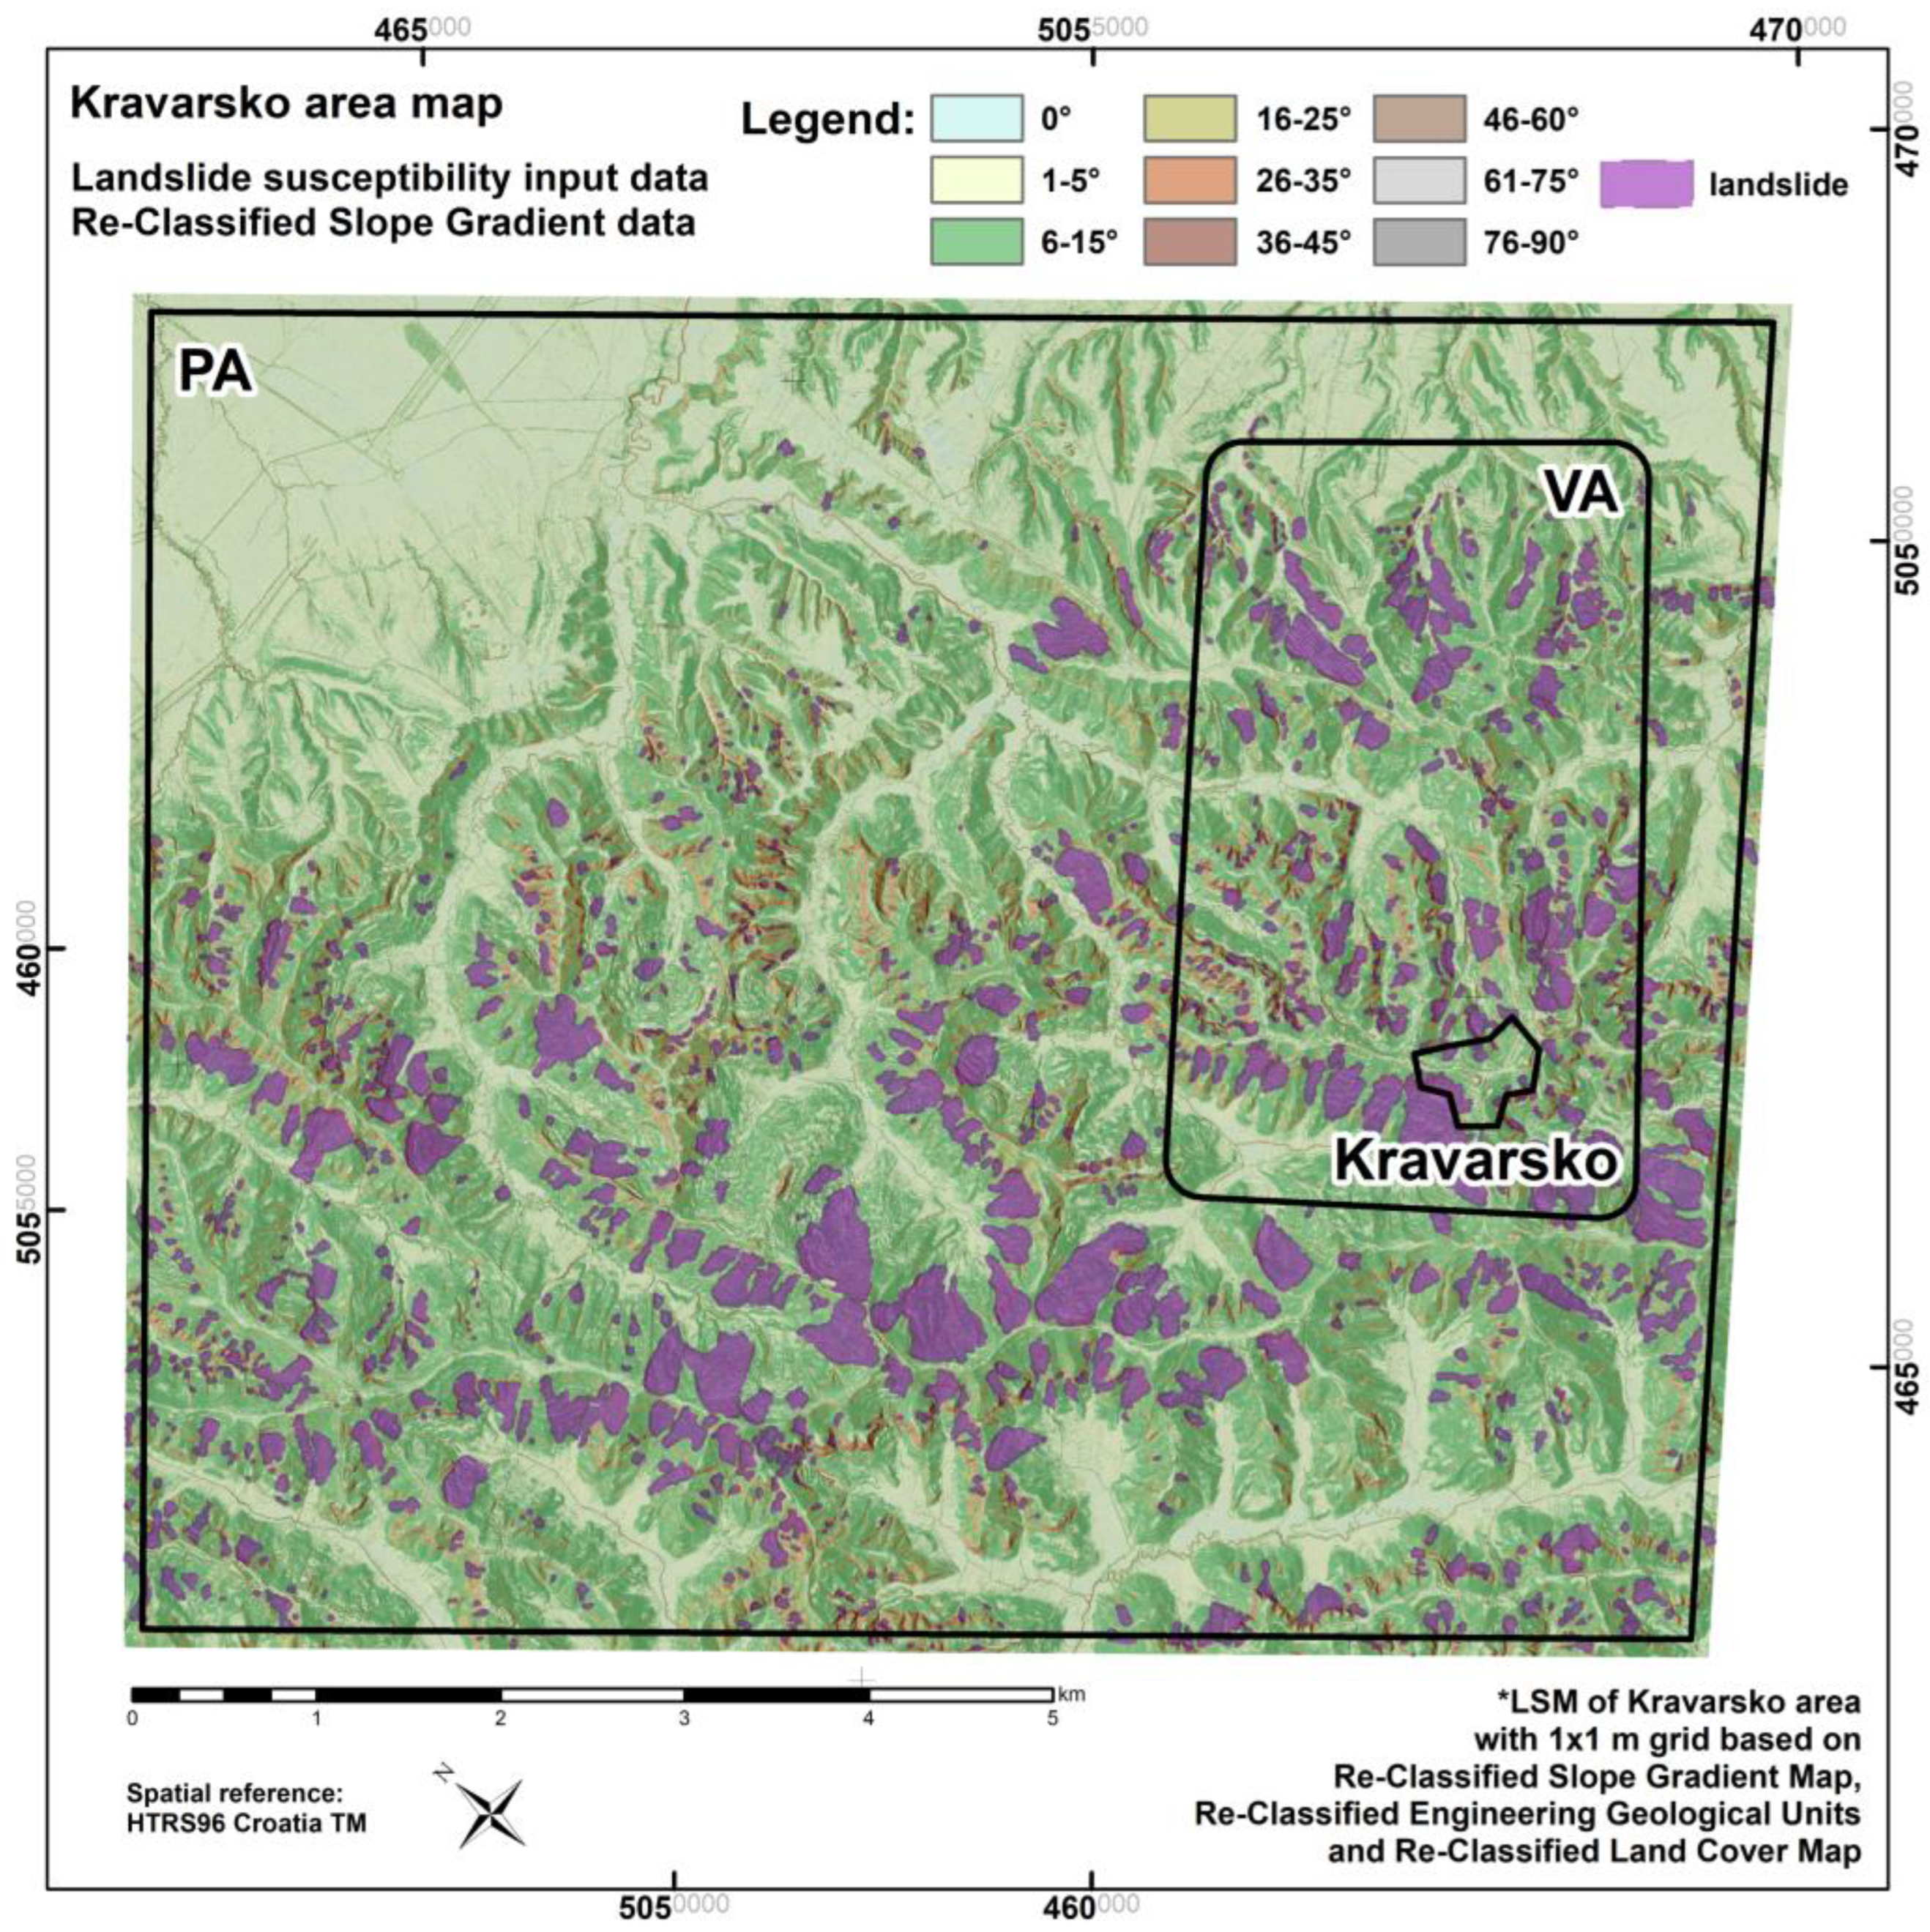
When developing a landslide susceptibility map, usually, the slope gradient data are regarded as the “most important” [53,55,56]. For the Kravarsko PA, based on the hrDEMs (0.5 × 0.5 m), it was possible to develop a detailed slope gradient data/slope angle map with 1° distinction (Figure 4). The high-resolution input was reflected in the number of classes (9) used in the initial analysis for this layer, and, at the same time, this layer was regarded as the “most important” in the analysis (with an overall weight of 0.5). For the Kravarsko PA (≈61.7 km2), the classification of detailed slope gradient data with percentages and areas is summarized as follows: flat areas (with no inclination, 0°) were present in ~3% of the area (~1.9 km2 of the PA), almost flat areas (with an inclination in the range of 1–5°) were present in ~34% of the area (~21.0 km2 of the PA), gentle slopes (with an inclination in the range of 6–15°) were present in ~45% of the area (~27.8 km2 of the PA), slopes (with an inclination in the range of 16–25°) were present in ~13% of the area (~8.0 km2 of the PA), inclined slopes (with an inclination in the range of 26–35°) were present in ~4% of the area (~2.5 km2 of the PA), steep slopes (with an inclination in the range of 36–45°) were present in ~1% of the area (~0.6 km2 of the PA), and very steep slopes (with an inclination in the ranges of 46–60°, 61–75°, and 76–90°) were present in less than ~0.2% of the area (~0.1 km2 of the PA), as shown in Figure 4.

3.2. Engineering Geological Units

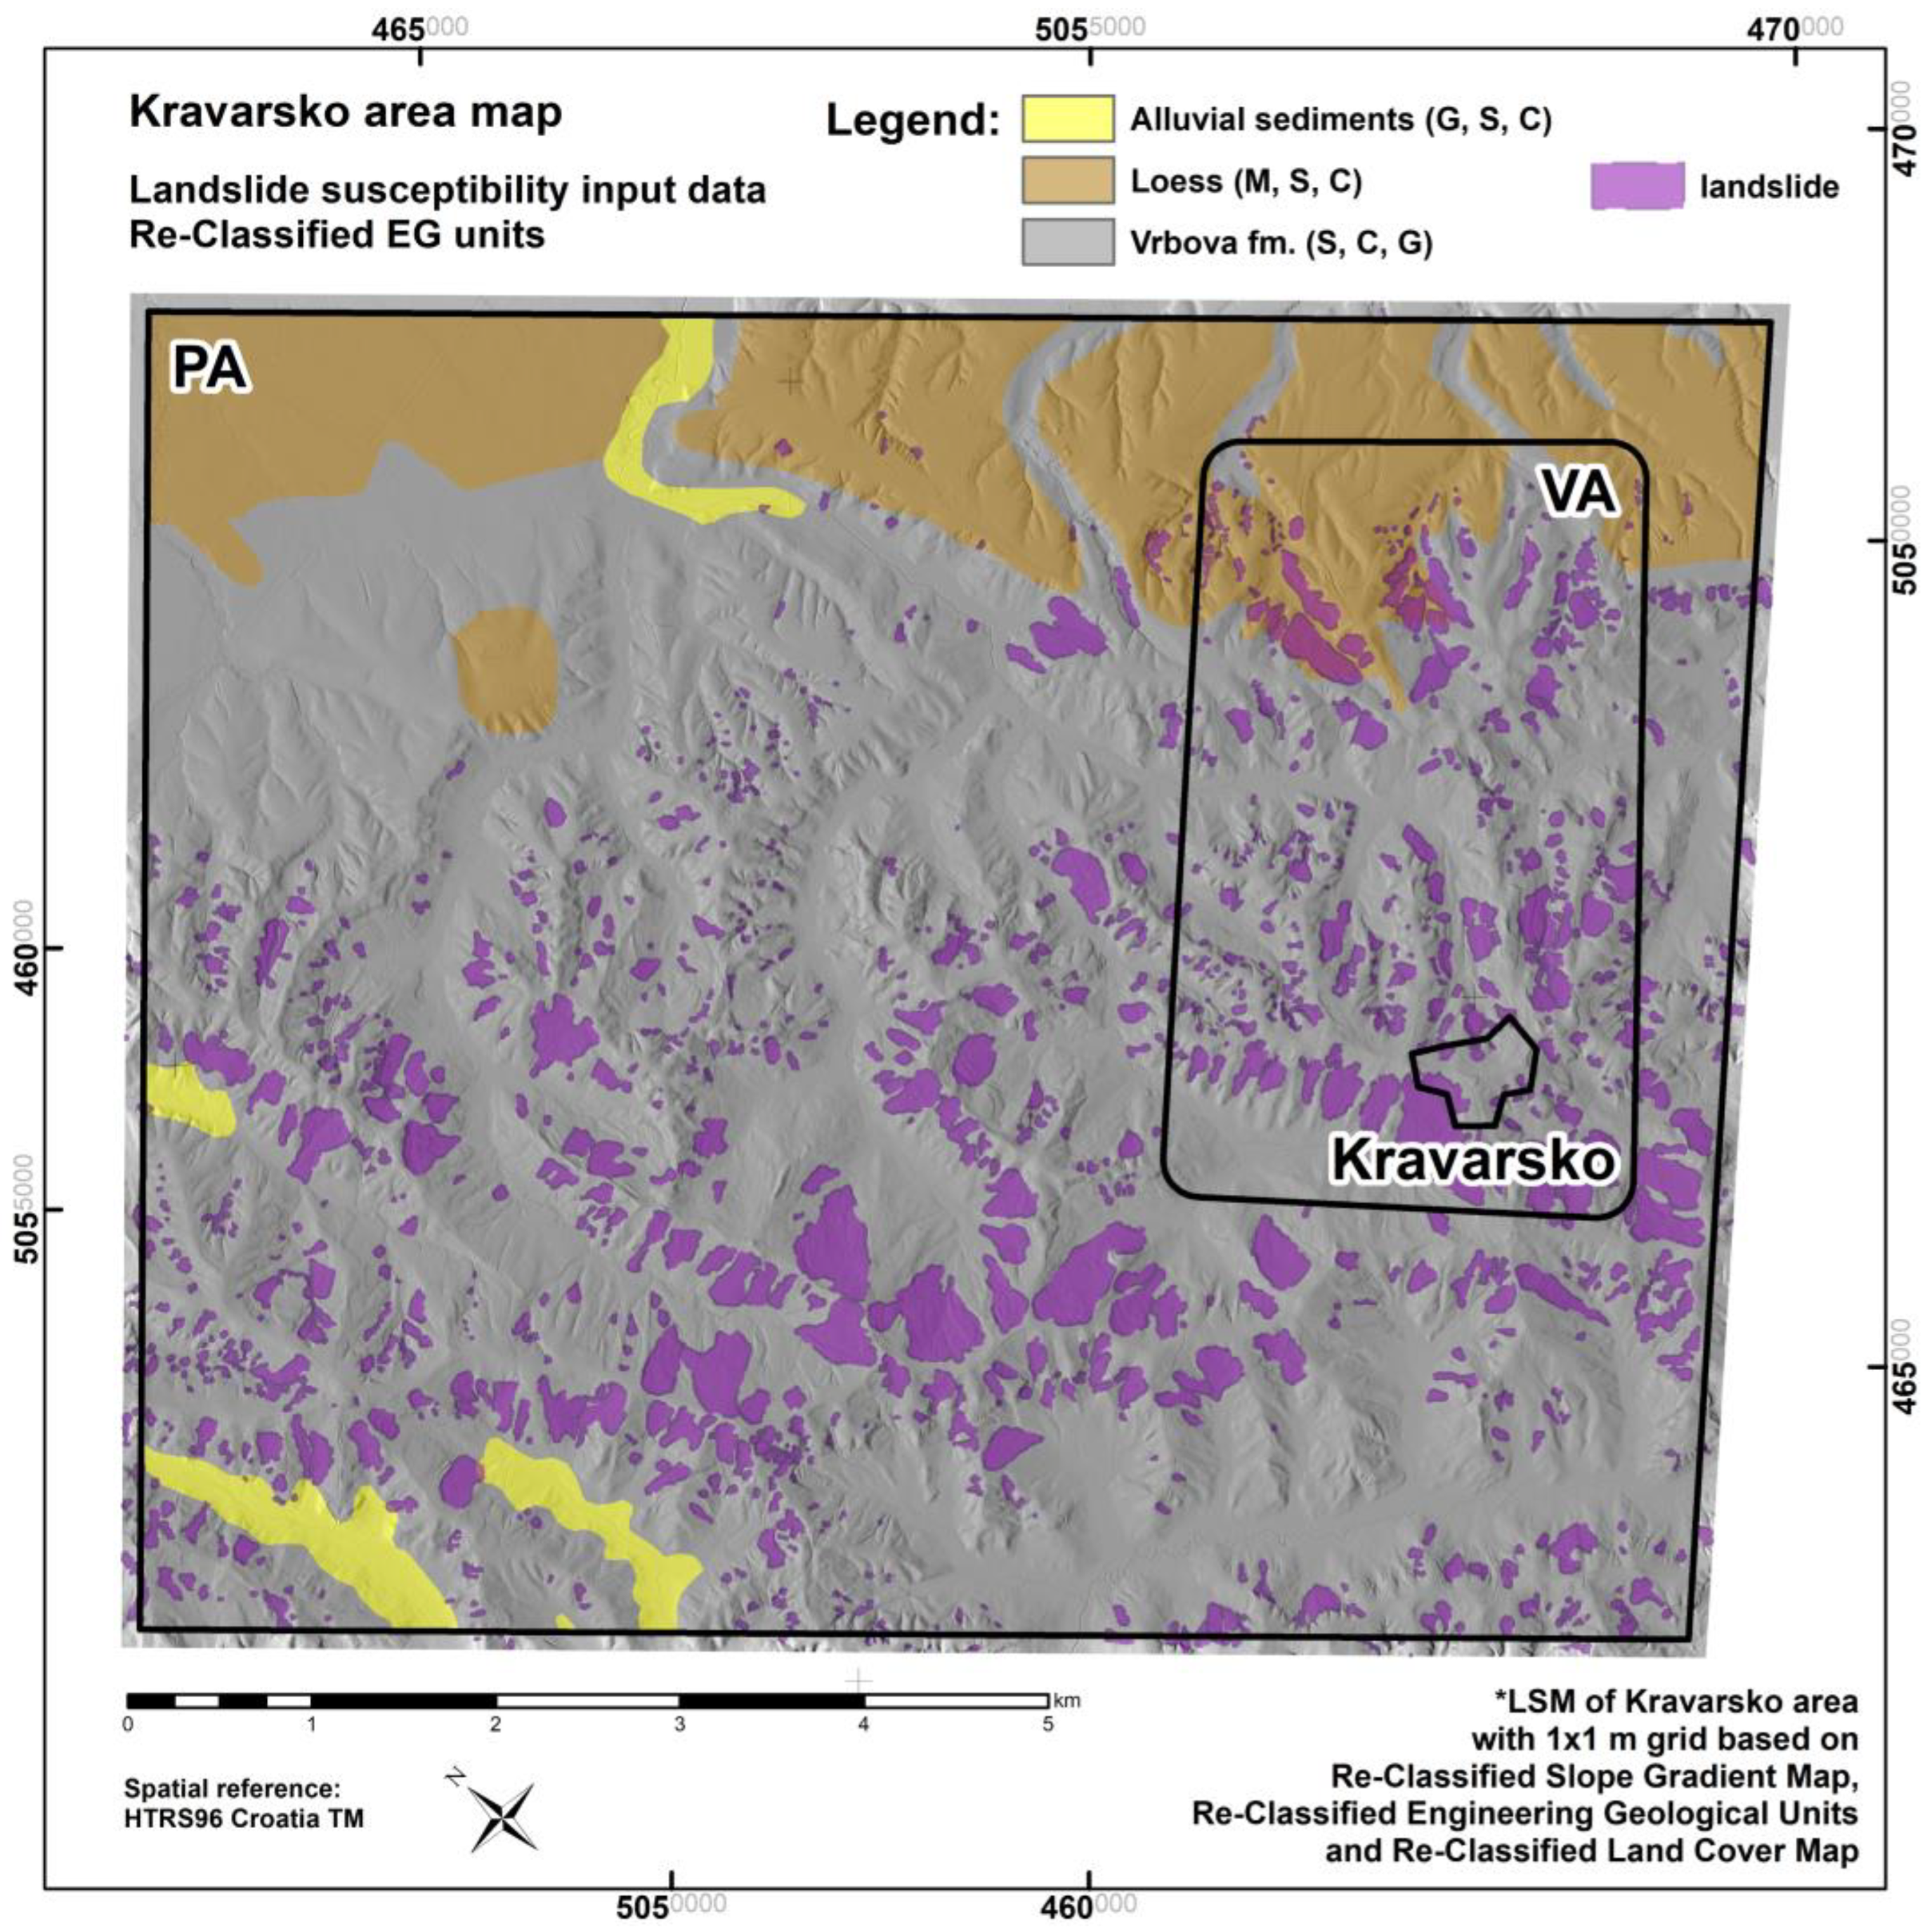
In landslide development in some areas (depending on the landslide susceptibility of the area), the geological setting (in the wider sense) plays an important role [57,58,59]. For the Kravarsko PA, the most detailed available geological data are at the scale of 1:100,000 [31], which is a relatively “coarse” scale compared to the resolution of available hrDEMs. Nevertheless, for the PA, three major engineering geological units (EGUs) can be differentiated based on the available geological data: alluvial sediments, represented by gravels (G), sands (S), and clays (C); loess-type sediments, represented by silts (M), sands (S), and clays (C); and the Vrbova fm., represented by sands (S), clays (C), and gravels (G). The vast majority of the landslides in the PA occur in Vrbova fm. [26,32,40,41], and the developed map of EG units reflects this (Figure 5). As the geological input data (in the wider sense) were relatively coarse, “just” three classes for this layer were used in the analysis. At the same time, however, this layer was regarded as “almost as important as” the slope gradient data layer (with an overall weight of 0.4). For the Kravarsko PA (≈61.7 km2), the reclassified engineering geological data with percentages are summarized as follows: alluvial sediments were present in ~3% of the area (~1.9 km2 of the PA), loess-type sediments were present in ~15% of the area (~9.3 km2 of the PA), and Vrbova fm. was present in ~82% of the area (~50.6 km2 of the PA), as detailed in Figure 5.

3.3. Land-Cover Data

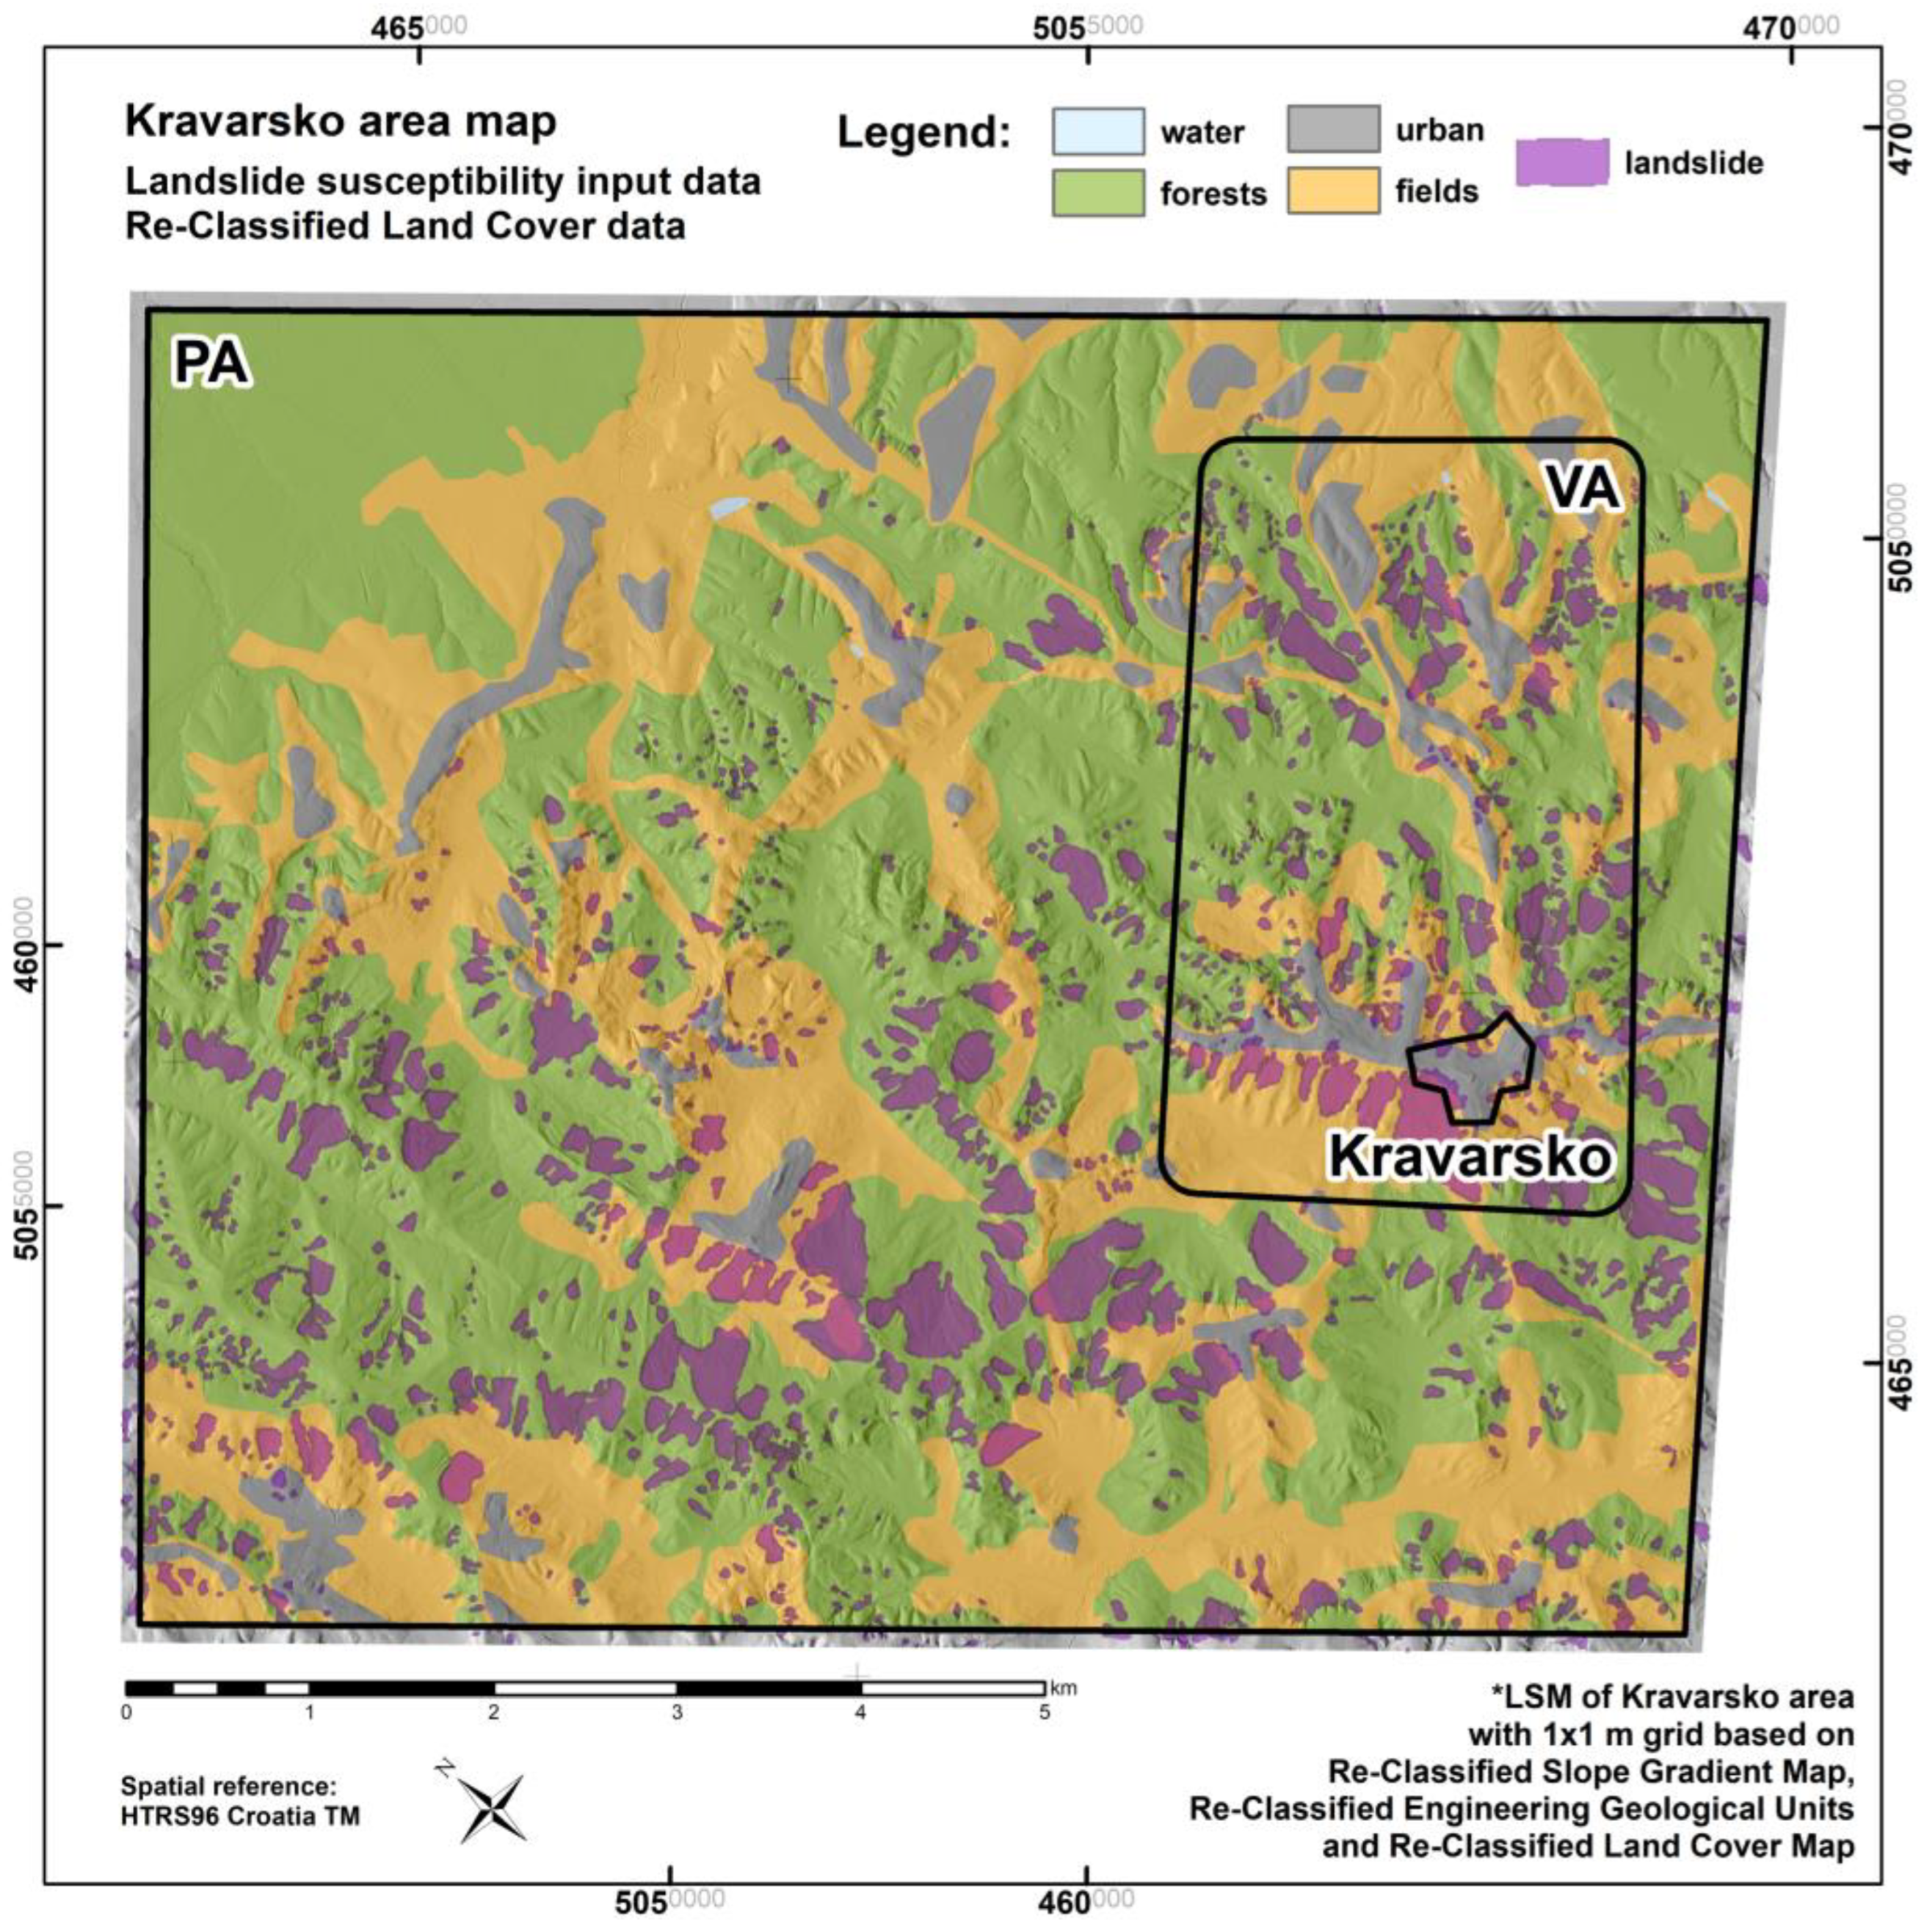
In landslide development in some areas (depending on the landslide susceptibility of the area), the land-cover type can play some role [60,61,62]. For the Kravarsko PA, new land-cover data (map) were developed based on detailed orthophotos from 2018 (10 × 10 cm pixel size), and four classes of land cover were differentiated: surface water areas, forest areas (or areas with “high” vegetation cover), urban areas (or areas with “artificial” cover), and fields (or areas with “low” or no vegetation) (see Figure 6). In our analysis, the land-cover data were regarded as the “least important” layer (with an overall weight of 0.1). For the Kravarsko PA (≈61.7 km2), the detailed land-cover data reclassified by classes with percentages and areas are summarized as follows: surface water areas were present in less than 0.1% of the area (~0.1 km2 of the PA), forest areas were present in ~59% of the area (~36.4 km2 of the PA), urban areas were present in ~6% of the area (~3.7 km2 of the PA), and field areas were present in ~35% of the area (~21.6 km2 of the PA), as shown in Figure 6.

3.4. Development of the Kravarsko Landslide Susceptibility Map

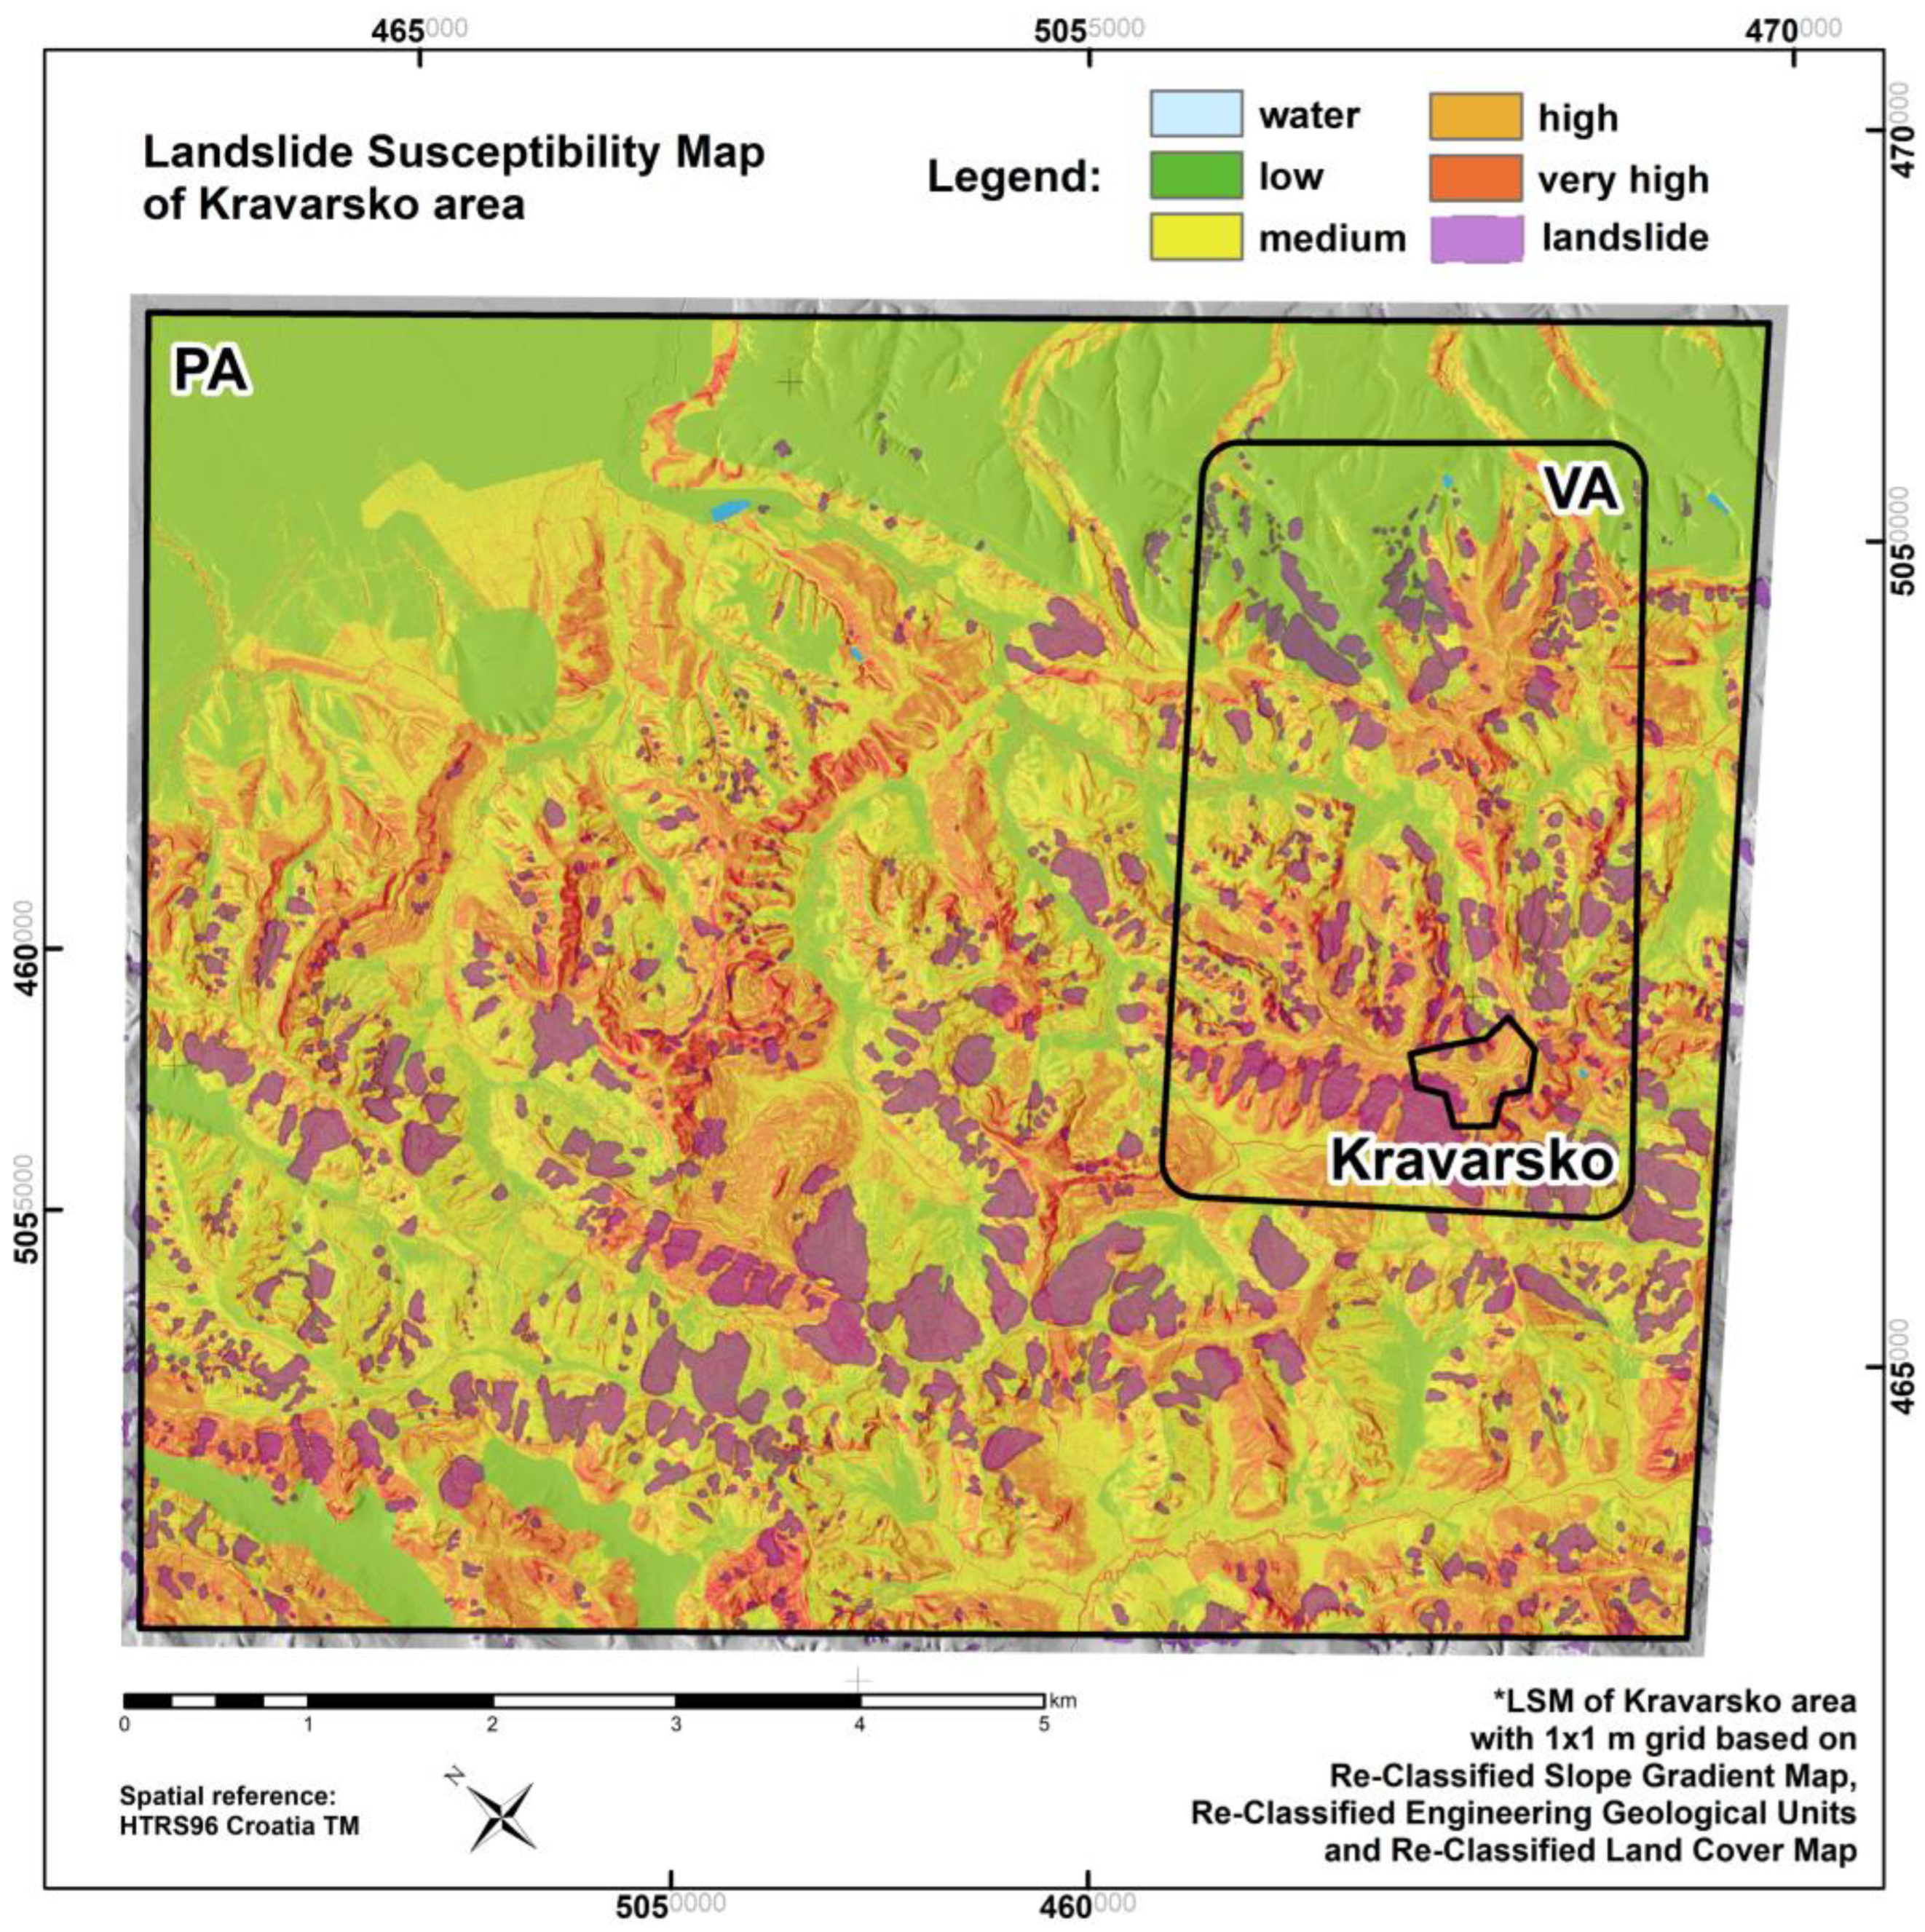
Landslide susceptibility maps are classified according to the methodology and data used during their development: they can be quantitative or qualitative; direct or indirect; or heuristic, probabilistic, or deterministic, with differentiated or undifferentiated types of landslide mechanisms [63,64,65,66,67]. For the Kravarsko PA, the landslide susceptibility map was developed using a heuristic approach with the weight factors presented in Table 1. The heuristic approach was chosen based on the available data and experience, while the weight of the criteria for the layers, as well the overall weight (Table 1), was based on recommendations from the literature [55,62] and expert judgment [53]. It is important to mention that for Croatia, a small-scale LSM was developed in 2015, and those results were also taken into account [53]. Still, as extensive field work was carried out for the Kravarsko PA (described in detail in [32], with the material properties described in detail in [26]), the weights of criteria used herein were modified based on those findings and engineering judgments to more accurately reflect the terrain conditions. A detailed slope gradient map and land-cover data were developed as completely new datasets, while the available geological data were used to develop reclassified engineering geological units. Based on these three “basic” layers (slope angle, engineering geological units, and land cover as 1 × 1 m pixel-sized raster format data), a landslide susceptibility map was developed. The landslide inventory was used to check the developed landslide susceptibility map, with field validation performed on a smaller validation area (Figure 7).
On the resulting LSM map, five classes were distinguished (Table 2); whereas water areas can be disregarded as “landslide-free areas” (~0.1% and ~0.1 km2 of the PA area), the low-LSM zone can be considered a “not or somewhat landslide-prone area” (~31.4% and ~19.1 km2 of the PA area). Meanwhile, medium, high, and very-high LSM zones can be considered “landslide-prone areas” (~68.5% and ~42.6 km2 of the PA area), as shown in Figure 7. It should be noted that landslides can occur in “not landslide-prone areas”, but their occurrence is not expected to be as frequent and devastating as in “landslide-prone areas”.

3.5. Development of the Kravarsko Area Terrain Stability Map

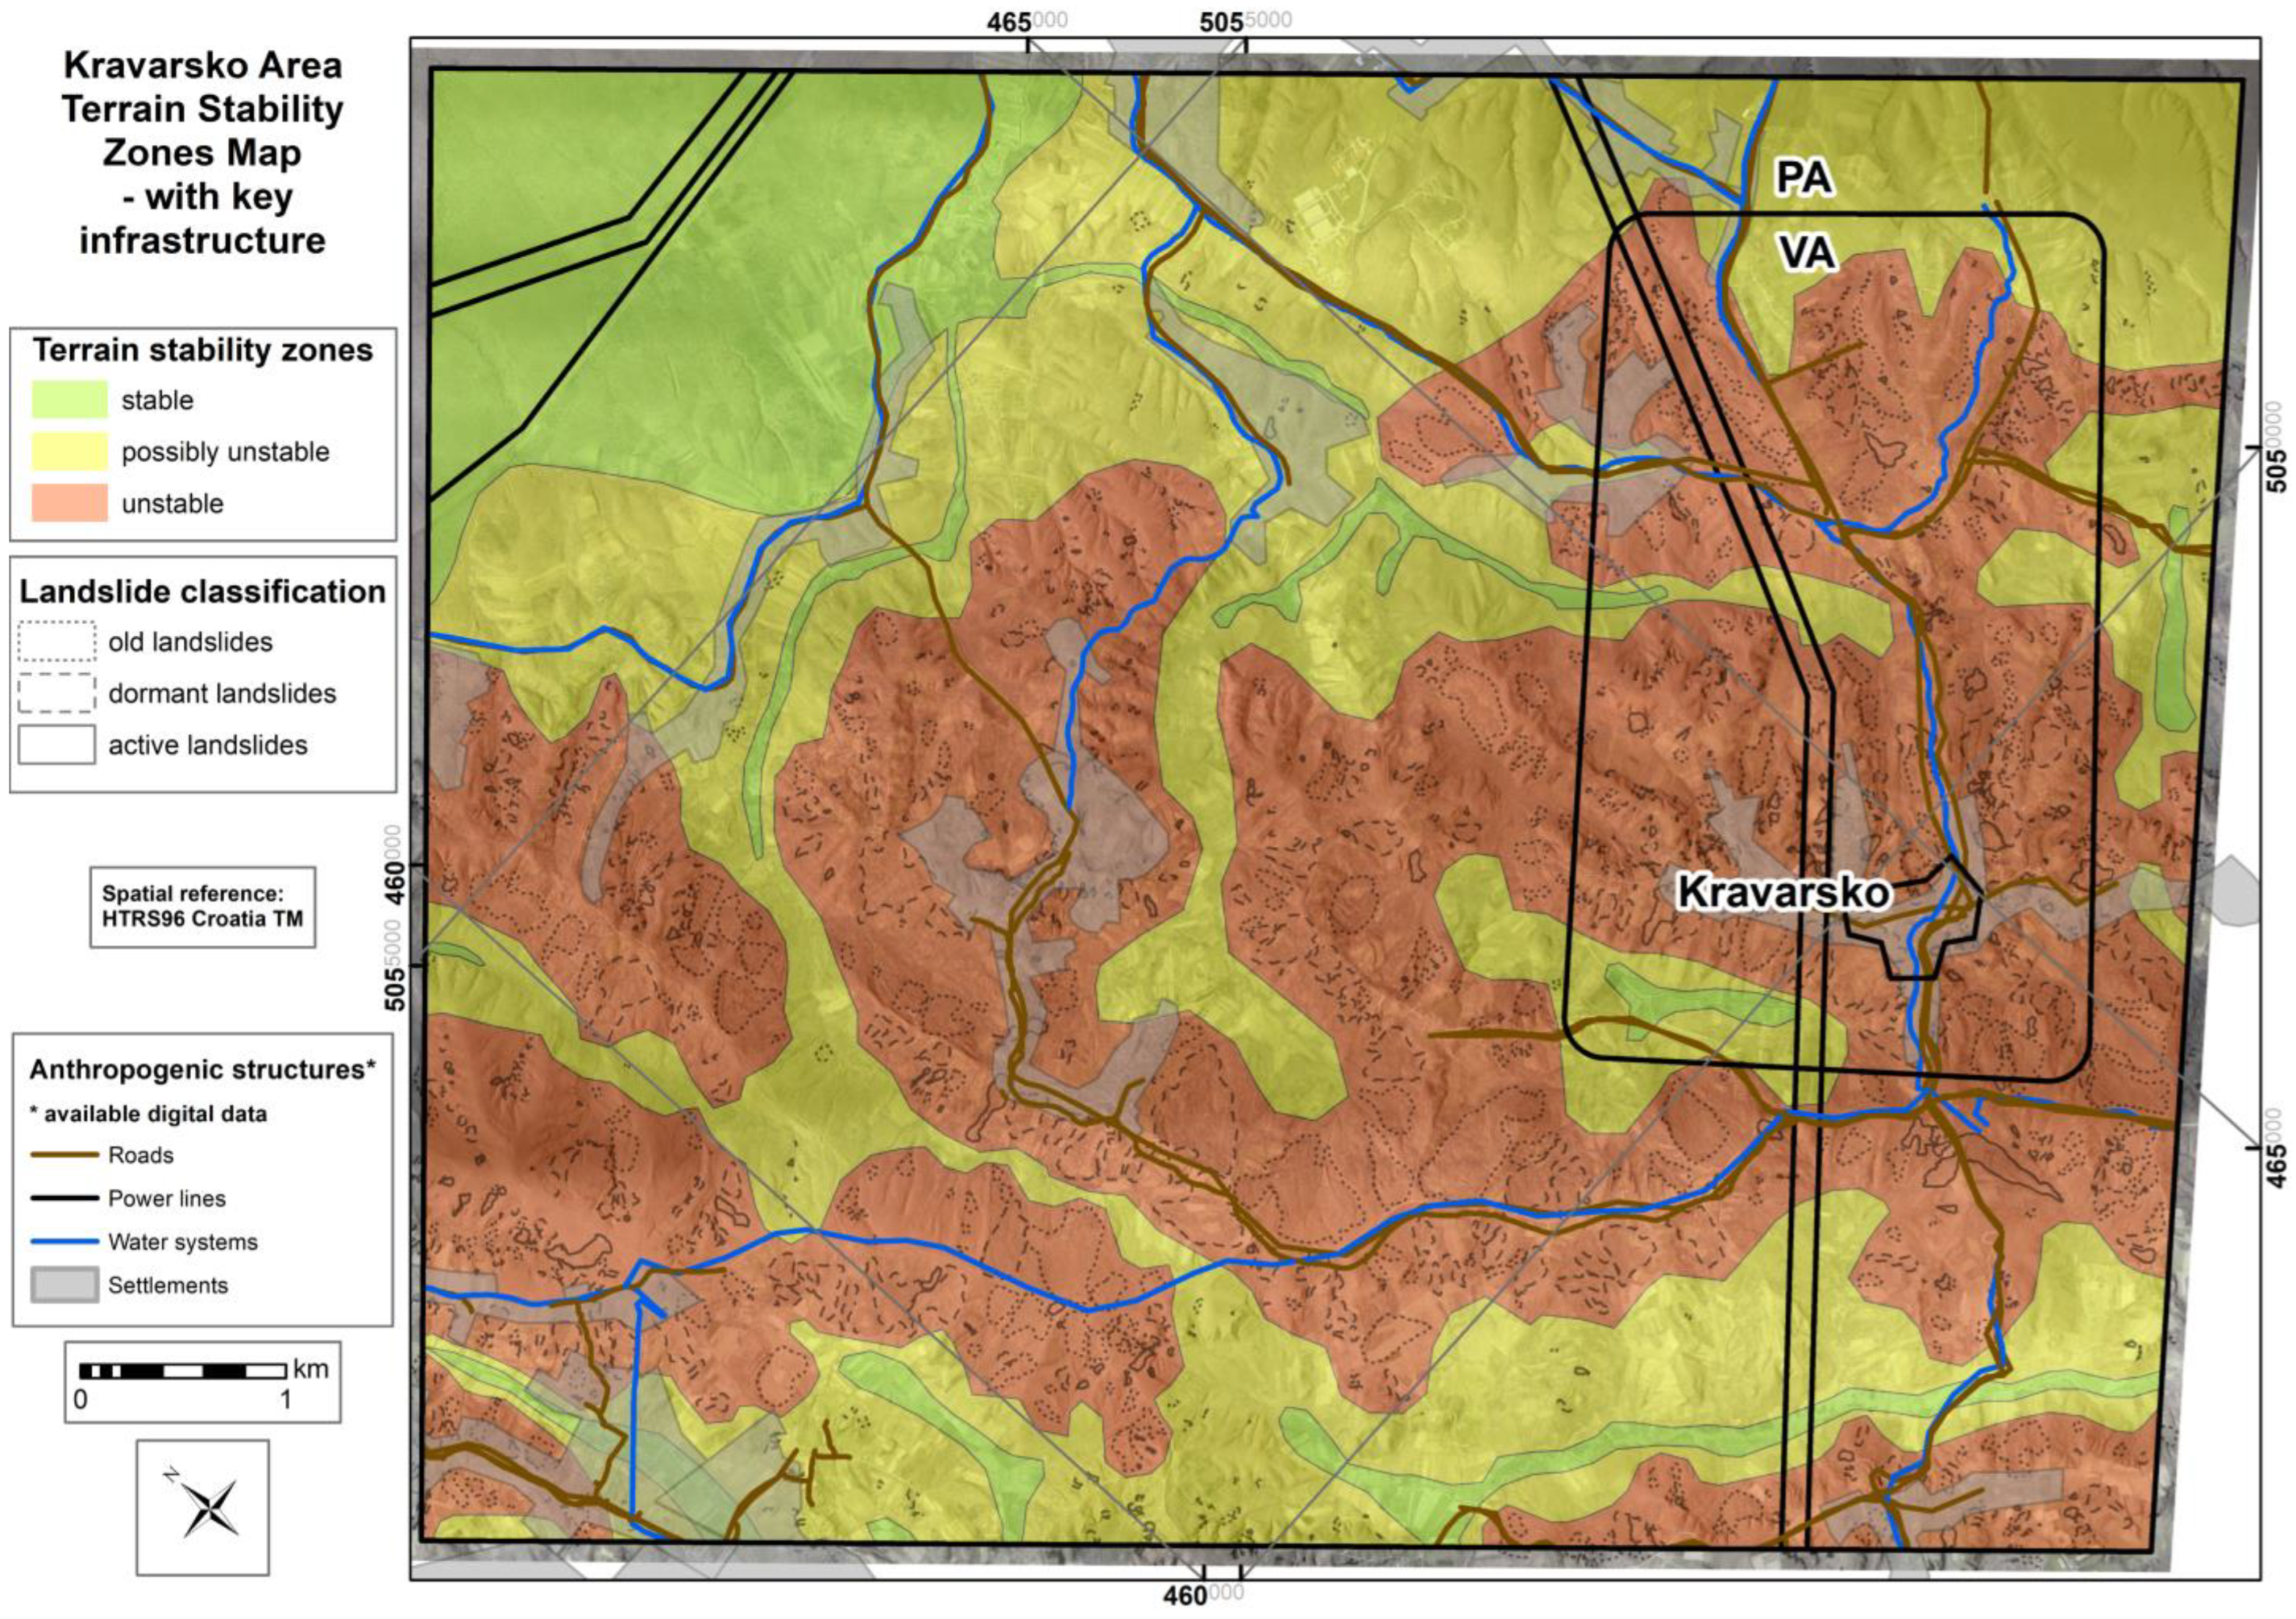
For the Kravarsko PA, the main goal was to develop a simple and usable map for natural hazard management (NHM) for the local community (i.e., non-expert users) [32,61,68,69,70,71]. It was concluded that for this purpose, a somewhat modified landslide susceptibility map (LSM) with additional content of interest (anthropogenic structures) could prove more useful: this would result in a terrain stability map (TSM) with key infrastructure data. The results of the previous research were taken into account [19,25,29], along with the data and analyses presented herein, and the Kravarsko Area Terrain Stability Map was developed, as shown in Figure 8. On this map, the Kravarsko PA is differentiated into three zones of terrain stability: stable zones (~7.3 km2 and ~12% of the PA area) are areas without recorded landslides (0 landslides), possibly unstable zones (~23.0 km2 and ~37% of the PA area) are areas with some (in general, smaller) recorded landslides (131 landslides from inventory, corresponding to ~9% of landslides and ~0.11 km2 of the landslide area), and unstable zones (~31.4 km2 and ~51% of the PA area) are areas with recorded landslides (1299 landslides from inventory, corresponding to ~91% of landslides and ~6.40 km2 of landslide area). For this type of zoning, reliable landslide inventory data are vital. In natural hazard management (NHM), anthropogenic structures and their possible endangerment are important aspects of future planning and funding allocation, so the available digital data regarding settlements, roads, power lines, and water systems were taken into account in relation to the defined zones of terrain stability (see Table 3).

4. Discussion

In the process of developing the Kravarsko landslide susceptibility map (LSM), the input layers were “treated” with different weight factors and numbers of classes in order to find the optimum balance between data quality and the intention that the LSM reflect the terrain conditions for landslide occurrences as closely as possible. In order to achieve this goal, the results of previous detailed research studies were also taken into account [26,32,41]. The presented LSM for the Kravarsko PA is considered acceptable and usable regarding the input data and field observations [26,32]. However, after detailed landslide inventory analysis, recommendations can still be made about input layers and cases when the landslide susceptibility map is optimal and cases when a “new” map (a terrain stability map with key infrastructure data) is more appropriate for the local community to use in natural hazard management (NHM).

4.1. Comments on Input Layers

For the Kravarsko PA, detailed slope gradient data with a 1° distinction and nine classes were developed; however, the steep and very steep slope classes (with inclinations in the range of 36–90°) were present only in ~1.2% of the area (~0.7 km2 of PA), while flat areas (with no inclination, 0°) were present in ~3% of the area (~1.9 km2 of PA) (see Figure 4). This was expected, as the “usual and most common” natural terrain has some inclination to it, and it does not comprise flat areas or very steep slopes (as steep slopes “tend” to become gentler due to different natural processes: erosion, mass movements, etc.). This finding was also reflected in the landslide frequency for these areas: ~2% of landslides (~0.13 km2 of landslide area) were in the steep and very steep slope classes (with inclinations in the range of 36–90°), and ~2% of landslides (~0.13 km2 of the landslide area) were in flat areas (with no inclination, 0°). Based on these data (and field observations), it can be concluded that the “problematic” slope inclination values for the Kravarsko PA are the following ranges: (i) 1–5°, almost flat areas covering ~34% and ~21.0 km2 of the PA, with ~16% of landslides and ~1.04 km2 of the landslide area; (ii) 6–15°, gentle slope areas covering ~45% and ~27.8 km2 of the PA, with ~53% of landslides and ~3.45 km2 of the landslide area; and (iii) 16–35°, slopes and inclined slope areas covering ~17% and ~10.5 km2 of the PA, with ~27% of landslides and ~1.76 km2 of the landslide area. In general, for the Kravarsko PA, in almost flat areas (1–5°), soil creeps (long-lasting and shallow movements) are common; meanwhile, on slopes (6–35°), slides in soil (which can be described as rotational, planar, or compound slides in clays and silts or as debris slides in gravels and sands) are more frequent [32,49].
For the Kravarsko PA, alluvial sediments were present only in ~3% of the area (~1.9 km2 of the PA), with only ~0.1% of landslides and ~0.01 km2 of the landslide area. Therefore, for the Kravarsko area, alluvial sediments (in general) can be regarded as not being landslide-prone areas. Loess-type sediments were present in ~15% of the area (~9.3 km2 of the PA), with ~4.3% of landslides and ~0.28 km2 of the landslide area. Therefore, for the Kravarsko area, loess-type sediments (in general) can be regarded as somewhat landslide-prone areas. Vrbova fm. was present in ~82% of the area (~50.6 km2 of PA), with ~95.6% of landslides and ~6.22 km2 of the landslide area, as shown in Figure 5. In general, for the Kravarsko PA, landslides occur in Vrbova fm. sediments (landslide-prone areas [26,32,40,41]), and they are shallow (those with a deepest sliding surface of up to 5 m in depth are the most frequent) and small to medium in (100–20,000 m2) [7].
For the Kravarsko PA, a new land-cover map was developed, where surface water areas were present in less than 0.1% of the area (~0.1 km2 of PA); these were areas without landslides. Forest areas were present in ~59% of the area (~36.4 km2 of PA), comprising ~78% of the landslides and ~5.01 km2 of the landslide area. Urban areas were present in ~6% of the area (~3.7 km2 of PA), with ~1% of the landslides and ~0.07 km2 of the landslide area. Field areas were present in ~35% of the area (~21.6 km2 of PA), with ~21% of the landslides and ~1.37 km2 of the landslide area (Figure 6). The land-cover data should be critically considered with the following points kept in mind: (i) the majority of the landslides are registered in forest areas due to the available mapping method (hrDTMh), whereby the landslide features are “preserved” (more or less) in their natural environment; (ii) in fields (due to cultivation), landslide features are “quickly” masked/destroyed, and “older” landslides cannot be mapped; and (iii) in urban areas (as for the fields but due to mitigation measures), landslide features are “quickly” masked/destroyed, and “older” landslides cannot be mapped, even though for the Kravarsko PA, the anthropogenic factor (in addition to the geological setting) often plays a key role in the landslide activation process [32,60,61].

4.2. Comments on the Kravarsko Landslide Inventory and Landslide Susceptibility Map

For the Kravarsko PA, a new landslide inventory and landslide susceptibility map were developed. While both of these datasets are valuable, they have their limitations in terms of practical usage. The landslide inventory was developed based on hrDEMs, which contain precise data. However, the interpretation of the landslide inventory (landslide mapping) is a subjective process [19,31,32]; therefore, periodic LiDAR scanning and updates of the landslide data are recommended. Additionally, periodic data gathering and updates could serve as a basis for landslide hazard map development; this would provide the much-needed time component in landslide datasets [17,20,21]. In LSM for the Kravarsko PA, ~17% of landslides and ~1.11 km2 of the landslide area are in low-LSM zones (~31.4% and ~19.1 km2 of the PA area), ~43% of landslides and ~2.80 km2 of the landslide area are in the medium LSM zone (~35.9% and ~22.3 km2 of the PA area), ~32% of landslides and ~2.08 km2 of the landslide area are in the high-LSM zone (~27.2% and ~16.7 km2 of the PA area), and ~8% of landslides and ~0.52 km2 of the landslide area are in the very-high-LSM zone (~5.4% and ~3.7 km2 of the PA area), as shown in Figure 7. In general, based on the resulting LSM, ~70% of the Kravarsko PA can be considered a “landslide-prone area”, where ~85% of the landslides occur. At first glance, it is a high-value “landslide-prone area”, but it can be directly correlated with the defined EGUs for the research area: Vrbova fm. landslide-prone sediments cover more than 80% of the investigated area (Figure 5).

4.3. Comments on the Kravarsko Area Terrain Stability Map

From the perspective of optimizing natural hazard management, the Kravarsko area terrain stability map has the following advantages: (i) the crucial management area (areas with landslides) is smaller in terms of TSM than LSM (~50% vs. ~70% of the Kravarsko PA, respectively), and (ii) the at-risk key infrastructure areas are clearly defined with concrete values (Table 3). It is also worth noting that although landslides are concentrated in Vrbova fm., as is the case for settlements, roads, power lines, and water systems, the TSM data allow us to focus on ~50% of the PA in which ~90% of the landslides occur: ~60% of settlements areas, ~70% of roads, ~60% of water systems, and ~40% of power lines in the PA represent management priorities because they are endangered by landslides.
Based on the relatively simple analysis presented here, the area of (intensive) natural hazard management is reduced practically by half (50%), and key infrastructure “maintenance” is reduced by 40–60%. Of course, this does not mean that key infrastructure in possibly unstable zones (or even stable zones) should not be checked or maintained, but the frequency and the cost of such checks can be reduced, as can the eventual mitigation measures needed. That stated, the TSM can directly reflect (positively) budget optimization processes and future (urban) planning in the local community.

4.4. Reflections and Comments on the Presented Perennial Research

4.4.1. Innovation and Novelty of the Research

There are many different types of research conducted and a variety of methods used in the development of LSMs [35,36,37,38,39], but the novelty of the present results is that they do not focus on the LSM but on the development of a reliable LI based on high-resolution RS data in combination with the available digital key infrastructure data in order to provide a simple and usable map for the local community: the TSM. In this sense, the TSM presented herein is a “practical” novelty, and the presented methodology can be used/upscaled for larger areas and regions or at a national level. With adequate data, there are no limitations; only the final TSM scale and “purpose of the use” must be kept in mind and defined accordingly.

4.4.2. Validation and Field Research

The developed TSM is based on RS and field data. For the Kravarsko PA, old and new detailed RS data were analyzed, and the developed LI was validated in an on-the-ground setting for 10% of the research area and 15% of the developed LI [32]. Moreover, extensive field work was carried out (described in detail in [26,32]). The field data collected to determine the on-site material characteristics included 16 shallow boreholes, 43 field pocket penetrometer tests, 29 field shear vane tests, and 676 field points (geological and engineering geological) for the VA with 113 field points (geological) and ~200 different laboratory tests for the wider area (granulometry, mineralogy, XRD, CaCO3 content, etc.) [32].

4.4.3. Research Limitations

It must be remembered that the quality of the developed TSM is based on the quality of the input data. Limitations in TSM development can be associated with the quality of the RS data and the available LI and infrastructure data. RS data quality is affected by the season, light conditions (i.e., the length of a day and angle of sun beams), and the density of the vegetation cover. To minimize these limiting conditions for the Kravarsko area, airborne LIDAR scanning was conducted in early spring 2018 with 20 points per m2; at the same time, orthophotos and stereopairs with pixel sizes of 10 × 10 cm were acquired. Based on these data, hrDEMs (0.5 × 0.5 m pixel size) were developed for analysis. The developed LI is based on high-quality hrDEMs analysis; nevertheless, the subjectivity of the expert(s) [31,32] cannot be neglected. The following main problem in LI development remains: how are we to accurately identify “older” landslides when some of their features are masked/degraded/poorly visible or non-visible [31,32]? As for infrastructure data, they should be provided by the local community or regional management, depending on the final scale of the developed TSM.

4.4.4. Broader Implications and Scalability

The methodology of the present study can be applied to larger areas and regions or used at the national level, regardless of the topography and climate. In this regard, the Kravarsko PA (≈61.7 km2) can be considered a smaller test polygon for which the results (the developed LI and TSM) were positive. The next step involves upscaling the presented methodology on a county level, i.e., using it for Zagreb City County (≈641 km2, an area 10 times larger).

4.4.5. Research Steps and Technical Explanations

The perennial research presented herein can be described as three-step study with certain prerequisites. These prerequisites are as follows: a defined area of research, hrDEMs of the area, and a developed scoring system for the classification of identified landslides and key digital infrastructure data. The steps are as follows:
  • Step 1: The interpretation of hrDEMs and LI development based on the applied scoring system (described in more detail in [32]);
  • Step 2: The verification of results in terms of the cabinet (historical data review) and field research (calibration of the mapping and scoring system, if needed) described in more detail in [32]);
  • Step 3: Product development, i.e., the development of a TSM with key infrastructure (presented in this paper).
All of the research was performed within CAD (AutoCad2023 and StereoCad) and the GIS environment (ArcGIS 10.2.1.). The basic statistical analyses are described in [32], while more detailed statistical analysis is intended for publication along with stakeholder feedback data and new research results.

5. Conclusions

In some areas (for example, the Kravarsko PA), landslides represent a constant threat to safety and property. Landslides cannot be predicted exactly, but the conditions and areas (zones) in which they are activated can be estimated with great confidence, provided there are adequate data available. In landslide analysis, a reliable landslide inventory is of significant value, as it is a basis for developing a viable natural hazard (landslide) management plan for a certain area. In optimized landslide management, the area of interest should be divided into (smaller) zones with the same characteristics; this can be achieved by developing an LSM based on basic data (slope gradient, geology, and land cover) or by developing a TSM, such as that presented here, based on the available relevant data (inventory and infrastructure). Basic LSMs can provide adequate solutions in cases when landslide inventories are not available, but a TSM with a landslide inventory, and key infrastructure data are on the “user-friendly side” for non-expert users engaged in natural hazard management, for example, local administrations. At the same time, it can provide easily understandable information for the local community. It is reasonable to expect future landslides to occur in the areas where they have occurred in the past or where they are occurring now [72]. The results of the present study can assist in the management of natural hazards and urban planning:
  • The LSM presented here was developed for the Kravarsko PA; however, it should be noted that the developed LSM is heavily influenced by terrain slope inclination and geology (EGU) data.
  • The developed TSM is also heavily influenced by landslide inventory data.
  • The novelty of the results presented herein resides in their focus on the development of a reliable LI based on high-resolution RS data in combination with the available digital key infrastructure data in order to provide a simple and usable map for local community, i.e., the TSM.
  • With the TSM, the areas with higher landslide frequency (“risk”) are reduced (optimized). In the TSM, the area of (intensive) natural hazard management is reduced practically by half (50%), and key infrastructure “maintenance” is reduced by 40–60% for the Kravarsko PA.
  • We advise that future periodic (landslide) data gathering, the analysis of hazards, and the development of risk maps are still needed for the PA; these measures would improve the present state of natural hazard (landslide) management in the Kravarsko area.
  • The presented methodology for TSM development is described according to three steps and defined prerequisites.
  • With the provision of adequate data, the TSM can be used/upscaled for larger areas and regions or used at the national level, regardless of the differing topographies and climates of these regions.

Author Contributions

Conceptualization, methodology, and validation: L.P.; formal analysis, investigation, and data curation: L.P. and colleagues from the Croatian Geological Survey; writing—original draft preparation: L.P.; writing—review and editing: I.K.; visualization: L.P. and I.K. All authors have read and agreed to the published version of the manuscript.

Funding

The authors would like to express their thanks to the H2020-WIDESPREAD-05-2017-Twinning project (project acronym: GeoTwinn; project ID: 809943) and its members, with special thanks for their support of open-access research.

Data Availability Statement

Data are contained within the article.

Acknowledgments

The authors would like to express their thanks to (i) Interreg IPA CBC Croatia–Bosnia and Herzegovina–Montenegro projects safEarth (HR-BA-ME59) and RESPONSa and its members; and (ii) our colleagues from HGI-CGS, who helped with this research in many ways.

Conflicts of Interest

The authors declare no conflict of interest.

References

  1. Bell, F.G. Geological Hazards: Their Assessments, Avoidance and Mitigation; E&FN Spon Press: London, UK, 2003; pp. 1–648. [Google Scholar]
  2. Mateos, R.M.; López-Vinielles, J.; Poyiadji, E.; Tsagkas, D.; Sheehy, M.; Hadjicharalambous, K.; Liscák, P.; Podolski, L.; Laskowicz, I.; Iadanza, C.; et al. Integration of landslide hazard into urban planning across Europe. Landsc. Urban Plan. 2020, 196, 103740. [Google Scholar] [CrossRef]
  3. Podolszki, L.; Kosović, I.; Novosel, T.; Kurečić, T. Multi-Level Sensing Technologies in Landslide Research—Hrvatska Kostajnica Case Study, Croatia. Sensors 2022, 22, 177. [Google Scholar] [CrossRef] [PubMed]
  4. Cruden, D.M. A simple definition of a landslide. Bull. Int. Assoc. Eng. Geol. 1991, 43, 27–29. [Google Scholar] [CrossRef]
  5. The International Geotechnical Societies’ UNESCO Working Party on World Landslide Inventory (WP/WLI). A suggested method for reporting a landslide. Bull. Int. Assoc. Eng. Geol. 1990, 41, 5–12. [Google Scholar] [CrossRef]
  6. Varnes, D.J. Slope movement types and processes. In Landslides: Analysis and Control; Schuster, R.L., Krizek, R.J., Eds.; Transportation Research Board: Washington, DC, USA, 1978; Special Report 176; pp. 11–33. Available online: https://www.engr.hk/T05/176-002.pdf (accessed on 16 August 2023).
  7. Cornforth, D.H. Landslides in Practice: Investigation, Analysis, and Remedial/Preventative Options in Soils; John Wiley & Sons, Inc.: Hoboken, NJ, USA, 2005; pp. 1–596. ISBN 978-0-471-67816-8. [Google Scholar]
  8. Cruden, D.M.; Varnes, D.J. Landslide types and processes. In Landslides—Investigation and Mitigation; Turner, A.K., Schuster, R.L., Eds.; Transportation Research Boar: Washington, DC, USA, 1996; Special Report 247; pp. 36–75. Available online: http://onlinepubs.trb.org/Onlinepubs/sr/sr247/sr247-003.pdf (accessed on 17 August 2023).
  9. Highland, L.M.; Bobrowsky, P. The Landslide Handbook—A Guide to Understanding Landslides; US Geological Survey: Denver, CO, USA, 2008; pp. 1–147. [Google Scholar] [CrossRef]
  10. Liu, P.; Wei, Y.; Wang, Q.; Chen, Y.; Xie, J. Research on Post-Earthquake Landslide Extraction Algorithm Based on Improved U-Net Model. Remote Sens. 2020, 12, 894. [Google Scholar] [CrossRef]
  11. Komolvilas, V.; Tanapalungkorn, W.; Latcharote, P.; Likitlersuang, S. Failure analysis on a heavy rainfall-induced landslide in Huay Khab Mountain in Northern Thailand. J. Mt. Sci. 2021, 18, 2580–2596. [Google Scholar] [CrossRef]
  12. Korup, O.; Seidemann, J.; Mohr, C.H. Increased landslide activity on forested hillslopes following two recent volcanic eruptions in Chile. Nat. Geosci. 2019, 12, 284–289. [Google Scholar] [CrossRef]
  13. Karagianni, A.; Lazos, I.; Chatzipetros, A. Remote sensing techniques in disaster management: Amynteon mine landslides, Greece. In Lecture Notes in Geoinformation and Cartography; Cartwright, W., Gartner, G., Meng, L., Peterson, M.P., Eds.; Springer: Berlin/Heidelberg, Germany, 2019. [Google Scholar] [CrossRef]
  14. Li, Y.; Wang, X.; Mao, H. Influence of human activity on landslide susceptibility development in the Three Gorges area. Nat. Hazards 2020, 104, 2115–2151. [Google Scholar] [CrossRef]
  15. Manchado, A.M.-T.; Ballesteros-Cánovas, J.A.; Allen, S.; Stoffel, M. Deforestation controls landslide susceptibility in Far-Western Nepal. CATENA 2022, 219, 106627. [Google Scholar] [CrossRef]
  16. Chen, L.; Guo, Z.; Yin, K.; Shrestha, D.P.; Jin, S. The influence of land use and land cover change on landslide susceptibility: A case study in Zhushan Town, Xuan’en County (Hubei, China). Nat. Hazards Earth Syst. Sci. 2019, 19, 2207–2228. [Google Scholar] [CrossRef]
  17. Chacón, J.; Irigaray, C.; Fernández, T.; El Hamdouni, R. Engineering Geology Maps: Landslides and Geographical Information Systems. Bull. Eng. Geol. Environ. 2006, 65, 341–411. [Google Scholar] [CrossRef]
  18. Filipović, M.; Mišur, I.; Gulam, V.; Horvat, M. A case study in the research polygon in Glina and Dvor municipality, Croatia–landslide susceptibility assessment of geological units. Geol. Croat. 2022, 75, 17–33. [Google Scholar] [CrossRef]
  19. Guzzetti, F.; Mondini, A.C.; Cardinali, M.; Fiorucci, F.; Santangelo, M.; Kang-Tsung, C. Landslide inventory maps: New tools for an old problem. Earth Sci. Rev. 2012, 112, 42–66. [Google Scholar] [CrossRef]
  20. Corominas, J.; Van Westen, C.; Frattini, P.; Cascini, L.; Malet, J.-P.; Fotopoulou, S.; Catani, F.; Van Den Eeckhaut, M.; Mavrouli, O.; Agliardi, F.; et al. Recommendations for the Quantitative Analysis of Landslide Risk. Bull. Eng. Geol. Environ. 2014, 73, 209–263. [Google Scholar] [CrossRef]
  21. Guzzetti, F. Landslide Hazard and Risk Assessment. Ph.D. Thesis, University of Bonn, Bonn, Germany, 2006. [Google Scholar]
  22. Pollak, D.; Hećej, N.; Grizelj, A. Landslide inventory and characteristics, based on LiDAR scanning and optimised field investigations in the Kutina area, Croatia. Geol. Croat. 2022, 75, 83–99. [Google Scholar] [CrossRef]
  23. Herrera, G.; Mateos, R.M.; García-Davalillo, C.J.; Grandjean, G.; Poyiadji, E.; Maftei, R.; Filipciuc, T.C.; Jemec Auflič, M.; Jež, J.; Podolszki, L.; et al. Landslide databases in the Geological Surveys of Europe. Landslides 2018, 15, 359–379. [Google Scholar] [CrossRef]
  24. Bostjančić, I.; Filipović, M.; Gulam, V.; Pollak, D. Regional-Scale Landslide Susceptibility Mapping Using Limited LiDAR-Based Landslide Inventories for Sisak-Moslavina County, Croatia. Sustainability 2021, 13, 4543. [Google Scholar] [CrossRef]
  25. Frangen, T.; Pavić, M.; Gulam, V.; Kurečić, T. Use of a LiDAR-derived landslide inventory map in assessing Influencing factors for landslide susceptibility of geological units in the Petrinja area (Croatia). Geol. Croat. 2022, 75, 35–49. [Google Scholar] [CrossRef]
  26. Podolszki, L.; Miklin, L.; Kosović, I.; Gulam, V. Multi-Level Data Analyses in the Gajevo Landslide Research, Croatia. Remote Sens. 2023, 15, 200. [Google Scholar] [CrossRef]
  27. Van Westen, C.J.; Castellanos, E.; Kuriakose, S.L. Spatial data for landslide susceptibility, hazard, and vulnerability assessment: An overview. Eng. Geol. 2008, 102, 112–131. [Google Scholar] [CrossRef]
  28. Miyagi, T.; Prasad, B.G.; Tanavud, C.; Potichan, A.; Hamasaki, E. Landslide Risk Evaluation and Mapping—Manual of Aerial Photo Interpretation for Landslide Topography and Risk Management. Report of the National Research Institute for Earth Science and Disaster Prevention, Japan. 2004, No. 66, pp. 75–137. Available online: https://www.researchgate.net/profile/Eisaku-Hamasaki-2/publication/242516740_Landslide_Risk_Evaluation_and_Mapping_-_Manual_of_Aerial_Photo_Interpretation_for_Landslide_Topography_and_Risk_Management/links/5961f922a6fdccc9b132c467/Landslide-Risk-Evaluation-and-Mapping-Manual-of-Aerial-Photo-Interpretation-for-Landslide-Topography-and-Risk-Management.pdf (accessed on 5 July 2023).
  29. Paine, D.P.; Kiser, J.D. Aerial Photogrametry and Image Interpretation; John Wiley & Sons, Inc.: Hoboken, NJ, USA, 2012; pp. 1–629. [Google Scholar]
  30. Jaboyedoff, M.; Oppikofer, T.; Abellán, A.; Derron, M.H.; Loye, A.; Metzger, R.; Pedrazzini, A. Use of LIDAR in landslide investigations: A review. Nat. Hazards 2012, 61, 5–28. [Google Scholar] [CrossRef]
  31. Slaughter, S.L.; Burns, W.J.; Mickelson, K.A.; Jacobacci, K.E.; Biel, A.; Contreras, T.A. Protocol for Landslide Inventory Mapping from LIDAR Data in Washington State; Washington Geological Survey, USGS: Washington, DC, USA, 2017; pp. 1–26. [Google Scholar]
  32. Podolszki, L.; Kurečić, T.; Bateson, L.; Svennevig, K. Remote Landslide Mapping, Field Validation and Model Development—An Example from Kravarsko, Croatia. Geol. Croat. 2022, 75, 67–82. [Google Scholar] [CrossRef]
  33. Van Westen, C.J.; Van Asch, T.W.; Soeters, R. Landslide hazard and risk zonation-why is it so difficult? Bull. Eng. Geol. Environ. 2006, 65, 167–184. [Google Scholar] [CrossRef]
  34. Mersha, T.; Meten, M. GIS-based landslide susceptibility mapping and assessment using bivariate statistical methods in Simada area, northwestern Ethiopia. Geoenviron. Disasters 2020, 7, 20. [Google Scholar] [CrossRef]
  35. Pourghasemi, H.R.; Teimoori Yansari, Z.; Panagos, P.; Pradhan, B. Analysis and evaluation of landslide susceptibility: A review on articles published during 2005–2016 (periods of 2005–2012 and 2013–2016). Arab. J. Geosci. 2018, 11, 193. [Google Scholar] [CrossRef]
  36. Kalantar, B.; Ueda, N.; Saeidi, V.; Ahmadi, K.; Halin, A.A.; Shabani, F. Landslide Susceptibility Mapping: Machine and Ensemble Learning Based on Remote Sensing Big Data. Remote Sens. 2020, 12, 1737. [Google Scholar] [CrossRef]
  37. Lv, L.; Chen, T.; Dou, J.; Plaza, A. A hybrid ensemble-based deep-learning framework for landslide susceptibility mapping. Int. J. Appl. Earth Obs. Geoinf. 2022, 108, 102713. [Google Scholar] [CrossRef]
  38. Hakim, W.L.; Rezaie, F.; Nur, A.S.; Panahi, M.; Khosravi, K.; Lee, C.-W.; Lee, S. Convolutional neural network (CNN) with metaheuristic optimization algorithms for landslide susceptibility mapping in Icheon, South Korea. J. Environ. Manag. 2022, 305, 114367. [Google Scholar] [CrossRef]
  39. Sun, D.; Chen, D.; Zhang, J.; Mi, C.; Gu, Q.; Wen, H. Landslide Susceptibility Mapping Based on Interpretable Machine Learning from the Perspective of Geomorphological Differentiation. Land 2023, 12, 1018. [Google Scholar] [CrossRef]
  40. Zagrebačka Županija. Proglašena Elementarna Nepogoda Za Općinu Kravarsko [Zagreb County. Declared Natural Disaster for Kravarsko Municipality—In Croatian] (19.02.2014). Available online: https://www.zagrebacka-zupanija.hr/vijesti/1763/proglasena-elementarna-nepogoda-za-opcinu-kravarsko (accessed on 7 July 2023).
  41. Miklin, L.; Podolszki, L.; Gulam, V.; Markotić, I. The Impact of Climate Changes on Slope Stability and Landslide Conditioning Factors: An Example from Kravarsko, Croatia. Remote Sens. 2022, 14, 1794. [Google Scholar] [CrossRef]
  42. Dashwood, C.; Podolszki, L.; Pedersen, S.A.S.; Gulam, V.; Kosović, I.; Novellino, A.; Bostjančić, I.; Pollak, D.; Svennevig, K.; Marchant, B.; et al. CGS GeoTwinn Project Report: Training Results Report—WP3—Deliverable 3.3; Internal Data Base of H2020-WIDESPREAD-05-2017-Twinning Project 809943: Strengthening Research in the Croatian Geological Survey; Croatian Geological Survey: Zagreb, Croatia, 2021; pp. 1–49. [Google Scholar]
  43. Pikija, M. Osnovna Geološka Karta SFRJ 1:100.000—List Sisak L33-93 [Basic Geological Map SFRY in Scale of 1:100,000—Sheet Sisak L33-93—In Croatian]; Institut za Geološka Istraživanja: Belgrade, Serbia, 1987. [Google Scholar]
  44. Čubrilović, P.; Palavestrić, L.; Nikolić, T. Inženjerskogeološka Karta Jugoslavije 1:500,000 [Engineering–geological Map of Yugoslavia in Scale of 1:500,000—In Croatian]; Institut za Geološka Istraživanja: Belgrade, Serbia, 1967. [Google Scholar]
  45. Galli, M.; Ardizzone, F.; Cardinali, M.; Guzzetti, F.; Reichenbach, P. Comparing landslide inventory maps. Geomorphology 2008, 94, 268–289. [Google Scholar] [CrossRef]
  46. Zhengjing, M.; Gang, M. Deep learning for geological hazards analysis: Data, models, applications, and opportunities. Earth-Sci. Rev. 2021, 223, 103858. [Google Scholar] [CrossRef]
  47. Tokarev, M.J.; Roslyakov, A.G.; Terehina, Y.E. Geophysical Approach to the Geohazard Classification in Marine Engineering and Geological Surveys; European Association of Geoscientists & Engineers Marine Technologies: Gelendzhik, Russia, 2019; pp. 1–8. [Google Scholar] [CrossRef]
  48. Culshaw, M.G. Geohazards. In Encyclopedia of Engineering Geology; Bobrowsky, P., Marker, B., Eds.; Springer: Cham, Switzerland, 2018. [Google Scholar] [CrossRef]
  49. Hungr, O.; Leroueil, S.; Picarelli, L. The Varnes classification of landslide types, an update. Landslides 2014, 11, 167–194. [Google Scholar] [CrossRef]
  50. Mihalić Arbanas, S.; Krkač, M.; Bernat, S. Application of innovative technologies in landslide research in the area of the City of Zagreb (Croatia, Europe). Geol. Croat. 2016, 69, 231–243. [Google Scholar] [CrossRef]
  51. Jagodnik, P.; Jagodnik, V.; Arbanas, Ž.; Mihalić Arbanas, S. Landslide types in the Slani Potok gully, Croatia. Geol. Croat. 2020, 73, 13–28. [Google Scholar] [CrossRef]
  52. McCalpin, J. Preliminary age classification of landslides for inventory mapping. In Proceedings of the 21st Annual Symposium on Engineering Geology and Soil Engineering Symposium; University Press: Moscow, Russia, 1984; pp. 99–111. [Google Scholar]
  53. Podolszki, L.; Pollak, D.; Gulam, V.; Miklin, Ž. Development of Landslide Susceptibility Map of Croatia. In Engineering Geology for Society and Territory—Volume 2: Landslide Processes; Lollino, G., Giordan, D., Crosta, G.B., Corominas, J., Azzam, R., Wasowski, J., Sciarra, N., Eds.; Springer: Berlin/Heidelberg, Germany, 2015; Volume 2, pp. 947–950. [Google Scholar] [CrossRef]
  54. Pollak, D.; Bostjančić, I.; Gulam, V. CGS SafEarth Project Report: Landslide Susceptibility Map in Scale of 1:100,000—Zagreb County (Project ID: HR-BA-ME59, WP Implementation Deliverable: T1.3.2a, LSM in Small Scale (HGI), Annex 3 LSM in Small Scale for Zagreb County); Internal Data Base of Interreg—IPA CBC Croatia—Bosnia and Herzegovina—Montenegro; Croatian Geological Survey: Zagreb, Croatia, 2018; pp. 1–2, 1 map. [Google Scholar]
  55. Çellek, S. Effect of the Slope Angle and Its Classification on Landslide. Nat. Hazards Earth Syst. Sci. Discuss. 2020. [Google Scholar] [CrossRef]
  56. Günther, A.; Reichenbach, P.; Malet, J.P.; Van Den Eeckhaut, M.; Hervás, J.; Dashwood, C.; Guzzetti, F. Tier-based approaches for landslide susceptibility assessment in Europe. Landslides 2013, 10, 529–546. [Google Scholar] [CrossRef]
  57. Kincal, C.; Kayhan, H. A Combined Method for Preparation of Landslide Susceptibility Map in Izmir (Türkiye). Appl. Sci. 2022, 12, 9029. [Google Scholar] [CrossRef]
  58. Leoni, G.; Campolo, D.; Falconi, L.; Gioè, C.; Lumaca, S.; Puglisi, C.; Torre, A. Heuristic method for landslide susceptibility assessment in the Messina municipality. In Engineering Geology for Society and Territory—Volume 2: Landslide Processes; Lollino, G., Giordan, D., Crosta, G.B., Corominas, J., Azzam, R., Wasowski, J., Sciarra, N., Eds.; Springer: Berlin/Heidelberg, Germany, 2015; Volume 2, pp. 501–504. [Google Scholar] [CrossRef]
  59. Sinčić, M.; Bernat Gazibara, S.; Krkač, M.; Lukačić, H.; Mihalić Arbanas, S. The Use of High-Resolution Remote Sensing Data in Preparation of Input Data for Large-Scale Landslide Hazard Assessments. Land 2022, 11, 1360. [Google Scholar] [CrossRef]
  60. Pacheco Quevedo, R.; Velastegui-Montoya, A.; Montalván-Burbano, N.; Morante-Carballo, F.; Korup, O.; Daleles Rennó, C. Land use and land cover as a conditioning factor in landslide susceptibility: A literature review. Landslides 2023, 20, 967–982. [Google Scholar] [CrossRef]
  61. Rohan, T.; Shelef, E.; Mirus, B. Prolonged influence of urbanization on landslide susceptibility. Landslides 2023, 20, 1433–1447. [Google Scholar] [CrossRef]
  62. Sinčić, M.; Bernat Gazibara, S.; Krkač, M.; Mihalić Arbanas, S. Landslide susceptibility assessment of the City of Karlovac using the bivariate statistical analysis. Rud. Geološko Naft. Zb. 2022, 37, 149–170. [Google Scholar] [CrossRef]
  63. Ahmed, M.F.; Rogers, J.D.; ISMAIL, E.H. A regional level preliminary landslide susceptibility study of the upper Indus river basin. Eur. J. Remote Sens. 2014, 47, 343–373. [Google Scholar] [CrossRef]
  64. Peshevski, I.; Jovanovski, M.; Abolmasov, B.; Papić, J.; Đurić, U.; Majranović, M.; Haque, U.; Nedelkovska, N. Preliminary regional landslide susceptibility assessment using limited data. Geol. Croat. 2019, 72, 81–92. [Google Scholar] [CrossRef]
  65. Ruff, M.; Czurda, K. Landslide susceptibility analysis with a heuristic approach in the Eastern Alps (Vorarlberg, Austria). Geomorphology 2008, 94, 314–324. [Google Scholar] [CrossRef]
  66. Shano, L.; Raghuvanshi, T.K.; Meten, M. Landslide susceptibility evaluation and hazard zonation techniques—A review. Geoenviron. Disasters 2020, 7, 18. [Google Scholar] [CrossRef]
  67. Stanley, T.; Kirschbaum, D.B. A heuristic approach to global landslide susceptibility mapping. Nat. Hazards 2017, 87, 145–164. [Google Scholar] [CrossRef]
  68. Bukhari, M.H.; Da Silva, P.F.; Pilz, J.; Istanbulluoglu, E.; Görüm, T.; Lee, J.; Karamehic-Muratovic, A.; Urmi, T.; Soltani, A.; Wilopo, W.; et al. Community perceptions of landslide risk and susceptibility: A multi-country study. Landslides 2023, 20, 1321–1334. [Google Scholar] [CrossRef]
  69. Haque, U.; Blum, P.; Da Silva, P.F.; Andersen, P.; Pilz, J.; Chalov, S.R.; Malet, J.-P.; Jemec Auflič, M.; Andres, N.; Poyiadji, E.; et al. Fatal landslides in Europe. Landslides 2016, 13, 1545–1554. [Google Scholar] [CrossRef]
  70. He, Y.; Ding, M.; Liu, K.; Lei, M. The Impact of Geohazards on Sustainable Development of Rural Mountain Areas in the Upper Reaches of the Min River. Front. Earth Sci. 2022, 10, 862544. [Google Scholar] [CrossRef]
  71. Van Den Eeckhaut, M.; Hervás, J.; Jaedicke, C.; Malet, J.-P.; Montanarella, L.; Nadim, F. Statistical modelling of Europe-wide landslide susceptibility using limited landslide inventory data. Landslides 2012, 9, 357–369. [Google Scholar] [CrossRef]
  72. Varnes, D.J. Landslide Hazard Zonation: A Review of Principles and Practice; International Association of Engineering Geology: Paris, France, 1984; pp. 1–63. [Google Scholar]
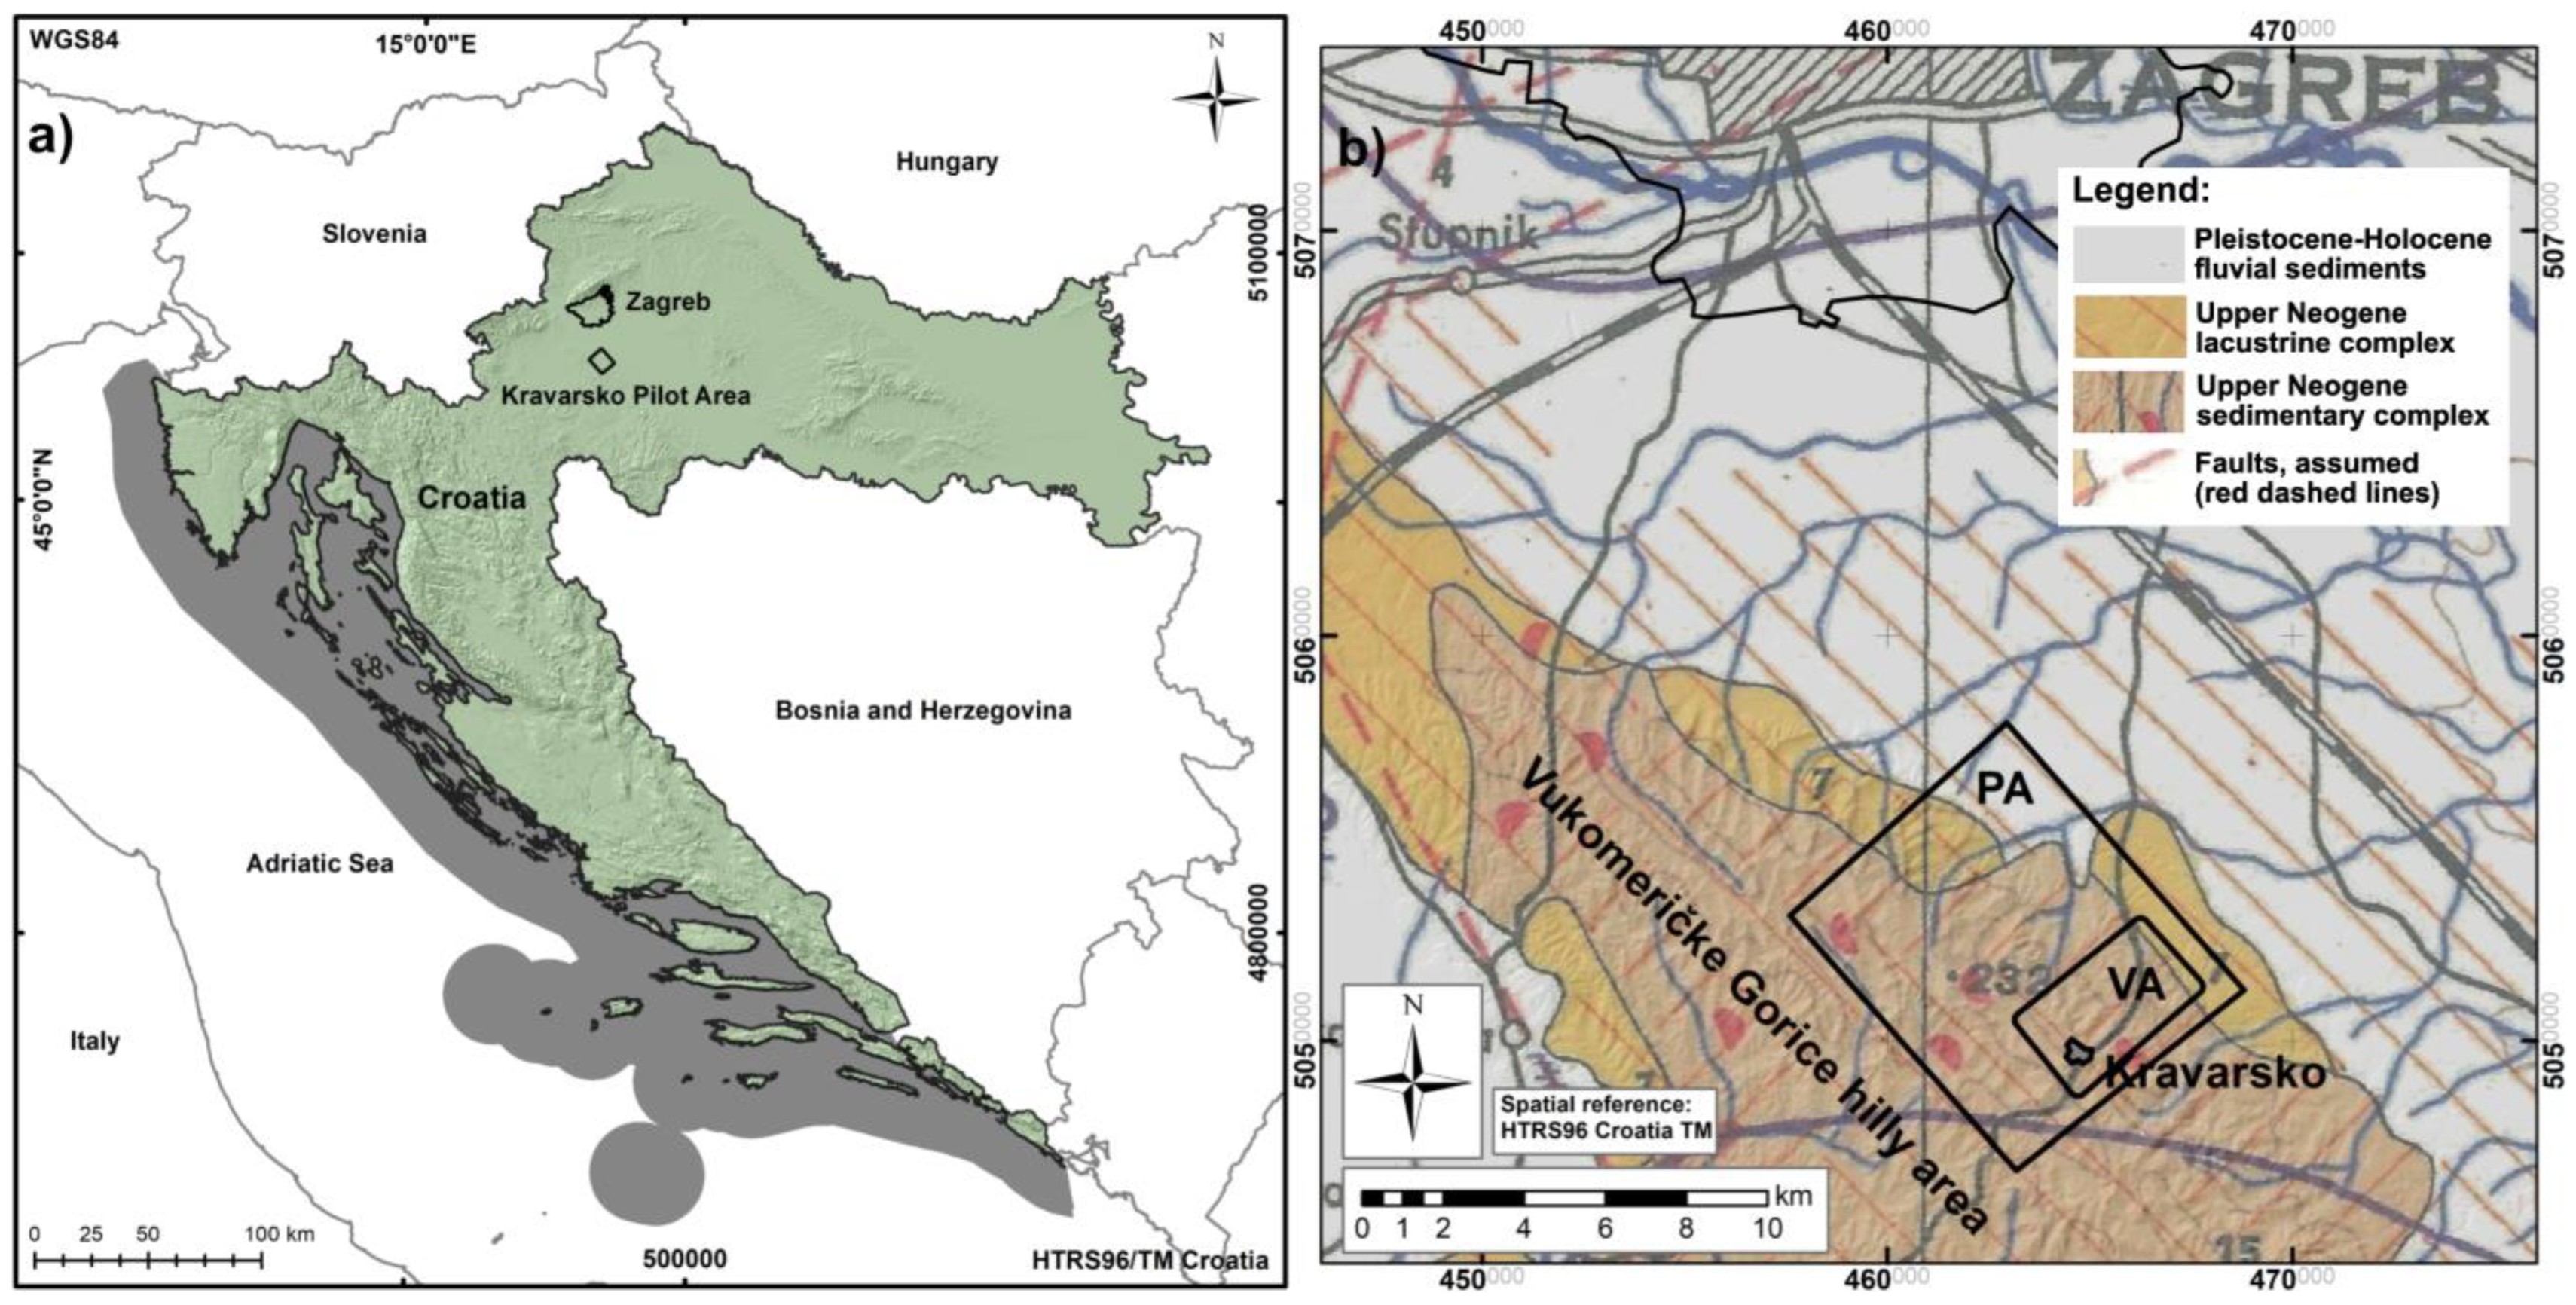
Figure 1. Kravarsko pilot area location: (a) in northern Croatia, south of Zagreb city; (b) in the Vukomeričke Gorice hilly area, which is prone to landslides. In addition to the pilot area (PA ≈ 61.7 km2), the field validation area (VA ≈ 10.3 km2) and the Kravarsko settlement area are marked. As a base map, a detail from the engineering geological map of Yugoslavia at the (original) scale of 1:500,000 is used, and even in this map (scale), landslides are identified in the (wider) area (red polygons). On the map, three units are present in the PA: (i) the Upper Neogene sedimentary complex—sandstones, marly clays, marls, and sands prone to erosion and sliding (brown on map); (ii) the Upper Neogene lacustrine complex—sands, gravels, and clays prone to erosion and sliding (yellow on map); and (iii) Pleistocene–Holocene fluvial sediments—sandy gravels that are sporadically clayey, mostly covered with loam, and porous (white on map). Assumed faults (wider area) are marked with red dashed lines [44].
Remotesensing 15 05519 g001
Figure 2. Kravarsko pilot area field examples: (a) landslide head scarp; (b) landslide flank; (c) landslide damaging houses and road; (d) cultivated orchard in an old landslide body; (e) road damaged by landslide; (f) road mitigation measures; (g) Vrbova fm. clays; (h) Vrbova fm. sands.
Remotesensing 15 05519 g002
Figure 3. Kravarsko pilot area landslide inventory map with landslide classifications based on geomorphological indicators. In addition to the pilot area (PA ≈ 61.7 km2), a field validation area (VA ≈ 10.3 km2) and the Kravarsko settlement area are marked with, the high-resolution hillshade digital terrain model (hrDTMh) used as the base layer.
Remotesensing 15 05519 g003
Figure 4. Kravarsko pilot area slope gradient data: slope angle map with nine classes overlaid with landslide inventory data (developed within the ArcGIS environment).
Remotesensing 15 05519 g004
Figure 5. Kravarsko pilot area engineering geological unit map with three classes overlaid with landslide inventory data (developed within the ArcGIS environment).
Remotesensing 15 05519 g005
Figure 6. Kravarsko pilot area land-cover data map with four classes overlaid with landslide inventory data (developed within the ArcGIS environment). The land-cover map was developed based on a detailed orthophoto with a 10 × 10 cm pixel size.
Remotesensing 15 05519 g006
Figure 7. Kravarsko pilot area landslide susceptibility map with five classes overlaid with landslide inventory data (developed within the ArcGIS environment).
Remotesensing 15 05519 g007
Figure 8. Kravarsko Pilot Area Terrain Stability Zone Map with key infrastructure and three classes of terrain stability overlaid with the landslide inventory data (developed within the ArcGIS environment).
Remotesensing 15 05519 g008
Table 1. Weights of criteria and classes used for the analysis: layer-specific and overall.
Landslide Susceptibility Map LayerClassesWeight of Criteria (Layer)Weight of Criteria (Overall)
Slope angle (°)010.5
1–53
6–156
16–259
26–3512
36–4515
46–6017
61–7518
76–9019
Engineering geological unitsAlluvial sediments50.4
Loess20
Vrbova fm.75
Land coverWater00.1
Forest25
Urban35
Fields40
Table 2. Landslide susceptibility map classes, percentages, and zones.
Resulting LSM ClassPercentage (%)Area (km2)Resulting LSM Zone
00.10.1Water
131.419.1Low
235.922.2Medium
327.216.7High
45.43.7Very high
Table 3. Anthropogenic structures: settlements (sett.), roads, water systems (w.s.), power lines (p.l.), and zones of terrain stability (stable, possibly unstable, and unstable zones).
Anthropogenic
Structures
Kravarsko PA
(≈61.7 km2)
Stable Zone
(~7.3 km2 of PA)
Possibly Unstable Zone
(~23.0 km2 of PA)
Unstable Zone
(~31.4 km2 of PA)
Settlements (km2)5.69 (~9% of PA)0.29 (~5% of sett.)2.13 (~37% of sett.)3.27 (~58% of sett.)
Roads (km’)85.42 (100%)4.10 (~5% of roads)24.24 (~28% of roads)57.08 (~67% of roads)
Water systems (km’)34.65 (100%)2.38 (~7% of w.s.)12.91 (~37% of w.s.)19.36 (~56% of w.s.)
Power lines (km’)21.72 (100%)7.12 (~33% of p.l.)5.55 (~25% of p.l.)9.05 (~42% of p.l.)
Disclaimer/Publisher’s Note: The statements, opinions and data contained in all publications are solely those of the individual author(s) and contributor(s) and not of MDPI and/or the editor(s). MDPI and/or the editor(s) disclaim responsibility for any injury to people or property resulting from any ideas, methods, instructions or products referred to in the content.