
Review of the Monothematic Series of Publications Concerning Research on Statistical Distributions of Navigation Positioning System Errors


Abstract
:1. Introduction
- Adopting a priori the normal distribution as the statistical model of 1D errors;
- The validity of the application of the 2DRMS measure to determine the navigation positioning system accuracy (2D);
- The occurrence, in the process of the position coordinate determination, of the PRW phenomenon resulting in the need to determine the length (number of measurements) of the representative sample;
- The determination of the representative sample length and its relationship with the positioning system type and its accuracy.
- The development of a method enabling the determination of the navigation positioning system representative sample length from the perspective of assessing its accuracy [20];
- The determination of consistency between empirical position errors for selected systems (GPS, DGPS, and EGNOS) and typical statistical distributions based on long-term measurement campaigns (1–2 million fixes) [17];
- The development of the author’s original method (reliability modelling of stationary processes with renewal) enabling the calculation of a navigation system position error value based on the empirical data [21];
- The determination of differences between the position accuracy measures calculated using the 2DRMS and R95 for the GPS [22];
- The performance of statistical analyses to determine the relation between the 2D position error and the Horizontal Dilution Of Precision (HDOP) values for the GPS.
- Statistical testing of empirical data—employed to determine the statistical distributions with the best fit to the empirical data (navigation positioning systems’ 1D and 2D position errors) [17,21,22,23]. Moreover, the method was used to calculate selected measures of position error statistical distributions [17,21,22] and the HDOP [23];
- Mathematical modelling—enabled the determination of numerical measures describing the process of a position’s “wandering” occurring in navigation systems [20], the calculation of the length of the positioning system representative sample [20], the development of the author’s original method enabling the determination of the navigation system’s position error value with a probability of 0.95 [21], and the determination of differences between the accuracy measures (2DRMS and R95) for positioning systems [21,22];
- Experimental research—enabled the determination of position error statistics. The publication series used the results of seven long-term measurement campaigns: Decca Navigator 1993 [20], DGPS 2006 [17] and 2014 [20,21], EGNOS 2006 [17] and 2014 [20,21], as well as GPS 2013 [20,21] and 2021 [22,23]. It should be noted that the author personally participated in the surveys conducted in the years 2013, 2014, and 2021, while the results of archive measurements conducted in 1993 and 2006 are taken from research projects implemented at the Institute of Navigation and Marine Hydrography of the Polish Naval Academy in Gdynia under the supervision of Professor Zdzisław Kopacz. The results of these surveys were used with the permission of Professor Kopacz. All measurement campaigns were carried out in stationary mode, where the position coordinates of the fixed receiver were determined with centimetre accuracy using the geodetic method. In all surveys, position data were recorded as National Marine Electronics Association (NMEA) GGA messages with a frequency of 1 Hz. The receivers were set with a min. topocentric height amounting to 10° in order to prevent the multipath effect. Before processing the measurement data, erroneously recorded NMEA GGA messages were deleted. A single 1D or 2D position error was calculated as the difference between the coordinates recorded by the fixed receiver and those measured by the geodetic method;
- Interdependence analysis and inference—one of the main research methods applied in the publication series. The need for its use resulted from the range of the research questions raised, to which no comprehensive answers have been provided by the scientific literature on the subject. It should be stressed that despite the prior (before writing the first article) planning of the subject matter of individual publications in the series, it repeatedly appeared that the results obtained were surprising and inconsistent with the initial expectations. Therefore, based on the interdependence analysis and inference, it was necessary to modify the concept of the research and the subject of the successive articles.
2. The Development of a Method Enabling the Determination of the Navigation Positioning System Representative Sample Length from the Perspective of Assessing Its Accuracy
3. The Determination of Consistency between Empirical Distributions of Position Errors for Selected Systems (DGPS, EGNOS, and GPS) and Typical Statistical Distributions
- The calculation of selected statistical distribution measures: arithmetic mean, asymmetry coefficient, kurtosis, median, range, standard deviation, and variance [27]. In addition, the 2DRMS(2D) and R95(2D) measures were determined;
- The sample size for each positioning system under study was set at 900,000 fixes. Based on the research conducted in [20], this number of measurements should be regarded as representative;
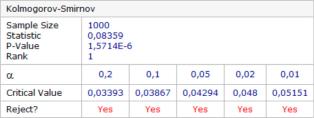
- The determination of consistency between the 1D error distributions with the normal distribution was conducted based on 1000 randomly selected surveys using the Anderson–Darling, chi-squared, and Kolmogorov–Smirnov tests;
- In order to compare the empirical distributions of 1D and 2D position errors, the most popular theoretical distributions were used, i.e., beta, Cauchy, chi-square, exponential, gamma, Laplace, logistic, lognormal, normal, Pareto, Rayleigh, Student’s, and Weibull;
- The rankings of the statistical distributions best fitted to the empirical data were established based on the Kolmogorov–Smirnov statistics (D) for a significance level (α) of 0.05.
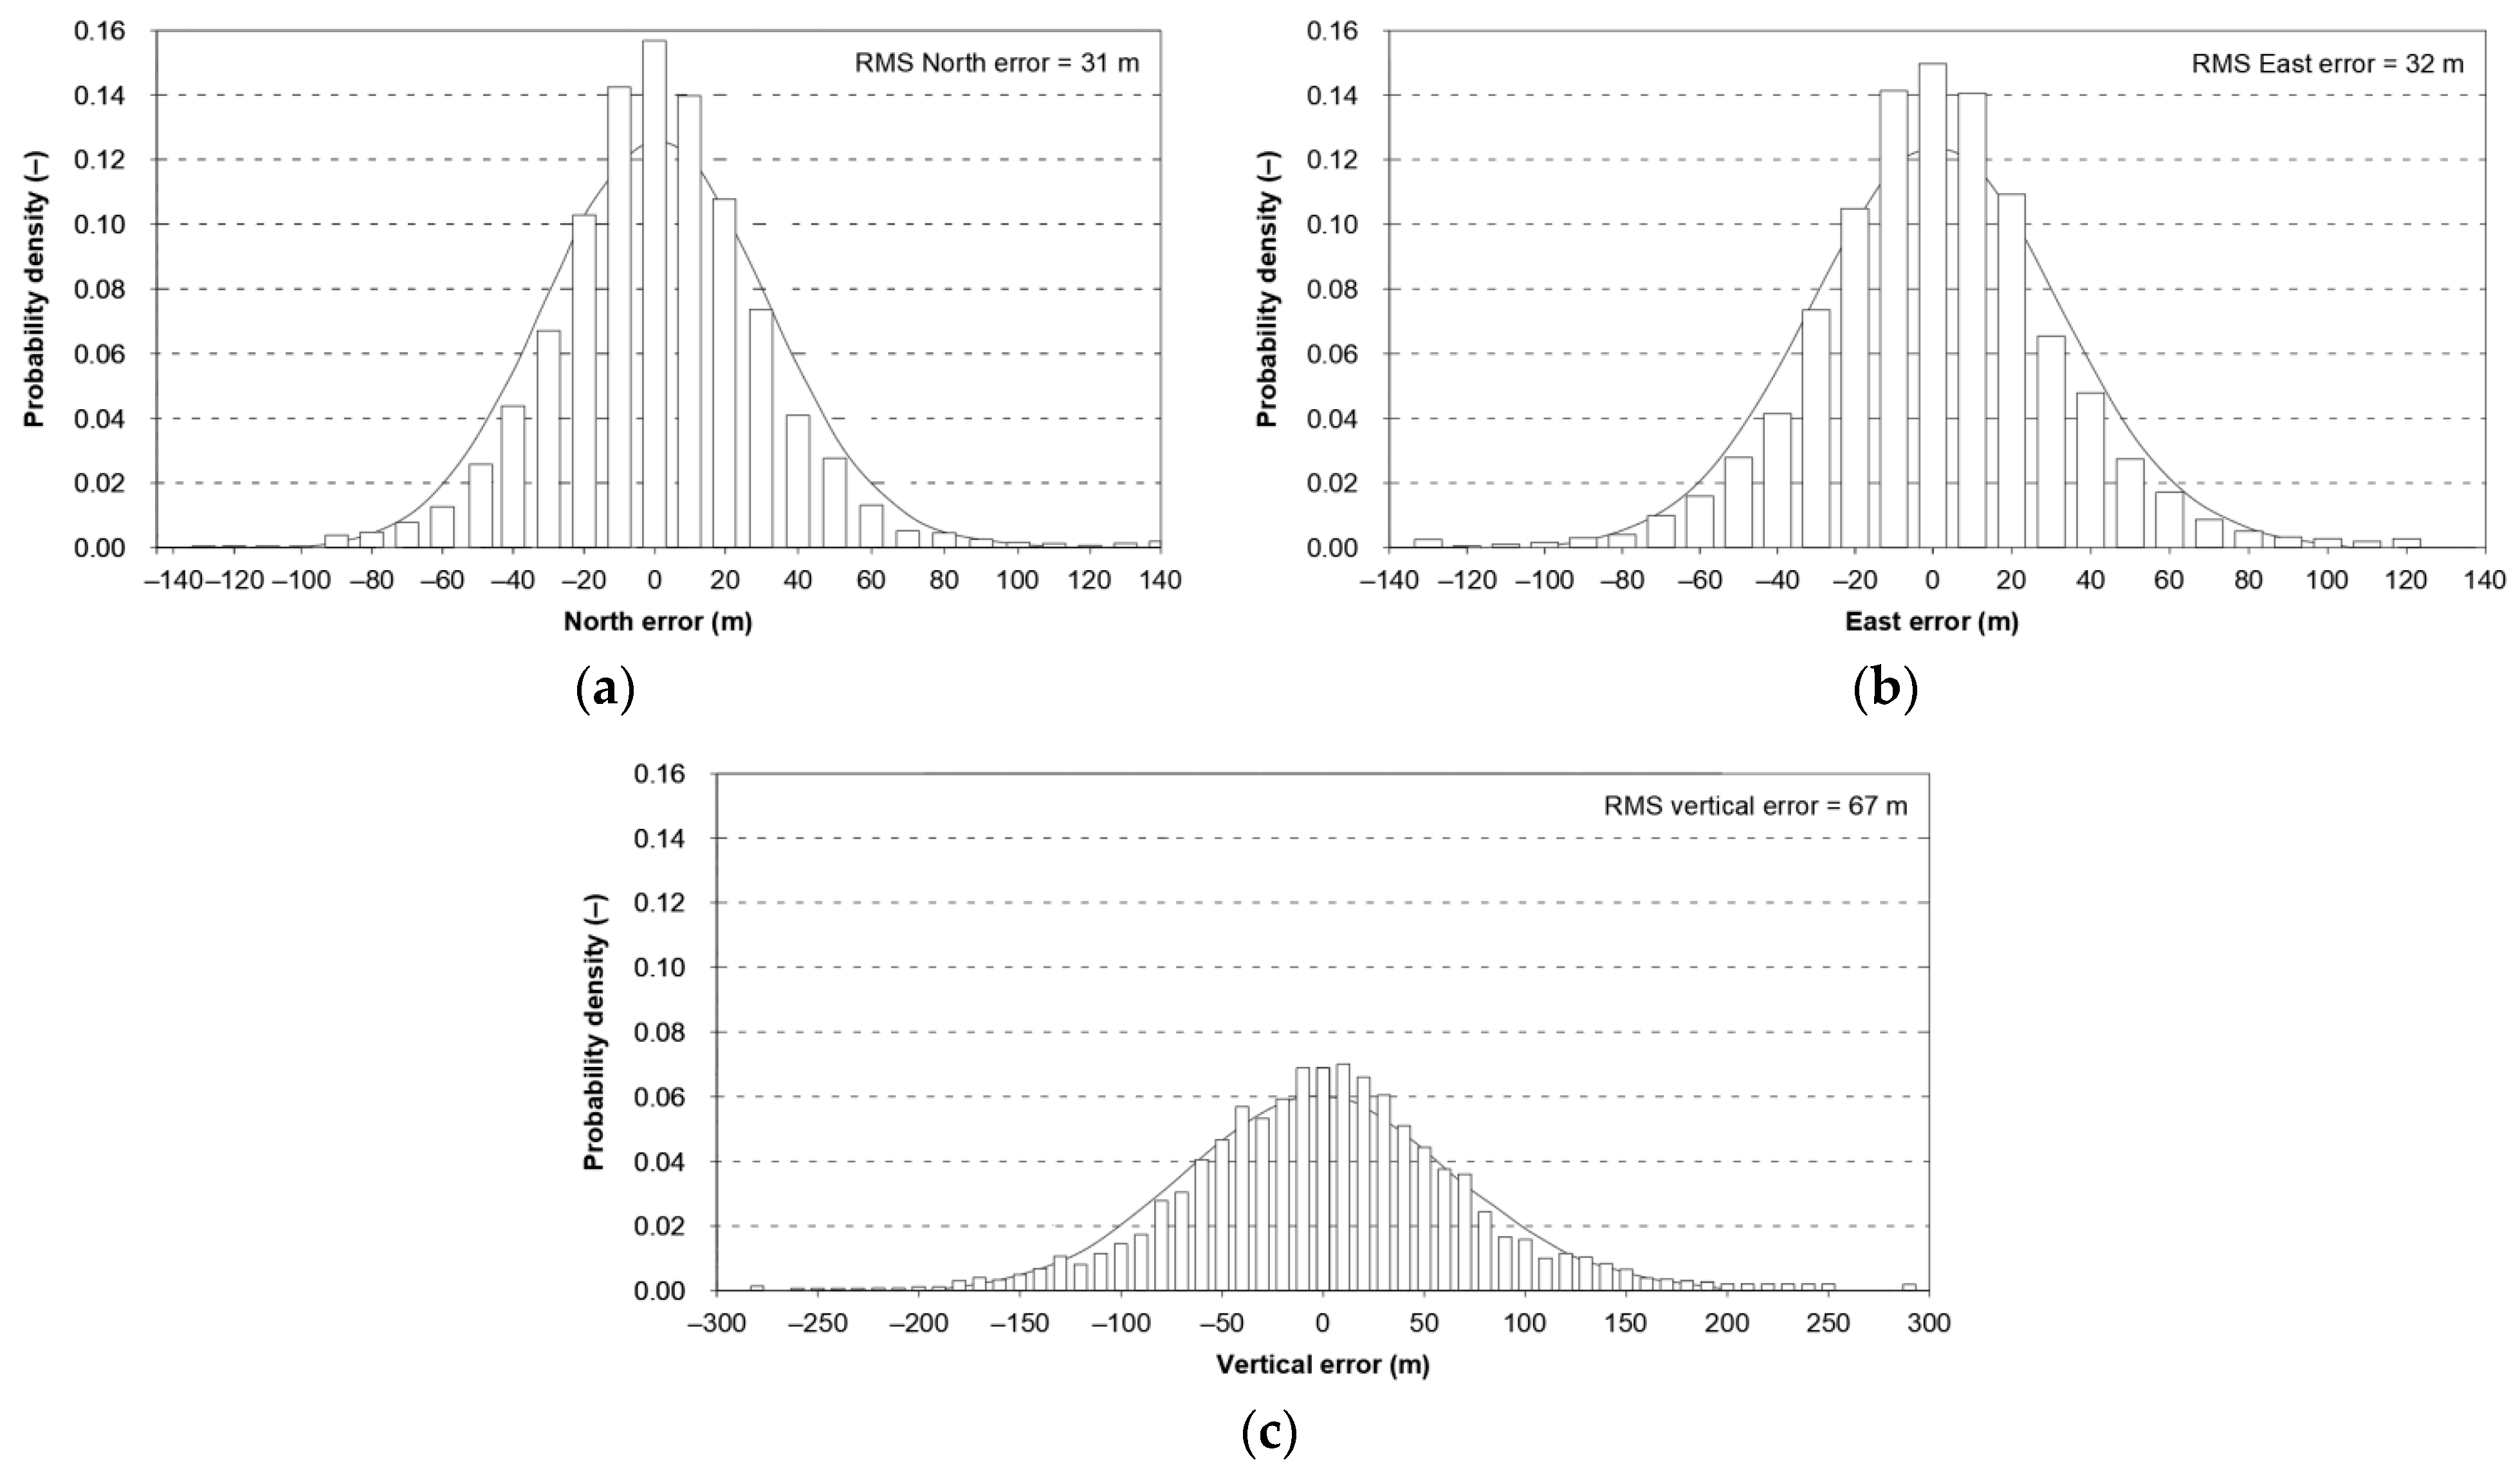
- Since the values of arithmetic means and skewness were close to zero, φ and λ error distributions can be considered symmetrical in the directions N-S and E-W;
- The latitude error standard deviation value was greater by approx. 1.5 times than that for the longitude error, despite the similar range values;
- One-dimensional error distributions were leptokurtic (Kurt > 0), which indicates that the intensity or extreme values was greater than that for the normal distribution;
- Anderson–Darling and Kolmogorov–Smirnov tests confirmed the consistency between the empirical φ error distribution and the Gaussian distribution. However, all the tests demonstrated no consistency between the empirical λ error distribution and the normal distribution;
- The logistic distribution was the best fitted statistical distribution to the empirical data for 1D errors. The figures in Table 4 show the consistency (probability difference) between the 1D error empirical distributions and the theoretical distributions for the DGPS of 2014. It can be noted that there were approx. 0.01 greater probability differences across the entire error range for the third best fitted distribution (normal) than for the best fitted distribution (logistic). Statistical distributions classified in further positions were characterised by greater probability differences between the 1D error empirical distributions and the theoretical distributions.
- The range value (5.076 m) suggests that there were no outliers during the tests. It indicates the high quality of the DGPS services;
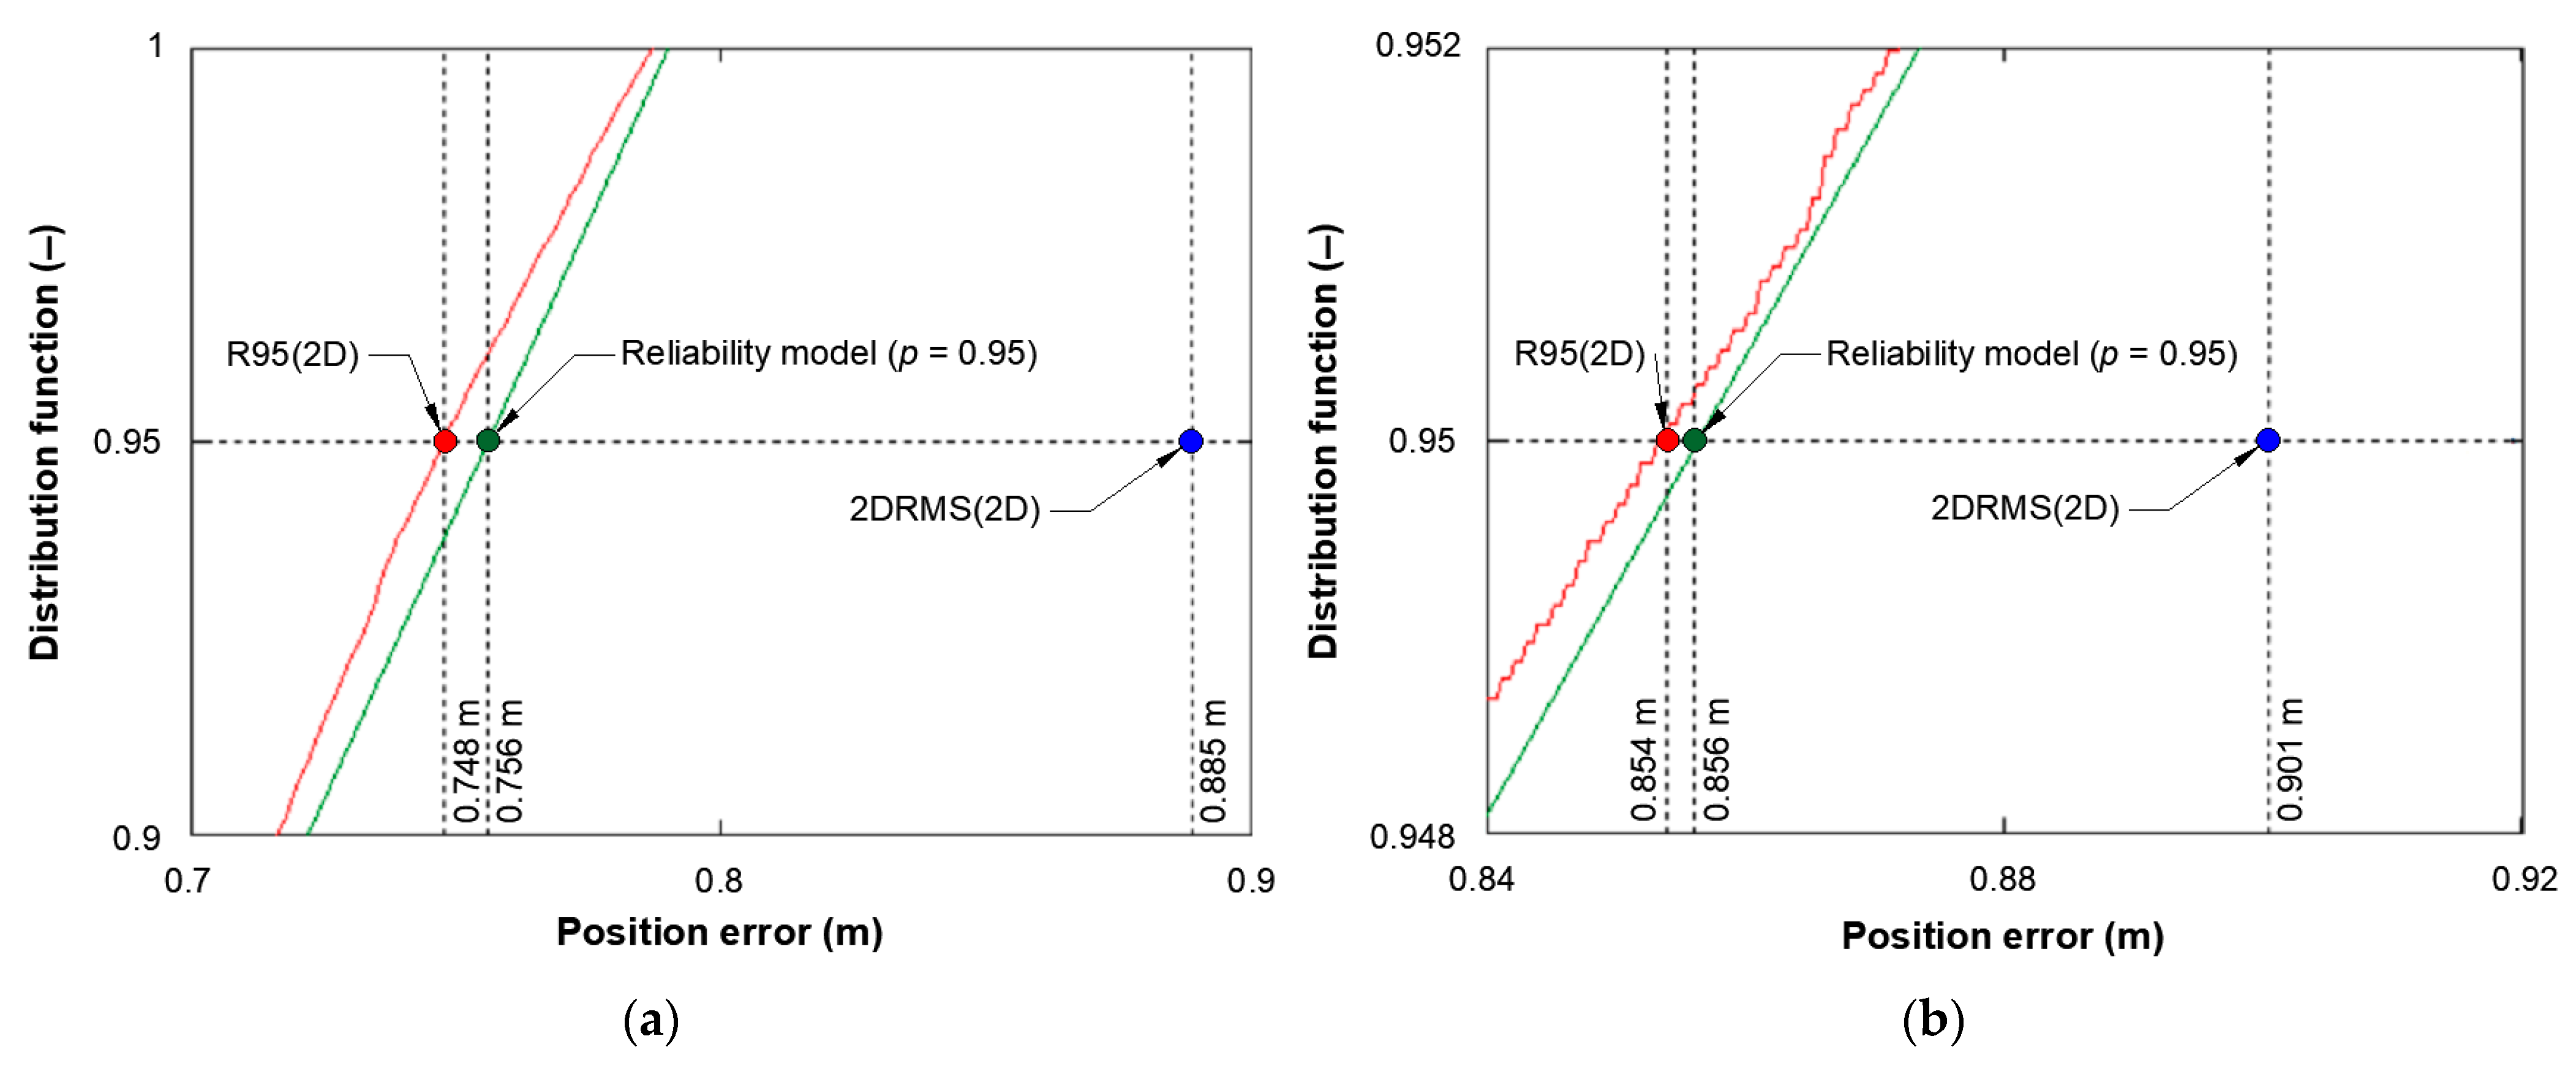
- The 2DRMS measure value (0.885 m) and the R95 measure value (0.748 m) were similar, and both amounted to less than 1 m, which indicated the high accuracy of the navigation positioning system;
- The graph of the 2D position error distribution might indicate that the empirical distribution exhibited a linear trend. But, in reality, it was not, because only 0.17% of the test sample (1496 fixes) had errors of more than 2 m;
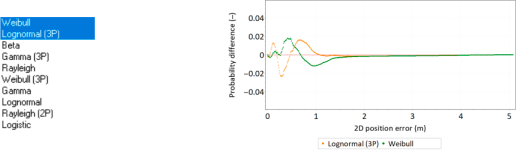
- Beta, gamma, lognormal, Rayleigh, and Weibull distributions were the best fitted statistical distributions to the empirical data for the 2D position error. Statistical distributions were classified depending on the size of the probability difference between the 2D position error empirical distribution and the theoretical distribution.
- The universal distribution of the 1D and 2D position errors. For the analyses, the results of the following campaigns were used: DGPS 2006 and 2014, as well as EGNOS 2006 and 2014;
- The best fitting distribution of the 1D errors. For the analyses, the results of the following campaigns were used: DGPS 2006 and 2014, as well as EGNOS 2014;
- The best fitting distribution of the 2D position errors. For the analyses, the results of the following campaigns were used: DGPS 2006 and 2014, as well as EGNOS 2014.
- The lognormal distribution is a universal statistical distribution, as it approximates the best of both 1D and 2D position errors;
- Distributions: beta, gamma, logistic, and Weibull showed a slightly worse fit to the empirical data than the lognormal distribution;
- The normal distribution should only be applied for the analysis of navigation positioning system errors in the 1D dimension;
- The chi-squared distribution, which is suggested, particularly for the analysis of the 2D position errors, exhibited a slight similarity to the empirical data.
4. The Development of the Author’s Original Method (Reliability Modelling of Stationary Processes with Renewal) Enabling the Calculation of a Navigation System Position Error Value Based on the Empirical Data
5. The Determination of Differences between the Position Accuracy Measures Calculated Using the 2DRMS and R95 for the GPS
- Statistical distribution measure values are similar for both GPS 1 and GPS 2 receivers;
- Differences between the arithmetic mean values for the GPS 1 and GPS 2 receivers, operating in parallel, amounted to 8 mm for φ and 22 mm for λ;
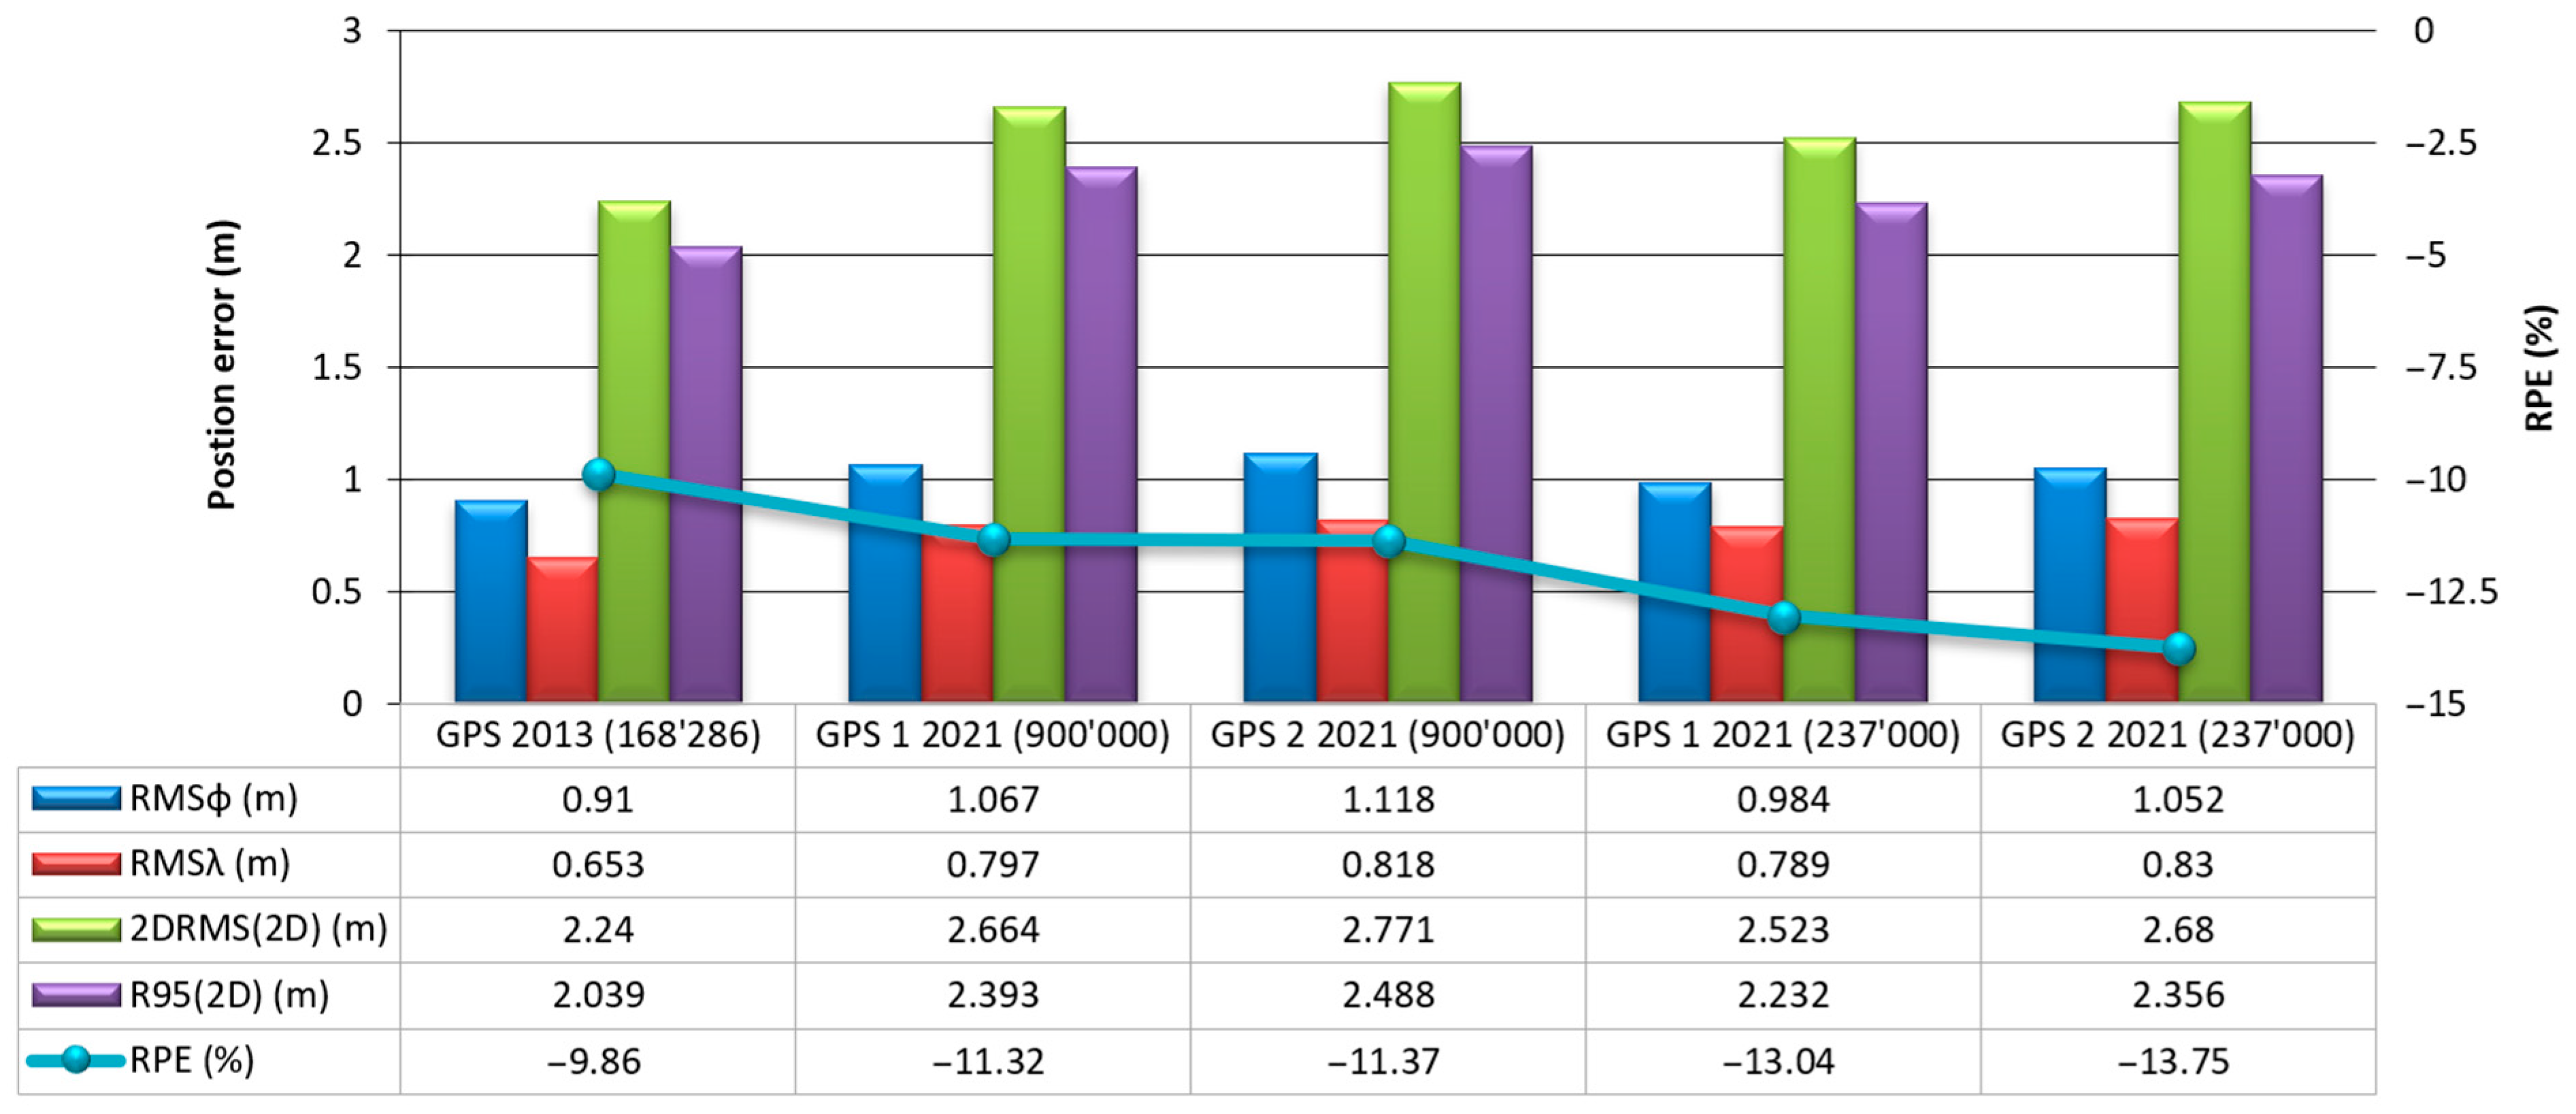
- The values of φ error standard deviations (1.067 m for GPS 1 and 1.117 m for GPS 2) were much greater than those for λ errors (0.796 m for GPS 1 and 0.818 m for GPS 2). Hence, it can be concluded that the latitude errors for the GPS were greater than the longitude errors. This thesis is also positively verified by the range value, which was considerably greater for φ error (11.495 m for GPS 1 and 11.115 m for GPS 2) than for λ error (7.668 m for GPS 1 and 7.342 m for GPS 2);
- Both coordinates showed a slight asymmetry (skewness) close to 0. For the latitude, it was negative (–0.166 for GPS 1 and –0.106 for GPS 2), while for the longitude, it was positive (0.022 for GPS 1 and 0.034 for GPS 2). The low arithmetic mean and skewness values for both receivers enabled the conclusion that the statistical distributions of 1D errors were symmetrical and exhibited consistency with the normal distribution.
- The values of the arithmetic means and standard deviations were similar to the results obtained during the main session;
- Latitude errors were greater than longitude errors, similar to the main session;
- One-dimensional error skewness values showed a slight skewness (asymmetry), which proved that the statistical distributions of these errors were symmetrical and consistent with the normal distribution.
- During the main session, the R95 measure values amounted to 2.393 m for the GPS 1 receiver and 2.488 m for the GPS 2 receiver. Therefore, they were similar to the R95 measure values obtained during the verification session (2.232 m for GPS 1 and 2.356 m for GPS 2). The difference between the R95 measure values was less than 10 cm during the main session, which proved that this session was representative. A slightly greater difference between the R95 measure values (12.4 cm) was obtained for the verification session, which may have resulted from the measurement session length;
- Statistical distributions beta, gamma, lognormal, and Weibull best approximated the 2D position errors both in the main and verification sessions;
- Based on the analysis of the Q-Q plot, it can be concluded that the beta distribution approximated the GPS position errors well in almost the entire probability range. This was due to the fact that the beta distribution described these errors well up to 3.7 m with a high probability of 0.997 (3σ) for the main session.
- Standard deviation values for φ errors were greater by 25–39% than those for λ errors. For the main session, these differences ranged from 33.88% (GPS 1 receiver) to 36.67% (GPS 2 receiver), while for the verification session, the differences concerned were slightly smaller and amounted to 24.71% (GPS 1 receiver) and to 26.75% (GPS 2 receiver). As regards the GPS measurement campaign of 2013, φ errors were greater by 39.36% than λ errors;
- The 1D error skewness value decreased with an increase in the measurement session length, which resulted in the statistical distributions of these errors becoming increasingly symmetrical;
- Latitude errors had a kurtosis greater by 2–3 times (being more concentrated in relation to the average value) than longitude errors.
6. The Performance of Statistical Analyses to Determine the Relationship between the 2D Position Error and the HDOP Values for the GPS
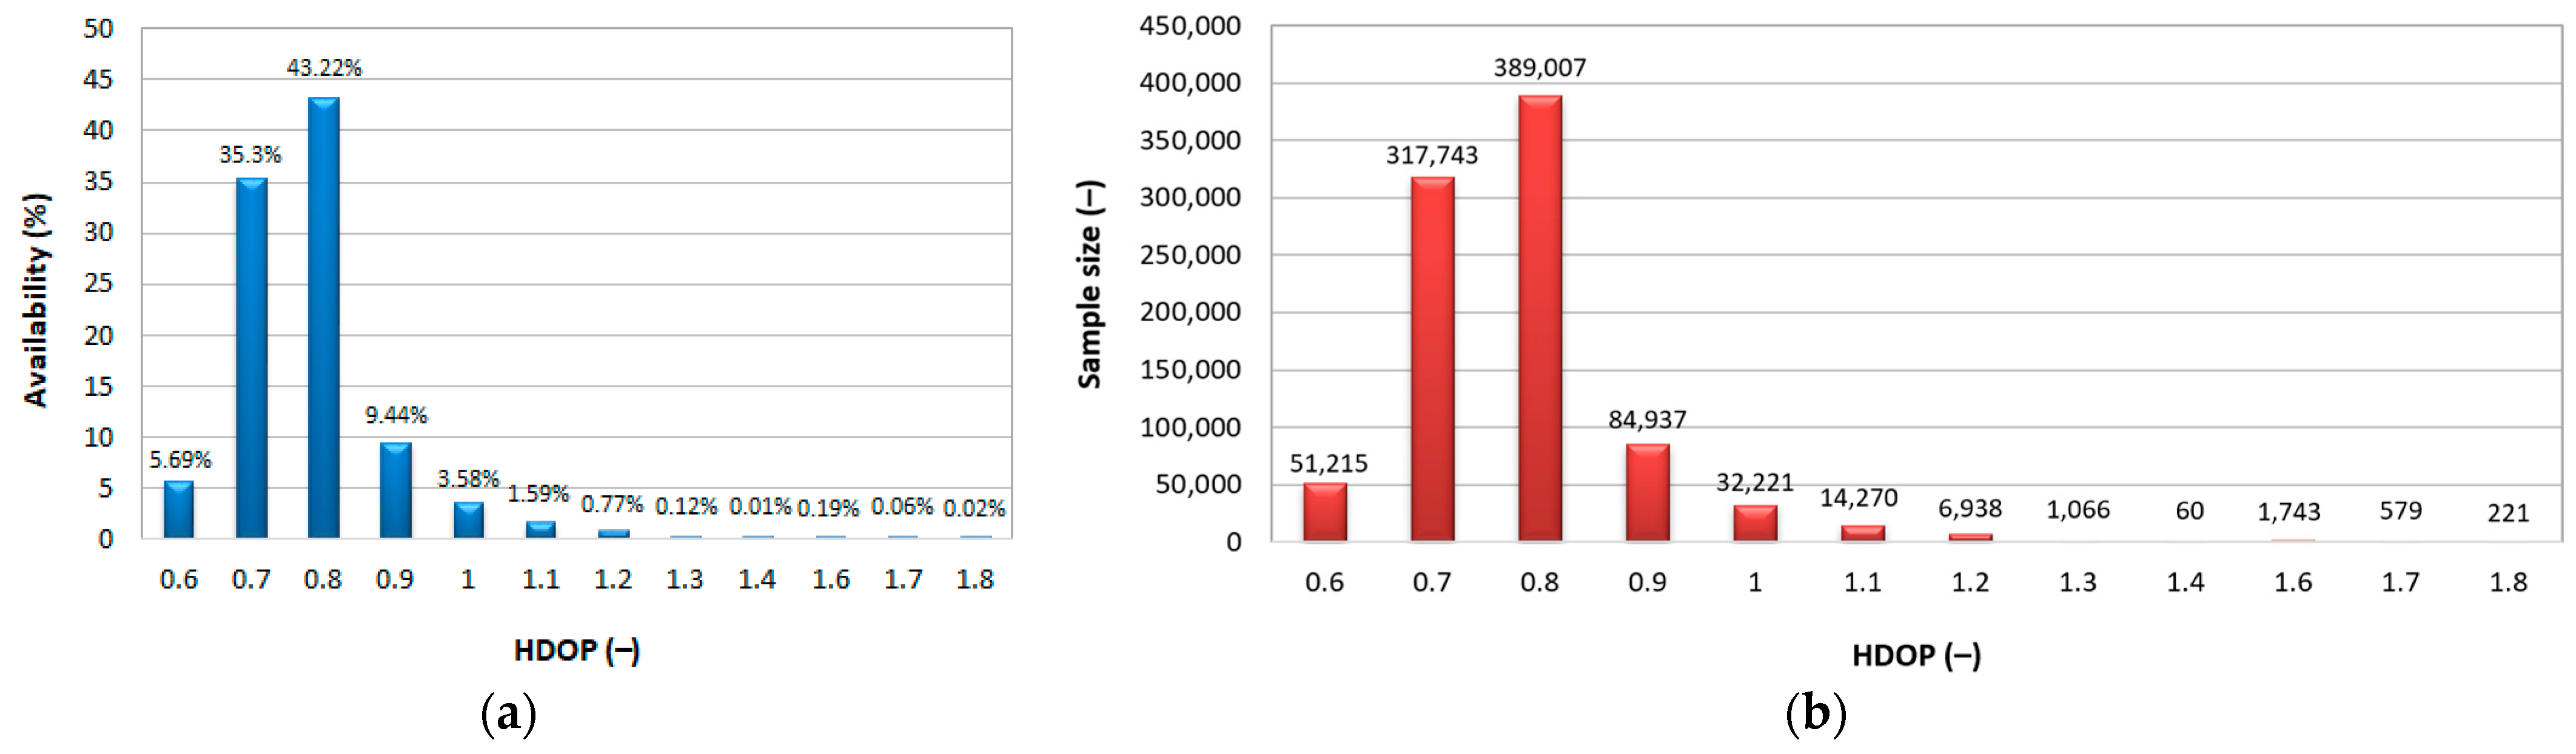
- The HDOP arithmetic average value was 0.781, with a small standard deviation of 0.113;
- The most frequently occurring HDOP values were 0.7 and 0.8;
- For more than 95% of measurements, the coefficient had a value of less than or equal to 1;
- The obtained HDOP values should be considered low, which was possible thanks to the optimal conditions for the GPS measurement performance due to the lack of field obstacles.
- The HDOP value ranged from 0.6 to 1.8 during the main session carried out under optimal conditions for the GPS measurement performance;
- HDOP values of 0.7 and 0.8 occurred 78.52% of the time;
- HDOP values of more than 1 occurred 2.77% of the time;
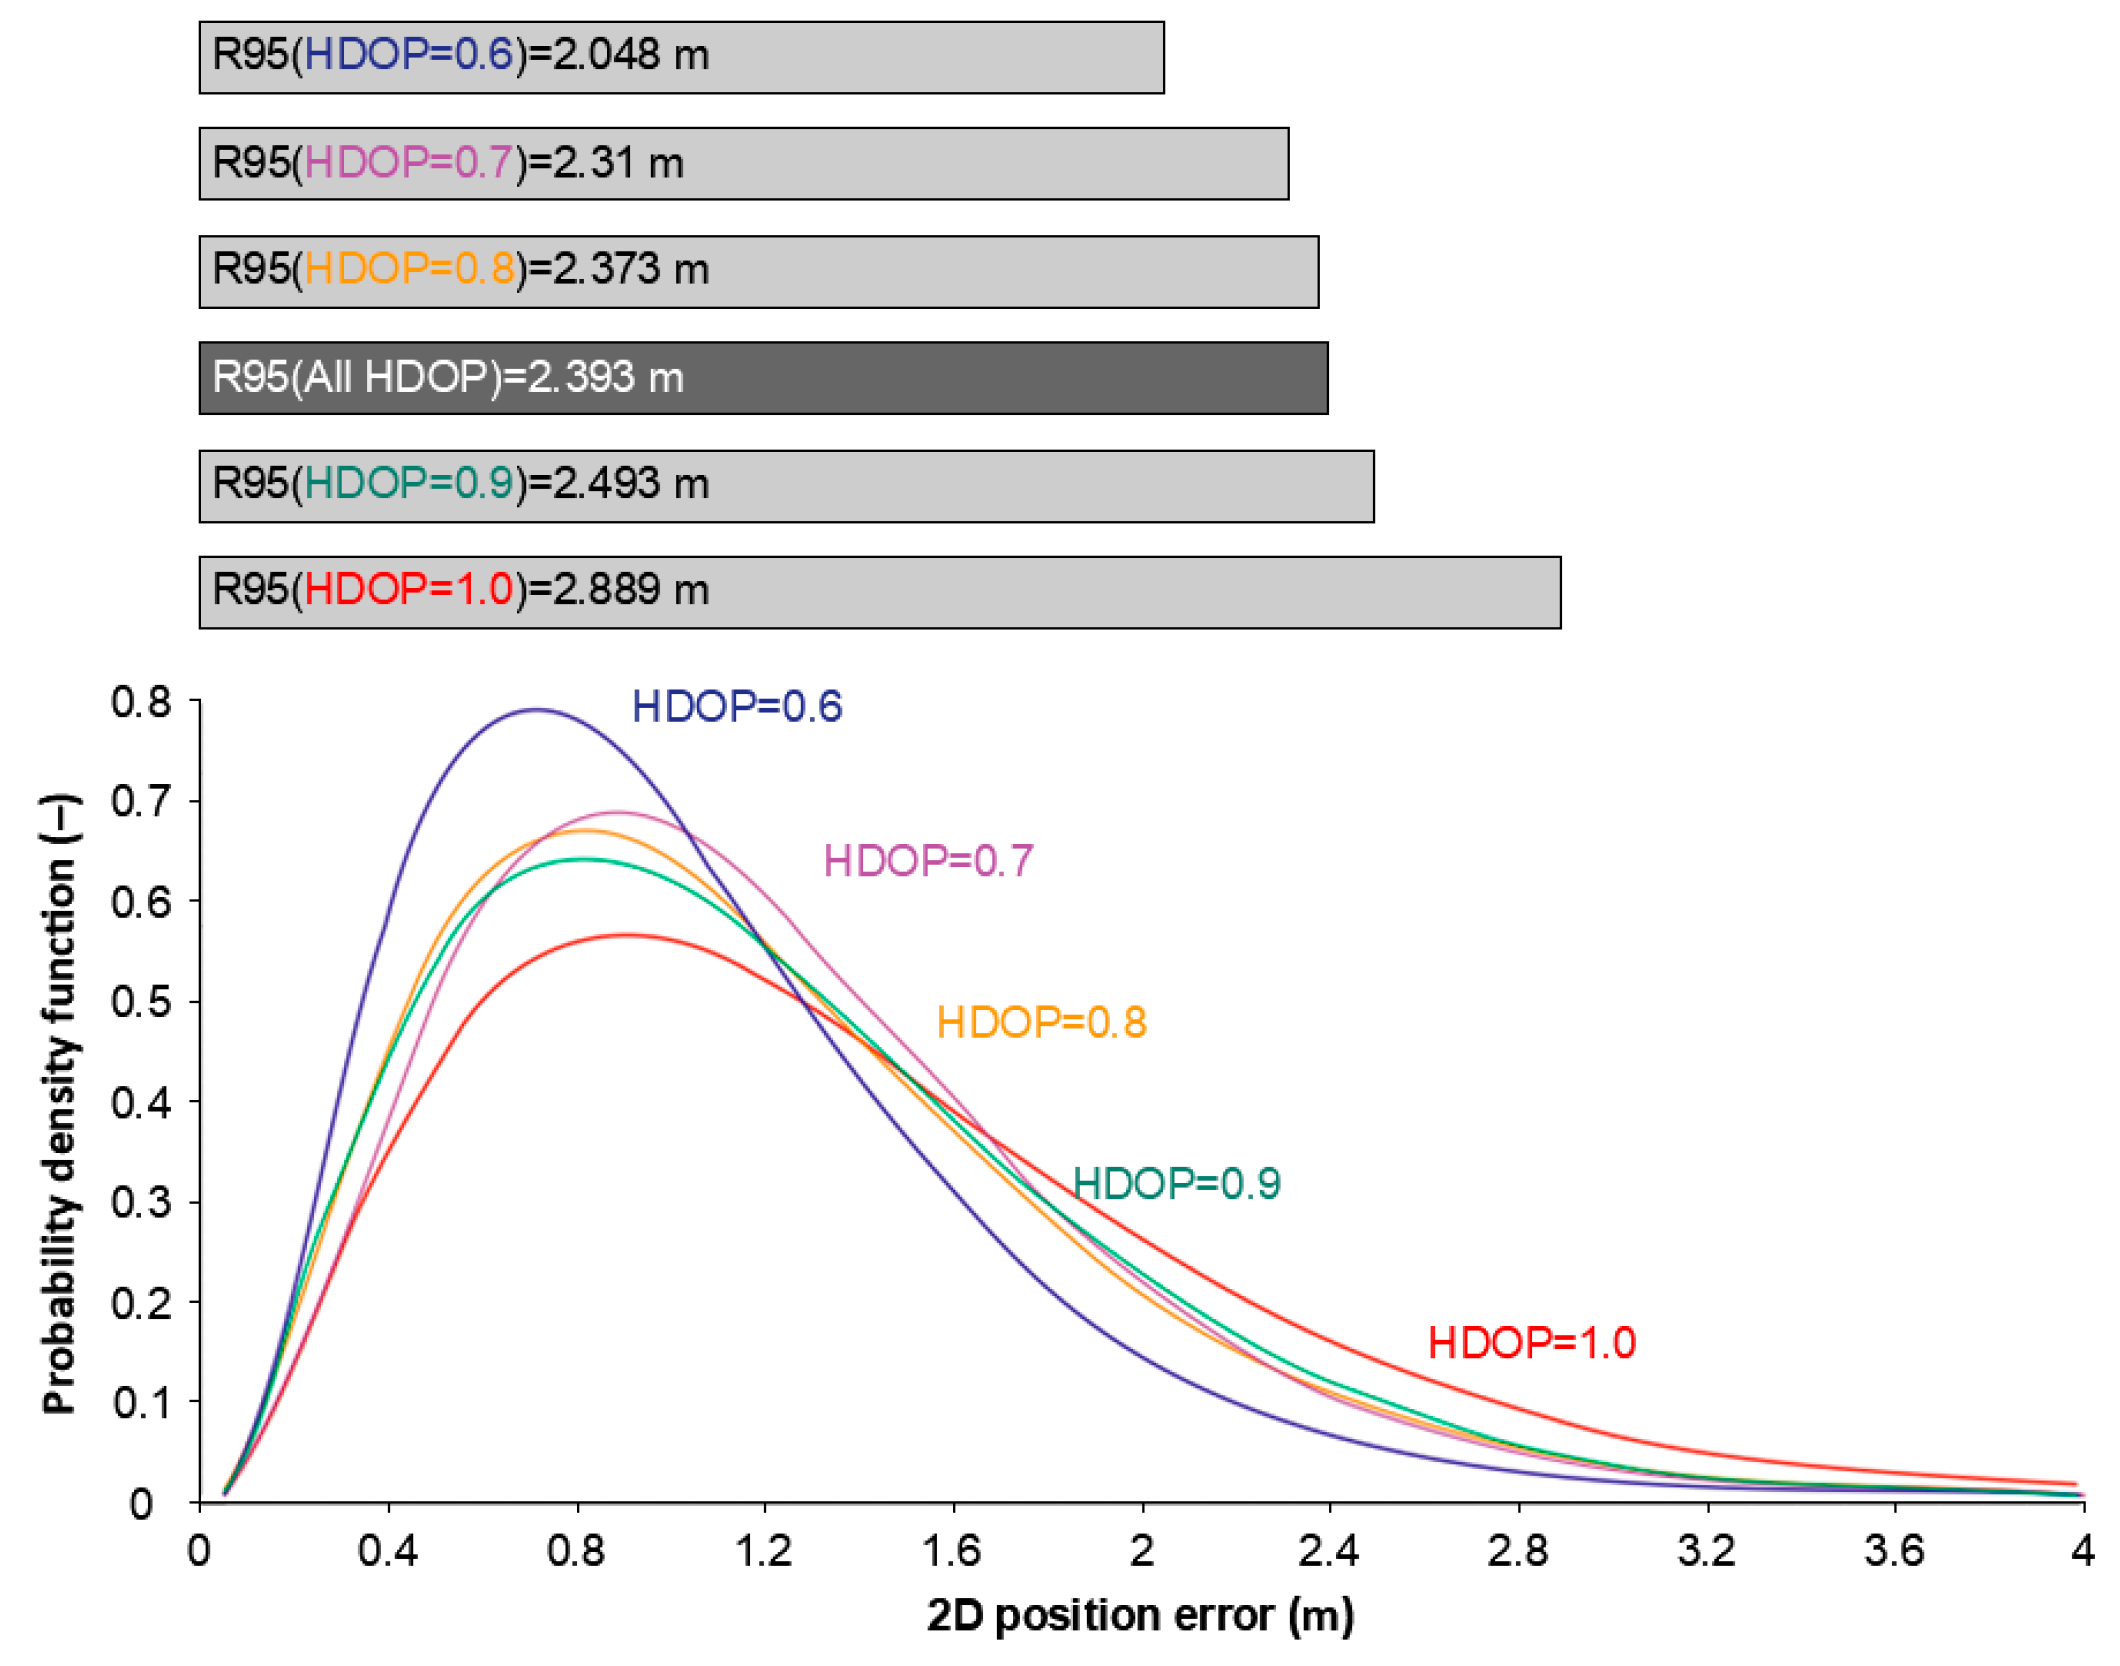
- Population sizes of the sets (32,221–389,007 fixes) for the HDOP values in the range from 0.6 to 1.0 should be considered fully representative, enabling further statistical analyses and inference as regards the 2D position errors. The population sizes of the sets (60–14,270 fixes) for the HDOP values in the range from 1.1 to 1.8 should be considered hardly representative, which prevents the performance of further statistical analyses.
- In order to ensure the greatest HDOP value of 0.6, from 12 to 16 satellites were used. An average of 14.085 satellites were tracked;
- Obtaining the HDOP value of 0.7 was possible when using from 9 to 14 satellites. An average of 12.506 satellites were tracked;
- In order to obtain the most frequently occurring HDOP value of 0.8 (p = 0.432), from 8 to 14 satellites were used. An average of 11.336 satellites were tracked;
- For the HDOP values of 0.9 and 1.0, there was an evident decrease in the number of satellites tracked to 10.149 and 8.749, respectively.
7. Discussion
- The development of a method enabling the determination of the navigation positioning system representative sample length from the perspective of assessing its accuracy [20]. In the navigation systems under study (Decca Navigator, DGPS, EGNOS, and GPS), the PRW phenomenon occurred, and 1D errors did not appear in a random manner as in the normal distribution. Moreover, it was demonstrated that the extent of the “wandering” phenomenon of the position coordinates was determined by the navigation positioning system accuracy. A system with a lower accuracy (Decca Navigator) exhibited considerably greater changes in the successively recorded position coordinates than systems with higher accuracy (DGPS and EGNOS). Moreover, the length of the representative measurement campaign, which will enable reliable statistical inference about the navigation systems’ accuracy, was determined. This will be a session with such a length, for which the process of stabilisation of standard deviations calculated by the cumulative method for the measurement errors of the latitude (RMSφ), longitude (RMSλ), and 2D position (DRMS(2D)) will occur;
- The determination of consistency between empirical distributions of position errors for selected systems (DGPS, EGNOS, and GPS) and typical statistical distributions based on long-term measurement campaigns (1–2 million fixes) [17]. On the basis of data from the GPS measurement campaigns conducted in 2006 and 2014, as well as for the EGNOS of 2014, it can be concluded that the distributions of φ and λ errors are not always consistent with the Gaussian distribution. Moreover, this is not an optimal distribution for the modelling of navigation positioning systems’ errors. A higher fit to the 1D errors was exhibited by such distributions as beta, logistics, and lognormal. On the other hand, a considerably higher fit to the 2D position errors was exhibited by such distributions as beta, gamma, logistic, lognormal, and Weibull. Hence, it should be concluded that the normal distribution should only be applied for the analysis of navigation positioning system errors in the 1D dimension. Moreover, the chi-squared distribution, which is suggested in particular for the analysis of the 2D position errors, exhibited a slight similarity to the empirical data. Therefore, it should not be used for the modelling of the positioning systems’ navigation errors in the 2D dimension;
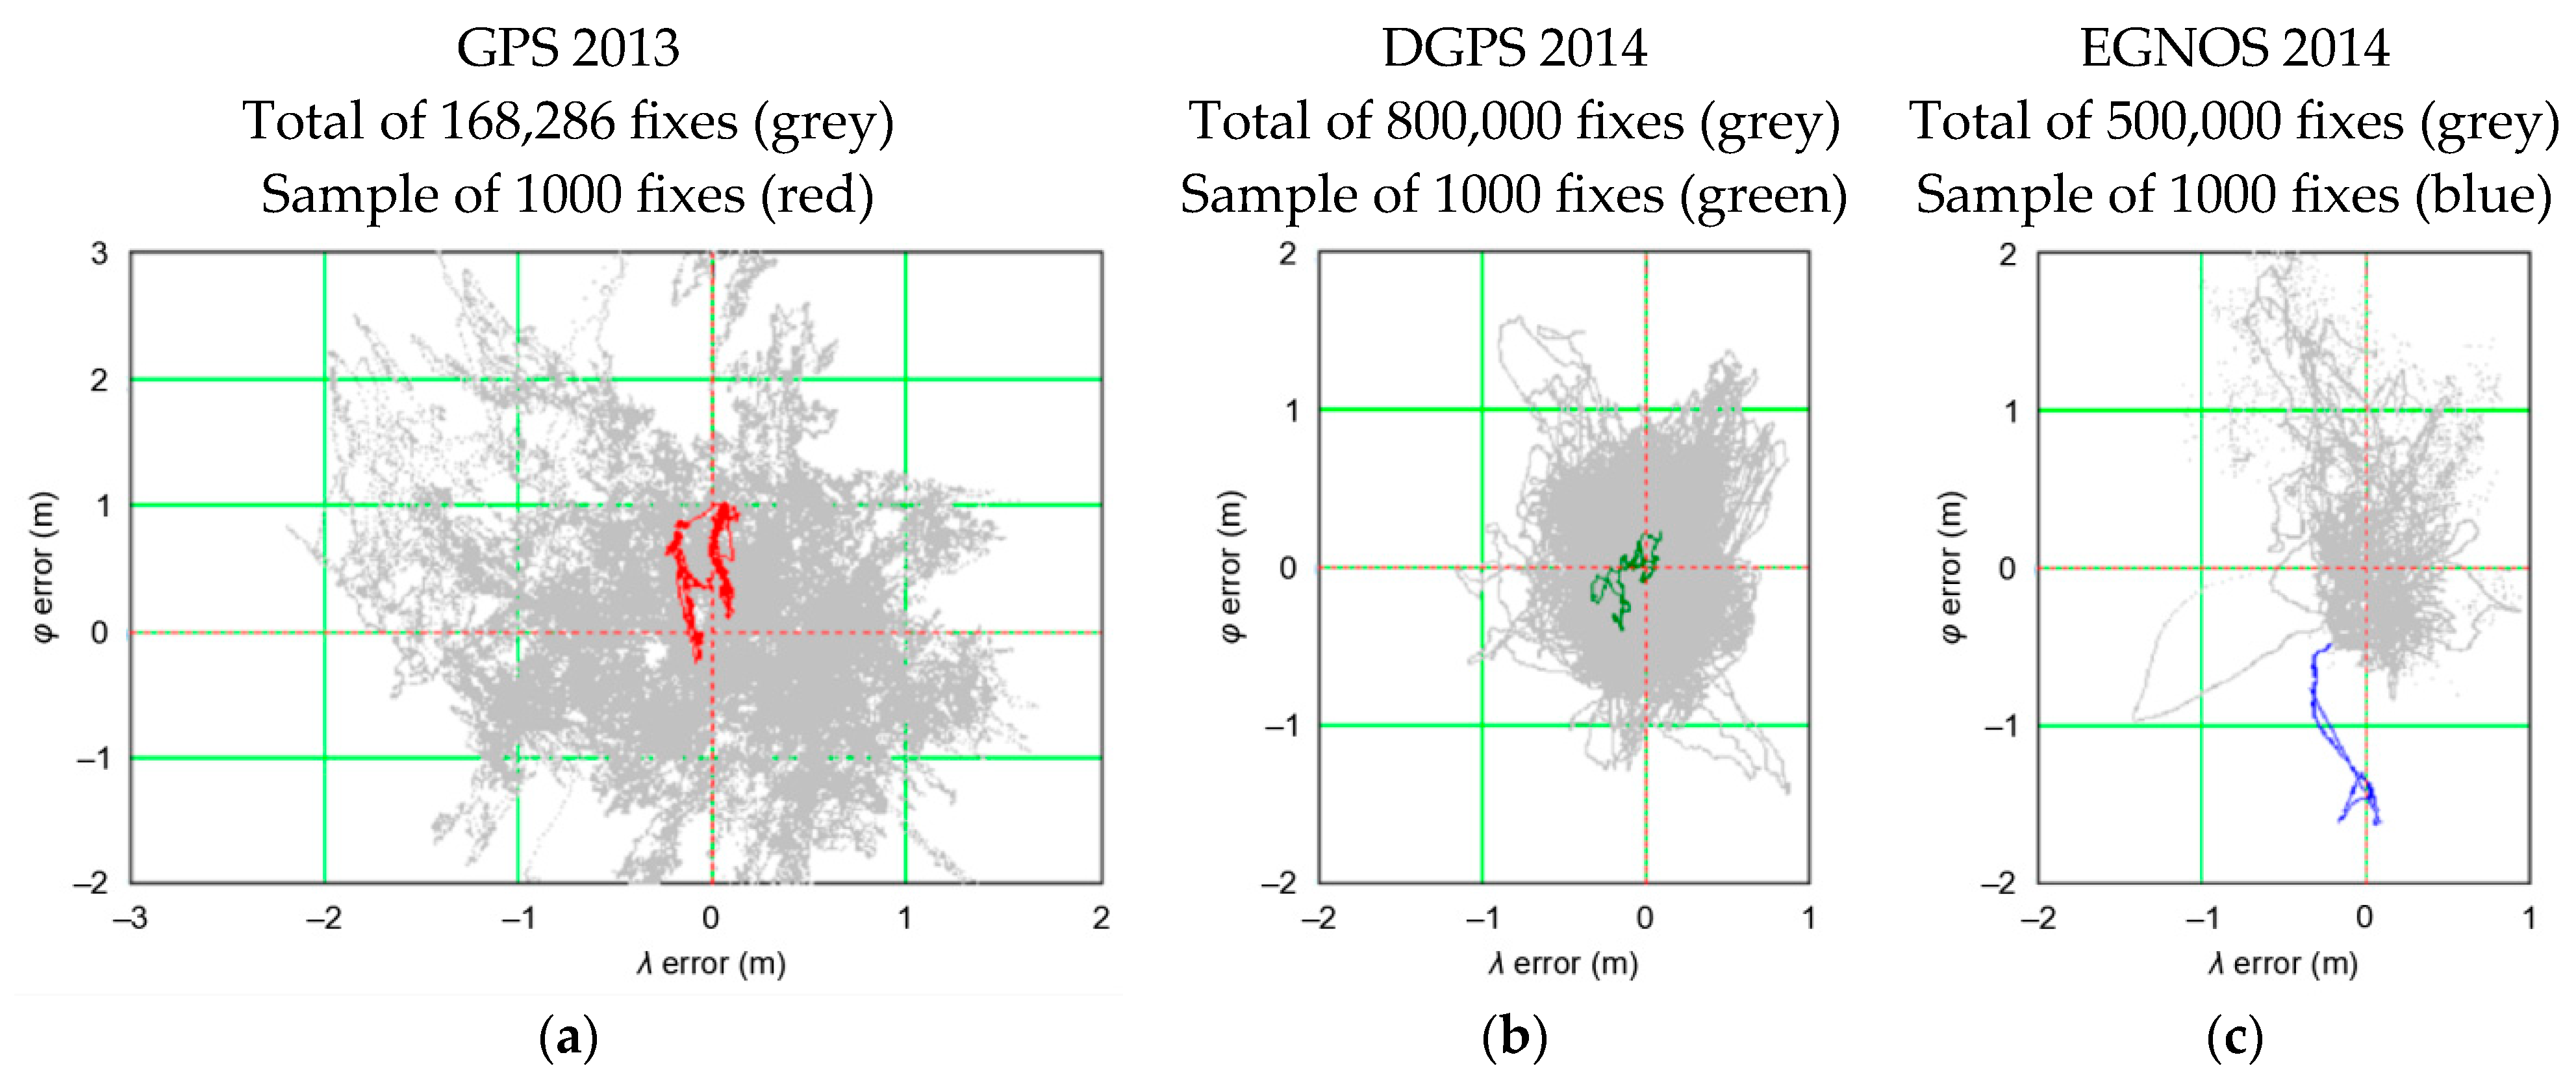
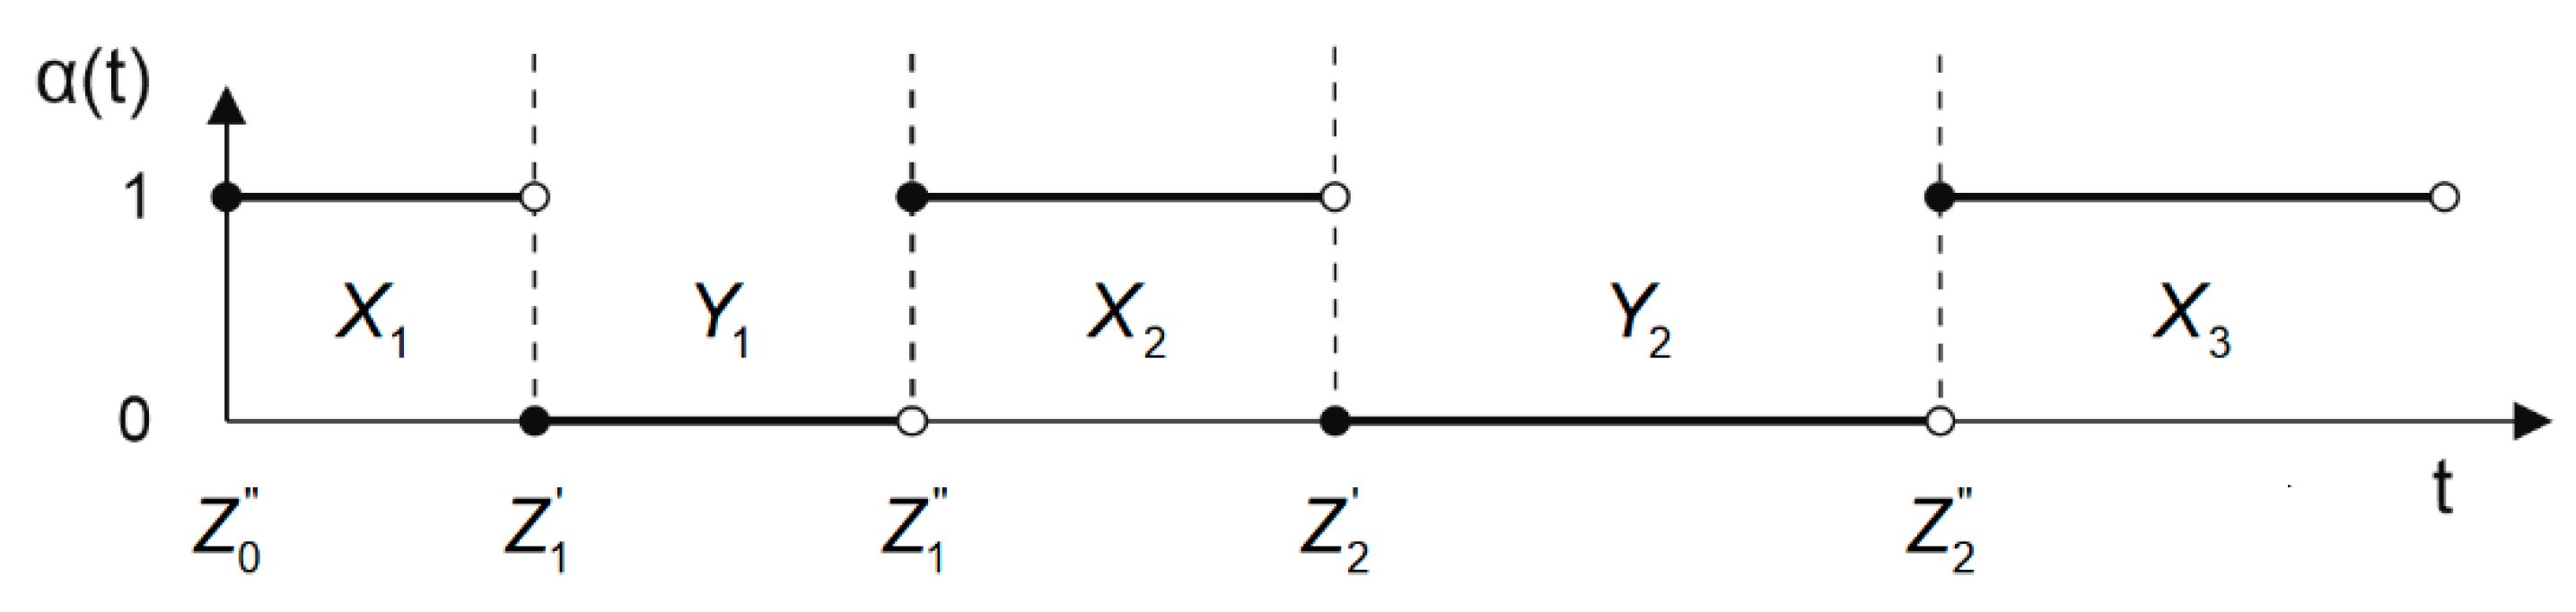
- The development of the author’s original method (reliability modelling of stationary processes with renewal) enabling the calculation of a navigation system position error value based on the empirical data [21]. The publication presented the author’s original method for determining the accuracy of navigation positioning systems, whose essence is based on the reliability model of stationary processes with renewal. The random variables in this method are the life and failure times of the position coordinate determination process and not position errors as in the classical model based on the 2DRMS(2D) measure. The author believes that the reliability method better reflects the nature of the navigation process (real-time process), which is based on time, and it can be effectively used in the assessment of the positioning system suitability for a specific navigation application. Based on the data recorded during the measurement campaigns of the following systems: GPS 2013, DGPS 2014, and EGNOS 2014, it can be concluded that the proposed reliability method ensures considerably more precise calculation of the accuracy of navigation positioning systems in comparison with the 2DRMS measure. Another advantage of this model is the non-complex computational algorithm;
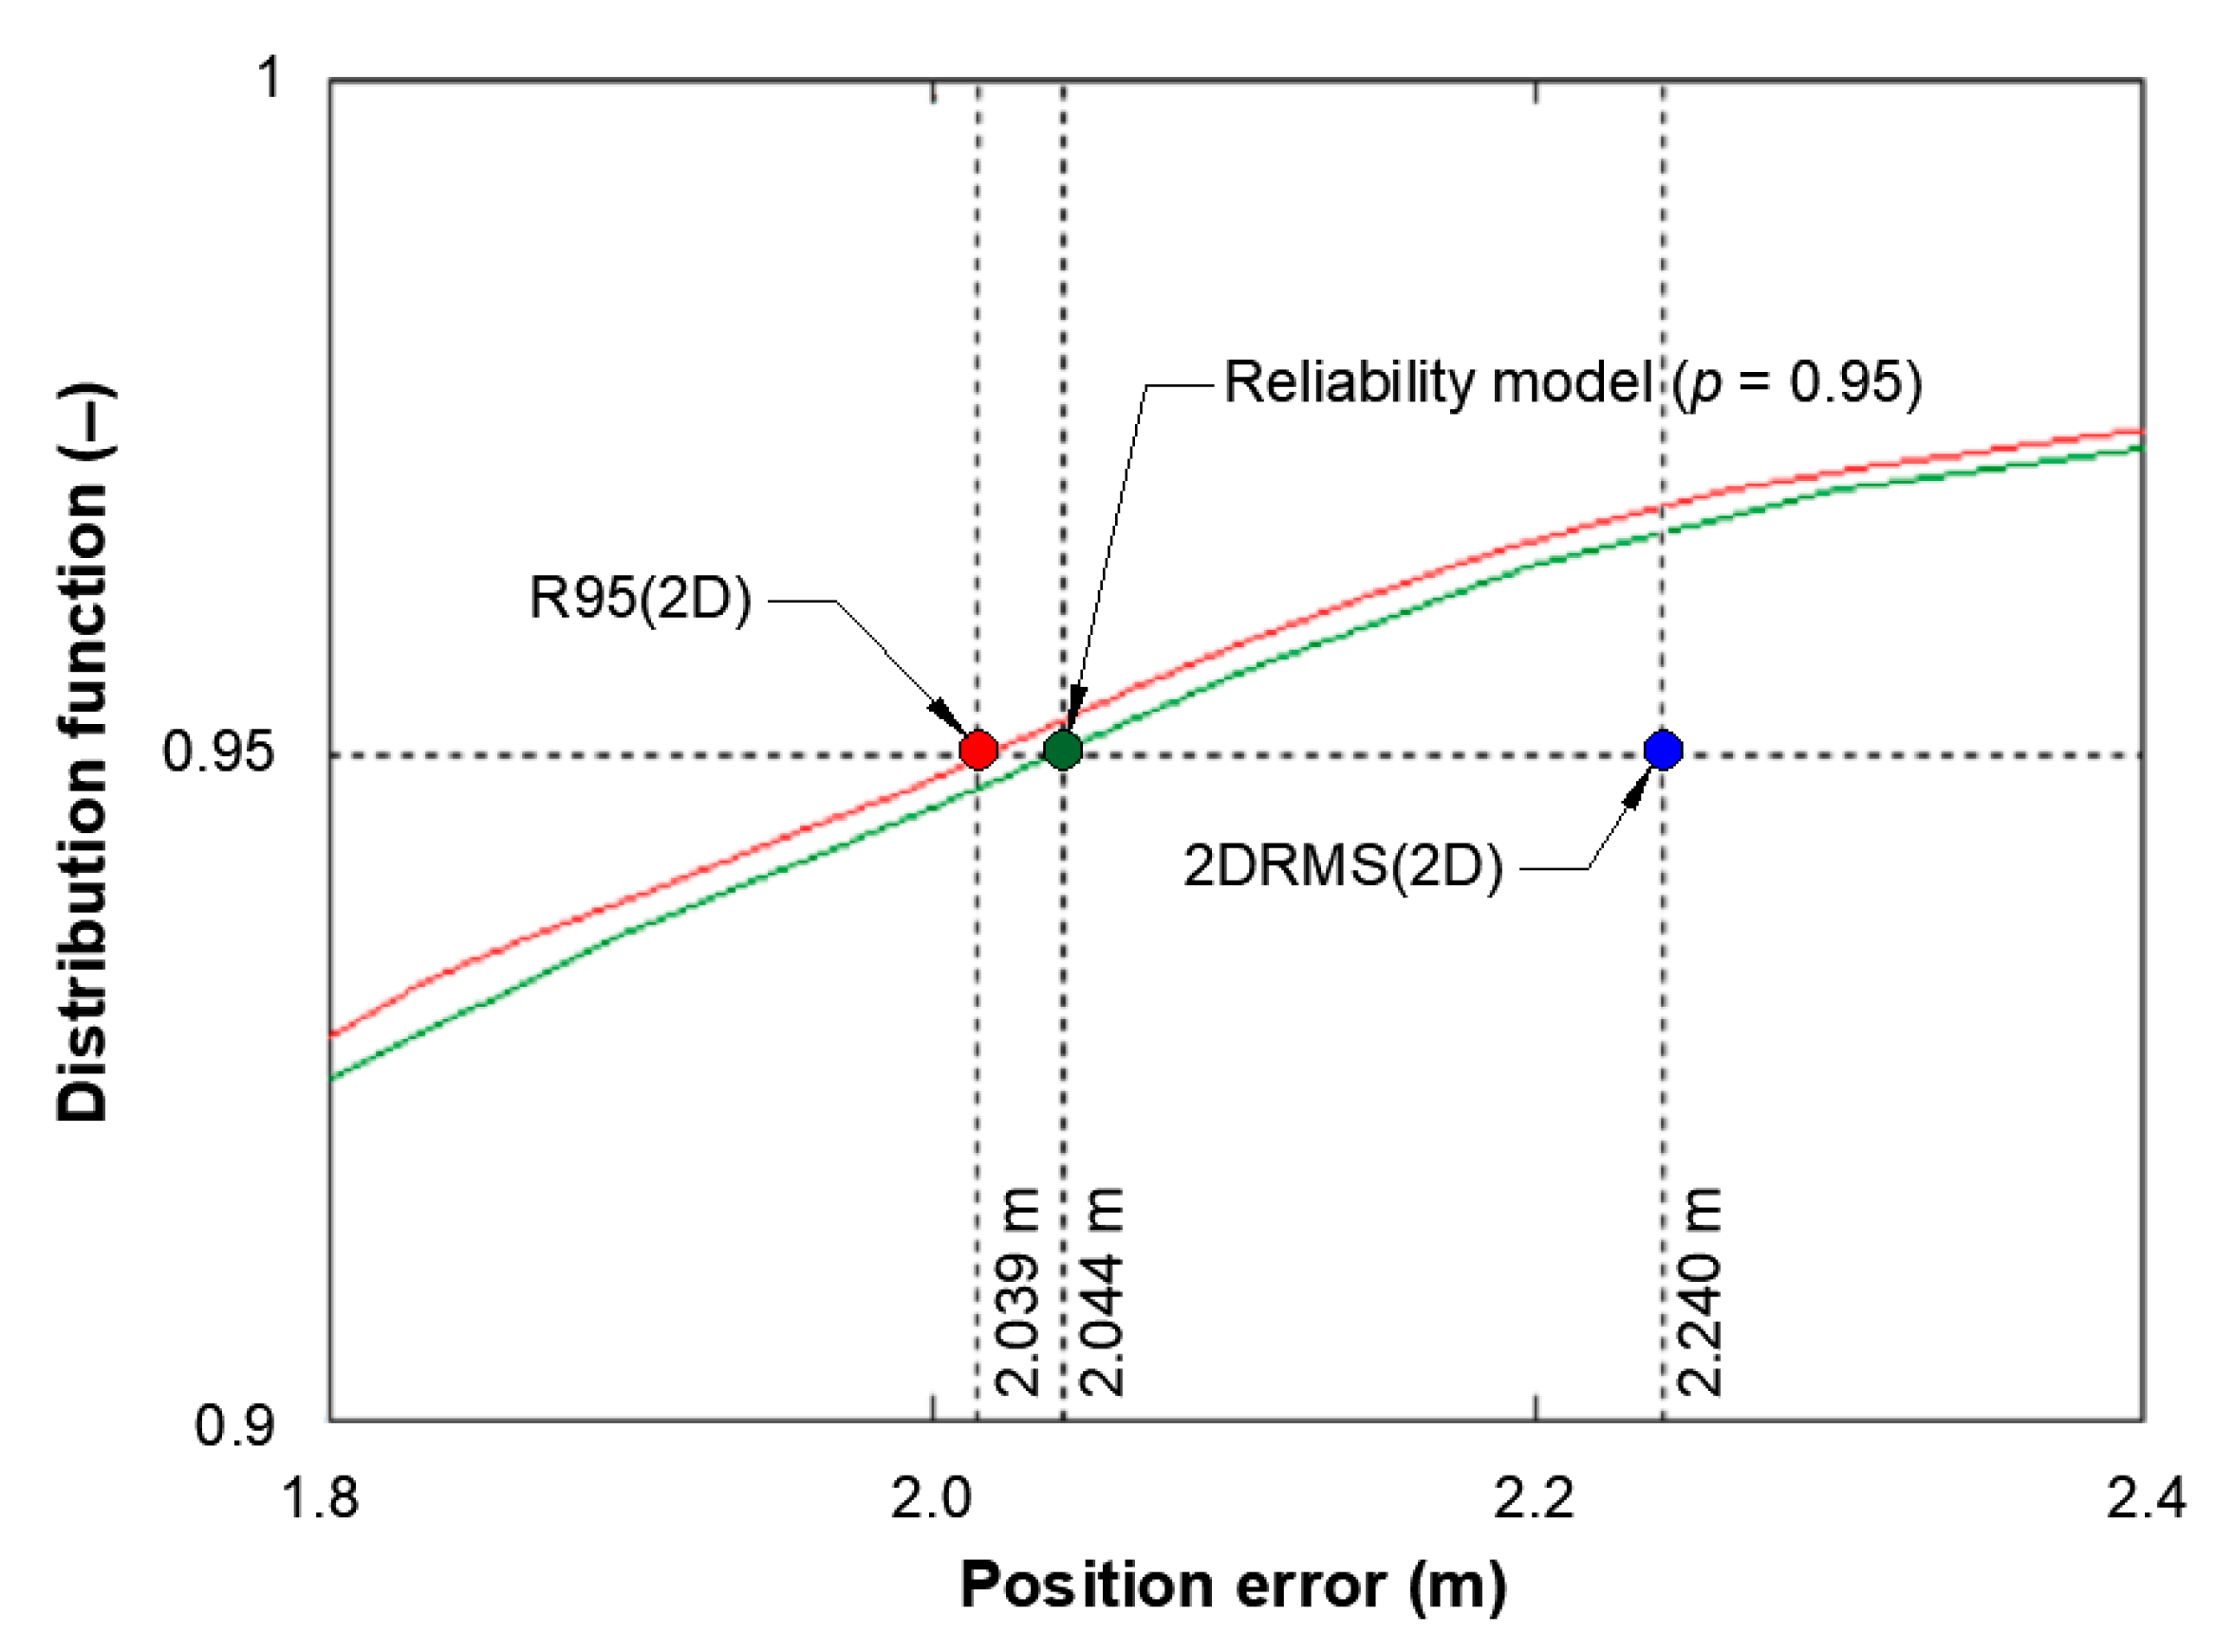
- The determination of differences between the position accuracy measures calculated using the 2DRMS and R95 for the GPS [22]. On the basis of data from the GPS measurement campaigns conducted in 2013 and 2021, it can be concluded that φ errors are greater by 25–39% than λ errors. The differences between these 1D errors must result in the inconsistency between the 2D position error distribution and the chi-squared distribution. This study demonstrated that the 2DRMS(2D) measure value was underestimated by 10–14% in relation to the R95(2D) measure value that should be considered the actual value. It was also proven that the statistical distributions beta, logistic, lognormal, normal, and Student’s best approximate φ errors; the distributions beta, gamma, logistic, lognormal, and normal best describe λ errors; and the distributions beta, gamma, lognormal, and Weibull best approximate the 2D position errors;
- The performance of statistical analyses to determine the relation between the 2D position error and the HDOP values for the GPS [23]. On the basis of data from the GPS measurement campaign conducted in 2021, it can be concluded that the HDOP values fell within a range of 0.6–1.8, with the most frequently occurring quantities of 0.7 (p = 0.353) and 0.8 (p = 0.432). It should be noted that for 95% of surveys (2σ), the HDOP value was 0.973, and for 2.77% of measurements, the coefficient value was greater than 1. It was possible to obtain such low HDOP values thanks to the optimal conditions for the GPS measurement performance due to the lack of field obstacles. Moreover, this study demonstrated that, in order to ensure a low value of the HDOP, and thus a low value of the GPS 2D position error, a great average number of the tracked satellites (at least 12) with low variability are required.
Funding
Conflicts of Interest
References
- U.S. DoD. 2019 Federal Radionavigation Plan; U.S. DoD: Springfield, VA, USA, 2019. [Google Scholar]
- Langley, R.B. The Mathematics of GPS. GPS World 1991, 2, 45–50. [Google Scholar]
- Van Diggelen, F. GPS Accuracy: Lies, Damn Lies, and Statistics. GPS World 1998, 9, 1–6. [Google Scholar]
- Bowditch, N. American Practical Navigator: An Epitome of Navigation; DMA: Washington, DC, USA, 1984. [Google Scholar]
- Cutler, T.J. Dutton’s Nautical Navigation, 15th ed.; Naval Institute Press: Annapolis, MD, USA, 2003. [Google Scholar]
- Hofmann-Wellenhof, B.; Legat, K.; Wieser, M. Navigation—Principles of Positioning and Guidance; Springer: Wien, Austria, 2003. [Google Scholar]
- EC. European Radio Navigation Plan, version 1.1; EC: Luxembourg, 2018. [Google Scholar]
- GSA. Report on Rail User Needs and Requirements, version 1.0; GSA: Prague, Czech Republic, 2018. [Google Scholar]
- IALA. NAVGUIDE 2018 Marine Aids to Navigation Manual, 8th ed.; IALA: Saint-Germain-en-Laye, France, 2018. [Google Scholar]
- ICAO. Convention on International Civil Aviation of 7th December 1944; ICAO: Montreal, QC, Canada, 1944. [Google Scholar]
- IHO. IHO Standards for Hydrographic Surveys, Special Publication No. 44, 6th ed.; IHO: Monaco, Monaco, 2020. [Google Scholar]
- SMA. Swedish Radio Navigation Plan, Policy and Plans; SMA: Norrköping, Sweden, 2009. [Google Scholar]
- Specht, C.; Pawelski, J.; Smolarek, L.; Specht, M.; Dabrowski, P. Assessment of the Positioning Accuracy of DGPS and EGNOS Systems in the Bay of Gdansk Using Maritime Dynamic Measurements. J. Navig. 2019, 72, 575–587. [Google Scholar] [CrossRef]
- Specht, C.; Dabrowski, P.; Pawelski, J.; Specht, M.; Szot, T. Comparative Analysis of Positioning Accuracy of GNSS Receivers of Samsung Galaxy Smartphones in Marine Dynamic Measurements. Adv. Space Res. 2019, 63, 3018–3028. [Google Scholar] [CrossRef]
- Szot, T.; Specht, C.; Specht, M.; Dabrowski, P.S. Comparative Analysis of Positioning Accuracy of Samsung Galaxy Smartphones in Stationary Measurements. PLoS ONE 2019, 14, e0215562. [Google Scholar] [CrossRef]
- U.S. DoD. Global Positioning System Standard Positioning Service Signal Specification, 1st ed.; U.S. DoD: Arlington County, VA, USA, 1993. [Google Scholar]
- Specht, M. Consistency of the Empirical Distributions of Navigation Positioning System Errors with Theoretical Distributions—Comparative Analysis of the DGPS and EGNOS Systems in the Years 2006 and 2014. Sensors 2021, 21, 31. [Google Scholar] [CrossRef]
- NovAtel Positioning Leadership. GPS Position Accuracy Measures. Available online: https://www.novatel.com/assets/Documents/Bulletins/apn029.pdf (accessed on 19 September 2023).
- Pearson, K. The Problem of the Random Walk. Nature 1905, 72, 294. [Google Scholar] [CrossRef]
- Specht, M. Statistical Distribution Analysis of Navigation Positioning System Errors—Issue of the Empirical Sample Size. Sensors 2020, 20, 7144. [Google Scholar] [CrossRef]
- Specht, M. Determination of Navigation System Positioning Accuracy Using the Reliability Method Based on Real Measurements. Remote Sens. 2021, 13, 4424. [Google Scholar] [CrossRef]
- Specht, M. Consistency Analysis of Global Positioning System Position Errors with Typical Statistical Distributions. J. Navig. 2021, 74, 1201–1218. [Google Scholar] [CrossRef]
- Specht, M. Experimental Studies on the Relationship Between HDOP and Position Error in the GPS System. Metrol. Meas. Syst. 2022, 29, 17–36. [Google Scholar]
- Dziewicki, M.; Specht, C. Position Accuracy Evaluation of the Modernized Polish DGPS. Pol. Marit. Res. 2009, 16, 57–61. [Google Scholar] [CrossRef]
- Mięsikowski, M.; Nowak, A.; Specht, C.; Oszczak, B. EGNOS—Accuracy Performance in Poland. Ann. Navig. 2006, 11, 63–72. [Google Scholar]
- Specht, C. Accuracy and Coverage of the Modernized Polish Maritime Differential GPS System. Adv. Space Res. 2011, 47, 221–228. [Google Scholar] [CrossRef]
- Masereka, E.M.; Otieno, F.A.O.; Ochieng, G.M.; Snyman, J. Best Fit and Selection of Probability Distribution Models for Frequency Analysis of Extreme Mean Annual Rainfall Events. Int. J. Eng. Res. Dev. 2015, 11, 34–53. [Google Scholar]
- Anderson, T.W.; Darling, D.A. A Test of Goodness of Fit. J. Am. Stat. Assoc. 1954, 49, 765–769. [Google Scholar] [CrossRef]
- Pearson, K. On the Criterion that a Given System of Deviations from the Probable in the Case of a Correlated System of Variables is Such that it Can be Reasonably Supposed to have Arisen from Random Sampling. London Edinb. Dublin Philos. Mag. J. Sci. 1900, 50, 157–175. [Google Scholar] [CrossRef]
- Kolmogorov, A. Sulla Determinazione Empirica di una Legge di Distribuzione. G. Ist. Ital. Attuari 1933, 4, 83–91. (In Italian) [Google Scholar]
- Smirnov, N. Table for Estimating the Goodness of Fit of Empirical Distributions. Ann. Math. Stat. 2007, 19, 279–281. [Google Scholar] [CrossRef]
- Bowditch, N. American Practical Navigator; Paradise Cay Publications: Blue Lake, CA, USA, 2019; Volume 1–2. [Google Scholar]
- Specht, C.; Rudnicki, J. A Method for the Assessing of Reliability Characteristics Relevant to an Assumed Position-fixing Accuracy in Navigational Positioning Systems. Pol. Marit. Res. 2016, 23, 20–27. [Google Scholar] [CrossRef]
- GLA. GLA Radio Navigation Plan; GLA: London, UK, 2007. [Google Scholar]
- Reid, T.G.R.; Houts, S.E.; Cammarata, R.; Mills, G.; Agarwal, S.; Vora, A.; Pandey, G. Localization Requirements for Autonomous Vehicles. In Proceedings of the WCX SAE World Congress Experience 2019, Detroit, MI, USA, 9–11 April 2019. [Google Scholar]
- Specht, C. Radio Navigation Systems: Definitions and Classifications. J. Navig. 2021, 74, 945–954. [Google Scholar] [CrossRef]
- Specht, C. Availability, Reliability and Continuity Model of Differential GPS Transmission. Annu. Navig. 2003, 5, 1–85. [Google Scholar]
- Barlow, R.E.; Proschan, F. Statistical Theory of Reliability and Life Testing: Probability Models; Holt, Rinehart and Winston: New York, NY, USA, 1974. [Google Scholar]
- Chin, G.Y. Two-Dimensional Measures of Accuracy in Navigation Systems; Tech. Rep. No. DOT-TSC-RSPA-87-1; TSC: Cambridge, MA, USA, 1987. [Google Scholar]
- Kalafus, R.M.; Chin, G.Y. Measures of Accuracy in the Navstar/GPS: 2drms vs. CEP. In Proceedings of the 1986 National Technical Meeting of The Institute of Navigation (NTM 1986), Long Beach, CA, USA, 21–23 January 1986. [Google Scholar]
- Norman, L.J.; Kotz, S.; Balakrishnan, N. Continuous Univariate Distributions; John Wiley & Sons, Inc.: Hoboken, NJ, USA, 1995; Volume 2. [Google Scholar]


| Measure | All Fixes (168,286) | S1—Red Session (1–1000) | S2—Blue Session (1001–2000) | S3—Green Session (2001–3000) | S4—Purple Session (3001–4000) | S5—Sky-Blue Session (4001–5000) | Mean from S1–S5 |
|---|---|---|---|---|---|---|---|
| shift | 0.000 m | 0.572 m | 0.633 m | 1.268 m | 1.956 m | 1.463 m | 1.178 m |
| shift | 0.000 m | −0.047 m | 0.251 m | 0.157 m | 0.326 m | 0.427 m | 0.223 m |
| from the real coordinates (0, 0) | 0.000 m | 0.574 m | 0.681 m | 1.278 m | 1.983 m | 1.524 m | 1.208 m |
| RMSφ | 0.910 m | 0.299 m | 0.201 m | 0.414 m | 0.275 m | 0.358 m | 0.309 m |
| Session RMSφ vs. all measurements RMSφ (%) | 100.00% | 32.86% | 22.12% | 45.54% | 30.26% | 39.37% | 34.03% |
| RMSλ | 0.653 m | 0.098 m | 0.066 m | 0.059 m | 0.120 m | 0.085 m | 0.086 m |
| Session RMSλ vs. all measurements RMSλ (%) | 100.00% | 15.07% | 10.09% | 9.01% | 18.36% | 13.01% | 13.11% |
| Kolmogorov–Smirnov Test | |
|---|---|
| φ Error | λ Error |
 |  |
| Distribution Measure | φ Error | λ Error | PDF for φ Error | PDF for λ Error | ||
|---|---|---|---|---|---|---|
| Sample size | 900,000 |  | 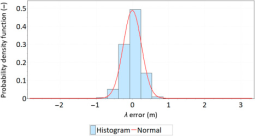 | |||
| Arithmetic mean | −0.001 m | −0.001 m | ||||
| Median | −0.013 m | 0.010 m | ||||
| Range | 7.176 m | 6.153 m | ||||
| Variance | 0.135 m | 0.063 m | ||||
| Standard deviation | 0.368 m | 0.251 m | ||||
| Skewness | −0.114 | 0.216 | ||||
| Kurtosis | 6.204 | 12.956 | ||||
| Anderson–Darling | No reject | Anderson–Darling | Reject | |||
| Chi-squared | Reject | Chi-squared | Reject | |||
| Kolmogorov–Smirnov | No reject | Kolmogorov–Smirnov | Reject | |||
| Best Fit Distribution for φ Error | Best Fit Distribution for λ Error | ||
|---|---|---|---|
 | 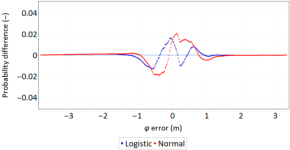 |  | 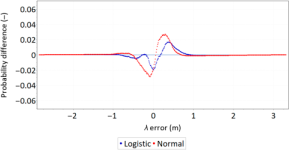 |
| Distribution Measure | 2D Position Error | PDF for 2D Position Error | 2D Position Error Distribution |
|---|---|---|---|
| Sample size | 900,000 |  | 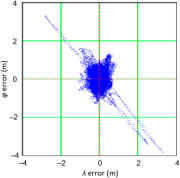 |
| Arithmetic mean | 0.367 m | ||
| Median | 0.330 m | ||
| Range | 5.076 m | ||
| Variance | 0.064 m | ||
| Standard deviation | 0.252 m | ||
| Skewness | 4.513 | ||
| Kurtosis | 54.192 | ||
| 2DRMS(2D) | 0.885 m | ||
| R95(2D) | 0.748 m |
| Best Fit Distribution for 2D Position Error |
|---|
 |
| Ranking of the Best Fit Distributions | |||||
|---|---|---|---|---|---|
| φ Error | λ Error | 2D Position Error | |||
| 1. Logistic | 10 pt | 1. Logistic | 10 pt | 1. Weibull | 10 pt |
| 2. Lognormal (3P) | 9 pt | 2. Beta | 9 pt | 2. Lognormal (3P) | 9 pt |
| 3. Normal | 8 pt | 3. Normal | 8 pt | 3. Beta | 8 pt |
| 4. Beta | 7 pt | 4. Lognormal (3P) | 7 pt | 4. Gamma (3P) | 7 pt |
| 5. Gamma (3P) | 6 pt | 5. Gamma (3P) | 6 pt | 5. Rayleigh | 6 pt |
| 6. Laplace | 5 pt | 6. Weibull (3P) | 5 pt | 6. Weibull (3P) | 5 pt |
| 7. Cauchy | 4 pt | 7. Laplace | 4 pt | 7. Gamma | 4 pt |
| 8. Weibull (3P) | 3 pt | 8. Cauchy | 3 pt | 8. Lognormal | 3 pt |
| 9. Chi-square (2P) | 2 pt | 9. Rayleigh (2P) | 2 pt | 9. Rayleigh (2P) | 2 pt |
| 10. Rayleigh (2P) | 1 pt | 10. Chi-square (2P) | 1 pt | 10. Logistic | 1 pt |
| Ranking of the Best Fit Distributions | |||||
|---|---|---|---|---|---|
| 1D Error | 2D Position Error | 1D + 2D Position Errors | |||
| 1. Logistic | 53 | 1. Lognormal (3P) | 26 | 1. Lognormal (3P) | 93 |
| 2. Beta | 51 | 2. Weibull | 26 | 2. Beta | 86 |
| 3. Lognormal (3P) | 49 | 3. Beta | 24 | 3. Gamma (3P) | 75 |
| 4. Normal | 44 | 4. Gamma (3P) | 23 | 4. Logistic | 69 |
| 5. Gamma (3P) | 39 | 5. Weibull (3P) | 15 | 5. Normal | 56 |
| 6. Weibull (3P) | 30 | 6. Gamma | 14 | 6. Weibull (3P) | 51 |
| 7. Laplace | 25 | 7. Rayleigh | 13 | 7. Laplace | 42 |
| 8. Cauchy | 21 | 8. Lognormal | 13 | 8. Cauchy | 42 |
| 9. Rayleigh (2P) | 9 | 9. Rayleigh (2P) | 7 | 9. Weibull | 31 |
| 10. Chi-square (2P) | 8 | 10. Normal | 2 | 10. Lognormal | 23 |
| Descriptive Statistic | 2D Position Error | |||||
|---|---|---|---|---|---|---|
| HDOP = 0.6 | HDOP = 0.7 | HDOP = 0.8 | HDOP = 0.9 | HDOP = 1.0 | HDOP ∈ <0.6, 1.8> | |
| Sample size | 51,215 | 317,743 | 389,007 | 84,937 | 32,221 | 900 000 |
| Availability | 5.69% | 35.30% | 43.22% | 9.44% | 3.58% | 100% |
| Arithmetic mean | 0.988 m | 1.16 m | 1.151 m | 1.168 m | 1.353 m | 0.875 m |
| Range | 3.902 m | 6.582 m | 6.582 m | 4.109 m | 6.102 m | 0.802 m |
| Variance | 0.322 m | 0.41 m | 0.439 m | 0.456 m | 0.673 m | 5.993 m |
| Standard deviation | 0.568 m | 0.641 m | 0.663 m | 0.675 m | 0.82 m | 2.448 m |
| R95 | 2.048 m | 2.31 m | 2.373 m | 2.493 m | 2.889 m | 2.393 m |
Disclaimer/Publisher’s Note: The statements, opinions and data contained in all publications are solely those of the individual author(s) and contributor(s) and not of MDPI and/or the editor(s). MDPI and/or the editor(s) disclaim responsibility for any injury to people or property resulting from any ideas, methods, instructions or products referred to in the content. |
© 2023 by the author. Licensee MDPI, Basel, Switzerland. This article is an open access article distributed under the terms and conditions of the Creative Commons Attribution (CC BY) license (https://creativecommons.org/licenses/by/4.0/).
Share and Cite
Specht, M. Review of the Monothematic Series of Publications Concerning Research on Statistical Distributions of Navigation Positioning System Errors. Remote Sens. 2023, 15, 5407. https://doi.org/10.3390/rs15225407
Specht M. Review of the Monothematic Series of Publications Concerning Research on Statistical Distributions of Navigation Positioning System Errors. Remote Sensing. 2023; 15(22):5407. https://doi.org/10.3390/rs15225407
Chicago/Turabian StyleSpecht, Mariusz. 2023. "Review of the Monothematic Series of Publications Concerning Research on Statistical Distributions of Navigation Positioning System Errors" Remote Sensing 15, no. 22: 5407. https://doi.org/10.3390/rs15225407
APA StyleSpecht, M. (2023). Review of the Monothematic Series of Publications Concerning Research on Statistical Distributions of Navigation Positioning System Errors. Remote Sensing, 15(22), 5407. https://doi.org/10.3390/rs15225407