Article

Using Satellite Data to Characterize Land Surface Processes in Morocco

by
Mohammed Thaiki
1,
Lahouari Bounoua
2,* and
Hinde Cherkaoui Dekkaki
1
1
Laboratory of Research and Development in Applied Geosciences, Department of Earth and Environmental Sciences, Faculty of Science and Technique of Al Hoceima, Abdelmalek Essaâdi University, Al Hoceima 32003, Morocco
2
Biospheric Sciences Laboratory, NASA Goddard Space Flight Center, Greenbelt, MD 20771, USA
*
Author to whom correspondence should be addressed.
Remote Sens. 2023, 15(22), 5389; https://doi.org/10.3390/rs15225389
Submission received: 30 September 2023 / Revised: 13 November 2023 / Accepted: 14 November 2023 / Published: 17 November 2023
(This article belongs to the Special Issue Remote Sensing of Vegetation Biochemical and Biophysical Parameters)

Abstract

:
This study endeavors to produce a comprehensive land cover map for Morocco, addressing the absence of such a detailed map in the country. Our research encompasses ecological and climatic aspects specific to Morocco, while the methods used can be adapted to various regions and countries, considering their unique climatic conditions and land cover types. A combination of MODIS and Landsat datasets was employed to create a 5 km resolution Land Use and Land Cover (LULC) map for the entire nation. The process involved the aggregation and advanced processing of these datasets using surface processes algorithms. The resulting LULC map is the first of its kind for Morocco, shedding light on land cover distribution nationwide. It shows that approximately 13.5% of the country is covered by forests, predominantly in the Atlas and Rif mountains, Rabat–Sale, and the southern regions. Grasslands occupy over 16% of the study area, mainly in the north-east and west. Urban areas, including major cities like Casablanca, Rabat, and Marrakech, span nearly 3400 km². Moreover, large areas of shrublands and bare lands are evident across the country, while agricultural lands account for almost 20% of the national territory, mainly in the interior plains and north-western Atlantic coast. This study forms a crucial basis for ecological and climatic research in Morocco and serves as a valuable reference for various disciplines such as agriculture, natural resource management, and climate modeling. The mapping of biophysical parameters for each land cover class is a key feature of our research, and these parameters will be instrumental in a subsequent study examining the impact of urban development on surface climate in Morocco. Overall, our study underscores the importance of understanding biophysical parameters in addressing environmental and societal challenges.

Graphical Abstract

1. Introduction

Urbanization is transforming extensive tracts of land that were once covered with vegetation or left bare. According to certain calculations, urban regions now cover nearly 3% of the Earth’s surface and house over half of the global population [1]. From an ecological standpoint, urbanization represents a significant and enduring land use change, with its expansion closely tied to population growth and economic advancement.
Globally, urban expansion, has predominantly encroached upon agricultural land, with estimates indicating over 60% of such expansion occurring on arable fields over the past 50 years [2,3,4].
Urbanization in Morocco displays rapid expansion with significant spatial disparities occurring nationwide despite efforts to stabilize rural communities, involving both established urban centers and a network of new units on the outskirts of major cities. This trend has been particularly accelerated, with an annual growth rate of 3.6% between 1982 and 1994. This growth predominantly occurs in coastal regions of the north and west, while the arid or semi-arid southern regions experience less concentration of population. Simultaneously, Morocco faces a yearly loss of approximately 22,000 hectares of fertile land, attributed to urbanization, soil overexploitation, and suboptimal plowing methods [5,6].
However, urbanization tends to encroach upon the most fertile and productive lands. The combined impact of this human-induced land use disruption becomes particularly pronounced in certain areas, leading to potential changes in surface carbon storage, as well as alterations in surface water and energy distribution. These changes can have repercussions on local and regional biological, hydrological, and energy cycles [7]. In terms of energy, for example, urbanization is characterized by the formation of urban heat islands that exacerbate warming [8,9] in cities and increase energy consumption [10,11].
Land surface models (LSMs) play a pivotal role in understanding the interactions involving carbon, energy, water, and momentum exchanges between the soil, vegetation, and the atmosphere. While linked to atmospheric models, these LSMs suffered from coarse resolutions [12,13,14]. However, advancements in incorporating finer details, like biophysical parameters [12], were driven by the need to capture landscape complexity. LSMs require precise characterization of land cover and related parameters, significantly influencing their sensitivity and outcomes [15]. Misclassifying land cover introduces uncertainties, affecting critical factors like leaf area index and roughness length, thereby influencing surface carbon, water, and energy fluxes [16]. Accurate parameterization enhances LSMs’ reliability in depicting intricate environmental processes which in turn serve to assess the interactions between ecosystems and surface climate.
These models serve as interconnected interfaces within climate models, bridging the gap between the Earth’s surface and the atmosphere, and prove invaluable in comprehending and replicating the intricate exchange of carbon, energy, water, and momentum among the soil, vegetation, and the atmosphere. However, to operate effectively, these models require several key components: a comprehensive land use map that defines all land cover types, including artificial urban areas, and their corresponding biophysical attributes, which encompass various characteristics such as morphology, optics, and physiology, particularly with regard to vegetation [17]. It is important to note that these biophysical parameters are highly contingent on the specific vegetation types [18]. Errors in the classification of land cover can introduce uncertainties into critical calculations involving the fraction of photosynthetically active radiation (FPAR), leaf area index (LAI), and roughness length (Zo). These variables have substantial implications for the transfer of carbon, water, and energy at the interface between the land and the atmosphere [16].
The paper outlines the methodology and structure for developing a continental-scale gridded land cover dataset that incorporates fractions from 13 distinct land cover types, derived from MODIS and Landsat data sources. For each category, the dataset provides time series of biophysical parameters at 16 day intervals over Morocco for 2010. These parameters are derived using algorithms designed for the Simple Biosphere model (SiB2) [19]. While the grid maintains a consistent angular resolution of 0.05° × 0.05° latitude/longitude, for simplicity, the resolution is colloquially referred to as 5 km × 5 km throughout the paper.
This dataset is designed for simulating surface state variables with the SiB2 model, specifically exploring how urbanization dynamics influence surface climate.

2. Materials and Methods
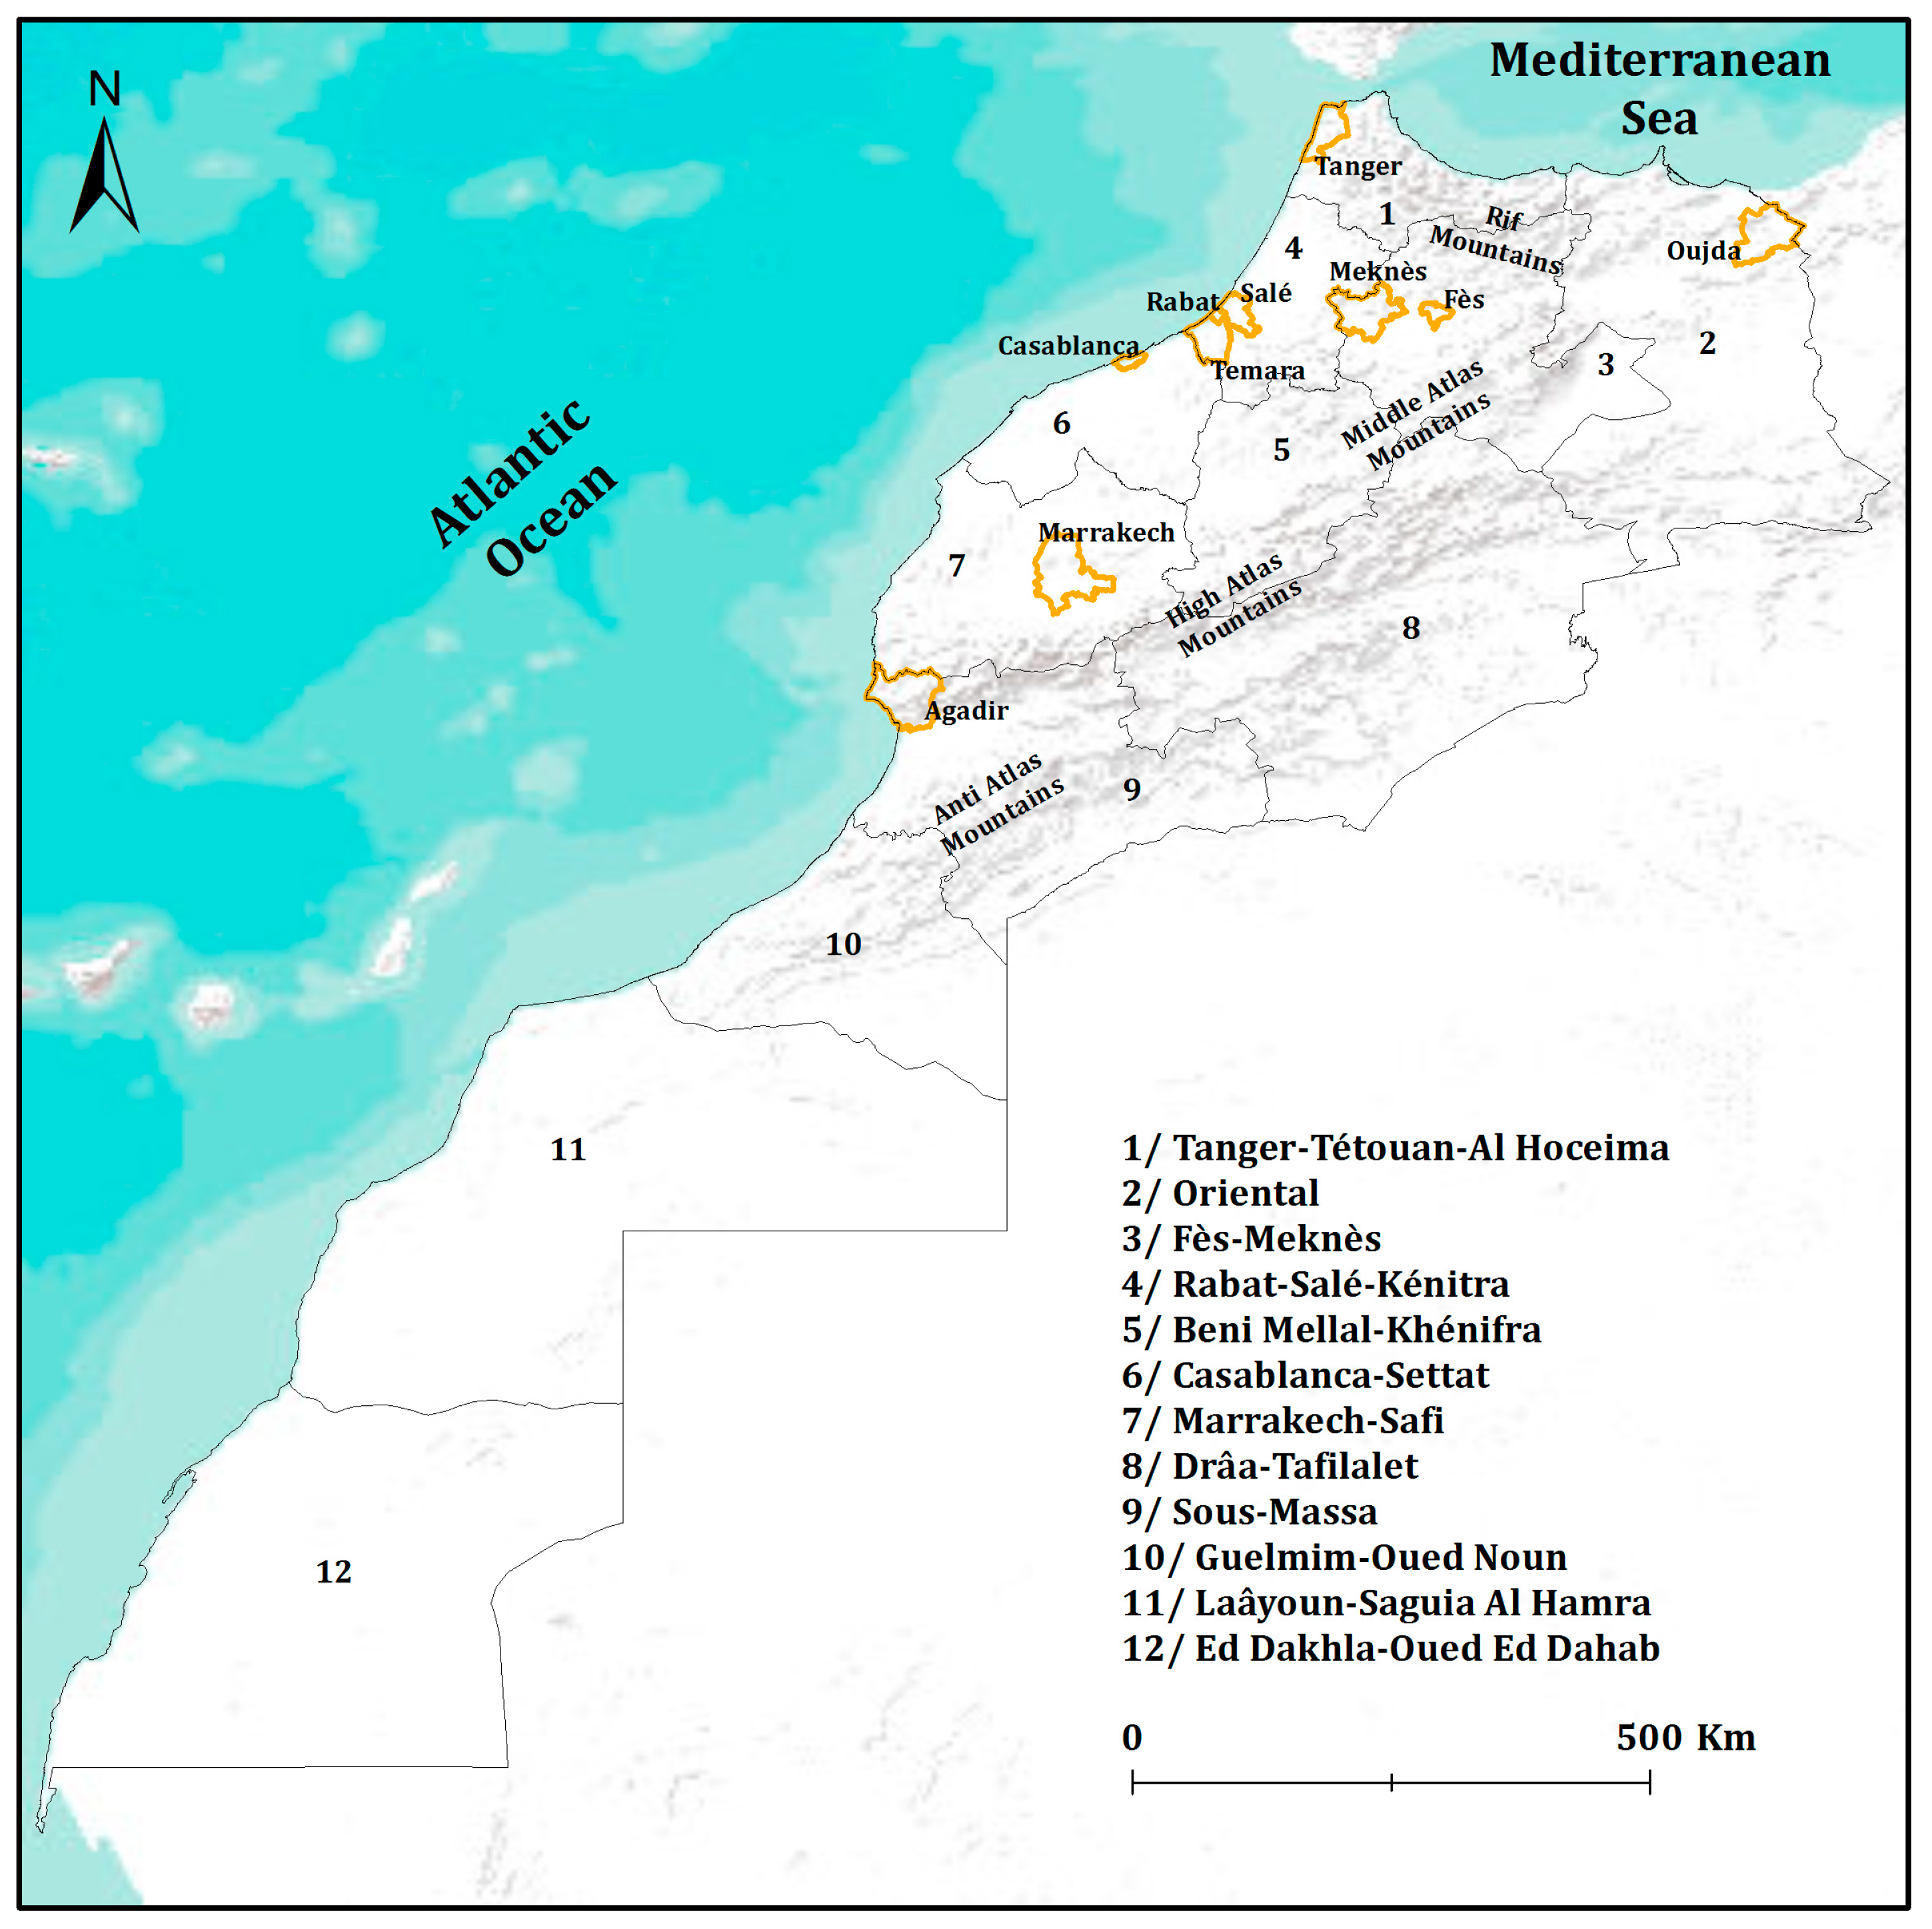
2.1. Study Area

Morocco, situated in the northwestern part of Africa, is a Mediterranean nation that extends along the northern coastline of the Atlantic Ocean, covering a land area of approximately 710,850 square kilometers [20]. Morocco is divided into 12 administrative regions and had a population of approximately 33.8 million people in 2022, with over half of its residents residing in urban areas [21]. Rabat serves as the administrative capital of Morocco, while Casablanca holds the distinction of being the country’s economic capital and its largest urban metropolis.
Morocco is undergoing a notable trend of urbanization, with rural to urban migration contributing to this shift. Over the period between 2004 and 2016, the urbanization rate rose from 55% to 60.2% [22].
Morocco’s climate exhibits a diverse range of characteristics. Along the northern coast, it tends to be temperate, featuring mild winters and hot, dry summers. As one moves further inland, the climate becomes more continental, marked by colder winters and similarly hot, dry summers. In the southern regions, the climate transitions from semi-arid to fully arid as one enters the Sahara Desert [23].
Morocco is characterized by two broad climatic zones: coastal and inland. Temperature variations are relatively small along the Atlantic coast. The northern and central areas have a Mediterranean, moderate, and subtropical climate; however, in the mountains, temperatures can reach as low as −18 °C. The peaks of the Atlas and Rif mountains are covered with snow for most of the year (Figure 1).
From a land use perspective, the Moroccan urban system is often described as highly unbalanced, with a lack of intermediate-sized cities. However, Morocco’s urban structure has changed significantly over the past 50 years, in terms of both in-city impervious surface density and the overall number of cities. The urban agglomerations are not isolated points but are part of a territorial network where some economic logics are at work.

2.2. Data

Within this section, an overview of the dataset employed in this study is provided, encompassing both the products obtained from the Terra Moderate Resolution Imaging Spectroradiometer (MODIS) and the Landsat Operational Land Imager (OLI) instruments.

2.2.1. MODIS Data

The sixth iteration of the Moderate Resolution Imaging Spectroradiometer (MODIS) data product MCD12Q1, which focuses on Land Cover Type, is generated from a combination of data collected by the MODIS instrument onboard the Terra and Aqua satellites. It offers comprehensive global land cover information spanning the years 2001 to 2018. The creation of this product involves supervised classifications applied to the reflectance data gathered by Terra and Aqua MODIS. Subsequently, these supervised classifications undergo additional post-processing, which integrates pre-existing knowledge and observations, to enhance the accuracy and specificity of the identified land cover classes [24].
MODIS vegetation indices, composited over 16 day intervals and various spatial resolutions, offer a reliable basis for comparing canopy greenness consistently across both space and time. This greenness is a composite measure of factors such as leaf area, chlorophyll content, and canopy structure. These vegetation indices are derived from reflectance data that have been adjusted to account for atmospheric influences in the red, near-infrared, and blue wavelengths. One commonly used index is the Normalized Difference Vegetation Index (NDVI), which quantifies the density of vegetation cover on the land [18,25].
The Normalized Difference Vegetation Index (NDVI) is calculated using the following formula:
N D V I = NIR R E D NIR + R E D
where NIR represents near-infrared reflectance and RED represents red reflectance.

2.2.2. Landsat Data

The Impervious Surface Area (ISA) data employed in this study are sourced from the Landsat Global Man-made Impervious Surface (GMIS) dataset. This dataset provides global estimates of the fraction of impervious surfaces, which are derived from the Landsat Global Land Survey (GLS) dataset for the reference year 2010. The GMIS dataset comprises two main components: (1) the overall percentage of impervious cover, and (2) the corresponding uncertainty values assigned to each individual pixel, providing insight into the reliability of the overall impervious cover estimates [26].
These layers are spatially aligned and cover the same geographical area with a resolution of 30 m. This spatial coverage encompasses the entire world, excluding Antarctica and a few small islands. Notably, this dataset stands as one of the pioneering Impervious Surface Area (ISA) datasets that provides insight into the extent of urbanization on a global scale for the year 2010 [26].
This dataset serves a diverse range of users, catering to individuals interested in investigating intricate urban land cover details on a global scale at the full 30 m resolution, as well as modelers seeking to comprehend the climate and environmental ramifications of man-made surfaces on continental and global levels. For instance, it finds relevance in localized modeling studies focused on understanding the impacts of urban areas on energy, water, and carbon cycles, as well as in country-level analyses [22].

2.3. Methods

The approach adopted for this work consists of three phases, (1) the method employed to create the land cover maps, (2) the method of validating these maps, and (3) the description of the generation of biophysical parameters over the study area.
The first and third phases are detailed in [27], but a brief summary is provided in this section.

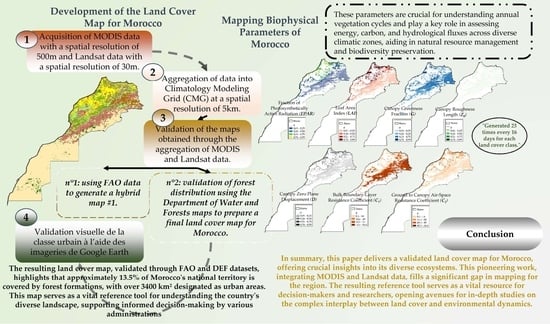
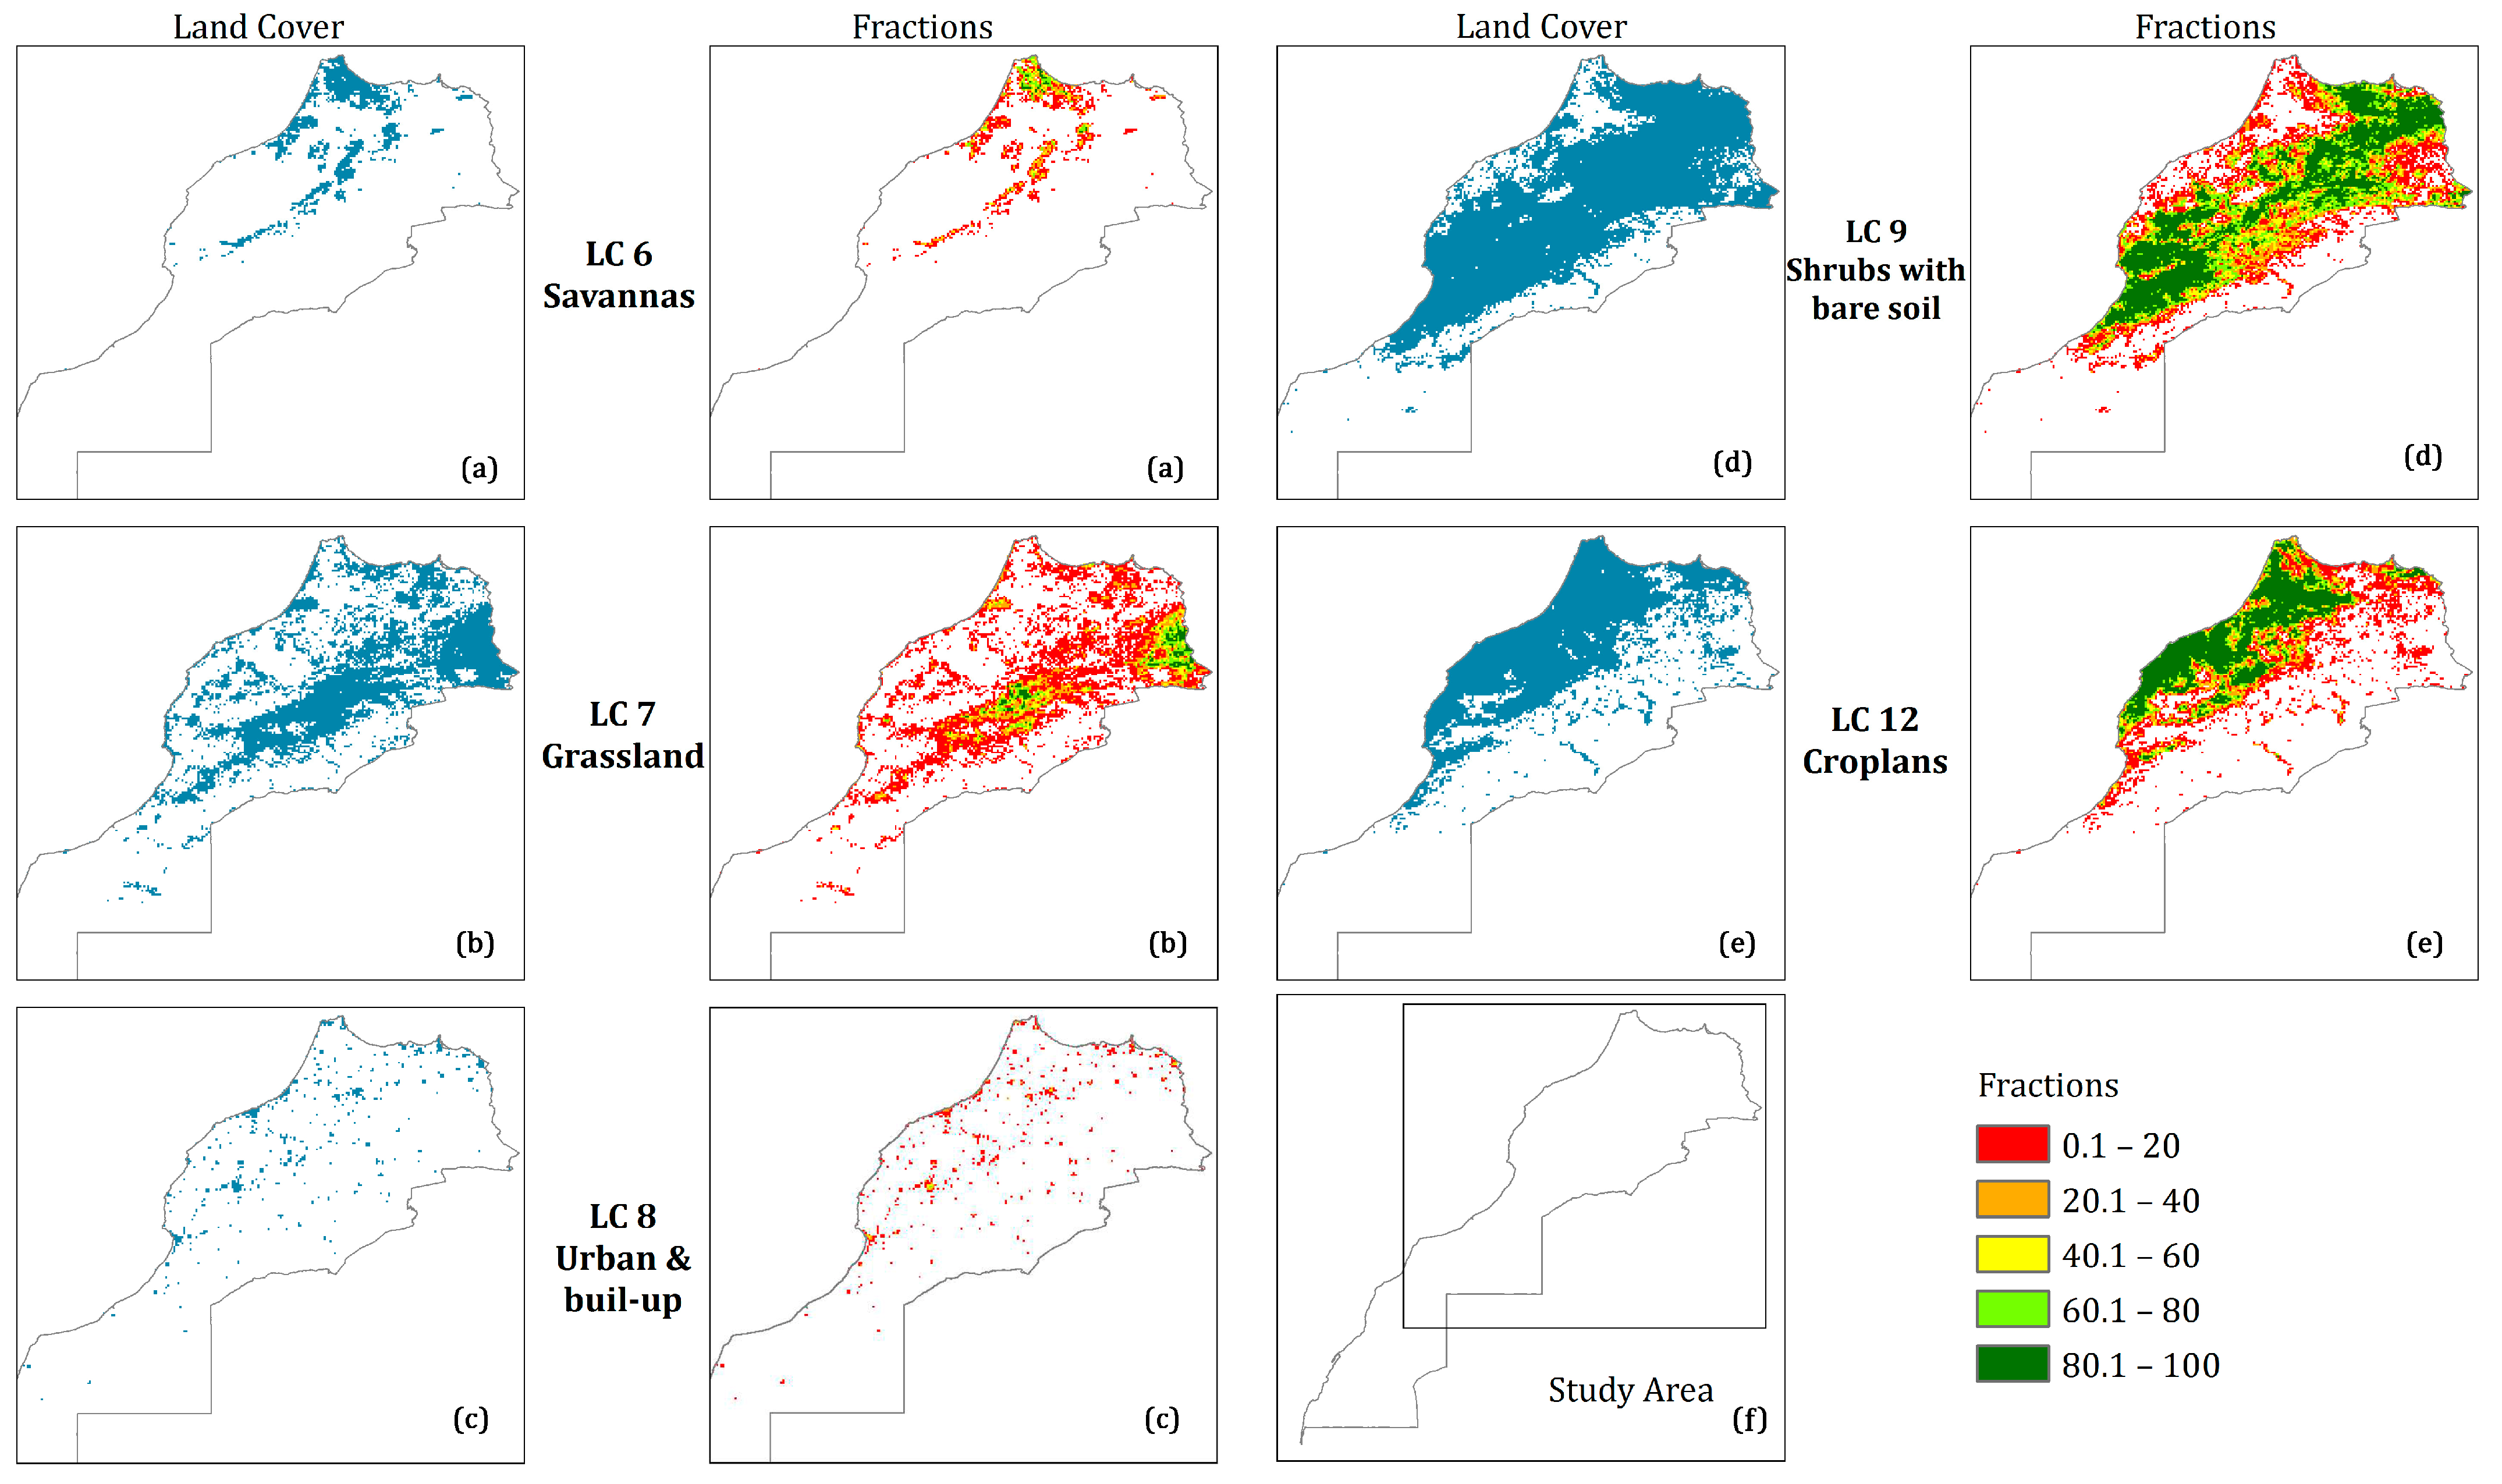
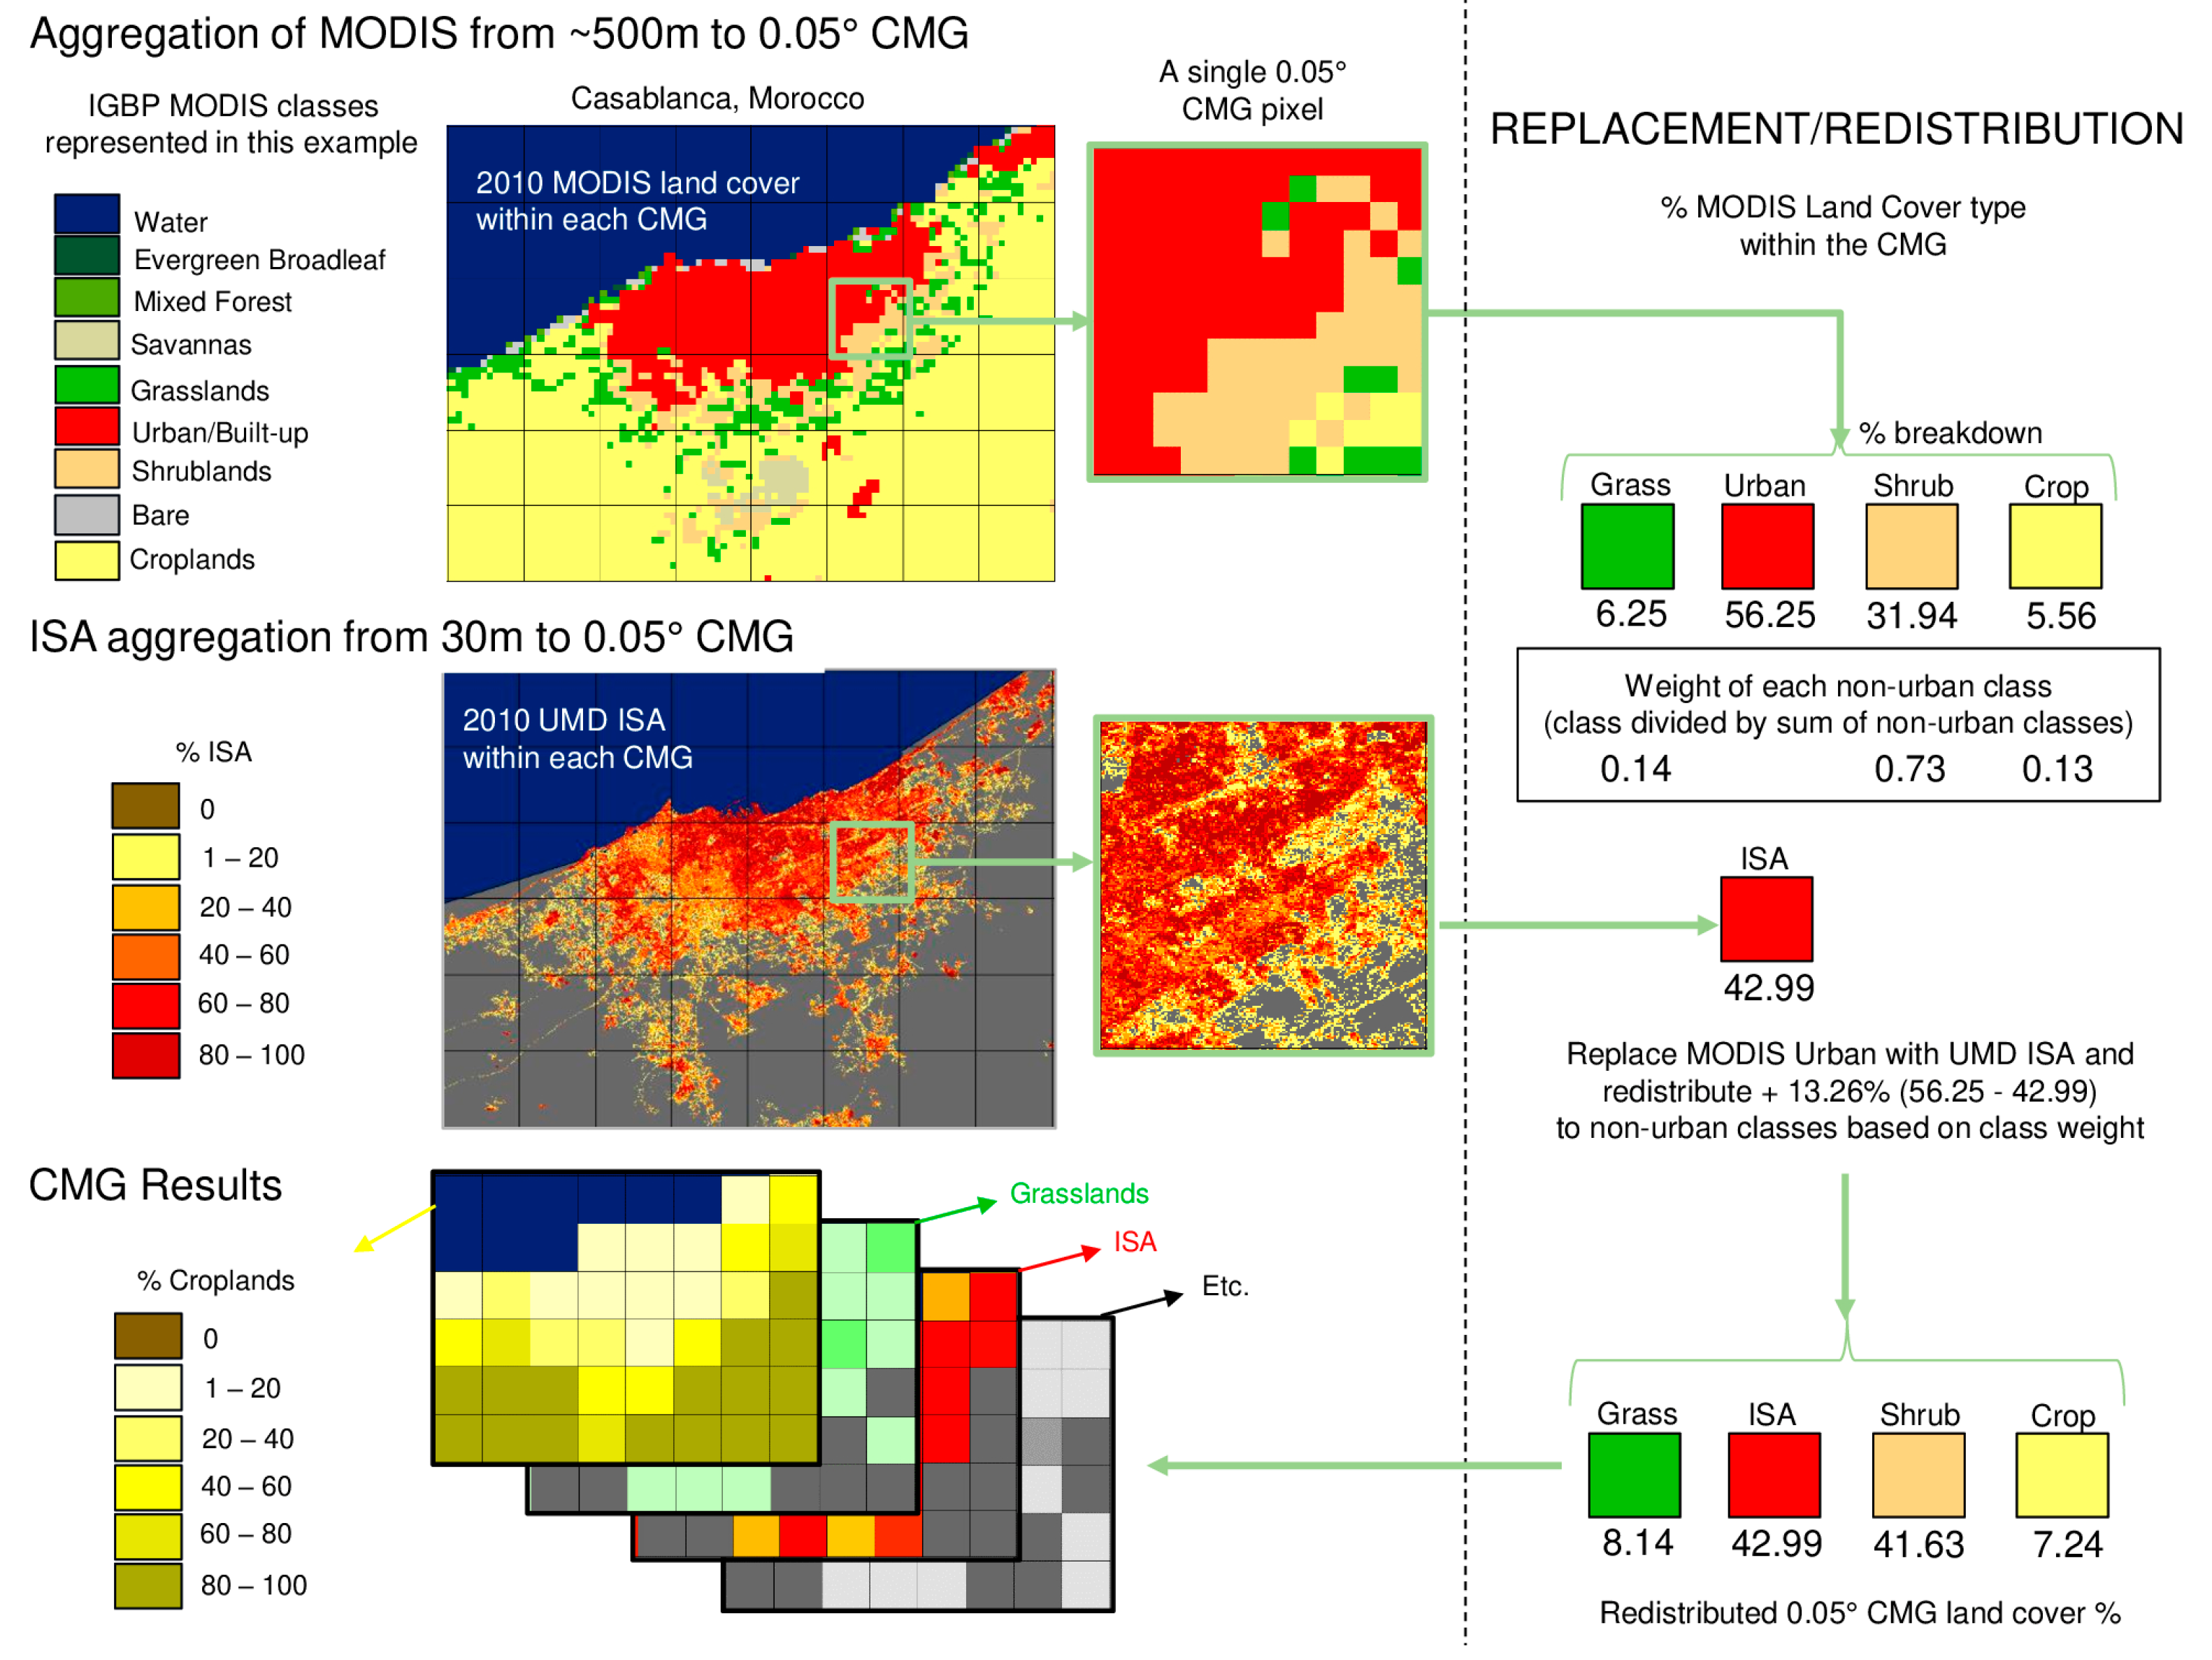
2.3.1. Development of Land-Cover Maps

The land cover map is created through the amalgamation of two datasets: the Landsat-based impervious surface data, which provides a detailed depiction of urban areas at a spatial resolution of 30 m, and the MODIS 500 m land cover map (MCD12Q1) for the year 2010, covering the designated study area (Figure 1).
The data fusion was performed considering the Landsat data as the most accurate and was implemented as follows (Figure 2):
  • The different land cover types were aggregated from MCD12Q1 at 500 m and their fractions in a 0.05° × 0.05° (equivalent to 5 km × 5 km) Climate Modeling Grid (CMG) were obtained.
  • The 30 m × 30 m Landsat ISAs were also aggregated to 0.05° × 0.05° and co-registered in the same CMG.
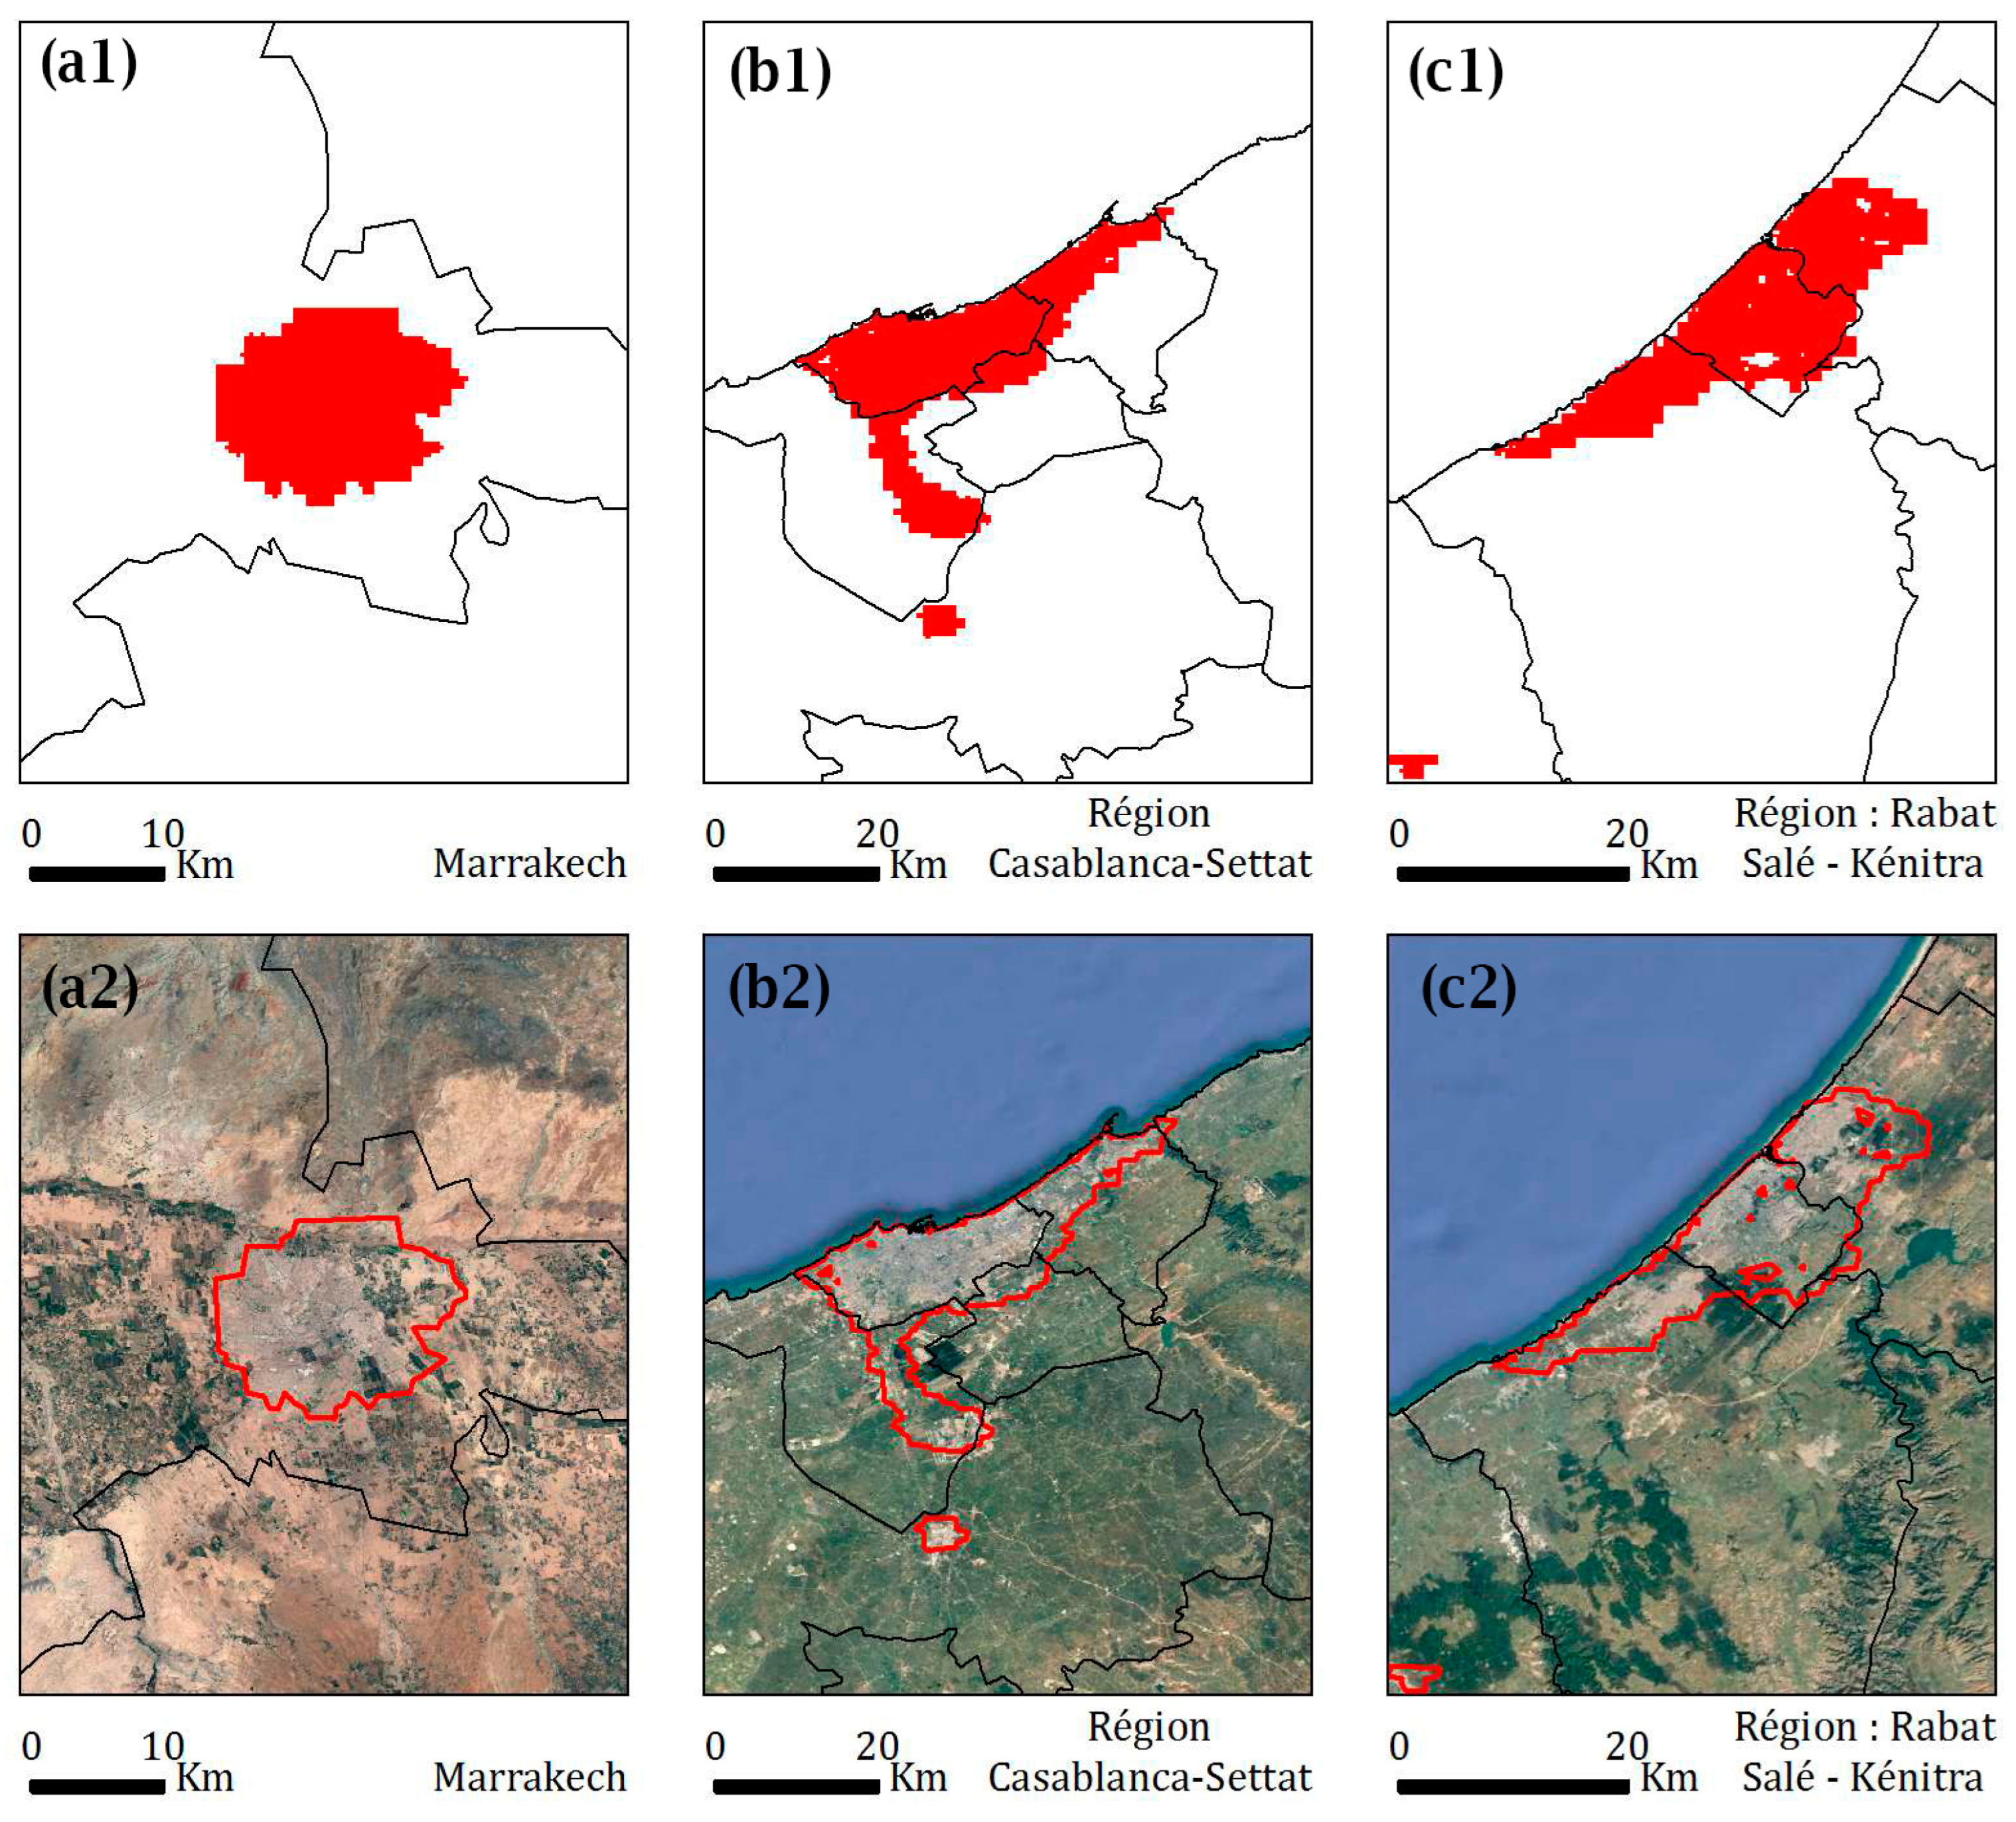
  • These Landsat ISA fractions were imposed into the CMG as a replacement for the urban fraction from MODIS.
When incorporating Landsat Impervious Surface Area (ISA) data into the CMG, any disparities between the Landsat ISA fraction and the MODIS urban fraction were distributed proportionally among the other non-urban land cover types already present within the CMG. This distribution was influenced by the fractions of existing vegetation classes within the CMG. In scenarios where the MODIS urban class was at 100%, any differences were allocated across non-urban land cover types that were imported from neighboring cells. The resultant dataset forms a gridded representation at the CMG level, spanning the entire study area; each CMG encompassing up to 13 distinct land cover classes, as outlined in Table 1.
The land cover map and the fraction of each land cover type resulting from this approach is illustrated in Figure 3 and Figure 4.

2.3.2. Validation of the Land Use Map

In order to provide reliability to the final product, it is necessary to have a verification phase to compare our results with data from other land use observations over the study area.
The verification of the maps was performed in two steps:
  • The first using the maps published by the Food and Agriculture Organization (FAO) [28] and
  • The second using maps published by the Moroccan Department of Water and Forests [29].
It is necessary at this point to note that the nomenclature of the MODIS land cover classification legend is the same as that used in the Simple Biosphere Model (SiB2) of [19] as modified in [30] but with different code numbers. As this work is intended for a modeling study using the SiB2 legend (Table 1), we continue to refer to it as MODIS.
The global land cover data created by the FAO-Land and Water Division is the result of combining various national, regional, and/or sub-national land cover databases. This process generates a series of comprehensive thematic land cover layers, with each pixel nominally measuring 30 m by 30 m. The information in these layers is calculated as a weighted average of land cover data derived from available large-scale datasets.
This database is developed with a spatial resolution of 30 m by 30 m. The methodology employed is built upon the utilization of the Land Cover Classification Legend System (LCCS) and the System of Economic and Environmental Accounting (SEEA). These systems serve as the foundation for harmonizing different land cover legends from global, regional, and national sources, ensuring consistency and compatibility across the dataset.
The primary advantage of this product lies in its capacity to retain and uphold the high-resolution land cover data that are already accessible and in use at the local and national levels.
The main FAO land cover types existing in Morocco are classified to be compared with those obtained from the MODIS data aggregation.
This classification is based on the nomenclature provided by the FAO source file and the fraction of the classes within each CMG, and therefore Table 2 is generated in order to reclassify and provide a new nomenclature corresponding to that of the MODIS classes.
The land cover class correspondence between FAO and MODIS is summarized in Table 2.
The FAO map was first aggregated from 30 m × 30 m to 0.05° × 0.05° to facilitate comparison.
The approach employed to compare the classes of the FAO map and those of the map developed from MODIS and Landsat data (referred to as the MODIS map hereafter) is based on studying the intersection of the same land cover type at each CMG between the two maps, regardless of the fraction, as long as it is greater than zero. For example, at the pixel level, several types of land covers can coexist. A comparative analysis was conducted, examining each land cover type individually between the two maps. The intersection between the LCXX type in the FAO map and the corresponding LCXX type in the MODIS map was explored, considering three possible scenarios:
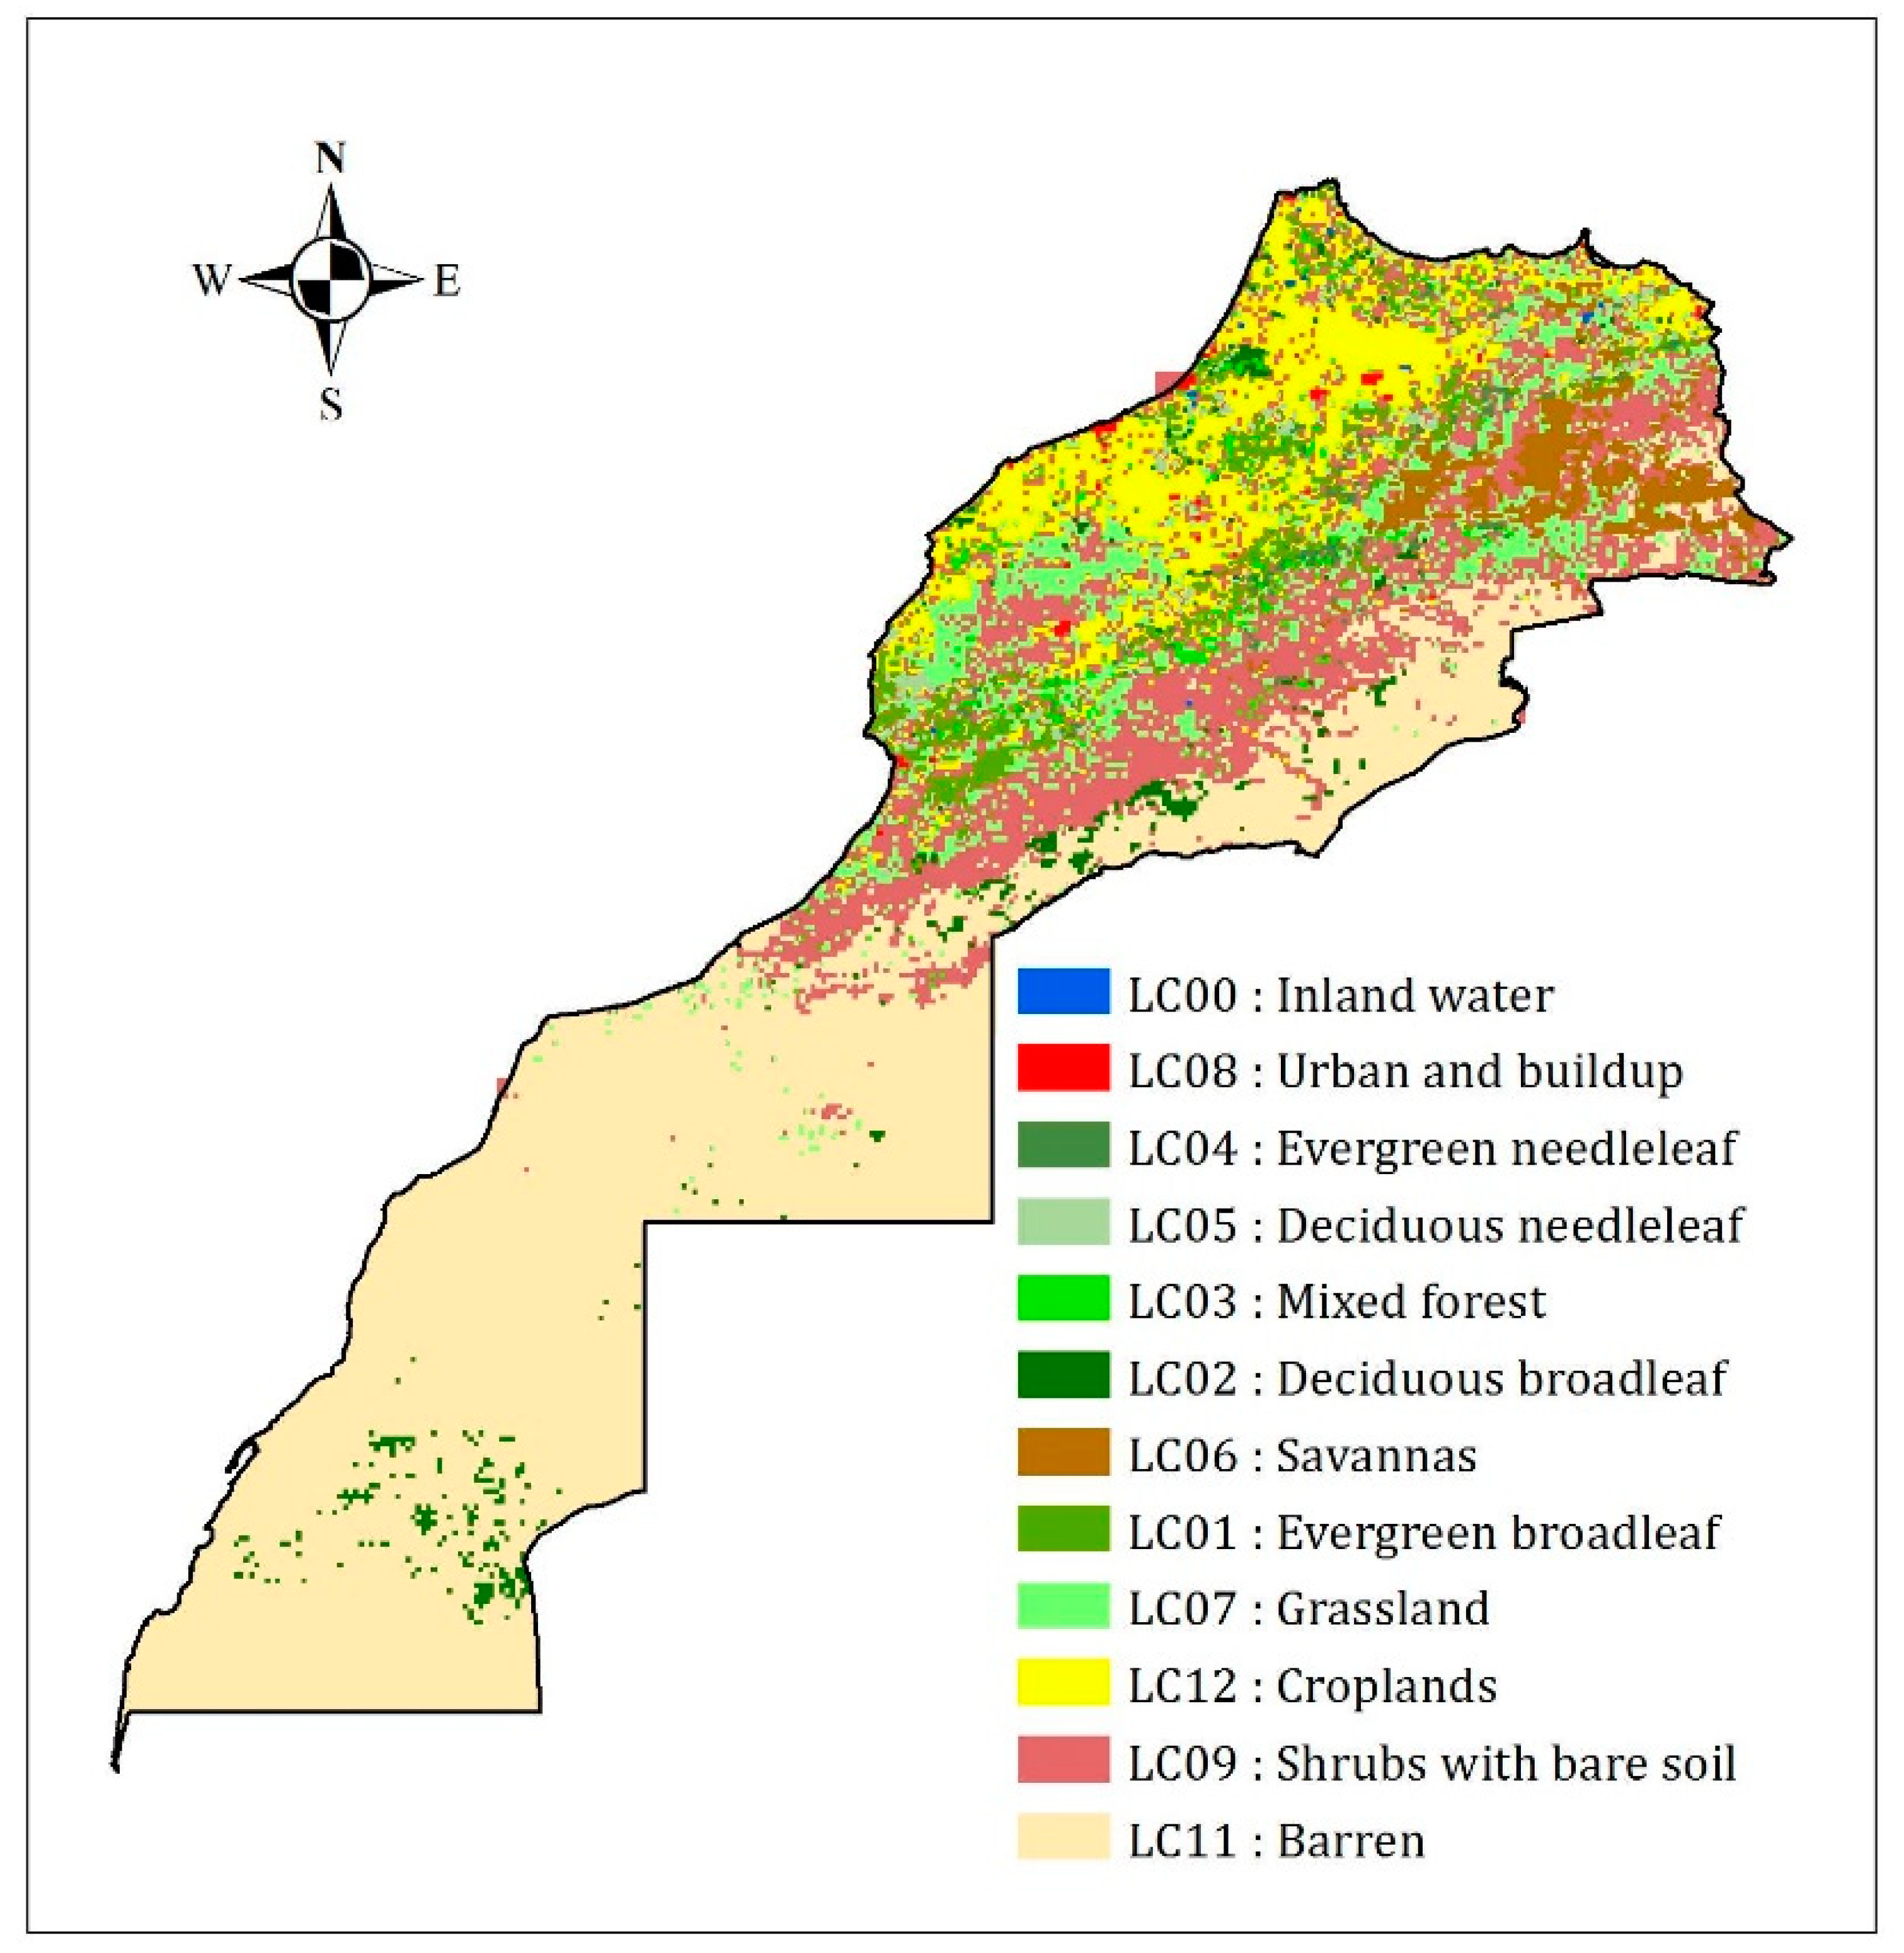
  • If FAO type LCXX and the same MODIS type LCXX exist in the pixel, it is inferred that type LCXX exists at this pixel, and the MODIS classification is confirmed.
  • If the FAO LCXX type exists but the same MODIS LCXX type does not exist in the pixel, it is inferred that the LCXX type exists at the pixel level, and the MODIS classification is invalid.
  • If the FAO type LCXX does not exist, but the MODIS type LCXX exists in the pixel, it is inferred that the LCXX type does not exist at this pixel. In this case, the MODIS classification is invalidated, and the FAO type is substituted for the MODIS type.
The analysis of the intersection between the FAO map and the MODIS map resulted in a hybrid map n°1.
Furthermore, to validate the forest areas, the map of forest species published by the Department of Water and Forests (DEF) [29] was used as a baseline. The intersection of these areas with the forested regions on Hybrid Map n°1 was re-examined using the same 3-step approach detailed above.
For the DEF map, the approach to the reclassification of types differs from that adopted for the FAO map, since the DEF map is provided by species, and therefore it was necessary to classify these species according to their characteristic parameters based on the basic parameters mentioned in [17]. Subsequently, each class is renamed based on the same approach used by the FAO classes and using the same nomenclature.
The forest formations in Morocco exhibit a diverse composition of species, encompassing approximately 9,631,896 hectares, which accounts for approximately 13.5% of the country’s total land area [29]. These forests comprise both natural deciduous tree species such as holm oak, cork oak, and argan trees, as well as coniferous tree species including Atlas cedar, Berber cedar, and various pine species. They are distributed across various bioclimatic stages, ranging from semi-arid to sub-humid to humid regions [29].
The forest species map published by the DEF has an initial resolution of 30 m × 30 m. It has been aggregated to a resolution of 0.05° in order to compare it with the hybrid map n°1 resulting from the comparison of the MODIS classification with that of FAO.
The DEF map includes only a few MODIS type classes: type 0 (Inland water), types 1 to 5 (forest types), and type 6 (savannah) represented by Alpha species (Table 3).
The forest formations occupy 6,212,056 ha or an average 9% of the national territory, generally, the largest part of forests are located on the mountainous massifs of the Rif and Atlas and also at the level of coastal plains, while the Saharan acacias are present in low density in the region of Dakhla [29,31,32].
According to the administrative region’s limits, the distribution of forest areas (excluding Alpha) is as follows: the region of Sous-Massa, is mainly argan and cedar, and that of the Dakhla–Oued-Eddahab, consists of acacia, and have large sparse forest areas not very productive. On the other hand, the northern and central regions of Tangier-Tetouan-Al Hoceima, Fez-Meknes, and Marrakech-Safi are populated with productive stands provided the high potential of forest production in these regions [29,31,32].
The validation is carried out with the help of the confusion matrix which aims to measure the quality of our MODIS classification by comparing it to observations from FAO and DEF pixel by pixel. This validation analysis was performed using the ArcGIS 10.3 software.
To ensure that the urban class map provided by FAO also presents a ground reality, we compared it at its original resolution of 30 m × 30 m with images available on Google Earth (GE).
The approach utilized well-calibrated and validated satellite-based datasets, specifically MODIS and Landsat imagery, known for their reliable land cover classification. Validation was performed by comparing the results with higher-resolution ground observations from two distinct sources: Food and Agriculture Organization (FAO) data and Moroccan Department of Water and Forests (DEF) data. While some discrepancies were noted, it is essential to highlight that this paper presents the first-ever satellite-based land cover classification for Morocco. This map not only distinguishes various land use types but also facilitates the assessment of vegetation phenology variations across different regions and climate zones. Despite the initial challenges and discrepancies, our study offers valuable insights into land cover classification and biophysical parameters for Morocco.
To execute this verification, a confusion matrix was employed. Multiple points within the FAO urban area were randomly selected. Subsequently, the presence of these points within the urban area, as depicted in the Google Earth (GE) imagery, was compared.
The results of the validation analysis are presented in Section 3.

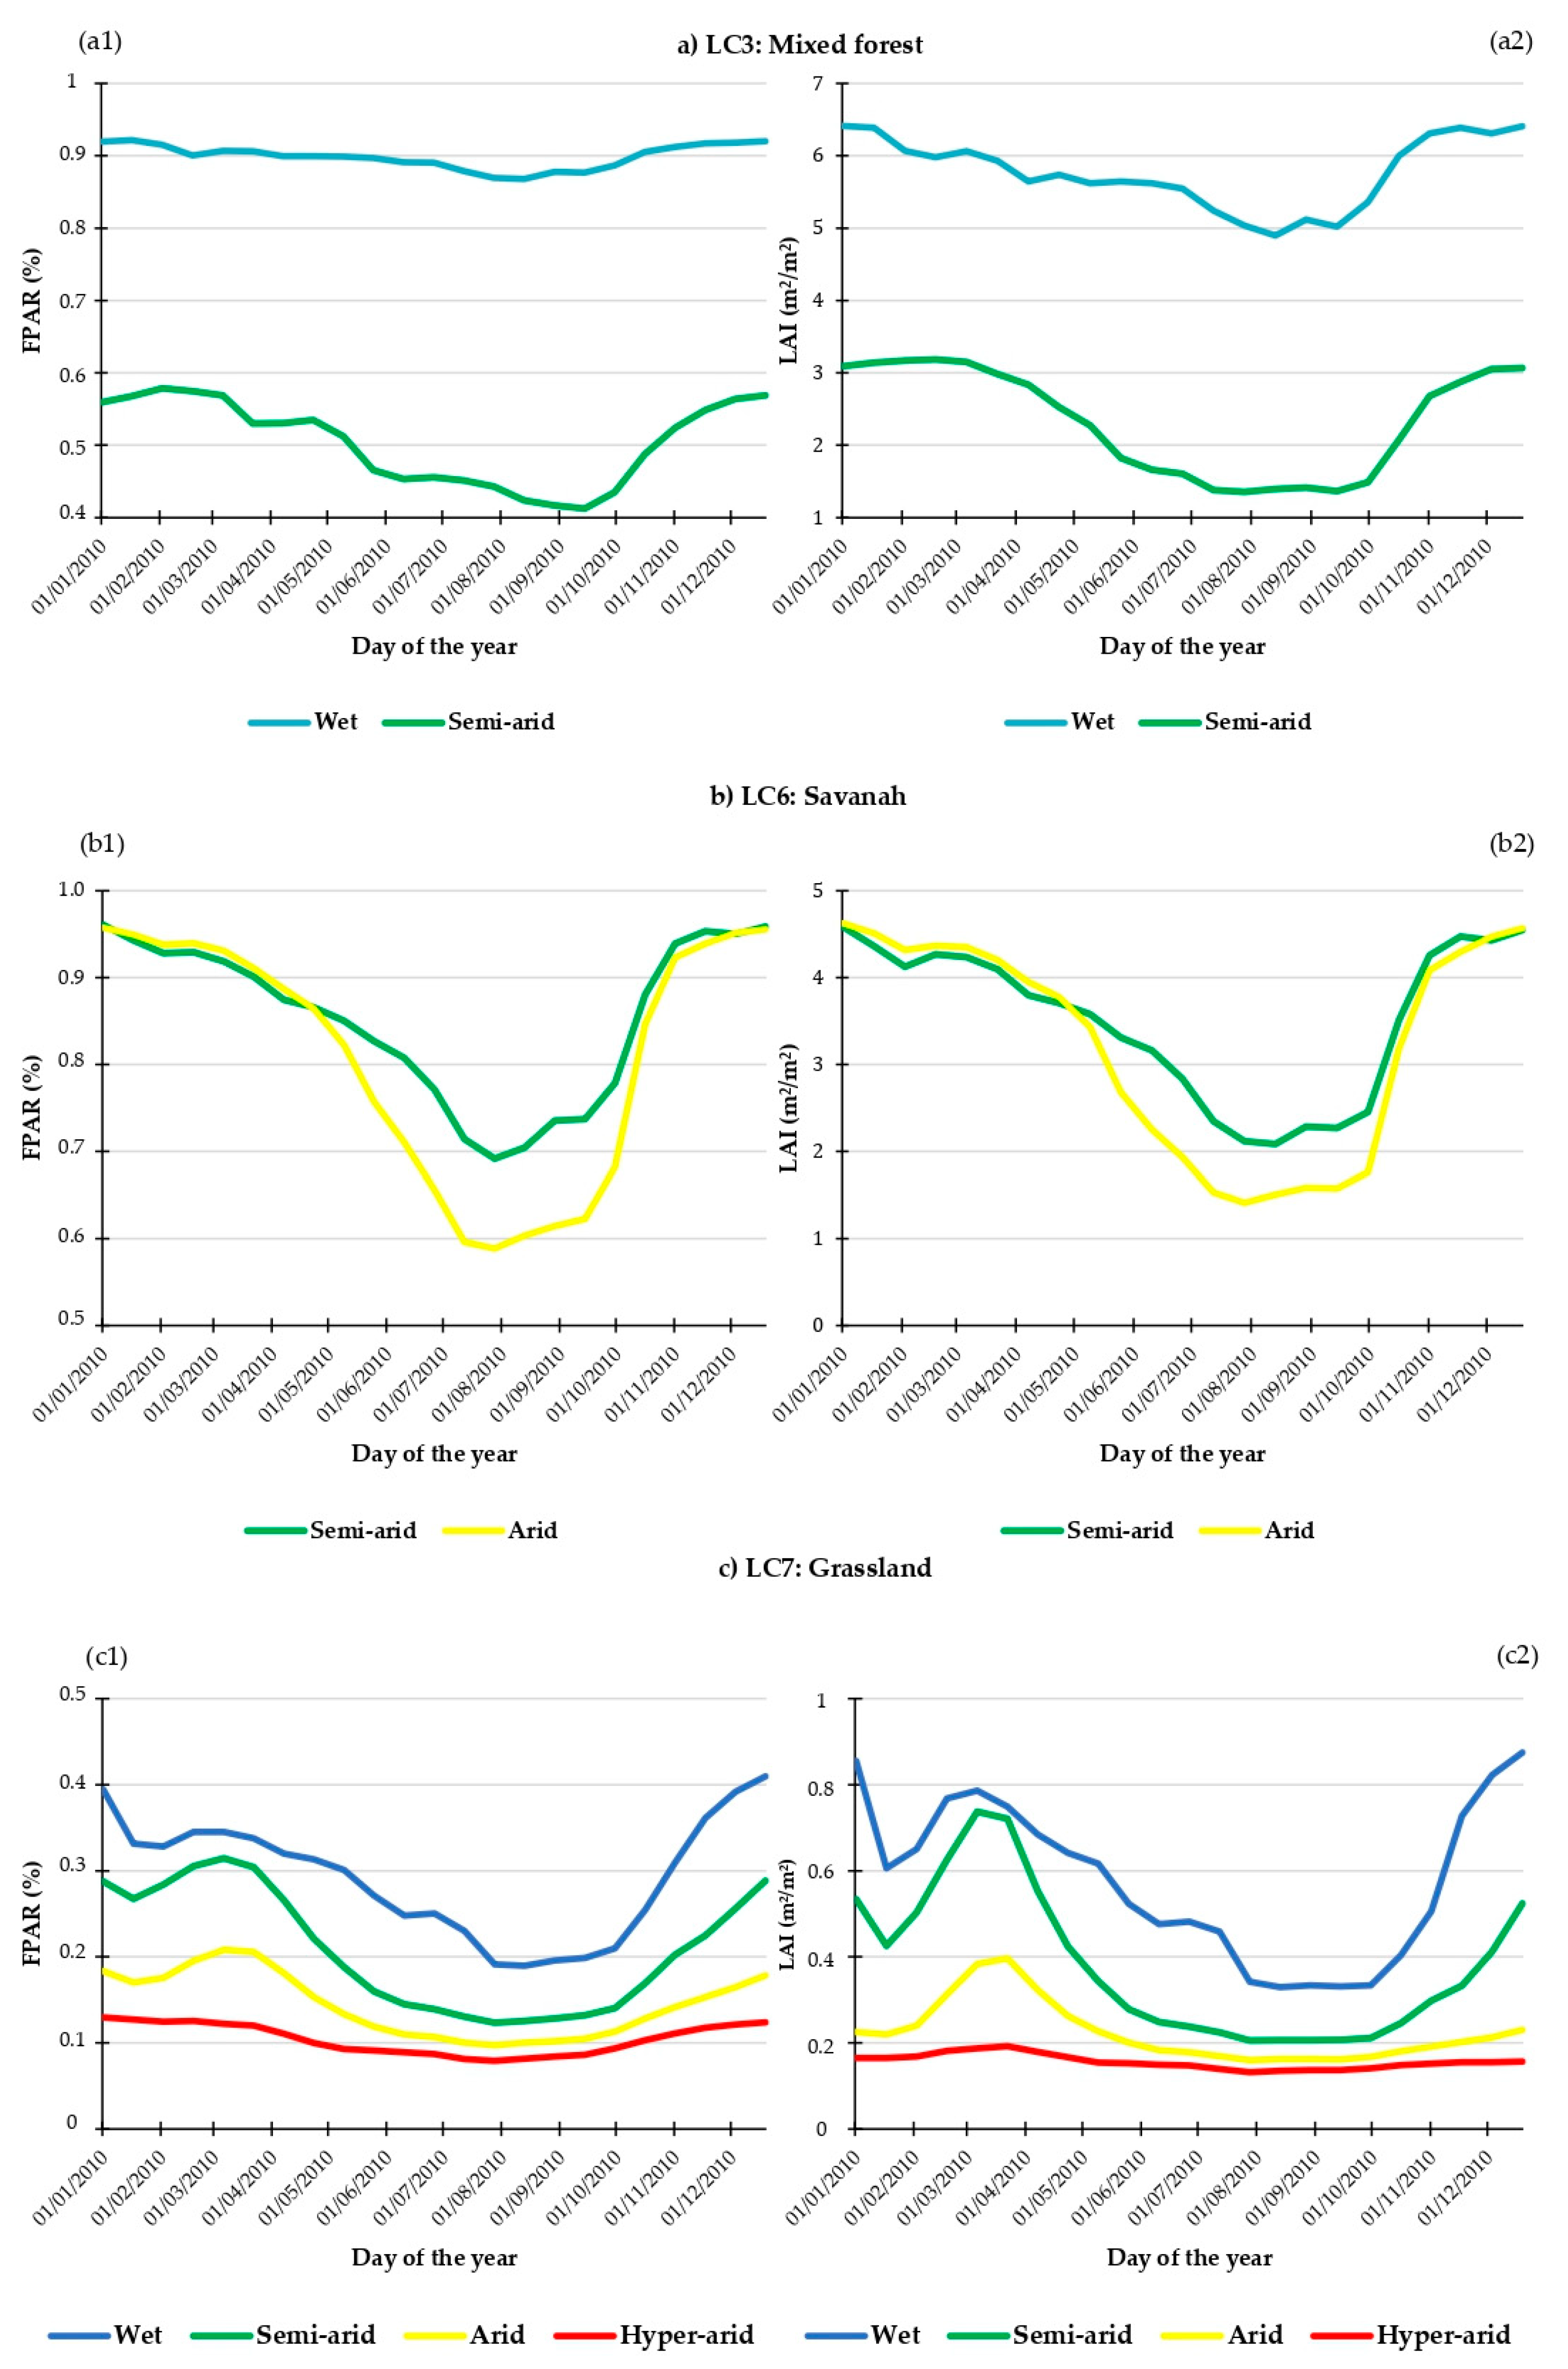
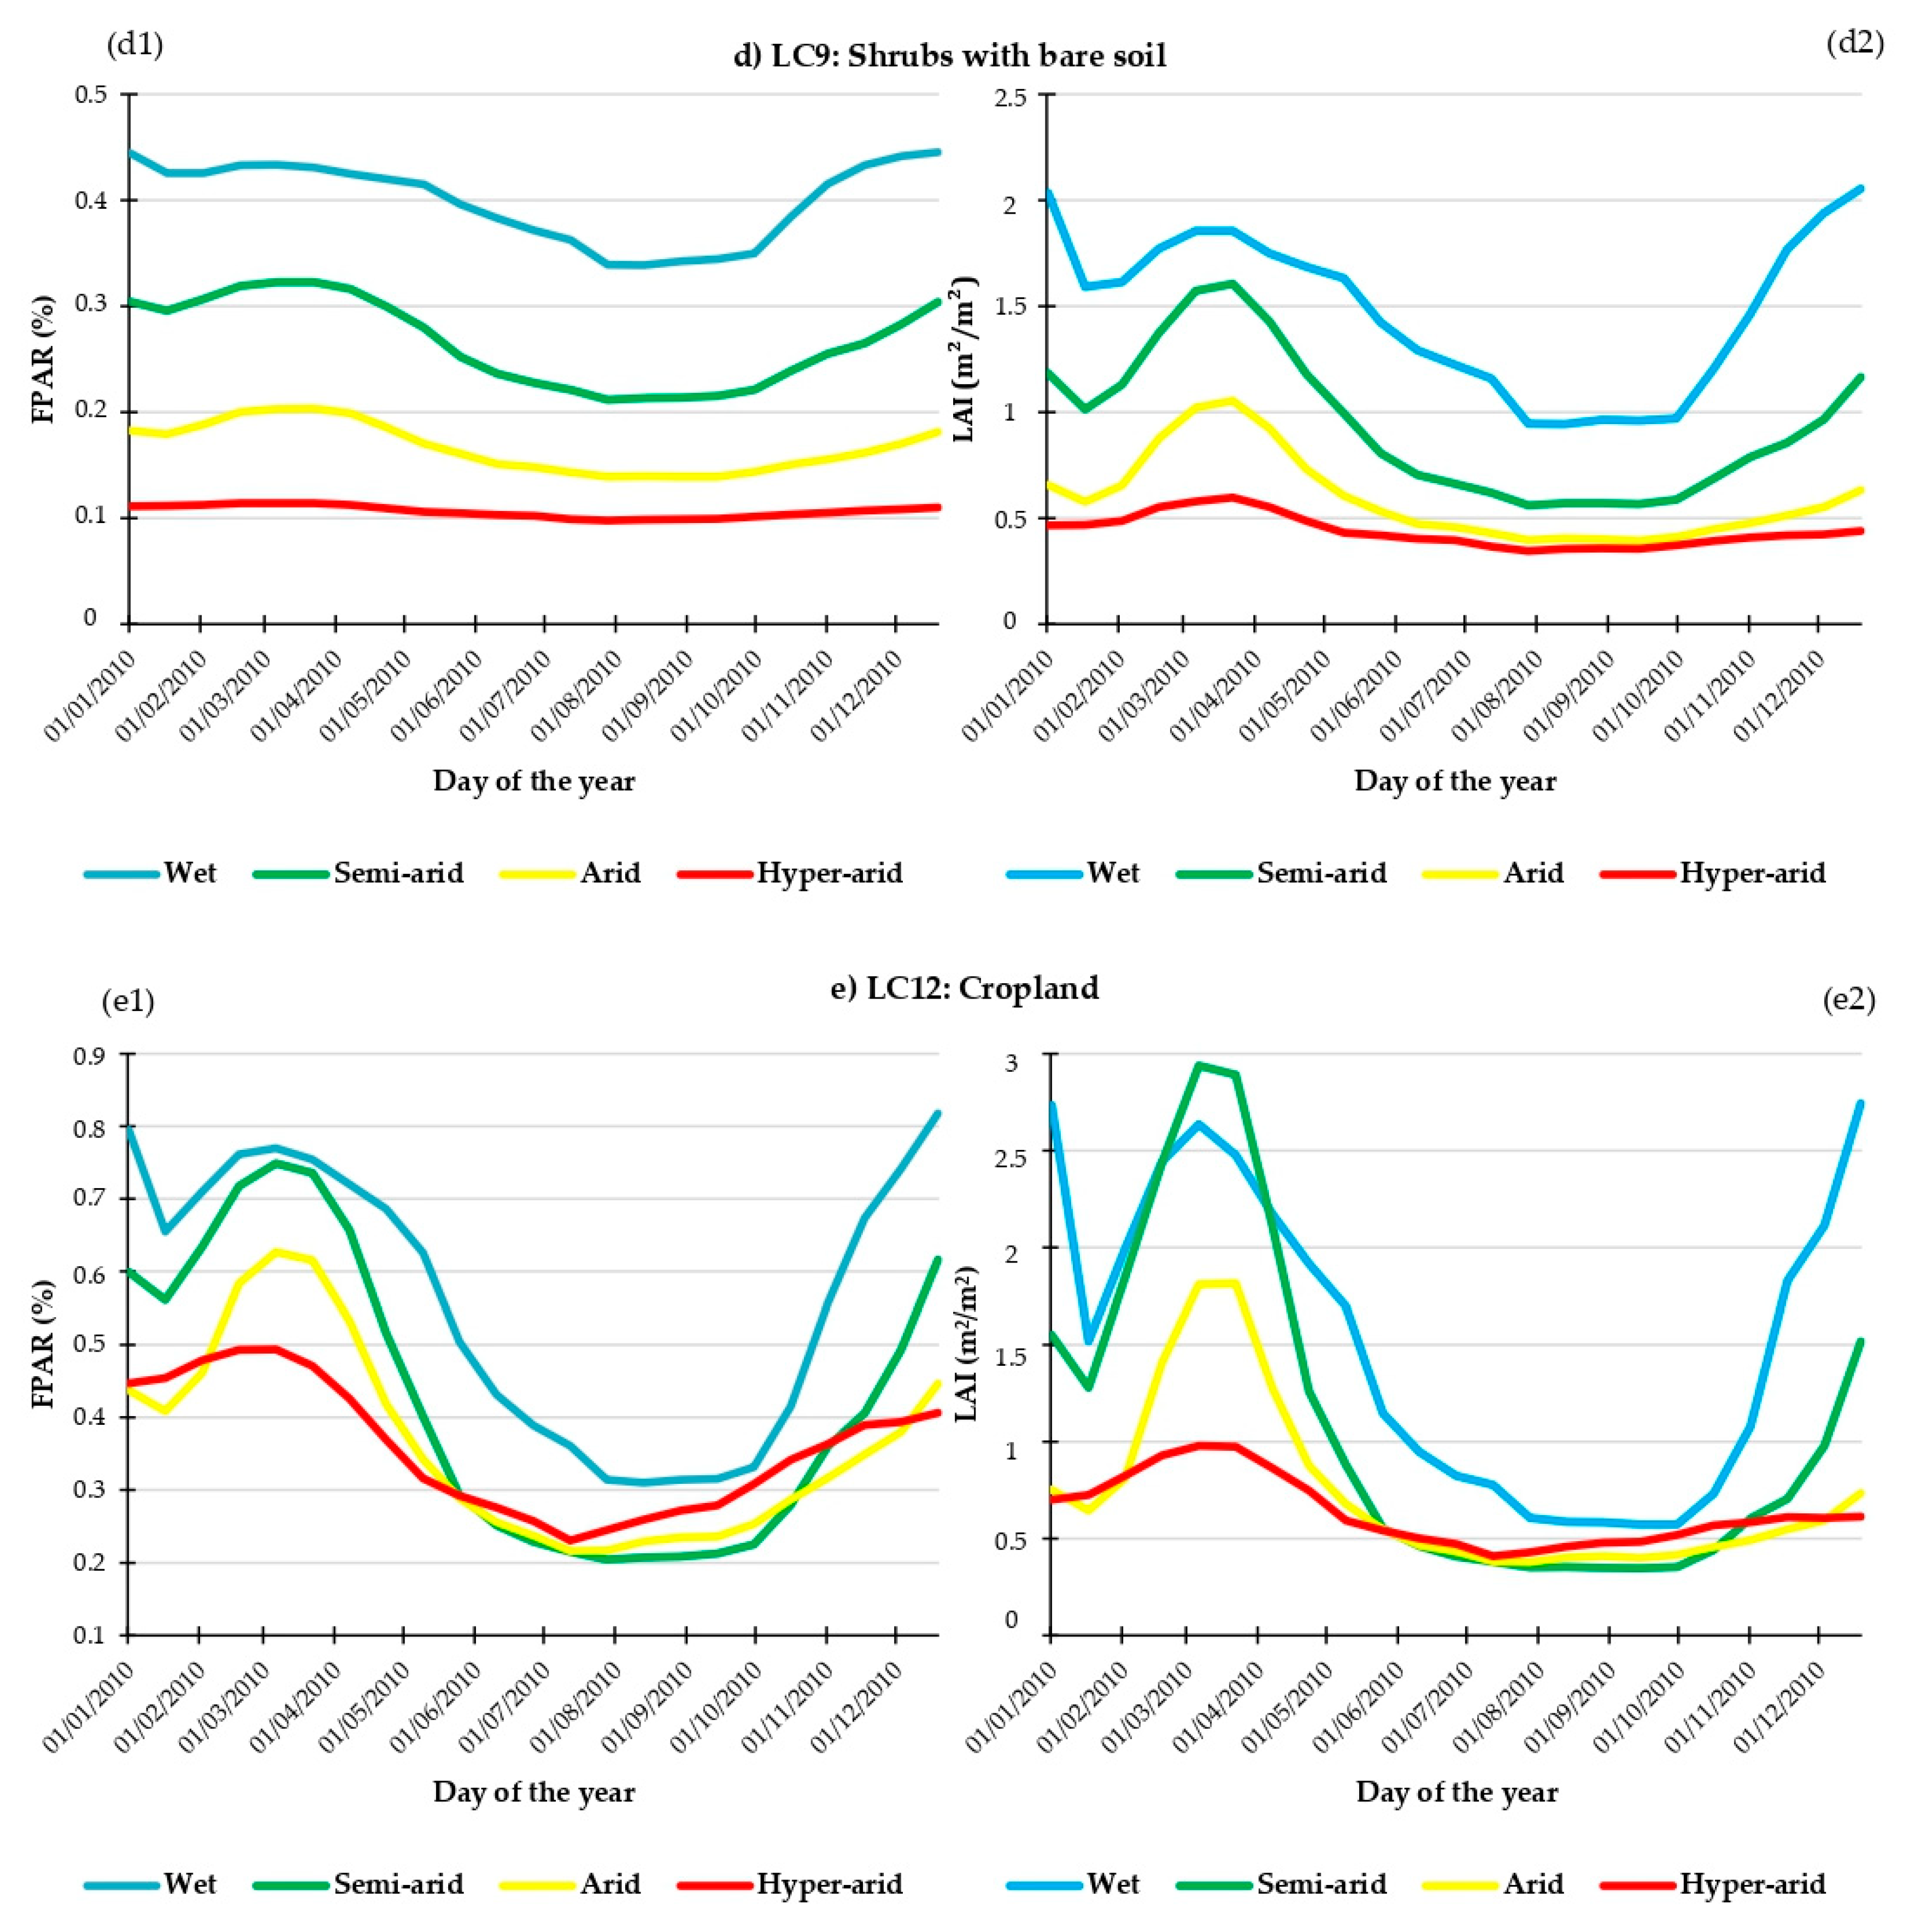
2.3.3. Biophysical Parameters

The procedure employed to produce biophysical parameters for the various vegetation types within the study area is detailed in the work of [17].
These biophysical parameters are calculated directly from the NDVI and land cover types. These parameters define the phenology of the vegetation as well as its physiological behavior.
The calculated biophysical parameters are:
  • Fraction of Photosynthetically Active Radiation «FPAR»: represents the portion of incoming solar radiation absorbed by green vegetation within the visible spectral range of 0.4-0.7 μm. FPAR is a crucial biophysical parameter that plays a significant role in characterizing processes like photosynthesis and the exchange of energy and water between vegetation and the atmosphere. Moreover, it finds extensive applications in monitoring various aspects, including crop growth status, drought conditions, changes in land use, and vegetation dynamics like phenology [33]. Due to its significance, FPAR has been recognized as one of the Essential Climate Variables (ECV) by both the Global Terrestrial Observing System (GTOS) and the Global Climate Observing System (GCOS) [34].
    Satellite observation stands out as the sole method capable of providing FPAR data with spatiotemporal coverage on both regional and global scales. Numerous studies have underscored the notion that an increasing proportion of diffuse radiation can enhance the efficiency of light utilization [35,36,37], even though the overall photosynthetically active radiation reaching the canopy top may have decreased. In various regions around the world, recent research has demonstrated a trend of diminishing total radiation alongside an increase in the fraction of diffuse radiation. For instance, Zhu et al. [38] reported a substantial decrease in total radiation over the past five decades in China. This finding holds significant importance for global climate change investigations, particularly concerning atmospheric, water, and vegetation cycles, and has a direct impact on the accuracy of carbon budget estimations [39,40,41].
    The Fraction of Absorbed Photosynthetically Active Radiation (FPAR) is calculated using the SiB2 model, which involves several parameters and mathematical equations to estimate the amount of incoming photosynthetically active radiation absorbed by vegetation. The specific formula used for FPAR calculation is as follows:
    FPAR = FPAR max FPAR min SR i max SR i min SR SR i min + FPAR min
    where the vegetation index by quotient SR:
    SR = NIR R = 1 + NDVI 1 NDVI
    And:
    FPAR max = 0.95 ;
    FPAR min = 0.001 ;
    SR i max : the SR value corresponding to the percentile 98% of the NDVI for vegetation type i;
    SR i min : the SR value corresponding to the percentile 5% of the NDVI for vegetation type i.
  • Leaf Area Index «LAI»: is a measure that quantifies the extent of leaf area present within an ecosystem. It holds significant importance in various ecological processes, including photosynthesis, respiration, rainfall interception [42,43,44], as well as calculations related to albedo and surface roughness. LAI, being a fundamental characteristic of vegetation, has been recognized as a pivotal climate variable within the realm of global climate change research [45].
  • Canopy Greenness Fraction «G»: Represents the proportion of soil that is covered by green vegetation. In practical terms, it serves as a measure of the spatial coverage of vegetation. One notable advantage of using this fraction is that it is not influenced by the direction of lighting and is highly responsive to the quantity of vegetation present. Due to these characteristics, the fraction G is a promising alternative to traditional vegetation indices for monitoring ecosystems [46].
  • Canopy Roughness Length: Denoted as Z0, is a critical parameter employed in numerical models to characterize surface roughness. This parameter exerts influence over the strength of mechanical turbulence and the exchanges of turbulent properties above the surface. Z0 is determined by considering the frontal area of the average surface element (facing the wind) divided by the ground area it occupies. In the context of sub-grid scale vertical heat exchange, which occurs through turbulent eddies, this can be expressed as the vertical gradient of potential temperature multiplied by the roughness length. A shorter roughness length signifies reduced exchange between the Earth’s surface and the atmosphere. However, it also corresponds to a more robust near-surface wind flow, particularly at the standard height of 10 m above ground level [47].
  • Canopy Zero Plane Displacement: In turbulent airflow over rough surfaces with significant roughness elements, a height scale represents a specific vertical distance that characterizes the average level of momentum transfer between the moving air and the roughness elements. In conditions of neutral stability, the logarithmic wind profile assumes a linear shape only when the zero-plane displacement length adjusts the vertical axis. Various formulas are available to establish a connection between this height scale and the geometric attributes of the roughness elements, such as silhouette spacing and area. Tables containing precomputed values for different surface types can be found in many micro-meteorological references, such as [48]. These tables provide valuable data for assessing and modeling turbulent flows over diverse terrains and surfaces.
  • Bulk Boundary-Layer Resistance Coefficient and the Ground to Canopy Air-Space Resistance Coefficient: In the article [49], the significance of boundary resistance coefficient and ground to canopy air space resistance coefficient in energy efficiency is discussed in detail. The authors suggest that the boundary resistance coefficient is a measure of the resistance to air flow between two surfaces and is important in determining the energy efficiency of a building. Similarly, the ground to canopy air space resistance coefficient is the resistance to air flow between the surface and the canopy of a building and impacts the energy efficiency of the building. As such, it is clear that understanding the significance of boundary resistance coefficient and ground to canopy air space resistance coefficient is essential in order to maximize energy efficiency.
    In 2008, DJ Sailor published a study in the journal Elsevier on energy and buildings. This study explored the advantages and disadvantages of two different thermal resistance coefficients, boundary resistance coefficient and ground to canopy air space resistance coefficient. The boundary resistance coefficient is a measure of the amount of heat that is transferred between two objects or layers, such as building walls or natural surfaces [50].
    In a 2015 study conducted by V Kapsalis and D Karamanis of Energy and Buildings, the impact of boundary and ground to canopy air space resistance coefficients on heat transfer was explored. The authors used a two-dimensional numerical model to calculate the convective heat exchange between the canopy and the ground, as well as the air temperature near the ground. The study found that the boundary and ground to canopy air space resistance coefficients had a significant influence on the heat transfer process. Specifically, the boundary resistance coefficient had a stronger influence on the heat transfer than the ground to canopy air space resistance coefficient. This was attributed to the fact that the boundary resistance coefficient had a higher impact on the air temperature near the ground, which in turn had an effect on the heat transfer process. The results of this study provide valuable insight into the impact of boundary and ground to canopy air space resistance coefficients on heat transfer, which can be used to improve building design and energy efficiency [51].
    The boundary resistance coefficient and the ground to canopy air space resistance coefficient are two closely related parameters that together can provide important insights into the performance of a provided air flow system. By determining the values of these coefficients, diligent researchers can identify potential problems in the design of any air flow system, leading to better designs and more reliable systems. The understanding and application of boundary resistance and ground to canopy air space resistance coefficients is therefore essential for any researcher delving into the related field of air flow systems [51].
The FPAR exhibits a linear relationship with the NDVI, as established in [17]. FPAR is directly employed in the computation of photosynthesis, a crucial process that impacts factors such as stomatal conductance and the fluxes of carbon assimilation and water vapor in ecosystems. This relationship underscores the significant role FPAR plays in understanding and modeling vegetation dynamics and its influence on various environmental processes.
The Leaf Area Index (LAI) exhibits a non-linear relationship with the Fraction of Photosynthetically Active Radiation (FPAR). The calculation of LAI differs for broadleaf and needle crops, and when both types are present, it utilizes a linear mixed model, as outlined in [17]. LAI serves as a fundamental biophysical parameter that determines the quantity of light intercepted by the canopy, which is essential for photosynthesis. In optimal growth conditions, the maximum LAI value for a closed canopy is associated with the lower canopy leaves’ capacity to intercept sufficient light to sustain a positive carbon balance. This parameter plays a critical role in various components of energy and water balances, including albedo, transpiration, and conductance.
The green fraction (G) plays a role in adjusting the Leaf Area Index (LAI) over different time periods and influences the balance between green and non-green (dead) vegetation within the canopy [19].
Additionally, parameters like Z0, D, C1, and C2 are integral in the aerodynamic calculations of turbulence fluxes within land surface models. These parameters are estimated through functional relationships that rely on satellite-derived data, properties that vary with land cover, and standard aerodynamic principles. They are crucial for accurately modeling and simulating processes related to heat, moisture, and momentum exchange between the Earth’s surface and the atmosphere in land surface models [19].
While acknowledging the limitations and uncertainties associated with the surface processes algorithm in generating biophysical parameters, it is important to emphasize its demonstrated reliability. Although the surface processes algorithm used relies on input data from remote sensing sources MODIS and ISA, which may have inherent limitations due to sensor calibration issues, atmospheric correction errors, and cloud contamination, this study has showcased its competence in diverse regions. For instance, the surface processes algorithm used relies on input data from remote sensing sources MODIS and ISA, which may have inherent has been effectively employed in Marrakech, a city situated within the study region of Morocco, and in Oran, Algeria, which shares comparable climatic conditions with Morocco. These successful applications underscore the algorithm’s adaptability and robustness. Furthermore, the concerns pertaining to various vegetation types and the quality of input data have been diligently addressed through an extensive data validation process. This process integrates ground truth data from the Food and Agriculture Organization (FAO), the Moroccan Department of Water and Forests (DEF), and Google Earth images, resulting in a high occurrence rate and significantly enhanced data reliability. This rigorous validation framework has further bolstered the credibility of the biophysical parameters obtained using this surface processes algorithm.

3. Results & Discussion

3.1. Land Cover Map

To generate a final land cover map for Morocco, the intersection of the MODIS land cover with the FAO map was used to produce a hybrid-1 map. This resulting hybrid-1 map was then further confronted to the DEF forest distribution to validate its forest classification resulting in hybrid-2 map. Finally, the urban area in hybrid-2 map was validated using Google Earth imagery.
The result of the validation of the hybrid-1 showed a correspondence of more than 80% between the two original maps (Table 4). Most of the land cover classes, from type 2 to type 8 were validated at over 90% accuracy. However, the desert and cropland classes have a lesser accuracy but more than 87%. The least accurate classification was that of bare lands. Indeed, bare lands have reflectance characteristics close to those of artificial surfaces and often are confused by the classification algorithms. Nevertheless, the urban class was further discriminated using Google Earth imagery.
The second validation effort concerns the intersection between the first hybrid map (hybrid-1) and the DEF map, resulting in a hybrid-2 map. A statistical analysis was performed on this map based on the number of pixels with the same label in both maps, and the results are shown in (Table 5).
The final step consisted of comparing hybrid-2 with GE imagery. Figure 5 shows a comparison of the hybrid-2 urban class and the GE images, this comparison was performed by creating contours on the hybrid-2 urban area and overlaying them over GE images. The verification was performed by superposition between the two polygons (hybrid-2) urban class and GE urban class, and shows a good agreement. However, one needs to keep in mind that the GE map is for 2021 while our data are for 2010. Moreover, ancillary information suggests that the substantial differences between GE and hybrid-2 urban areas are primarily attributed to variations in their respective time periods.
The final land cover map is shown in Figure 6.
The final land cover map therefore includes MODIS forest classes consistent with those of FAO and Water and Forests, in which the short vegetation class (Alpha) was imposed as ground truth and assigned to type 6 because of its morphological characteristics [52,53,54] which are comparable with the characteristics described in [17] which provides the different morphological, optical, and physiological characteristics of this vegetation type.
Also, the examination of this map reveals that about 96,320 km² (including more than 30,000 km² of alfatiere layers-savannahs) that is to say a rate of 13.5% of the national territory is occupied by forest formations, which are distributed largely on the mountains of Atlas, Rif, in the vicinity of the region of Rabat–Salé represented by the forest of Maâmoura and also in the south of Morocco.
In addition, grasslands are distributed over more than 16% of the study area generally in the north–east and west of Morocco, urban areas occupy almost 3400 km² distinguished by large cities such as (Casablanca, Rabat, Sale, Fez, Marrakech, Agadir, Oujda, and others). The shrubby areas with bare land are distributed in the major part of the country also for the bare land which represents the largest fraction of land occupation and which extends over the whole part of the Sahara and at the level of the east of the country, on the other hand the agricultural areas occupy almost 20% of the national territory and extend largely in the interior plains and on the Atlantic coast north–west of the country.
The study of land use is a privileged entry in the evaluation of the interactions between man and his environment, so the information derived from the analysis of land use is always useful in identifying appropriate strategies to better manage the state of land use. To this end, our land use map offers interested actors a co-constructed and evolving reference tool to better understand the Moroccan territory, and proves useful in obtaining an overview of how our study area is organized in order to facilitate decision-making by the different administrations.
Currently, there are no land cover maps of this type and scale available for Morocco, and several biophysical parameters corresponding to each type of land cover have been generated, namely FPAR, LAI, NDVI, etc., which will be used later in other studies, such as the study of the relationship between land cover and surface climate by applying models to the ground over the entire Moroccan territory.

3.2. Biophysical Parameters

As stated earlier, the land cover map is required for estimating the biophysical parameters using remote sensing. Here, a satellite-derived map adapted to the study region has been used and validated with ground observations from the FAO and the DEF.
For each of the land cover classes within the CMG, seven biophysical parameters were computed using the final land cover map and the 16 day composite NDVI series for the year 2010 to estimate the biophysical parameters, as detailed in Section 2.
We used the simple biosphere model (SiB2) formulation [17,19] to calculate, map and geo-reference the biophysical parameters to each land cover type.
Figure 7 shows the annual cycle of the biophysical parameters (LAI and FPAR) obtained from MODIS for the classes (mixed forest (LC3), savanna (LC6), grassland (LC7), shrubland (LC9), and cropland (LC12)).
For the mixed forest class, the leaf area index varies little over the year with a minimum value of 4.89 m 2 . m 2 and a maximum value of 6.41 m 2 . m 2 during the growing season in the wetland; however, the FPAR parameter remains almost constant throughout the year. The absolute maximum LAI value is 8.0 m 2 . m 2 .
However, the two parameters FPAR and LAI of class 6 show almost the same pattern as those of the mixed forest class with a minimum value of order 2.08 m 2 . m 2 for LAI and 0.69 for FPAR in the semi-arid zone, and in the arid zone the values show a minimum of 1.41 m 2 . m 2 for LAI and 0.59 for FPAR.
The LAI of the LC7 grassland class ranges from 0.13 m 2 . m 2 to 0.87 m 2 . m 2 and that FPAR is between 0.07 and 0.41 for the same land use class. For type LC9, the LAI varies from 0.34 m 2 . m 2 to 2.05 m 2 . m 2 and that FPAR varies from 0.09 to 0.45 which is comparable to the class 12 intervals with an LAI between 0.34 m 2 . m 2 and 2.94 m 2 . m 2 and an FPAR ranging from 0.21 to 0.82.
The annual cycle of vegetation phenology, as deduced from remote sensing data, is marked by four pivotal transition dates that delineate significant phases in the dynamics of vegetation over the course of a year: (1) Greening, (2) Maturity, (3) and Senescence and Dormancy [55,56,57].
In this research, phenological changes in the greenness of the prevailing natural vegetation were deduced by examining MODIS satellite imagery. Our primary focus during the initial analysis was on two significant events: greening, which signifies the emergence and growth of green vegetation; and senescence, which represents the decline and loss of green vegetation within the observed area.
While utilizing MODIS daily surface reflectance data can enhance the temporal resolution for analysis, providing insights at a daily time step, it is important to note that the standard temporal resolution of MODIS composites, which occur at 16 day intervals, is determined by the frequency of data gaps due to cloud cover in various regions worldwide. Consequently, this 16 day interval does not provide the accuracy required to precisely characterize swift events such as the emergence and rapid development of leaves during the spring season [58,59].
The graphs in Figure 7 reveal that for LC3 (mixed forests), the biophysical parameters NDVI, FPAR, and LAI remain constant during all 23 periods of the year. This stability can be attributed to evergreen trees characterized by consistently high NDVI, resulting in maximum FPAR and LAI values.
For the savannahs located in eastern Morocco, the beginning of the growth phase was between the beginning and the middle of October and ends in the beginning of June. The cycles of grassland and agriculture (LC7 and LC12 respectively) have almost the same paces during the whole year, where the growth phase starts in the middle of September or even beginning of October and ends around the beginning of May.
Moving on to the comparison of the variation in the biophysical parameters of the two land use classes (agriculture and forest) in to the regional climate (humid, semi-arid, arid, and hyper-arid [60]) illustrated in Figure 7. The analysis indicates that mixed forests exhibit two distinct FPAR/LAI cycles. It is clear that regions with wetter climates consistently show significantly higher values compared with semi-arid areas.
Regarding the agriculture class, it is evident that FPAR and LAI cycles exhibit the highest values in wetland regions, followed by semi-arid and arid areas, while hyper-arid areas consistently have the lowest values.
The duration of the growing season stands as a crucial factor influencing plant growth and distribution. A lengthened growing season has the potential to enhance plant productivity and open up new opportunities for planting in both the agricultural and forestry sectors.
Moving from wetlands with lower temperatures to dry lands with higher temperatures, we can observe an extension of the growing season for various vegetation types. Paradoxically, trees are more vulnerable to frost and despite the warming temperatures, the cooler climate at an earlier period is less favorable for fertilization and pollination.
The 2010 data on biophysical parameters (FPAR, LAI, NDVI, etc.) for various vegetation types in Morocco, distributed across different climatic zones, provide insight into vegetation responses to environmental and climatic variations. These data play a critical role in the balance of energy, carbon, and hydrological fluxes. Each zone, whether characterized as humid, semi-arid, arid, or hyper-arid, present unique conditions that influence both plant growth and these essential balances. Analyzing the seasonal trends of these parameters for each zone highlights challenges and opportunities. The conclusions are as follows:
Mixed forests (LC03): In humid areas, these parameters favor active vegetation and continuous carbon sequestration, while in semi-arid zones, more pronounced seasonal variations are observed.
Savannah (LC06): In semi-arid zones, vegetation exhibits relatively stable growth, with seasonal variations affecting carbon fixation. In arid areas, similar seasonal variations are observed but with lower parameter values.
Grasslands (LC07): In humid areas, vegetation maintains steady growth. In semi-arid, arid, and hyper-arid zones, growth is more limited, and seasonal variations impact energy, carbon, and hydrological balances.
Shrubs with bare soil (LC09): In humid areas, vegetation efficiently utilizes light, displaying high foliage density and increasing vigor. In semi-arid and arid zones, the ability to use light is limited, with seasonal variations. In hyper-arid areas, vegetation struggles to utilize light and maintain high foliage density.
Cropland (LC12): In humid areas, photosynthesis is more efficient, while in semi-arid and arid zones, seasonal variations influence the hydrological balance. In hyper-arid zones, carbon sequestration capacity is limited but contributes to hydrological balance stability.
In summary, variations in biophysical parameters reflect climatic disparities among Morocco’s zones, impacting plant growth, carbon sequestration, canopy density, and energy balance. These data are crucial for natural resource management and biodiversity preservation.

4. Conclusions

In conclusion, this study has successfully provided Morocco with its first comprehensive land use and land cover (LULC) map. The critical need for such a detailed representation of the country’s diverse ecological and climatic characteristics has been addressed. Our research integrated MODIS and Landsat datasets to generate a high-resolution (5 km) LULC map, offering a detailed overview of land cover across Morocco.
The results of our analysis revealed that approximately 13.5% of Morocco’s land area is occupied by forest formations, with concentrations in regions such as the Atlas and Rif mountain ranges, the vicinity of Rabat–Sale, and the southern parts of the country. Grasslands span over 16% of the study area, mainly in the north-east and west, while urban areas occupy nearly 3400 km², including major cities like Casablanca, Rabat, and Marrakech. Additionally, large expanses of shrublands and bare lands are prevalent in various regions, while agricultural areas cover almost 20% of the national territory, primarily in the interior plains and along the north-western Atlantic coast.
A significant contribution of this research is the mapping of biophysical parameters for each land cover class, which includes Leaf Area Index (LAI), Normalized Difference Vegetation Index (NDVI), and Fraction of Absorbed Photosynthetically Active Radiation (FPAR). These parameters play a crucial role in ecological and climatic studies and provide essential insights for environmental and societal applications.
Furthermore, the methodology developed here holds the potential for adaptation and utilization in regions and countries with similar ecological and climatic characteristics, underlining the significance of understanding biophysical parameters in addressing environmental and societal challenges.
Our study has a broader implication. It is the first to map land cover and its biophysical parameters at the national level over Morocco. These data serve as a foundational resource, applicable to diverse fields such as agriculture, natural resource management, climate modeling, environmental research, and more. Enhancing our understanding of these biophysical parameters provides us with the tools to address numerous environmental and societal challenges, including sustainable land use, biodiversity conservation, and climate change mitigation and adaptation.
Furthermore, the practical applications of biophysical parameters, such as LAI, FPAR, and NDVI, extend far beyond environmental understanding. These parameters find utility in various fields, including agriculture, natural disaster prediction, urban planning, and more. Their versatility and potential make them indispensable decision-making tools, contributing significantly to the development of sustainable management strategies and the mitigation and adaptation to complex challenges posed by environmental and societal changes. An improved understanding of these biophysical parameters is not only relevant but also imperative in addressing Morocco’s environmental and societal challenges.

Author Contributions

Conceptualization, methodology, software, validation, formal analysis: M.T. and L.B.; resources, data curation, M.T. and H.C.D.; writing—original draft preparation, M.T.; writing—review and editing, supervision, L.B. All authors have read and agreed to the published version of the manuscript.

Funding

This research received no external funding.

Data Availability Statement

Data available from lead author upon request.

Conflicts of Interest

The authors declare no conflict of interest.

References

  1. The Earth Institute—Columbia University. 2005. Available online: https://www.earth.columbia.edu/news/2005/story03-07-05.html (accessed on 8 January 2020).
  2. Augusseau, X.; Bourgoin, J.; David, D.; Degenne, P.; Lagabrielle, E.; Lestrelin, G.; Lo Seen, D. Modèles et simulations spatio- temporels comme « objets intermédiaires »: Le cas de l’étalement urbain à la Réunion. In Les Terres Agricoles Face à L’urbanisation: De la Donnée à L’action, Quels rôles Pour L’information? Éditions Quæ: Versailles, France, 2018; Volume 32. [Google Scholar]
  3. Hofmann, N. Bulletin D’analyse: Régions Rurales et Petites Villes du Canada. 2001. Available online: https://www150.statcan.gc.ca/n1/fr/catalogue/21-006-X (accessed on 5 October 2021).
  4. Worldwide Urban Expansion Causing Problems. ScienceDaily. 2020. Available online: https://www.sciencedaily.com/releases/2020/03/200326124129.htm (accessed on 5 October 2021).
  5. Akesbi, N. Évolution et Perspectives de L’agriculture Marocaine; CIHEAM IAM Montpellier: Montpellier, France, 2006; Volume 114. [Google Scholar]
  6. Güneralp, B.; Lwasa, S.; Masundire, H.; Parnell, S.; Seto, K.C. Urbanization in Africa: Challenges and opportunities for conservation. Environ. Res. Lett. 2017, 13, 015002. [Google Scholar] [CrossRef]
  7. Bounoua, L.; Zhang, P.; Mostovoy, G.; Thome, K.J.; Masek, J.G.; Imhoff, M.L.; Shepherd, M.; Quattrochi, D.; Santanello, J.; Silva, J.; et al. Impact of urbanization on US surface climate. Environ. Res. Lett. 2015, 10, 084010. [Google Scholar] [CrossRef]
  8. Quelle est L’influence du Milieu Urbain sur le Climat? 2021. Available online: https://www.lemonde.fr/climat/article/2014/10/03/quelle-est-l-influence-du-milieu-urbain-sur-le-climat_4500276_1652612.html (accessed on 5 October 2021).
  9. Bounoua, L.; Thome, K.; Nigro, J. Cities Exacerbate Climate Warming. Urban Sci. 2021, 5, 27. [Google Scholar] [CrossRef]
  10. Fathi, N.; Bounoua, L.; Messouli, M. A Satellite Assessment of the Urban Heat Island in Morocco. Can. J. Remote Sens. 2019, 45, 26–41. [Google Scholar] [CrossRef]
  11. Lachir, A.; Bounoua, L.; Zhang, P.; Thome, K.; Messouli, M. Modeling the Urban Impact on Semiarid Surface Climate: A Case Study in Marrakech, Morocco. Can. J. Remote Sens. 2016, 42, 379–395. [Google Scholar] [CrossRef]
  12. Los, S.O.; Pollack, N.H.; Parris, M.T.; Collatz, G.J.; Tucker, C.J.; Sellers, P.J.; Malmström, C.M.; DeFries, R.S.; Bounoua, L.; Dazlich, D.A. A Global 9-yr Biophysical Land Surface Dataset from NOAA AVHRR Data. J. Hydrometeorol. 2000, 1, 183–199. [Google Scholar] [CrossRef]
  13. Bounoua, L.; Collatz, G.J.; Los, S.O.; Sellers, P.J.; Dazlich, D.A.; Tucker, C.J.; Randall, D.A. Sensitivity of Climate to Changes in NDVI. J. Clim. 2000, 13, 2277–2292. [Google Scholar] [CrossRef]
  14. Masek, J.G.; Collatz, G.J. Estimating forest carbon fluxes in a disturbed southeastern landscape: Integration of remote sensing, forest inventory, and biogeochemical modeling. J. Geophys. Res. 2006, 111, G01006. [Google Scholar] [CrossRef]
  15. Bonan, G.B.; Pollard, D.; Thompson, S.L. Influence of Subgrid-Scale Heterogeneity in Leaf Area Index, Stomatal Resistance, and Soil Moisture on Grid-Scale Land–Atmosphere Interactions. J. Clim. 1993, 6, 1882–1897. [Google Scholar] [CrossRef]
  16. Bounoua, L.; Masek, J.; Tourre, Y.M. Sensitivity of surface climate to land surface parameters: A case study using the simple biosphere model SiB2. J. Geophys. Res. 2006, 111, D22S09. [Google Scholar] [CrossRef]
  17. Sellers, P.J.; Tucker, C.J.; Collatz, G.J.; Los, S.O.; Justice, C.O.; Dazlich, D.A.; Randall, D.A. A Revised Land Surface Parameterization (SiB2) for Atmospheric GCMS. Part II: The Generation of Global Fields of Terrestrial Biophysical Parameters from Satellite Data. J. Clim. 1996, 9, 706–737. [Google Scholar] [CrossRef]
  18. K. Didan. MOD13A1 MODIS/Terra Vegetation Indices 16-Day L3 Global 500m SIN Grid V006 2015. Available online: https://lpdaac.usgs.gov/products/mod13a1v006/ (accessed on 5 October 2021).
  19. Sellers, P.J.; Randall, D.A.; Collatz, G.J.; Berry, J.A.; Field, C.B.; Dazlich, D.A.; Zhang, C.; Collelo, G.D.; Bounoua, L. A revised Land Surface Parameterization (SiB2) for Atmospheric GCMs. Part I: Model Formulation. J. Clim. 1995, 9, 676–705. [Google Scholar] [CrossRef]
  20. HAUT COMMISSARIAT AU PLAN. Statistiques Environnementales au Maroc. 2006. Available online: https://www.hcp.ma/downloads/Statistiques-environnementales-au-Maroc_t22451.html (accessed on 18 September 2021).
  21. RGPH, Recensement Général de la Population et de l’Habitat. Population légale des Régions, Provinces, Préfectures, Municipalités, Arrondissements Et Communes du Royaume D’après les Résultats du RGPH 2014 (12 Régions). 2015.
  22. UN-Habitat. World Cities Report 2016: Urbanization and Development, Emerging Futures; UN-Habitat: Nairobi, Kenya, 2016. [Google Scholar]
  23. Elan, S. Country Profile: Morocco. 2006. Available online: https://www.refworld.org/docid/46f9134ed.html (accessed on 20 September 2021).
  24. Sulla-Menashe, D.; Friedl, M. MCD12Q1 MODIS/Terra+Aqua Land Cover Type Yearly L3 Global 500m SIN Grid V006 2015. Available online: https://lpdaac.usgs.gov/products/mcd12q1v006/ (accessed on 16 September 2021).
  25. K. Didan. MYD13A2 MODIS/Aqua Vegetation Indices 16-Day L3 Global 1km SIN Grid V006 2015. Available online: https://lpdaac.usgs.gov/products/myd13a2v006/ (accessed on 16 September 2021).
  26. Brown de Colstoun, E.C.; Huang, C.; Wang, P.; Tilton, J.C.; Tan, B.; Phillips, J.; Niemczura, S.; Ling, P.-Y.; Wolfe, R.E. Global Man-made Impervious Surface (GMIS) Dataset From Landsat; Socioeconomic Data and Applications Center (SEDAC): Palisades, NY, USA, 2017. [Google Scholar] [CrossRef]
  27. Bounoua, L.; Zhang, P.; Thome, K.; Masek, J.; Safia, A.; Imhoff, M.L.; Wolfe, R.E. Mapping Biophysical Parameters for Land Surface Modeling over the Continental US Using MODIS and Landsat. Dataset Pap. Sci. 2015, 2015, 564279. [Google Scholar] [CrossRef]
  28. Global Land Cover -Food and Agriculture Organization of the United Nations. 2020. Available online: http://www.fao.org/land-water/land/land-governance/land-resources-planning-toolbox/category/details/en/c/1036355/ (accessed on 11 October 2020).
  29. Formations Forestières. 2020. Available online: http://www.eauxetforets.gov.ma/ForetsMarocaines/Formations/Pages/Formations-Forestieres.aspx (accessed on 11 October 2020).
  30. Bounoua, L.; Safia, A.; Masek, J.; Peters-Lidard, C.; Imhoff, M.L. Impact of Urban Growth on Surface Climate: A Case Study in Oran, Algeria. J. Appl. Meteorol. Climatol. 2009, 48, 217–231. [Google Scholar] [CrossRef]
  31. Forêts En Chiffres. 2021. Available online: http://www.eauxetforets.gov.ma/ForetsMarocaines/ForetsChiffres/Pages/Forets-En-Chiffres.aspx (accessed on 6 October 2020).
  32. Répartition Géographique. 2021. Available online: http://www.eauxetforets.gov.ma/ForetsMarocaines/ForetsChiffres/Pages/Repartition-Geographique.aspx (accessed on 6 October 2020).
  33. Bing-fang, W.; Yuan, Z.; Jin-liang, H. Overview of lai/fpar retrieval from remotely sensed data. Adv. Earth Sci. 2004, 19, 585. [Google Scholar]
  34. Systematic Observation Requirements for Satellite-Based Data Products for Climate; Global Climate Observing System (GCOS): Geneva, Switzerland, 2011.
  35. Zhang, Q.; Middleton, E.M.; Margolis, H.A.; Drolet, G.G.; Barr, A.A.; Black, T.A. Can a satellite-derived estimate of the fraction of PAR absorbed by chlorophyll (FAPARchl) improve predictions of light-use efficiency and ecosystem photosynthesis for a boreal aspen forest? Remote Sens. Environ. 2009, 113, 880–888. [Google Scholar] [CrossRef]
  36. Cheng, S.J.; Bohrer, G.; Steiner, A.L.; Hollinger, D.Y.; Suyker, A.; Phillips, R.P.; Nadelhoffer, K.J. Variations in the influence of diffuse light on gross primary productivity in temperate ecosystems. Agric. For. Meteorol. 2015, 201, 98–110. [Google Scholar] [CrossRef]
  37. Ogutu, B.O.; Dash, J. An algorithm to derive the fraction of photosynthetically active radiation absorbed by photosynthetic elements of the canopy (FAPARps) from eddy covariance flux tower data. New Phytol. 2013, 197, 511–523. [Google Scholar] [CrossRef]
  38. Zhu, X.; He, H.; Liu, M.; Yu, G.; Sun, X.; Gao, Y. Spatio-temporal variation of photosynthetically active radiation in China in recent 50 years. J. Geogr. Sci. 2010, 20, 803–817. [Google Scholar] [CrossRef]
  39. He, M.; Ju, W.; Zhou, Y.; Chen, J.; He, H.; Wang, S.; Wang, H.; Guan, D.; Yan, J.; Li, Y.; et al. Development of a two-leaf light use efficiency model for improving the calculation of terrestrial gross primary productivity. Agric. For. Meteorol. 2013, 173, 28–39. [Google Scholar] [CrossRef]
  40. Laffineur, Q.; Aubinet, M.; Schoon, N.; Amelynck, C.; Müller, J.-F.; Dewulf, J.; Steppe, K.; Heinesch, B. Impact of diffuse light on isoprene and monoterpene emissions from a mixed temperate forest. Atmos. Environ. 2013, 74, 385–392. [Google Scholar] [CrossRef]
  41. Gu, L.; Baldocchi, D.; Verma, S.B.; Black, T.A.; Vesala, T.; Falge, E.M.; Dowty, P.R. Advantages of diffuse radiation for terrestrial ecosystem productivity. J. Geophys. Res. Atmos. 2002, 107, ACL-2. [Google Scholar] [CrossRef]
  42. Alton, P.B.; North, P. Interpreting shallow, vertical nitrogen profiles in tree crowns: A three-dimensional, radiative-transfer simulation accounting for diffuse sunlight. Agric. For. Meteorol. 2007, 145, 110–124. [Google Scholar] [CrossRef]
  43. Asner, G.P.; Braswell, B.; Schimel, D.S.; Wessman, C.A. Ecological Research Needs from Multiangle Remote Sensing Data. Remote Sens. Environ. 1998, 63, 155–165. [Google Scholar] [CrossRef]
  44. Boussetta, S.; Balsamo, G.; Dutra, E.; Beljaars, A.; Albergel, C. Assimilation of surface albedo and vegetation states from satellite observations and their impact on numerical weather prediction. Remote Sens. Environ. 2015, 163, 111–126. [Google Scholar] [CrossRef]
  45. World Meteorological Organization (WMO); The United Nations Educational, Scientific and Cultural Organization (UNESCO); United Nations Environment Programme (UNEP); International Council for Science (ICSU); GCOS. Systematic Observation Requirements for Satellite-Based Products for Climate. Supplemental Details to the Satellite-Based Component of the Implementation Plan for the Global Observing System for Climate in Support of the UNFCCC: 2011 Update; WMO: Geneva, Switzerland, 2011. [Google Scholar]
  46. Fraction of Green Vegetation Cover|Copernicus Global Land Service. 2022. Available online: https://land.copernicus.eu/global/products/fcover (accessed on 8 February 2022).
  47. Roughness Length. 2022. Available online: http://www-das.uwyo.edu/~geerts/cwx/notes/chap14/roughness.html (accessed on 8 February 2022).
  48. Zero-Plane Displacement. 2022. Available online: https://glossary.ametsoc.org/wiki/Zero-plane_displacement (accessed on 8 February 2022).
  49. van der Tol, C.; Verhoef, W.; Timmermans, J.; Verhoef, A.; Su, Z. An integrated model of soil-canopy spectral radiances, photosynthesis, fluorescence, temperature and energy balance. Biogeosciences 2009, 6, 3109–3129. [Google Scholar] [CrossRef]
  50. Sailor, D.J. A green roof model for building energy simulation programs. Energy Build. 2008, 40, 1466–1478. [Google Scholar] [CrossRef]
  51. Kapsalis, V.; Karamanis, D. On the effect of roof added photovoltaics on building’s energy demand. Energy Build. 2015, 108, 195–204. [Google Scholar] [CrossRef]
  52. BETAF. L’étude D’aménagement et de Valorisation des Nappes d’alfa dans la Province de Jerada; Consulting & Formation BETAF: Wildwood, WI, USA, 2020. [Google Scholar]
  53. Bula, R.J. Morphological Characteristics of Alfalfa Plants Grown at Several Temperatures. Crop. Sci. 1972, 12, 683–686. [Google Scholar] [CrossRef]
  54. Nasri, I.R.; Abdessamad, A.; Ksontini, M.; Ferchichi, A. Morphological characterization of tufts of alfa (Stipa tenacissima L.) from different populations in the Kasserine region of Tunisia. J. New Sci. 2017, 46, 13. [Google Scholar]
  55. Zhang, X.; Friedl, M.A.; Schaaf, C.B.; Strahler, A.H.; Hodges, J.C.F.; Gao, F.; Reed, B.C.; Huete, A. Monitoring vegetation phenology using MODIS. Remote Sens. Environ. 2003, 84, 471–475. [Google Scholar] [CrossRef]
  56. Richardson, A.D.; Jenkins, J.P.; Braswell, B.H.; Hollinger, D.Y.; Ollinger, S.V.; Smith, M.-L. Use of digital webcam images to track spring green-up in a deciduous broadleaf forest. Oecologia 2007, 152, 323–334. [Google Scholar] [CrossRef] [PubMed]
  57. Lim, C.H.; An, J.H.; Jung, S.H.; Nam, G.B.; Cho, Y.C.; Kim, N.S.; Lee, C.S. Ecological consideration for several methodologies to diagnose vegetation phenology. Ecol. Res. 2018, 33, 363–377. [Google Scholar] [CrossRef]
  58. Kang, S.; Running, S.W.; Lim, J.-H.; Zhao, M.; Park, C.-R.; Loehman, R. A regional phenology model for detecting onset of greenness in temperate mixed forests, Korea: An application of MODIS leaf area index. Remote Sens. Environ. 2003, 86, 232–242. [Google Scholar] [CrossRef]
  59. Adole, T.; Dash, J.; Atkinson, P.M. A systematic review of vegetation phenology in Africa. Ecol. Inform. 2016, 34, 117–128. [Google Scholar] [CrossRef]
  60. Mokhtari, N.; Mrabet, R.; Lebailly, P.; Bock, L. Spatialisation des bioclimats, de l’aridité et des étages de végétation du Maroc. Rev. Mar. Sci. Agron. Vét. 2014, 2, 50–66. [Google Scholar]
Figure 1. Geographical location of Morocco (The study region), the black contours represent the regions, and the orange shapes indicate the cities where the population is greater than 500,000 inhabitants.
Remotesensing 15 05389 g001
Figure 2. Approach used for the aggregation of 500 m MODIS and 30 m ISA pixels at a spatial resolution of 0.05° CMG [28].
Remotesensing 15 05389 g002
Figure 3. Spatial distribution of land cover classes (on the left) and their fractions (on the right), with (a) for LC6, (b) for LC7, (c) for LC8, (d) for LC9, and (e) for LC12, in the CMG zoomed for the study area shown in the lower right corner (f).
Remotesensing 15 05389 g003
Figure 4. Spatial distribution (a) of forests and their fractions (b) in the CMG over the study area shown on the right panel.
Remotesensing 15 05389 g004
Figure 5. Upper panel: example of classification results for the 3 urban areas of Marrakech (a1), Casablanca (b1), and Rabat–Sale–Kenitra (c1). The red areas represent the areas classified as urban in the elaborated map. The images in the lower panel are Google Earth (GE) images of the same size showing, in gray color, for the same 3 urban areas of Marrakech (a2), Casablanca (b2), and Rabat–Sale–Kenitra (c2), the urban areas within the urban perimeters represented in red lines. The GE images are provided for visual comparison only.
Remotesensing 15 05389 g005
Figure 6. Final land cover map resulting from the two steps of validation of the MODIS data with the FAO map, and the resulting map confronted the Department of Water and Forestry (DEF) map to validate the forest types. Validation of the urban pixels was performed using Google Earth 7.3.6.9345 imagery.
Remotesensing 15 05389 g006
Figure 7. The annual variation in biophysical parameters, where (a1,a2) represent FPAR and LAI for LC3, (b1,b2) for LC6, (c1,c2) for LC7, (d1,d2) for LC9, and (e1,e2) for LC12, in different climatic zones, including humid (wet), semiarid, arid, and hyper-arid regions.
Remotesensing 15 05389 g007aRemotesensing 15 05389 g007b
Table 1. Land cover classes.
ClassCodeName
00LC00Inland water
01LC01Evergreen Broadleaf
02LC02Deciduous Broadleaf
03LC03Mixed forest
04LC04Evergreen Needleleaf
05LC05Deciduous Needleleaf
06LC06Open and close Savannas
07LC07Grassland
08LC08Urban buildup (ISA)
09LC09Shrubs with bare soil
10LC10Tundra
11LC11Barren/desert
12LC12Cropland
Table 2. Correspondence of FAO-MODIS classes.
Code FAOSellers et al. 1996 [19] SiB-Code
11Post-flooding or irrigated croplands (or aquatic)Cropland12
14Rainfed croplandsCropland12
20Mosaic cropland (50–70%)/
Vegetation (grassland/shrubland/forest) (20–50%)
Cropland12
30Mosaic vegetation (grassland/shrubland/forest)
(50–70%)/cropland (20–50%)
Savanah6
50Closed (>40%) broadleaved deciduous forest (>5 m)Broadleaf deciduous trees2
70Closed (>40%) needle leaved evergreen forest (>5 m)Needleleaf evergreen trees4
100Closed to open (>15%) mixed broadleaved and needle leaved forest (>5 m)Mixed Forest3
110Mosaic forest or shrubland (50–70%)/grassland (20–50%)Shrubland/Grassland7 + 9
120Mosaic grassland (50–70%)/forest or shrubland (20–50%) Grassland7
170Closed (>40%) broadleaved forest or shrubland
permanently flooded—Saline or brackish water
Grassland/Savanah7
190Artificial surfaces and associated areas (Urban areas > 50%)Urban8
200Bare areasNo vegetation/Bare soil11 (desert) + 9 (bare)
210Water bodiesWater 0
Source: [19,28].
Table 3. Correspondence of tree species from the Department of Water and Forests with those from MODIS.
Plant Species from DEF Sellers et al. 1996 [19]SiB-Code
Zen oakBroadleaf evergreen trees1
Holm oakBroadleaf evergreen trees1
Cedar oakBroadleaf evergreen trees1
Argan treeBroadleaf evergreen trees1
Other deciduous treesBroadleaf evergreen and deciduous trees1 et 2
Deciduous reforestationBroadleaf evergreen and deciduous trees1 et 2
Saharan AcaciasBroadleaf deciduous trees2
TamarixBroadleaf deciduous trees2
Cedar treeNeedleleaf evergreen trees4
Juniper treesNeedleleaf evergreen trees4
Pine treesNeedleleaf evergreen trees4
Softwood reforestationNeedleleaf evergreen and deciduous trees4 et 5
ThujaNeedleleaf deciduous trees5
Fir treeNeedleleaf deciduous trees5
AlphaSavanah6
Source: [19,29].
Table 4. Matrix for calculating the intersection and error rate of FAO pixels with MODIS pixels for each land cover type existing in Morocco.
Type of Land CoverAccuracy (%)
type 081
type 2100
type 393.8
type 490.3
type 690.5
type 798.7
type 893
type 914
type 1189.8
type 1287.2
Mean83.8
Table 5. Pixel by pixel accuracy matrix between the intersection of the huybrid-1 map and the DEF map for the forest types existing in the region of study, the water, and the savanna classes. Note that forest types 1, 3, and 5 do not exist in the study region.
Type of Land CoverAccuracy (%)
type 067.24
type 287.69
type 470
type 664.44
Mean72.34
Disclaimer/Publisher’s Note: The statements, opinions and data contained in all publications are solely those of the individual author(s) and contributor(s) and not of MDPI and/or the editor(s). MDPI and/or the editor(s) disclaim responsibility for any injury to people or property resulting from any ideas, methods, instructions or products referred to in the content.

