


Analysis of Daytime and Night-Time Aerosol Optical Depth from Solar and Lunar Photometry in Valladolid (Spain)

 , , , , , , , and
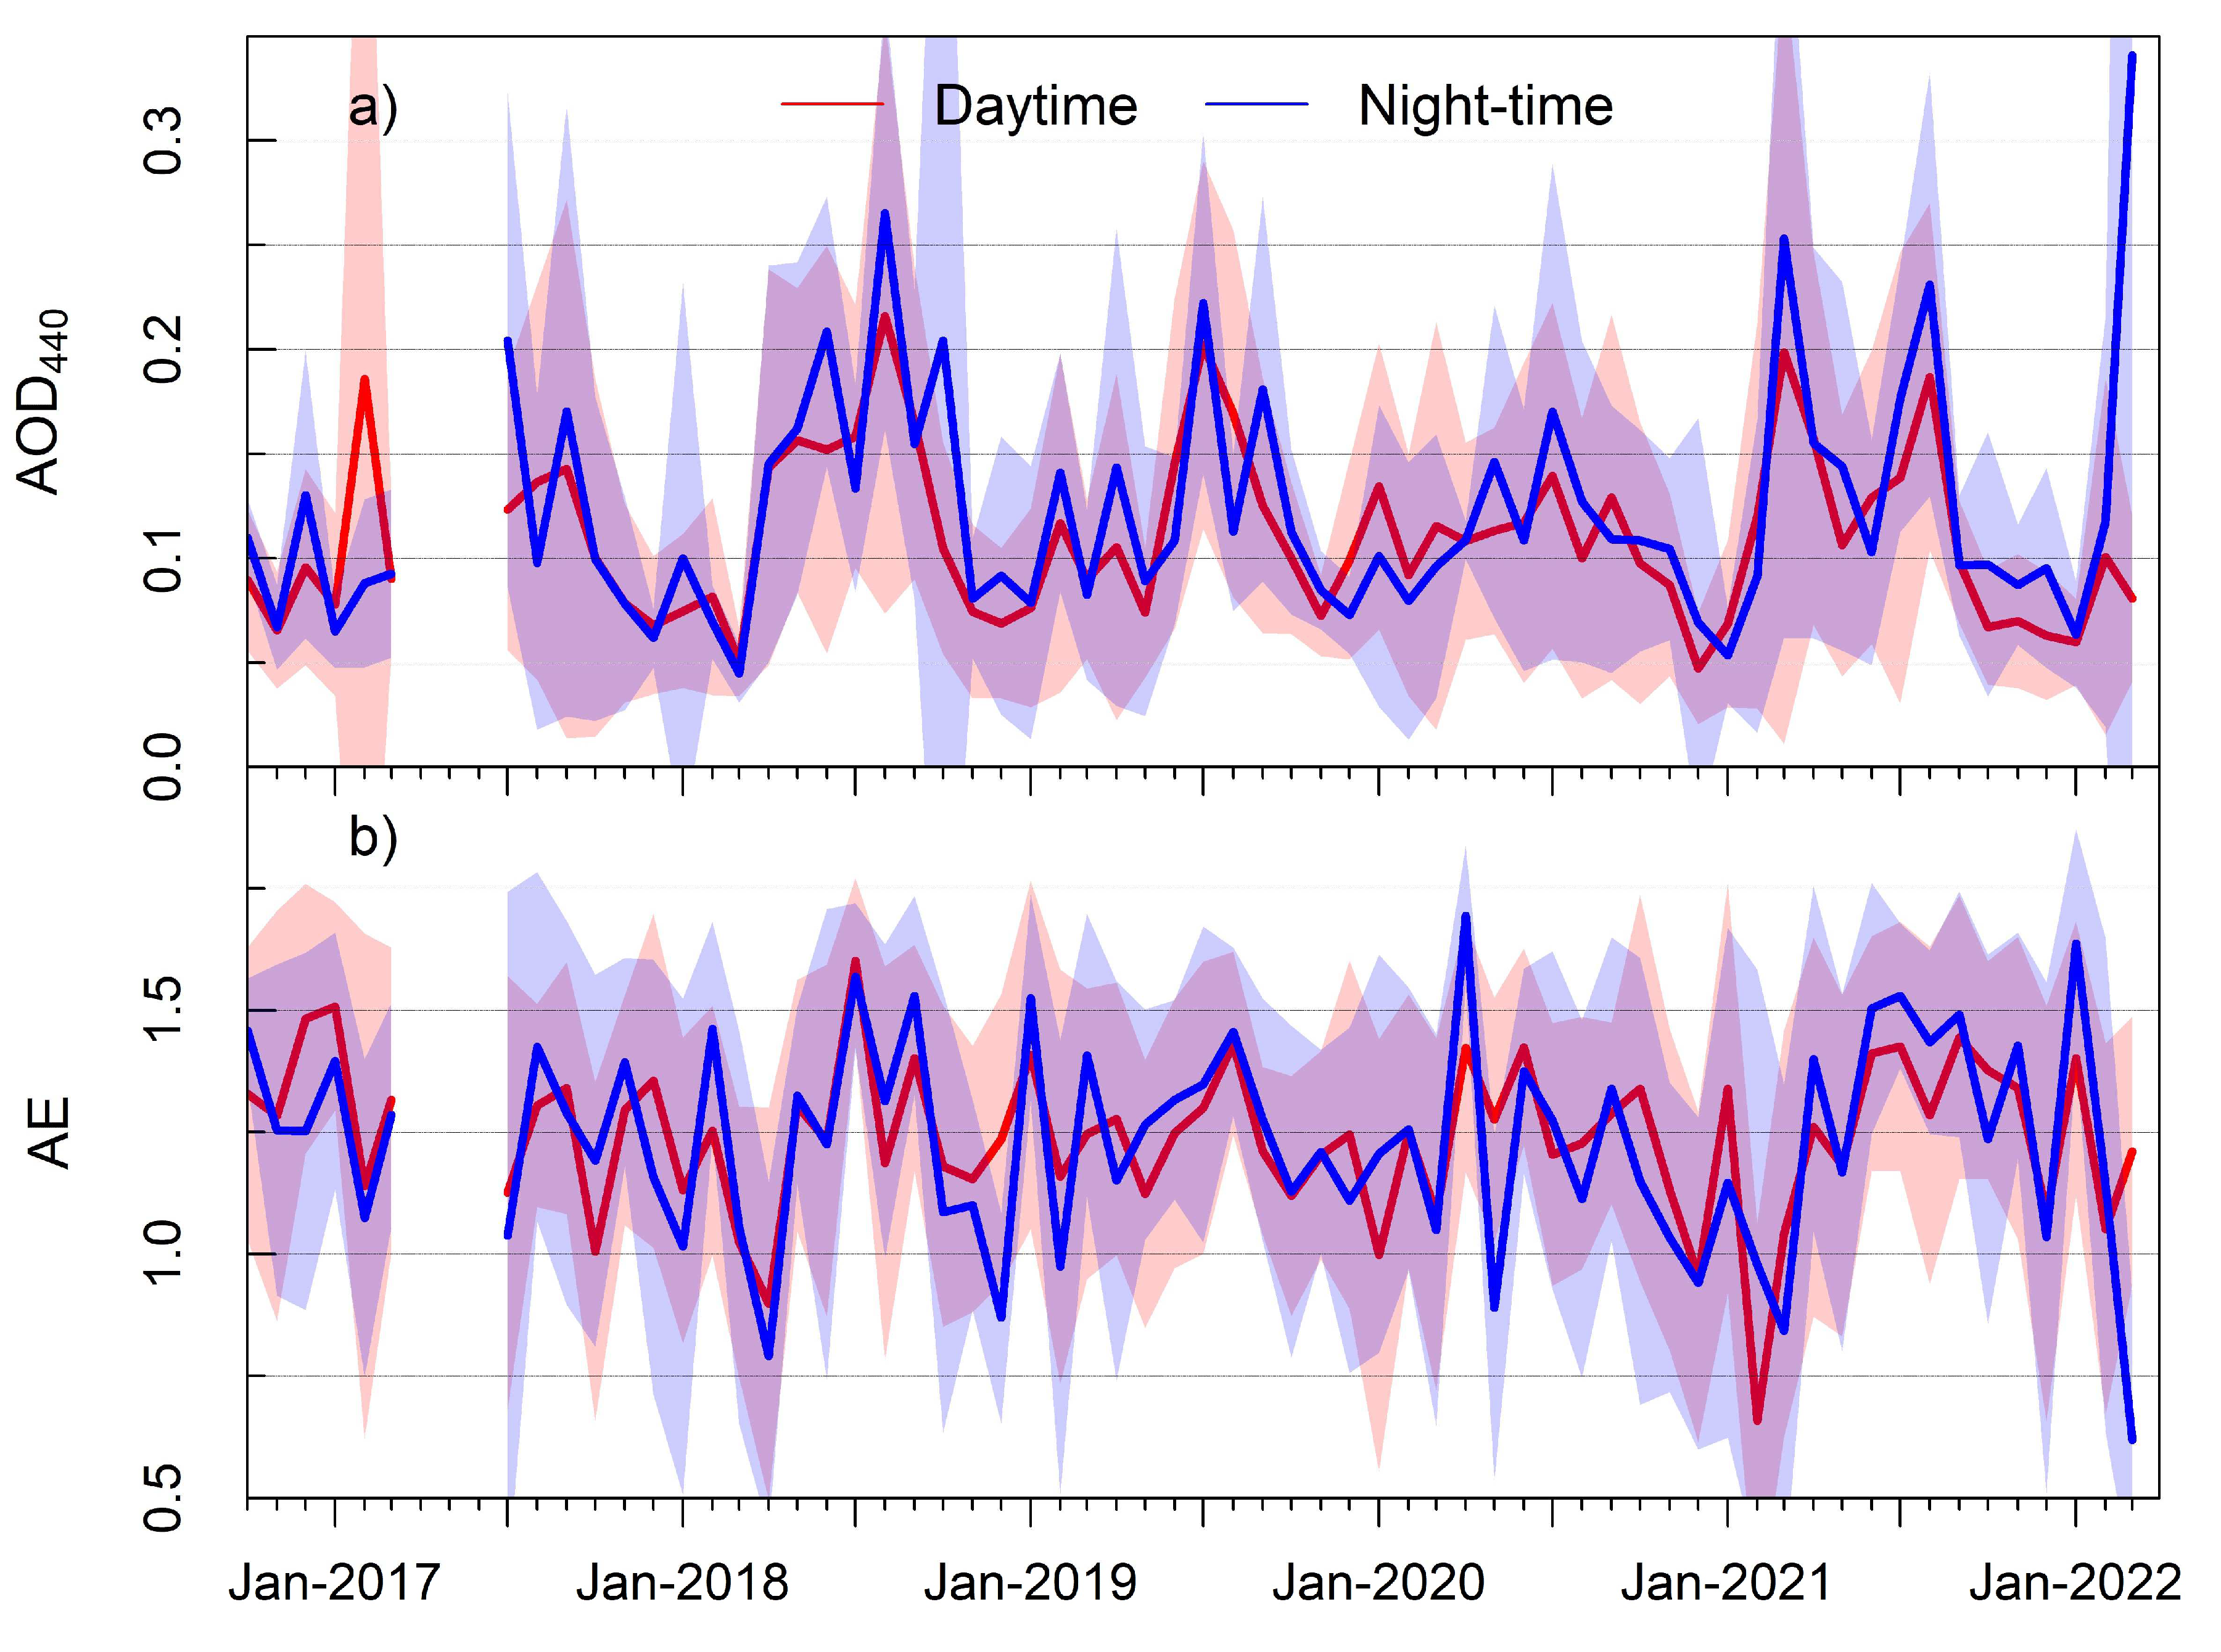
Abstract
:1. Introduction
2. Site, Data and Method
3. Results and Discussion
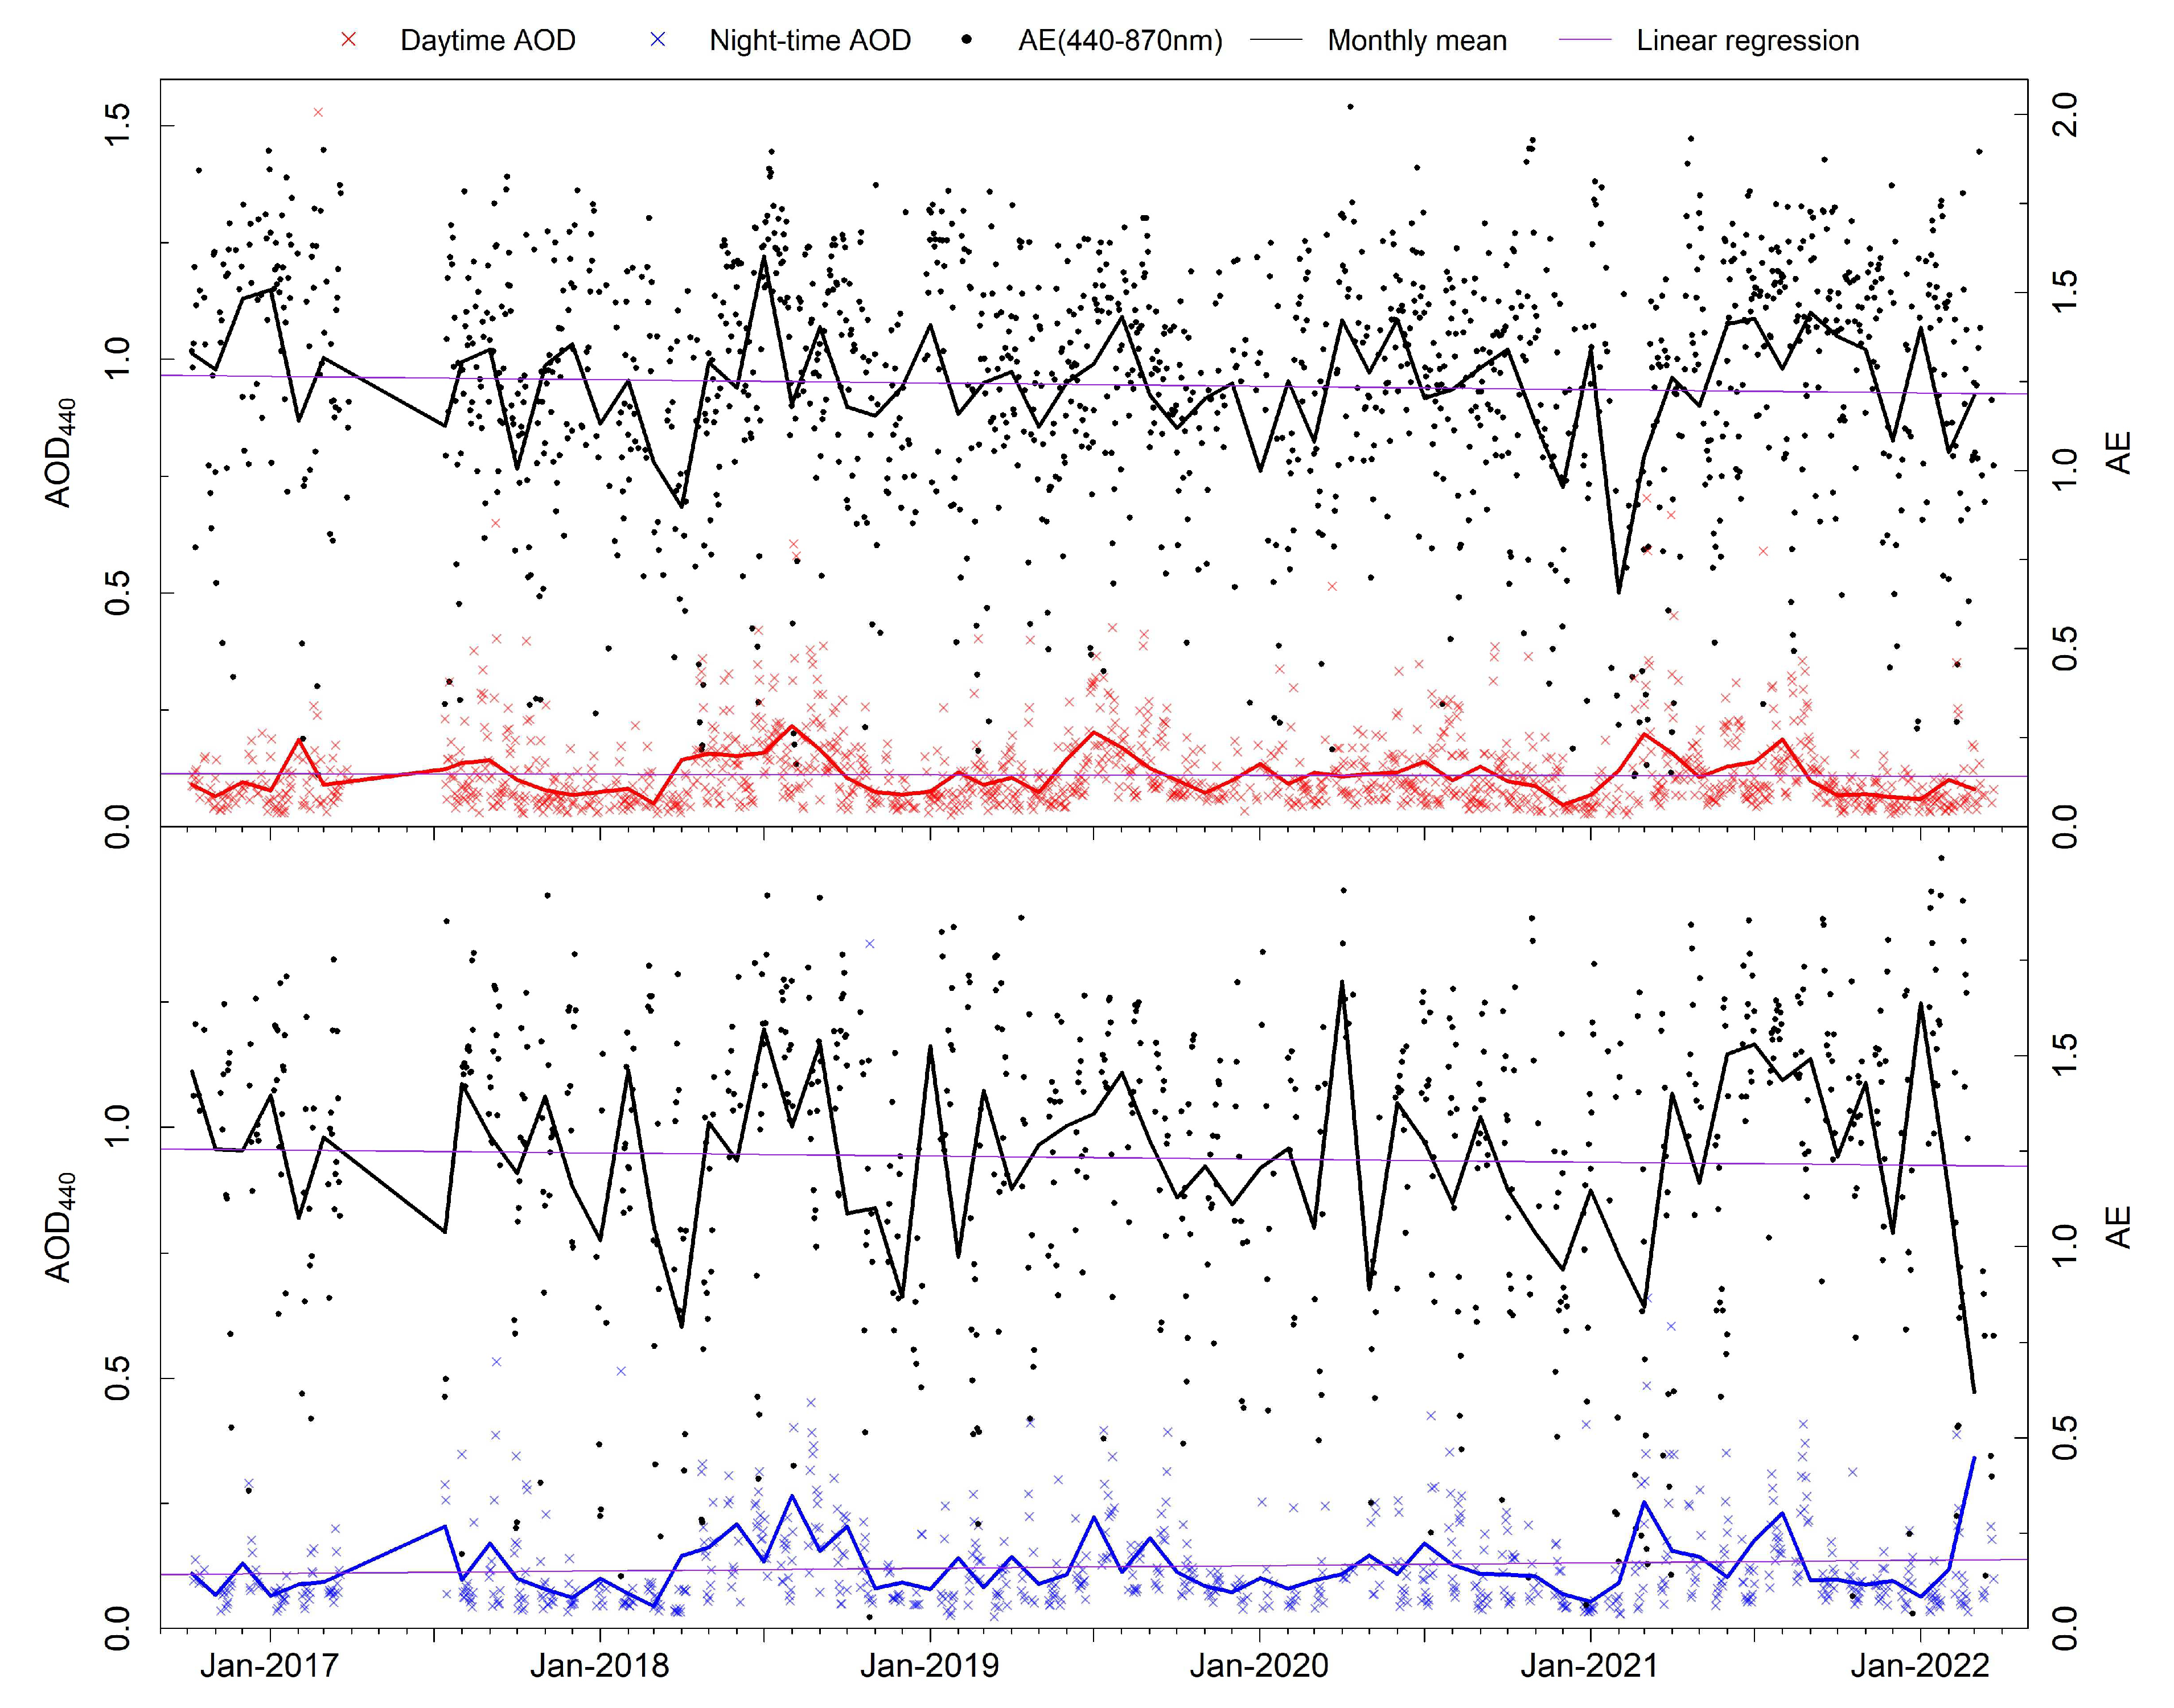
3.1. Time Series of Aerosol Optical Depth and Ångström Exponent
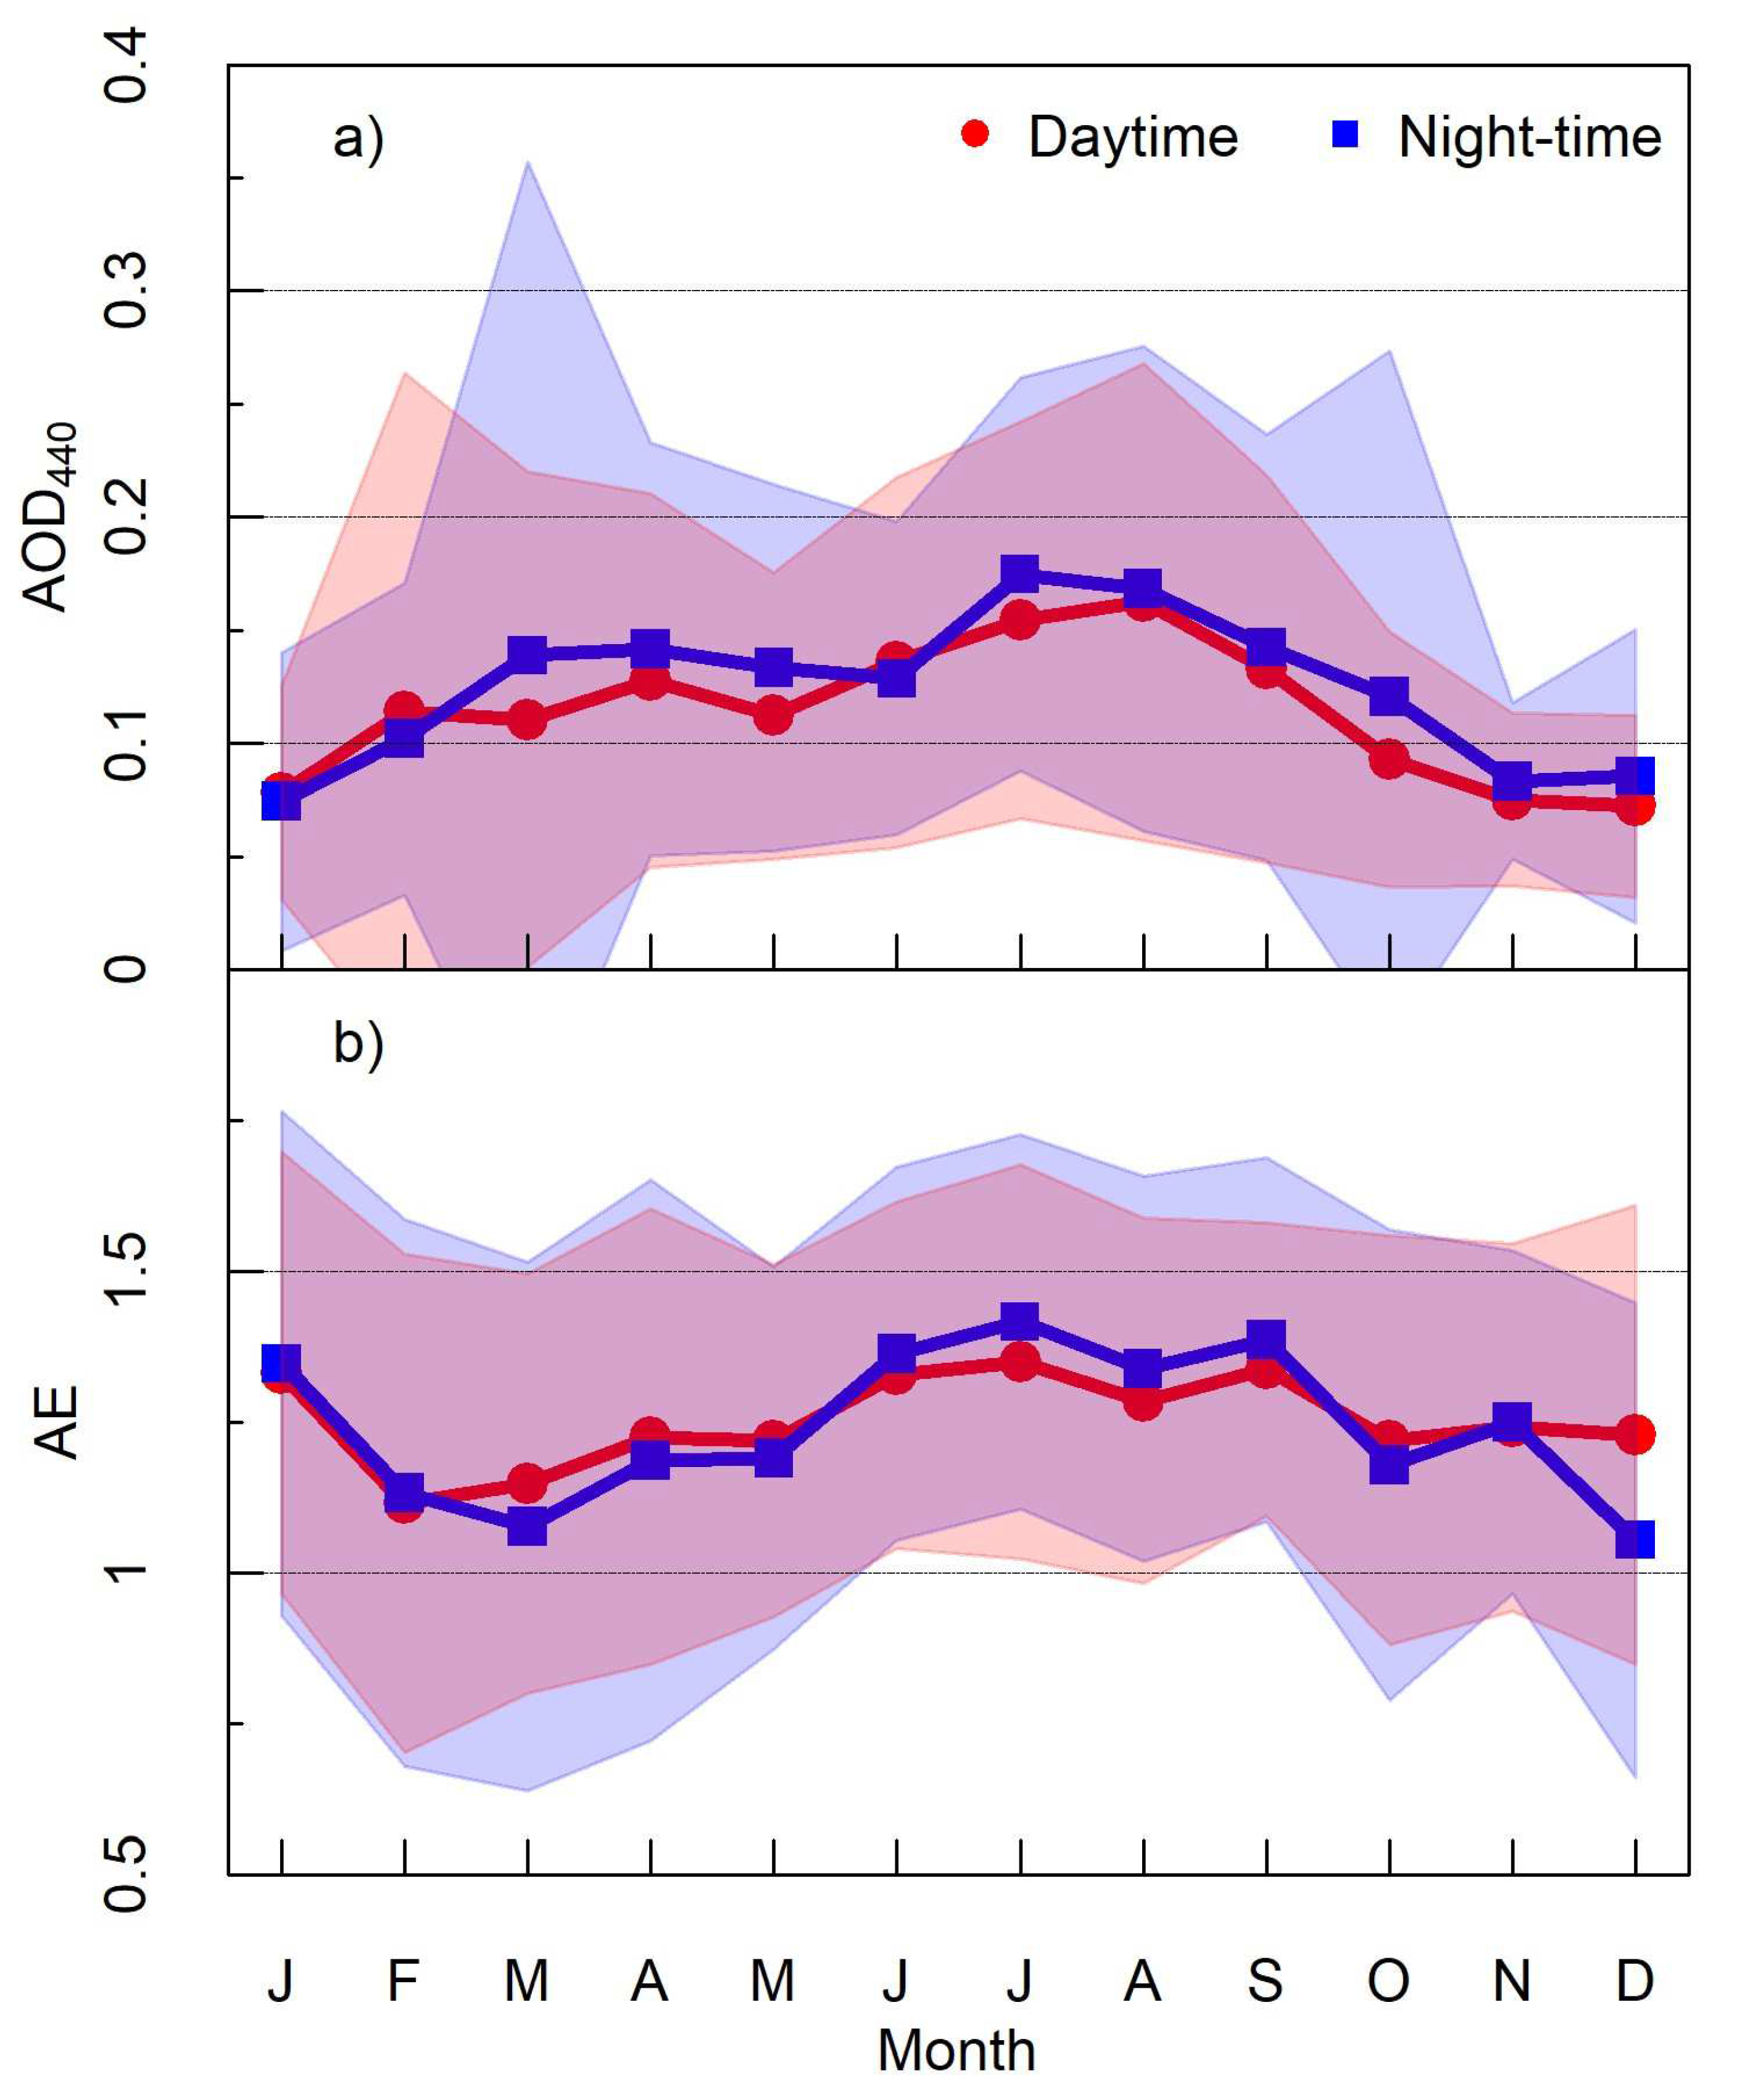
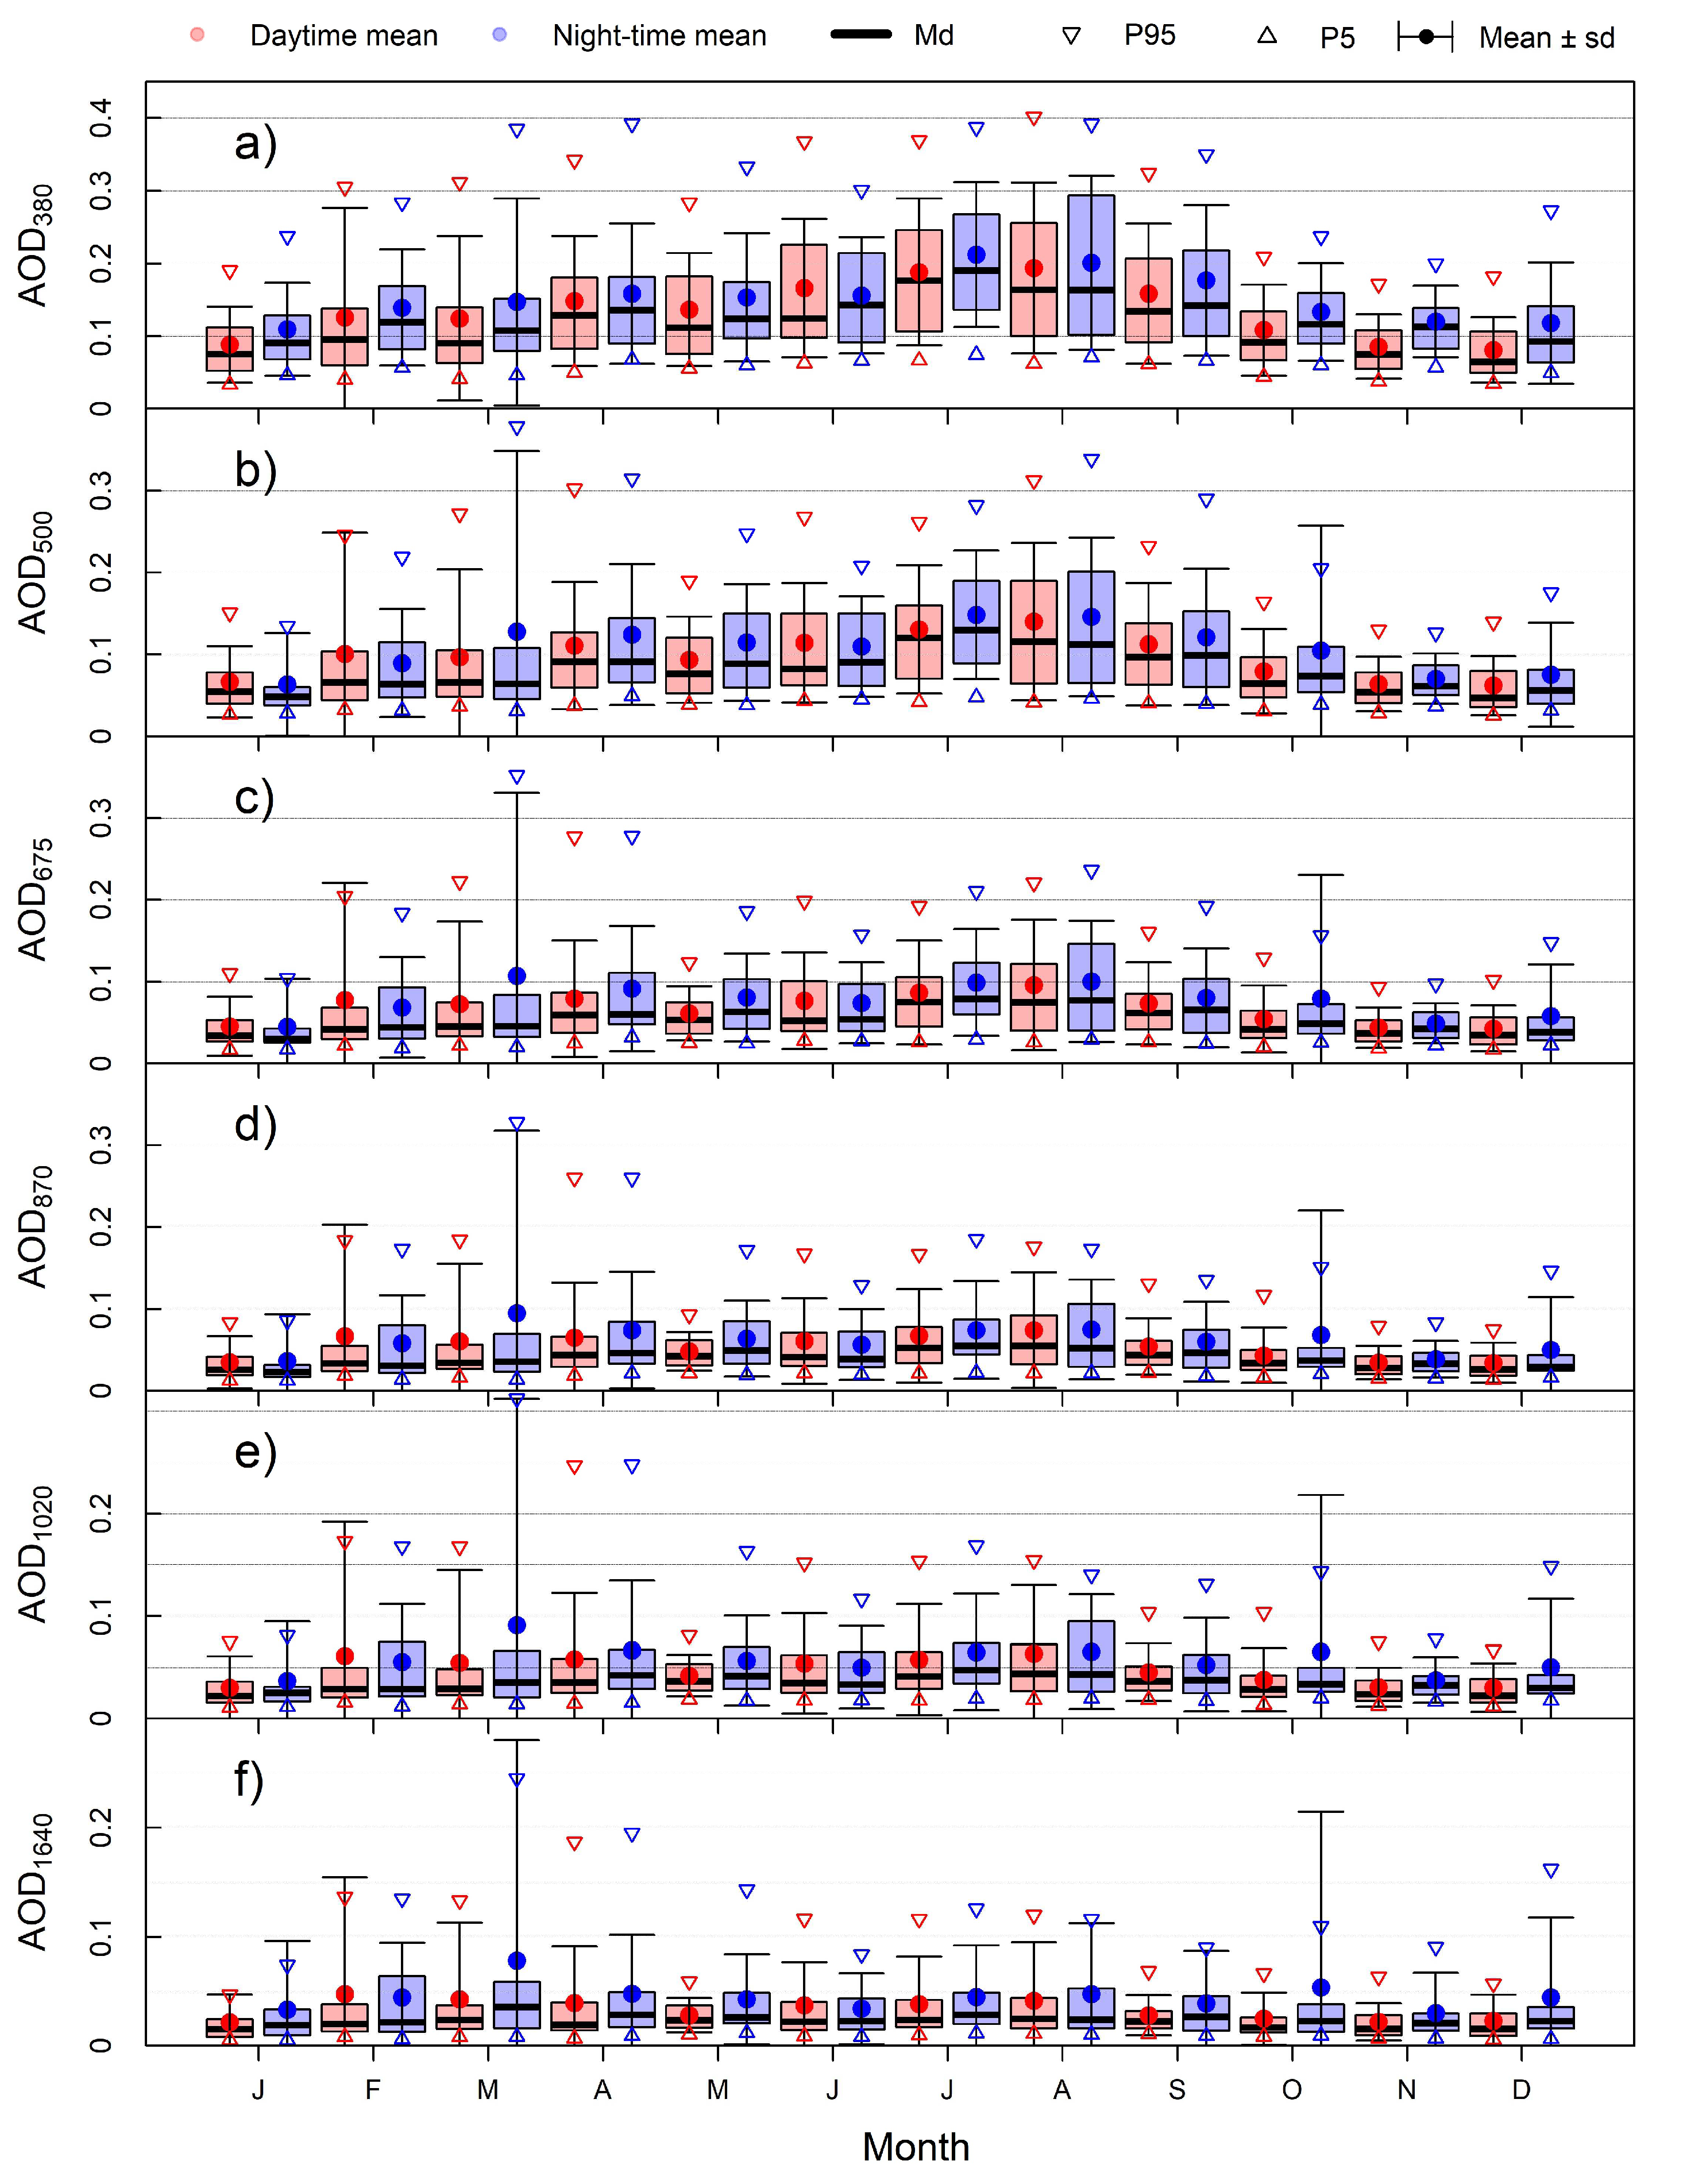
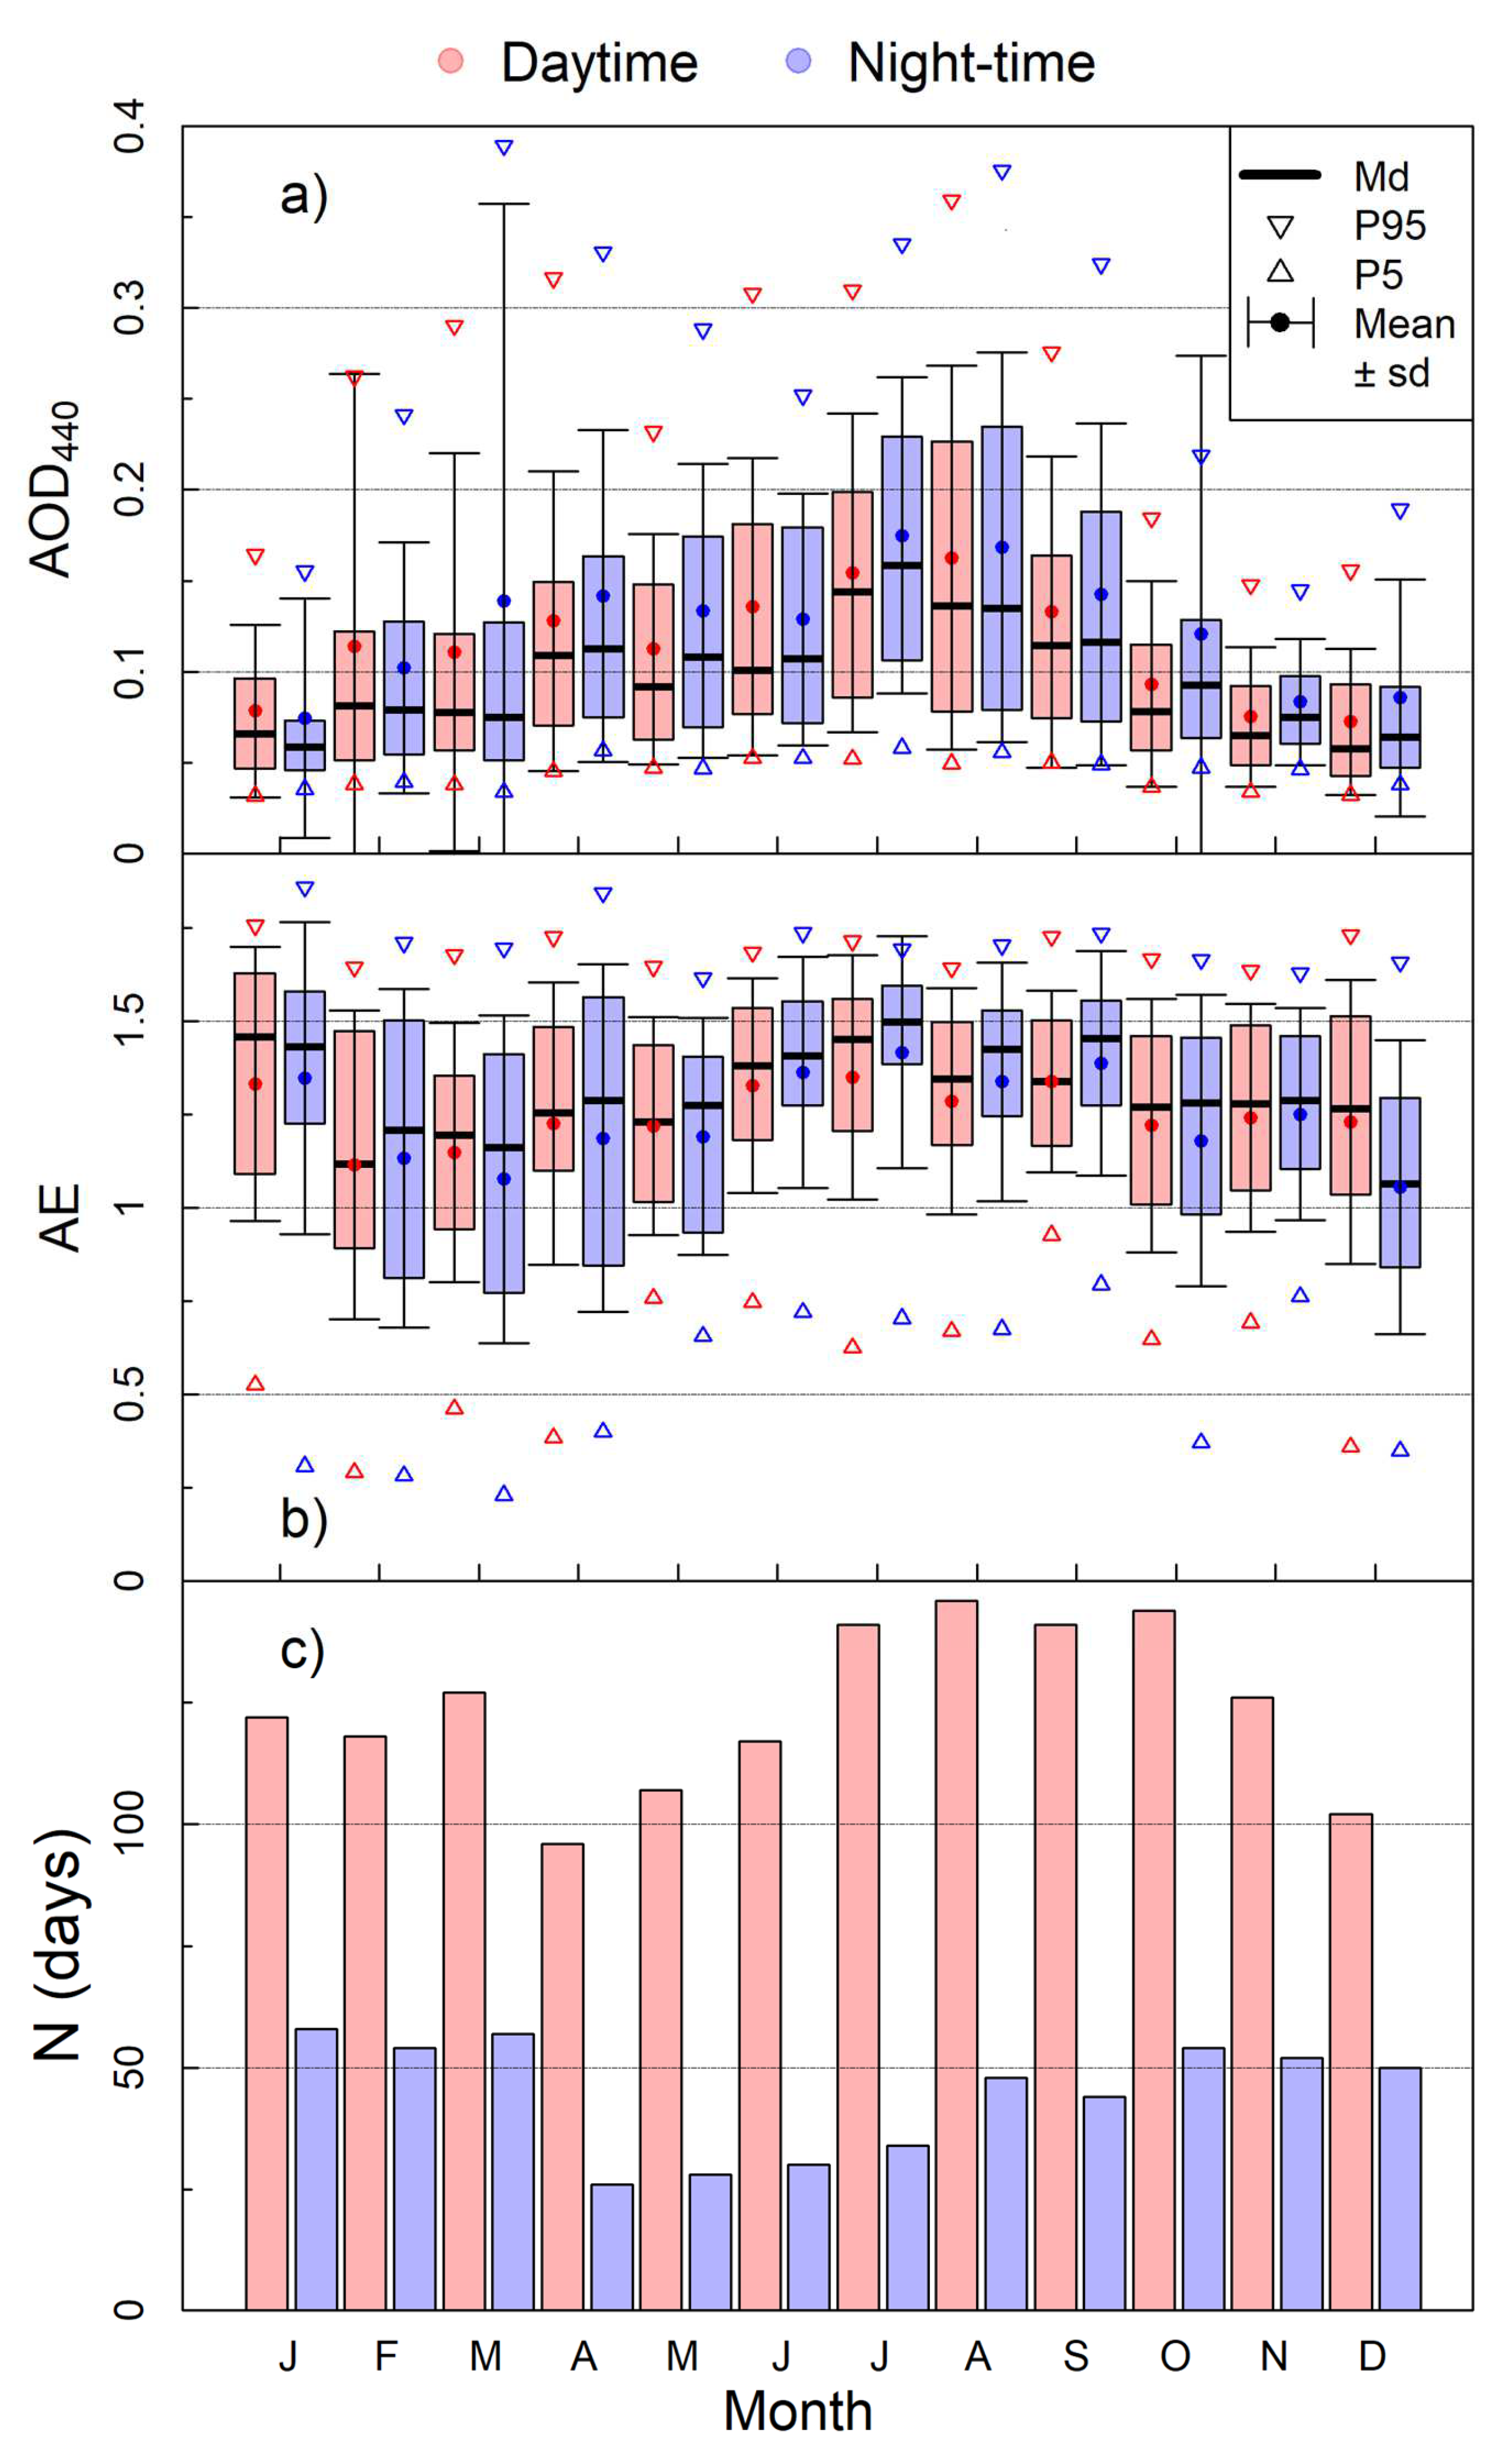
3.2. Annual Cycle
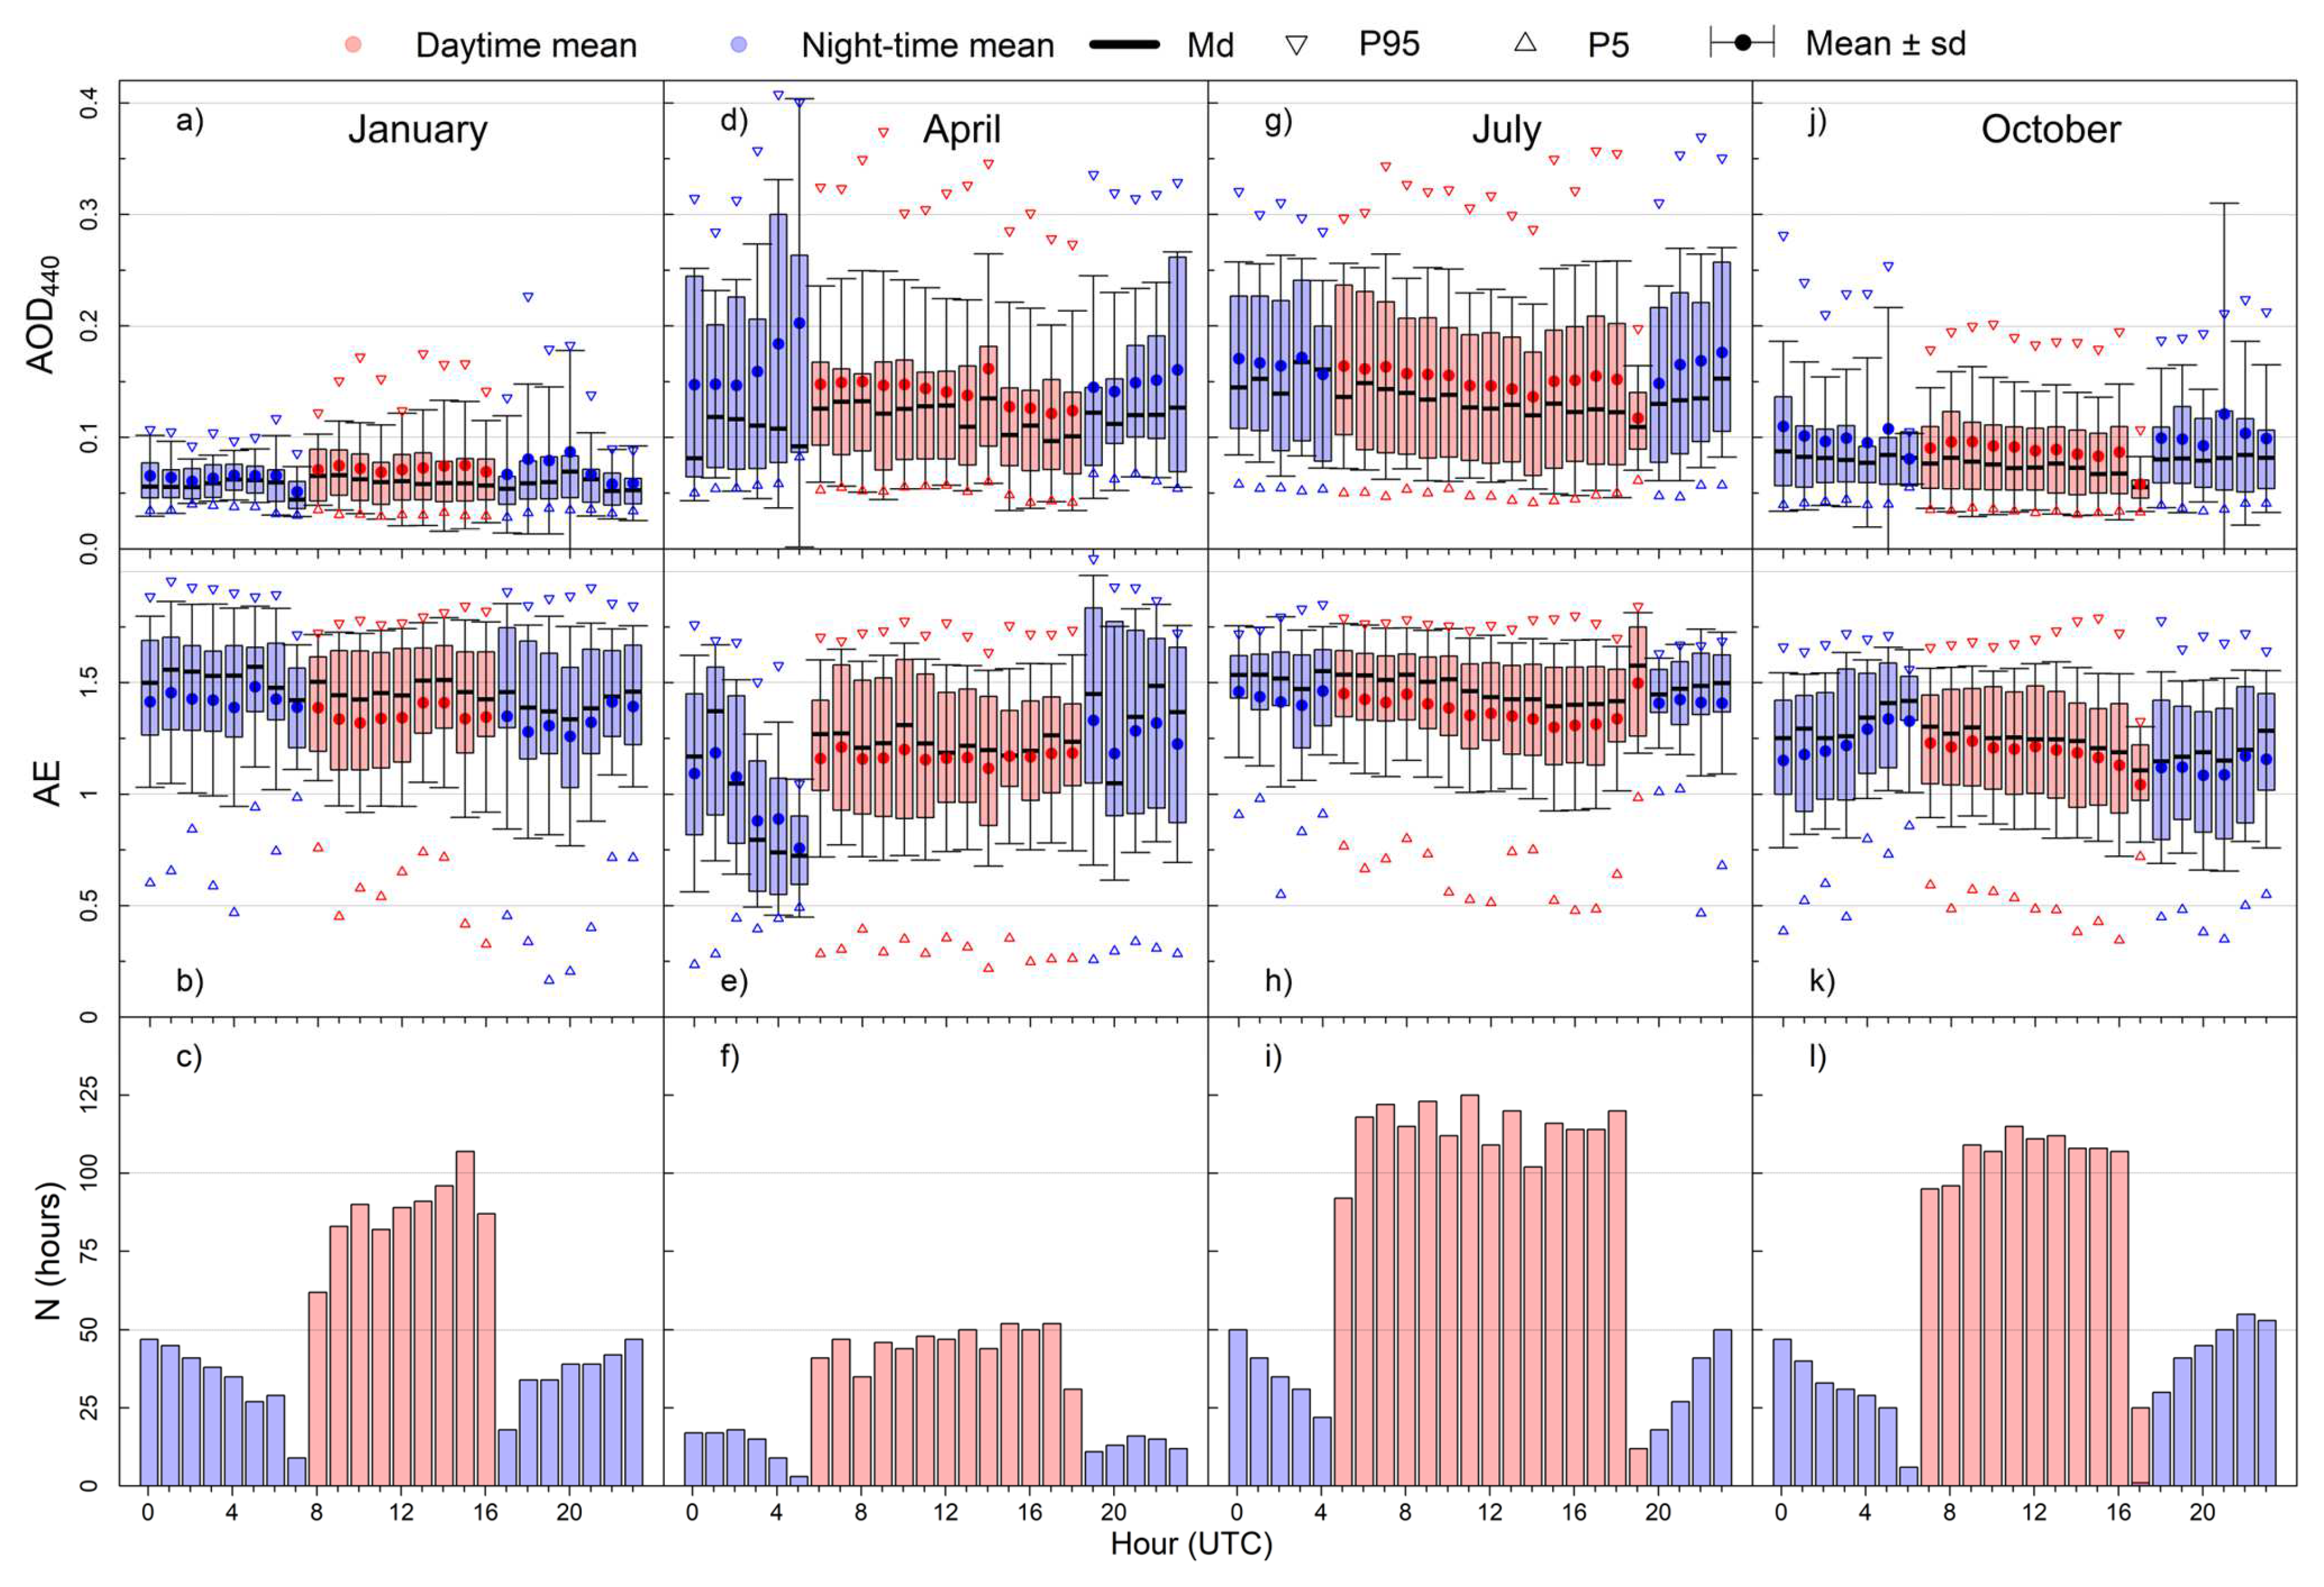
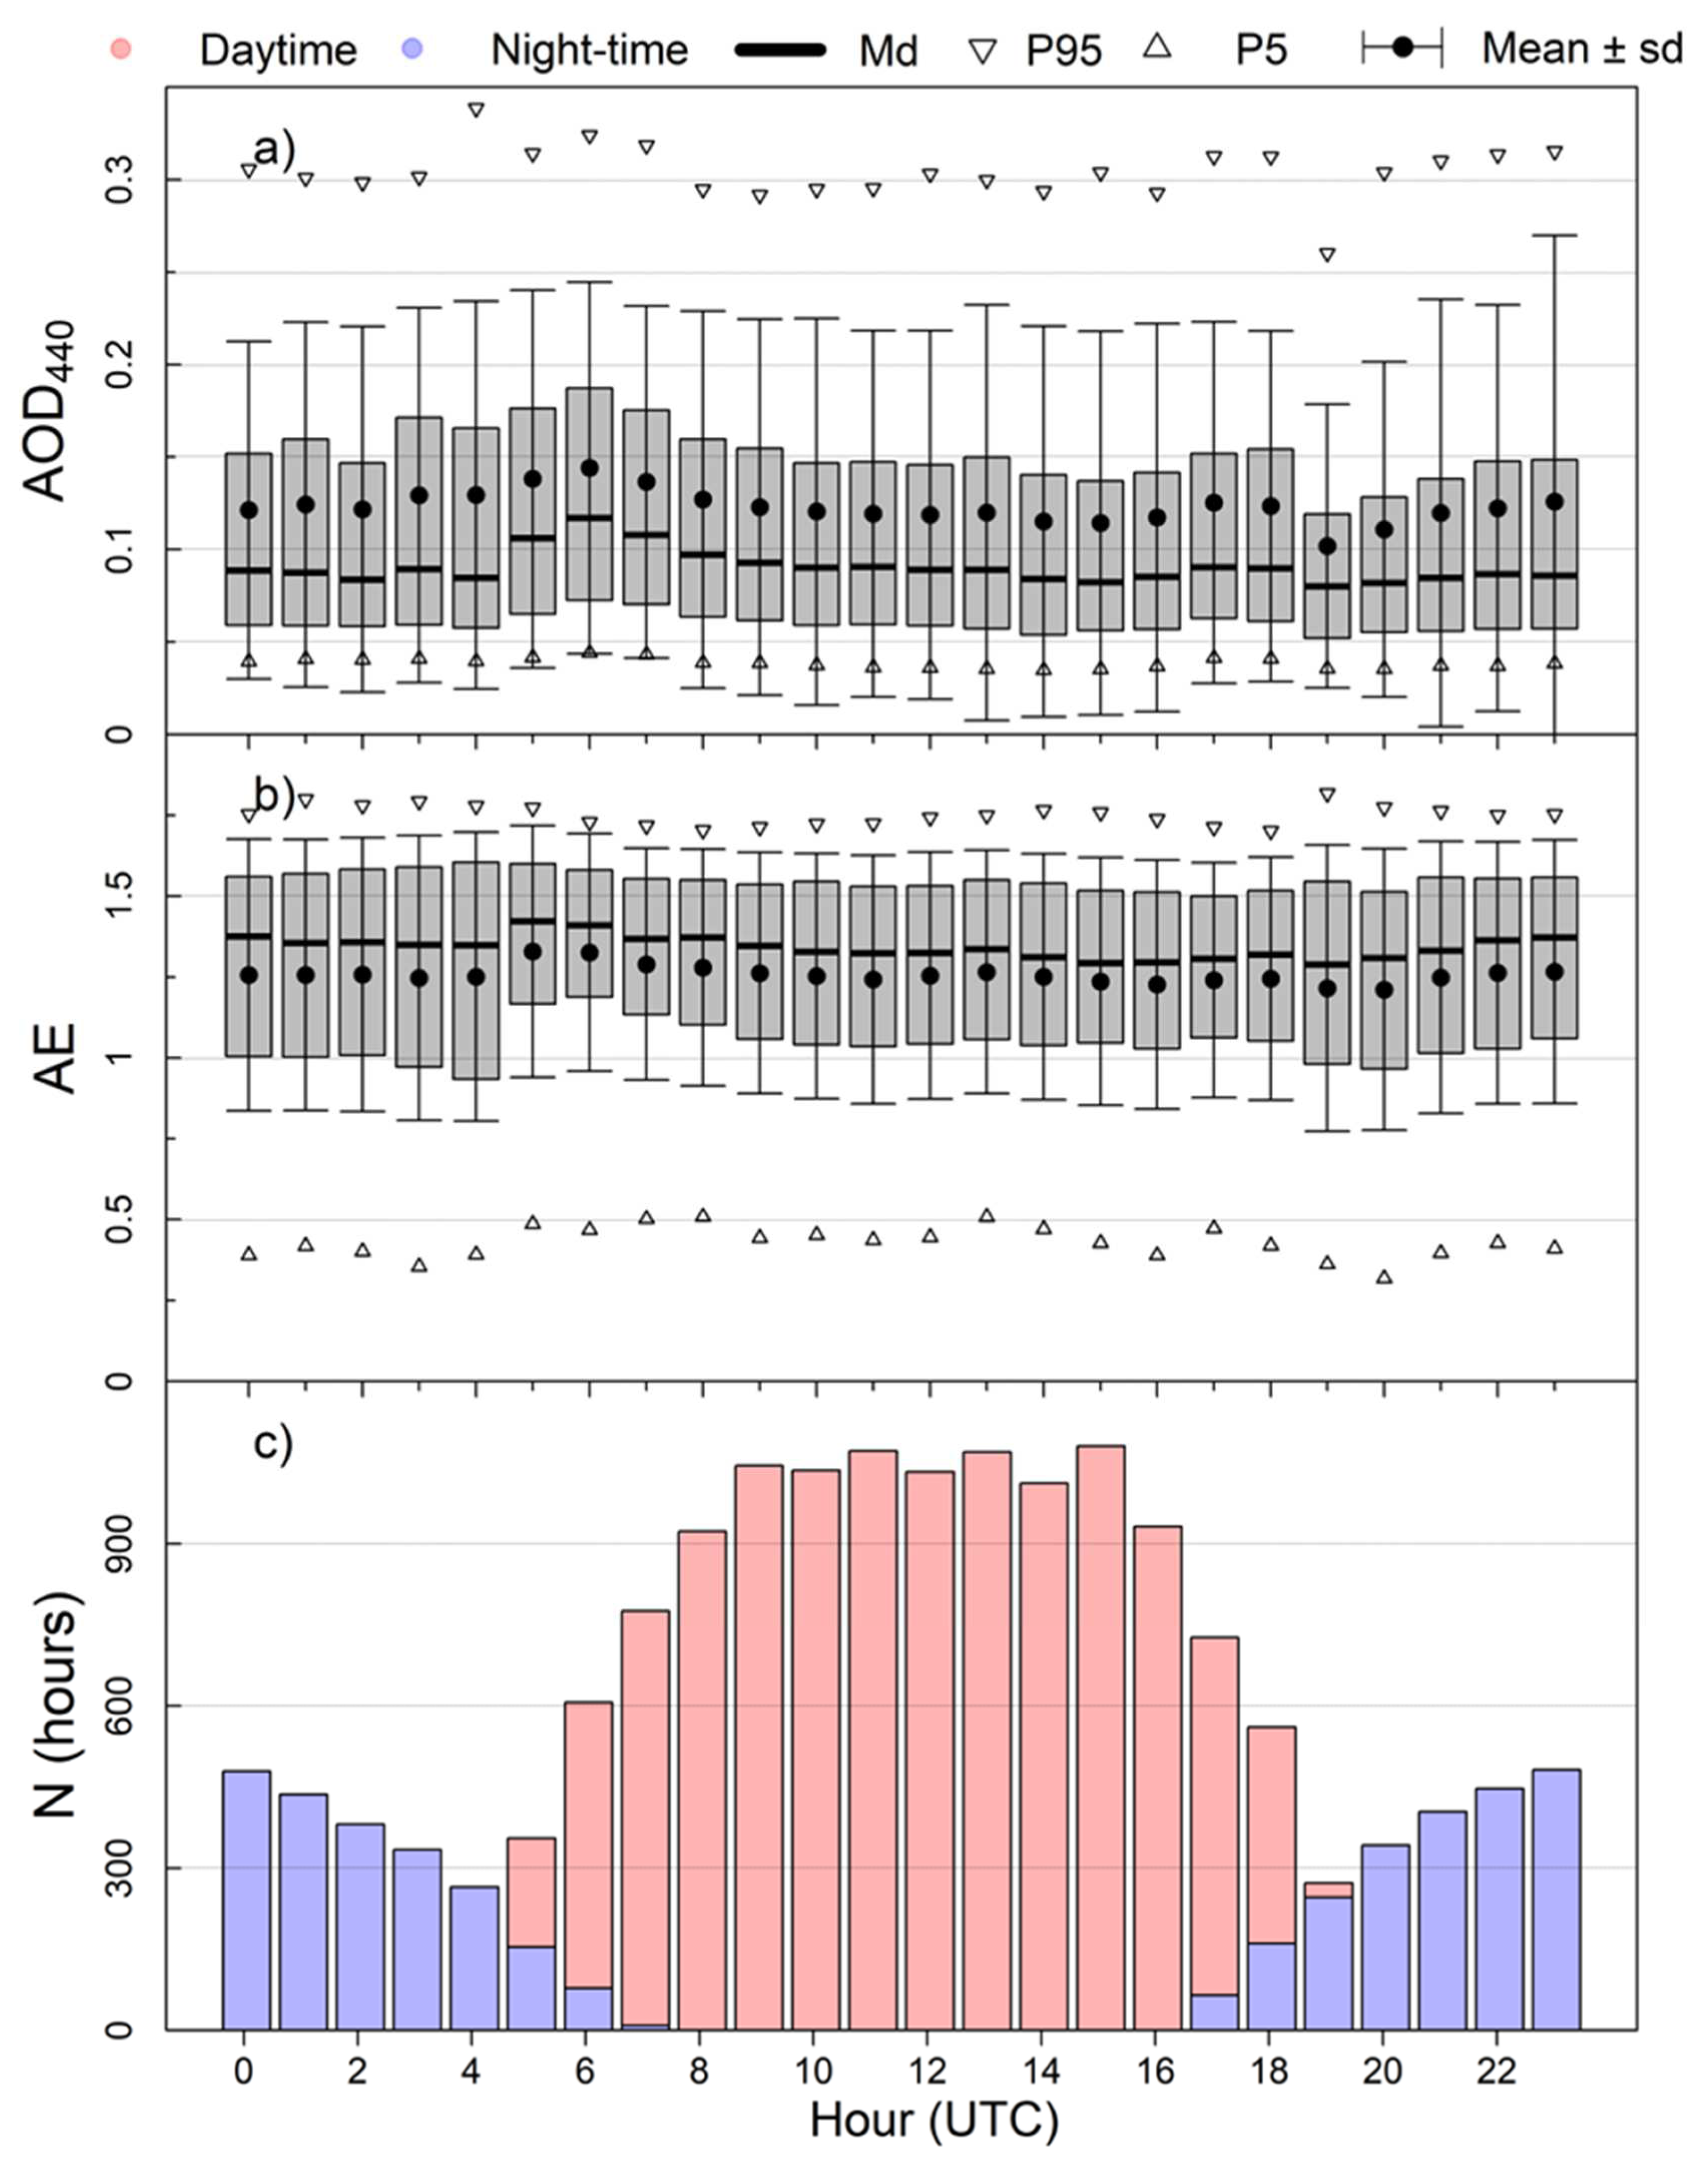
3.3. Daily Cycle
4. Summary and Conclusions
Author Contributions
Funding
Data Availability Statement
Acknowledgments
Conflicts of Interest
Appendix A
References
- Boucher, O.; Randall, D.; Artaxo, P.; Bretherton, C.; Feingold, G.; Forster, P.; Kerminen, V.; Kondo, Y.; Liao, H.; Lohmann, U.; et al. Clouds and Aerosols. In Climate Change 2013: The Physical Science Basis. Contribution of Working Group I to the Fifth Assessment Report of the Intergovernmental Panel on Climate Change Coordinating Lead Authors: Lead Authors; Cambridge University Press: Cambridge, UK, 2013. [Google Scholar]
- Shindell, D.; Faluvegi, G.; Nazarenko, L.; Bowman, K.; Lamarque, J.F.; Voulgarakis, A.; Schmidt, G.A.; Pechony, O.; Ruedy, R. Attribution of Historical Ozone Forcing to Anthropogenic Emissions. Nat. Clim. Chang. 2013, 3, 567–570. [Google Scholar] [CrossRef]
- Szopa, S.; Naik, V.; Adhikary, B.; Artaxo, P.; Berntsen, T.; Collins, W.; Fuzzi, S.; Gallardo, L.; Kiendler-Scharr, A.; Klimont, Z.; et al. Short-Lived Climate Forcers. In Climate Change 2021: The Physical Science Basis. Contribution of Working Group I to the Sixth Assessment Report of the Intergovernmental Panel on Climate Change; Masson-Delmotte, V., Zhai, P., Pirani, A., Connors, S.L., Péan, C., Berger, S., Caud, N., Chen, Y., Goldfarb, L., Gomis, M.I., et al., Eds.; Cambridge University Press: Cambridge, UK, 2021; pp. 817–922. [Google Scholar]
- Ångström, A. Techniques of Determinig the Turbidity of the Atmosphere. Tellus 1961, 13, 214–223. [Google Scholar] [CrossRef]
- Cachorro, V.E.; Casanova, J.L.; de Frutos, A.M. The Influence of Ångström Parameters on Calculated Direct Solar Spectral Irradiances at High Turbidity. Sol. Energy 1987, 39, 399–407. [Google Scholar] [CrossRef]
- Holben, B.N.; Eck, T.F.; Slutsker, I.; Tanré, D.; Buis, J.P.; Setzer, A.; Vermote, E.; Reagan, J.A.; Kaufman, Y.J.; Nakajima, T.; et al. AERONET—A Federated Instrument Network and Data Archive for Aerosol Characterization. Remote Sens. Environ. 1998, 66, 1–16. [Google Scholar] [CrossRef]
- Wehrli, C. GAWPFR: A Network of Aerosol Optical Depth Observations with Precision Filter Radiometers. In Proceedings of the WMO/GAW Experts Workshop on a Global Surface Based Network for Long Term Observations of Column Aerosol Optical Properties, Davos, Switzerland, 8–10 March 2004. [Google Scholar]
- Nakajima, T.; Campanelli, M.; Che, H.; Estellés, V.; Irie, H.; Kim, S.-W.; Kim, J.; Liu, D.; Nishizawa, T.; Pandithurai, G.; et al. An Overview of and Issues with Sky Radiometer Technology and SKYNET. Atmos. Meas. Tech. 2020, 13, 4195–4218. [Google Scholar] [CrossRef]
- Barreto, Á.; Cuevas, E.; Granados-Muñoz, M.-J.; Alados-Arboledas, L.; Romero, P.M.; Gröbner, J.; Kouremeti, N.; Almansa, A.F.; Stone, T.; Toledano, C.; et al. The New Sun-Sky-Lunar Cimel CE318-T Multiband Photometer—A Comprehensive Performance Evaluation. Atmos. Meas. Tech. 2016, 9, 631–654. [Google Scholar] [CrossRef]
- Barreto, A.; Cuevas, E.; Damiri, B.; Romero, P.M.; Almansa, F. Column Water Vapor Determination in Night Period with a Lunar Photometer Prototype. Atmos. Meas. Tech. 2013, 6, 2159–2167. [Google Scholar] [CrossRef]
- Kieffer, H.H.; Stone, T.C. The Spectral Irradiance of the Moon. Astron. J. 2005, 129, 2887–2901. [Google Scholar] [CrossRef]
- Barreto, A.; Román, R.; Cuevas, E.; Pérez-Ramírez, D.; Berjón, A.J.; Kouremeti, N.; Kazadzis, S.; Gröbner, J.; Mazzola, M.; Toledano, C.; et al. Evaluation of Night-Time Aerosols Measurements and Lunar Irradiance Models in the Frame of the First Multi-Instrument Nocturnal Intercomparison Campaign. Atmos. Environ. 2019, 202, 190–211. [Google Scholar] [CrossRef]
- Barreto, Á.; Román, R.; Cuevas, E.; Berjón, A.J.; Almansa, A.F.; Toledano, C.; González, R.; Hernández, Y.; Blarel, L.; Goloub, P.; et al. Assessment of Nocturnal Aerosol Optical Depth from Lunar Photometry at the Izaña High Mountain Observatory. Atmos. Meas. Tech. 2017, 10, 3007–3019. [Google Scholar] [CrossRef]
- Román, R.; González, R.; Toledano, C.; Barreto, Á.; Pérez-Ramírez, D.; Benavent-Oltra, J.A.; Olmo, F.J.; Cachorro, V.E.; Alados-Arboledas, L.; de Frutos, A.M.; et al. Correction of a Lunar-Irradiance Model for Aerosol Optical Depth Retrieval and Comparison with a Star Photometer. Atmos. Meas. Tech. 2020, 13, 6293–6310. [Google Scholar] [CrossRef]
- Fuertes, D.; Toledano, C.; González, R.; Berjón, A.; Torres, B.; Cachorro, V.E.; De Frutos, Á.M. CÆLIS: Software for Assimilation, Management and Processing Data of an Atmospheric Measurement Network. Geosci. Instrum. Methods Data Syst. 2018, 7, 67–81. [Google Scholar] [CrossRef]
- González, R.; Toledano, C.; Román, R.; Fuertes, D.; Berjón, A.; Mateos, D.; Guirado-Fuentes, C.; Velasco-Merino, C.; Antuña-Sánchez, J.C.; Calle, A.; et al. Daytime and Nighttime Aerosol Optical Depth Implementation in CÆLIS. Geosci. Instrum. Methods Data Syst. 2020, 9, 417–433. [Google Scholar] [CrossRef]
- Kouremeti, N.; Gröbner, J.; Kazadzis, S.; Pfiffner, D.; Soder, R. Development of a Lunar PFR PMOD/WRC Annual Report 2015 Eth-22636-17_2015; ETH Zurich: Zürich, Switzerland, 2016. [Google Scholar]
- Uchiyama, A.; Shiobara, M.; Kobayashi, H.; Matsunaga, T.; Yamazaki, A.; Inei, K.; Kawai, K.; Watanabe, Y. Nocturnal Aerosol Optical Depth Measurements with Modified Sky Radiometer POM-02 Using the Moon as a Light Source. Atmos. Meas. Tech. 2019, 12, 6465–6488. [Google Scholar] [CrossRef]
- Bennouna, Y.S.; Cachorro, V.E.; Mateos, D.; Burgos, M.A.; Toledano, C.; Torres, B.; de Frutos, A.M. Long-Term Comparative Study of Columnar and Surface Mass Concentration Aerosol Properties in a Background Environment. Atmos. Environ. 2016, 140, 261–272. [Google Scholar] [CrossRef]
- Toledano, C.; González, R.; Fuertes, D.; Cuevas, E.; Eck, T.F.; Kazadzis, S.; Kouremeti, N.; Gröbner, J.; Goloub, P.; Blarel, L.; et al. Assessment of Sun Photometer Langley Calibration at the High-Elevation Sites Mauna Loa and Izaña. Atmos. Chem. Phys. 2018, 18, 14555–14567. [Google Scholar] [CrossRef]
- Giles, D.M.; Sinyuk, A.; Sorokin, M.G.; Schafer, J.S.; Smirnov, A.; Slutsker, I.; Eck, T.F.; Holben, B.N.; Lewis, J.R.; Campbell, J.R.; et al. Advancements in the Aerosol Robotic Network (AERONET) Version 3 Database—Automated near-Real-Time Quality Control Algorithm with Improved Cloud Screening for Sun Photometer Aerosol Optical Depth (AOD) Measurements. Atmos. Meas. Tech. 2019, 12, 169–209. [Google Scholar] [CrossRef]
- Mateos, D.; Cachorro, V.E.; Toledano, C.; Burgos, M.A.; Bennouna, Y.; Torres, B.; Fuertes, D.; González, R.; Guirado, C.; Calle, A.; et al. Columnar and Surface Aerosol Load over the Iberian Peninsula Establishing Annual Cycles, Trends, and Relationships in Five Geographical Sectors. Sci. Total Environ. 2015, 518–519, 378–392. [Google Scholar] [CrossRef] [PubMed]
- López-Cayuela, M.Á.; Córdoba-Jabonero, C.; Bermejo-Pantaleón, D.; Sicard, M.; Salgueiro, V.; Molero, F.; Carvajal-Pérez, C.V.; Granados-Muñoz, M.J.; Comerón, A.; Couto, F.T.; et al. Vertical Characterization of Fine and Coarse Dust Particles during an Intense Saharan Dust Outbreak over the Iberian Peninsula in Springtime 2021. Atmos. Chem. Phys. 2023, 23, 143–161. [Google Scholar] [CrossRef]
- Cachorro, V.E.; Burgos, M.A.; Mateos, D.; Toledano, C.; Bennouna, Y.; Torres, B.; De Frutos, Á.M.; Herguedas, Á. Inventory of African Desert Dust Events in the North-Central Iberian Peninsula in 2003–2014 Based on Sun-Photometer–AERONET and Particulate-Mass–EMEP Data. Atmos. Chem. Phys. 2016, 16, 8227–8248. [Google Scholar] [CrossRef]
- Mateos, D.; Cachorro, V.E.; Velasco-Merino, C.; O’Neill, N.T.; Burgos, M.A.; Gonzalez, R.; Toledano, C.; Herreras, M.; Calle, A.; de Frutos, A.M. Comparison of Three Different Methodologies for the Identification of High Atmospheric Turbidity Episodes. Atmos. Res. 2020, 237, 104835. [Google Scholar] [CrossRef]
- Perrone, M.R.; Lorusso, A.; Romano, S. Diurnal and Nocturnal Aerosol Properties by AERONET Sun-Sky-Lunar Photometer Measurements along Four Years. Atmos. Res. 2022, 265, 105889. [Google Scholar] [CrossRef]
- Mateos, D.; Antón, M.; Toledano, C.; Cachorro, V.E.; Alados-Arboledas, L.; Sorribas, M.; Costa, M.J.; Baldasano, J.M. Aerosol Radiative Effects in the Ultraviolet, Visible, and near-Infrared Spectral Ranges Using Long-Term Aerosol Data Series over the Iberian Peninsula. Atmos. Chem. Phys. 2014, 14, 13497–13514. [Google Scholar] [CrossRef]
- Fernández, A.J.; Sicard, M.; Costa, M.J.; Guerrero-Rascado, J.L.; Gómez-Amo, J.L.; Molero, F.; Barragán, R.; Basart, S.; Bortoli, D.; Bedoya-Velásquez, A.E.; et al. Extreme, Wintertime Saharan Dust Intrusion in the Iberian Peninsula: Lidar Monitoring and Evaluation of Dust Forecast Models during the February 2017 Event. Atmos. Res. 2019, 228, 223–241. [Google Scholar] [CrossRef]
- Pérez-Ramírez, D.; Lyamani, H.; Olmo, F.J.; Alados-Arboledas, L. Improvements in Star Photometry for Aerosol Characterizations. J. Aerosol Sci. 2011, 42, 737–745. [Google Scholar] [CrossRef]

Disclaimer/Publisher’s Note: The statements, opinions and data contained in all publications are solely those of the individual author(s) and contributor(s) and not of MDPI and/or the editor(s). MDPI and/or the editor(s) disclaim responsibility for any injury to people or property resulting from any ideas, methods, instructions or products referred to in the content. |
© 2023 by the authors. Licensee MDPI, Basel, Switzerland. This article is an open access article distributed under the terms and conditions of the Creative Commons Attribution (CC BY) license (https://creativecommons.org/licenses/by/4.0/).
Share and Cite
Herrero del Barrio, C.; Mateos, D.; Román, R.; González, R.; Herrero-Anta, S.; González-Fernández, D.; Calle, A.; Toledano, C.; Cachorro, V.E.; De Frutos Baraja, Á.M. Analysis of Daytime and Night-Time Aerosol Optical Depth from Solar and Lunar Photometry in Valladolid (Spain). Remote Sens. 2023, 15, 5362. https://doi.org/10.3390/rs15225362
Herrero del Barrio C, Mateos D, Román R, González R, Herrero-Anta S, González-Fernández D, Calle A, Toledano C, Cachorro VE, De Frutos Baraja ÁM. Analysis of Daytime and Night-Time Aerosol Optical Depth from Solar and Lunar Photometry in Valladolid (Spain). Remote Sensing. 2023; 15(22):5362. https://doi.org/10.3390/rs15225362
Chicago/Turabian StyleHerrero del Barrio, Celia, David Mateos, Roberto Román, Ramiro González, Sara Herrero-Anta, Daniel González-Fernández, Abel Calle, Carlos Toledano, Victoria Eugenia Cachorro, and Ángel Máximo De Frutos Baraja. 2023. "Analysis of Daytime and Night-Time Aerosol Optical Depth from Solar and Lunar Photometry in Valladolid (Spain)" Remote Sensing 15, no. 22: 5362. https://doi.org/10.3390/rs15225362
APA StyleHerrero del Barrio, C., Mateos, D., Román, R., González, R., Herrero-Anta, S., González-Fernández, D., Calle, A., Toledano, C., Cachorro, V. E., & De Frutos Baraja, Á. M. (2023). Analysis of Daytime and Night-Time Aerosol Optical Depth from Solar and Lunar Photometry in Valladolid (Spain). Remote Sensing, 15(22), 5362. https://doi.org/10.3390/rs15225362