Article

Wavelet Analysis of a Sentinel-2 Time Series to Detect Land Use Changes in Agriculture in the Vega Alta of the Guadalquivir River: Cantillana Case Study (Seville)

by
Emilio Ramírez-Juidias
1,
José-Lázaro Amaro-Mellado
2,3 and
Daniel Antón
4,5,*
1
Instituto Universitario de Arquitectura y Ciencias de la Construcción (IUACC), Universidad de Sevilla, 2 Reina Mercedes Avenue, 41012 Seville, Spain
2
Departamento de Ingeniería Gráfica, Universidad de Sevilla, 41092 Seville, Spain
3
Instituto Geográfico Nacional-Servicio Regional en Andalucía, 41013 Seville, Spain
4
Departamento de Expresión Gráfica e Ingeniería en la Edificación, Escuela Técnica Superior de Ingeniería en la Edificación, Universidad de Sevilla, 41012 Seville, Spain
5
School of Architecture, Design and the Built Environment, Nottingham Trent University, Nottingham NG1 4FQ, UK
*
Author to whom correspondence should be addressed.
Remote Sens. 2023, 15(21), 5225; https://doi.org/10.3390/rs15215225
Submission received: 31 July 2023 / Revised: 15 October 2023 / Accepted: 31 October 2023 / Published: 3 November 2023

Abstract

:
Historically, the Vega Alta of the Guadalquivir River (southern Spain) has been an anthropized space. Over time, the dominance of latifundia agriculture has evolved towards more intensive citrus-based agriculture. In this study, wavelet algorithms applied to Sentinel-2 time series were used to determine both the expansion of citrus plantations and the level of intensification of these plantations within the municipality of Cantillana. Sentinel-2 provides comprehensive global coverage from March 2017 to the present. Our study applied a 90% power wavelet transformation for the creation of a wavelet-smoothed time series for four years of Sentinel-2 NDVI data. Based on the data, it can be stated that within our research region covering 5000 hectares of agricultural land, over a span of four years (2017 to 2020), more than 980 hectares of native vegetation and pasture were transformed into citrus orchards, giving rise, at the end of 2020, to a total area of 3250 ha. Analyzing unique spatial patterns within a wavelet-smoothed time series data is very useful for land management, as it allows land use changes to be controlled. For this reason, it becomes feasible to assess the reliability of the wavelet method using both remote sensing and GIS tools.

1. Introduction

In the 1980s, while the global economic integration process of the Spanish economy intensified, multiple experiences of local development arose and developed as a response to the unemployment and backwardness in many Spanish municipalities. In the Autonomous Community of Andalusia, it had its expression in those municipalities belonging to the regions of Montilla, Cabra, Lucena, and Puente Genil, located in the province of Córdoba, El Condado, located in the province of Huelva, and Antequera, located in the province of Malaga [1]. The objective was to reduce poverty, create employment, and promote economic and social progress. The driver was constituted by local agents and communities, which promoted economic initiatives with the purpose of facing the challenges posed by productive adjustment and the growing competition in national and international markets. This event did not occur in Cantillana, in the province of Seville.
However, since mid-2007, the Spanish economy, like the economies of many other countries, has been affected by the international crisis of the financial system. This fact caused a blockage in economic functioning in addition to a decrease in both productive activity and internal and external demands. Likewise, there was growth in the unemployment rate and a subsequent increase in poverty. This final consequence led to a noticeable worsening of the economic fabric of towns located in the most depressed areas of the country in the case of Andalusia, mainly its villages [2]. In this regard, it is necessary to comment that Cantillana reached an unemployment rate higher than 50% [3].
As is well known, an economic crisis such as the one that occurred cannot be resolved solely by applying monetary policies. On the contrary, it is necessary to design policies that stimulate the quantitative expansion of the money in circulation in order to activate demand. On this basis, it is a treatment that combines actions to recover consumer confidence to make the financial system work with initiatives aimed at improving both productivity and competitiveness [4]. In short, it is a matter of implementing different economic development strategies in this area where local development initiatives play a determining role. Mainly, this is because they shape their strategies through a territorial approach that aligns closely with the social and productive conditions of the specific municipality while always being rooted in the examination and enhancement of local internal factors [2].
To effectively engage with the productive system, it is crucial to recognize that the agricultural actions and decisions to be made will occur within distinct regions marked by the unique social, institutional, and cultural contexts with which they interact. In this context, the essential factors include the agricultural potential present in the specific area in question and the organizational capabilities of local stakeholders [2]. It is precisely from this perspective that local initiatives must be articulated. The reason is that the territories have a set of resources that constitute their development potential. In the case of Cantillana, one of the pillars is citriculture.
In this regard, Cantillana constitutes a dominant sector over all the others, the agricultural sector, and within this, citrus cultivation is what historically has been the major economic source of the municipality. Currently, this woody crop occupies more than 64.5% of the irrigable area (and continues to increase) and around 45% of the entire agrarian area used for agriculture [2]. For this reason, due to the importance of citrus-related economic activity in the municipality of Cantillana, a pioneering research project [
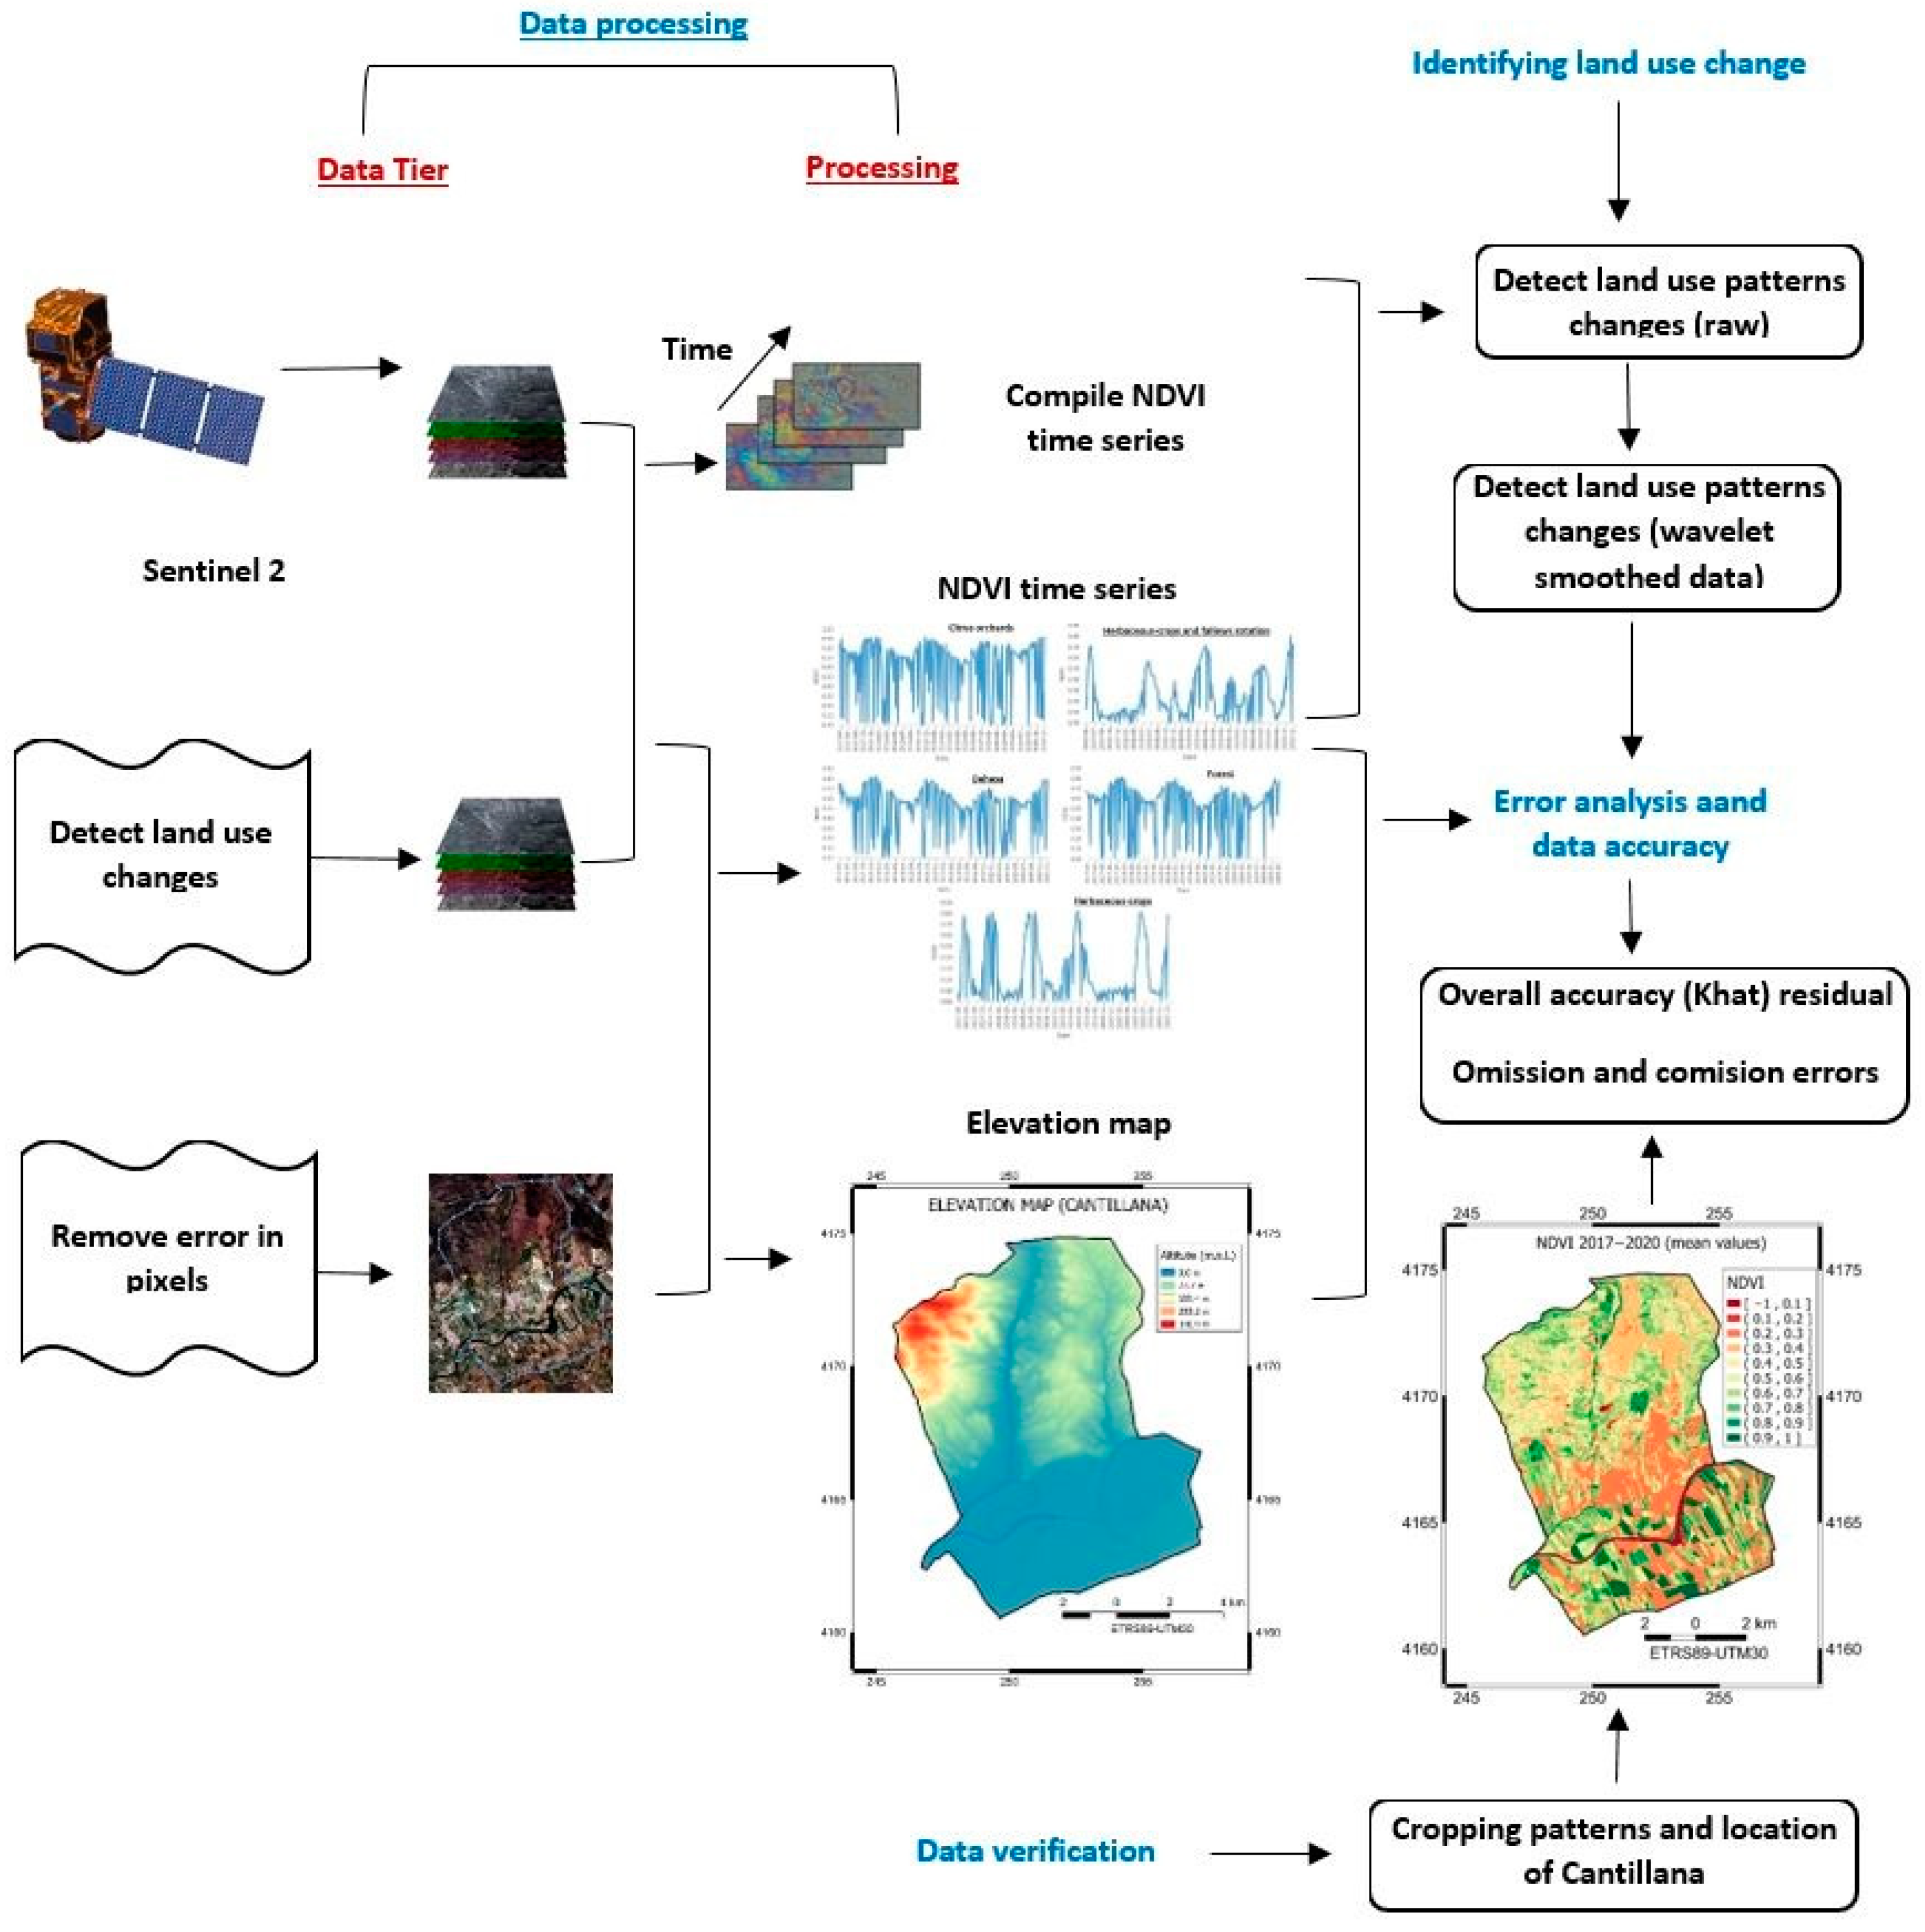
2] was carried out via a public initiative (from 3 August 2015 to 3 August 2020). This project, through the use of geographic information systems (GIS) and remote sensing tools, was intended to increase the profitability and competitiveness of citrus farms. To achieve this objective, a technology transfer was carried out and specially designed in the form of patents, utility models, and industrial designs.
Regarding the above, it must be emphasized that the agricultural development of Cantillana has a strong dependence on the agricultural policies carried out previously. For this reason, and given that land use changes continue to occur today as a consequence of the prevalence of the aforementioned agrarian policies, its presentation is vital to adequately understand the results and discussion of this work.
Furthermore, by employing GIS and remote sensing technology, along with comprehensive climate data comprising temperature and rainfall records, it becomes possible to establish the correlations between these variables and the various specific conditions observed at the plot level [5,6]. With this, sustainability and eco-design parameters can be established that allow an optimal adjustment of the available resources, as well as an improvement in production levels through the minimum and necessary use of inputs.
Logically, the quality of the obtained product (orange fruit) is one of the factors to take into account, which is why technology transfer strategies, as well as local initiatives, have to be linked with the purpose of improving it.
On the other hand, regional changes in land cover and land use can have important implications for the environment and agriculture, leading to alterations in carbon and nitrogen storage, surface water quality, trace gas emissions, and biodiversity [7,8,9,10,11,12,13]. Thus, the first step in comprehending the consequences of agricultural expansion and intensification is to identify the spatial and temporal patterns of this phenomenon. This information is critical for determining the long-term impacts on crop production, as well as agricultural sustainability, the environment, and the economy.
As is well known, remotely detected green leaf phenology is a useful measure for distinguishing between different types of land cover and land use changes, particularly in agricultural settings. The croplands’ phenology is more complicated than that of natural land cover, owing to the numerous peaks that arise from the successive planting of multiple crops during a single growing season. Moreover, the homogeneous coverage of green leaves in agricultural fields results in extremely high observed greenness, specifically when contrasted with the barren soil that remains following harvest. Over time, the substantial range of cropland green vegetation is influenced significantly by natural factors, such as the amount and temporal rainfall variability, and management choices, including the time of planting and the crop variety used. In this sense, the studies carried out by [14,15,16] are of great importance.
It is widely acknowledged that vegetation plays a significant role in agricultural ecosystems, as highlighted in references [14,15]. Consequently, the Normalized Difference Vegetation Index (NDVI), closely linked to measures such as green biomass and leaf area indices at different levels (regional, national, or international), has gained extensive recognition for its utility in examining alterations in terrestrial vegetation patterns and its capacity to capture photosynthetically active radiation (fAPAR) by canopy [15].
Phenology studies typically apply curve-fitting algorithms to simplify parameterization and identify metrics such as the start of the season. Land cover can be identified from specific characteristics of green leaf phenology, including the season onset, dry season minimums, and amplitude of maximums, as demonstrated in previous studies [17,18]. A multi-point smoothing function is the simplest way to create a smoothed time series, but it may not effectively remove high-frequency noise. Other curve-fitting approaches [17] use a harmonic curve-fit to characterize the inter-annual variability of a time series. A sigmoid curve-fitting algorithm [18,19] can be applied to a single year’s time series, but it requires an understanding of the prior system’s seasonality to spot the phenological peaks [18,19,20].
Several methods have successfully identified cropping systems in certain environments, but these are not effective for Cantillana agriculture for three reasons. First, multi-point smoothing functions cannot eliminate high-frequency noise driven by the long rainy season, which would require a finely tuned crop detection algorithm that accounts for the precipitation gradients in the area. Second, using average annual phenology to identify land cover fails to capture the inherent variability of the system [17], which can change dramatically yearly. Fourier transforms are also unsuitable due to the non-stationary nature of the time series signal, more appropriately addressed by wavelet transforms [21]. Third, stochastic rainfall’s nature and human action influence the calendar and spatial patterns of phenology peaks, making it challenging to predict precisely when they will occur. Additionally, certain curve-fitting algorithms, like SIGMOD, require a priori knowledge of the phenology peaks’ timing, which does not apply to this system [18,19].
In order to undertake the challenge of removing high-frequency noise whilst remaining sensitive to annual changes in phenology, we will follow the wavelet-based curve-fitting methodology used by Rhif et al. [
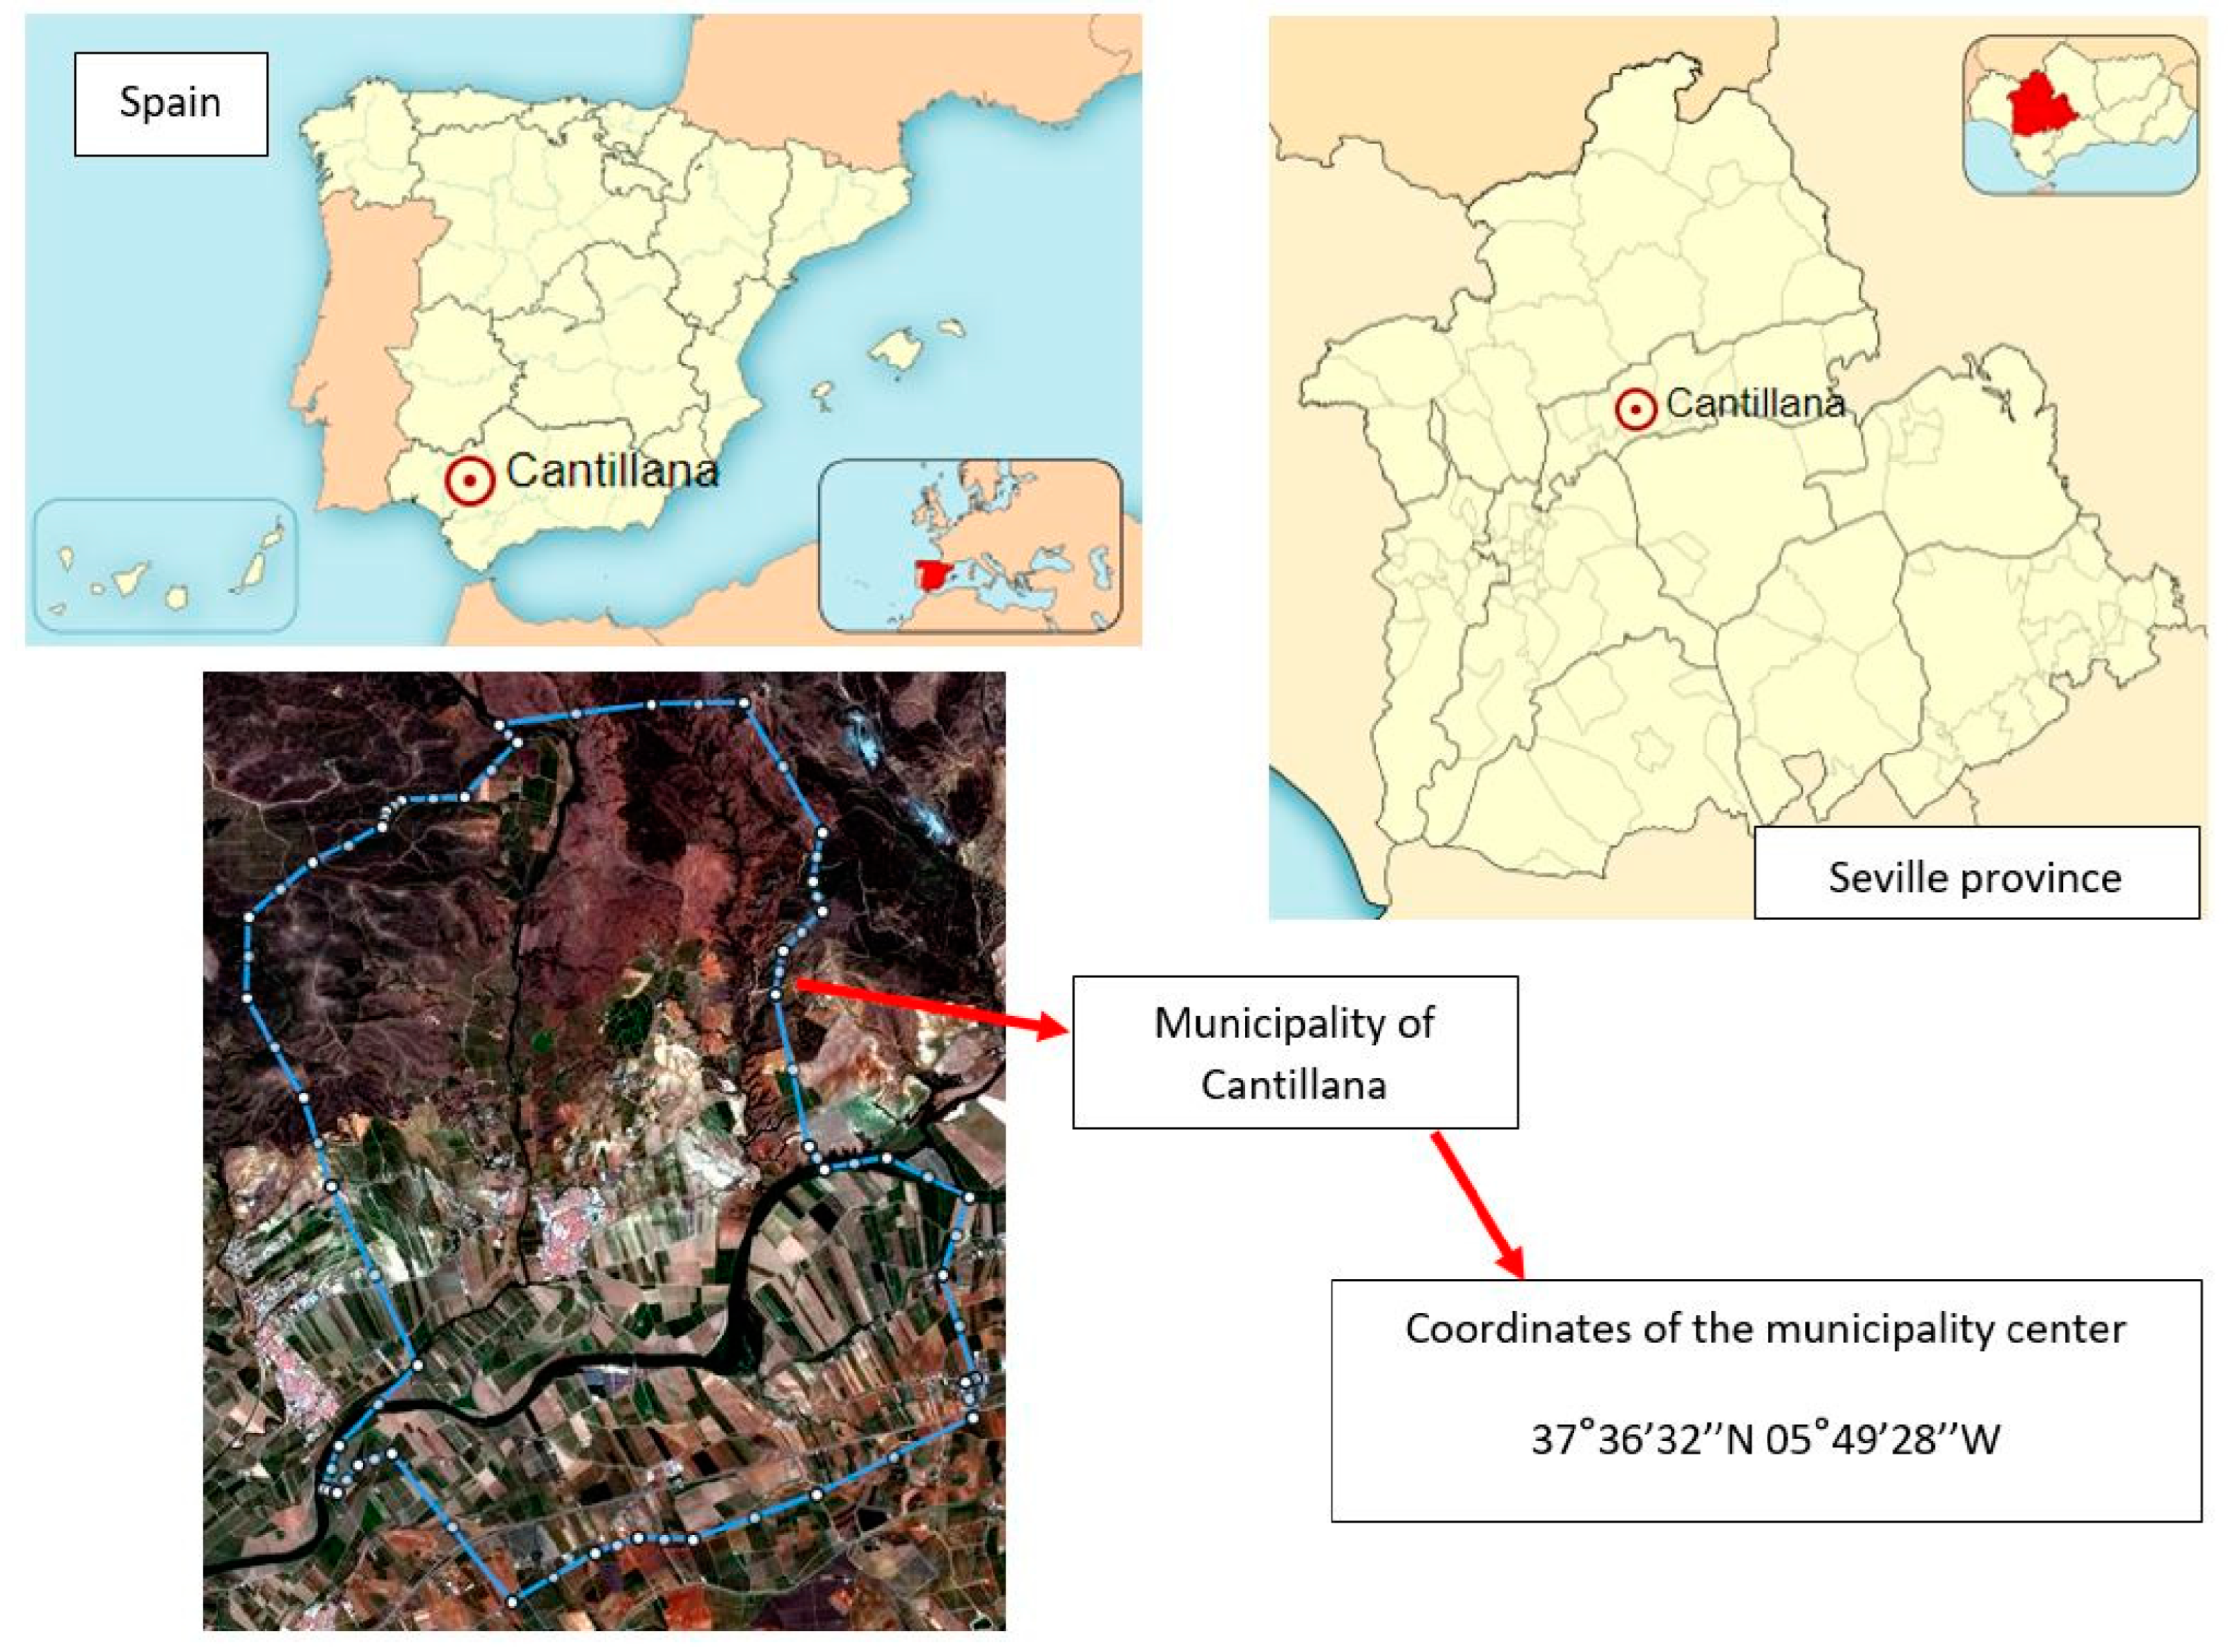
21], called the Wavelet-Based Filter for Determining Crop Phenology (WFCP). To evaluate the efficacy of this approach in a generalized context, it is crucial to ensure that it can be applied to a variety of study areas while not compromising performance or demanding extensive modifications. Our research focuses on the Guadalquivir Valley, where Cantillana is located, which offers a consistent test for the wavelet methodology due to the significant fluctuation in phenology patterns and the additional noise caused by the tropical rainy season. We have a particular interest in applying the WFCP to this area because it has demonstrated strong curve-fitting capabilities for citrus orchard phenology and has the potential to be a rapid and highly automated method.
To study highly dynamic systems, we rely on a wavelet transform for time series analysis. The wavelet analysis efficiently extracts valuable information from large datasets, including hyperspectral image cubes, seismological signals, vegetated land cover, and sea surface temperature [21,22,23,24,25,26,27].
The use of wavelet analysis has been found to be effective in identifying the beginning of the growing season and the timing of harvest in agriculture applications, with a low error rate of 11 to 14 days [21]. Wavelet analysis is well suited to agricultural patterns that occur over time and fields’ spatial heterogeneity due to precipitation and management decisions, as it is capable of localizing the transformation in time and frequency. It must be taken into account that, when cloud cover is frequent in the study area, the use of wavelet analysis is particularly desirable, as it can effectively remove high-frequency noise in a highly automated manner.
Remote sensing can provide valuable insights into the impact of the extensification and intensification in croplands on both the natural environment and agricultural sustainability. In the Vega Alta of the Guadalquivir River, where industrial-scale croplands (industrial agriculture model) are becoming more prevalent, the shift towards citrus orchards and the intensification of cropping systems can have long-term biogeochemical effects on soil fertility [21]. Industrial agriculture is an agricultural model that aims to directly commercialize what is grown. This production method is one of the most used in the world since it is efficient enough to achieve profitable economic returns for the farmers who choose to carry it out. This type of agriculture is of enormous importance for the agrarian economy of the Guadalquivir Valley. For this reason, the main aim of this research is specified below:
  • To detect patterns of citrus orchards in the Viar River’s Irrigable Area (Cantillana, Spain) using wavelet-smoothed time series analysis of Sentinel-2 data sets.
By testing the effectiveness of wavelet analysis on time series data, the highlights of this study are:
  • The potential utility of wavelet analysis for identifying land use and land cover changes in agricultural environments close to the Viar River’s Irrigable Area;
  • Studying the dynamics of citrus orchards’ patterns and discussing their interconnection with the dynamics of NDVI and the topography of the study area.
The novelty of this work focuses on the fact that it is the first time that wavelet analysis has been carried out in the Vega of the Guadalquivir River. In the same way, due to the NDVI time series of land uses in the study area, this work serves as a basis for developing a territory management tool dependent on Sentinel-2 data.

2. Materials and Methods

2.1. Study Area

In Figure 1, it can be seen that the municipality of Cantillana (37°36′32″N 05°49′28″W), located in the Vega Alta of the Guadalquivir River, is limited to the north by the foothills of Sierra Morena and has an area of 107.70 km2.
The study area, with a temperate and warm climate (type Csa, according to the Köppen–Geiger climate classification), presents an average annual temperature of 18.8 °C. Precipitation in the study area is 521 mm per year. Regarding the dry season, it should be mentioned that it runs from June to September (Figure 2), while the rainy season runs from October to April, both inclusive (Figure 3) [28].
Regarding the existing textural type in the study area, it must be specified that it is variable (clay–silty, loam–silt, loam–sandy, and loam), which must be taken into account when scheduling adequate irrigation. The soil pH varies between 7 and 8.5, with traces of NO3, P2O5, and K2O [2].
Currently, citrus plantations coexist in the study area (83.71%) with herbaceous crops (mainly corn and cotton) (10%). The remaining area is occupied by dehesas “like a savannah” (1.2%), forests (2.95%), and fallows (2.14%).
In another vein, in accordance with data from the Spanish National Institute of Statistics (INE) [29], Foro Ciudad (FC) [30], and the Cantillana City Council [3], the population of Cantillana presents an upward trend, varying from 4386 inhabitants in 1842 to 10,751 people in 2022. In this regard, it should be noted that property structures play a fundamental role in conditioning the evolution of agriculture in the study area. In this sense, it is relevant to mention that in the study area, there are two extremes in terms of land ownership; on the one hand, 5% of the owners have accumulated 60% of the arable land, and on the other hand, 50% of the owners hold 5% of the arable land (the remaining 45% owns 35% of farmland).

2.2. Datasets and Pre-Processing

2.2.1. Field Data

In April 2017, fieldwork was conducted in all the citrus orchards in Cantillana to provide field control points. Mapping was conducted using a handheld GPS to identify three management units with distinct agricultural histories. These histories cover type or land use information prior to the citrus orchards, the conversion moment into citrus orchards, and the cropping patterns deployed for each year of land use as citrus orchards. The Junta de Andalucía (the Andalusian regional government) shared the records of these histories with us. In addition, data collection was undertaken in each citrus plot in Cantillana.

2.2.2. Remote Sensing Time Series Data

By utilizing remotely sensed data, it is possible to classify croplands in a comprehensive manner. This is achieved by detecting and analyzing significant features, or parameters, of changes in land cover and land use over time, as revealed via a smoothed NDVI time series. In this particular study, the Sentinel-2 L2A 5-day dataset was employed.
NDVI products were generated using the standard formulation [31], as it has a favorable dynamic range that can effectively capture citrus orchards’ phenology [31]. By merging the NDVI images, we created an NDVI time series for every pixel even though the time intervals between them were uneven. For a specific pixel, we created an unevenly spaced time series and utilized the observation flag date that was incorporated in the data output as the day of the year for each observation. This technique enabled us to further sharpen the definition of the moment and size of the green peaks.

2.3. Methods

A summary of the approach employed, or flowchart, is outlined in Figure 4, with the overall method drawing upon the “Wavelet based Filter for Crop Phenology” (WFCP) technique [21]. The methodology consists of four key stages: (1) the processing of data, (2) the determination of land usage, (3) the verification of results in the field, and (4) the analysis of errors.

2.3.1. Data Processing

The processing of data for pixels that were affected by noise and contamination involved two main steps. The first step was to detect the pixels that were contaminated by clouds and had excessive noise. The second step involved replacing the bad data points using linear interpolation. The processing considered each pixel as a single-dimensional time series, and for each time-step, if the band 1 (443 nm) reflectance values exceeded 10%, the data point was identified as cloud-contaminated and removed [26]. Additionally, data points that showed an extreme level of noise, which was typically caused by little cloud contamination, were removed when exceeding a change threshold of 0.15 in NDVI from the value at the previous time step.
The missing values were filled in utilizing linear interpolation from the available observed data points. To avoid any potential aliasing effect while generating a wavelet-smoothed time series, we generated a daily time step NDVI time series since the observation dates were different for each pixel and were not uniformly spaced. Afterward, we decreased the dataset size and processing time for further analysis by resampling the interpolated data set for each day to five-day bins.
Initially, the citrus orchards were distinguished from other types of land coverage. Vegetation within the citrus orchards underwent a significant annual standard deviation in comparison to other types of vegetation because of high density during growth and low density after harvest. When rotating between herbaceous crops and fallows, there was low phenological variation, with an average NDVI value of 0.24, which seldom exceeded 0.8 NDVI. The phenology of the dehesa land use demonstrated some seasonal variation, with a decrease in greenness during the dry season and an increase during the rainy season, showing a mean annual NDVI of 0.5 and a maximum of approximately 0.82 NDVI. Both rotations between herbaceous crops and fallows and dehesas had a standard deviation of around 0.21 NDVI. The forest phenology was comparable to that of a dehesa, with a slightly wider dynamic range and an average NDVI value of 0.51. Herbaceous crops often presented maximum NDVI values above 0.8 and NDVI minimums that frequently fell below 0.1 (Figure 5).
In order to justify the eligible selection chosen in this study, the Coiflet wavelet graphs (Figure 6) corresponding to the different uses are shown below, as well as the NDVI maps (Figure 7) for the different years (2017–2020).
Figure 8 shows the spectral analysis conducted from the NDVI temporal series illustrated in Figure 5.

2.3.2. Using a Wavelet-Smoothed Technique to Create an NDVI Time Series

In this context, we applied a discrete wavelet transformation method that involved the use of a wavelet function represented by the symbol “Φ(t)”. The wavelet function was characterized by its oscillatory behavior (as indicated in Equation (1)), as well as having a finite energy and a mean value of zero.
+ Φ ( t ) d t = 0    
Equation (2) provides the definition of the wavelet transformation, denoted by “W(a, b)”.
W ( a ,   b ) i = 1 a · Φ * ( t b a ) s ( t ) d t    
In Equation (2), the input signal “s(t)” is analyzed using a mother wavelet, denoted by “Φ*”. The mother wavelet can be chosen from various options, such as Coiflet, Daubechies, and the derivative of a Gaussian (DOG) [27]. The width of the wavelet is determined by the parameter “b”, while the variable “t” stands for the time step in the one-dimensional time series. The wavelet transformation has the advantage of preserving information about the width and location, i.e., the scale and time, of the features in “s(t)”. Furthermore, Equation (2) can be utilized for signal reconstruction [22].
In Equation (3), the time series “W” produced by the wavelet is a sum of wavelets with various widths.
W = i = 1 n W ( a ,   b ) i      
In the given equation (Equation (3)), “W(a, b)i” represents the wavelet transformation obtained using Equation (1). The wavelet transformations with decreasing widths are added up from “i to x”, where “x” is the number of transformations required to retain the desired number of coefficients from the input data. The width of a wavelet transformation is half that of the previous one. The sum of these wavelet transformations, denoted by “W” in Equation (3), is referred to as the wavelet-smoothed time series.
To prevent aliasing effects, the wavelet filtering process commenced with the application of a smoothing function to an evenly spaced, one-dimensional time series, following cloud elimination and missing data interpolation. Initially, a discrete wavelet transformation was employed to eliminate any remaining high-frequency noise. Subsequently, the smoothed NDVI time series was recomposed using an inverse discrete wavelet transformation.
In order to apply wavelet analysis to an NDVI time series, several parameters of the mother wavelet, including its order and power, need to be chosen to specify its behavior. For our analysis, we opted to use the Coiflet mother wavelet with an order of 4, since its shape closely resembles the peaks in agricultural phenology that we were trying to identify [21]. The order of the wavelet determines its level of smoothness, with higher orders producing smoother wavelets [32].
In wavelet analysis, a power threshold needs to be set to determine whether the number of coefficients that dictate the portion of the input NDVI time series is preserved in the transformation. Increasing the power or the number of coefficients keeps more of the original data by yielding a narrower wavelet that comprises more fine-scale features, but it is also likely to conserve more noise. Conversely, reducing the power or the number of coefficients keeps less high-frequency data by using a wider wavelet. While a low-power wavelet can pick up trends throughout the entire time series, it can miss some of the phenological detail within an individual year.
Analysis was conducted to identify errors in cropping patterns using various detection thresholds (70%, 80%, 85%, 90%, and 95%) and power wavelets (with 0.3 and 0.4 NDVI detection thresholds). A total of 125 verification points were randomly selected within the agricultural zone of citrus orchards, and reference data on cropping patterns were generated from an NDVI time series with defective pixels discarded. The reference data were fed back to cross-check the observed cropping patterns from each wavelet-smoothed time series. Later, the results were compiled to estimate the overall accuracy (the proportion of correctly recognized points within a group, relative to the total number of points that were selected) and Khat (these values included misclassifications while assessing classification accuracy). Each verification point had four years of data, and each year was analyzed separately, resulting in a total of 500 checkpoints. More information on the detection threshold can be found in the following section.
According to Table 1, except for the 95% power wavelet, all wavelet powers had high levels of overall accuracy and Khat values, as demonstrated via this error analysis.
Based on the findings, it was determined that the wavelet-smoothed time series with 90% power was most effective in capturing cropping patterns and, therefore, would be the main focus of our continued analysis. To achieve this, we utilized the 90% power wavelet, which included 27 coefficients and resulted in the lowest omission and commission errors, and it also minimized the RMS error in detecting cropping patterns. Upon visual analysis, we observed a significant improvement in the performance of the 90% wavelet in comparison to the other wavelet powers across numerous pixels.
The method suggested by Rhif et al. [21] involves using multiple frequency thresholds to determine the plausible length of growing seasons and remove noise through wavelet analysis. However, in this study, we opted to use the power threshold instead of frequency thresholds to remove high-frequency noise. This approach was chosen because it did not require any assumptions about the length of the growing season, providing greater versatility to adjust narrow peaks. This is especially important when dealing with both very narrow peaks, typical of double cropping systems, and broad peaks, common in monocultures. As the application of wavelet filtering to the NDVI time series can cause distortion at the edges [21], we implemented a process of spinning up or conditioning the wavelet. In our study, we utilized a wavelet transformation to analyze the one-dimensional NDVI time series. To avoid distortion, we replicated the earliest and the most recent year of data ten times at the start and end of the time series. This allowed us to condition the wavelet and obtain accurate results. After the transformation, we removed the additional years of data from the wavelet-smoothed time series. The uniqueness of this research centers on the fact that, while the inherent noise structure is pre-established for some systems, achieving stationarity in an NDVI time series is a complex endeavor, mainly due to the presence of numerous additional layers. Consequently, this research employed a series spanning more than one year to include year-to-year variations.

2.3.3. Land Use and Phenology

The wavelet-smoothed NDVI time series was used to identify cropping patterns, which refer to the number of crops grown per year. The wavelet-smoothed NDVI time series has a maximum value for each crop grown. To determine whether a piece of cropland was used for single or double cropping, the number of local maximums in a growing year was counted. A local maximum was defined as a point with an NDVI value higher than the two points before and two points after it. The wavelet-smoothed NDVI time series was divided into four growing years, running from April to December between 2017 and 2020, and identified according to their respective harvest years.
The use of wavelets in detecting phenological peaks in crops can be problematic because wavelets can amplify small peaks and create false detections, especially in areas with low NDVI ranges. To address this issue, a cutoff value of 0.4 NDVI for the 90% power wavelet was used to remove false detections and minimize the detection of minor false peaks. Real phenological maximums in the NDVI time series may correspond to single or double crops, while the first maximum is frequently driven by the early green-up of volunteer crops or weeds. Weeds or other green cover can be distinguished from crops, as they do not exceed the 0.4 NDVI threshold. Nevertheless, this approach risks excluding very small real phenological maximums, like a failing crop that did not exceed the cutoff.
Using specific detection criteria, we can target changes in cropping patterns that indicate the intensification or extensification of cropland [26]. To verify these cropping patterns, we employed an observed NDVI time series with defective pixels weeded out, and we selected 125 verification points within cropland areas using a random point generator. Four growing seasons existed for each point in the time series, resulting in 500 total verification points. We matched the cropping pattern sensed from the 90% wavelet-smoothed time series to the original data and identified and tabulated misclassifications for each point. This process allowed us to evaluate the accuracy of our cropping pattern detections.
We could assess the accuracy of our cropping pattern detection by comparing our wavelet-smoothed time series to the agricultural history of Cantillana. The study area has multiple management units with different land use histories, and agricultural history data for citrus orchards were collected during a visit in April 2017. For each management unit, these data included information on the conversion timing, sequence, and cropping patterns in future years. To evaluate the effectiveness of our NDVI time series’ cleaning and wavelet transformation processes, we compared the observed cropping patterns to the citrus orchard records and analyzed how well they matched the processes that took place on the ground.

2.3.4. Statistical Error Assessments

We analyzed the quality of the curve-fitting using statistical methods, specifically by examining the residuals and root mean square (RMS) error. The RMS error was calculated by determining the difference between the raw NDVI time series and the wavelet-smoothed time series, and it provided a measure of the error magnitude in the curve-fitting. This method allowed us to judge the accuracy of our curve-fitting and ensure that our wavelet-smoothing process effectively captured the patterns in the data.
We examined the error in land use classes by contrasting the detected cropping patterns based on the wavelet-smoothed time series to the noted cropping patterns in the input data. An error matrix was created for the classes to measure the overall accuracy, the producer’s accuracy, the user’s accuracy, and the Khat value using KAPPA analysis. This method allowed us to evaluate the accuracy of the detected cropping patterns and determine any discrepancies between the wavelet-smoothed time series and the observed data.
Thus, the data were divided into four classes based on the data values to assess the statistical errors. These were: non-citrus-orchards, single cropping systems, double cropping systems, and unclassified. Each pixel’s class was considered a test point for one growing year, as the class may have changed from year to year. Omission and commission errors were calculated from two sets of reference data: a raw NDVI time series and spatially and temporally explicit historical farm data. In addition, the overall accuracy was computed as the ratio between the total number of correctly classified test points and the total number of test pixels used. The producer’s accuracy, or omission error, was calculated as the total number of correct pixels in a remotely sensed class divided by the total number of pixels in that class from the reference data. The user’s accuracy, or commission error, was calculated as the total number of correct pixels in a remotely sensed class divided by the total number of pixels in that remotely sensed class. The Khat statistic was obtained via KAPPA analysis for discrete multivariate accuracy assessment, which provides a subtly different accuracy assessment than overall accuracy, as it embodies information about the misclassifications reported in the error matrix. If the classification results were completely random, Khat would equal zero.
We compared the user-detected reference classes to the automated class detection, applying the wavelet-smoothed time series in order to calculate the overall accuracy of the raw NDVI reference test case. One hundred test points per class were used, with test points evenly distributed by year (25 test pixels per year per class) for the non-citrus-orchards and unclassified classes. For single and double crop classes, test points were weighted by their relative abundance in each year, and randomly located using a random sample. The results of crop detection using a wavelet-smoothed time series were tested against the raw NDVI input data, which were screened to the same criteria to generate the four classes. Omission and commission errors were used to assess the within-class accuracy, as well as the overall accuracy and the Khat value for the random test points throughout the whole scene.
The authors employed a set of established cropping patterns as reference data to compute both omission and commission errors across all the citrus orchards within the Cantillana study area. The validity of their findings was confirmed by cross-referencing an independent data source. However, the size of the study area (107.70 km2), limited only to the municipality of Cantillana, represents a constraint to this methodology.
We used two indicators to determine the level of citrus orchard agriculture, namely extensification and intensification. On the one hand, the former measures the growth in the total area of citrus orchards from one growing season to another by identifying areas not previously detected as citrus orchards. On the other hand, intensification refers to the shift from a single to a double cropping pattern from one year to the next. These metrics and concepts are helpful in understanding trends in agricultural development.

3. Results

3.1. Citrus Orchards’ Extensification

According to the cropland detection method based on annual standard deviation, the area of citrus orchards in the study location rose by 980 hectares, from 2270 ha in the 2017 growing season to 3250 ha in the 2020 growing season (Table 2). This indicates a growth of 43% in citrus orchard agriculture in the study region. The expansion of citrus orchards mostly occurred at the periphery of existing croplands.

3.2. Cropping Pattern Detection

The results of the statistical analysis of detection errors indicated that the wavelet-smoothed time series performed well overall. The error matrix revealed that most of the unclassified pixels (i.e., those with more than two crops detected) were actually fake detections of double crops, as shown in Table 3. To categorize single and double cropping patterns, we defined double crops as all pixels with two or more maximums, which may have introduced additional errors. Our accuracy could be evaluated based on the results of the error matrix, as displayed in Table 4. The omission and commission errors for each classification (i.e., non-citrus-orchards, including native vegetation and pastures, single cropping patterns, and double cropping patterns) were derived from the error matrix. All omission errors were below 10% except for that of single crops, which had a producer’s accuracy of 77.2%. The user’s accuracy was higher than 84.2% for every class, as indicated in Table 5. Using the wavelet-smoothed time series, we achieved an overall accuracy of 88.7% and a Khat value of 92.3% for the whole study region (as shown in Table 6).
The wavelet transformation method was used to detect changes in land use and land cover in the farms of Cantillana, where the previous crops were transformed into citrus orchards over time. The farming history revealed that the first year involved a single citrus orchard crop in 2017–2018, followed by a double crop (a citrus orchard and an olive tree orchard or a citrus orchard and a dehesa) in 2018–2019. Statistical analysis of the wavelet-derived classes compared with the land use records for Cantillana showed high accuracy (Table 7 and Table 8), as indicated by the producer’s and user’s accuracy values for different crop types. Nevertheless, the accuracy was lower for double crops due to higher omission errors. Due to the small sample size, the commission and omission errors might not be representative of the entire scene. The Khat value and overall accuracy were 85.9% and 94.2% (Table 6), respectively, for land use classifications on all Cantillana citrus orchards. This indicates that the wavelet transform method is a reliable technique for identifying land use and land cover changes on Cantillana’s farms.
The relationship between single and double cropping patterns was dynamic, and both patterns displayed a net increase, as indicated in Table 9. Between the start and end of the study period, the area dedicated to single crops expanded from 1132.73 hectares to 1241.50 hectares, while the area devoted to double crops increased from 1137.27 hectares to 2008.50 hectares. The growth in the single-crop area between 2017 and 2020 could be due to croplands extending into regions that were previously covered with natural vegetation. Subsequently, many single-crop areas may have been transformed into double-crop areas, suggesting a dynamic link between the two cropping patterns. The process of agricultural intensification, or growing more crops in a given area, follows a similar trend to agricultural extensification, expanding from the established mechanized agricultural zones outwards to the periphery over time. It is important to consider the impact that these changes can have on the environment and the surrounding communities.
On the other hand, cropping pattern detection could be conducted using the NDVI maps trend shown in Figure 7. In this regard, it is of great interest to emphasize the use of elevation maps (Figure 9) because of the relationship between the crop type and altitude. In the same way, land cover maps (Figure 10 and Figure 11) should be taken into account.

4. Discussion

A large citrus orchard in the Iberian Peninsula, specifically in Cantillana, Andalusia, Spain, is taking over natural ecosystems and becoming one of the largest contiguous citrus plantations worldwide [
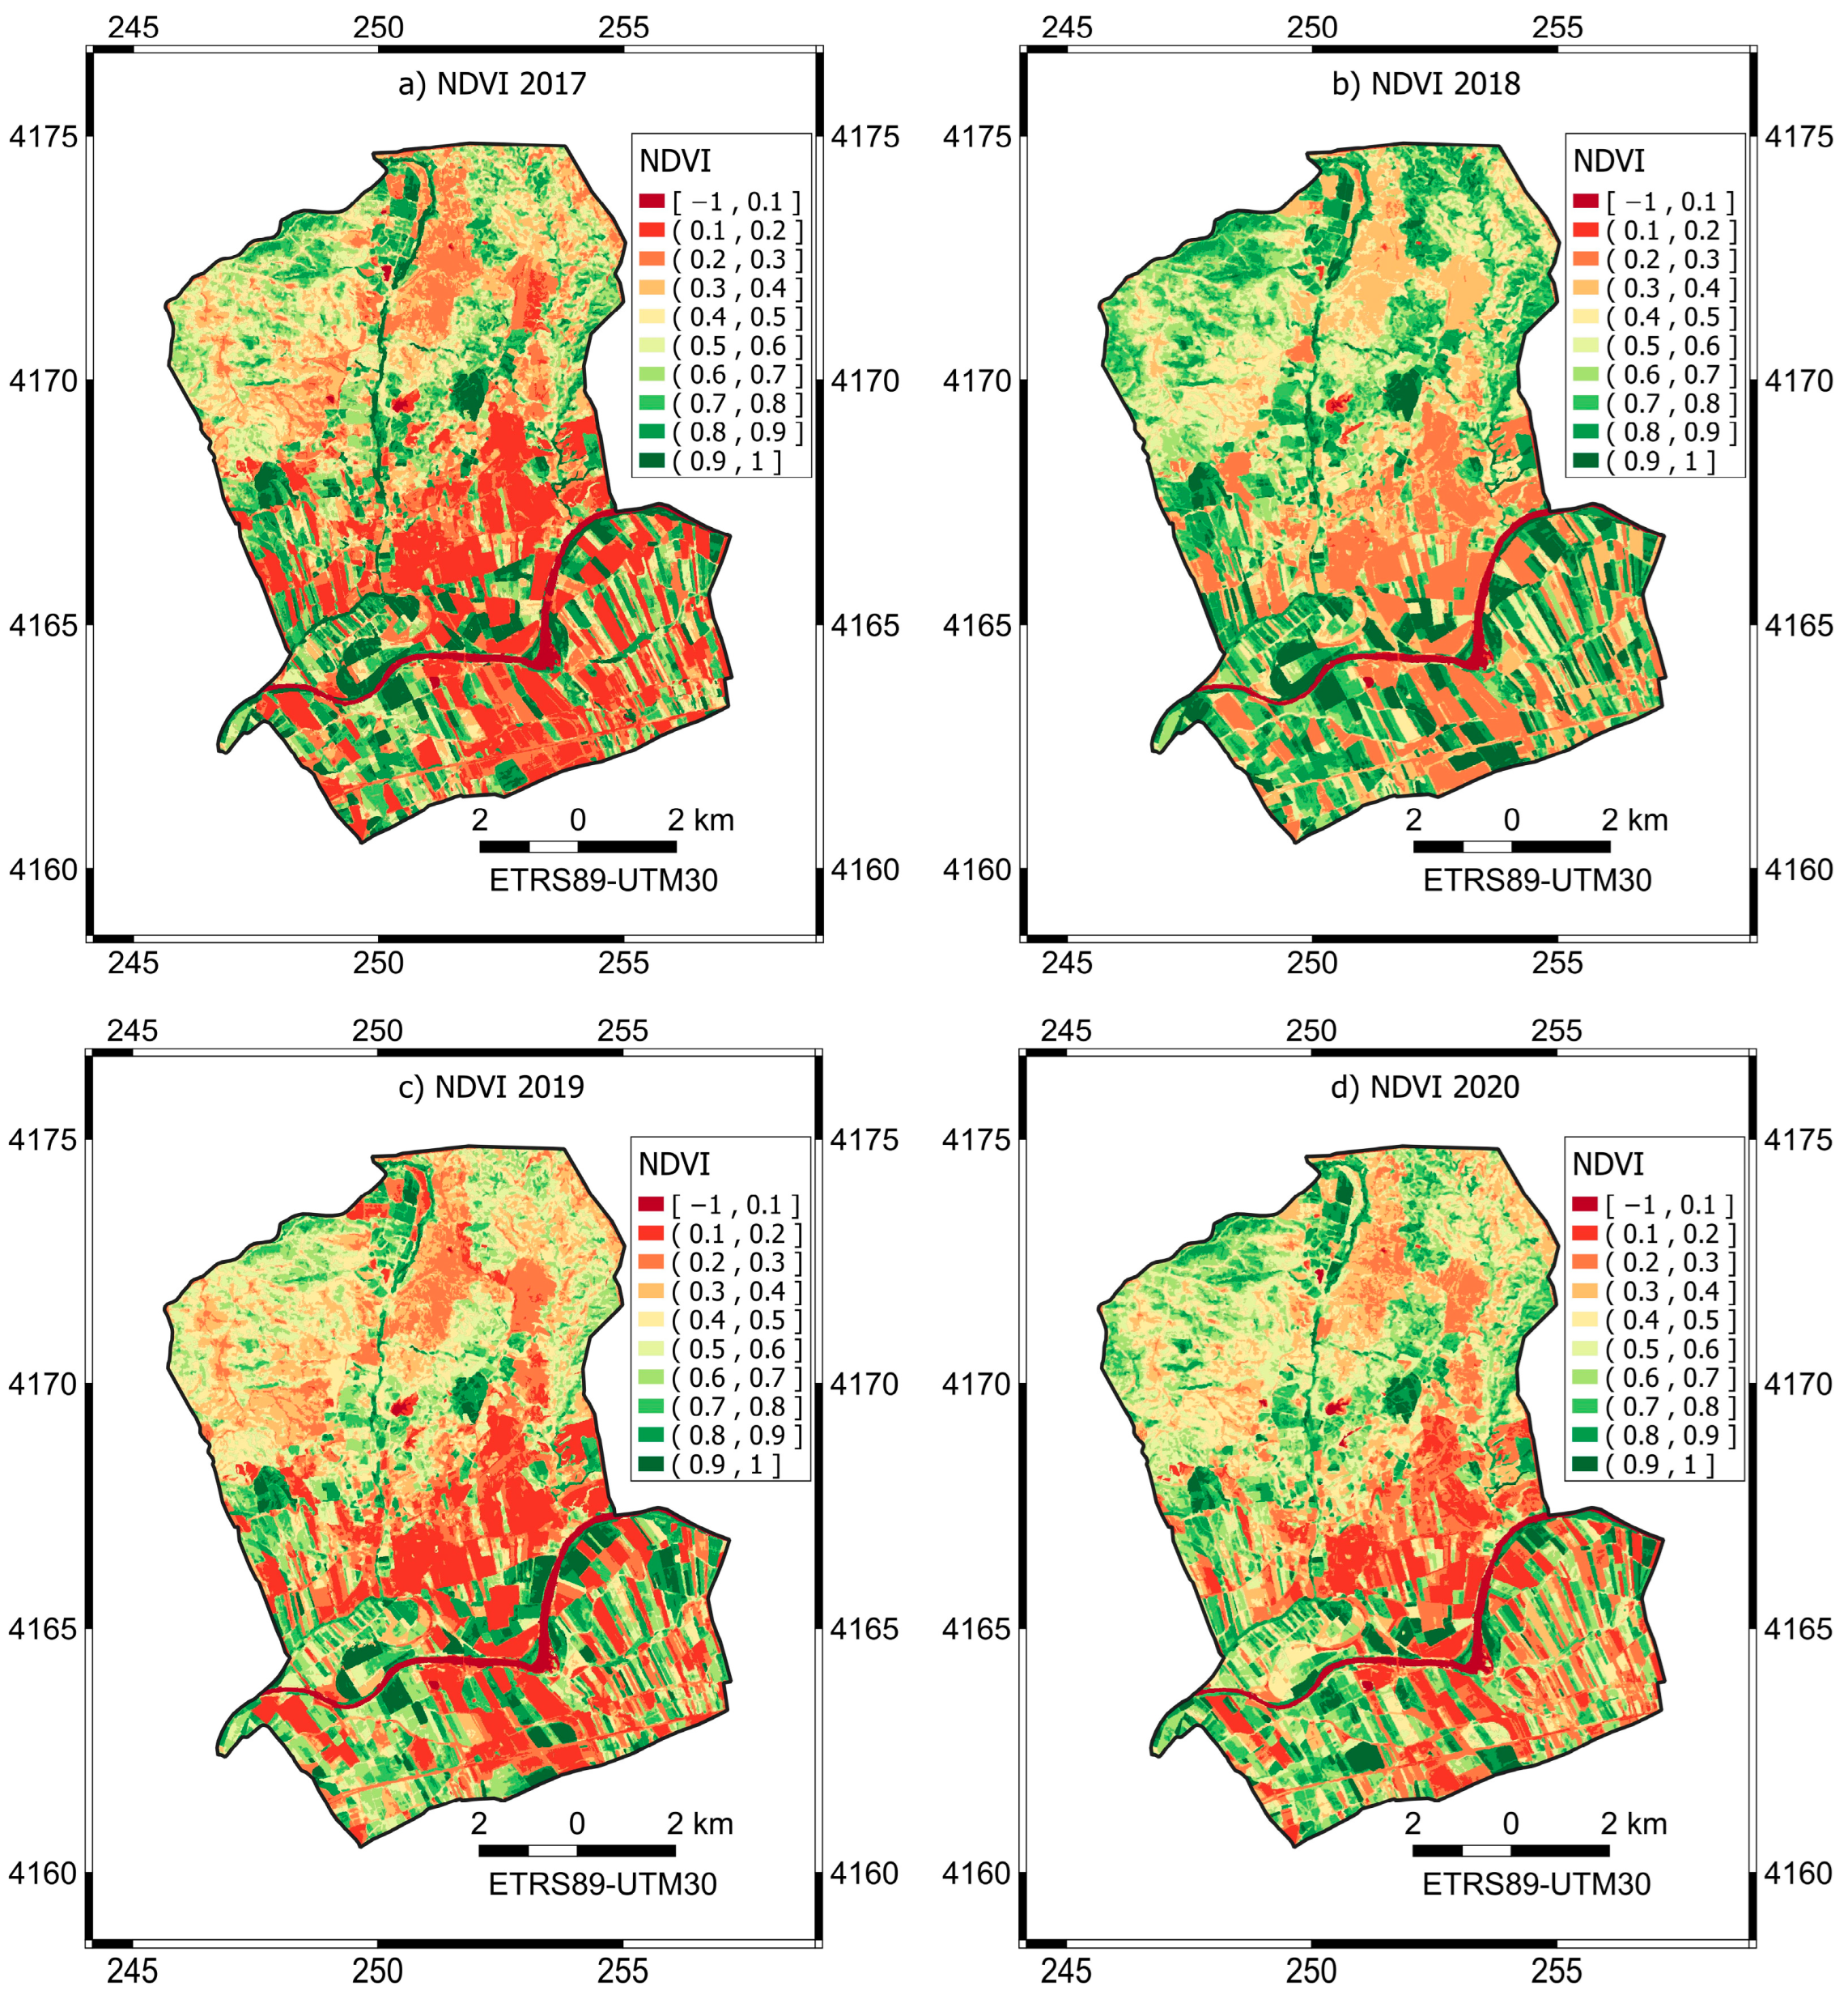
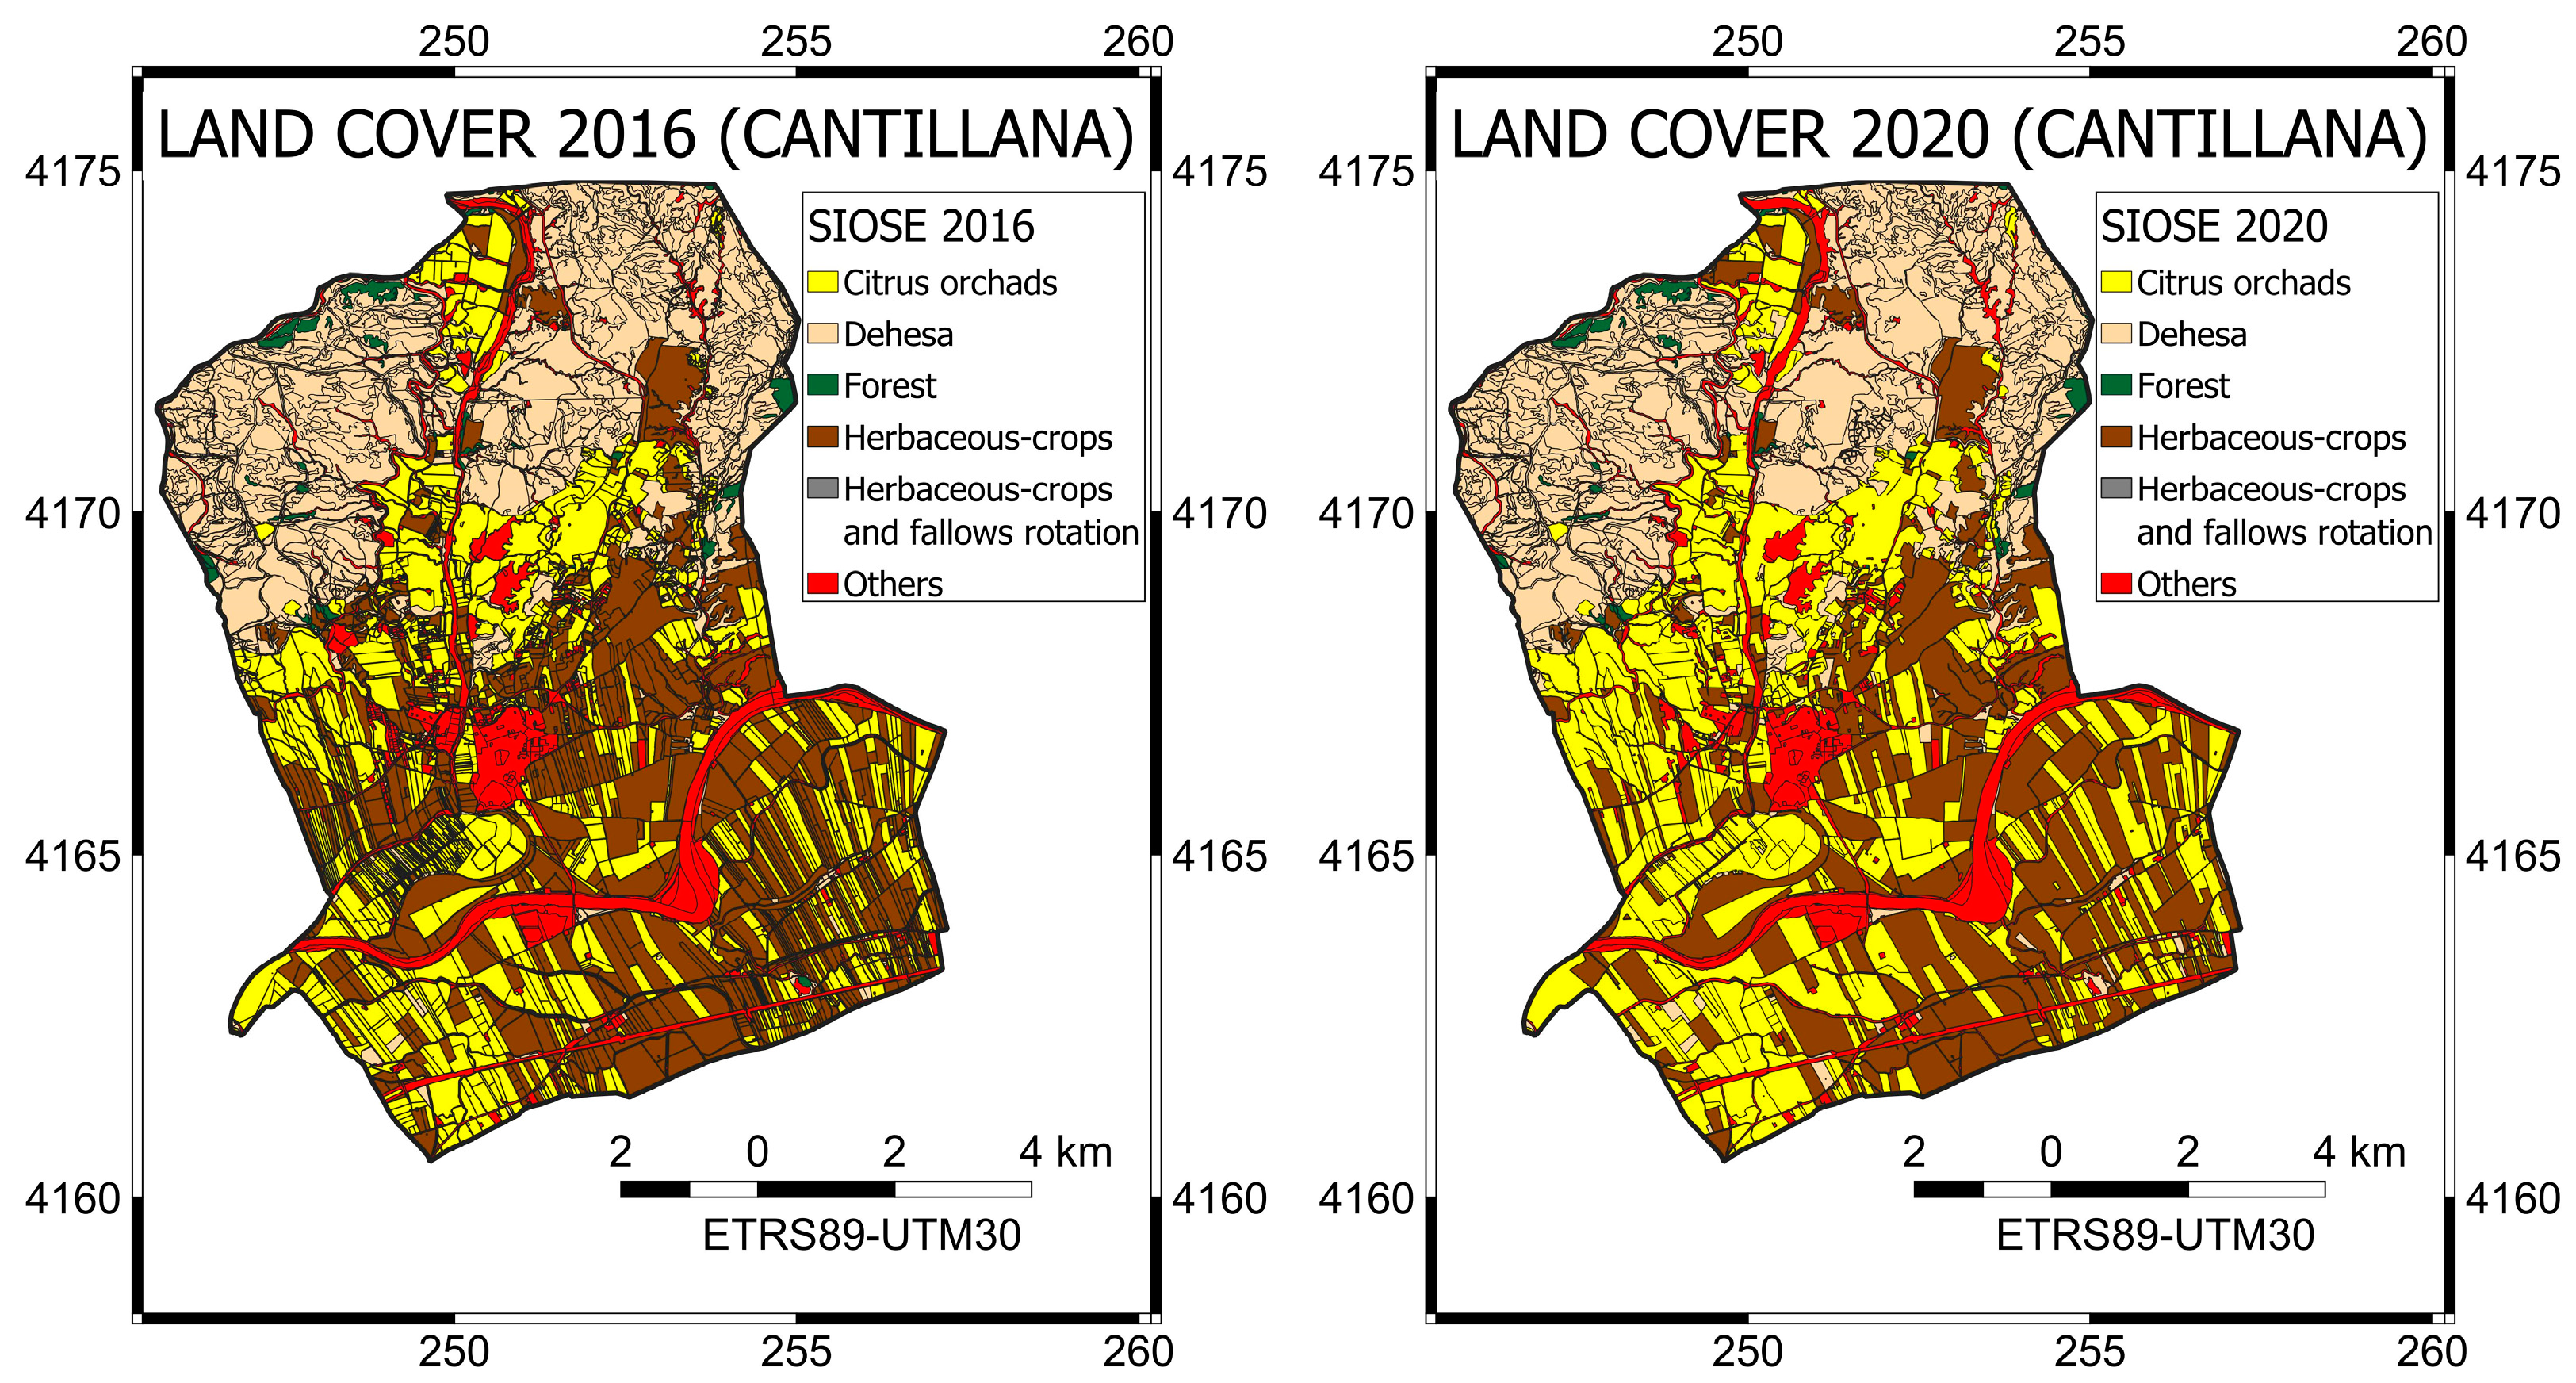
26]. The agricultural census offers data about the cultivated area and crop yields are insufficient beyond the municipal level. Thus, they fail to provide information on the crop sequence and duration or land use practices that affect local biogeochemistry. Fortunately, remote sensing can help establish agricultural patterns and construct a land use chronology per pixel (Figure 10), which could have applications in understanding carbon and nitrogen cycling and estimating crop production rates’ economic impact.
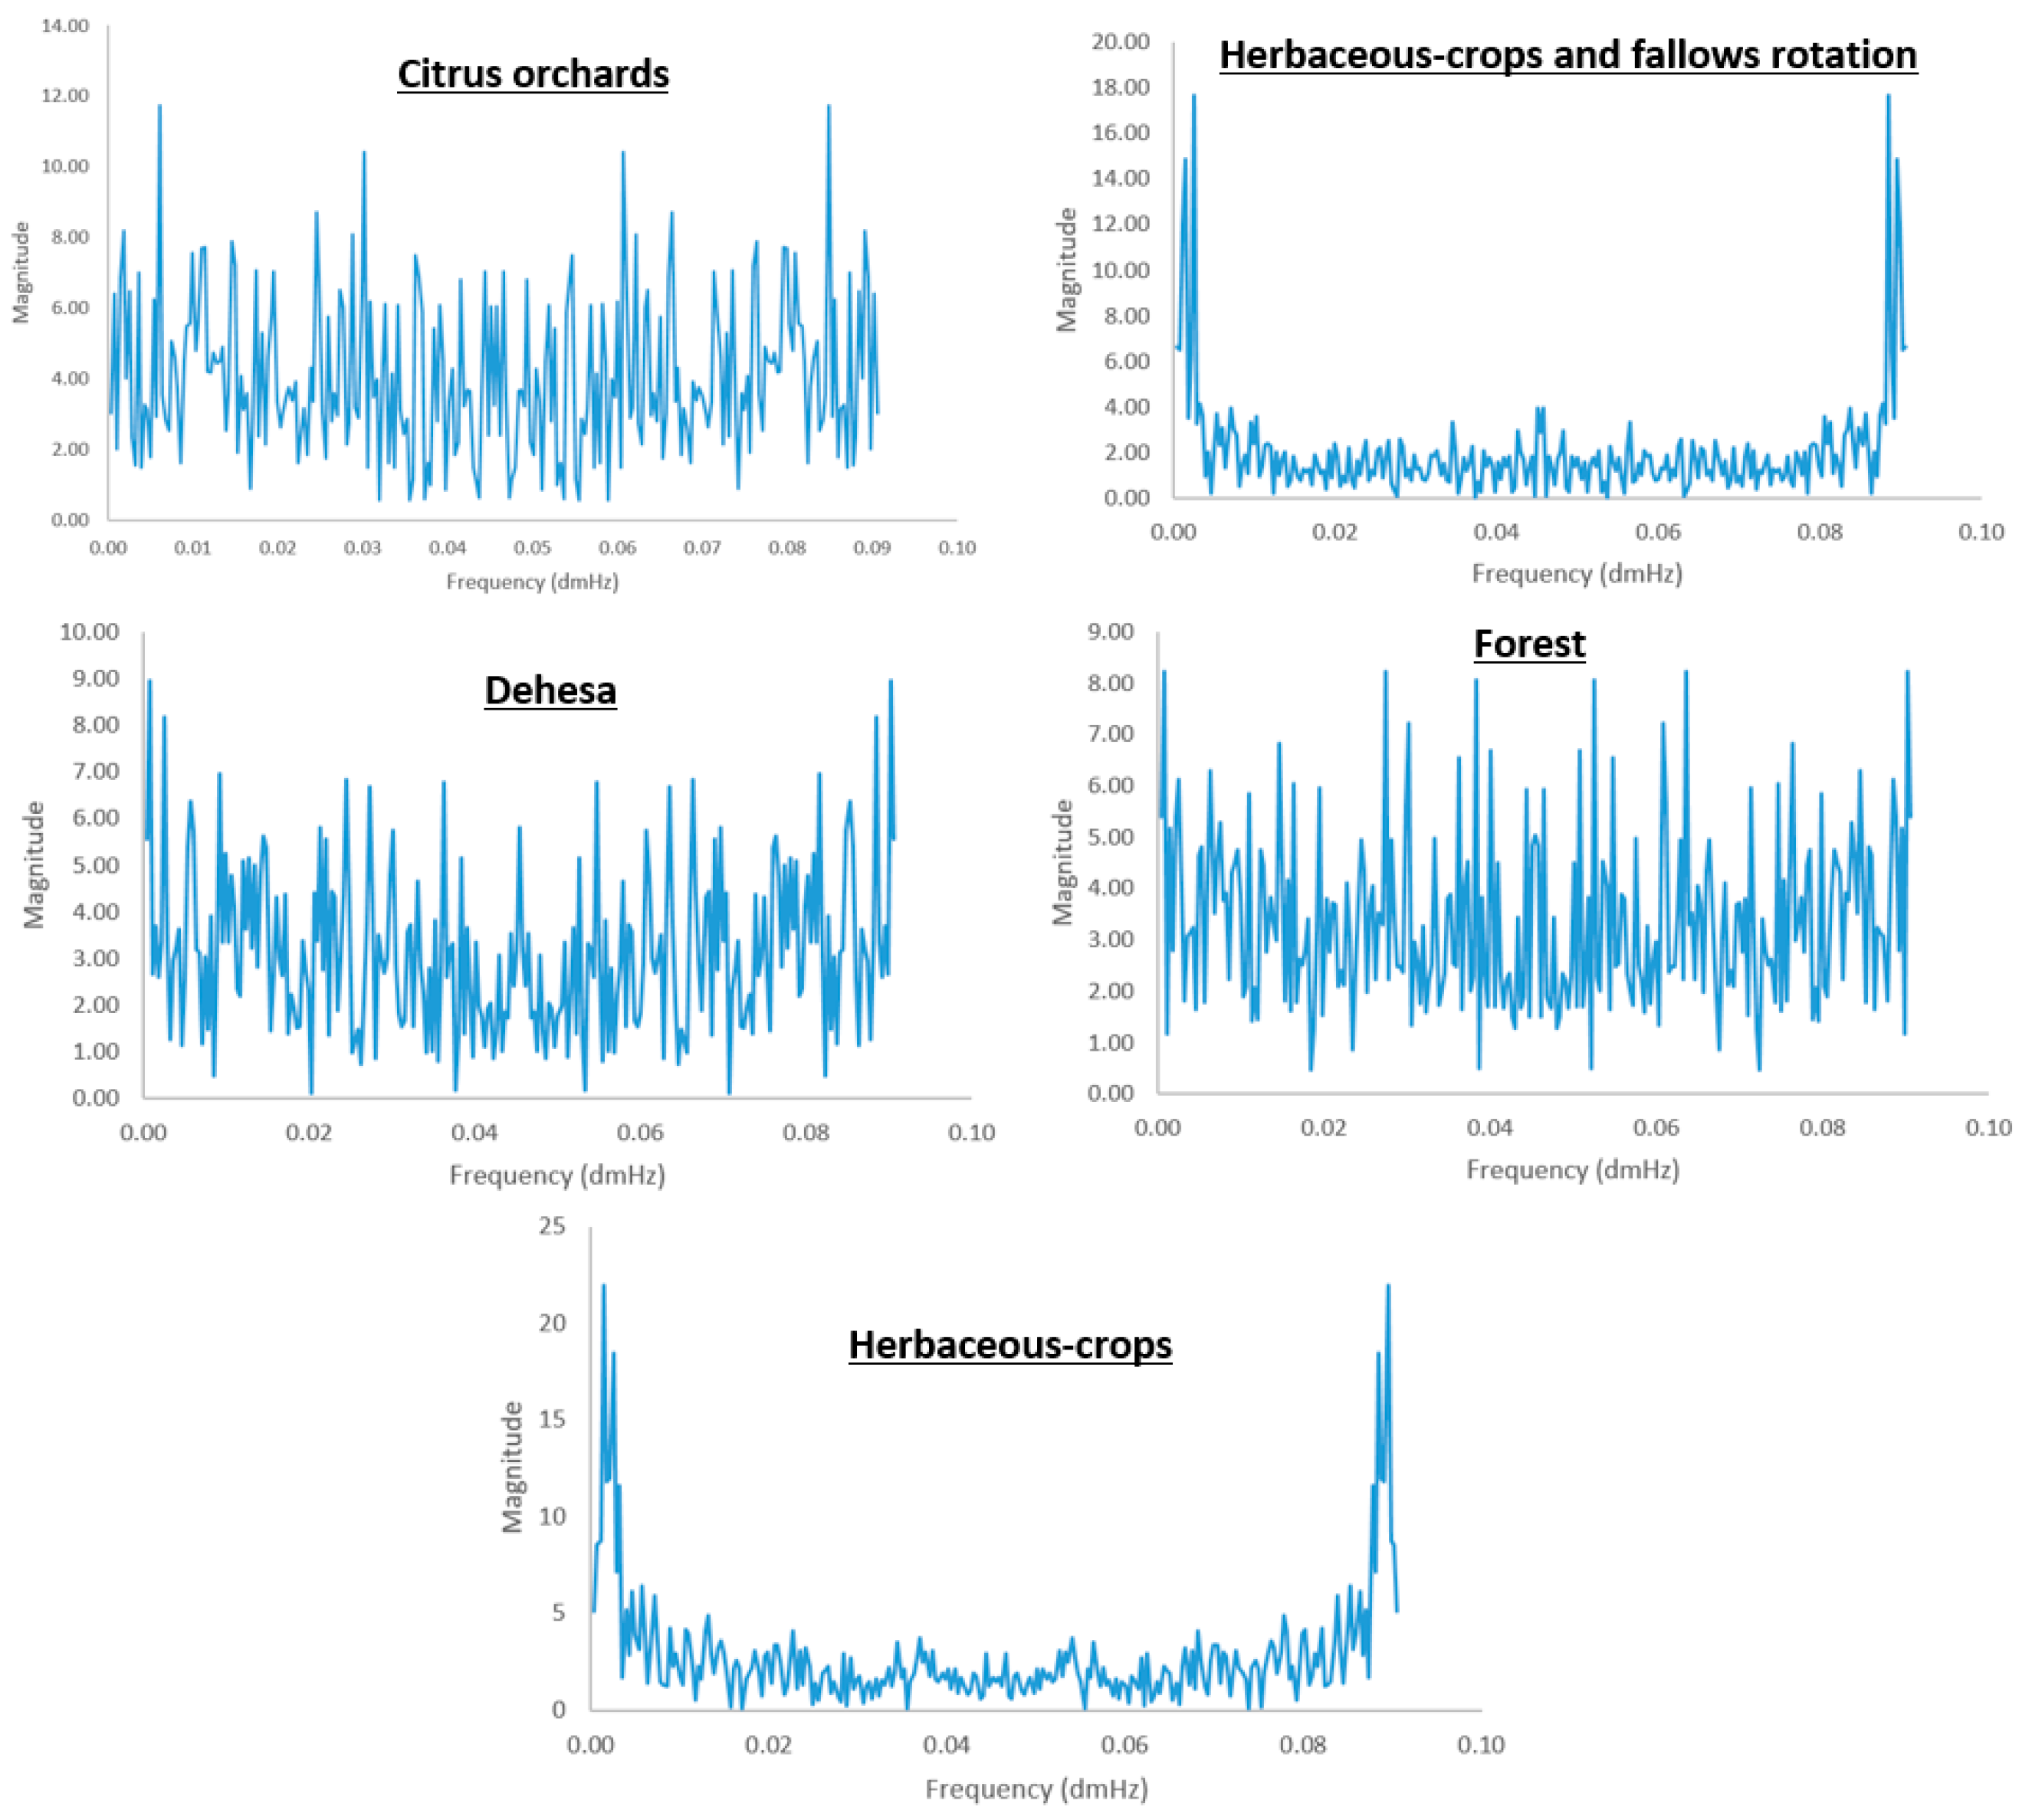
The WFCP methodology, which utilizes wavelet transformation on an NDVI time series, effectively represents crop phenological behavior with minimal error [22]. The methodology was tested under new environmental conditions, including high-frequency noise caused by clouds due to climate and different agricultural phenology than the areas where the model was originally developed and validated [21,26,31]. However, as a limitation, it is important to highlight that wavelet transformation may occasionally overemphasize small phenology peaks resulting from weedy growth or create a false peak due to wavelet resonance. To address this issue, small peaks can be classified as double crops. While this classification may be problematic from a curve-fitting standpoint, it remains amenable for the purpose of picking out cropping patterns. The 90% power wavelet is used to detect false maximums or weedy growth, which often fall under the detection threshold for maximums of 0.4 NDVI and are, therefore, not tallied, leading to high overall accuracy [21,26,32]. Likewise, in relation to the limitation of the method used in the present work, emphasis must be placed on the methodology used by [14], since it does not require any interpolation or gap filings, and it considers observational uncertainties.
Distinct spatial patterns in the wavelet-smoothed time series data were observed. These patterns indicate that new areas of cropland tend to nucleate around existing croplands (see Figure 10), and small areas of native vegetation between large cropland areas are often replaced with citrus orchards. Additionally, there is evidence of areas with single crops becoming double-cropped over time. This intensification seems to be spatially limited to the center of agricultural areas and probably describes the evolution of farming practices as croplands age. Insight into agricultural practices underpins this observation. The increase in crops observed from 2017 to 2020 could be associated with economic factors, such as high global market prices [2]. Overall, the study area showed an increase in the number of crops grown per unit of land, resulting from either the expansion of new croplands or the intensification of pre-existing croplands from monoculture to double cropping systems.
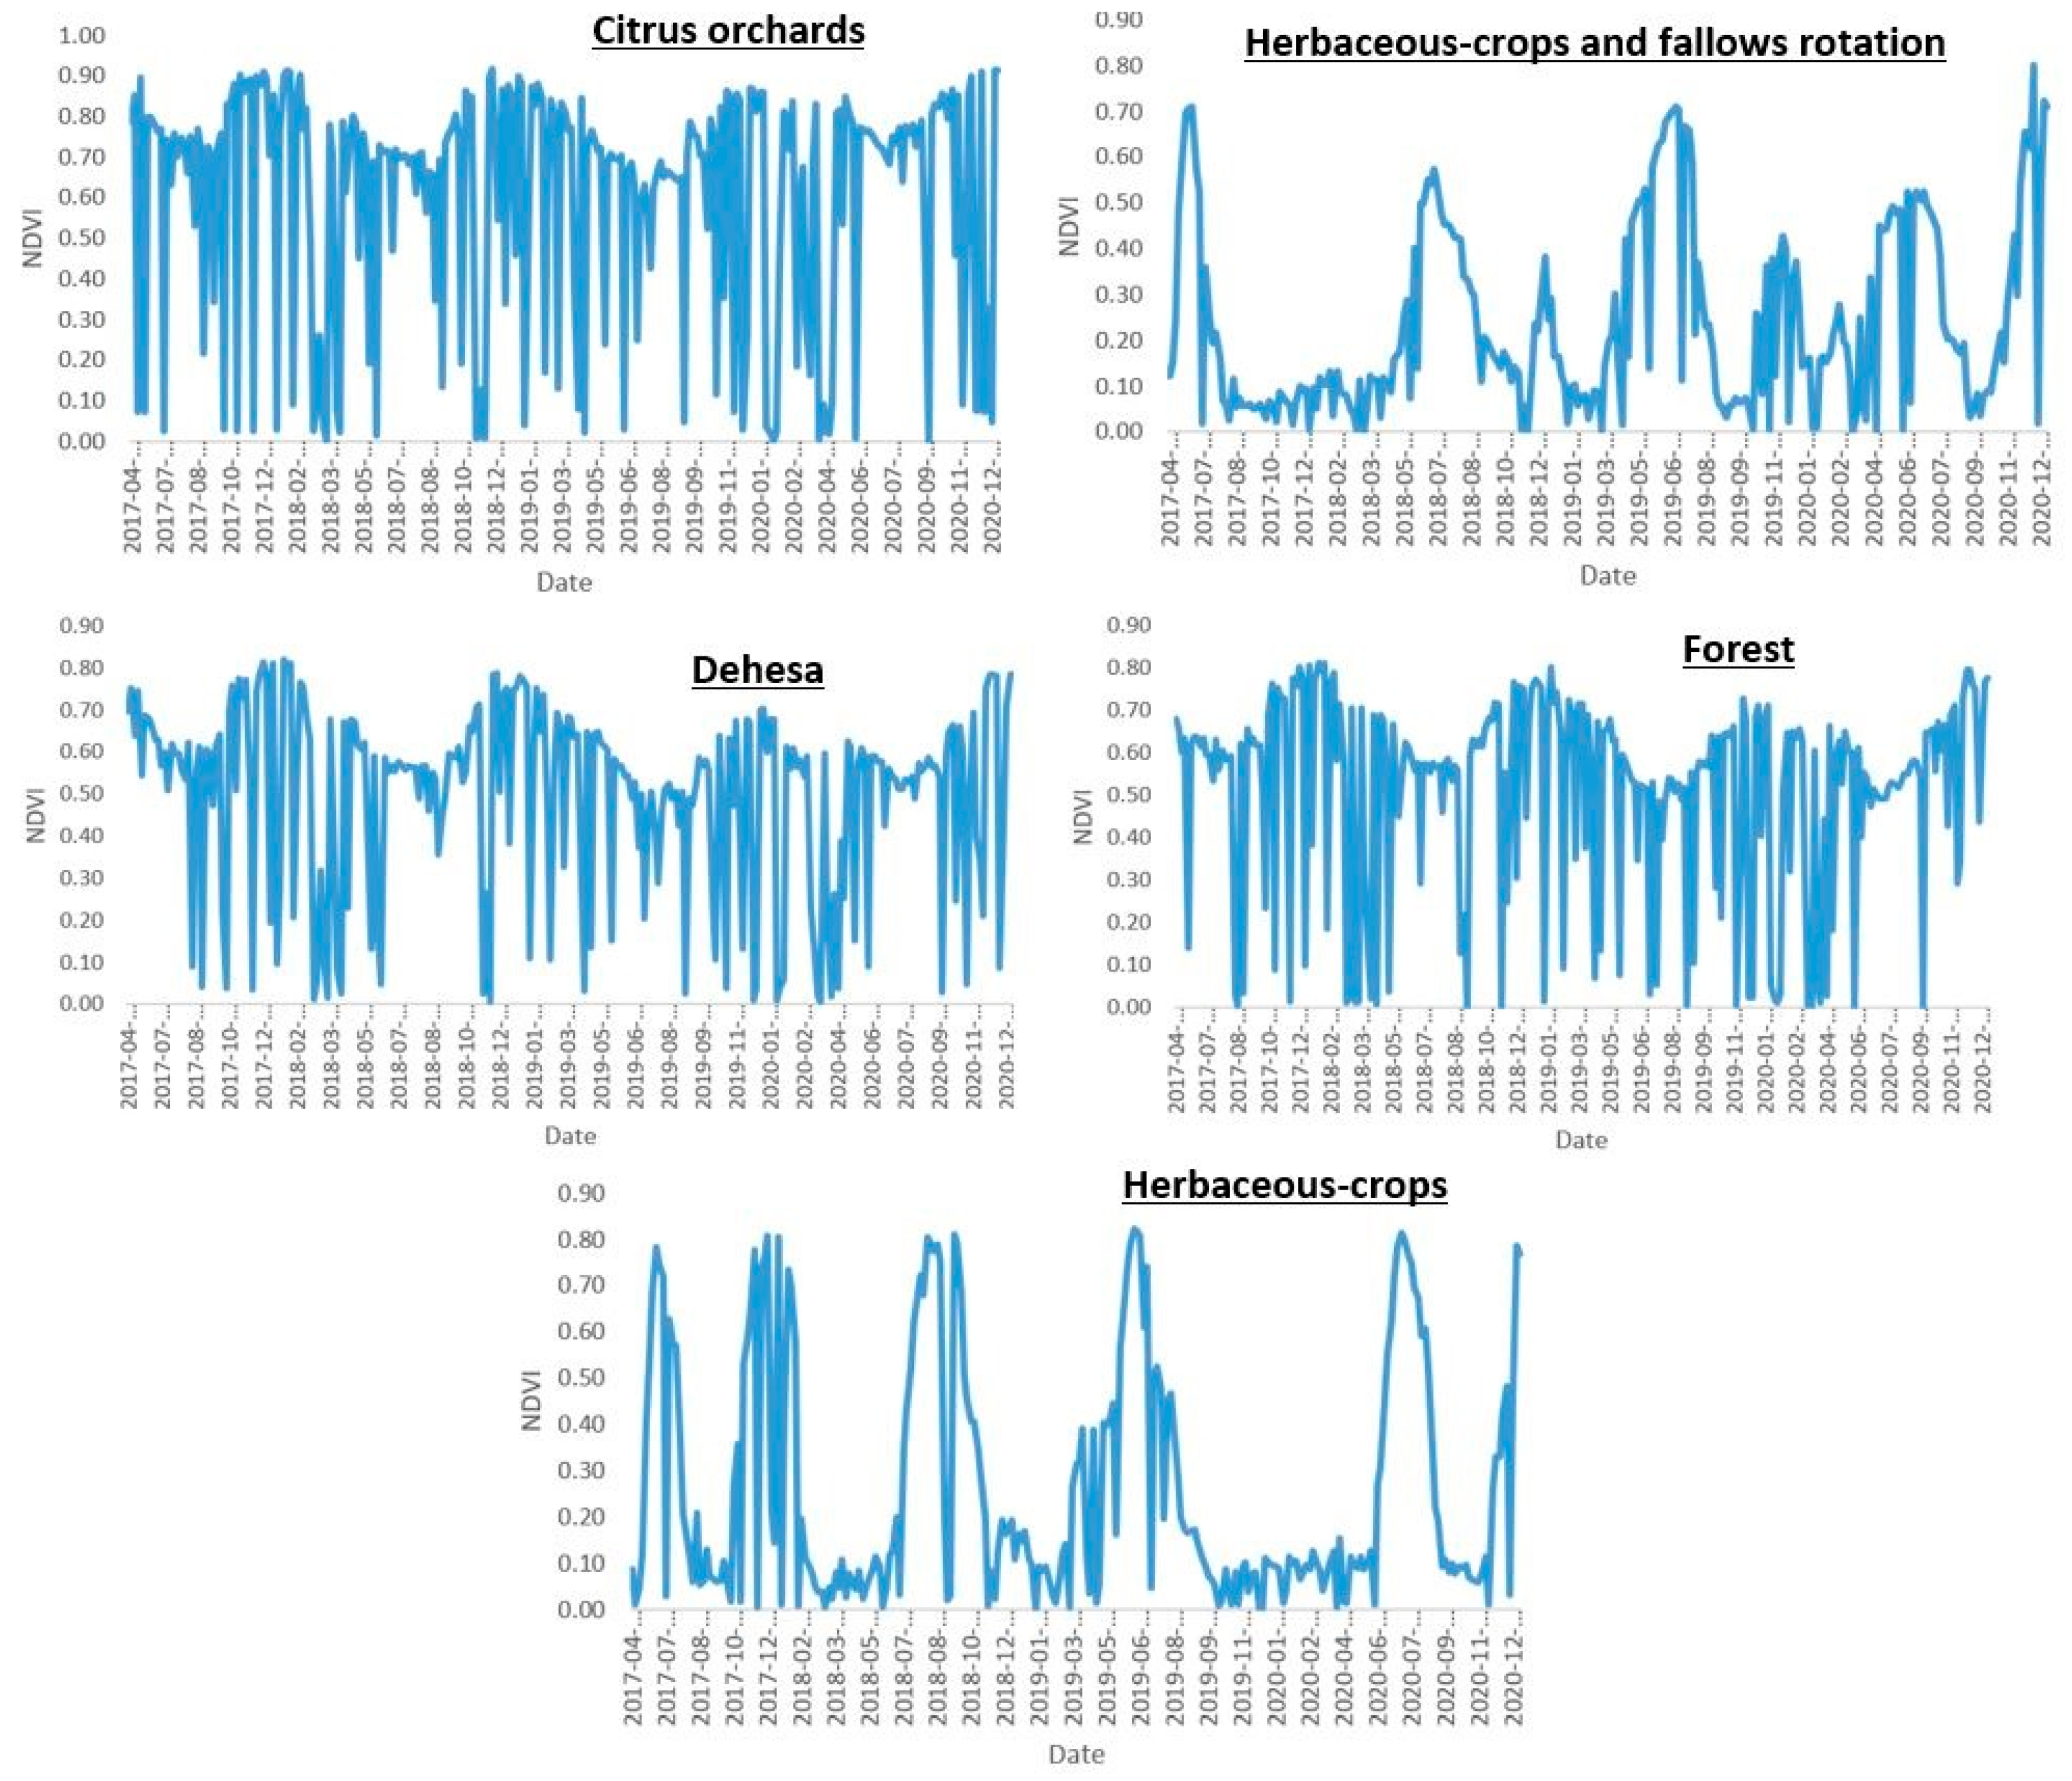
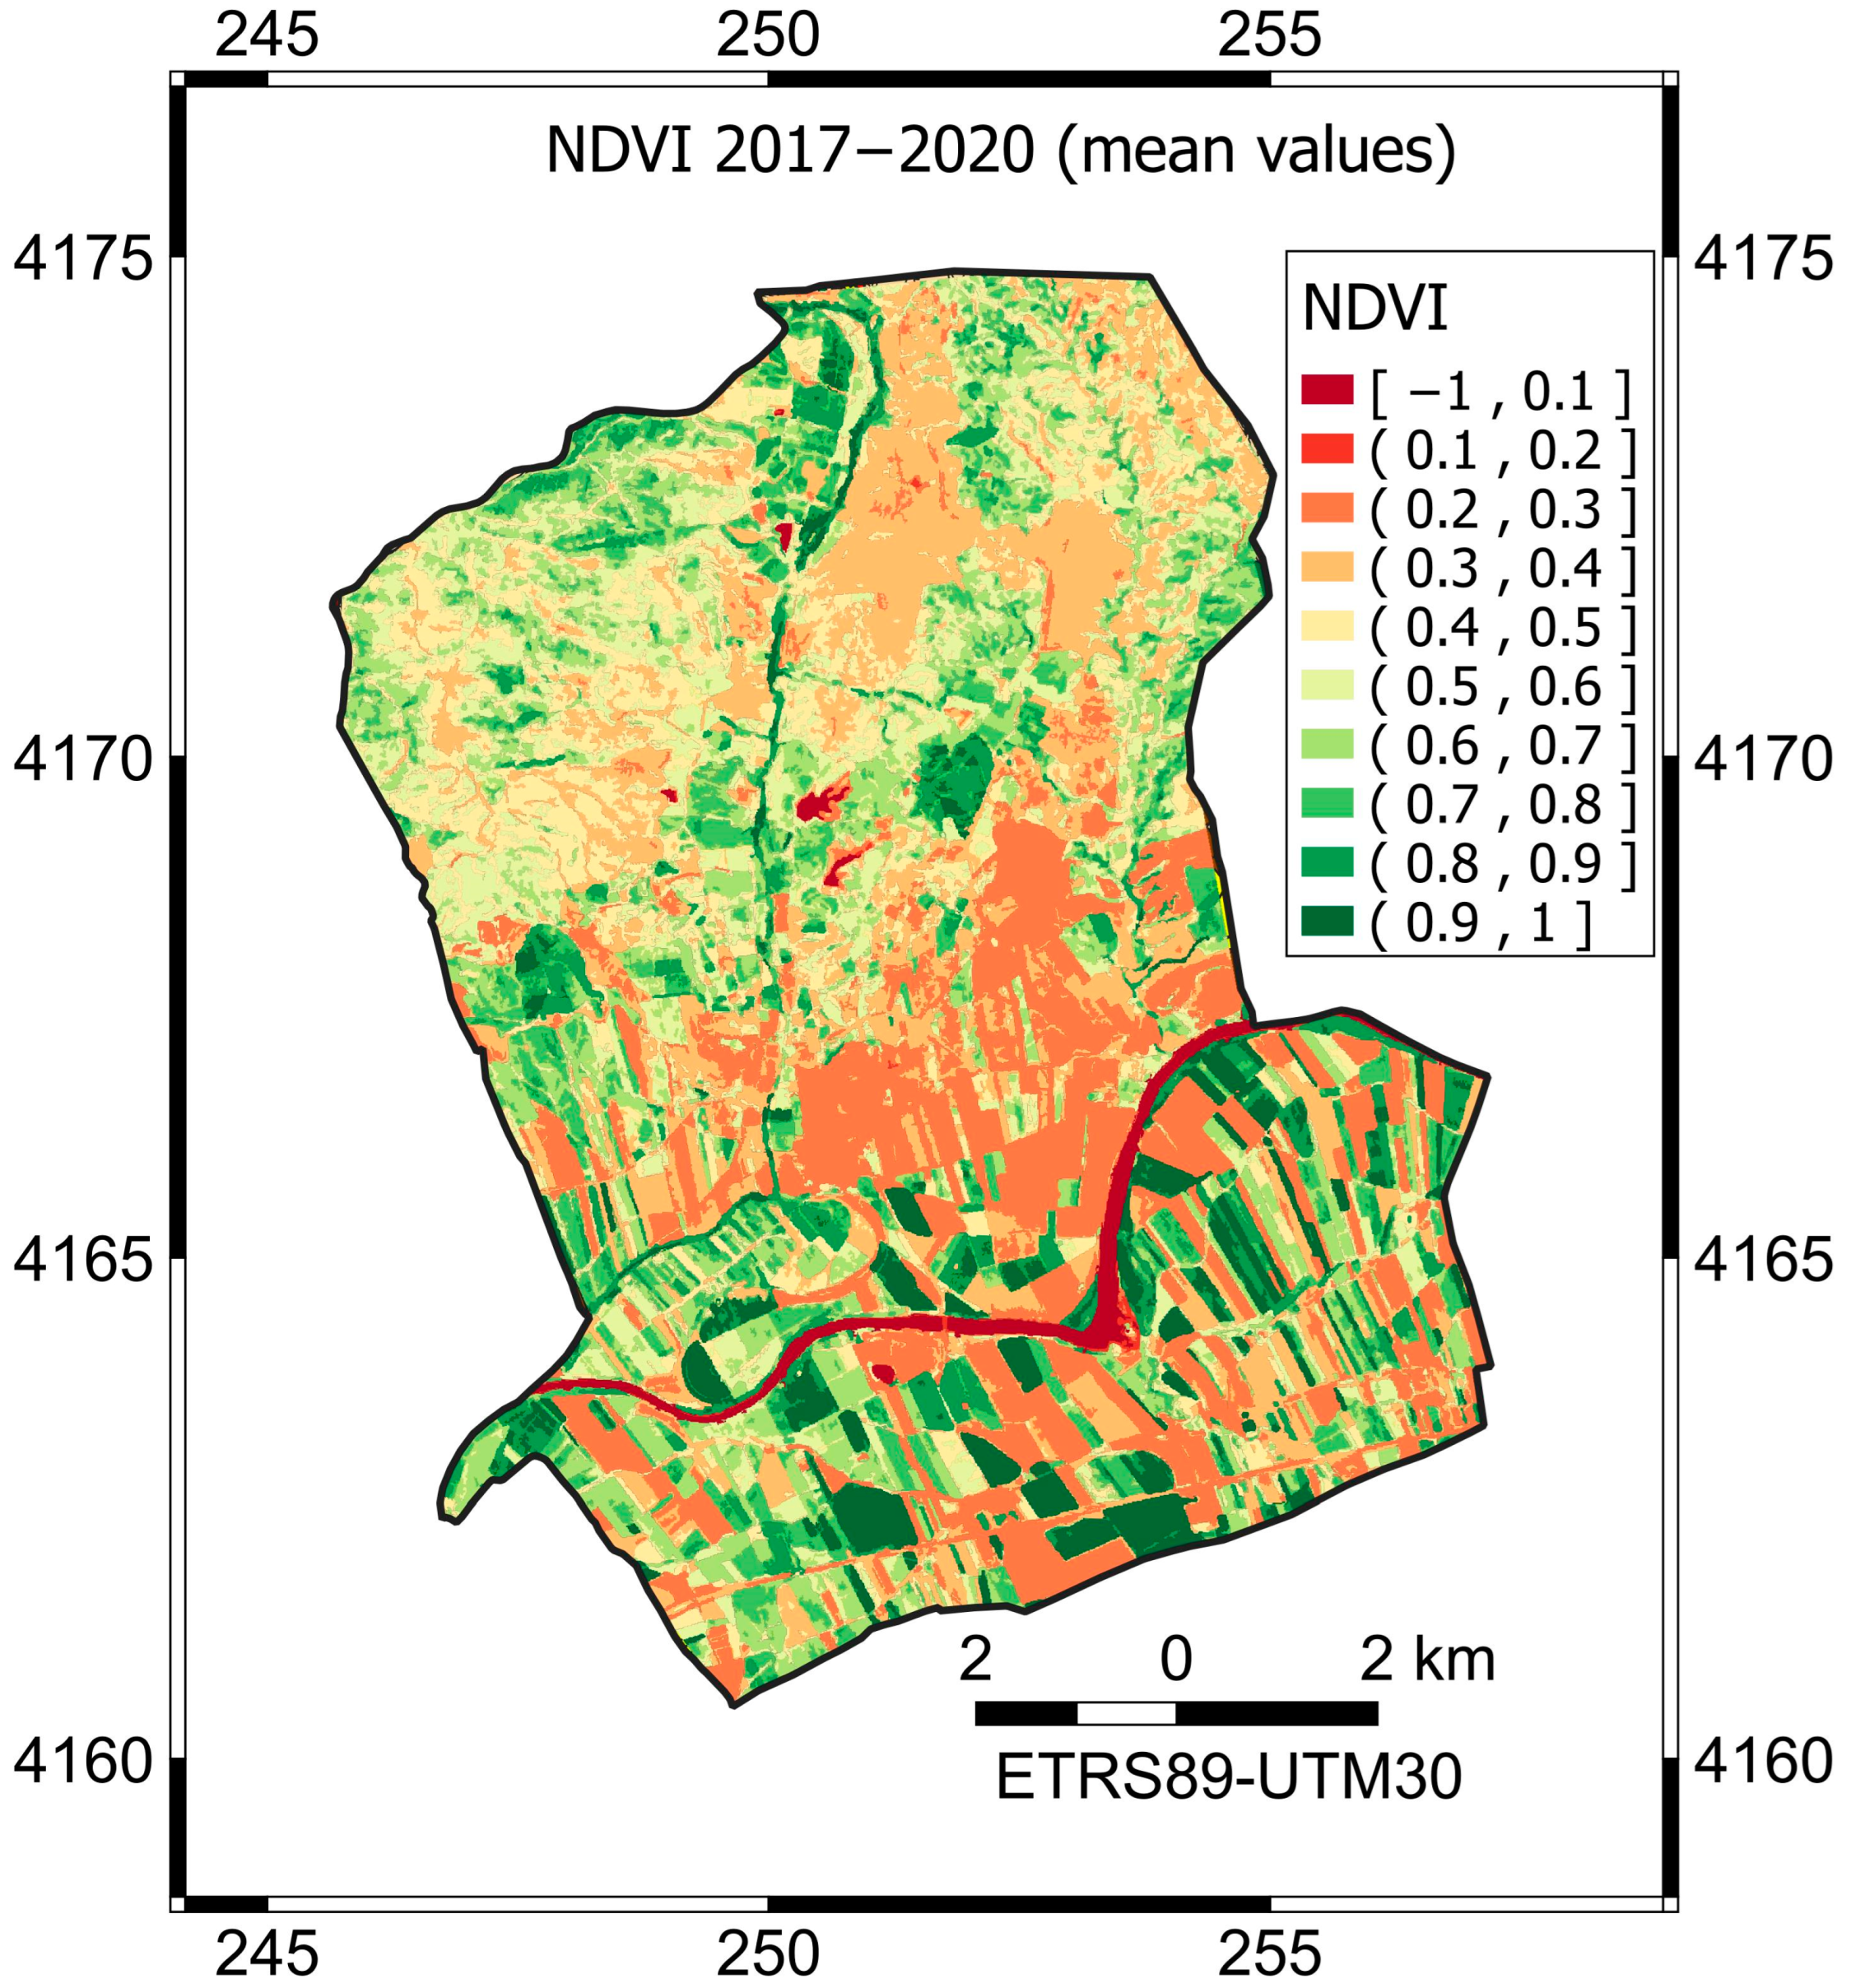
In another vein, after analyzing the elevation map (Figure 9) of the study area along with those corresponding to the land cover maps (Figure 10), it can be observed that the use of dehesas predominates at higher elevations, while the number of citrus orchards increases at lower elevations. This fact affects not only the trend of NDVI (see Figure 7) throughout the years analyzed (that is, 2017, 2018, 2019, and 2020) but also the average value of NDVI between 2017 and 2020 (Figure 11).
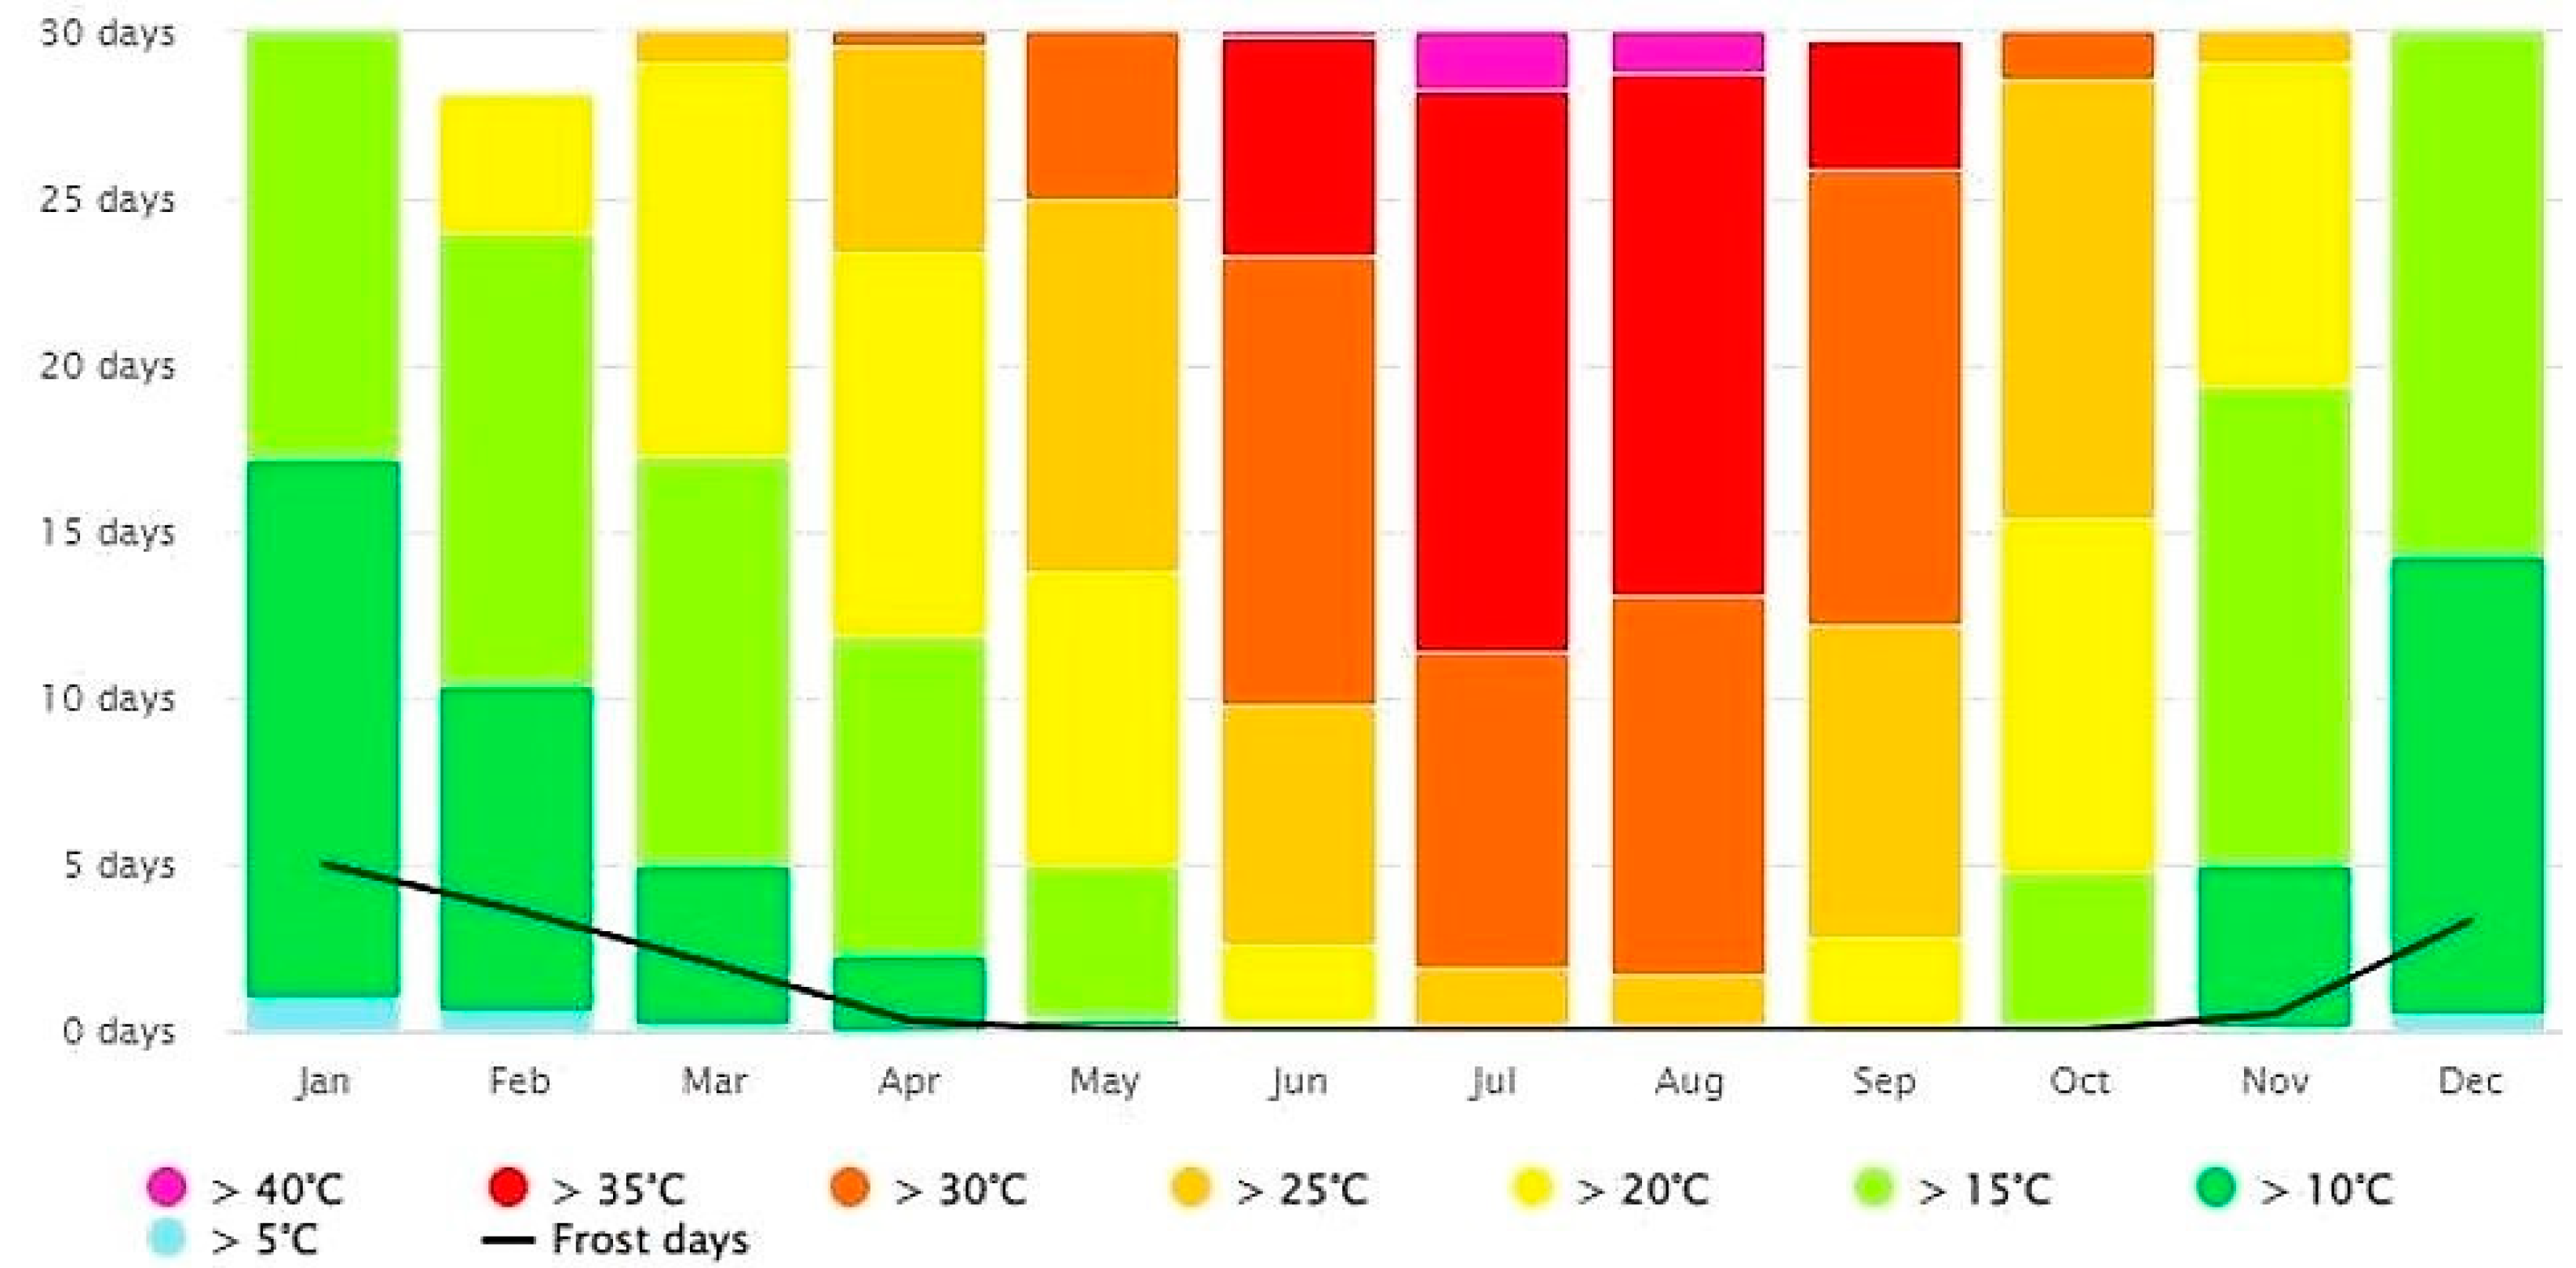
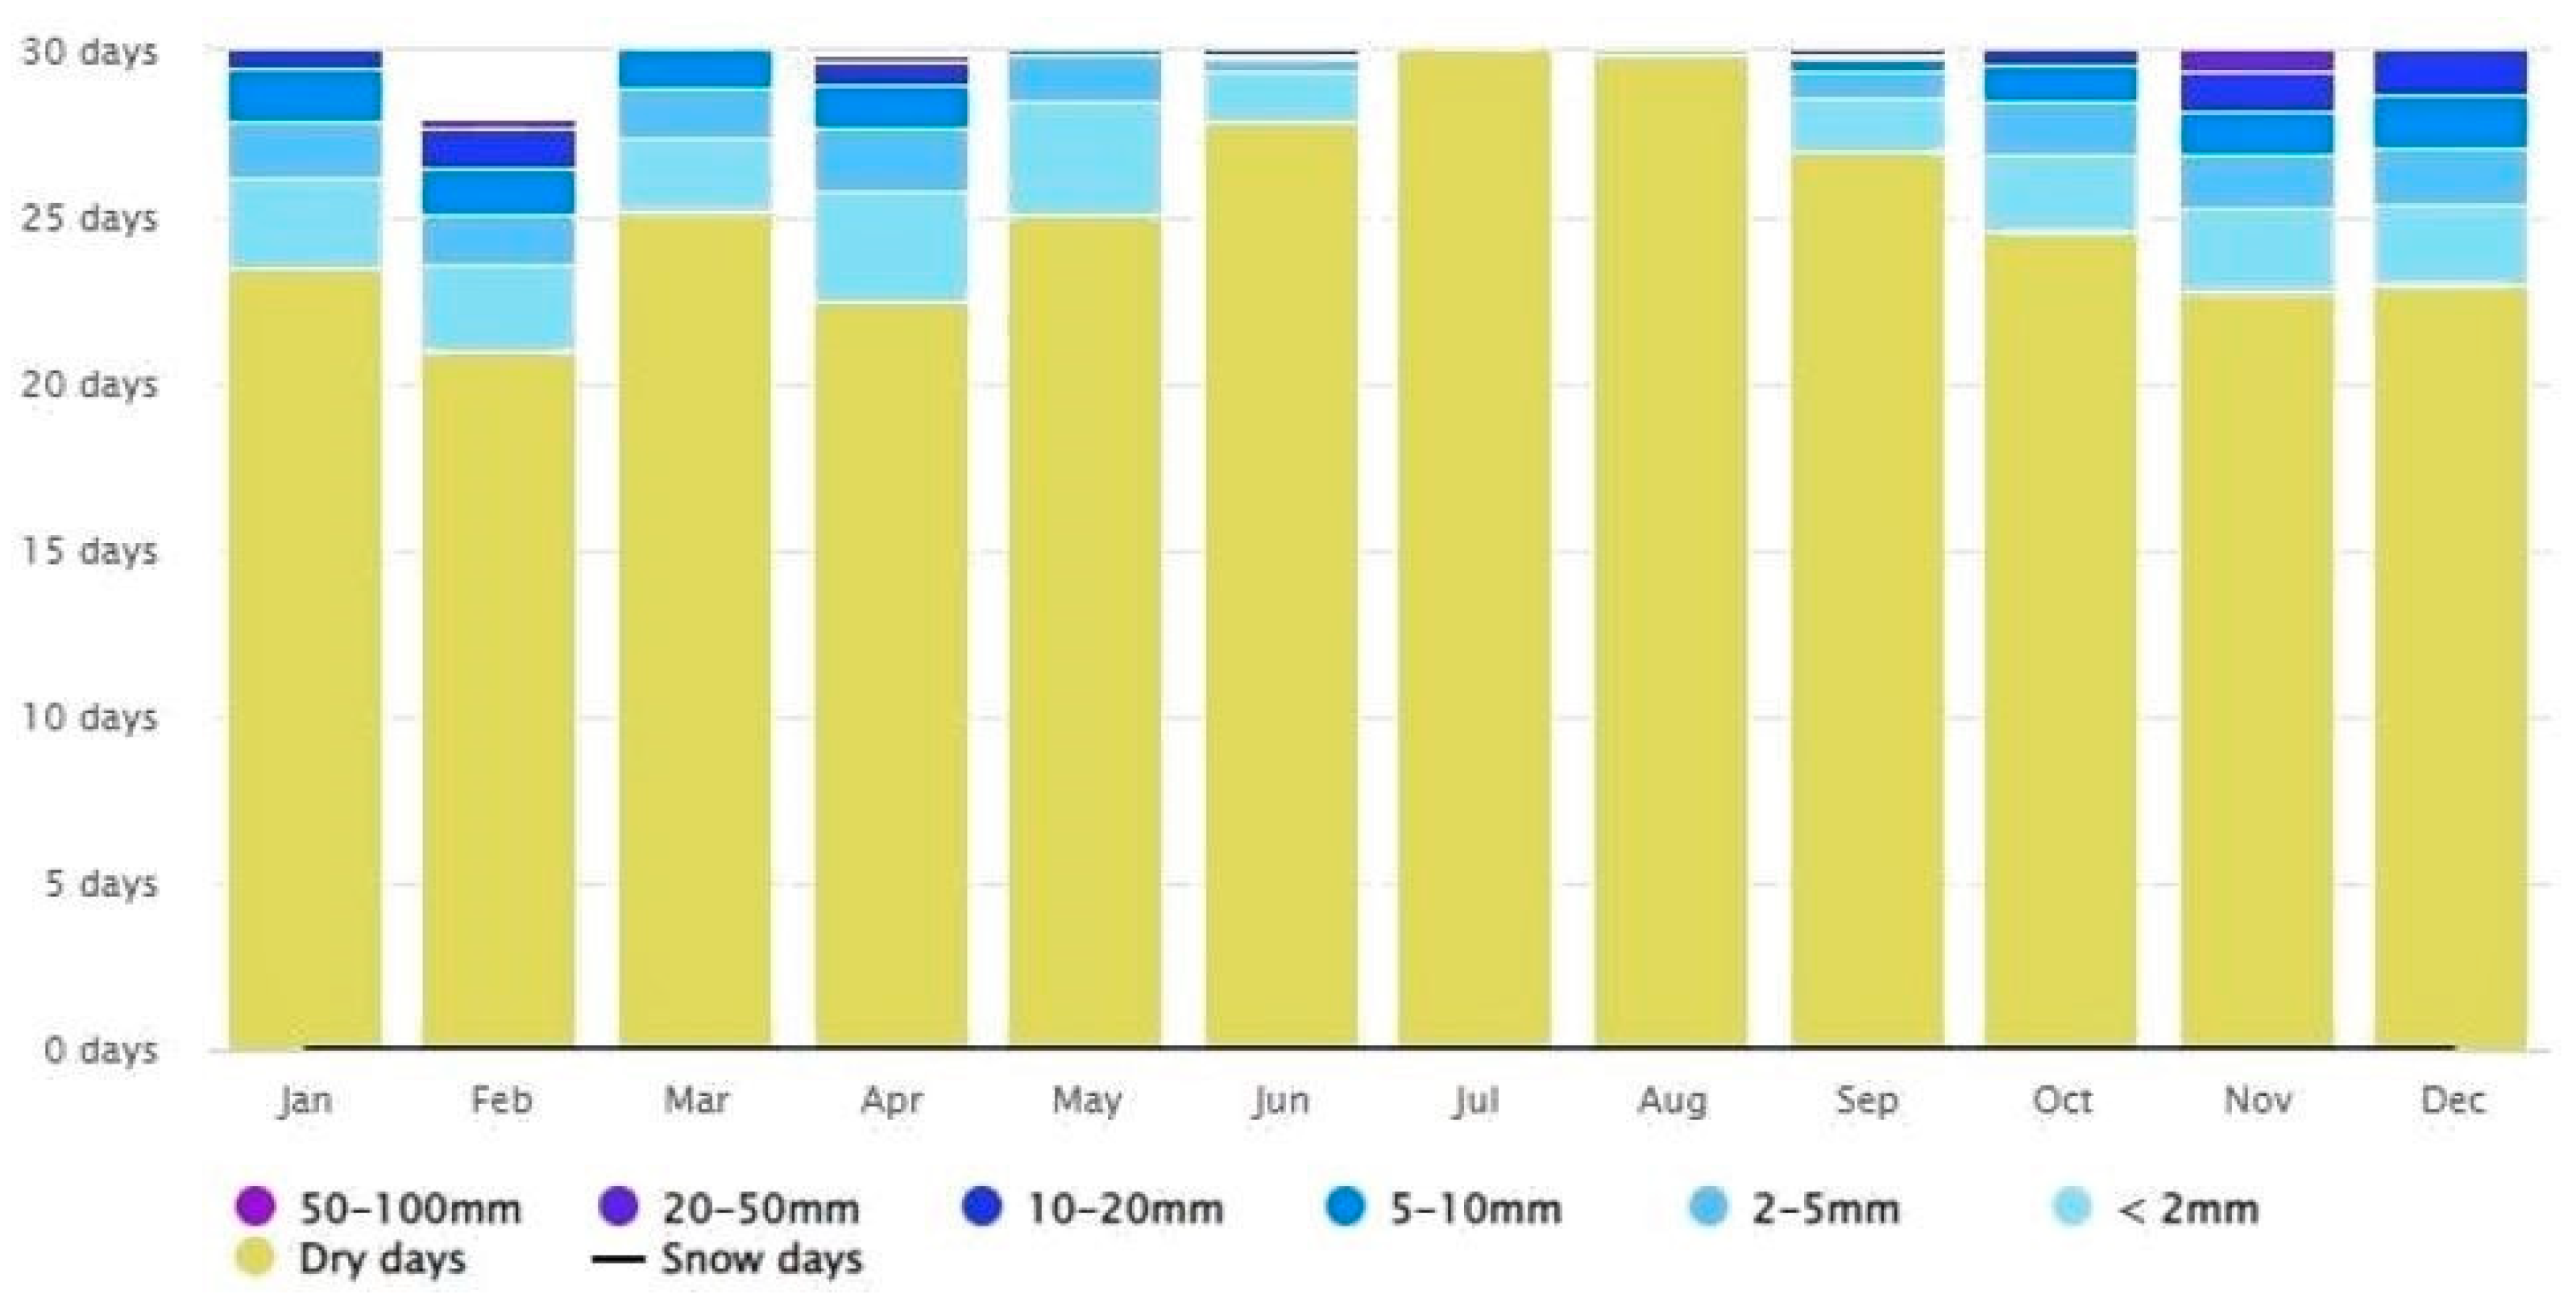
In this way, the existence of a relationship between the type of land use, the elevation (the temperature decreases at higher elevations), and, logically, the topographic characteristics of the study area is evident. Because of this, the study area can be divided into two zones of interest. The first one would be located to the north of the urban area. It has a more varied relief, alternating between plains and mountains. Its average altitude varies from 50 to 150 m, rising at the western vertex, where the highest heights are reached, with Loma de Enmedio being the highest peak at 316 m. They are erosion-resistant lands formed by various types of rocks: slate and agglomerates in the lower areas, and dark-colored granites and basalts in the highest altitudes of the north. The second zone includes the city and the entire south of the municipality. In this area, the Viar River, in its descent from the mountains, has dragged clay (alluvial deposits), forming a plain known as Vega del Guadalquivir, which is very suitable for citrus orchards.
After conducting this study, it is crucial to emphasize that the first-order derivative characteristics, wavelet coefficients obtained through continuous wavelet transformation, and remote sensing spectral analysis features obtained using a convolutional neural network model can serve as inputs for a partial least squares model, respectively. Validating the optimization of these characteristic features is essential for efficient chlorophyll content detection. It remains to be investigated whether selecting robust features from the remote sensing spectral analysis features can enhance model performance by eliminating redundant information among the features. Furthermore, future endeavors could encompass the following: (a) expanding the spectral data across multiple years to construct a larger dataset; and (b) identifying robust features and applying the detection model to assess other crops, thus verifying the suitability and applicability of the proposed method.

5. Conclusions

The primary aim of this study was to uncover changes in land cover and land use patterns, specifically focusing on single and double cropping practices, through the utilization of time series analysis. A key challenge in the process was the identification of crop patterns within agricultural areas. To address this issue, we employed the wavelet transformation technique to filter noisy NDVI time series data. We established an annual standard deviation threshold and determined each year based on the local minimum in a bimodal histogram of standard deviations to pinpoint citrus orchard areas. This enabled us to analyze cropping patterns for a pixel only after it had been designated as a citrus orchard, thus streamlining the processing time. Subsequently, we generated a wavelet-smoothed time series using the 90% power wavelet. Phenological peaks, represented by local maxima, were considered indicative of crops if the time series exceeded a 0.4 NDVI threshold. This cutoff value was employed to eliminate false peaks that could arise in the wavelet-smoothed time series.
The reason for choosing this study area was to validate the proposed model in a region marked by the rapid expansion of citrus orchards. Over the course of the four-year study, the total cropland area increased by 980 hectares. There was also a noticeable intensification of citrus orchards, initially in the form of single-crop orchards, followed by subsequent growth in double-crop orchards. This pattern was anticipated because the expansion of citrus orchards typically begins with single-crop patterns in the first growing season and then shifts to agricultural intensification or a transition from single-crop to double-crop cultivation in the following years. Geographically, the expansion of citrus orchards occurred at the borders of existing agricultural areas, while intensification took place within already established croplands.
The study area exhibited a significant expansion in cropland, underscoring the importance of comprehending how this alteration in land cover affects the cycling of carbon and nitrogen. It is critical to differentiate between various crop types because they have distinct implications for carbon and nitrogen cycling. The inadequate management of these crops over time could result in the depletion of carbon and nitrogen, diminishing soil fertility and potentially affecting the sustainability and management of land use. Additionally, secondary crops such as olive tree orchards may require substantial amounts of nitrogen fertilizers, which can lead to increased emissions of nitrous oxide and have an impact on local water quality. Hence, possessing information regarding the quantity and nature of crops in the area is essential for developing precise spatial models that account for biogeochemical changes associated with agricultural expansion and intensification. This observation is crucial for the development of a land management tool reliant on Sentinel-2 data, using a NDVI time series to characterize land uses in the study area.
In this research, the wavelet approach’s stability was evidenced throughout several years of NDVI time series data. As a result, the WFCP methodology can be applied to a larger study region to examine the regional development patterns of citrus orchards. Upcoming studies could involve the parametrization of the wavelet-smoothed time series to pinpoint crop types. Additionally, there is potential to use other types of time series data, such as fractions of green vegetation via spectral mixture analysis, in the wavelet analysis method (WFCP). Finally, our work creates a paradigm for future studies applied to the Guadalquivir Valley.

Author Contributions

Conceptualization, E.R.-J., J.-L.A.-M. and D.A.; methodology, E.R.-J., J.-L.A.-M. and D.A.; formal analysis, E.R.-J., J.-L.A.-M. and D.A.; investigation, E.R.-J., J.-L.A.-M. and D.A.; resources, E.R.-J., J.-L.A.-M. and D.A.; writing—original draft preparation, E.R.-J., J.-L.A.-M. and D.A.; writing—review and editing, E.R.-J., J.-L.A.-M. and D.A.; supervision, E.R.-J., J.-L.A.-M. and D.A.; project administration, E.R.-J. All authors have read and agreed to the published version of the manuscript.

Funding

This research received no external funding.

Data Availability Statement

The data used to support the findings of this study can be made available by the corresponding author upon request.

Acknowledgments

This study was carried out thanks to the research projects with reference numbers “2497/0110” and “3923/0110” from the Universidad de Sevilla. The authors are grateful for the disinterested collaboration of the Knowledge-Based Company RSV3 Remote Sensing S.L. This research was also supported by a postdoctoral researcher contract from the VI Plan Propio de Investigación y Transferencia of Universidad de Sevilla (reference: VIPPIT-2020-II.5).

Conflicts of Interest

The authors declare no conflict of interest.

References

  1. Diputación de Sevilla Informe Socioeconómico de La Provincia de Sevilla. Available online: https://www.ine.es/nomen2/index.do (accessed on 2 February 2023).
  2. Ramírez-Juidías, E.; Espinar-Risco, M.L.; Pérez-Pérez, A.M. Innovación agrícola mediante SIG y teledetección. In Desarrollo e Innovación del Sector Citrícola en Cantillana; Ra-Ma Editorial: Madrid, Spain, 2020; pp. 51–80. [Google Scholar]
  3. Ayuntamiento de Cantillana. Memoria Del Plan Estratégico Para El Desarrollo Económico de Cantillana; Ayuntamiento de Cantillana: Cantillana, Spain, 2015. [Google Scholar]
  4. Velarde, J.G.; Cavaco de São Pedro, B.; Mora, C. Analysis of housing for rent in borderlands: A case study approach from the Iberian Peninsula. In Cross-Border Cooperation (CBC) Strategies for Sustainable Development; IGI Global: Hershey, PA, USA, 2020; pp. 115–131. [Google Scholar]
  5. Lu, Y.; Tan, B.; Ding, S.; Li, Y. SPI-CGAN: Single-Pixel Imaging Based on Conditional Generative Adversarial Network. J. Phys. Conf. Ser. 2022, 2216, 12092. [Google Scholar] [CrossRef]
  6. Ramírez-Juidías, E.; Pozo-Morales, L.; Galán-Ortiz, L. Procedimiento para la Obtención de una Imagen Teledetectada a Partir de Fotografía 2015. Available online: https://invenes.oepm.es/InvenesWeb/detalle?referencia=P201300573 (accessed on 2 February 2023).
  7. Covey, K.; Soper, F.; Pangala, S.; Bernardino, A.; Pagliaro, Z.; Basso, L.; Cassol, H.; Fearnside, P.; Navarrete, D.; Novoa, S.; et al. Carbon and Beyond: The Biogeochemistry of Climate in a Rapidly Changing Amazon. Front. For. Glob. Change 2021, 4, 11. [Google Scholar] [CrossRef]
  8. Kassa, G.; Bekele, T.; Demissew, S.; Abebe, T. Above- and Belowground Biomass and Biomass Carbon Stocks in Homegarden Agroforestry Systems of Different Age Groups at Three Sites of Southern and Southwestern Ethiopia. Carbon Manag. 2022, 13, 531–549. [Google Scholar] [CrossRef]
  9. Han, M.; Zhu, B. Changes in Soil Greenhouse Gas Fluxes by Land Use Change from Primary Forest. Glob. Chang. Biol. 2020, 26, 2656–2667. [Google Scholar] [CrossRef] [PubMed]
  10. Rahbek, C.; Borregaard, M.K.; Colwell, R.K.; Dalsgaard, B.; Holt, B.G.; Morueta-Holme, N.; Nogues-Bravo, D.; Whittaker, R.J.; Fjeldså, J. Humboldt’s Enigma: What Causes Global Patterns of Mountain Biodiversity? Science 2019, 365, 1108–1113. [Google Scholar] [CrossRef] [PubMed]
  11. Nobre, R.L.G.; Caliman, A.; Cabral, C.R.; de Carvalho Araújo, F.; Guérin, J.; da Costa Catombé Dantas Dantas, F.; Quesado, L.B.; Venticinque, E.M.; Guariento, R.D.; Amado, A.M.; et al. Precipitation, Landscape Properties and Land Use Interactively Affect Water Quality of Tropical Freshwaters. Sci. Total Environ. 2020, 716, 137044. [Google Scholar] [CrossRef] [PubMed]
  12. Tessema, B.; Sommer, R.; Piikki, K.; Söderström, M.; Namirembe, S.; Notenbaert, A.; Tamene, L.; Nyawira, S.; Paul, B. Potential for Soil Organic Carbon Sequestration in Grasslands in East African Countries: A Review. Grassl. Sci. 2020, 66, 135–144. [Google Scholar] [CrossRef]
  13. McDaniel, M.D.; Saha, D.; Dumont, M.G.; Hernández, M.; Adams, M.A. The Effect of Land-Use Change on Soil CH4 and N2O Fluxes: A Global Meta-Analysis. Ecosystems 2019, 22, 1424–1443. [Google Scholar] [CrossRef]
  14. Ghaderpour, E.; Mazzanti, P.; Mugnozza, G.; Bozzano, F. Coherency and phase delay analyses between land cover and climate across Italy via the least-squares wavelet software. Int. J. Appl. Earth Obs. Geoinf. 2023, 118, 103241. [Google Scholar] [CrossRef]
  15. Zhang, Y.; Wang, X.; Li, C.; Cai, Y.; Yang, Z.; Yi, Y. NDVI dynamics under changing meteorological factors in a shallow lake in future metropolitan, semiarid area in North China. Sci. Rep. 2018, 8, 15971. [Google Scholar] [CrossRef]
  16. Zhong, F.; Cheng, Q.; Ge, Y. Relationships between spatial and temporal variations in precipitation, climatic indices, and the normalized differential vegetation index in the upper and middle reaches of the Heihe river basin, Northwest China. Water 2019, 11, 1394. [Google Scholar] [CrossRef]
  17. Moreno-Martínez, Á.; Izquierdo-Verdiguier, E.; Maneta, M.P.; Camps-Valls, G.; Robinson, N.; Muñoz-Marí, J.; Sedano, F.; Clinton, N.; Running, S.W. Multispectral High Resolution Sensor Fusion for Smoothing and Gap-Filling in the Cloud. Remote Sens. Environ. 2020, 247, 111901. [Google Scholar] [CrossRef] [PubMed]
  18. Zeng, L.; Wardlow, B.D.; Xiang, D.; Hu, S.; Li, D. A Review of Vegetation Phenological Metrics Extraction Using Time-Series, Multispectral Satellite Data. Remote Sens. Environ. 2020, 237, 111511. [Google Scholar] [CrossRef]
  19. Inouye, D.W. Climate Change and Phenology. WIREs Climate Change 2022, 13, e764. [Google Scholar] [CrossRef]
  20. Rußwurm, M.; Körner, M. Self-Attention for Raw Optical Satellite Time Series Classification. ISPRS J. Photogramm. Remote Sens. 2020, 169, 421–435. [Google Scholar] [CrossRef]
  21. Rhif, M.; Ben Abbes, A.; Farah, I.; Martínez, B.; Sang, Y. Wavelet Transform Application for/in Non-Stationary Time-Series Analysis: A Review. Appl. Sci. 2019, 9, 1345. [Google Scholar] [CrossRef]
  22. Gendrin, A.; Langevin, Y.; Bibring, J.-P.; Forni, O. A New Method to Investigate Hyperspectral Image Cubes: An Application of the Wavelet Transform. J. Geophys. Res. 2006, 111, E10004. [Google Scholar] [CrossRef]
  23. Tucker, C.S.; Pearl, J.K. Coastal Tree-Ring Records for Paleoclimate and Paleoenvironmental Applications in North America. Quat. Sci. Rev. 2021, 265, 107044. [Google Scholar] [CrossRef]
  24. El Mahdaoui, A.; Ouahabi, A.; Moulay, M.S. Image Denoising Using a Compressive Sensing Approach Based on Regularization Constraints. Sensors 2022, 22, 2199. [Google Scholar] [CrossRef]
  25. Ghaderpour, E.; Vujadinovic, T. Change Detection within Remotely Sensed Satellite Image Time Series via Spectral Analysis. Remote Sens. 2020, 12, 4001. [Google Scholar] [CrossRef]
  26. Mahlayeye, M.; Darvishzadeh, R.; Nelson, A. Cropping Patterns of Annual Crops: A Remote Sensing Review. Remote Sens. 2022, 14, 2404. [Google Scholar] [CrossRef]
  27. Adebayo, T.S.; Oladipupo, S.D.; Adeshola, I.; Rjoub, H. Wavelet Analysis of Impact of Renewable Energy Consumption and Technological Innovation on CO2 Emissions: Evidence from Portugal. Environ. Sci. Pollut. Res. 2022, 29, 23887–23904. [Google Scholar] [CrossRef]
  28. Meteoblue Simulated Historical Climate & Weather Data for Cantillana. Available online: https://www.meteoblue.com/en/weather/historyclimate/climatemodelled/cantillana_spain_2520215 (accessed on 6 March 2023).
  29. Instituto Nacional de Estadística. Available online: https://www.ine.es/nomen2/index.do (accessed on 6 March 2023).
  30. Foro Ciudad (FC) Cantillana: Evolución de Habitantes Desde 1900 Hasta 2022. Available online: https://www.foro-ciudad.com/sevilla/cantillana/habitantes.html#Evolucion (accessed on 6 March 2023).
  31. Rouse, J.W., Jr.; Hass, R.H.; Deering, D.W.; Schell, J.A. Monitoring the Vernal Advancement and Retrogradation (Green Wave Effect) of Natural Vegetation (CR-132982); NASA: Washington, DC, USA, 1973. [Google Scholar]
  32. Paul, R.K.; Mitra, D. Forecasting Wheat Yield Using Wavelet-Based Multiresolution Analysis. J. Indian Soc. Agric. Stat. 2021, 75, 181–188. [Google Scholar]
Figure 1. Location of the study area.
Remotesensing 15 05225 g001
Figure 2. Average temperatures diagram for the Viar River’s Irrigable Area during the project period (from 3 August 2015 to 3 August 2020).
Remotesensing 15 05225 g002
Figure 3. Average rainfall diagram for the Viar River’s Irrigable Area during the project period (from 3 August 2015 to 3 August 2020).
Remotesensing 15 05225 g003
Figure 4. Flowchart of this research.
Remotesensing 15 05225 g004
Figure 5. NDVI time series of more significant land uses for 2017–2020 in the study area. (NDVI drops are due to the continuous land use changes that occurred in the study area. These changes are the consequence of both the severe pruning carried out in order to rejuvenate, year by year, part of the plot (citrus orchard) and the controlled burning of superficial vegetation in the forest to avoid fires.)
Remotesensing 15 05225 g005
Figure 6. Coiflet wavelet graphs corresponding to an NDVI time series of more significant land uses for 2017–2020 in the study area.
Remotesensing 15 05225 g006
Figure 7. NDVI maps of the municipality of Cantillana from 2017 to 2020 (coordinates are shown in kilometers).
Remotesensing 15 05225 g007
Figure 8. Spectral analysis of the study area’s temporal series.
Remotesensing 15 05225 g008
Figure 9. Elevation map, coordinates in kilometers, of the municipality of Cantillana (https://centrodedescargas.cnig.es/CentroDescargas/ (accessed on 29 September 2023).
Remotesensing 15 05225 g009
Figure 10. Land cover map, coordinates in kilometers, both at the end of 2016 (left) and at the end of 2020 (right) in the study area (https://portalrediam.cica.es/descargas (accessed on 29 September 2023).
Remotesensing 15 05225 g010
Figure 11. NDVI mean map between 2017 and 2020.
Remotesensing 15 05225 g011
Table 1. Relationship between wavelet power, overall accuracy, and Khat values.
Wavelet Power (%)
7080859090 (0.4 Threshold)95 (0.4 Threshold)
Overall Accuracy (%)81.283.690.287.488.745.0
Khat (%)70.574.484.380.692.325.8
Table 2. Citrus orchards’ total agriculture areas are shown by harvest year.
YearArea (ha)
20172270
20182760
20193005
20203250
Table 3. Randomly selected unclassified pixels tabulated according to their reference categories (single = one maximum detected; double = two maximums detected; unclassified = more than two maximums detected).
Wavelet Power (%)
0.3 Threshold0.4 ThresholdTotal
7080859090
Non-Citrus-Orchards001023
Single8108161355
Double6658736064321
Unclassified71407331
Total8182828382410
Table 4. Error matrix displaying both the accurate classification count and the distribution of incorrectly classified points.
Reference Data (Non-Smoothed Sentinel-2 Cropping Patterns)
Non-Citrus-OrchardsSingleDoubleTotal
Wavelet-Detected Cropping PatternsNon-Citrus-Orchards820082
Single1731084
Double221138161
Total8594148327
Table 5. Accuracy obtained (both producer’s and user’s accuracy) in this study.
Producer’s Accuracy (%)User’s Accuracy (%)
Wavelet-Detected Cropping PatternsNon-Citrus-Orchards97.3100
Single77.287.2
Double93.584.2
Table 6. To determine the overall accuracy of our algorithm, we compared our automated crop detection methods using the wavelet-smoothed NDVI time series to the input NDVI time series data (which was not smoothed), the cropping patterns identified via the user or Sentinel-2, and the historical data of citrus orchards in Cantillana. We evaluated the overall accuracy by calculating the percentage of correctly identified points in a class over the total number of sampled points. The Khat values for all wavelet powers were also high.
Reference DataOverall Accuracy (%)Khat (%)
Sentinel-288.792.3
Cantillana Citrus Orchards94.285.9
Table 7. Error matrix displaying the level of concurrence and disagreement between the reference data (which include the complete history of the citrus orchards in Cantillana) and the cropping patterns detected using the wavelet technique with a 90% accuracy rate.
Reference Data (All Cantillana Citrus Orchards)
Non-Citrus-OrchardsSingleDoubleTotal
Wavelet-Detected Cropping PatternsNon-Citrus-Orchards583061
Single015217
Double0044
Total5818682
Table 8. Accuracy obtained (both producer’s and user’s accuracy) in this study for all Cantillana citrus orchards.
Producer’s Accuracy (%)User’s Accuracy (%)
Wavelet-Detected Cropping PatternsNon-Citrus-Orchards10094.9
Single8290.2
Double71.6100
Table 9. Cropping patterns (single and double) areas (in hectares) are shown by harvest year.
YearSingle AreaDouble Area
20171132.731137.27
20181217.161542.84
20191238.061766.94
20201241.502008.50
Disclaimer/Publisher’s Note: The statements, opinions and data contained in all publications are solely those of the individual author(s) and contributor(s) and not of MDPI and/or the editor(s). MDPI and/or the editor(s) disclaim responsibility for any injury to people or property resulting from any ideas, methods, instructions or products referred to in the content.

