Abstract
The Amazon forests act as a global reserve for carbon, have very high biodiversity, and provide a variety of additional ecosystem services. These forests are, however, under increasing pressure, coming mainly from deforestation, despite the fact that accurate satellite monitoring is in place that produces annual deforestation maps and timely alerts. Here, we present a proof of concept for rapid deforestation monitoring that engages the global community directly in the monitoring process via crowdsourcing while subsequently leveraging the power of deep learning. Offering no tangible incentives, we were able to sustain participation from more than 5500 active contributors from 96 different nations over a 6-month period, resulting in the crowd classification of 43,108 satellite images (representing around 390,000 km2). Training a suite of AI models with results from the crowd, we achieved an accuracy greater than 90% in detecting new and existing deforestation. These findings demonstrate the potential of a crowd–AI approach to rapidly detect and validate deforestation events. Our method directly engages a large, enthusiastic, and increasingly digital global community who wish to participate in the stewardship of the global environment. Coupled with existing monitoring systems, this approach could offer an additional means of verification, increasing confidence in global deforestation monitoring.
1. Introduction
The Amazon rainforest, spanning 5.5 million km2, is an area half the size of the United States of America and slightly larger than the European Union. This vast expanse of forest is home to the greatest variety of plant species per km2 in the world [1]—and plays a vital role in absorbing billions of tons of CO2 annually from the atmosphere [2]. However, deforestation and forest degradation continue to place pressure on the Amazon [3,4], as forests are cleared for timber extraction, crop production, rangeland expansion, and infrastructure development—ultimately impacting water bodies and biodiversity and leading to soil erosion and climate change [5,6].
Deforestation rates reached their peak in the Brazilian Amazon in the period 2003–2004 [7] at 29,000 km2 per year, thereafter declining to below 6000 km2 per year by 2014 [3]. However, since then, official deforestation rates have been rising again, worsening in recent years (10,129 km2 of forest were clear-cut in 2019) [8]. Compounding this problem, the number of active fires in August 2019 was nearly three times higher than in August 2018 and the highest since 2010, with strong evidence suggesting this increase in fire was linked to deforestation [9].
Several operational systems are in place to detect and monitor deforestation over the Amazon, including Brazil’s mapbiomas.org and continuous monitoring programs of clear-cut deforestation (PRODES) and the related alert warning system for near-real-time deforestation detection (DETER) [10], as well as the Global Land Analysis and Discovery Landsat deforestation alerts (GLAD-L) [11], the GLAD-S2 [12] Sentinel deforestation alerts, and the global annual tree cover loss datasets [13]. Radar-based deforestation alerts (RADD) [14] are also now available for the pan-tropical belt. The GLAD system employs a classification tree to detect deforestation [11], while the RADD system employs a probabilistic algorithm. While these operational remote sensing systems are delivering highly accurate annual assessments and frequent alerts [10,11,12,13], their uptake into actionable change or policy developments appears somewhat limited [15].
In an effort to monitor forest disturbance in near real time, Global Forest Watch has merged the GLAD-L, GLAD-S2, and RADD alerts into a single integrated deforestation alert. This has resulted in a daily pan-tropical monitoring system operating from 1 January 2019 to the present with a pixel resolution of 10 m. Although these alerts are described as deforestation alerts, they do not distinguish between human-caused deforestation and other disturbance types (e.g., fire, windthrow), meaning that these alerts should be considered as potential deforestation events and should be further investigated. Furthermore, accuracies vary across the three alerts due to different sensor characteristics—i.e., wetness greatly affects the RADD alerts, while cloud cover affects the GLAD alerts. Additionally, the highest confidence is only awarded to alerts where more than one alert system was in operation at a given location and time period, meaning this is not always achieved. Hence, a complementary verification system that could be established to add additional confidence to the integrated deforestation alerts would provide additional value.
One component of such a complementary verification system could include crowdsourcing, otherwise known as the outsourcing of tasks to the crowd [16], which has been used successfully in the past for image recognition tasks and the visual interpretation of satellite imagery [17,18] as humans are particularly well suited to image recognition, especially when the images are abstract or have complex features [19]. However, for challenging thematic classification tasks (which require specific knowledge or experience to identify), experts will outperform non-experts [20]. Hence, it is important to ensure training materials exist for the crowd for difficult tasks. Nonetheless, studies show that the crowd can perform equally as well as experts (in particular, for binary tasks such as human impact), with accuracies increasing when consensus or majority agreement is used [20,21]. Furthermore, ancillary benefits of crowdsourcing include awareness raising and education among participants, along with a feeling of community [22,23].
With large advances in recent years in the field of image recognition [24], large image libraries such as those generated via crowdsourcing can be exploited by Artificial Intelligence (AI). By combining both crowdsourcing and AI, we can harness the efforts of the crowd to construct a dataset of classified satellite images from which a deep-learning model can be trained to monitor rainforest deforestation.
Here, we investigate the application of supervised deep learning to automate the identification of satellite images that contain areas of significant deforestation. However, deep-learning models trained with supervised learning typically require large volumes of high-quality training data. Many deep-learning models are pre-trained on large datasets that have been curated over many years by researchers, such as ImageNet [25], CIFAR-10, and CIFAR-100 [26]. These datasets can contain millions of images, but those images are typically of common scenes and features available from the internet. While some image libraries do exist for identifying rainforest deforestation [27], we opted to crowdsource this task, in part, to demonstrate the potential of involving the global community.
Hence, our objectives in this proof of concept were twofold, namely, to explore the potential of the crowd to detect Amazon deforestation on a large scale and then, using this crowdsourced image library, to train deep learning models to demonstrate the accuracy, scalability, and applicability of such an approach across a large region.
2. Materials and Methods
2.1. Satellite Data
For this study, we exclusively utilized satellite imagery from the free and open Sentinel-2 mission of Copernicus, a program of the European Union. Sentinel-2 is a European wide-swath, high-resolution, multi-spectral imaging mission with a revisit frequency of 5 days at the Equator [28]. Sentinel-2 contains 13 optical bands of which we used 3 to create RGB images (Blue (~493 nm), Green (560 nm), and Red (~665 nm)) with a 10 m resolution. The orbital swath width is 290 km. The Sentinel-2 image tiles were downloaded using the Sen2r package [29]. We filtered the images using a 5% cloud filter. The retrieved images spanned the years 2018–2020, implying that, in some images, we would have missed the most recent activity.
The downloaded images were then further screened for quality, including excessive cloud coverage that was not filtered by the cloud filter or where missing data consumed the majority of the scene. These images were removed. In the next steps, the original tiles were subdivided into nine 3 × 3 km images, which, when presented to the crowd in a 3 × 3 matrix (Supplementary Information Figure S1), provided imagery at a suitable zoom level for crowdsourcing, bearing in mind a pixel resolution of 10 m.
2.2. Crowdsourcing Application
In order to explore the potential of the crowd and to collect the necessary training data to drive the AI models, a crowdsourcing application was designed and implemented (https://app.gatheriq.analytics/rainforest (accessed on 22 April 2020)). The crowd was only involved in the initial stage of labeling the satellite imagery. Several steps were undertaken to ensure the highest quality possible of the crowdsourced images. Users were presented with a 3 × 3 matrix of Sentinel-2 satellite images from which they selected the images that appeared to contain evidence of deforestation (Supplementary Information Figure S1). Classified examples of images that users may encounter are also provided (Supplementary Information Figure S2). These cover the broad categories of human impact, natural deforestation, and comparisons between natural and human impact. Under human impact, volunteers might encounter roads, settlements, fields, clear-cuts, and clearings. Under natural deforestation, volunteers might encounter water-related canopy disruptions and other canopy disruptions including fire, wind damage, and terrain- and soil-related changes.
We instructed the crowd to leave regions unselected if they were unsure. The entire platform containing an overview of the task and progress tracking is available at https://www.sas.com/en_us/data-for-good/rainforest.html (accessed on 22 April 2020). The current platform has now expanded upon the original study and continues to collect training data.
2.3. Crowdsourcing Campaign
To engage the crowdsourcing audience to participate in the image classification effort, several promotional efforts were executed over the course of the study period, including techniques such as the publication of online videos, press releases, conference events, social media promotion, and paid advertising. The project was launched to the public on Earth Day, 22 April 2020, an annual global event to demonstrate support of the efforts to protect the Earth’s environment. Aligning the launch of this campaign with Earth Day proved to be a successful starting point and a useful means of engagement with volunteers interested in the environment. A test period followed, with accurate data being collected as of 1 June 2020. Data collected until 30 November 2020 were used in this study. The resulting statistics from this campaign are presented in Table 1.

Table 1.
Statistics from the crowdsourcing campaign.
The campaign was open to anyone with access to the URL. There were no restrictions on participation; however, it is likely that the crowd was biased toward those with an interest in Earth Day and those who saw the online advertising. Although the campaign was open to anyone, we provided help to guide volunteers and applied a variety of techniques to ensure quality as described below.
2.4. Image Labeling
A naive approach to labeling would display each image to one person only and have them provide a label. While this would allow for labeling the most images in the shortest amount of time, we cannot assume that a randomly selected member of the public is skilled enough to accurately identify deforestation in a satellite image. Instead, we opted to display each satellite image to multiple users (a minimum of six unique submissions with a process making it unlikely that multiple votes come from the same person), taking a decision on the final classification based on their level of agreement.
We chose not to require users to login or provide any identifying information in an effort to eliminate as many hurdles to participation as possible. However, this decision also made it challenging to identify unique labelers, which prevented us from using techniques such as Inter-Rater Reliability [30]. Instead, users were shown images randomly sampled from a pool of 2000 unlabeled images, and we assumed that, if users can reach a consensus on the label after a reasonable number of views for a given image, then that label is an acceptable substitute for a label from an expert. This turns the problem of user consensus into estimating the probability that a user would, on average, assign a particular label. For each image to be labeled, we applied the following formula:
This represents the probability that a user selected at random will identify the image as showing evidence of deforestation. This gives a Bernoulli process where is unknown. By polling multiple users, we estimate , the likelihood that the crowd would collectively label the image as Deforestation = 1, as follows:
However, this estimate of also has some amount of error. Therefore, we place a 95% confidence interval around and only consider an image as labeled once the upper bounds (UBs) or lower bounds (LBs) for cross the 0.5 threshold, as follows:
2.5. Crowd Agreement with Experts
The users reached a consensus on most images within a few dozen votes (Supplementary Figure S6). However, a small percentage of images were challenging and required many votes to reach consensus. We periodically sampled these images with larger disagreement, as calculated in Equation (6), and had them manually reviewed and labeled by experts to remove them from circulation and avoid user frustration. Approximately 300 images were removed in this manner. These labeled images were retained for model training.
In addition, we randomly sampled 200 images for expert review to measure how often the crowd labels aligned with expert labels. The crowd agreed with experts 88% of the time (Supplementary Table S3).
2.6. Deforestation Data for Validation
For the purposes of validation, we obtained forest deforestation annual products from Brazil’s PRODES system located at http://terrabrasilis.dpi.inpe.br/en/download-2/ (accessed on 1 May 2021). For PRODES, the deforested area is composed of aggregate deforestation up to the year 2007 and is discretized into an annual historical time series for the years 2008 to 2020. PRODES uses Landsat or similar satellite images to register and quantify deforested areas greater than or equal to 6.25 hectares. PRODES considers deforestation to be the suppression of native vegetation, regardless of the future use of these areas.
The annual global tree cover loss products were obtained from https://glad.earthengine.app/view/global-forest-change#dl=1;old=off;bl=off;lon=20;lat=10;zoom=3 (accessed on 1 May 2021). We used the forest cover loss event (lossyear) product to represent annual forest loss. Forest loss during the period 2000–2020 is defined as a stand-replacement disturbance or a change from a forest to a non-forest state. It is encoded as either 0 (no loss) or else a value in the range 1–20, representing loss detected primarily in the year 2001–2020, respectively. All files contain unsigned 8-bit values and have a spatial resolution of 1 arc-second per pixel or approximately 30 m per pixel at the equator.
2.7. Deep Learning
We constructed four separate deep learning models using established convolutional neural network architectures: VGG16, ResNet18, ResNet34, and MobileNetV2. Each model was trained using SAS® Visual Data Mining and Machine Learning software (SAS 9.4 and SAS Viya 4; SAS Institute, Cary, NC, USA) in conjunction with the SWAT and DLPy packages for Python.
The VGG16 has a total of 16 layers with weights with approximately 138 million parameters, making it computationally expensive, although it generalizes well to a wide range of tasks [31]. ResNet18 has 18 layers and approximately 11 million trainable parameters, while ResNet34 is structured as a 34-layer CNN with 63.5 million parameters. Both ResNet models are useful where resources are limited, gaining accuracy from increased depth [32]. MobileNetV2 is 53 layers deep with approximately 13 million parameters and is designed for computational efficiency [33].
The preprocessing time of the models was negligible. We performed some basic oversampling of deforested images to balance the dataset and augmented the training set with flip/mirror transformations. For example, ResNet18 training for 30 epochs took approximately 45 min using 2 GPUs; however, this time varies by model architecture and, additionally, which resources were available on the shared environment.
During each training session, the model was trained for 50 epochs on the available training data. After each epoch, we measure the cross-entropy loss J as follows:
where is the total number of examples in the training set, is the label assigned by the crowd to image , and is the probability predicted by the network for the same training image.
We applied a stochastic gradient descent with momentum [34] to reduce the cross-entropy loss after each epoch. This optimization was performed with a learning rate of 1 × 10⁻³, a batch size of 32, and an L2 regularization parameter of 5 × 10⁻⁴.
3. Results
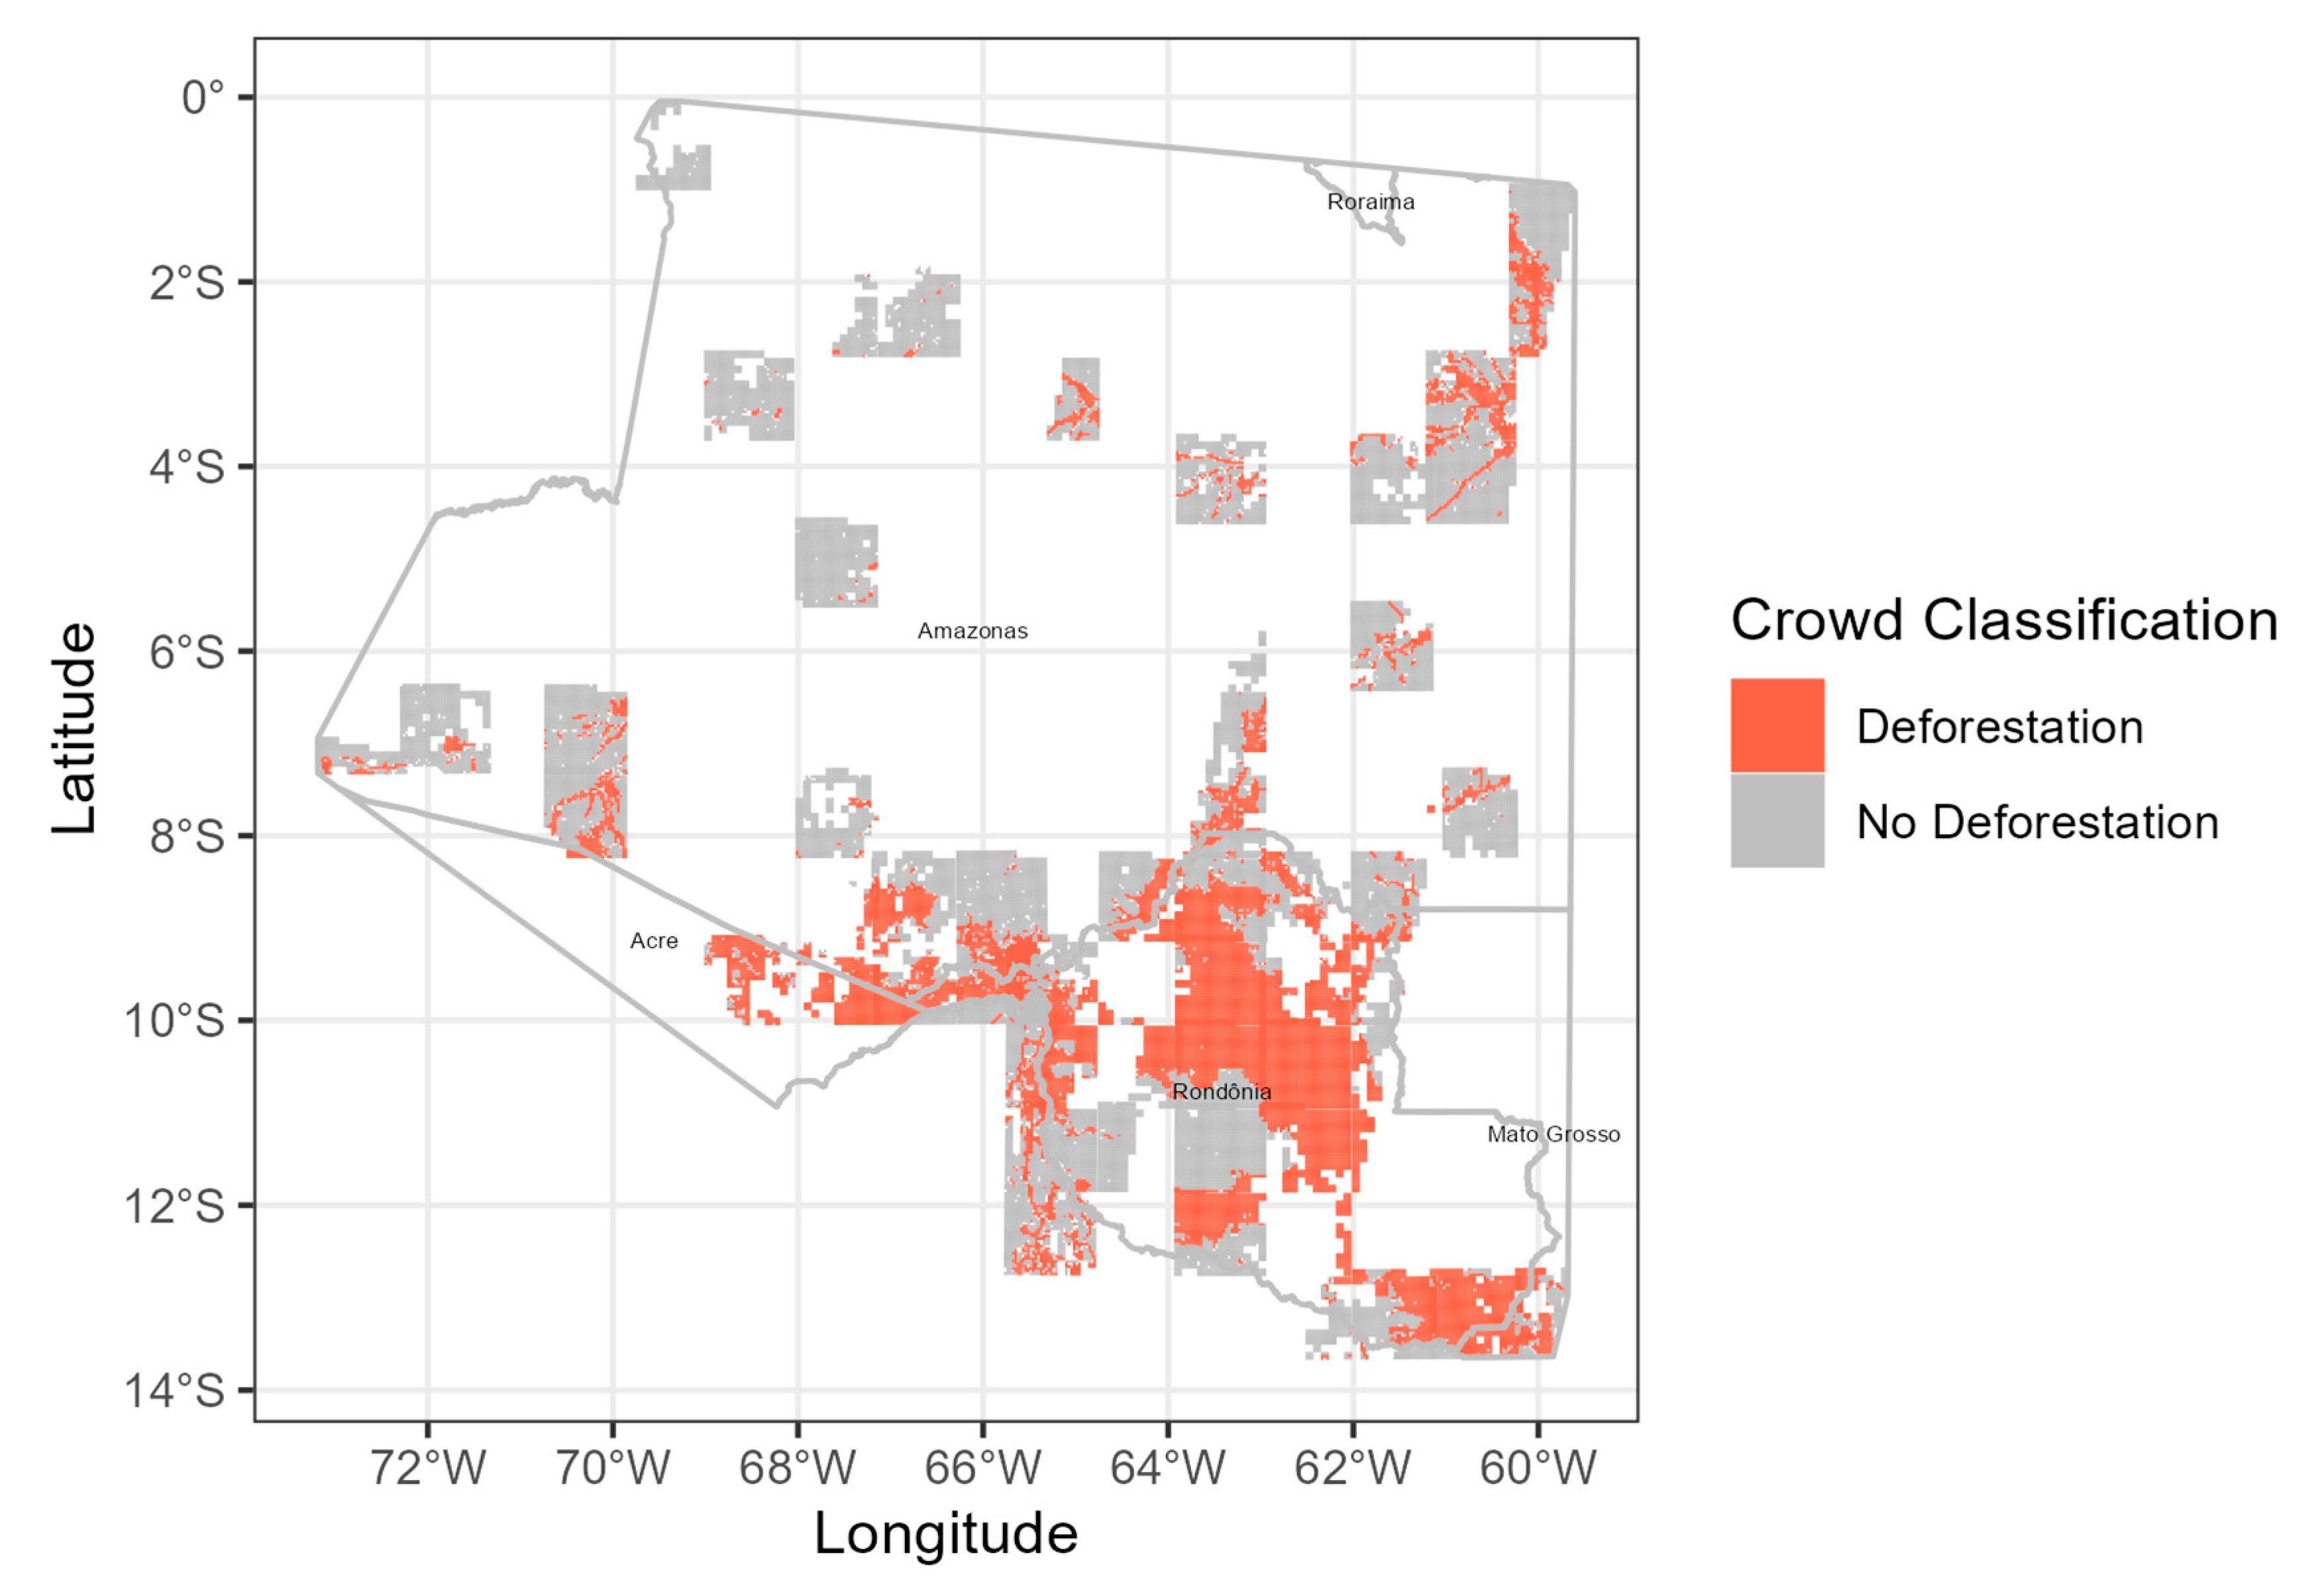
With the establishment of a dedicated crowdsourcing application (https://app.gatheriq.analytics/rainforest (accessed on 22 April 2020)), we launched a campaign to crowdsource Amazon deforestation activity. In a span of only 6 months, 5500 active participants from 96 countries helped crowdsource the classification of 389,988 square kilometers of the Amazon in terms of deforestation activity (Figure 1). Volunteers were presented with cloud-free samples of Sentinel-2 satellite images and asked to identify those in which deforestation activity was visible (Supplementary Figure S1). This resulted in a map and image library of deforestation activities across the Amazon basin. Example images were provided for guidance (Supplementary Figure S2). The level of consensus or agreement among the crowd on the classification result was generally high, with most images (37,325 images out of 43,108) receiving over 80% percent consensus.
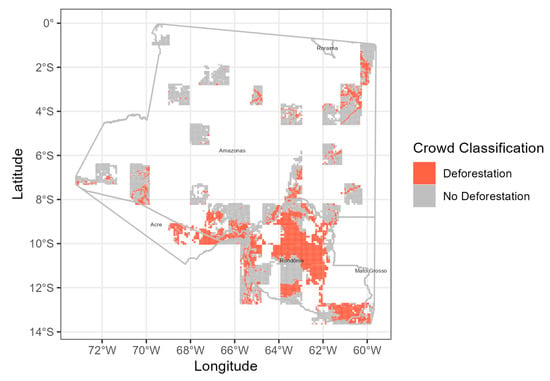
Figure 1.
Results of the crowdsourcing campaign over the Brazilian Amazon between June and November 2020. Map of the 390,000 km2 (43,108 images) classified by the crowd as having either evidence of deforestation or no deforestation. Individual pixels represent a 3 × 3 km image.
3.1. Validation of the Crowd
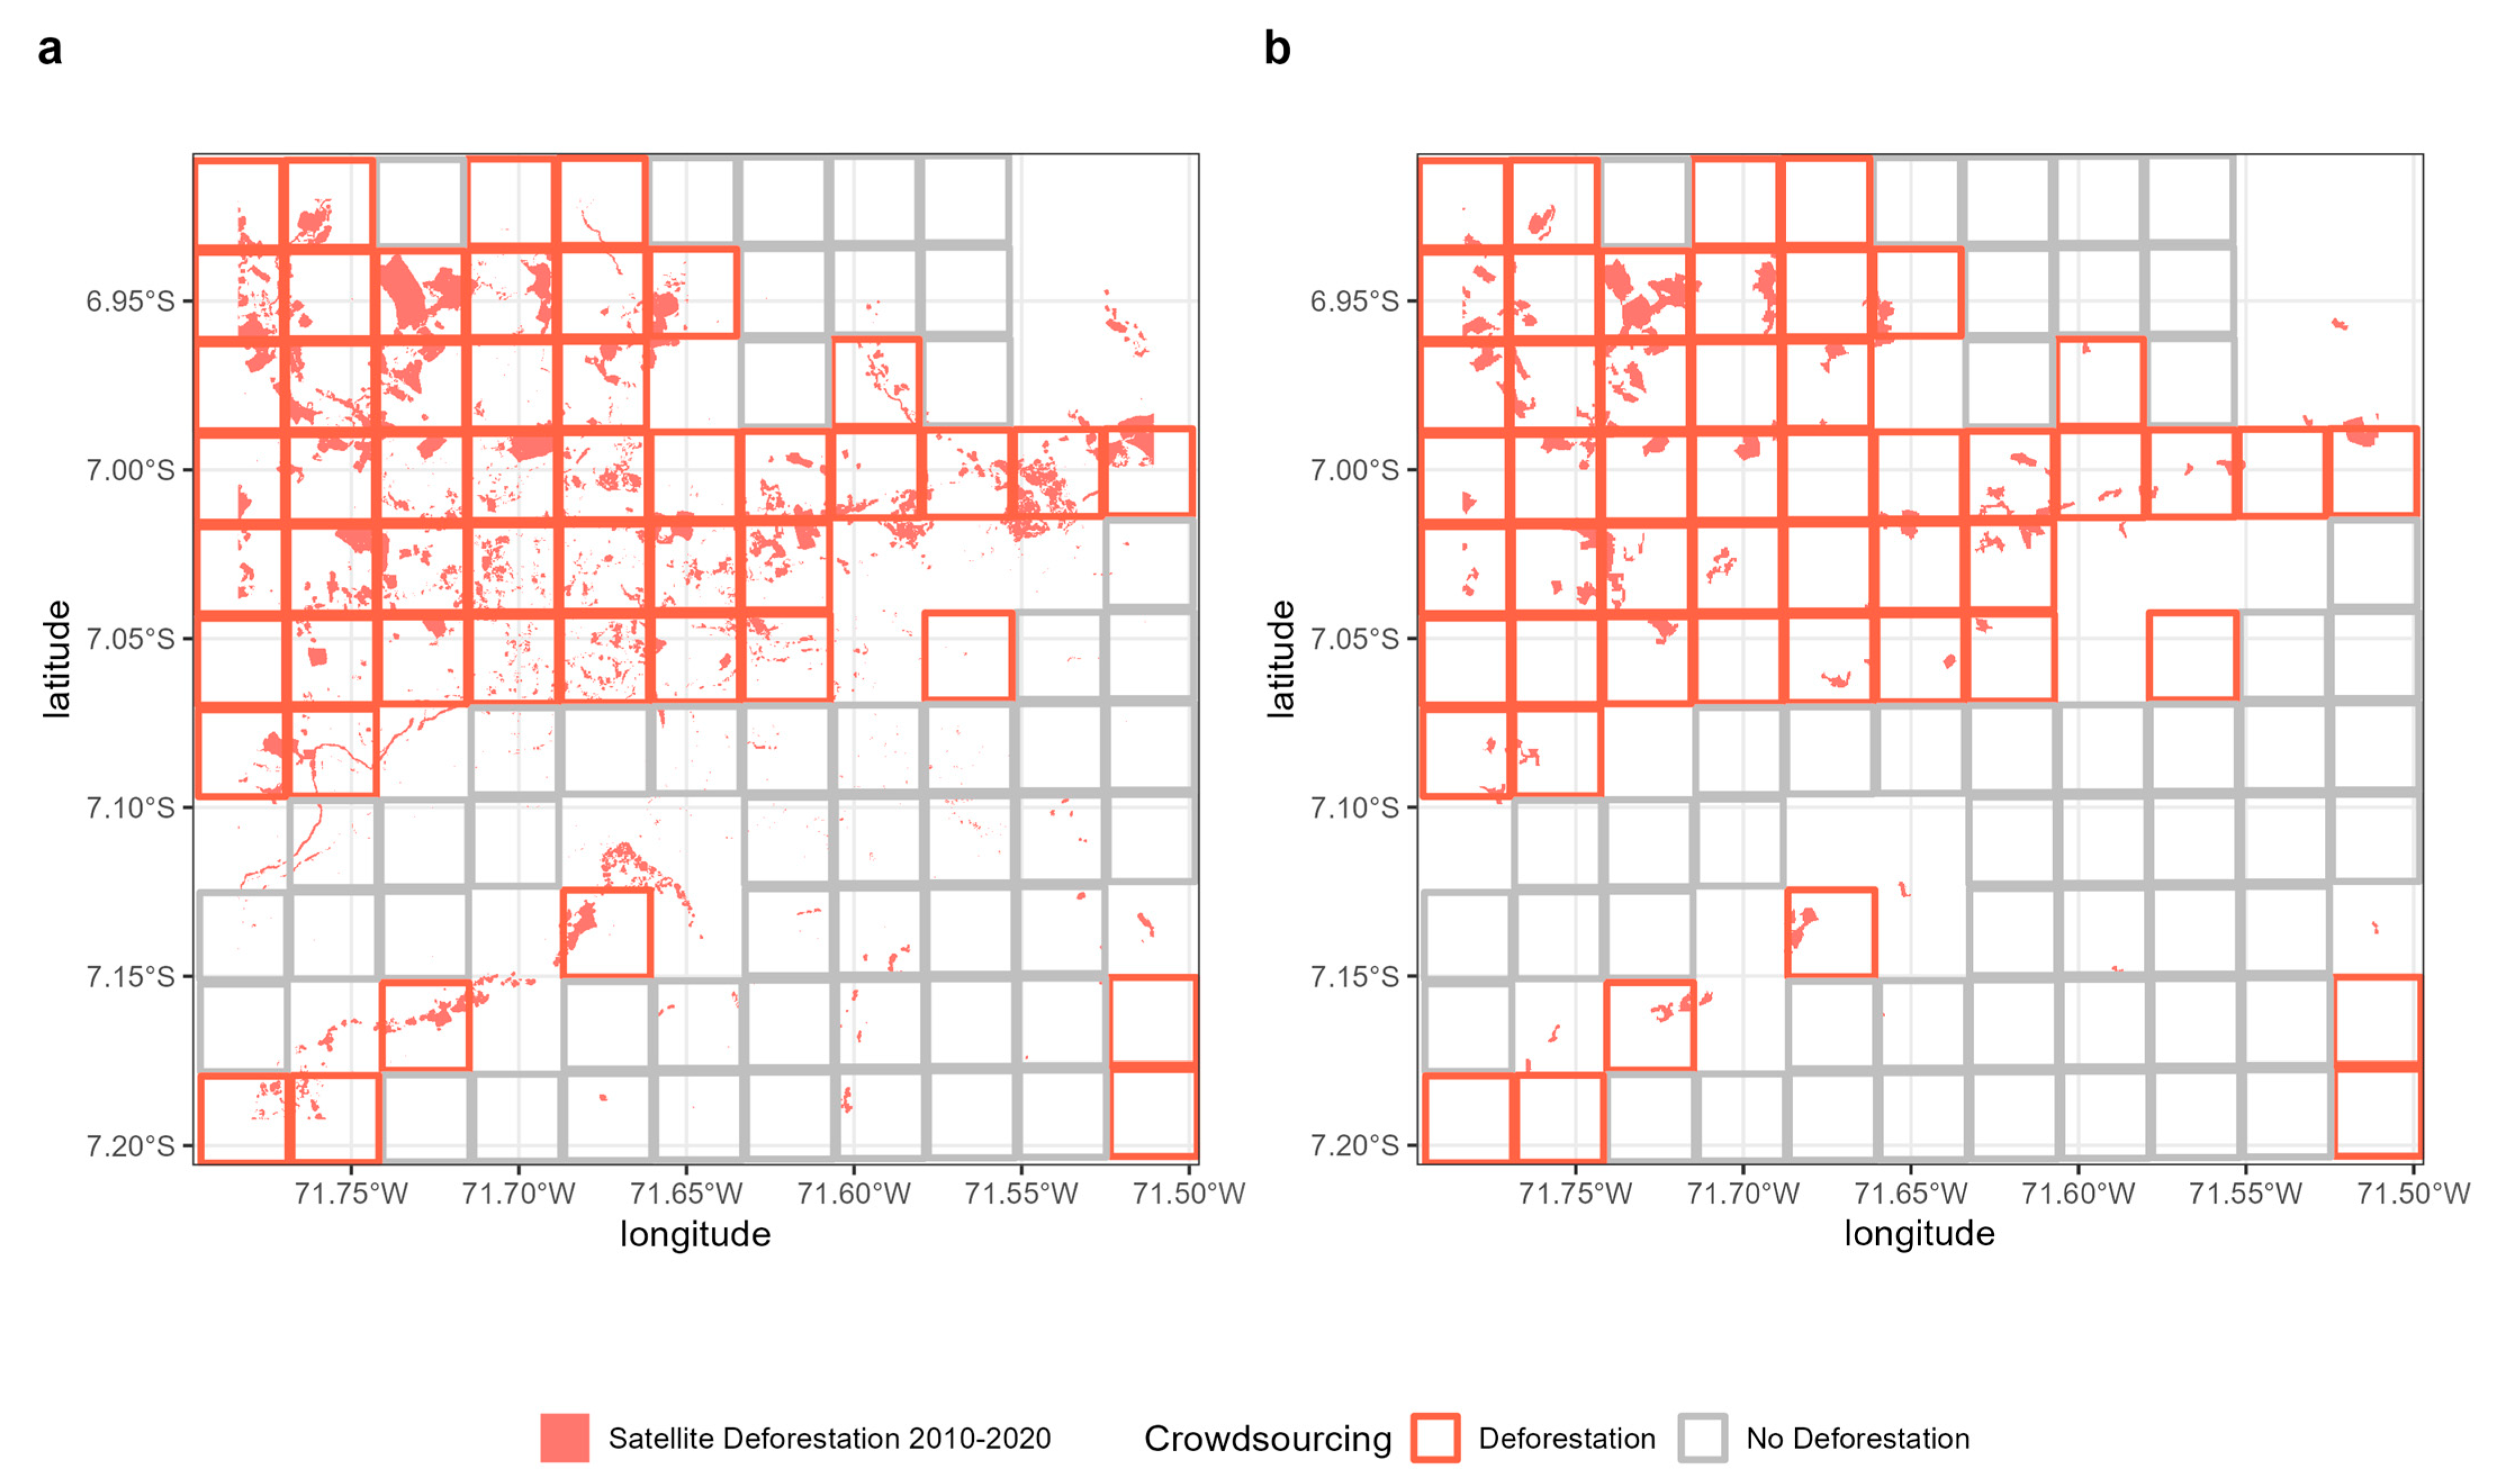
To increase our confidence in the crowd and determine the quality of our image library, we performed a series of quality steps (Methods). During the campaign, each image was shown to multiple users until a consensus was reached on the image label. Images that proved difficult for the crowd (i.e., consensus could not be reached) were removed from the campaign and labeled by experts (approximately 300 images in total, labeled by global land cover experts at IIASA). In addition, we randomly sampled 200 images for expert review to determine how often the crowd labels aligned with these expert labels, resulting in 88% agreement. Finally, we compared our crowdsourced image library of deforestation activity with the annual Brazilian deforestation map (PRODES) and the global annual tree cover loss product [13] (Figure 2).
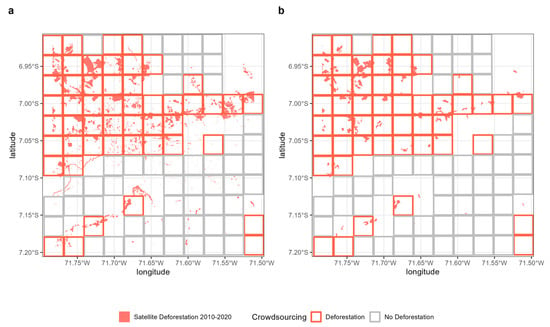
Figure 2.
A comparison of results from our crowdsourcing campaign with (a) global annual tree cover loss and (b) Brazil’s PRODES satellite deforestation datasets for a subset of the study area. We considered only tree cover loss and PRODES satellite observations from the period 2010–2020, as earlier disturbance is likely no longer visible to the crowd. The pixel outlines in red and gray (3 × 3 km) represent the unique crowdsourcing image locations identified as containing either signs of deforestation or no deforestation, respectively.
The resulting comparison of the three products demonstrates that our crowdsourcing data consistently detects historical deforestation activity recorded by both the PRODES and tree cover loss products. Differences exist in the level of spatial detail between the PRODES (6.25 ha) and tree cover loss products (30 m) and in the timespan of the two products (Methods). Thus, in order to compare these results with our crowdsourcing classifications, we searched the PRODES and tree cover loss products for deforestation activity greater than 1 km2 (100 ha) within the coarser pixels identified by the crowd as containing signs of deforestation activity. This resulted in a spatial accuracy between the crowd and the PRODES and tree cover loss products of 92% and 89%, respectively (Supplementary Tables S1 and S2).
3.2. Deep Learning
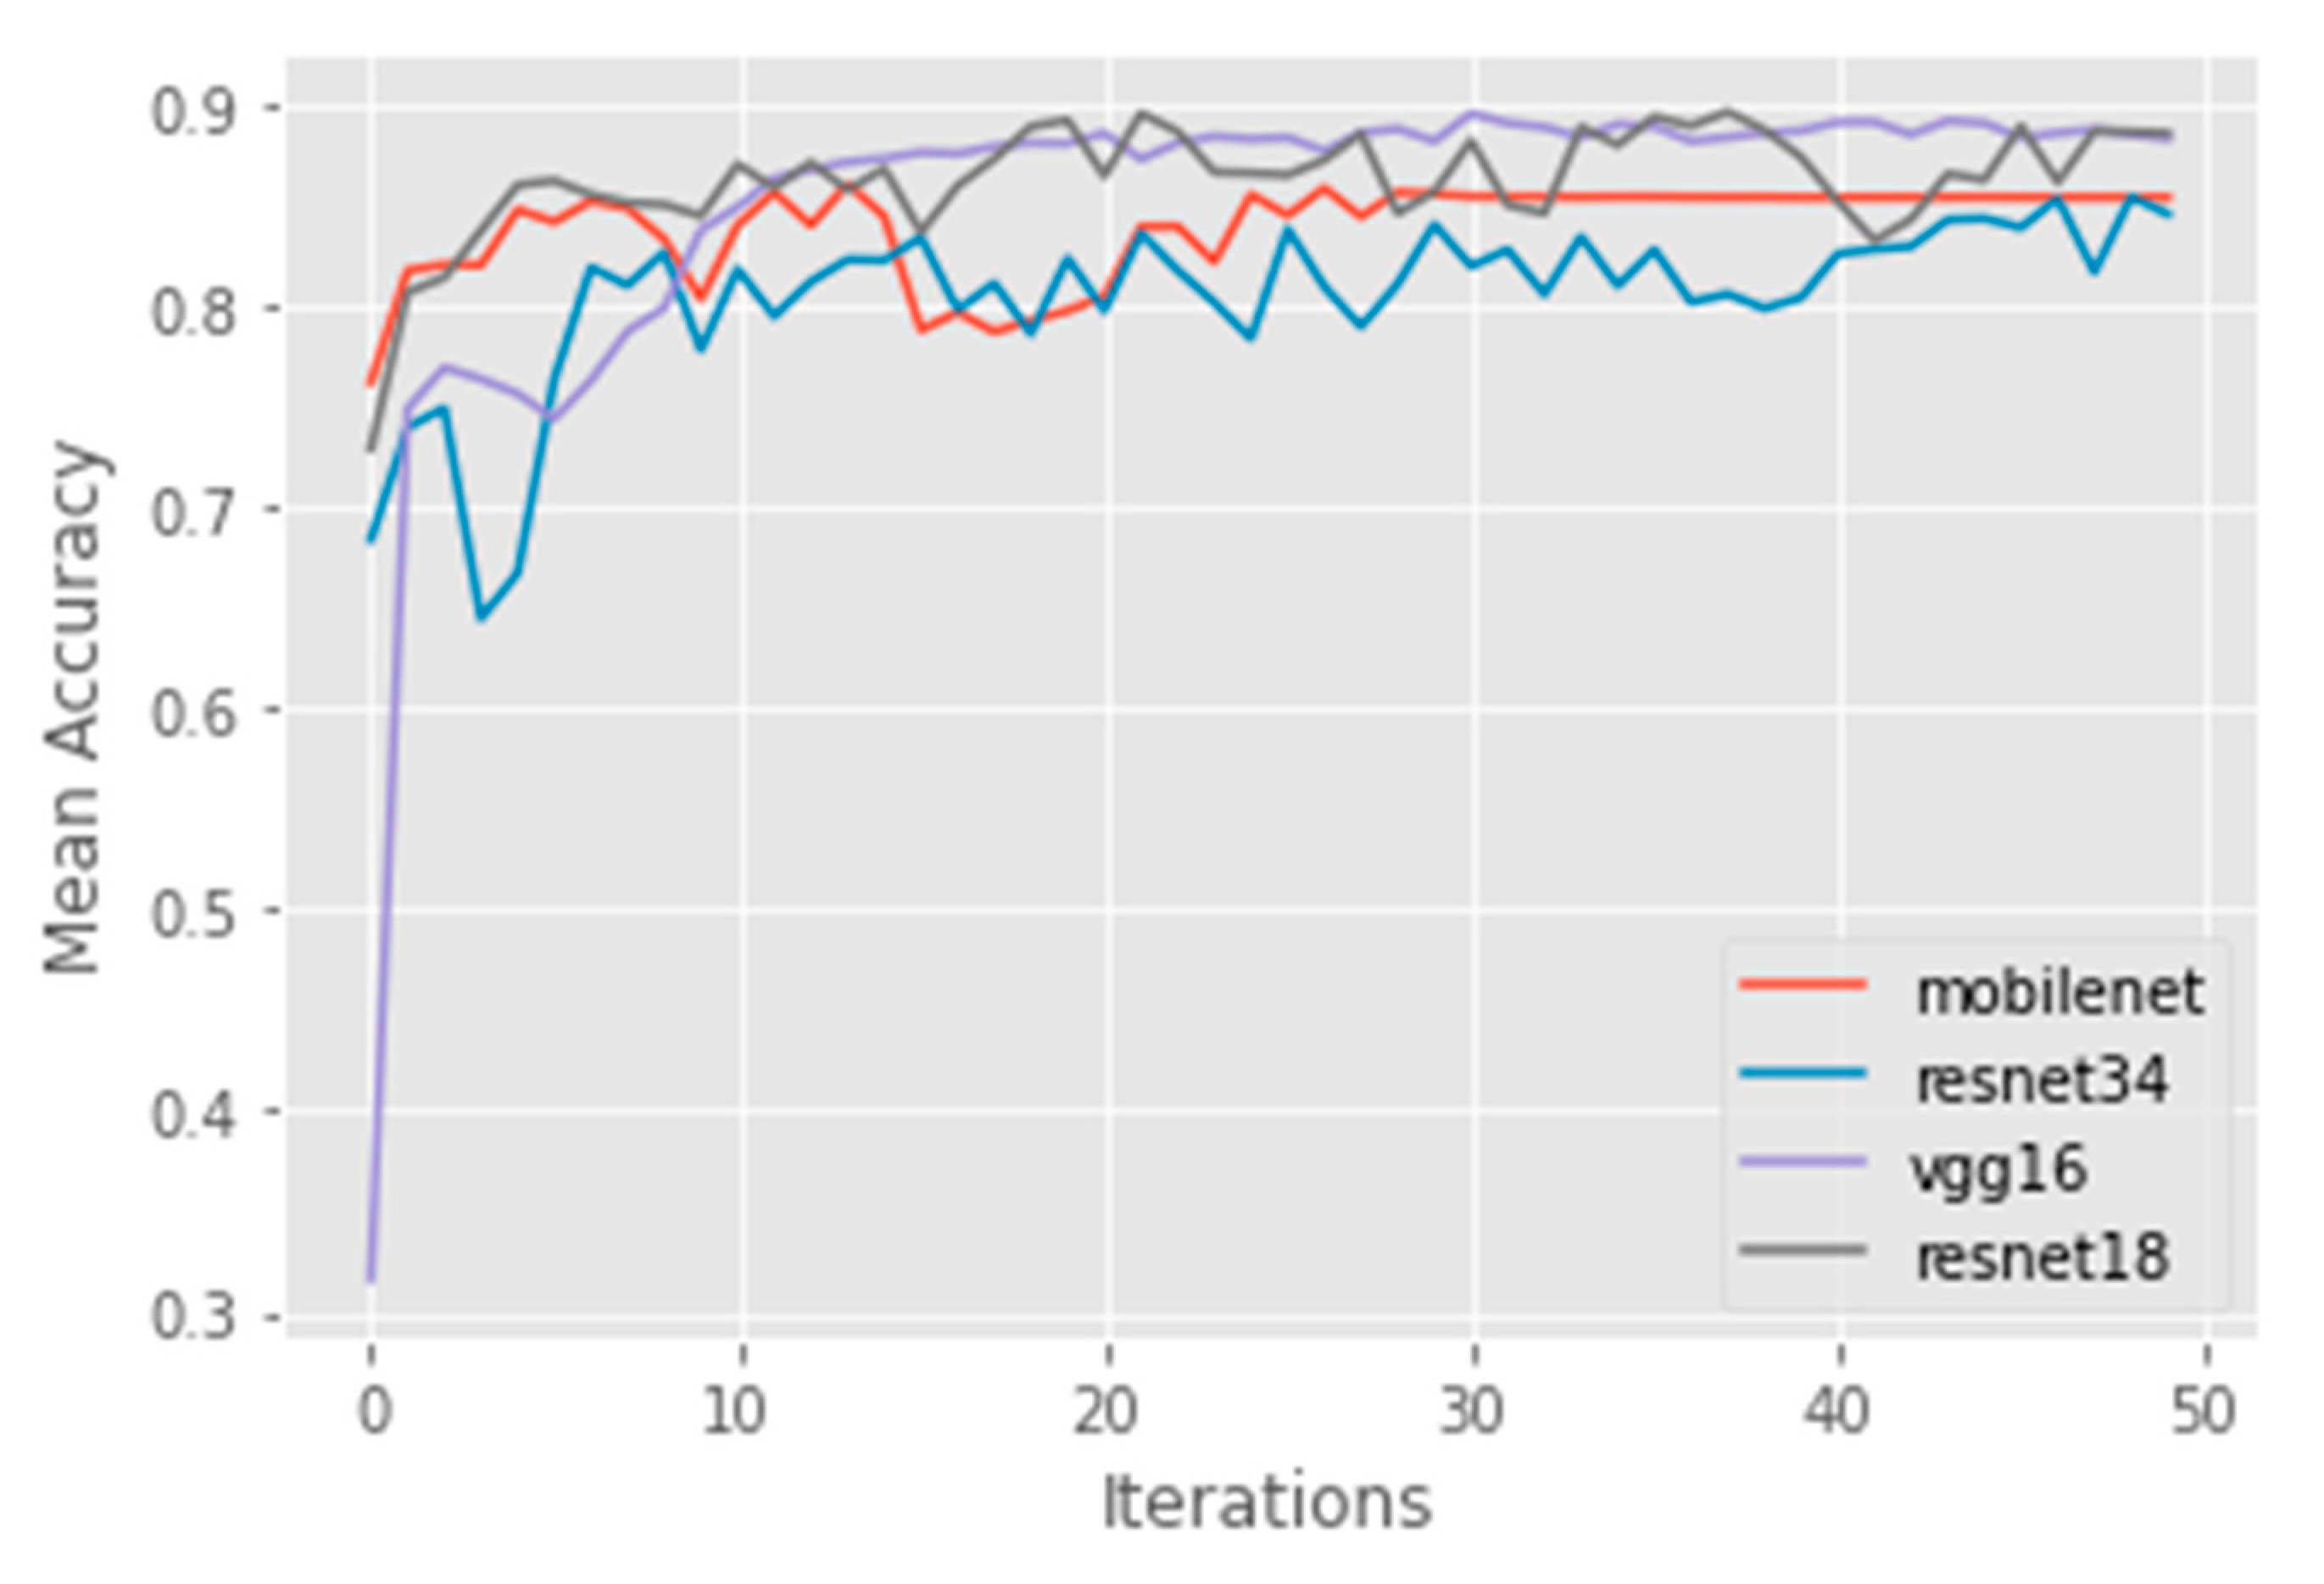
We randomly partitioned our newly established crowdsourced image library of approximately 43,000 images with labels assigned through crowd consensus (or expert review) into datasets for training, validation, and testing, i.e., 60%, 20%, and 20%, respectively. We then proceeded with the testing of a series of deep-learning models, trained on the available training images each month, including VGG16 [31], ResNet18, ResNet34 [32], and MobileNet [33]. At the end of the analysis, the ResNet18 model slightly outperformed all others, although all models performed well after almost 50 iterations (Figure 3). As Supplementary Figure S3 demonstrates, all architectures tested appear to be reasonable choices.
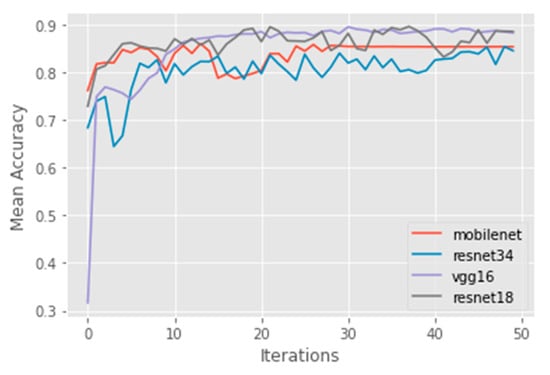
Figure 3.
The validation-set accuracy achieved by the MobileNet, ResNet34, VGG16, and ResNet18 models across 50 iterations, averaged over 5 independent runs.
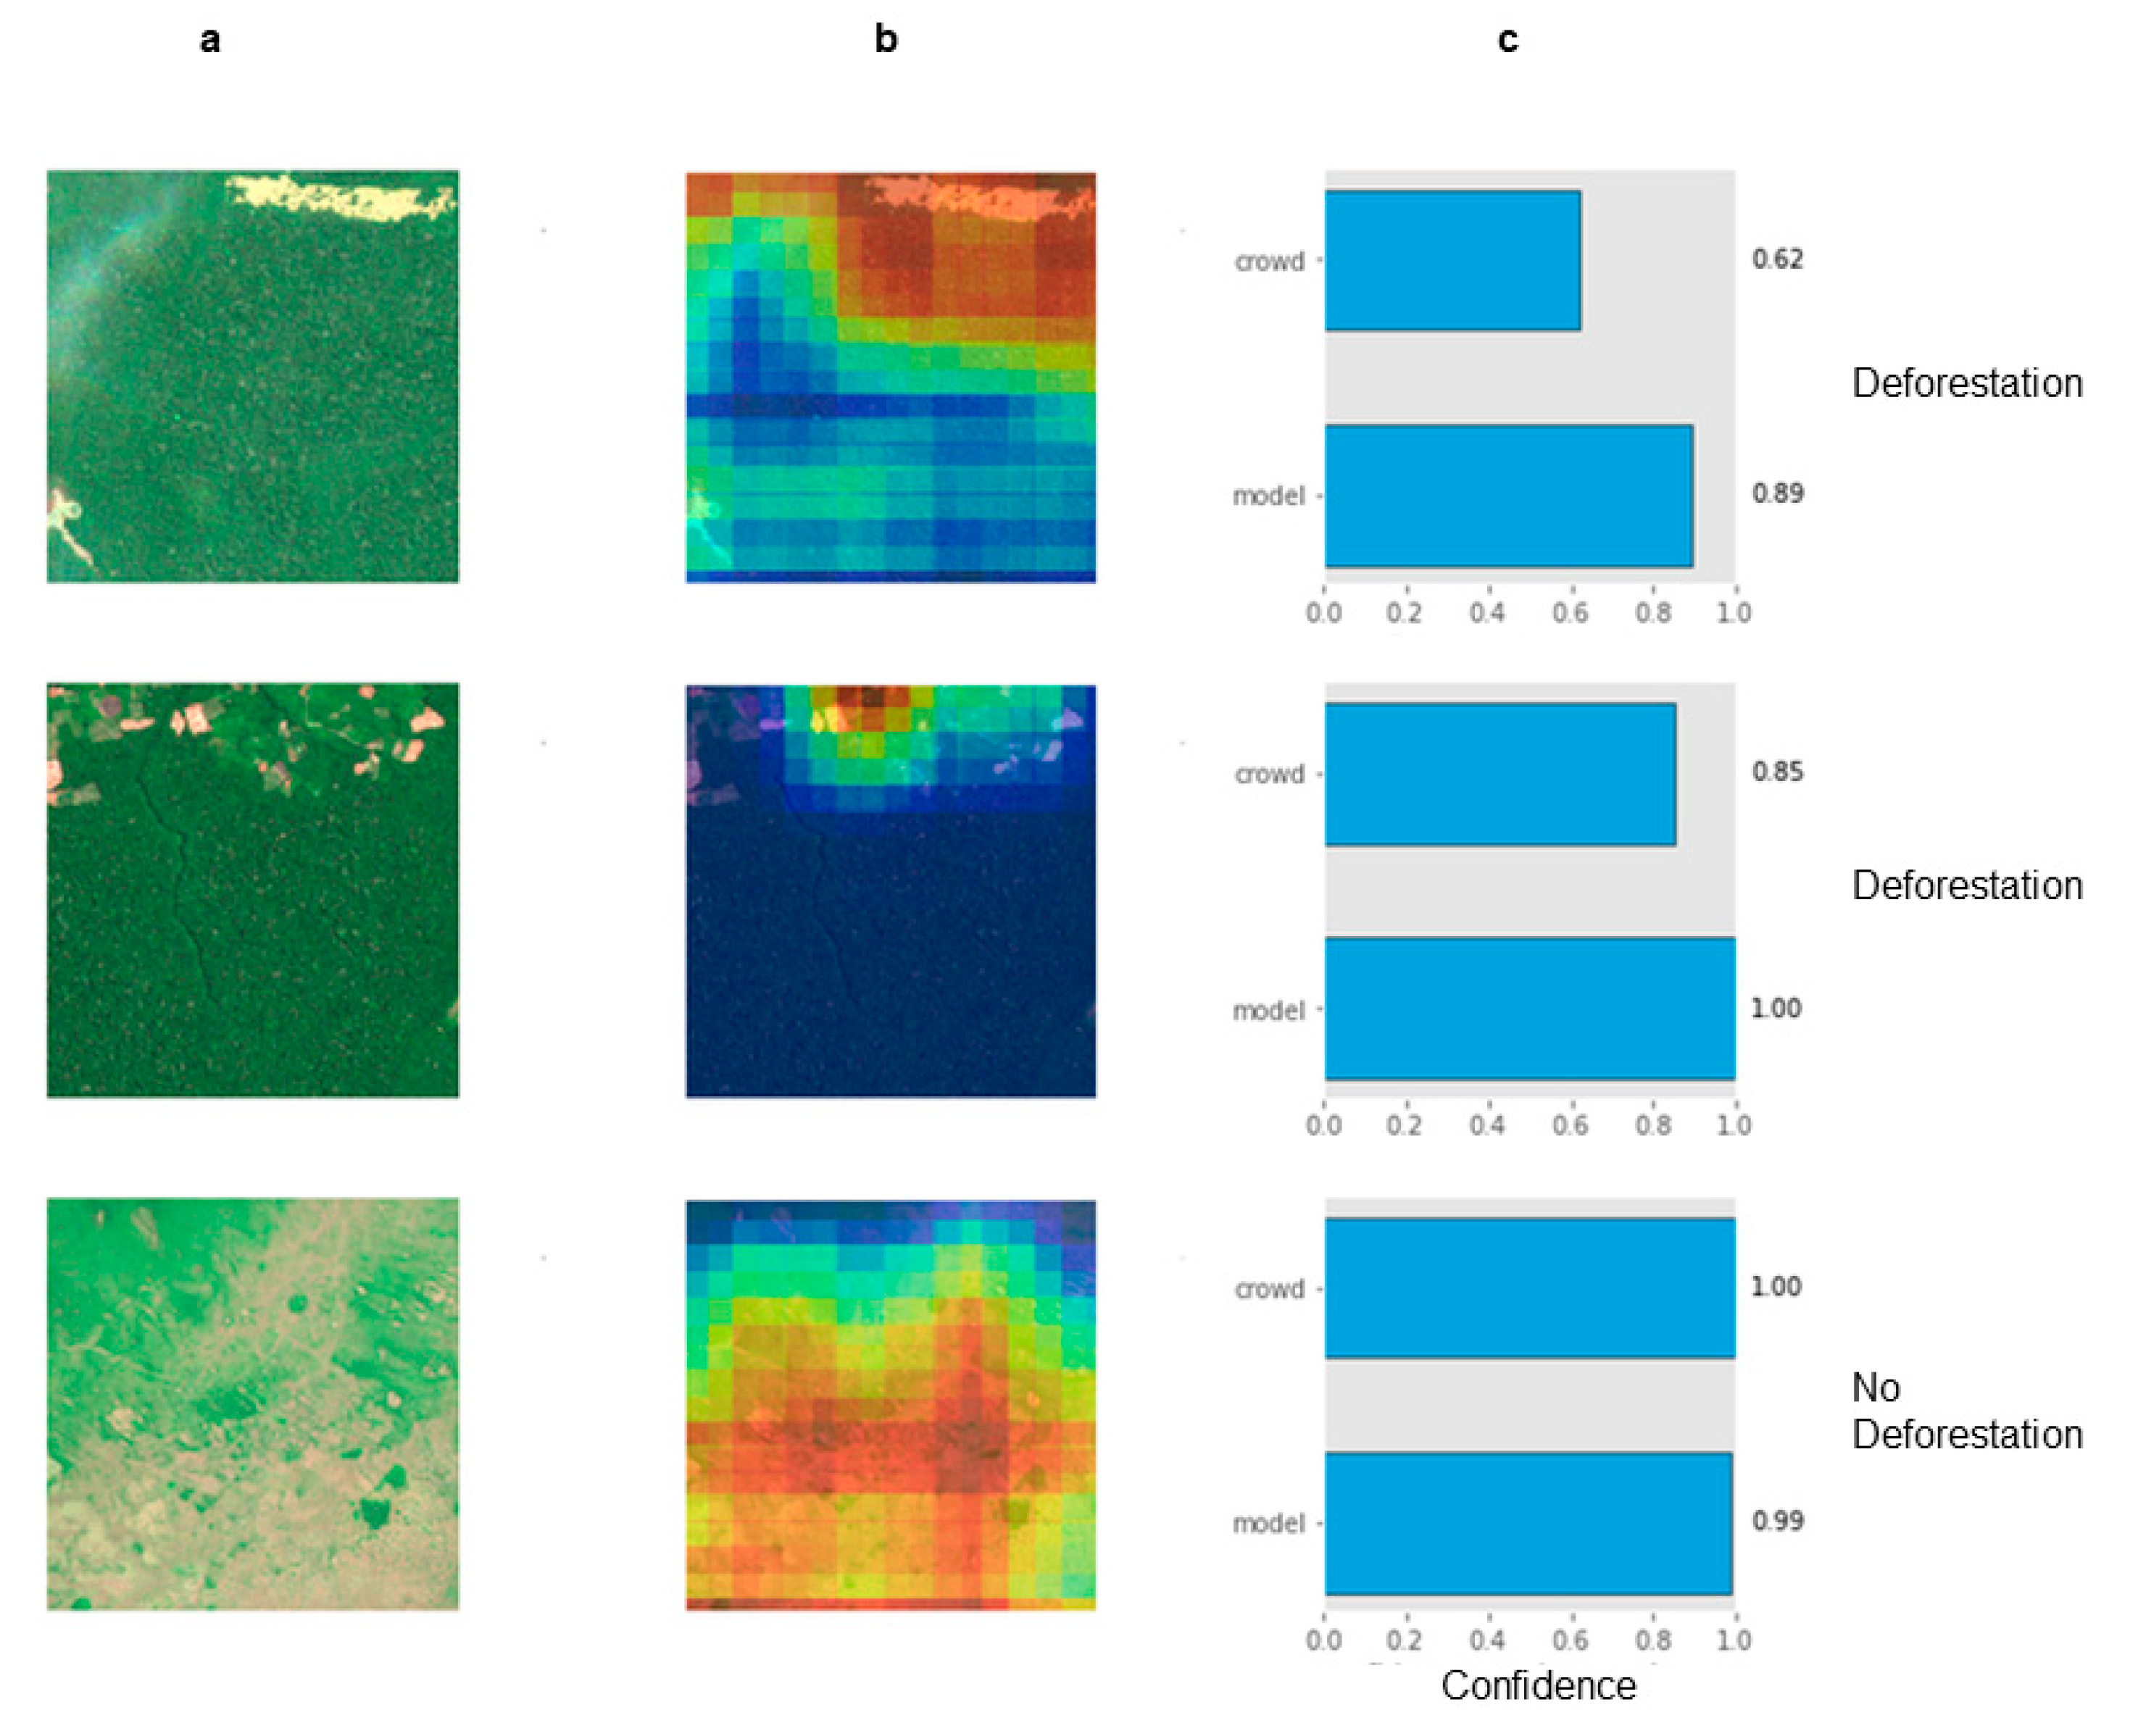
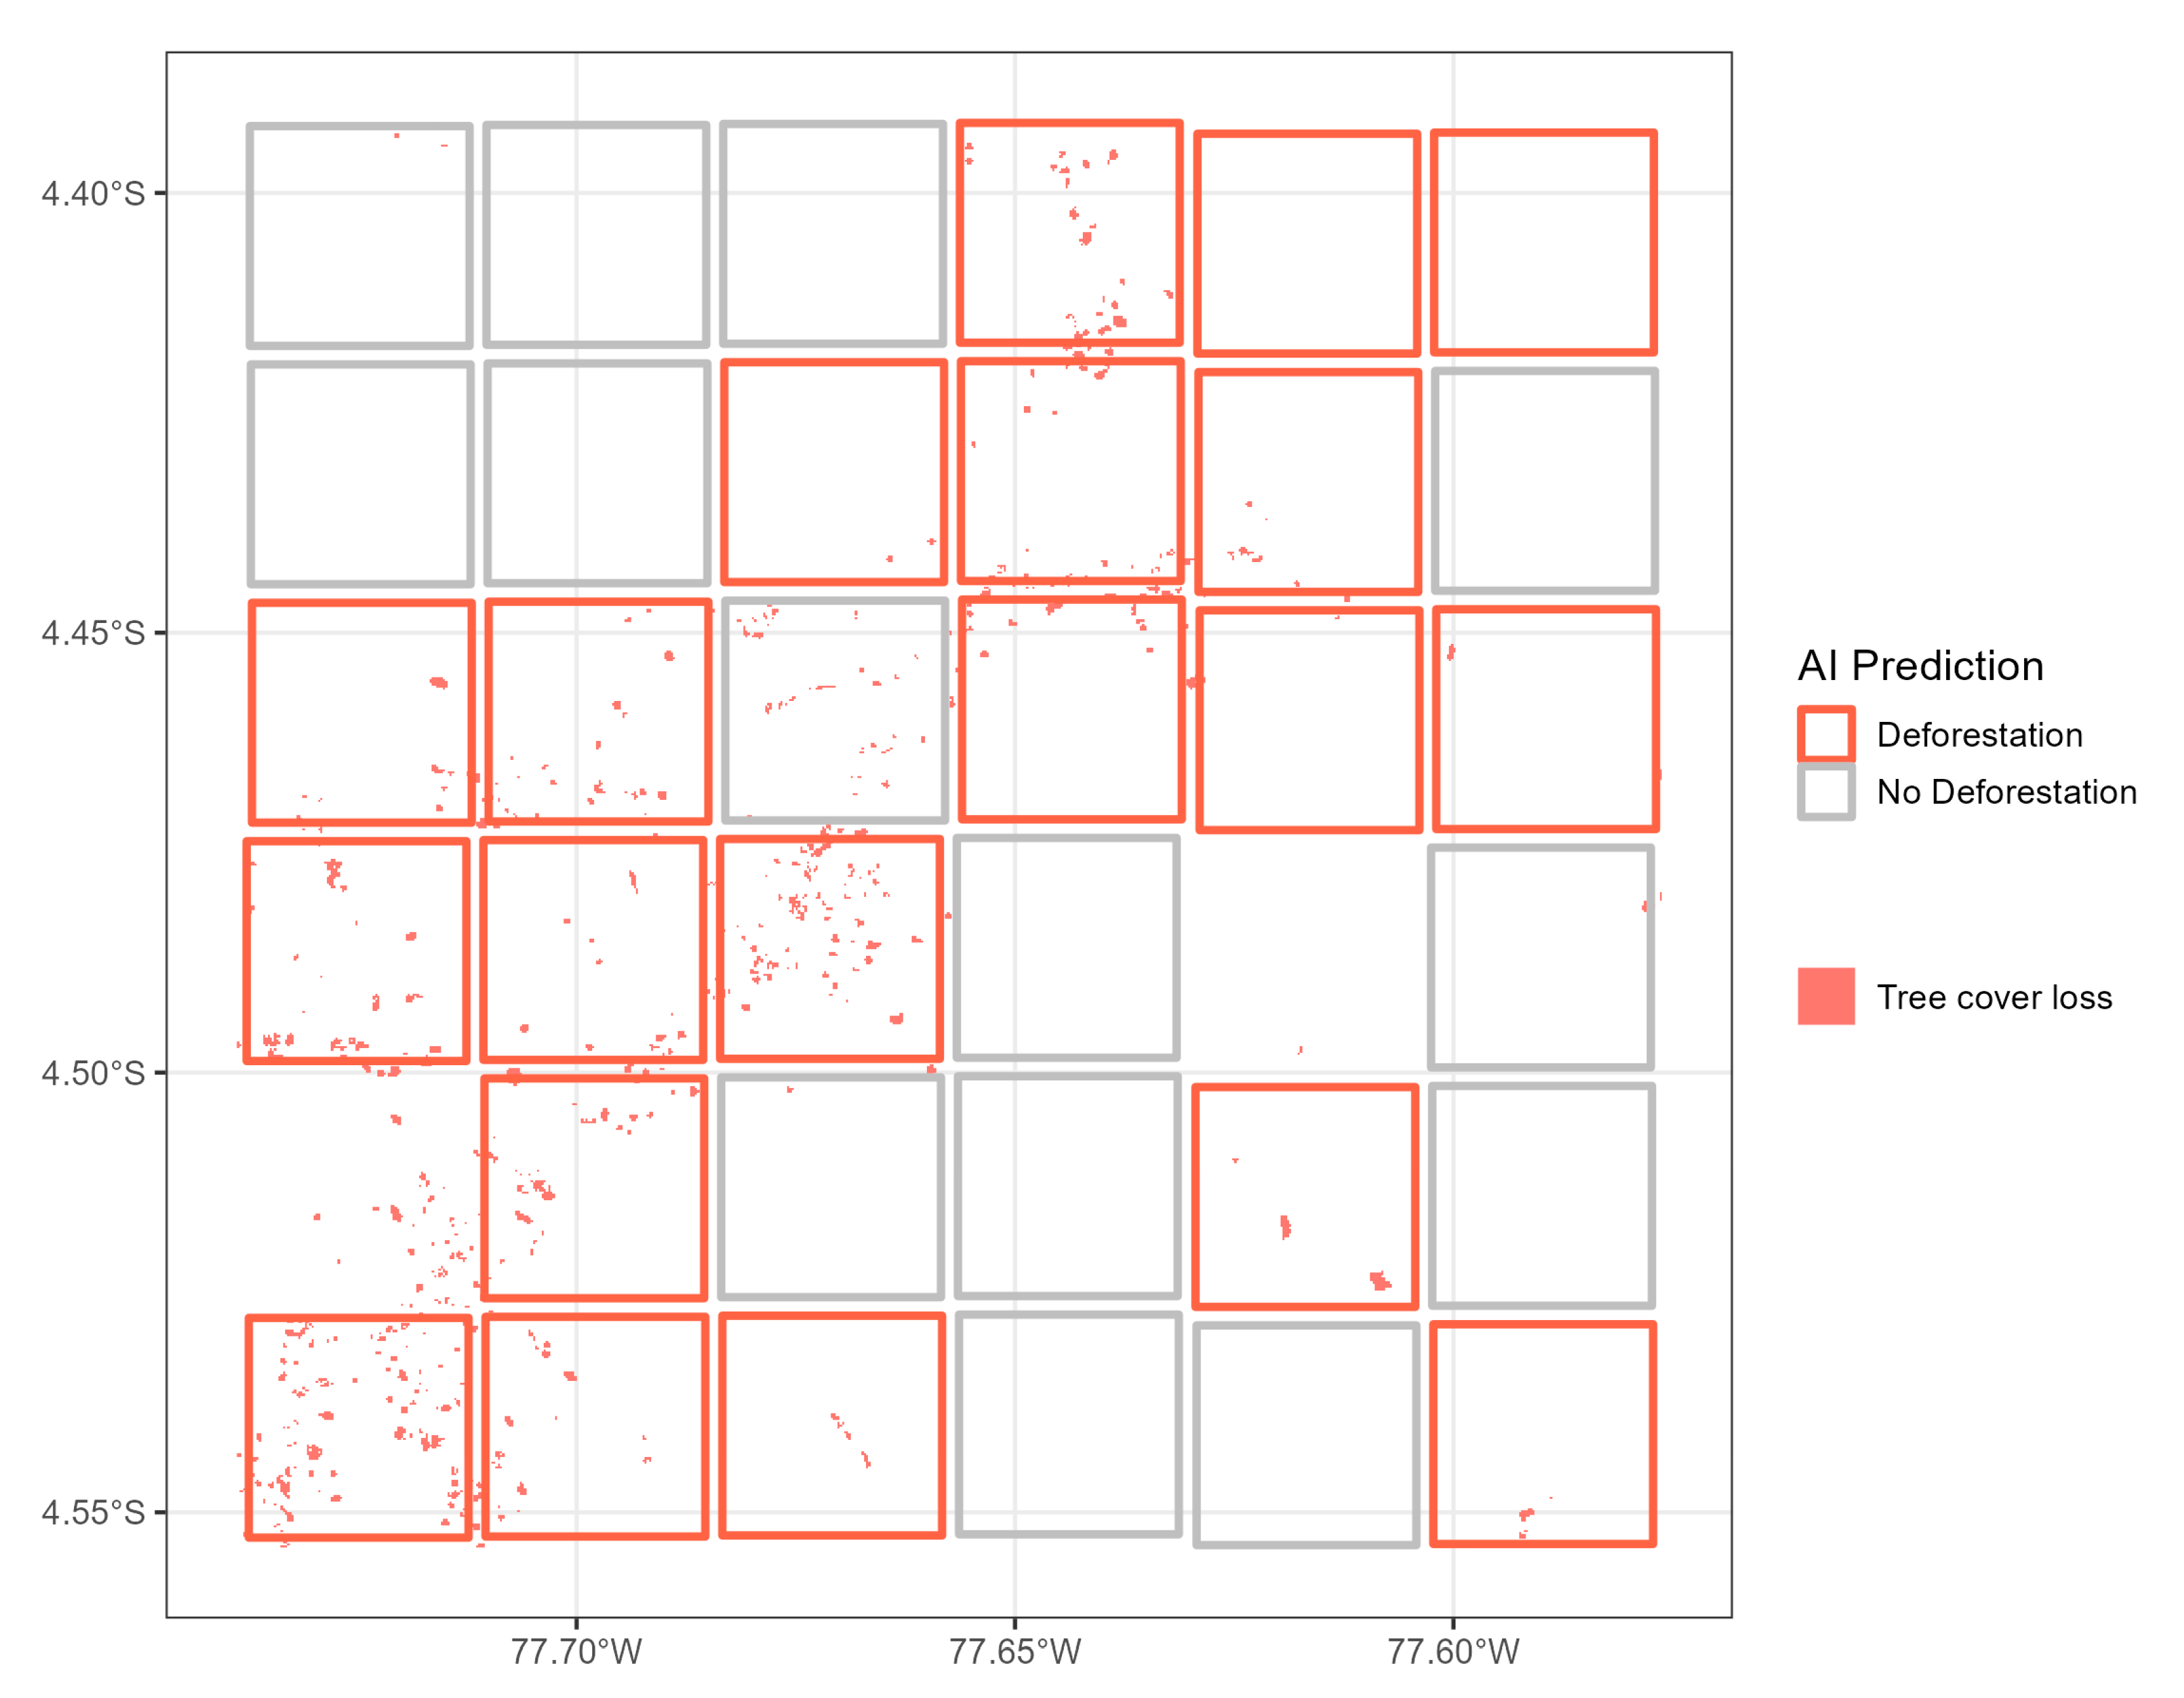
Applying the ResNet18 model to the testing dataset results in the classification of images based on deforestation activity or no deforestation. However, as the classified images are large (3 × 3 km each), and the actual deforestation activity may only occur in a small section of the image, we can use the various activation layers from the deep learning model to pinpoint the actual location in the image that triggered the classification (Methods). Applying this technique results in image heatmaps that identify the areas within each image that most strongly influence the final class (Figure 4).
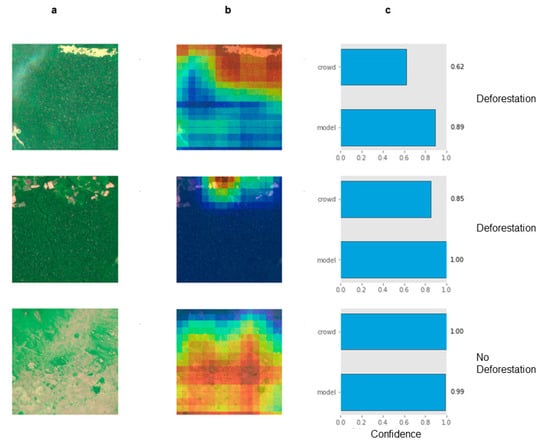
Figure 4.
Examples of deep learning model results for (a) three test dataset images from across the Brazilian Amazon representing signs of deforestation activity and no activity, (b) the occlusion sensitivity of the model showing which part of the image triggered the classifier (warmer colors imply model activation), and (c) the confidence of both the crowd and model in assigning deforestation and no deforestation classes.
Analyzing Figure 4, we are able to visualize the inner workings of the model [35]. This increases the confidence in the model results and demonstrates that even a small canopy disturbance can trigger a reaction in the model. In the top row, we see signs of deforestation in the image that trigger the activation layers, giving the model high confidence that human impact has occurred even though the crowd was less confident when compared to the model’s confidence. In the middle row, signs of human impact at the top of the image trigger the activation layer accordingly, and the model confidently detected human impact, recognizing the rest of the image as having no human impact. The crowd was also more confident that this image showed deforestation. Finally, in the bottom row, both the crowd and the model identified the canopy disturbance as no deforestation with high confidence. Additional examples are provided in Supplementary Figure S4.
3.3. AI Validation
In addition to this qualitative analysis, we measured the model’s performance against multiple sets of images that were distinct from the images used during training. The model’s accuracy was measured against a test set of 8774 images that had been labeled by the crowd but not previously seen by the model, achieving agreement with the crowd on 94.8% of the images. This indicates that the model successfully learned how to mimic the crowd’s classification of these images.
To independently validate our crowd-driven AI model, we analyzed 100 Sentinel-2 satellite images from 2019 unseen by the crowd over the Peruvian Amazon. We then compared these results to the global annual tree cover loss dataset (Figure 5). The overall accuracy of this comparison was 84% (Supplementary Table S5). The results show a strong overlap between the identification of deforestation from the tree cover loss product with the AI model outputs although there were a few examples of omission errors as shown in the center of the figure.
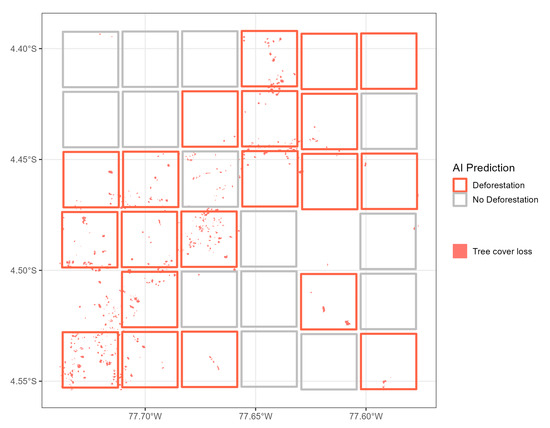
Figure 5.
Validation results of the crowd-driven AI model prediction compared with global annual tree cover loss over the Peruvian Amazon.
4. Discussion
Ensuring the effectiveness of the crowd in this approach is paramount to its success. We implemented several standard approaches to ensure we received the best possible input, and we employed several methods to clean the data ex post. As the participants are public volunteers with no tangible incentive, we relied on their goodwill and enthusiasm. Nonetheless, we offered guidance on the website in terms of what and how to classify the data and relied on random expert comparisons and the agreement of the crowed in order to increase quality, along with various forms of feedback to users and gamification techniques. Applying these techniques led to a crowd accuracy of 88% when compared to expert classifications.
A qualitative analysis of the crowd and AI models indicated that the crowd appeared to perform better in terms of classifying rivers and roads, while the AI models tended to struggle with them. Water, in particular, appears in many colors, in part, owing to the amount of silt in the water. The models also had difficulty with reflections from water bodies in comparison to the crowd. Both issues could be mitigated with more training data, and perhaps, in the case of water, filtering to remove glare or the use of a mask. In terms of detecting human impact, however, the crowd-driven AI models appeared to identify human impact with higher confidence than the crowd.
As we wanted to use the best available free and open satellite data at the time of this study, we opted for the Sentinel-2 dataset (Methods). Owing to the 10 m resolution of these data and the corresponding zoom level necessary to allow for accurate crowdsourcing, the chosen image size for classification was 3 × 3 km. This has the advantage that the images are acceptable for viewing by the crowd (i.e., of reasonable visual quality) and that the crowd is able to classify large areas in a short period of time. However, the disadvantage is that we are less precise about the exact location of any disturbances detected, as the resulting classification applies to the entire 3 × 3 km image. Areas without disturbance are, however, mapped with equal precision as in other methods, although forest degradation might go unnoticed as it is more difficult to spot. Further measures are possible, however, to accommodate this shortcoming in our current approach, including the use of recently available higher resolution Planet data (https://www.planet.com/ (accessed on 1 September 2023)) and the use of overlapping tiles to better isolate disturbances.
Note that our method currently detects any deforestation that is visible (i.e., irrespective of when the disturbance may have occurred), regardless of whether it is already captured in existing databases. We can, however, remove known areas of deforestation from our results using the existing products and, if applied daily to the most recent satellite imagery, could create a complementary crowd-driven AI monitoring system.
While this proof of concept was developed and tested over the Amazon, it could be implemented anywhere that deforestation is occurring. We chose the Amazon initially as this region contains very accurate monitoring programs in order to test and validate our application. The real advantage would be then moving into regions that have much less monitoring effort than in the Brazilian Amazon.
While our crowdsourcing volunteers view images of the rainforest in the visible spectrum, the computer vision models tested here are not restricted to visible wavelengths. In fact, using the near-infrared portion of the spectrum to calculate vegetation indices has been shown to be an effective method for monitoring vegetation presence [36]. Computer vision models that have been trained on images that contain either the near-infrared spectrum or the actual computed indices, such as the Normalized Difference Vegetation Index (NDVI), may be able to more accurately distinguish between natural deforestation, water features, and otherwise disturbed or developed land.
Our tests indicate that the model’s classifications are accurate, but as all models are imperfect approximations, we would like to have an indication of when the model is incorrect. A manual review of random samples is an option, but this is undesirable since the initial motivation for building the model was to reduce the time and manual effort required to identify deforestation. One area to explore is whether image embedding and clustering [37] could be used to flag similar images with disparate classifications. Manual review would still be required, but images would no longer need to be selected at random. Numerous unsupervised and self-supervised approaches to computer vision are also currently under development [38].
An additional area for improvement involves how images are selected for labeling by the crowd and how many times each image should be labeled to optimize the efforts of the crowd. For this study, the images were sampled at random. However, there are multiple strategies for active learning [39] that make it possible to select which images may be most beneficial to model training. These images could then be selected for labeling, potentially reducing the amount of data that must be manually labeled to train or refine an accurate model. We also required each image to be labeled at least six times by the crowd, but we could apply a Bayesian approach that would remove images once a minimum level of confidence in the answers was reached, using, e.g., a method like that developed for binary classification [40].
As our approach is data agnostic, by taking advantage of available high-resolution satellite imagery, we could provide much more detailed spatial information on deforestation and potentially degradation. Our approach presented here could also be used to focus on hotspots, turning to higher-resolution imagery for detailed inspection. Our approach is broadly applicable to other issues that lend themselves to image recognition with satellite imagery, including topics such as migration, food security, natural hazards, and pollution. Finally, the approach presented here could be operationalized, upscaled, and added to existing platforms (e.g., Global Forest Watch) to complement the existing monitoring methods currently in place. Documenting the drivers of deforestation would also be possible by expanding on this approach [41].
5. Conclusions
This study has resulted in a proof-of-concept, crowd-driven, AI approach to deforestation monitoring over the Amazon. The results are highly complementary to existing operational systems that operate autonomously using satellite data and developed and tested algorithms. Going forward, our approach could be established as a validation system complementary to the existing monitoring systems in place, where citizens and deep learning algorithms validate the existing alerts. In particular, our system could address the timeliness of deforestation alerts [42] by focusing the power of the crowd on new alerts as they arise, providing increased confidence and faster turnaround times. The existing systems require on the order of several weeks at a minimum between the initial alert and confirmation [14]. Furthermore, our approach could help to distinguish between deforestation and non-deforestation disturbances and potentially contribute to the identification of the drivers of deforestation [43].
Supplementary Materials
The following supporting information can be downloaded at https://www.mdpi.com/article/10.3390/rs15215204/s1: Figure S1. The crowdsourcing user interface, which prompts users to check any images they deem to contain deforestation in a 3 × 3 window. Unchecked boxes are then assumed to contain no deforestation. Figure S2. Example images with descriptions provided for guidance on the deforestation crowdsourcing platform. Figure S3. The mean training-set accuracy achieved by each model architecture computed over five separate trials. Figure S4. The Receiver Operating Characteristic curve illustrating the change in true-positive and false-positive classifications as the threshold for a positive class label is varied. The optimal threshold of 0.39 as determined using Youden’s Index is marked in black. Figure S5. Examples of deep learning model results for (a) eight test dataset images from across the Brazilian Amazon representing signs of deforestation activity and no activity (including natural breaks in the canopy), (b) the resulting activation layers from the model showing which part of the image triggered the classifier (warmer colors imply model activation), and (c) the resulting confidence of the crowd and model for deforestation or no deforestation. Figure S6. Frequency with which images require more than six votes before being successfully labeled. Frequency is a log scale. Table S1. Spatial accuracy between the crowd and the PRODES deforestation product. Table S2. Spatial accuracy between the crowd and the global annual tree cover loss product. Table S3. Accuracy of the crowd on a random sample of 200 images. Table S4. Accuracy of the ResNet18 model on test images. Table S5. Spatial accuracy of the crowd-driven AI model prediction compared with global annual tree cover loss over the Peruvian Amazon.
Author Contributions
Conceptualization, I.M., I.-S.H., M.d.V. and S.F.; methodology, I.M. and J.W.; software, J.W. and I.M.; visualization, C.M., D.L., S.M. and N.P.; investigation, all authors; data curation, J.W., S.M. and N.P.; writing—original draft preparation, I.M., J.W. and L.S.; writing—review and editing, I.M., J.W., L.S. and G.S. All authors have read and agreed to the published version of the manuscript.
Funding
IIASA’s contribution to this work was partially supported by the Transparent Monitoring Project (GA 20_III_108), funded by the International Climate Initiative (IKI).
Data Availability Statement
Examples of the data generated in this study are publicly available in Zenodo.
Acknowledgments
SAS colleagues acknowledge the SAS Data for Good Program. The authors thank the reviewers for their suggestions and comments.
Conflicts of Interest
The authors declare no conflict of interest.
References
- Giulietti, A.M.; Harley, R.M.; De Queiroz, L.P.; Wanderley, M.D.G.L.; Van Den Berg, C. Biodiversity and Conservation of Plants in Brazil. Conserv. Biol. 2005, 19, 632–639. [Google Scholar] [CrossRef]
- Mackey, B.; DellaSala, D.A.; Kormos, C.; Lindenmayer, D.; Kumpel, N.; Zimmerman, B.; Hugh, S.; Young, V.; Foley, S.; Arsenis, K.; et al. Policy Options for the World’s Primary Forests in Multilateral Environmental Agreements. Conserv. Lett. 2015, 8, 139–147. [Google Scholar] [CrossRef]
- Matricardi, E.A.T.; Skole, D.L.; Costa, O.B.; Pedlowski, M.A.; Samek, J.H.; Miguel, E.P. Long-Term Forest Degradation Surpasses Deforestation in the Brazilian Amazon. Science 2020, 369, 1378. [Google Scholar] [CrossRef]
- Feng, Y.; Zeng, Z.; Searchinger, T.D.; Ziegler, A.D.; Wu, J.; Wang, D.; He, X.; Elsen, P.R.; Ciais, P.; Xu, R.; et al. Doubling of Annual Forest Carbon Loss over the Tropics during the Early Twenty-First Century. Nat. Sustain. 2022, 5, 444–451. [Google Scholar] [CrossRef]
- Foley, J.A.; De Fries, R.; Asner, G.P.; Barford, C.; Bonan, G.; Carpenter, S.R.; Chapin, F.S.; Coe, M.T.; Daily, G.C.; Gibbs, H.K.; et al. Global Consequences of Land Use. Science 2005, 309, 570. [Google Scholar] [CrossRef] [PubMed]
- Watson, J.E.M.; Evans, T.; Venter, O.; Williams, B.; Tulloch, A.; Stewart, C.; Thompson, I.; Ray, J.C.; Murray, K.; Salazar, A.; et al. The Exceptional Value of Intact Forest Ecosystems. Nat. Ecol. Evol. 2018, 2, 599–610. [Google Scholar] [CrossRef]
- Nepstad, D.; Soares-Filho, B.S.; Merry, F.; Lima, A.; Moutinho, P.; Carter, J.; Bowman, M.; Cattaneo, A.; Rodrigues, H.; Schwartzman, S.; et al. The End of Deforestation in the Brazilian Amazon. Science 2009, 326, 1350. [Google Scholar] [CrossRef]
- Silva Junior, C.H.L.; Pessôa, A.C.M.; Carvalho, N.S.; Reis, J.B.C.; Anderson, L.O.; Aragão, L.E.O.C. The Brazilian Amazon Deforestation Rate in 2020 Is the Greatest of the Decade. Nat. Ecol. Evol. 2020, 5, 144–145. [Google Scholar] [CrossRef]
- Barlow, J.; Berenguer, E.; Carmenta, R.; França, F. Clarifying Amazonia’s Burning Crisis. Glob. Chang. Biol. 2020, 26, 319–321. [Google Scholar] [CrossRef]
- FG Assis, L.F.; Ferreira, K.R.; Vinhas, L.; Maurano, L.; Almeida, C.; Carvalho, A.; Rodrigues, J.; Maciel, A.; Camargo, C. TerraBrasilis: A Spatial Data Analytics Infrastructure for Large-Scale Thematic Mapping. ISPRS Int. J. Geo-Inf. 2019, 8, 513. [Google Scholar] [CrossRef]
- Hansen, M.C.; Krylov, A.; Tyukavina, A.; Potapov, P.V.; Turubanova, S.; Zutta, B.; Ifo, S.; Margono, B.; Stolle, F.; Moore, R. Humid Tropical Forest Disturbance Alerts Using Landsat Data. Environ. Res. Lett. 2016, 11, 034008. [Google Scholar] [CrossRef]
- Pickens, A.H.; Hansen, M.C.; Adusei, B.; Potapov, P. Sentinel-2 Forest Loss Alert. Global Land Analysis and Discovery (GLAD), University of Maryland. 2020. Available online: www.globalforestwatch.org (accessed on 19 September 2023).
- Hansen, M.C.; Potapov, P.V.; Moore, R.; Hancher, M.; Turubanova, S.A.; Tyukavina, A.; Thau, D.; Stehman, S.V.; Goetz, S.J.; Loveland, T.R.; et al. High-Resolution Global Maps of 21st-Century Forest Cover Change. Science 2013, 342, 850–853. [Google Scholar] [CrossRef]
- Reiche, J.; Mullissa, A.; Slagter, B.; Gou, Y.; Tsendbazar, N.-E.; Odongo-Braun, C.; Vollrath, A.; Weisse, M.J.; Stolle, F.; Pickens, A.; et al. Forest Disturbance Alerts for the Congo Basin Using Sentinel-1. Environ. Res. Lett. 2021, 16, 024005. [Google Scholar] [CrossRef]
- Moffette, F.; Alix-Garcia, J.; Shea, K.; Pickens, A.H. The Impact of Near-Real-Time Deforestation Alerts across the Tropics. Nat. Clim. Chang. 2021, 11, 172–178. [Google Scholar] [CrossRef]
- Jeff Howe Wired Magazine. 2006. Available online: http://www.wired.com/wired/archive/14.06/crowds.html (accessed on 15 October 2023).
- Lintott, C.J.; Schawinski, K.; Slosar, A.; Land, K.; Bamford, S.; Thomas, D.; Raddick, M.J.; Nichol, R.C.; Szalay, A.; Andreescu, D.; et al. Galaxy Zoo: Morphologies Derived from Visual Inspection of Galaxies from the Sloan Digital Sky Survey. Mon. Not. R. Astron. Soc. 2008, 389, 1179–1189. [Google Scholar] [CrossRef]
- See, L.; Fritz, S.; Perger, C.; Schill, C.; McCallum, I.; Schepaschenko, D.; Duerauer, M.; Sturn, T.; Karner, M.; Kraxner, F.; et al. Harnessing the Power of Volunteers, the Internet and Google Earth to Collect and Validate Global Spatial Information Using Geo-Wiki. Technol. Forecast. Soc. Chang. 2015, 98, 324–335. [Google Scholar] [CrossRef]
- McMillan, R. This Guy Beat Google’s Super-Smart AI—But It Wasn’t Easy; WIRED. 2015. Available online: https://www.wired.com/2015/01/karpathy/ (accessed on 15 October 2023).
- See, L.; Comber, A.; Salk, C.; Fritz, S.; van der Velde, M.; Perger, C.; Schill, C.; McCallum, I.; Kraxner, F.; Obersteiner, M. Comparing the Quality of Crowdsourced Data Contributed by Expert and Non-Experts. PLoS ONE 2013, 8, e69958. [Google Scholar] [CrossRef] [PubMed]
- Hill, S.; Ready-Campbell, N. Expert Stock Picker: The Wisdom of (Experts in) Crowds. Int. J. Electron. Commer. 2011, 15, 73–102. [Google Scholar] [CrossRef]
- Jordan, R.C.; Ballard, H.L.; Phillips, T.B. Key Issues and New Approaches for Evaluating Citizen-Science Learning Outcomes. Front. Ecol. Environ. 2012, 10, 307–309. [Google Scholar] [CrossRef]
- Walker, D.W.; Smigaj, M.; Tani, M. The Benefits and Negative Impacts of Citizen Science Applications to Water as Experienced by Participants and Communities. Wiley Interdiscip. Rev. Water 2021, 8, e1488. [Google Scholar] [CrossRef]
- Krichen, M. Convolutional Neural Networks: A Survey. Computers 2023, 12, 151. [Google Scholar] [CrossRef]
- Russakovsky, O.; Deng, J.; Su, H.; Krause, J.; Satheesh, S.; Ma, S.; Huang, Z.; Karpathy, A.; Khosla, A.; Bernstein, M.; et al. ImageNet Large Scale Visual Recognition Challenge. Int. J. Comput. Vis. 2015, 115, 211–252. [Google Scholar] [CrossRef]
- Krizhevsky, A. Learning Multiple Layers of Features from Tiny Images; Technical Report TR-2009; University of Toronto: Toronto, ON, USA, 2009. [Google Scholar]
- Kaggle Planet: Understanding the Amazon from Space. Available online: https://kaggle.com/c/planet-understanding-the-amazon-from-space (accessed on 12 August 2021).
- ESA. Sentinel-2 User Handbook. European Space Agency, European Commission. 2015. Available online: https://sentinel.esa.int/documents/247904/685211/sentinel-2_user_handbook (accessed on 15 October 2023).
- Ranghetti, L.; Boschetti, M.; Nutini, F.; Busetto, L. “Sen2r”: An R Toolbox for Automatically Downloading and Preprocessing Sentinel-2 Satellite Data. Comput. Geosci. 2020, 139, 104473. [Google Scholar] [CrossRef]
- McHugh, M.L. Interrater Reliability: The Kappa Statistic. Biochem. Med. 2012, 22, 276–282. [Google Scholar] [CrossRef]
- Simonyan, K.; Zisserman, A. Very Deep Convolutional Networks for Large-Scale Image Recognition. arXiv 2014, arXiv:1409.1556. [Google Scholar]
- He, K.; Zhang, X.; Ren, S.; Sun, J. Deep Residual Learning for Image Recognition. In Proceedings of the IEEE Conference on Computer Vision and Pattern Recognition, Boston, MA, USA, 7–12 June 2015. [Google Scholar]
- Sandler, M.; Howard, A.; Zhu, M.; Zhmoginov, A.; Chen, L.-C. MobileNetV2: Inverted Residuals and Linear Bottlenecks. arXiv 2019, arXiv:1801.04381. [Google Scholar]
- Rumelhart, D.E.; Hinton, G.E.; Williams, R.J. Learning Representations by Back-Propagating Errors. Nature 1986, 323, 533–536. [Google Scholar] [CrossRef]
- Zeiler, M.D.; Fergus, R. Visualizing and Understanding Convolutional Networks. In Proceedings of the Computer Vision—ECCV 2014: 13th European Conference, Zurich, Switzerland, 6–12 September 2014. [Google Scholar]
- Huang, S.; Tang, L.; Hupy, J.P.; Wang, Y.; Shao, G. A Commentary Review on the Use of Normalized Difference Vegetation Index (NDVI) in the Era of Popular Remote Sensing. J. For. Res. 2021, 32, 1–6. [Google Scholar] [CrossRef]
- Chicco, D. Siamese Neural Networks: An Overview. In Artificial Neural Networks; Cartwright, H., Ed.; Springer US: New York, NY, USA, 2021; pp. 73–94. ISBN 978-1-07-160826-5. [Google Scholar]
- Ayush, K.; Uzkent, B.; Meng, C.; Tanmay, K.; Burke, M.; Lobell, D.; Ermon, S. Geography-Aware Self-Supervised Learning. arXiv 2020, arXiv:2011.09980. [Google Scholar]
- Ren, P.; Xiao, Y.; Chang, X.; Huang, P.-Y.; Li, Z.; Chen, X.; Wang, X. A Survey of Deep Active Learning. ACM Comput. Surv. 2020, 54, 1–40. [Google Scholar] [CrossRef]
- Salk, C.; Moltchanova, E.; See, L.; Sturn, T.; McCallum, I.; Fritz, S. How Many People Need to Classify the Same Image? A Method for Optimizing Volunteer Contributions in Binary Geographical Classifications. PLoS ONE 2022, 17, e0267114. [Google Scholar] [CrossRef] [PubMed]
- Slagter, B.; Reiche, J.; Marcos, D.; Mullissa, A.; Lossou, E.; Peña-Claros, M.; Herold, M. Monitoring Direct Drivers of Small-Scale Tropical Forest Disturbance in near Real-Time with Sentinel-1 and -2 Data. Remote Sens. Environ. 2023, 295, 113655. [Google Scholar] [CrossRef]
- Bullock, E.L.; Healey, S.P.; Yang, Z.; Houborg, R.; Gorelick, N.; Tang, X.; Andrianirina, C. Timeliness in Forest Change Monitoring: A New Assessment Framework Demonstrated Using Sentinel-1 and a Continuous Change Detection Algorithm. Remote Sens. Environ. 2022, 276, 113043. [Google Scholar] [CrossRef]
- Laso Bayas, J.C.; See, L.; Georgieva, I.; Schepaschenko, D.; Danylo, O.; Dürauer, M.; Bartl, H.; Hofhansl, F.; Zadorozhniuk, R.; Burianchuk, M.; et al. Drivers of Tropical Forest Loss between 2008 and 2019. Sci. Data 2022, 9, 146. [Google Scholar] [CrossRef] [PubMed]
Disclaimer/Publisher’s Note: The statements, opinions and data contained in all publications are solely those of the individual author(s) and contributor(s) and not of MDPI and/or the editor(s). MDPI and/or the editor(s) disclaim responsibility for any injury to people or property resulting from any ideas, methods, instructions or products referred to in the content. |
© 2023 by the authors. Licensee MDPI, Basel, Switzerland. This article is an open access article distributed under the terms and conditions of the Creative Commons Attribution (CC BY) license (https://creativecommons.org/licenses/by/4.0/).

