1. Introduction
The accelerating effects of climate change have brought the global community to a critical period. Understanding and mitigating the impacts have become imperative. Given the frequency of the occurrence of abnormal and/or extreme weather events causing changes in climatic conditions, the need for innovative tools to comprehensively assess, predict, prevent or mitigate climate risks has become increasingly urgent. Adapting to the coming natural hazards and impacts of climate change is impossible without developing a community resiliency strategy, because the threat to all humanity is greater than ever [
1]. At this stage, the use of advanced technologies and approaches based on big data and the emerging Internet of Things offers significant opportunities to enhance resilience and adaptation to the changing climate landscape [
2,
3]. Accessing and analysing big geospatial data are crucial for planning scenarios for the application of climate impacts [
3]. One of the most recent advances is related to developments in cloud computing. This has culminated in the creation of Google Earth Engine (GEE), a free platform that combines big geospatial data and cloud computing [
4,
5].
Operationalising space imagery can be a key lever in addressing the growing challenges of climate change. Harnessing the power of geospatial data and satellite imagery to collect actionable information in real time can dramatically change the status quo and create a new paradigm for combating climate risks. The main obstacle to this is the need for lengthy, time-consuming data preprocessing, the complexity of subsequent modelling, and the lack of availability of the necessary tools and information to a wide range of users. The authors of recent studies [
6,
7,
8,
9,
10,
11] have made significant progress in understanding the multifaceted impacts of climate change and have developed valuable tools for risk assessment. Nevertheless, there is still a need for a more streamlined and accessible approach to address the existing challenges and obstacles in this area.
The authors [
12] note that advances in the application of remote thermal sensing of natural and agricultural surfaces provide insight into possible methods for advancing technologies and capabilities in urban areas. Improvements in the spatial and spectral resolution of current and next-generation satellite sensors, more detailed representations of urban surfaces and the availability of high-resolution thermal imaging scanners will allow for progress in the application of remote sensing data to study the climate of urban areas. In [
13], the impact of urbanisation on the urban heat island effect (UHI), as well as climate change, in Morogoro, Tanzania, was assessed, and there was found an increase in unprotected surfaces from 9 km
2 in 1990 to 82 km
2 in 2015 associated with the UHI and a significant upward trend in the mean annual maximum temperature, indicating the need for effective urban planning and education to mitigate heat stress for residents.
Researchers at the University of Colorado [
14] focused their research on the effects of urbanisation on land surface phenology, examining intra-urban differences in vegetation phenophases by analysing seasonal onset in the city of Roanoke using MODIS, NDVI (normalised difference vegetation index) and in situ observations of temperature and onset found that these differences correspond to different microclimates that could inform plans to increase urban tree crowns or cultivate sites for urban agriculture. The ongoing effects of the UHI in rapidly urbanising cities, exacerbated by global climate change, have increased heat stress for countless urban residents, especially those who are most vulnerable during heat waves. The authors [
15] investigated the SUHI in five study cities in East Africa in different climatic zones in 2003 and 2017. The results showed that differences in climatic conditions and urban development patterns had a significant impact on SUHI changes. They revealed that policy makers and urban planners should consider strategies to mitigate the effects of the UHI, taking into account climatic conditions, projected climate change and urban development patterns, as well as the consequences of the growth of informal settlements.
This has set the stage for the C3IS module. The scientific novelty of this study lies in the development of an innovative approach to analysing climate risk impacts based on the GEE platform through the creation of a new Community Climate Change Impacts Service (C3IS) module. The C3IS toolkit is a synergy of advanced geospatial technologies with user-friendly interfaces. The subsequent practical implementation of this approach could mark a significant step towards building a more sustainable future in the face of an ever-changing climate landscape.
The C3IS module has the potential to revolutionise the operational processing of space imagery, especially in the context of climate risk analysis in urban environments. Our research hypothesis is based on the fact that the integration of the GEE toolkit for climate change impact services will have an impact by optimising the entire process of climate change risk analysis. This optimised approach will provide stakeholders with timely, accurate and useful data, enabling informed decision making in the face of climate-related challenges.
The assessment of the technical and economic benefits of implementing C3IS demonstrates the technical viability of the toolkit, including the functionality, design, capabilities and adaptability to different application scenarios.
3. Description of the Developed C3IS Module
The effectiveness of any geospatial analytical system, especially in the area of climate risk assessment, is highly dependent on the quality, accuracy and completeness of the underlying data. Using remote sensing (RS) and geographic information system (GIS) methods, this study relies on datasets, each of which was selected for its relevance, timeliness and reliability.
The data sources are based on satellite image sets. Platforms such as MODIS [
17] and Landsat [
18] have played an important role in the acquisition of high-resolution multispectral imagery. These datasets, known for their accuracy and wide temporal coverage, enable comprehensive land cover classification and other analyses.
As an indicator of vegetation condition, normalised difference vegetation index (NDVI) has long been used in studies [
19,
20,
21]. However, the enhanced vegetation index (EVI) provides a better tool for detecting changes in vegetation in areas with high biomass content [
22]. A formula including red, blue and near infrared spectra was used to analyse changes in vegetation condition in detail.
The phenomenon of urban heat islands (UHIs), manifested in the form of increased temperatures in urban agglomerations compared to the surrounding rural areas, has been discussed in detail in the literature [
23]. Thermal infrared spectra obtained from Landsat and Sentinel satellites were used to analyse the manifestation of the UHI during daytime hours. The research methodology includes the assessment of surface temperature and its deviation from the temperature indices in rural areas, which ensures the identification of zones with the most pronounced UHI effect.
Geographic Information Systems (GIS) have proven to be an indispensable tool for integrating and coordinating diverse datasets. As highlighted in [
24], the functionality of GIS in spatial analysis is surpassed only by information visualisation. In our study, GIS was used to collate socioeconomic, infrastructure and climate data, providing an integrated view of climate risks.
A critical step when working with remotely sensed data is preprocessing. Satellite images often contain atmospheric interference, geometric distortions and other imperfections [
25]. The use of algorithms such as the dark object subtraction method [
26] and atmospheric correction procedures guaranteed high reliability of the data integrated into the C3IS system. The choice of data sources and processing techniques was made to ensure technical correctness and contextual relevance of the results obtained by C3IS. This facilitated an effective combination of advanced geospatial analyses and practical climate risk management strategies.
C3IS is an integrated module comprising 28 diverse functions designed to process satellite imagery using Google Earth Engine. This provides quick and in-depth insights in three key categories: exposure, hazard and vulnerability. Below is a detailed description of some of these features:
The implementation of the land use cover feature within the GEE environment involves importing satellite image data from sources like Sentinel-2, MODIS and Landsat. By utilising inbuilt classification methods, different land cover types are identified and categorised. Subsequent adjustments to the classification results create an interactive map, delineating various land use categories in the specified region.
The algorithmic procedure for calculating the extended vegetation index (EVI) on the GEE platform utilises JavaScript to extract spectral bands from multispectral satellite data, particularly from the MODIS collection. Employing specified mathematical operations on the spectral bands enables the determination of the EVI for each image pixel, producing a visualisation that allows users to discern between areas of potent vegetative health and those undergoing vegetation degradation.
The mechanism for detecting and visualising daytime urban heat islands (UHIs) with the GEE framework encompasses acquiring thermal infrared band data from Landsat and Sentinel satellite platforms. Subsequent calculations of the ground surface temperatures of urban areas, followed by a comparative analysis with rural area temperatures, assist in identifying UHIs. The visual map produced by the software highlights regions with elevated temperatures, aiding urban planning and the development of mitigation strategies.
The process for classifying macronutrients using GEE involves a meticulous training of a neural network, supported by TensorFlow, on a dataset drawn from agrochemical analysis results. This dataset, which includes critical macronutrients, such as nitrogen, phosphorus, humus, and potassium, establishes correlations with vegetation index data, like NDVI and MSAVI. The integration of machine learning algorithms with geospatial technology facilitates the precise identification and classification of various macronutrients, with TensorFlow ensuring the implementation of an efficient and sophisticated model capable of handling complex datasets and relationships [
27].
Through the assimilation of Sentinel-2 satellite imagery, high-resolution and multispectral data were harnessed, providing a detailed and comprehensive view of the Earth’s surface. This granularity in the data was paramount in enhancing the accuracy and reliability of macronutrient classification. The integration of such rich datasets with advanced neural networks optimised the capability of the system to discern subtle variations and patterns, thereby improving the predictive accuracy of macronutrient levels across varied agricultural landscapes.
Furthermore, the correlation of agrochemical analysis results with vegetation indices such as NDVI and MSAVI contributed to a more holistic understanding of the interaction between soil nutrients and vegetation health. NDVI and MSAVI, being crucial indicators of vegetation vigour and health, provided insights into the responsiveness of different vegetation types to the presence and proportions of specific macronutrients [
28].
The meticulous training of the neural network facilitated the recognition of complex patterns and relationships within the integrated datasets, thereby enabling the system to make informed predictions about macronutrient composition and distribution across diverse terrains. The refinement of the model through iterative training and validation cycles was pivotal in ensuring its robustness and reliability in real-world applications.
4. Results of Practical Implementation of the C3IS Module
A practical application of the Climate Change Information Integrated System (C3IS) to analyse climate parameters for Davidson and Montgomery Counties in Tennessee has demonstrated the potential of the developed module for in-depth investigation of climate change mechanisms. The application of the operational data analysis, intensive visualisation and the integration of heterogeneous datasets provides a detailed view of the available climate risks. Such in-depth analyses, enhanced by empirical evidence, provide stakeholders with the necessary tools to develop strategies aimed at building regional resilience to climate anomalies.
Among the key findings from the use of C3IS are the notable climate changes specific to the counties in question. The visualised data show significant changes in the mean temperature over different time periods. The most pronounced change is seen in the amplitude and frequency of the summer heat waves, as illustrated in
Figure 3.
Figure 3 shows the intensity of summer heat waves for the two districts under consideration. Of particular note is the manifestation of the urban heat island effect (UHI), which is clearly evident in both counties. According to the calculation results, the Montgomery County model found approximately 164 km
2 of area subject to dangerous summer heat waves, with the total area of the City of Clarksville being 247.4 km
2. Meanwhile, Davidson County identified approximately 495 km
2 of such area with the City of Nashville having a total area of 1.362 km
2. Based on these data, it is possible to calculate the percentage of area affected by TRP relative to the total area of each county. For example, for Montgomery County it is 50.81% and for Davidson County it is 51.98%.
The data obtained from this study become a valuable tool for minimising climate risks in the counties under consideration. Awareness of the level of urban heat island (UHI) impacts allows for the development of adaptation and mitigation strategies at the local level. In particular, it may be advisable to review the location of industrial facilities and urban infrastructure in order to optimise their impact on the microclimate. Relocating factories and other potential sources of thermal pollution to less vulnerable and populated areas can reduce the intensity of TRPs and, consequently, reduce climate risks.
In addition, proper planning of urban development and infrastructure can also contribute to reducing heat waves. The rational distribution of green spaces, parks and public gardens, as well as the introduction of green building technologies, such as green roofs and walls, can contribute to reducing urban temperatures.
Increasing urban green spaces and expanding recreational areas can provide additional cooling and improve microclimatic conditions, which in turn reduces climate risks. It also enhances biodiversity, air quality and general well-being.
This effect, due to a combination of anthropogenic activities and local topography, affects not only temperature patterns but also key aspects of the health and energy sectors.
Regarding the wind increase or the direction of heat transport, it can be assumed that TRP is partly shaped by changes in wind direction and intensity, resulting in uneven heat distribution in urban and peri-urban areas. Anthropogenic pressures, including construction, transport and other activities, also contribute to this effect by causing a slowing of air movement and an increase in temperature.
Figure 4a shows the distribution of TRP intensity within Montgomery County. It can be seen that the main heat centres are concentrated in the central and industrial areas of the county.
Figure 4b, illustrating Davidson County, shows that there are similar trends but with some peculiarities in the distribution of heat zones possibly due to the differences in the layout and infrastructure of the two counties.
In order to create predictive models of climate change and analyse the associated climate risks, it is crucial to study the dynamics of urban area assimilation.
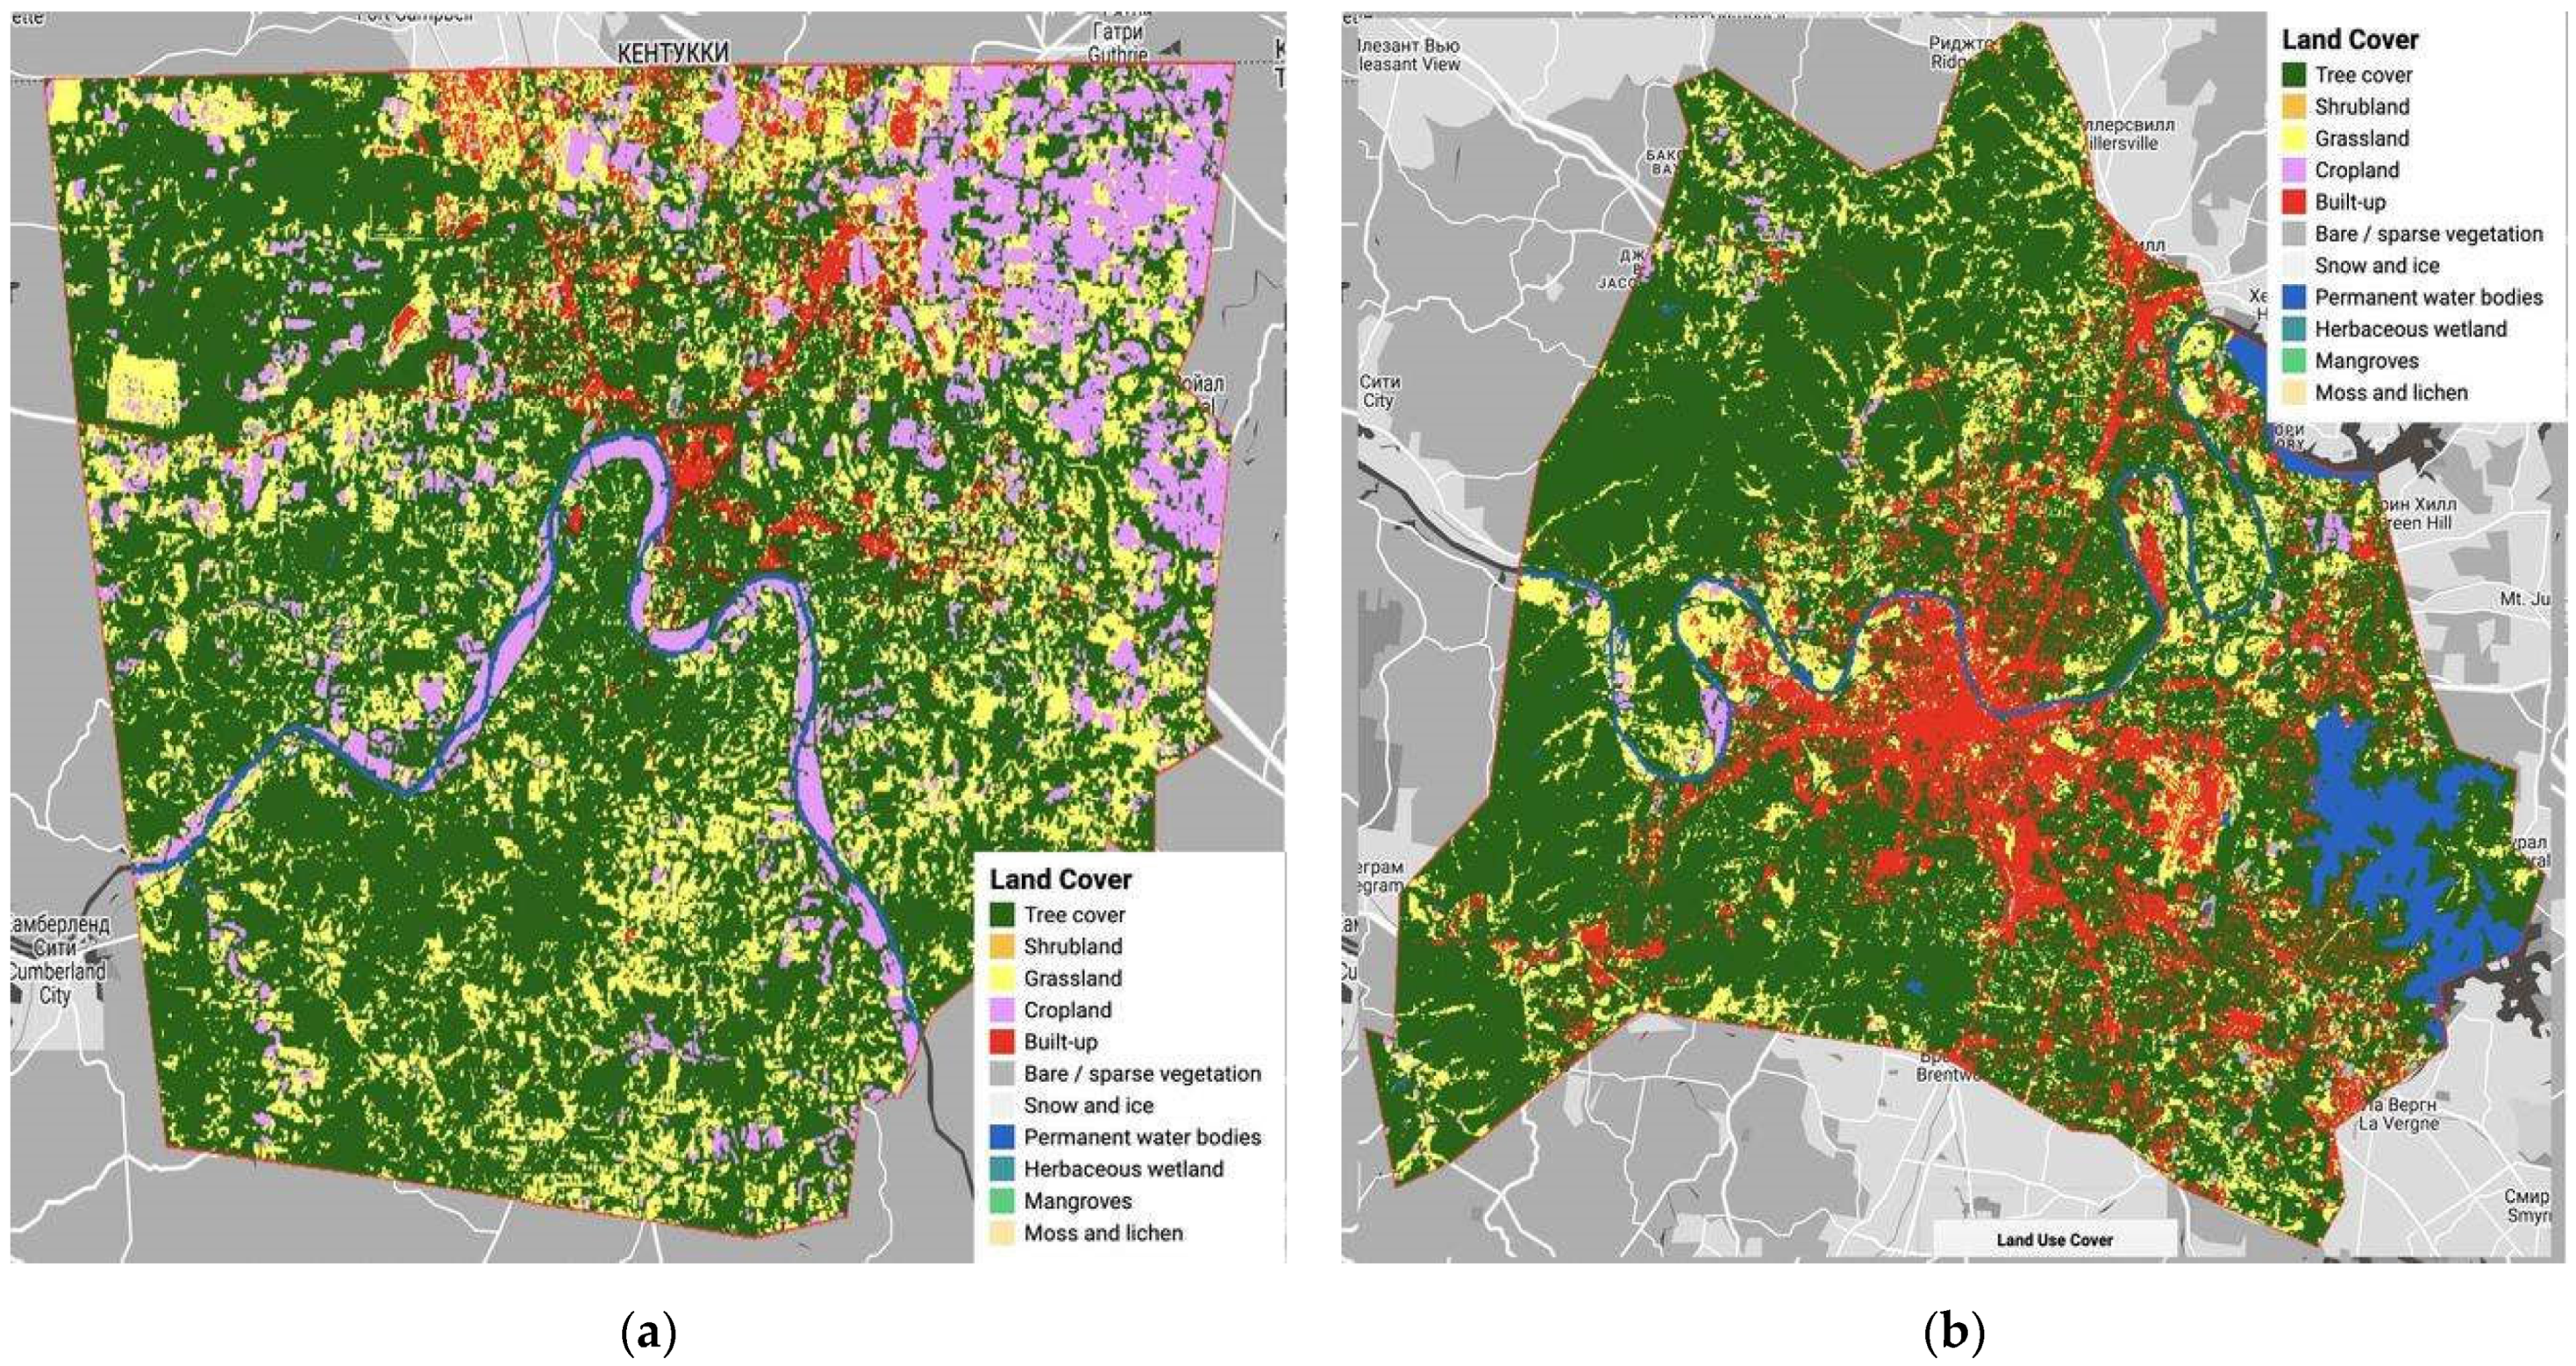
Figure 5 shows the dynamics of urban expansion in the two pilot districts. The different coloured graphic markers highlight the areas of infrastructure development (red) and green spaces (green).
In
Figure 5a, Montgomery County exhibits a characteristic patchwork of urban areas, with each land category having a unique colour or pattern that allows for a detailed look at land use patterns. Similarly, Davidson County (
Figure 5b) is characterised by its own “tapestry” of urban areas, allowing for an in-depth comparative analysis.
After deeply analysing the data for both counties, C3IS revealed an interesting observation: the areas with the most pronounced urban heat island effect, particularly in Davidson County, correlate closely with areas of active infrastructure development and a concurrent decrease in green space. This finding not only demonstrates the analytical capabilities of C3IS but also highlights the importance of sustainable urban planning in the context of climate change.
To create long-term and sustainable climate change adaptation and mitigation strategies, extensive research and data analyses are critical. In this context, we focused on two important factors affecting food in agriculture: climate conditions and soil quality.
The key components of soil quality are macronutrients such as nitrogen, potassium, humus and phosphorus, which are essential for soil health and fertility. The authors [
29] performed spatial predictions of macro- and micronutrient content in soils in subSaharan Africa with a spatial resolution of 250 m and a depth interval of 0–30 cm. Their predictions were made for 15 target nutrients: organic carbon (C) and total (organic) nitrogen (N), total phosphorus (P) and extractable phosphorus (P), potassium (K), calcium (Ca), magnesium (Mg), sulphur (S), sodium (Na), iron (Fe), manganese (Mn), zinc (Zn), copper (Cu), aluminium (Al) and boron (B). The model was trained using soil samples from approximately 59,000 locations (a compilation of soil samples from AfSIS, EthioSIS, One Acre Fund, VitalSigns and legacy soil data) and an extensive stack of remote sensing covariates in addition to elevation, lithology and land cover maps. An ensemble model was then created for each putative from two machine learning algorithms—random forest and gradient boosting, implemented in the R ranger and xgboost packages—and then used it to generate predictions in a fully optimised computational system. Cross-validation showed that, apart from S, P and B, meaningful models could be obtained for most target nutrients (R-squared between 40 and 85%).
Macronutrient classification results performed for Montgomery County using a TensorFlow neural network that was trained and integrated into the C3IS module. The actual average macronutrient content for the county was: humus—3.71, nitrogen—190, potassium—40.23 and phosphorus—7.05. In contrast, the classification module yielded the results: humus—4.06, nitrogen—179.31, potassium—32.48 and phosphorus—4.44.
To accurately quantify the performance of the module, the percentage difference between the actual and classified results was calculated. The discrepancies were approximately 9.43% for humus, 5.63% for nitrogen, 19.32% for potassium and 36.9% for phosphorus. These percentage differences reflect the accuracy of the classification module’s error and are important for assessing its accuracy and reliability when used under real-world conditions.
The technical implementation of this classification involved employing a sophisticated neural network model based on TensorFlow. The model was trained with diverse datasets, incorporating both the agrochemical analysis results and relevant geospatial data. This approach enabled the model to understand and identify complex relationships and patterns within the data, thereby enhancing its predictive accuracy for macronutrient levels across different landscapes.
The results obtained from the classification module, despite minor discrepancies, showcased its potential in accurately identifying and predicting macronutrient levels. Such precision is essential for developing targeted and effective agricultural practices, optimising resource utilisation and, subsequently, reducing the environmental impact. The detailed macronutrient classification provided by the C3IS module assists in formulating customised agricultural strategies, promoting sustainable practices and, ultimately, contributing to mitigating climate risks. Understanding and addressing the variances in macronutrient levels across different geographical regions empower stakeholders to make informed decisions in agricultural planning. By optimising the use of resources and adopting sustainable practices based on accurate macronutrient data, we can enhance agricultural productivity while minimising the adverse environmental impacts, thereby playing a significant role in reducing climate risks.
It should be noted that the technical implementation and results obtained based on macronutrient classification in the C3IS module represent an achievement in the field of precision agriculture. The knowledge gained from this approach contributes to the development of sustainable agriculture, to optimising resource allocation and to the broader goal of reducing climate risks.
To precisely gauge the accuracy of the module, the relative discrepancies between the actual and the classified results were calculated. The differences observed were approximately 3.91% for humus, 8.57% for nitrogen, 1.74% for potassium and 8.8% for phosphorus. These percentage differences are indicative of the error accuracy of the classification module, serving as a crucial metric in evaluating its precision and reliability for practical applications.
We monitor soil health based on remote sensing (RS) data and historical agrochemical analyses. This allows us to classify and assess current soil conditions and predict possible risks associated with macronutrient deficiencies or excesses. To process and analyse the data, we trained a neural network using TensorFlow and convolutional neural networks (CNNs—convolutional neural networks). This allows for more accurate and objective models of land cover and climate conditions in Montgomery and Davidson Counties.
The data provided by C3IS are necessary to study the assimilation of urban areas and to identify the associated climate risks. Particularly notable is the urban heat island effect, which correlates with areas of active infrastructure development and reduced green spaces.
These observations emphasise the importance of sustainable urban planning and the need for adaptation measures to prevent the negative impacts of climate change. In particular, the introduction of green spaces and the optimisation of land use can significantly reduce climate risks and improve conditions for agriculture.
The C3IS system architecture is a multilevel modular design aimed at optimising user experience, processing efficiency and data security.
Figure 6 illustrates the complex structure of the C3IS system, tracing its path from the data collection stage from a few sources to the complex analytical top end.
The user interface layer comes first, providing an intuitive platform for users to interact with the system. An interactive API serves as the primary entry point, allowing users to easily navigate and utilise the extensive capabilities of the platform. An accompanying visualisation panel allows users to immediately visualise the results, making data interpretation simple and clear.
Taking a deeper look, the processing layer acts as the driving force behind the system. Here, the Google Earth Engine’s integration module acquires the necessary geospatial data and images and passes them to the real-time processing module. The 28 different system functions in the Functions module then process these data, analysing and interpreting it according to the user’s request.
The data layer underpins the entire system and includes both external GEE databases and internal databases unique to C3IS.
The output and reporting layer converts all this processed information into tangible, actionable outputs. Users can not only visualise the results in real time but also export the processed layer in .tiff format, for a more detailed analysis.
The entire architecture demonstrates the system’s commitment to provide a holistic, efficient and user-friendly solution to climate change problems.
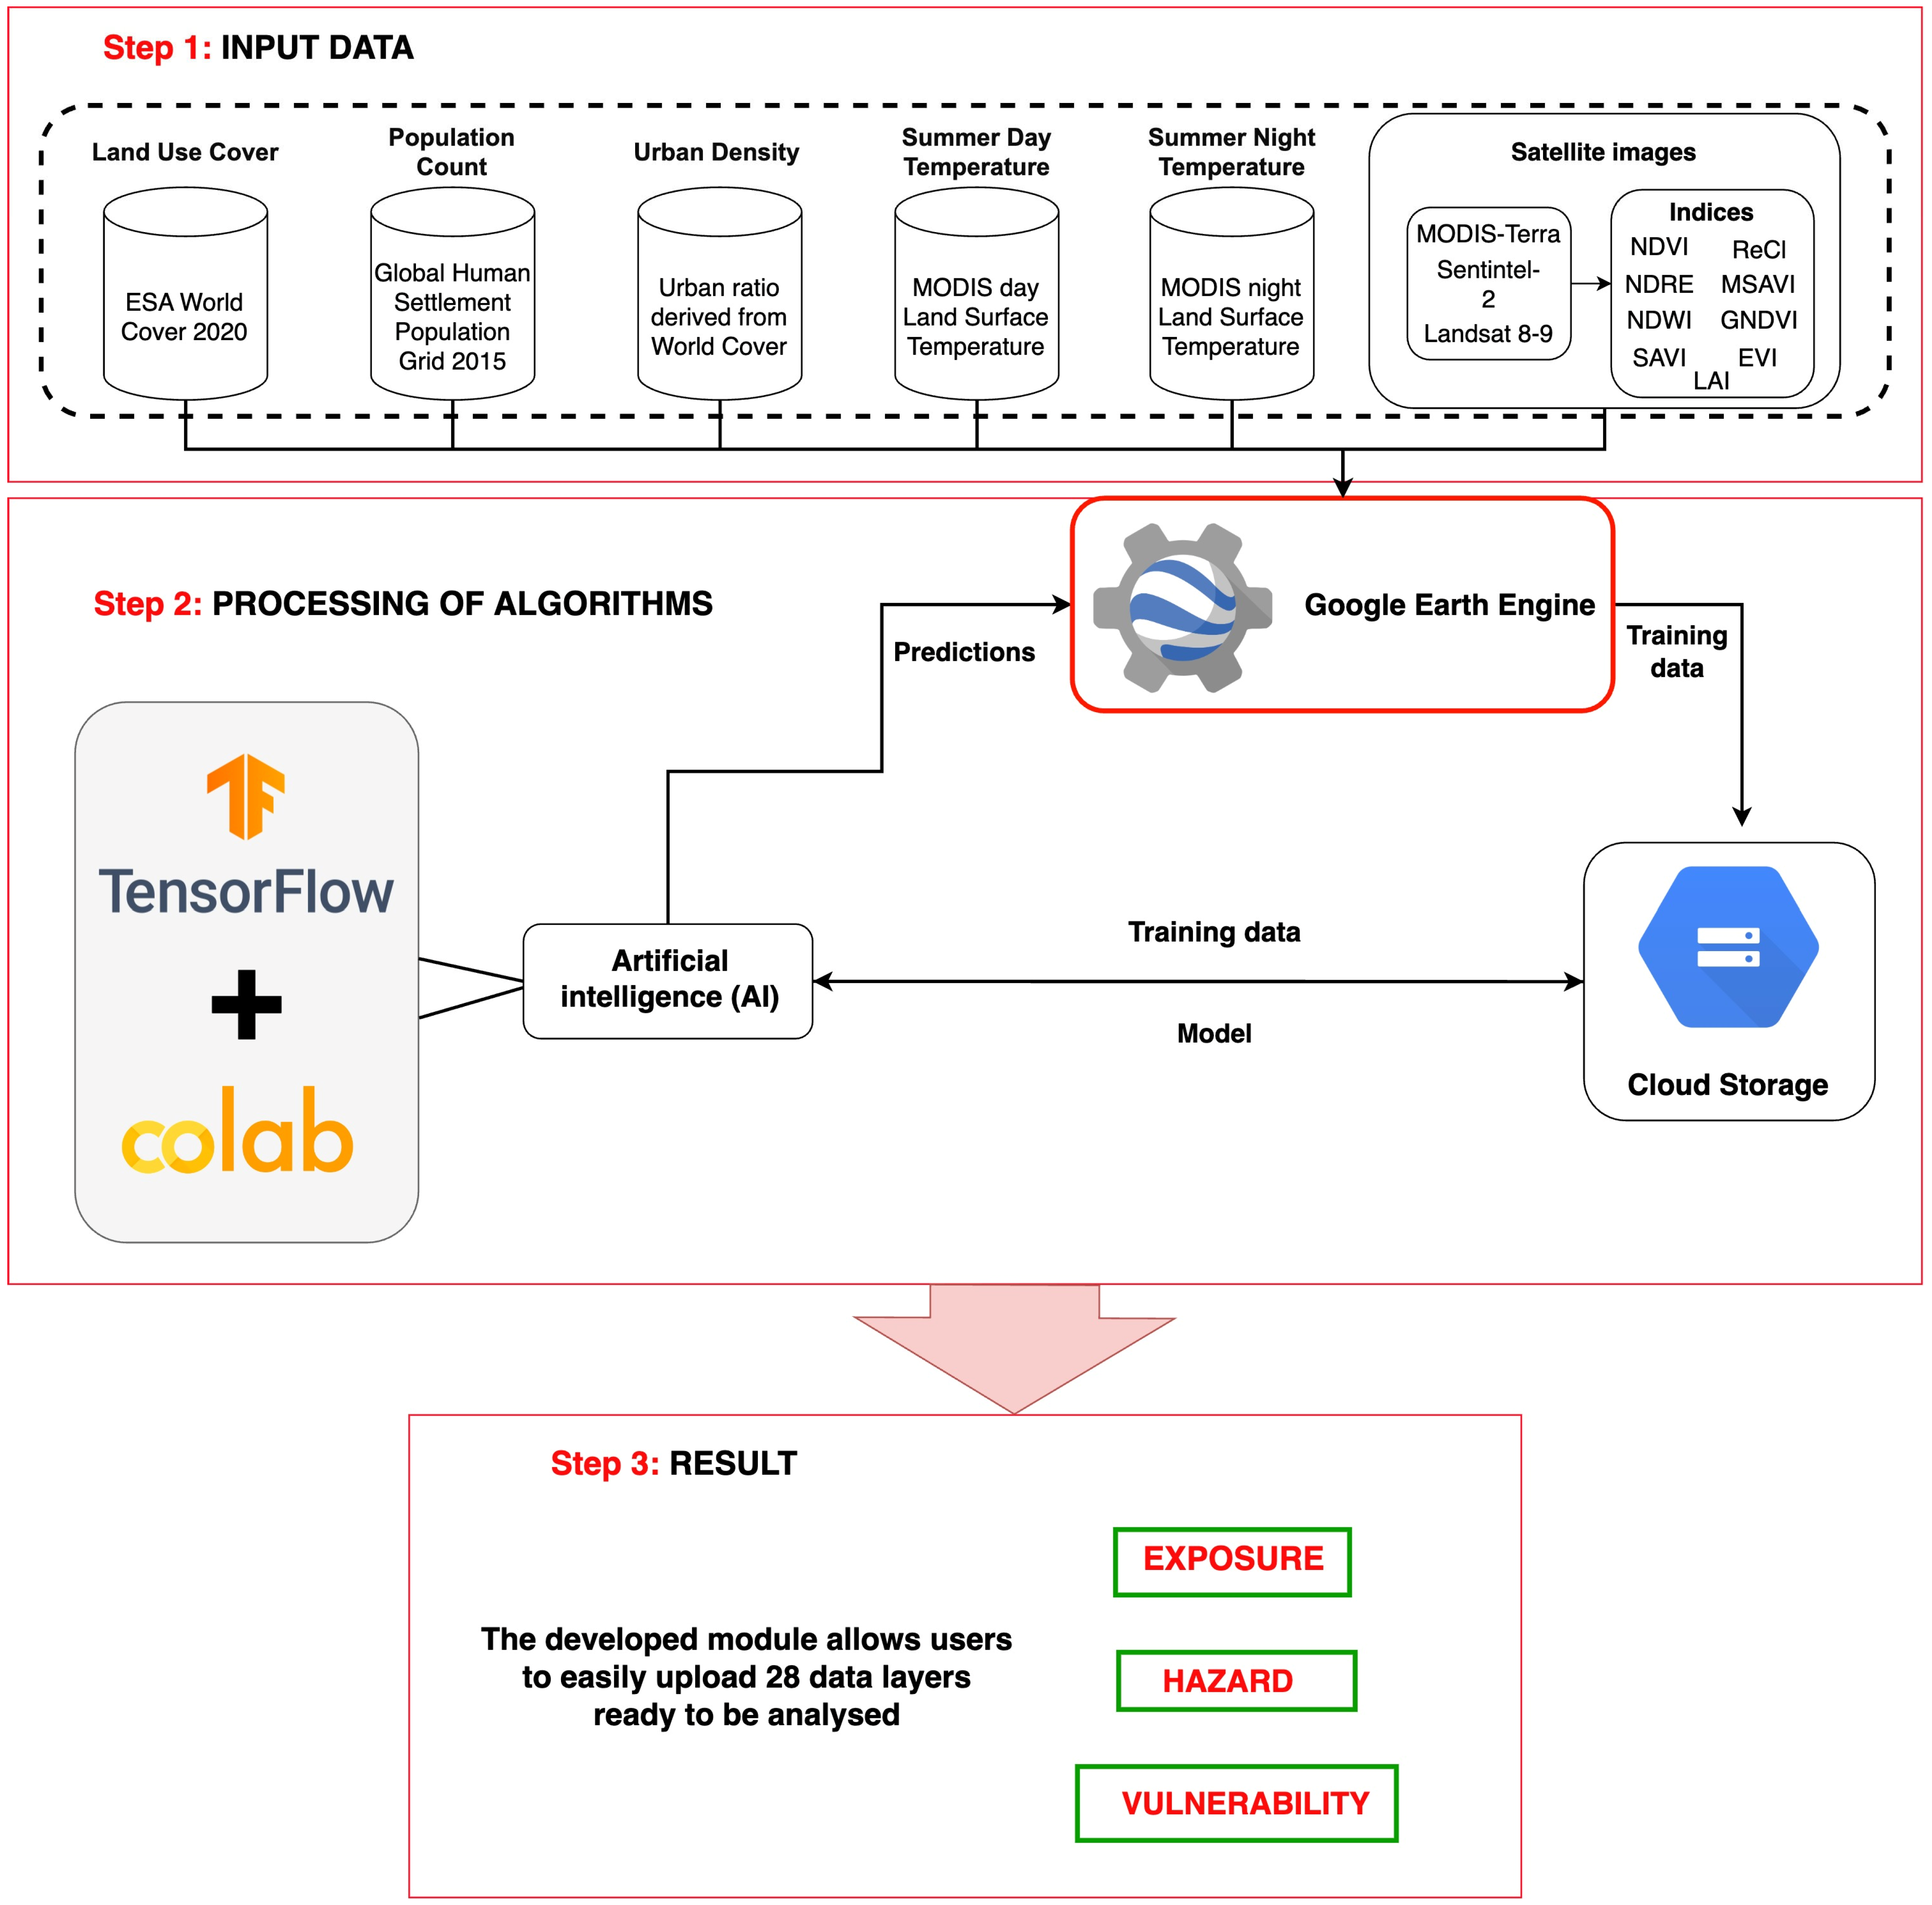
Figure 7 shows the developed architecture of the C3IS module, from the initial phase of raw data collection to the culminating phase of interactive presentation of climate risk indicators. The entire methodology, designed with accuracy, efficiency and accessibility in mind, aims to produce practical outputs that support informed climate-smart decision making.
The outline diagram presented in
Figure 7 illustrates the complex methodology underlying the Climate Change Impacts Inquiry Service (C3IS) toolkit. Structurally, the methodology is based on three main stages, each with its own functions and subtleties, which are revealed as follows:
Baseline data collection: This is the basic stage where multiple datasets, each with unique spatial, temporal and thematic resolution, are seamlessly fed into the C3IS system. These include:
The ESA World Cover 2020 integrated dataset, which contains a detailed land cover classification on a global scale for the year 2020, produced by the European Space Agency. It traces the dynamics of vegetation, water bodies, man-made surfaces and other notable elements of the Earth’s surface;
The Global Human Settlement Population Grid 2015 dataset provides detailed information on population distribution in a grid format to assess the human impact on the environment and understand vulnerability to climate change. An interpretable metric extrapolated from ESA World Cover 2020 data that provides a representation of urbanised areas in relation to total land cover, providing insight into urban sprawl and its impacts;
The MODIS LST Land Surface Temperature includes both daytime and night-time LST datasets. They provide crucial information on land surface temperature. Such data are important for assessing phenomena, for example, the urban heat island effect, which is of great importance for urban climatology. The cloud repository receives datasets from the MODIS, Sentinel and Landsat satellites. Each of these satellite systems provides different spectral, spatial and temporal resolutions, allowing the toolset to reflect multiple terrestrial processes and dynamics.
In step 2, once the data are acquired, the extensive datasets are subjected to complex algorithmic processing. The C3IS toolbox, consisting of 28 specialised functions, undertakes the mission of decoding, analysing and synthesising the incoming data. These functions use complex algorithms to integrate, analyse and extract nuances from incoming data. This computational juggernaut ensures that the disparate datasets are harmonised, analysed and prepared for the next stage.
In step 3, after collecting and processing the diverse datasets, the C3IS methodology results in a robust, trained system. This module, enriched with data and patterns, is now ready to serve stakeholders by helping them make sense of climate change impacts and their multifaceted implications.
6. Conclusions and Future Research
The development of the Climate Change Impacts Service (C3IS) suite of tools on the Google Earth Engine (GEE) platform represents a significant step forward in analysing climate risks, especially in urban environments. By providing real-time processing of Sentinel-2 satellite imagery through 28 different functions, C3IS enables users to quickly assess various climate parameters. The results are dynamically visualised on a GEE substrate, increasing accessibility and usability for stakeholders. In addition, the ability to export processed layers for in-depth analyses makes C3IS a versatile tool for complex image studies. The potential applications of this system cover a wide spectrum including climate resilience planning, disaster management and environmental monitoring.
This paper illustrates the enormous potential inherent in C3IS and highlights its innovative approach to climate risk assessment. Given the growing impacts of climate change, tools such as C3IS play an indispensable role in facilitating informed decision making and proactive development of adaptation strategies. As C3IS continues to be explored and applied in a variety of geographic contexts, it promises to make a significant contribution to building a more resilient and sustainable future in the face of climate-related challenges.
Google Earth Engine’s Google Earth Toolkit for Community Climate Impacts Services (C3IS) represents a major breakthrough in climate risk analysis, offering a simplified and accessible approach to studying climate hazards in urban settings. By fully integrating with the powerful Google Earth Engine platform, the toolkit effectively addresses the challenges associated with data preprocessing, modelling and storage, thereby allowing researchers and practitioners to focus on producing meaningful results.
The C3IS toolkit methodology leverages the extensive catalogue of geospatial data and parallel processing capabilities in GEE to facilitate real-time climate risk analysis. Its user-friendly interface will suit a wide range of users, from experienced scientists to policy makers and urban planners. By facilitating the exploration of vulnerabilities and impacts of climate change, the toolkit promotes informed decision making and the formulation of effective adaptation strategies.
Moreover, success stories and case studies based on the use of the C3IS toolkit highlight its transformative potential. From identifying heat-prone areas to developing flood preparedness measures, the toolkit’s contributions go beyond academic research to actively improve the preparedness and adaptive capacity of society.
As the global community continues to grapple with the multifaceted challenges of climate change, the C3IS toolkit acts as a beacon of innovation and collaboration. Its methodology informs the development of future climate resilience tools, emphasising the importance of using cloud-based platforms, satellite imagery and user-centred design principles. In conclusion, the C3IS toolkit not only empowers researchers but also contributes to the collective desire to build resilience and protect communities in an ever-changing climate landscape.
Future research includes integrating C3IS with digital twin models to localise and simulate climate change impacts using highly detailed 3D geospatial models, building information models (BIMs) and various levels of modelling, including prediction of exceedances and associated epidemiological health effects.

 ,
, 


