Article

Automated Method for SLAM Evaluation in GNSS-Denied Areas

by
Dominik Merkle
1,2,* and
Alexander Reiterer
1,2
1
Department of Sustainable Systems Engineering-INATECH, University of Freiburg, 79110 Freiburg, Germany
2
Fraunhofer Institute for Physical Measurement Techniques IPM, 79110 Freiburg, Germany
*
Author to whom correspondence should be addressed.
Remote Sens. 2023, 15(21), 5141; https://doi.org/10.3390/rs15215141
Submission received: 24 September 2023 / Revised: 17 October 2023 / Accepted: 24 October 2023 / Published: 27 October 2023

Abstract

:
The automated inspection and mapping of engineering structures are mainly based on photogrammetry and laser scanning. Mobile robotic platforms like unmanned aerial vehicles (UAVs) and unmanned ground vehicles (UGVs), but also handheld platforms, allow efficient automated mapping. Engineering structures like bridges shadow global navigation satellite system (GNSS), which complicates precise localization. Simultaneous localization and mapping (SLAM) algorithms offer a sufficient solution, since they do not require GNSS. However, testing and comparing SLAM algorithms in GNSS-denied areas is difficult due to missing ground truth data. This work presents an approach to measuring the performance of SLAM in indoor and outdoor GNSS-denied areas using a terrestrial scanner Leica RTC360 and a tachymeter to acquire point cloud and trajectory information. The proposed method is independent of time synchronization between robot and tachymeter and also works on sparse SLAM point clouds. For the evaluation of the proposed method, three LiDAR-based SLAM algorithms called KISS-ICP, SC-LIO-SAM, and MA-LIO are tested using a UGV equipped with two light detection and ranging (LiDAR) sensors and an inertial measurement unit (IMU). KISS-ICP is based solely on a single LiDAR scanner and SC-LIO-SAM also uses an IMU. MA-LIO, which allows multiple (different) LiDAR sensors, is tested on a horizontal and vertical one and an IMU. Time synchronization between the tachymeter and SLAM data during post-processing allows calculating the root mean square (RMS) absolute trajectory error, mean relative trajectory error, and the mean point cloud to reference point cloud distance. It shows that the proposed method is an efficient approach to measure the performance of SLAM in GNSS-denied areas. Additionally, the method shows the superior performance of MA-LIO in four of six test tracks with 5 to 7 cm RMS trajectory error, followed by SC-LIO-SAM and KISS-ICP in last place. SC-LIO-SAM reaches the lowest point cloud to reference point cloud distance in four of six test tracks, with 4 to 12 cm.

1. Introduction

The norm DIN 1076 [1] regulates the inspection of engineering structures in connection with roads in Germany. It requires the close-hand detection of damage such as cracks, delaminations, spalling, and cavities every three years. Large surface areas and diverse damage characteristics make this approach time-consuming and subjective. Automated mapping and damage detection using autonomous platforms like UGVs or UAVs can overcome this problem. For the visual inspection of bigger surface damage, the resolution of laser scanning can be sufficient. Photogrammetry is particularly suitable for fine structures like cracks. For the detection of subsurface damage, new technologies like LiDAR-based cavity detection can be used, as proposed by Vierhub-Lorenz et al. [2]. For the photogrammetric approach, the usual practice is taking enough images of the bridge from different perspectives and deriving a point cloud or textured mesh using a photogrammetric pipeline based on structure from motion (SfM). This computationally intensive approach cannot be used for real-time navigation of the platform but can be applied after the mission by using the recorded data. Moreover, real-time navigation is required in the case of real-time damage detection. For example, a close-up can be taken additionally, if damage is detected in a distant image. Many engineering structures like bridges shadow GNSS, as stated and tested in several works [3,4,5,6,7], complicating precise localization especially in the case of low structures and narrow areas between piers and girders. As used for indoor environments, SLAM solves this problem since it does not require GNSS. There is LiDAR-based SLAM, which usually uses a multi-layer LiDAR sensor and an IMU, and there is visual SLAM, which relies on a single camera or a system of multiple cameras. Visual SLAM is dependent on texture and context, which is dependent on the field of view (FoV). Engineering structures like bridges with a low ratio of height to width usually have bad ambient light coverage and shadowed areas. High contrast between the structure surface and the surrounding leads to the overexposure of images. Moreover, to ensure sufficient context in images, big structures require long working distances or a big FoV, which both reduce the ground sampling distance (GSD). The listed constraints even challenge state-of-the-art visual SLAM algorithms [8,9,10].
Due to the limitations of visual SLAM, this work deliberately concentrates solely on LiDAR-based SLAM. There are SLAM algorithms using a single LiDAR sensor like LIO-SAM [11] or an extended version using scan context for improved loop closure called SC-LIO-SAM [12], and algorithms using multiple LiDAR sensors. As an example, Xiao et al. [13] present a tight coupling of a dual LiDAR inertial odometry. They show the benefit of using a combination of horizontal and vertical LiDAR, e.g., in stair scenes. The recent work of Jung et al. [14] uses an asynchronous multiple LiDAR-inertial odometry. It is compatible with Velodyne, Ouster, and Livox LiDAR sensors. Apart from SLAM, a recent work on traditional iterative closest point (ICP) algorithms [15] shows that even without using an IMU and using ICP based on subsampled points instead of features, good results can be achieved. A big advantage is the low number of parameters compared to SLAM. However, the proposed KISS-ICP does not include loop closure.
Recent works focus on SLAM in GNSS-denied areas. Rizk et al. [16] present a method to overcome the limitations in complexity and memory requirement for UAV localization using image stitching. Chen et al. [17] fuse position information from ultra-wideband anchors with LiDAR point cloud data to detect line-of-sight measurements. Saleh and Rahiman [18] give an overview of recent mobile robot applications using visual SLAM in GNSS-denied areas. To optimize processing time, Jang et al. [19] use a GPU-accelerated normal distribution transform localization algorithm for GNSS-denied urban areas. Apart from classical methods, Petrakis and Partsinevelos [20] propose a deep learning method based on depth images. By using target markers and a combination of SLAM, deep learning, and point cloud processing, they achieve accuracies in the range of centimeters. Dai et al. [21] present deep learning-based scenario recognition using GNSS measurements on smartphones to recognize deep indoor, shallow indoor, semioutdoor, and open outdoor scenarios. The use of this information is part of their future work. Antonopoulos et al. [22] propose a localization module based on GNSS, inertial, and visual depth data which can be used for the autonomous navigation of UAVs in GNSS-denied areas. An et al. [23] propose a novel unsupervised multi-channel visual LiDAR SLAM method, called MVL-SLAM, which uses features based on deep learning for loop closure. Their experiments on the KITTI odometry dataset result in lower rotation and translation errors than other unsupervised methods, including UnMono [24], SfmLearner [25], DeepSLAM [26], and UnDeepVO [27]. Reitbauer et al. [28] propose LIWO-SLAM for wheeled platforms also using the wheel odometry information and show reductions in drift on tunnel datasets. Furthermore, Abdelaziz and El-Rabbany [29] propose a SLAM integration of inertial navigation system, LiDAR, and stereo data for indoor environments and tested it on the KITTI dataset including tunnel scenarios.
For outdoor scenarios, the SLAM results are usually compared to the pose information acquired using GNSS for precise localization. For indoor scenarios, known checkpoints, as used for the Hilti SLAM challenge dataset, can be used for evaluation. In small areas, 6D tracking based on camera setups like Optitrack, as used by Sier et al. [30], or a laser tracker like the Leica tracker with a T-Probe, allows sufficient ground truth information. However, in outdoor areas, those systems suffer from overexposure and limited distance. Another option is moving the system on a controlled path, as carried out by Filip et al. [31]. They test different state-of-the-art SLAM algorithms in a featureless tunnel. A rectangular path marked on the floor defines the reference path. However, they only consider a 2D trajectory. Moreover, this does not work on loose surfaces like sand or soil since it depends on a surface where reference markings can be attached. For profound evaluation of new SLAM methods for so called helmet laser scanning, Li et al. [32] present an outdoor dataset including forests and underground spaces.
In contrast to previous studies, the objectives of this work are (1) presenting an alternative method to measure the performance of SLAM in GNSS-denied outdoor areas using a tachymeter and a reference point cloud acquired by a terrestrial laser scanner; (2) implementing a time synchronization between tachymeter and SLAM trajectory data based on a fitting approach; (3) automated transformation of SLAM point clouds and reference point cloud in tachymeter coordinates; (4) evaluating the proposed method using a dual LiDAR system with IMU on three different algorithms: KISS-ICP, SC-LIO-SAM, and MA-LIO by (5) using a challenging 3D track including height variations and steep slopes leading to vibrations and high variations in roll and pitch.

2. Materials and Methods

2.1. Sensor System

The sensor system used in this work consists of a horizontal and vertical Velodyne VLP-16 LiDAR and an IMU 3DM-GX5-25 mounted on a rigid frame, as shown in Figure 1a. The VLP16 has a horizontal FoV of 360 with a resolution of 0.1 and a vertical FoV of 30 with a resolution of 2 based on the 16 scanning lines. The enhanced Kalman filter of the IMU calculates orientation, linear acceleration, and angular acceleration at 500 Hz. As part of this work, a frequency of 200 Hz is set. The sensor setup is mounted on a Husky mobile robotic platform from Clearpath Robotics, as depicted in Figure 1b. The Robot Operating System (ROS) serves as a backbone for operating the robot and acquiring the sensor data using the rosbag function. The extrinsic calibration is performed manually using a movable reference plate, as shown in Figure 2. All translations and rotations from horizontal LiDAR to IMU are based on the CAD drawing due to the use of precise manufacturing, short lever arms, and the use of dowel pins. The rotation between the vertical LiDAR and the horizontal LiDAR was optimized in such a way that the edges of the reference plate coincide. Time synchronization between the IMU and LiDAR sensor is usually created using GNSS. However, this is not available in GNNS-denied areas. The SLAM algorithms used in this work are not tested in real time during operation but in post-processing using rosbag play in real time, which includes time synchronization based on message reception time. We abstain from external time synchronization between LiDAR sensors and IMU to make the proposed method easily testable for the robotic community. However, in the case of real-time testing, artificially produced GNSS signals based on the system time can be used to synchronize the Velodyne LiDAR sensors and the IMU using pulse per second (PPS) and National Marine Electronics Association (NMEA) sentence.

2.2. Test Area

The test scenario for this work is a federal road bridge in Loerrach, Germany. Apart from multiple streets and a railroad line, most of the area under the bridge consists of drivable ground such as meadow or gravel. The chosen section of the test bridge consists of three areas, as shown in Figure 3: a hill area, a pump track area, and a flat area. The pump track consists of multiple hills, slopes, and steep curves. In contrast to previous studies, this allows testing SLAM on a UGV at larger pitch and roll changes. The bridge structure itself is homogeneous and has repeating structures, which is a common challenge for LiDAR-based SLAM. The bridge is surrounded by vegetation, which does not include many corners or surface features. However, it influences the results of SLAM.

2.3. Data Acquisition

For testing the performance of KISS-ICP, MA-LIO, and SC-LIO-SAM, six test tracks in the pump track area are driven manually. First of all, 4 reference markers are positioned as shown in Figure 3. The center of each reference target was measured using the tachymeter. Afterwards, the selected bridge area was recorded using the Leica RTC360 laser scanner (Leica Geosystems AG—part of Hexagon). For the used processing method, the following order of steps is important. First, the automated tracking of the prism using the tachymeter is started. This ensures that for each SLAM position, there is a reference position. Then, the messages of the two LiDAR sensors and the IMU are recorded in a single rosbag file. After waiting 5 to 10 s, the robot is driven manually on the planned track. This waiting time is required for the later approximated time synchronization between tachymeter and SLAM data. After stopping the robot and a waiting time of a few seconds, the rosbag record is stopped. After that, the tachymeter tracking is stopped. During tracking, it was ensured that the prism was not lost by the tachymeter. While driving, the operator walked as far as possible from the robot to avoid influencing the field of view. However, especially for bigger hills, a closer distance was necessary for the safe operation of the robot.

2.4. Data Processing

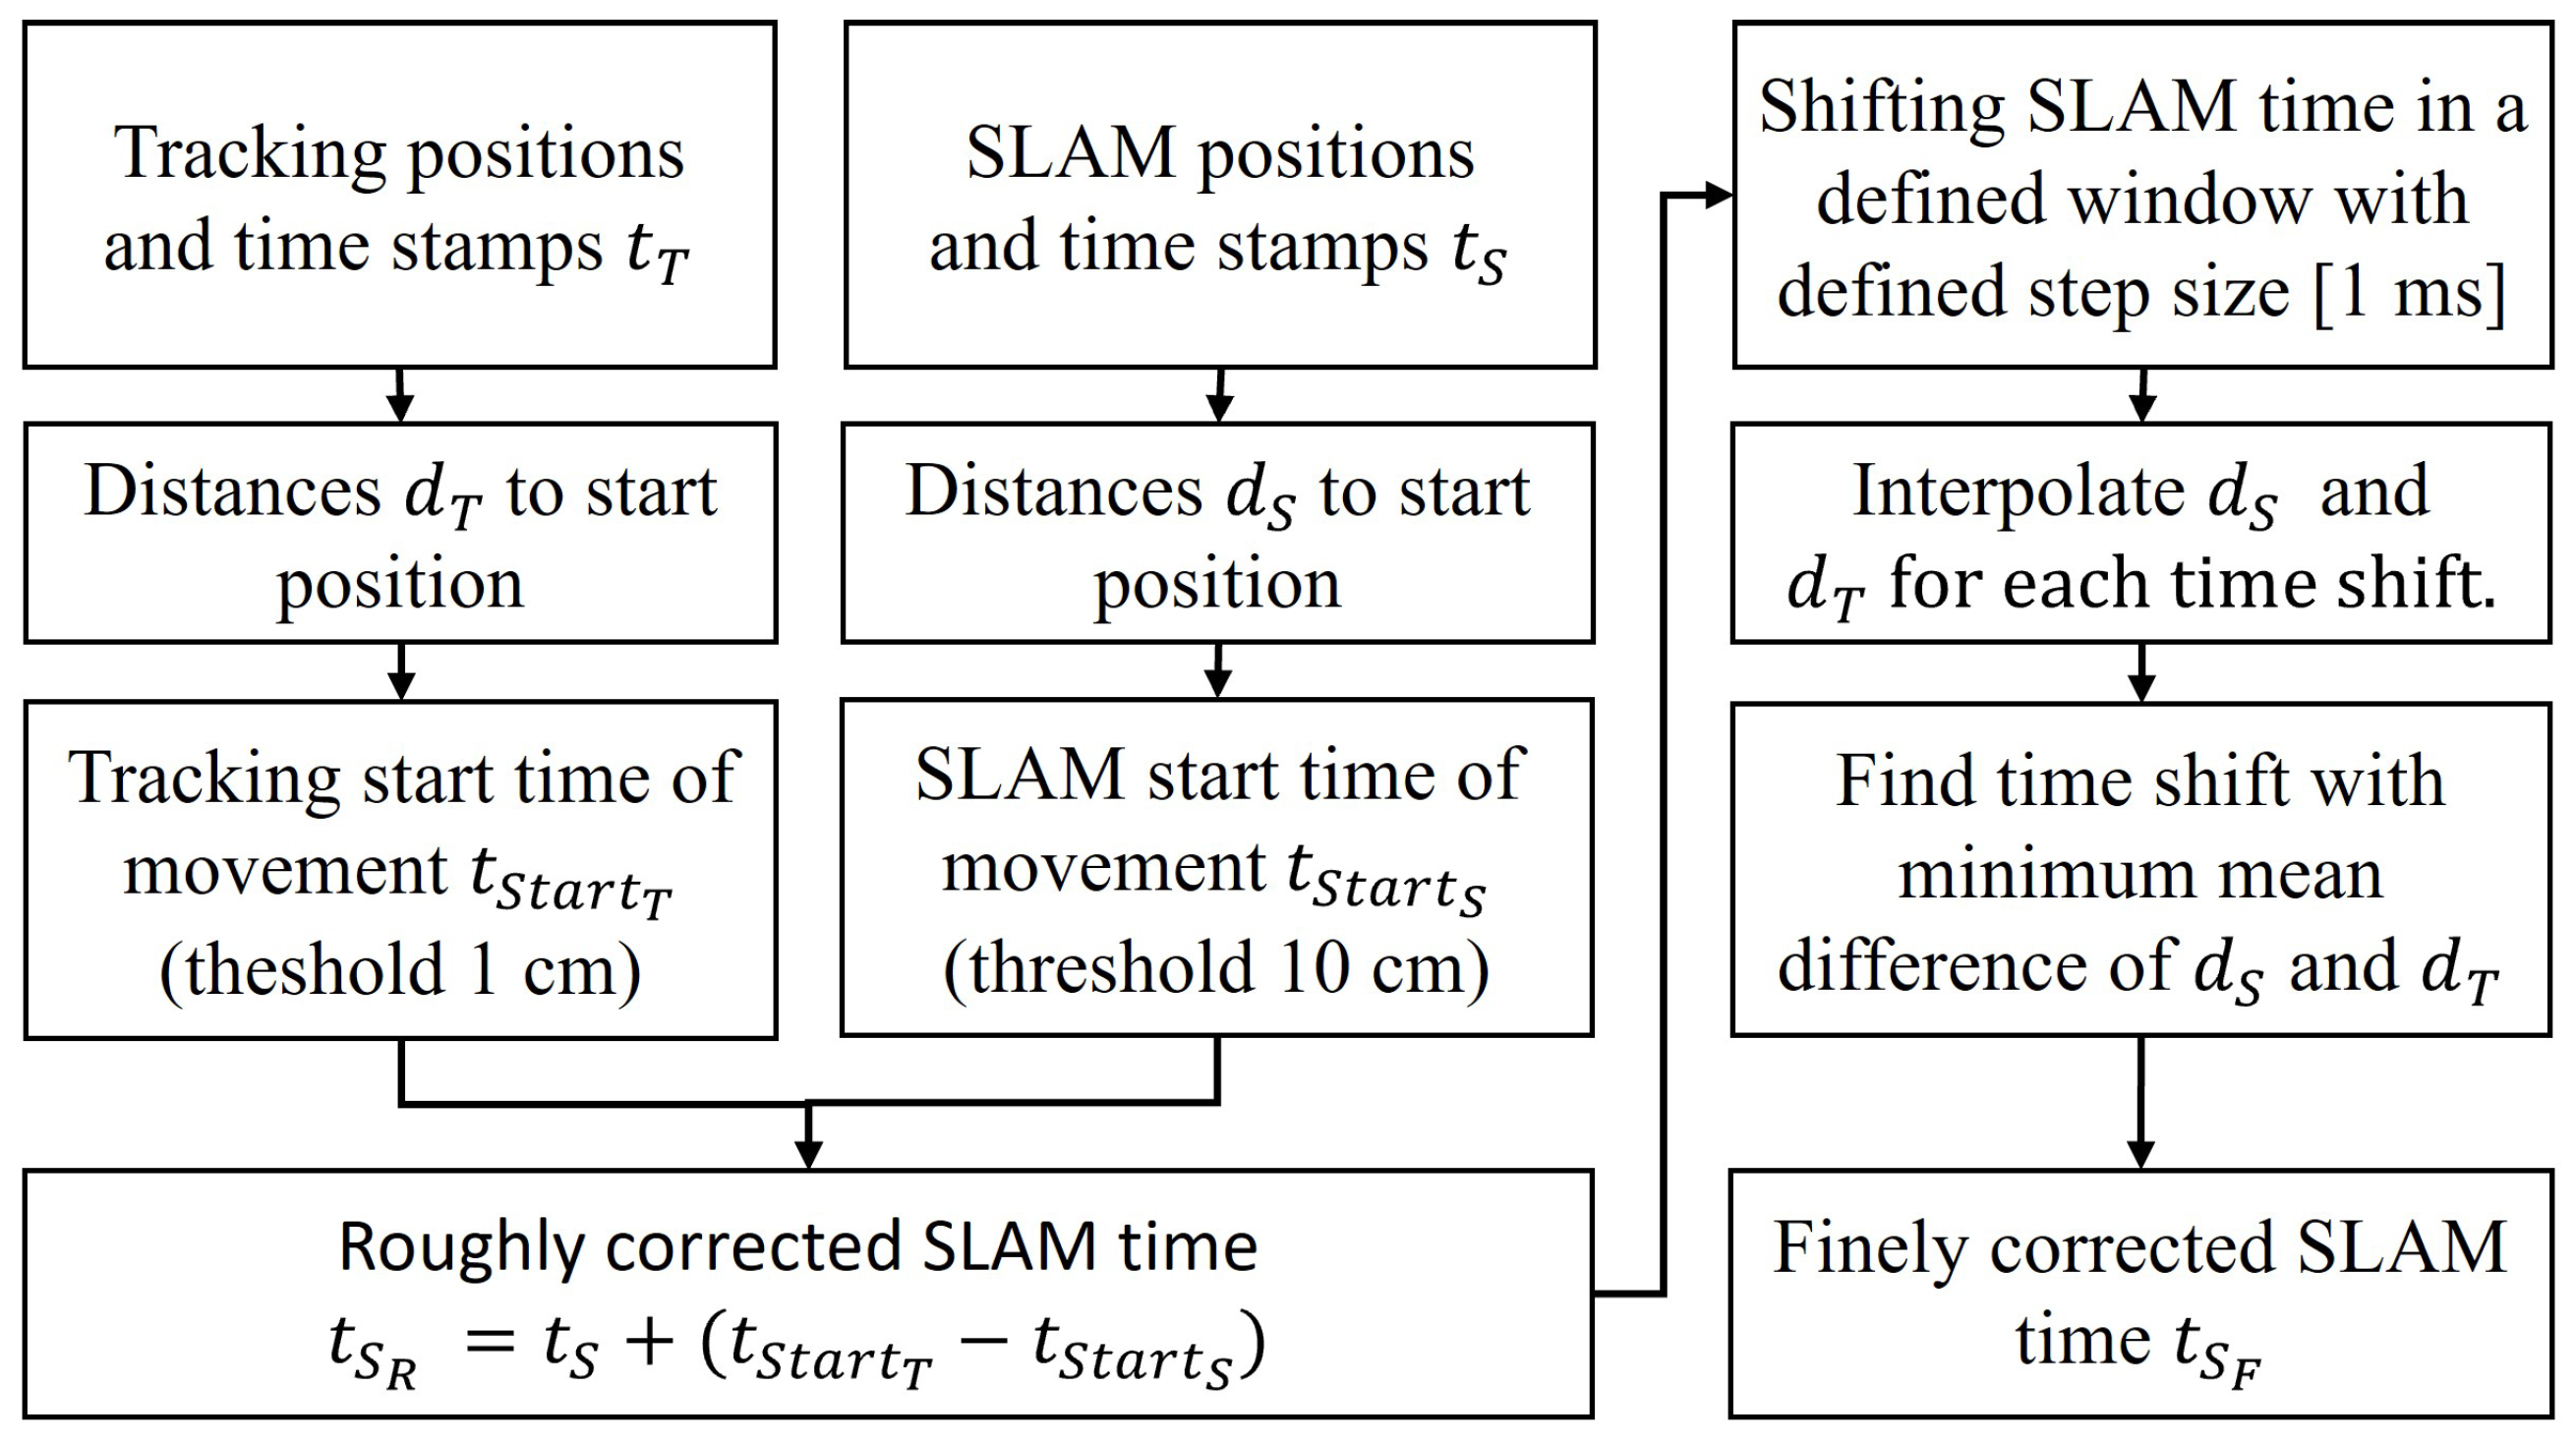
Based on the recorded LiDAR and IMU data, KISS-ICP, MA-LIO, and SC-LIO-SAM are used to calculate both point cloud data and trajectory. As part of this work, both the trajectory and the point cloud data are analyzed. The first objective is the transformation of the SLAM trajectory into tachymeter coordinates. Since the tachymeter data and the SLAM trajectory are not time-synchronized, either a registration without point correspondence can be used or a time synchronization in post-processing is required to use pose correspondence for trajectory alignment. The proposed method is shown in Figure 4. For that purpose, we calculate the distance from the prism at the start to all positions along the trajectory. This is carried out for the tachymeter data and the SLAM data after adding the transformation from the horizontal LiDAR sensor or IMU to the prism center. Based on that data, the time offset between the different data sources is determined. As a first guess, a distance threshold is used to find the tachymeter time when the robot started moving. After correcting the SLAM time data by the time guess, a sliding time window is used with a resolution of one millisecond. For each shift, the distance data are interpolated and the mean distance offset is calculated. The minimum mean distance offset gives the fine time correction. The result is the finely corrected SLAM time t S F .
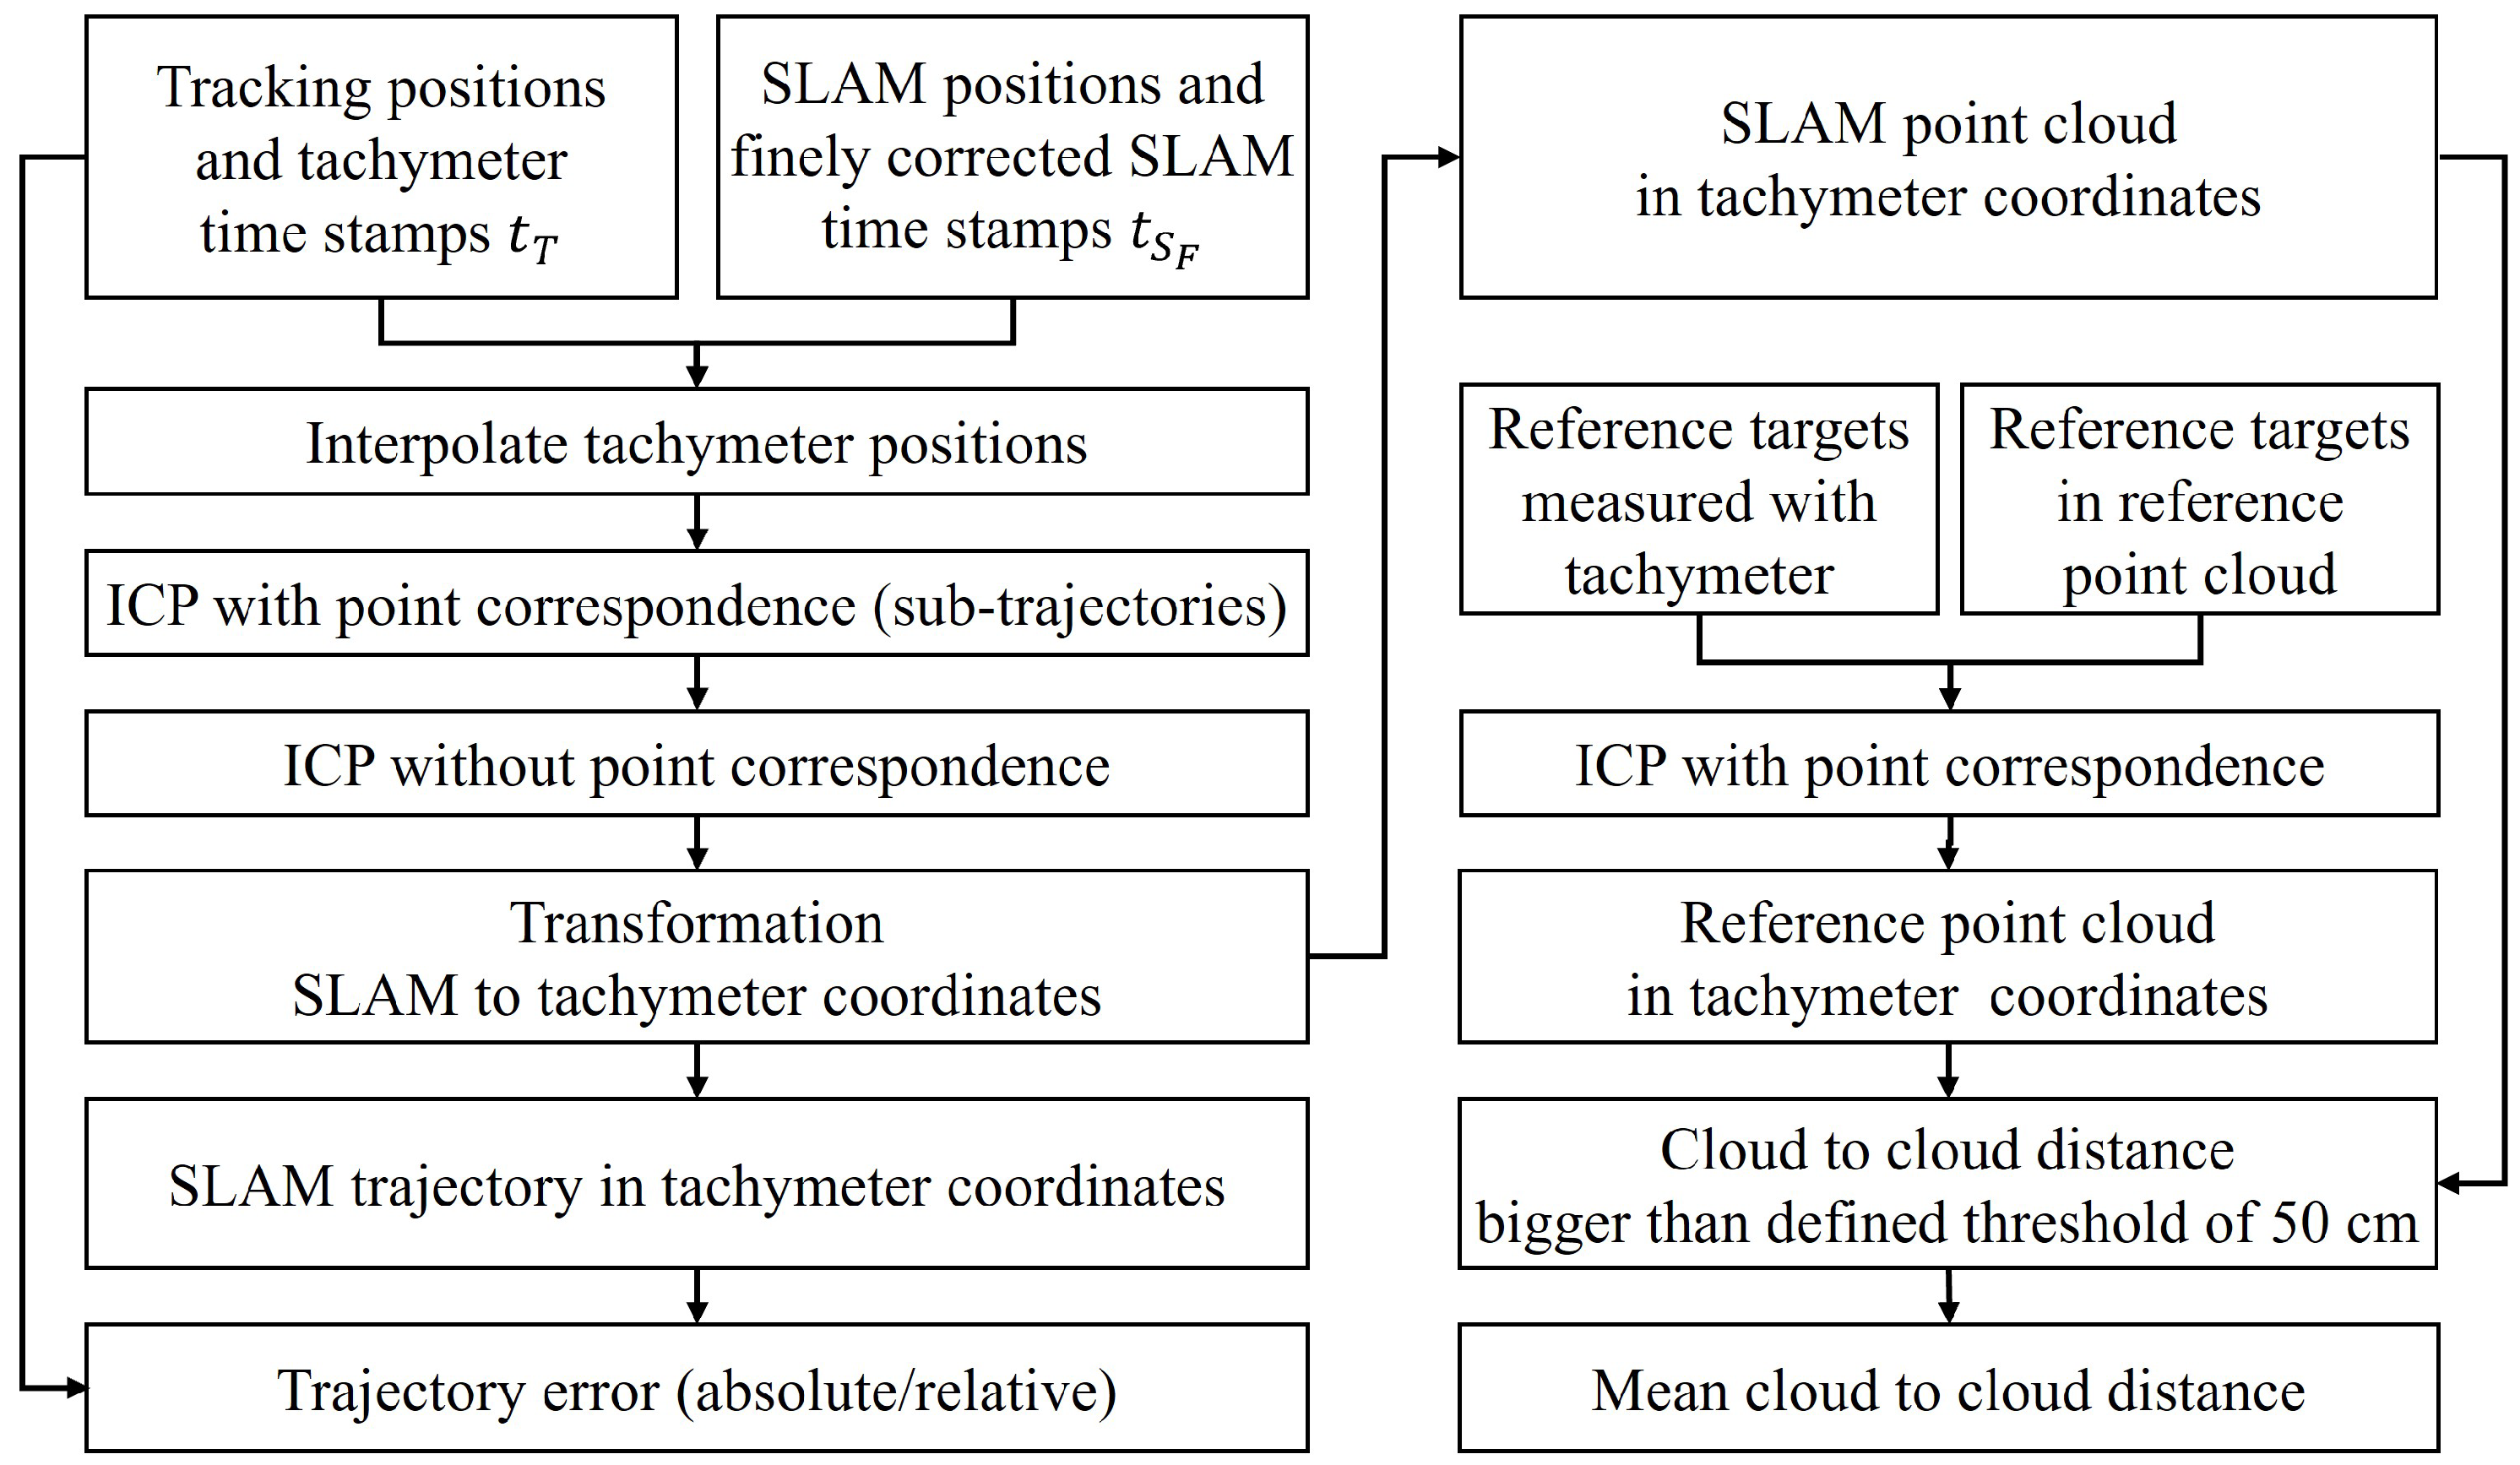
After applying the approximated time synchronization, there is a known time dependency between SLAM poses and interpolated poses measured with the tachymeter. This is followed by the following processing steps depicted in Figure 5. This is used for applying an ICP with point correspondence. After applying the ICP with point correspondence, a second ICP without time correspondence is used for fine adjustment. This ensures that the evaluation method is less dependent on the synchronization accuracy.
The next step is applying the transformation gained from the trajectory registration to the SLAM point cloud data. To analyze the deviations from the reference point cloud, the minimum cloud to cloud distance is used. Before, vegetation, ground, and side areas are removed from the Leica RTC360 point cloud to keep only sharp and simple geometries as shown in Figure 6. Since not the overall reference point cloud is covered by each trajectory, points in the SLAM point clouds with a distance higher than a defined threshold of 50 cm are removed and not used for further calculations. This is similar to a voxelization approach to check which voxels are covered by both data sources. In the end, the mean cloud-to-cloud distance is calculated. Those distances include pose errors, the measurement accuracy of the VLP16 LiDAR sensor, which is ±3 cm, and errors due to the density of the point clouds. An alternative approach is using point-to-plane distance. However, this would require either a 3D model, which is often not available, or fitting local planes into the point cloud. The reference point cloud has a minimum point-to-point distance of 1 cm. Therefore, the error induced by that is small. Due to the threshold of 50 cm, part of the SLAM point clouds in the interface areas of the reference bridge to the ground are not removed. Compared to the overall number of points, this effect is small. Moreover, the same approach is used for all SLAM algorithms compared in this work.
As proposed by Zhang and Scaramuzza [33], apart from the absolute trajectory errors, the relative trajectory errors allow comparing local performance of multiple SLAM algorithms. For this purpose, the trajectory error of multiple sub-trajectories is calculated. The number, length or duration, and distribution of the sub-trajectories is can be freely chosen; however, it affects the results and should be the same for all SLAM algorithms. In contrast, it is more complex to calculate than the absolute trajectory error but gives further information on drift and local stability. SC-LIO-SAM only outputs key poses which are in a distance of up to 1 m. This leads to a smaller distance than the actual distance. Therefore, the distance criteria to select equal sub-trajectories across different SLAM methods will lead to spatial shifts. Therefore, we use the corrected time information. Due to the short test tracks, five sub-trajectories with a duration of 15 s are equally distributed within the time period, which is covered by all SLAM methods per track. The chosen duration is based on the geometry of the trajectories. Shorter sub-trajectories would lead to false assumptions.
The last test is a long track through all three test areas a, b, and c, shown in Figure 3, and the way back to the start position. For this track, the tachymeter cannot be used due to occlusions because of the bridge piers and the topography. However, this test allows a qualitative evaluation if and under which constraints the algorithms map the bridge without major divergence and if the point clouds represent the bridge geometry correctly.

3. Results

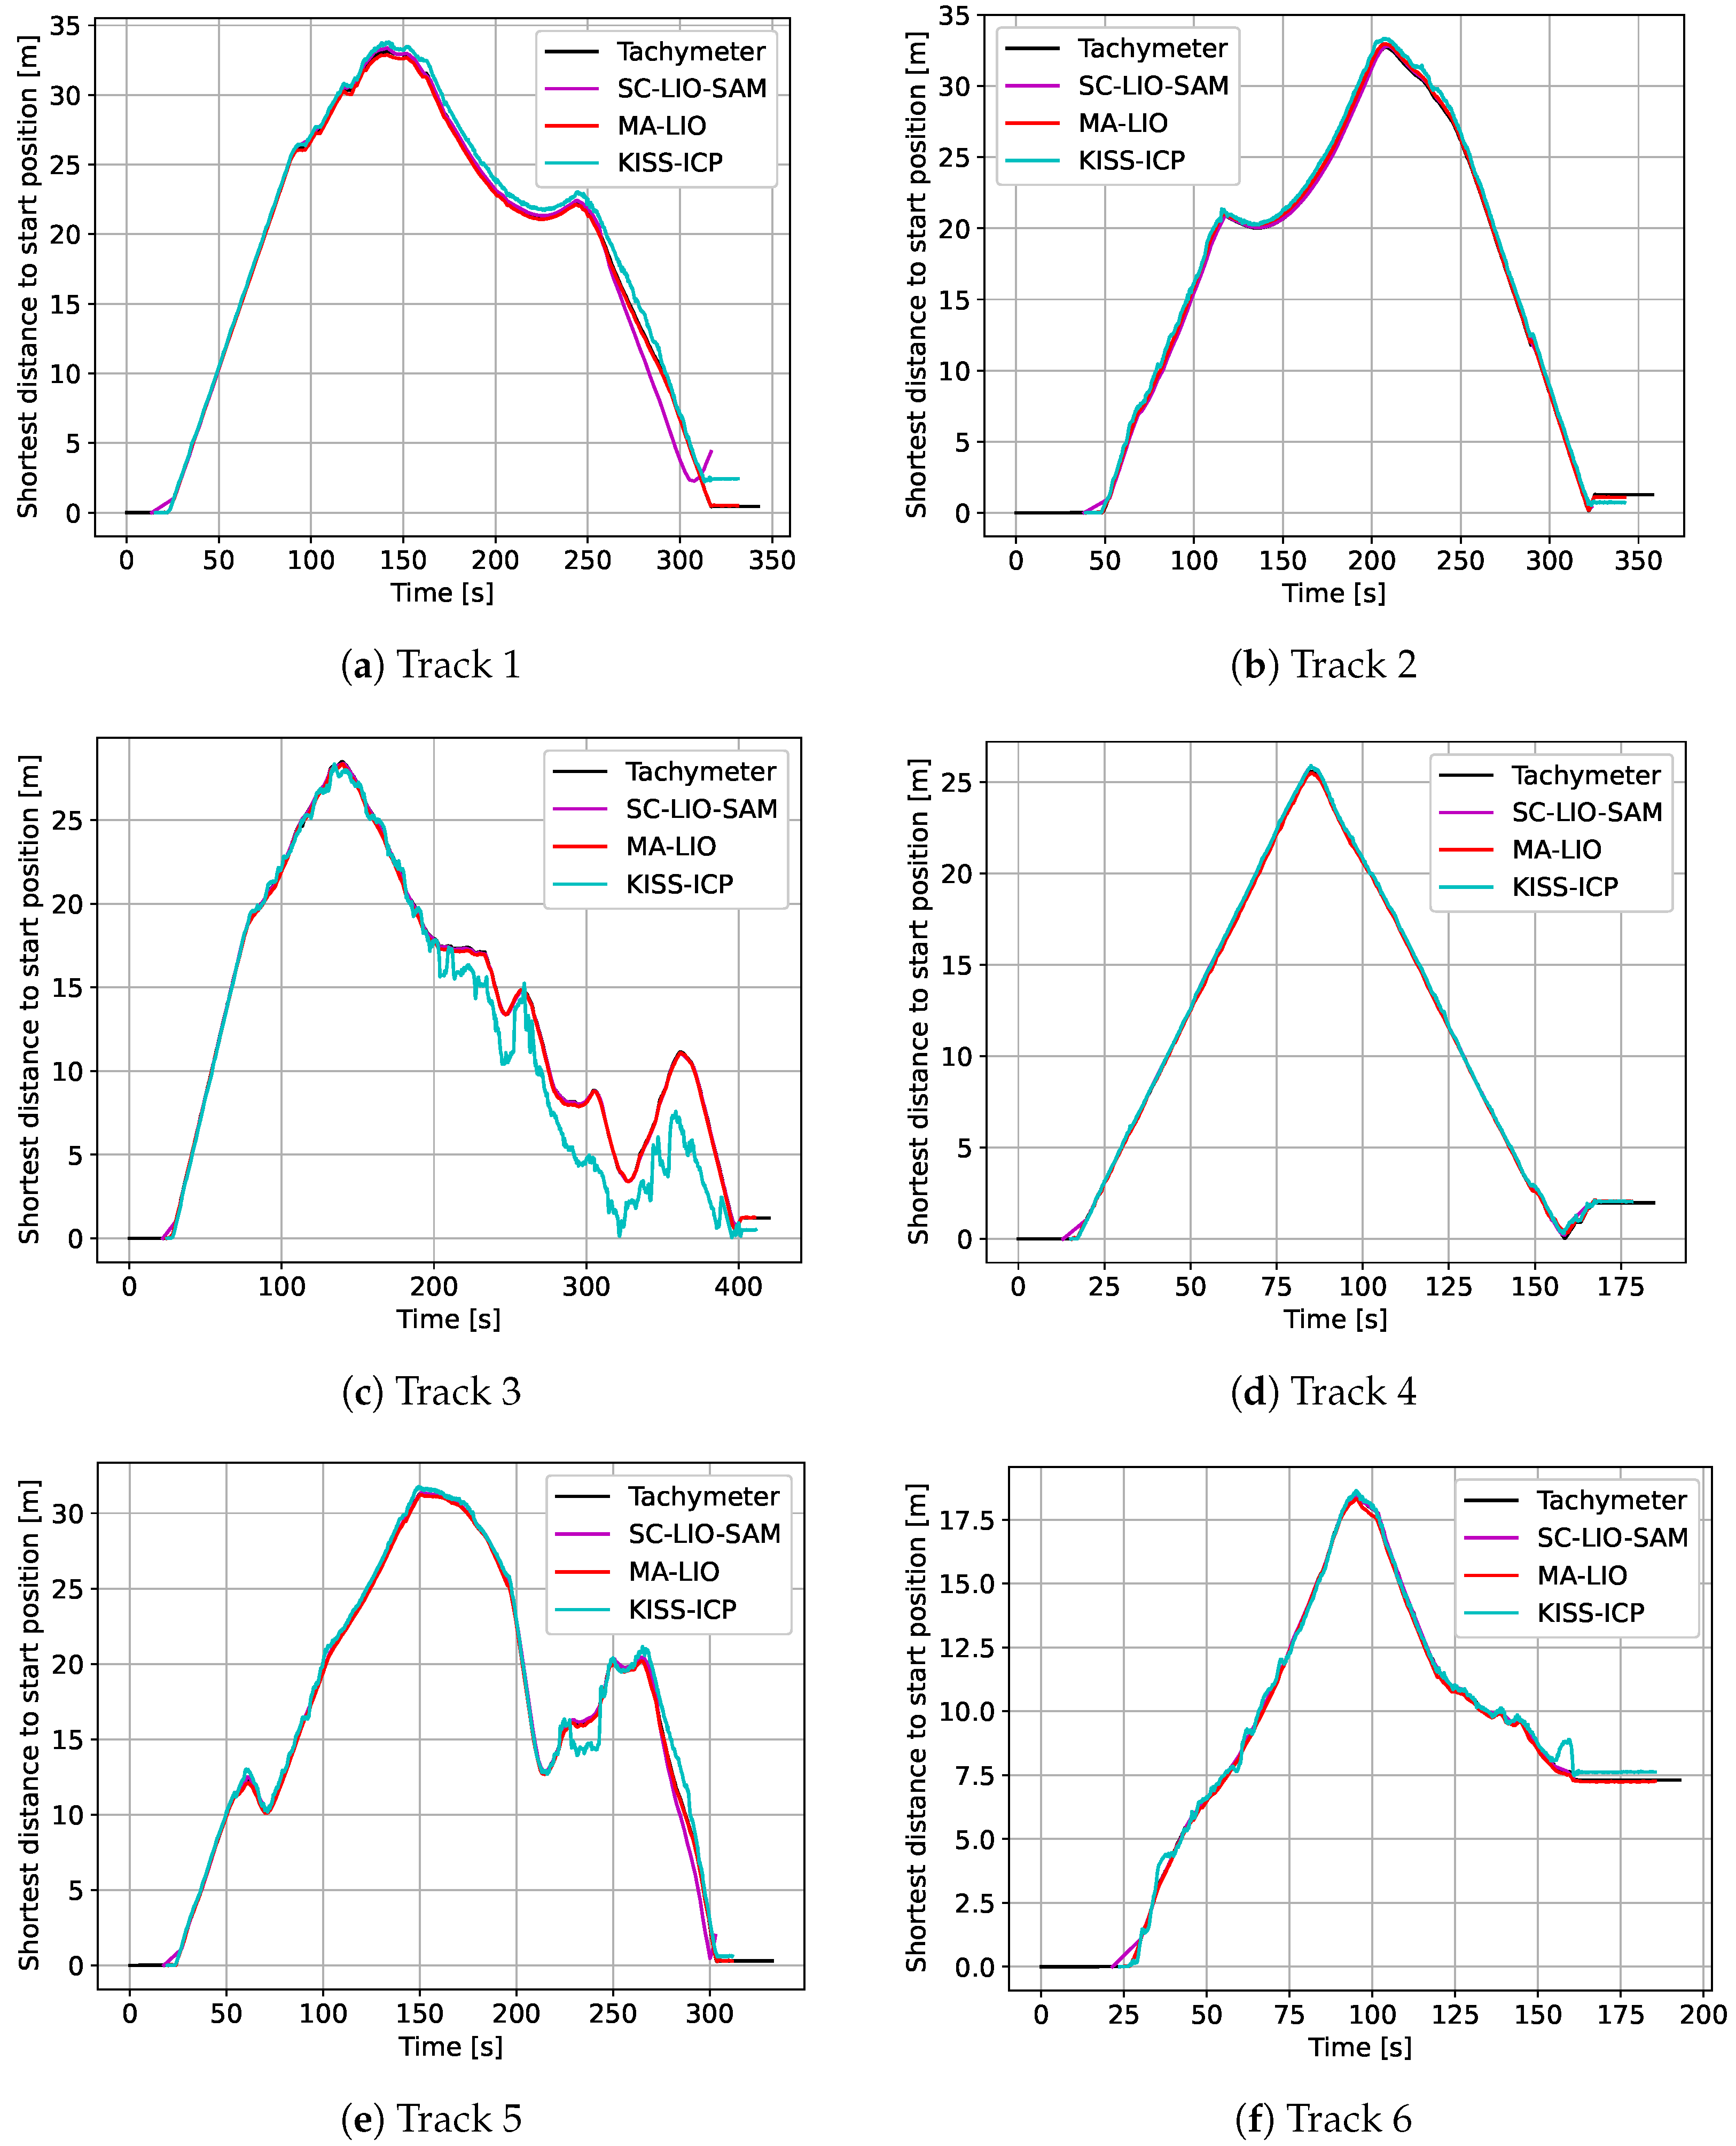
The results of the proposed time synchronization based on absolute distance to the start position are depicted in Figure 7. By using this approach, even the low frequency of 10 Hz of the tachymeter tracking and higher time duration between key frames of SC-LIO-SAM can be compensated. The graphs already show errors and drift of the SLAM results even without registration. For longer tracks, it might be necessary to use only part of the track, since rotational errors will influence the distance to the starting position.
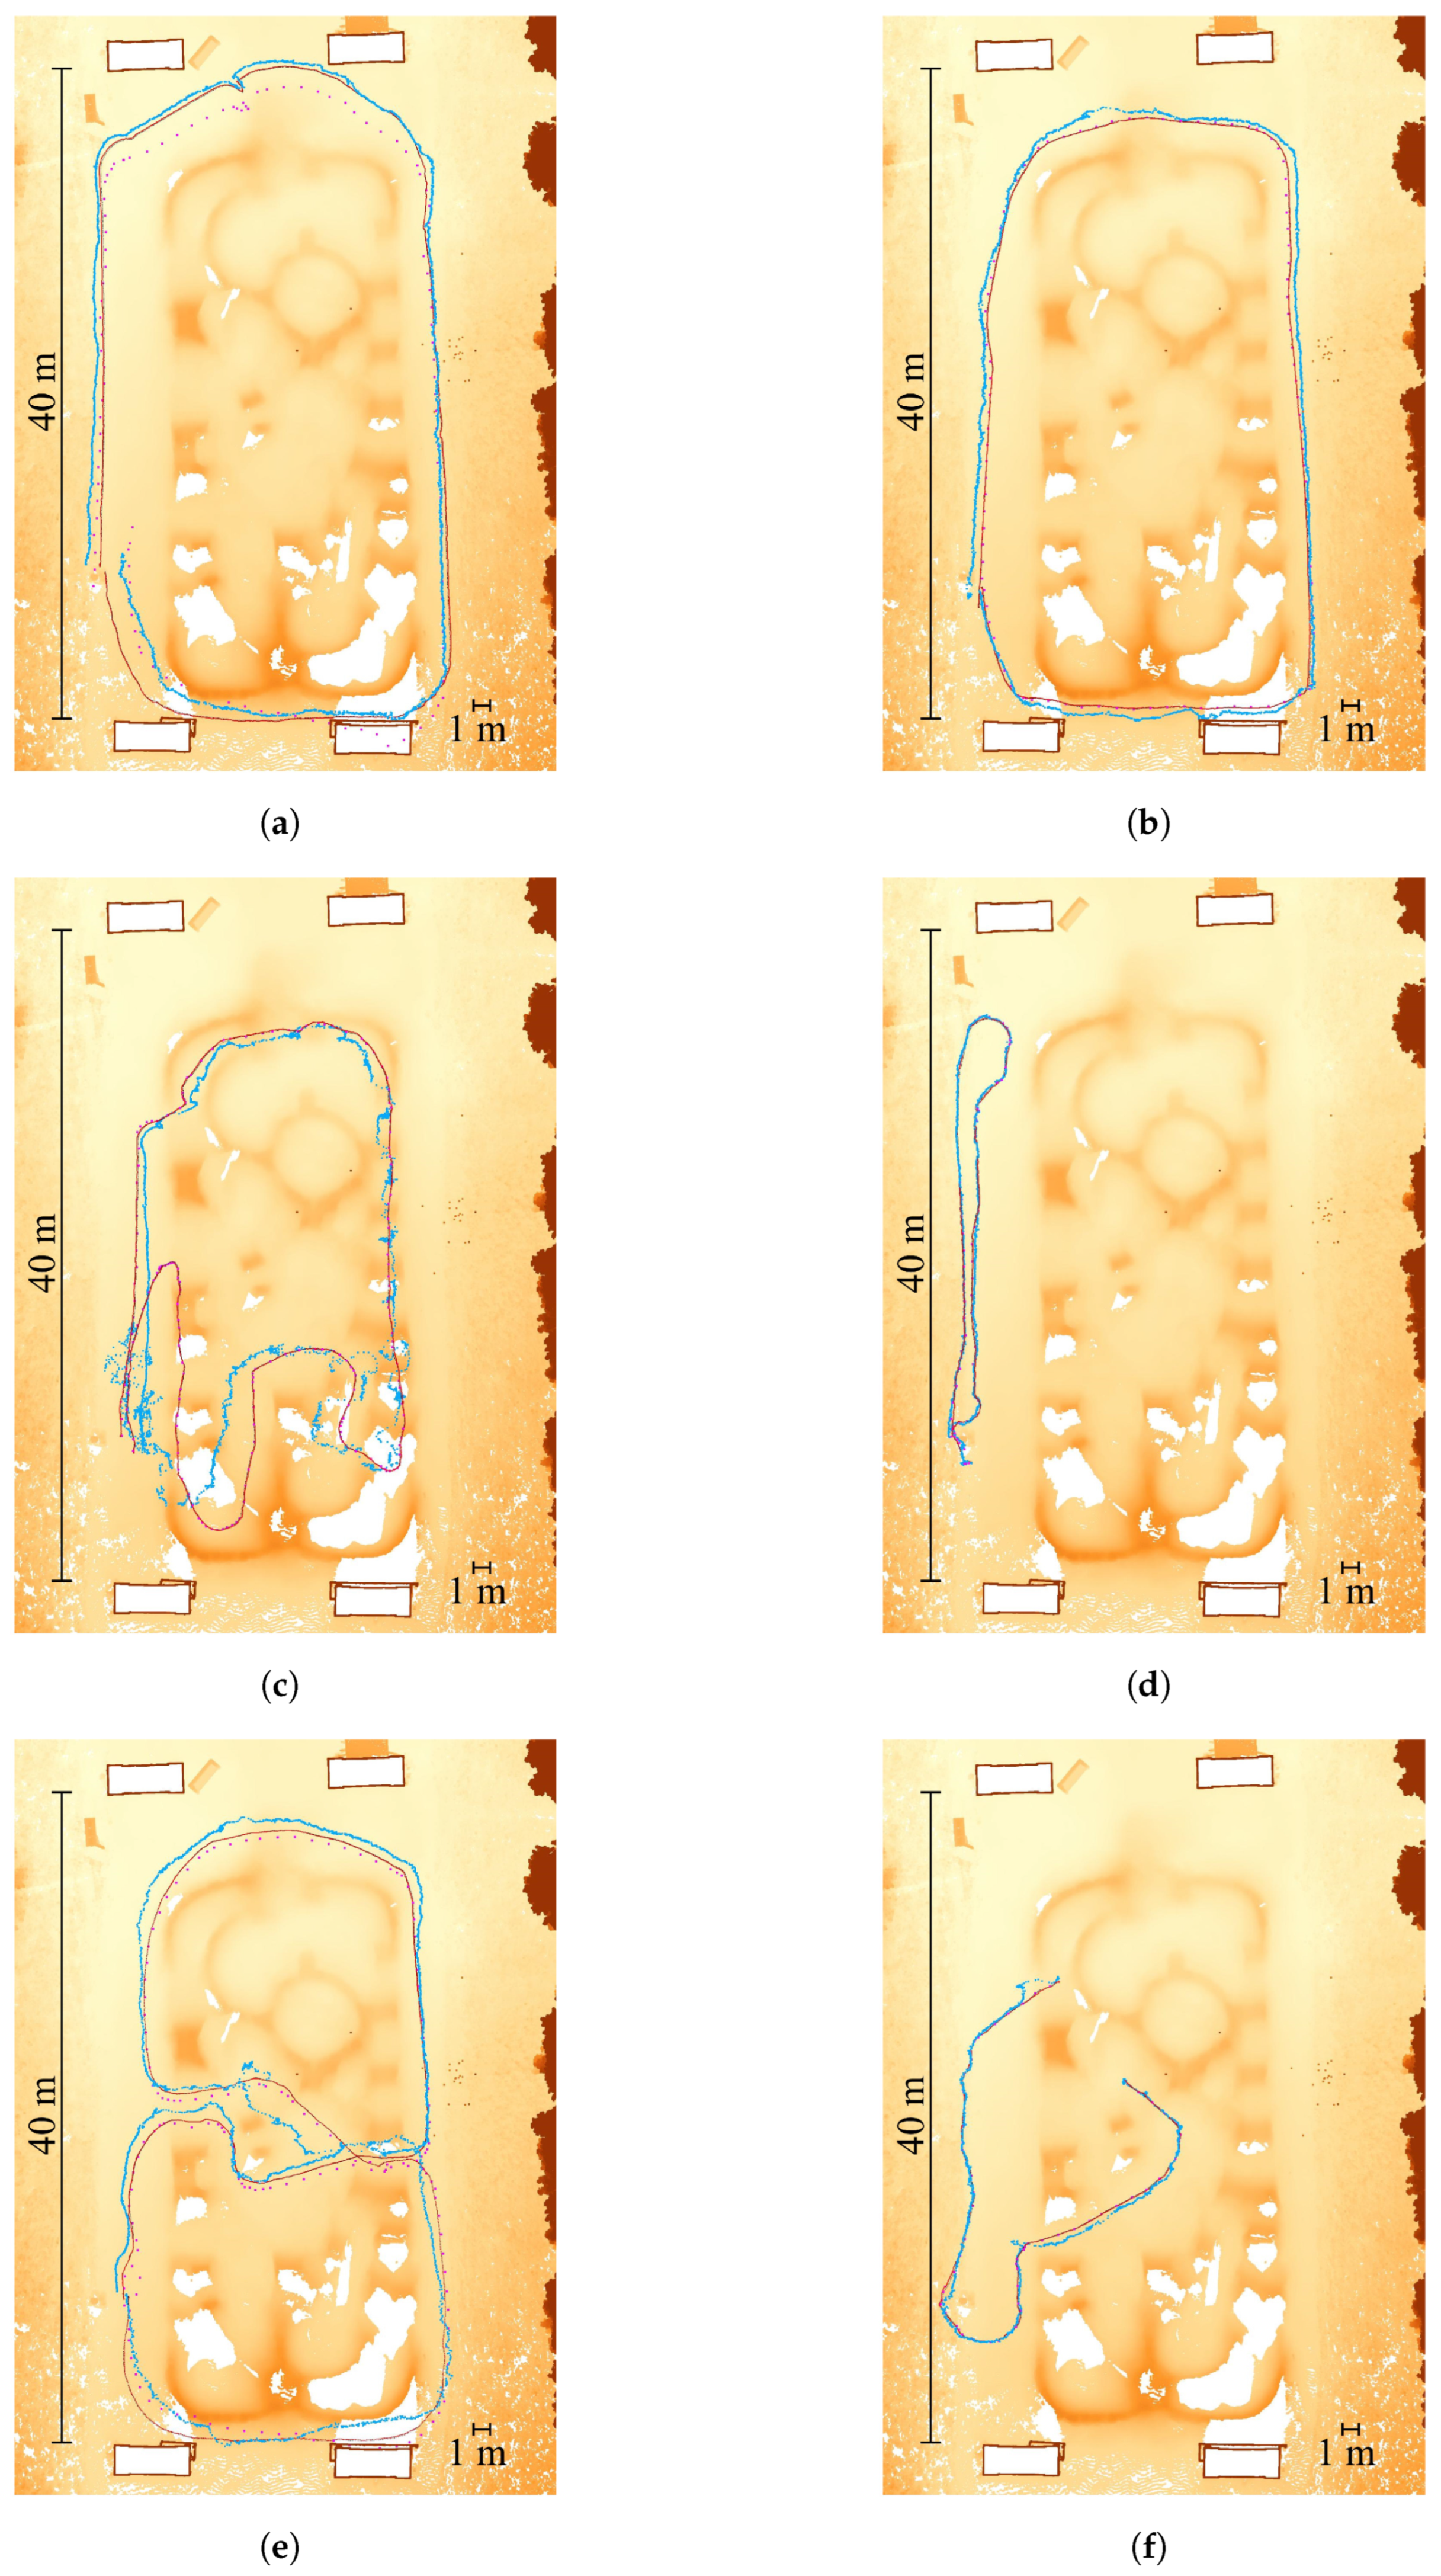
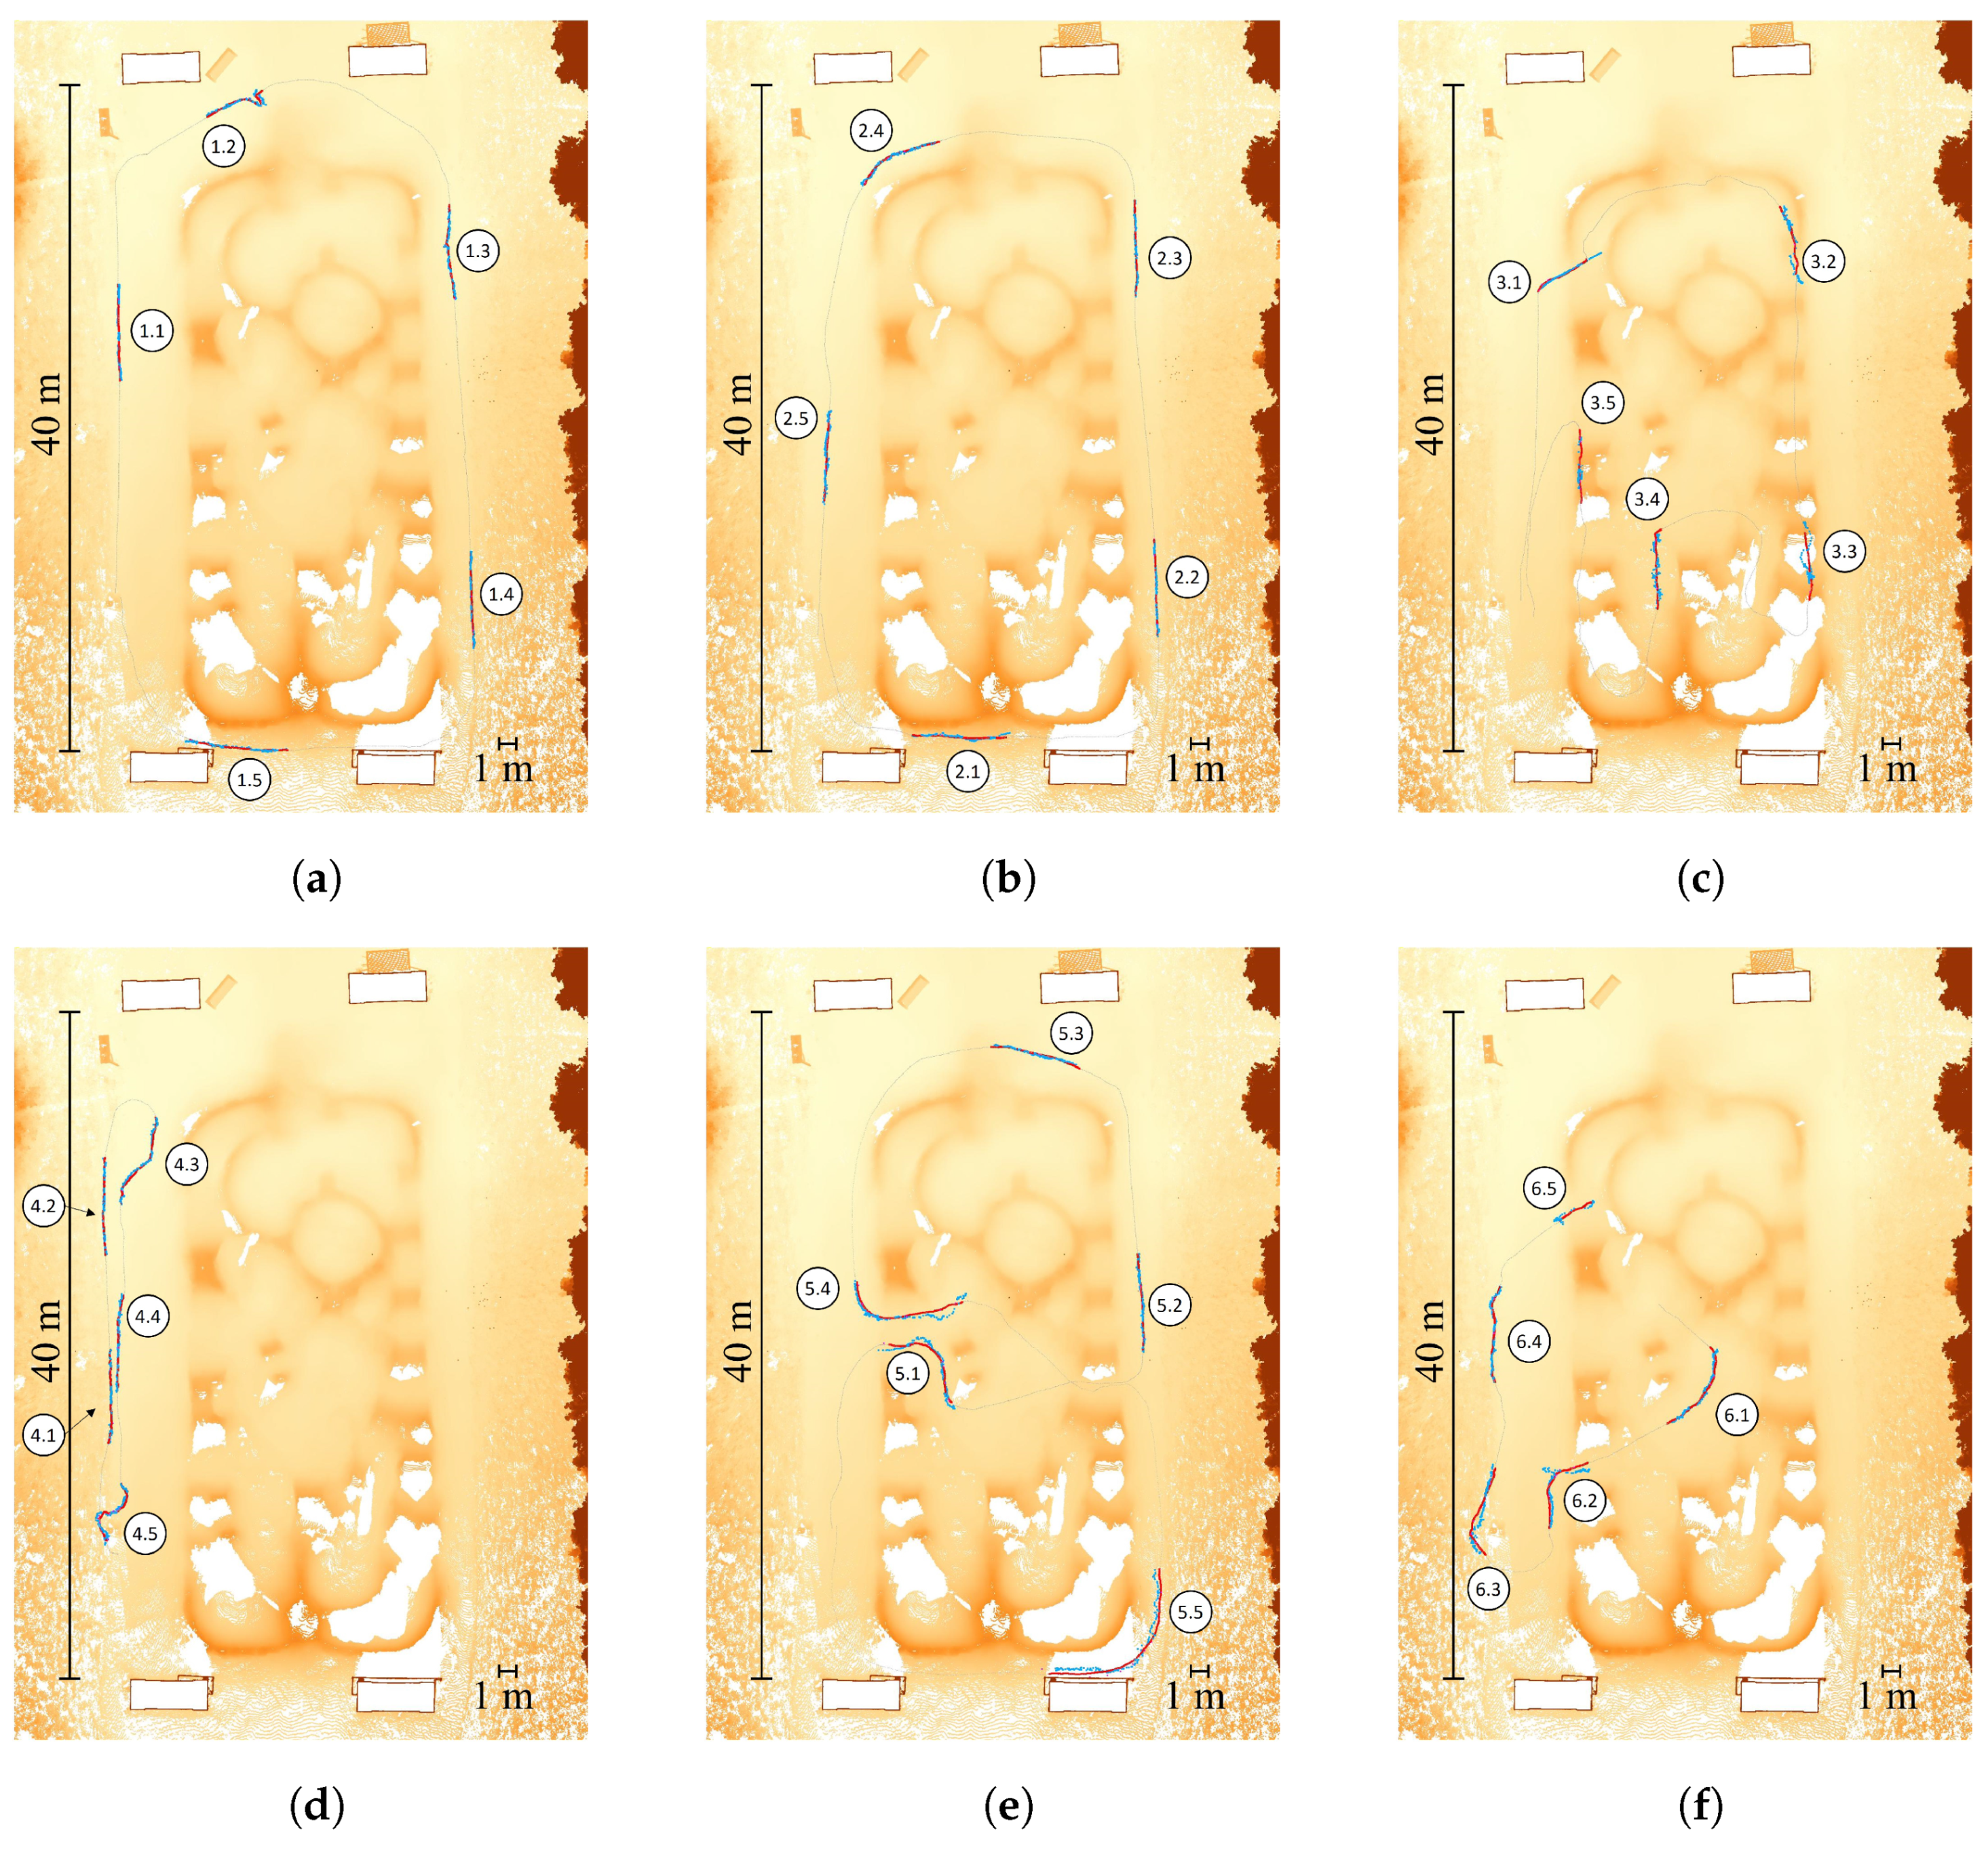
The six different SLAM trajectories, transformed into tachymeter coordinates, and the tachymeter reference trajectories are shown in Figure 8. The height map below, which is derived from the RTC360 point cloud, indicates the hills and piers of the pump track. The first two tracks are clockwise and counterclockwise where similar results are expected. However, the driving speed can vary and the exact same path is not driven. Track 3 includes most of the hills of the pump track. Track 4 is a return on the same line in the flat side area. Track 5 is a figure eight to include a meeting point for loop closure and vary the direction of rotation. Track 6, the last track, starts from the center to vary the start location.
The absolute RMS error for each algorithm and track is listed in Table 1. MA-LIO performs best, followed by SC-LIO-SAM and KISS-ICP. SC-LIO-SAM struggles with the end of track 1 and track 5, which is the bottom side in Figure 8a,e. One reason could be that SC-LIO has a problem with the person walking behind the robot in this narrow area or the fact that half of the FoV was blocked by the border of the pump track obscuring the view of the upper two bridge piers. Based on that error, the overall registration is shifted downwards. This leads to an RMS error of 1.693 m and 0.617 m. The other trajectories have an RMS error of 6 to 14 cm. Even track 3 with hills has a decent RMS error of 7.6 cm. The performance of MA-LIO is constant for all trajectories and is between 5 and 9 cm. For track 3 with big hills, it was expected that MA-LIO would perform better than SC-LIO-SAM due to the second LiDAR. However, compared to SC-LIO, it has a slightly bigger error but also has much more poses per trajectory, since it does not only use key frames, each 1 m or 0.2 rad. KISS-ICP performs best for itself on track 4, which is the simplest track. The voxel size parameter is already reduced to 1 cm instead of a default value of 1 m to improve accuracy. For the other tracks, a mix of drift and jumps along the trajectory leads to bigger errors of KISS-ICP. Even if the start pose would be at the reference start point, the offset would be even higher. Strong vibrations and steep slope, a LiDAR frame frequency of 10 Hz, and the absence of loop closure and an IMU could be the reasons.
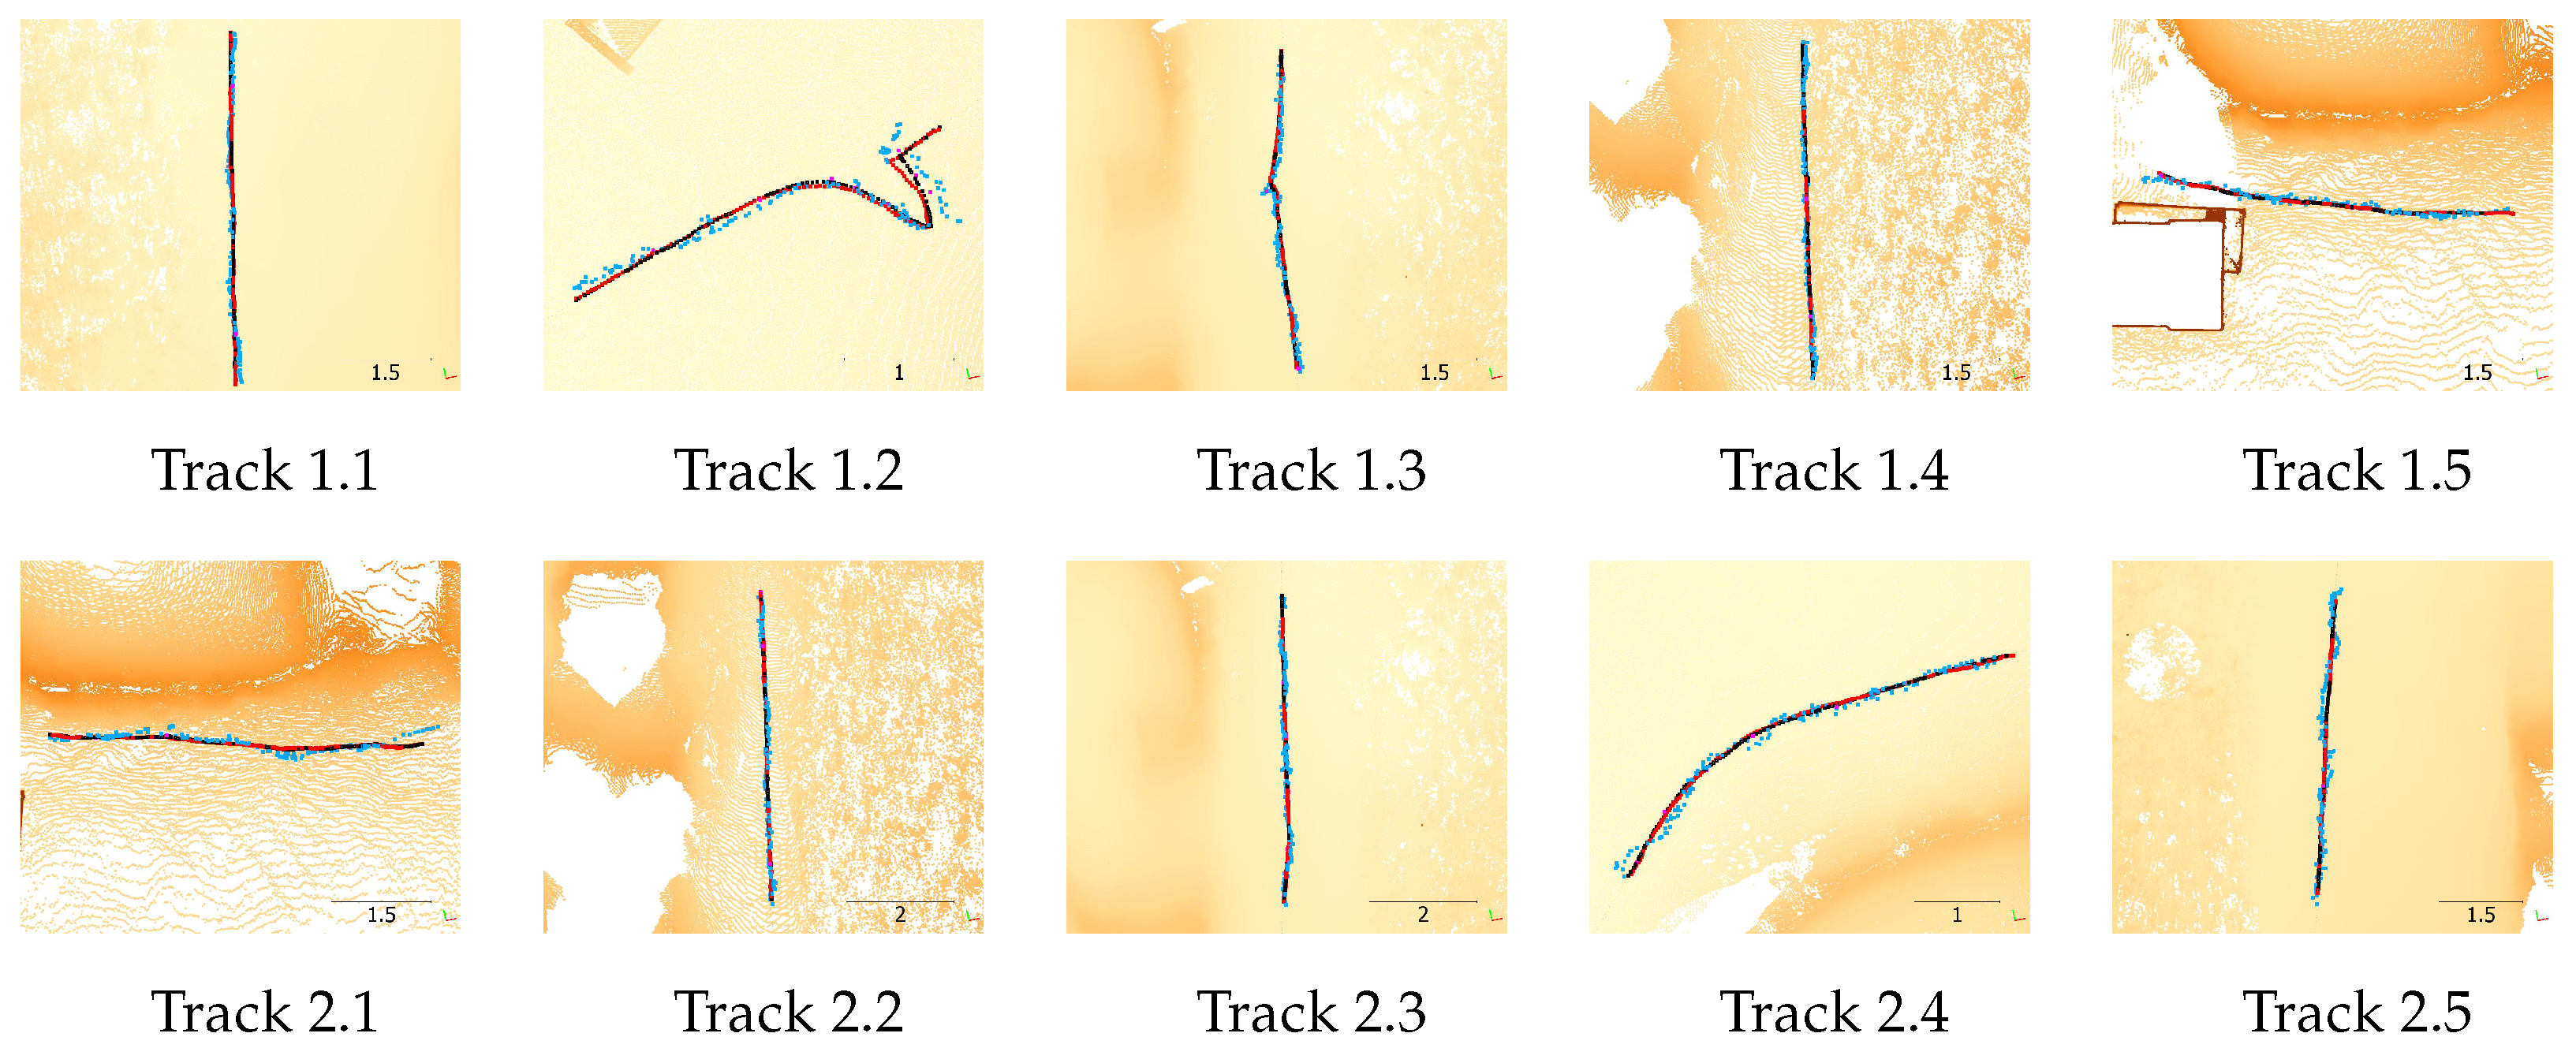
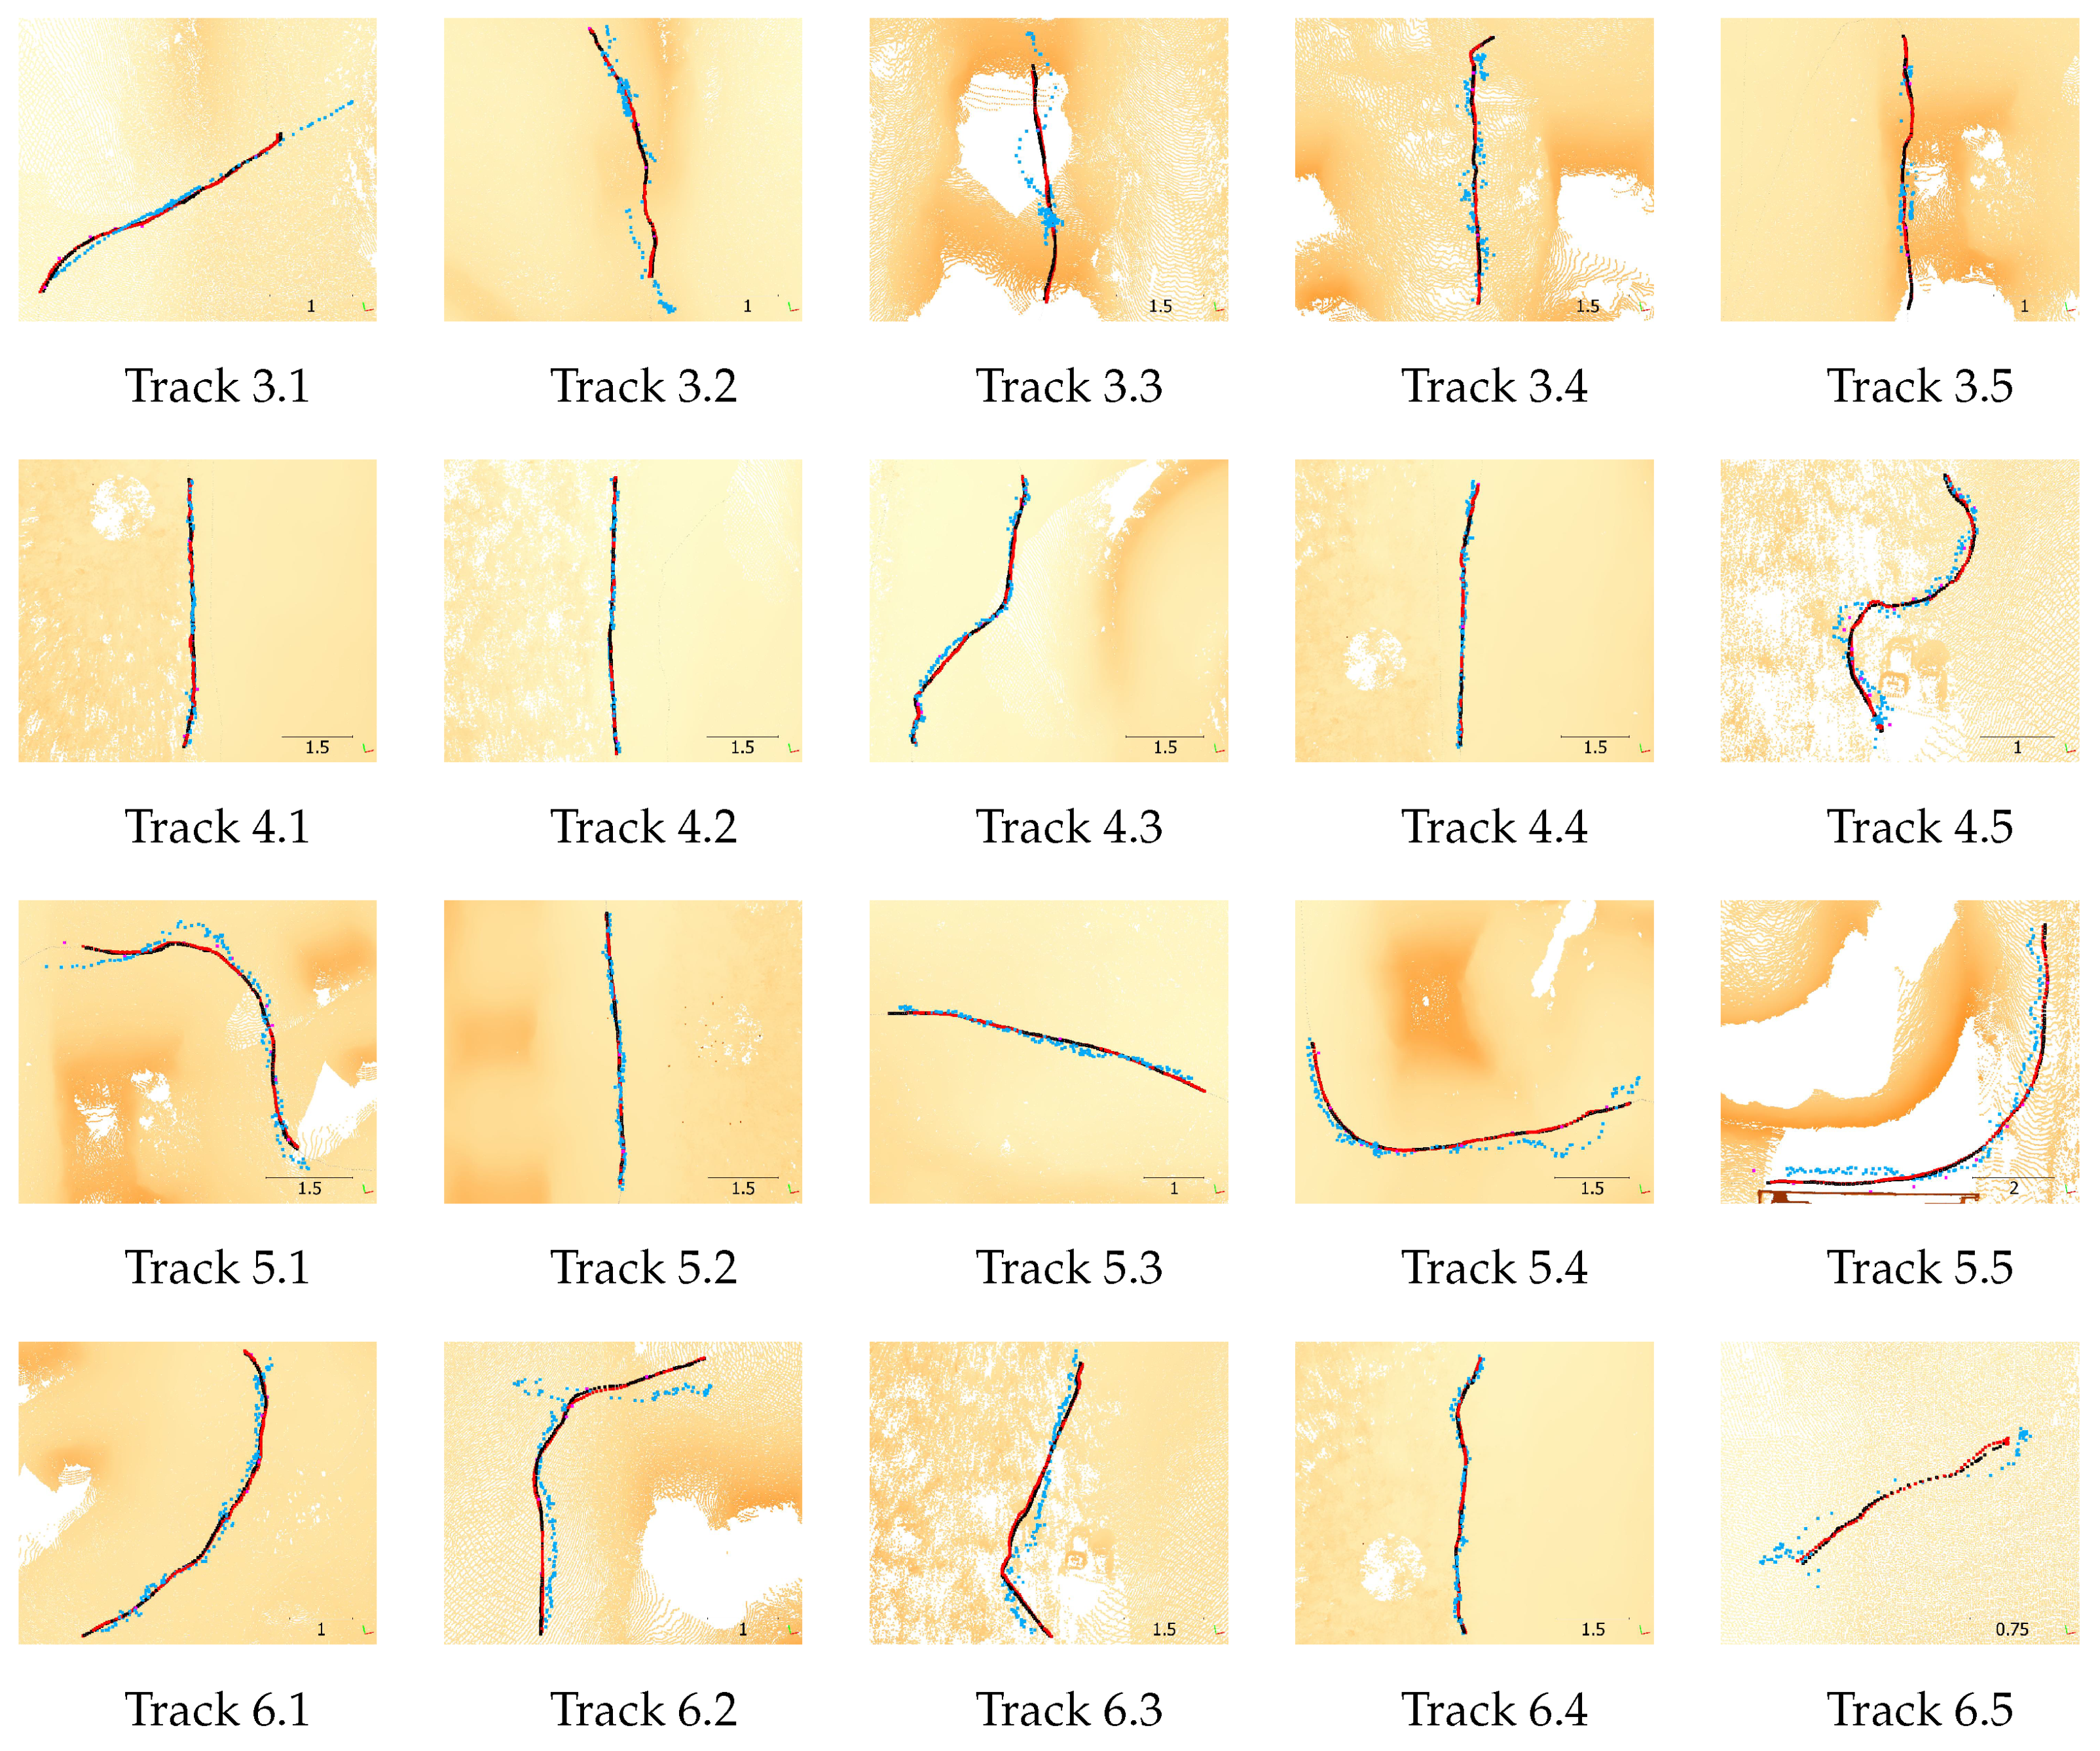
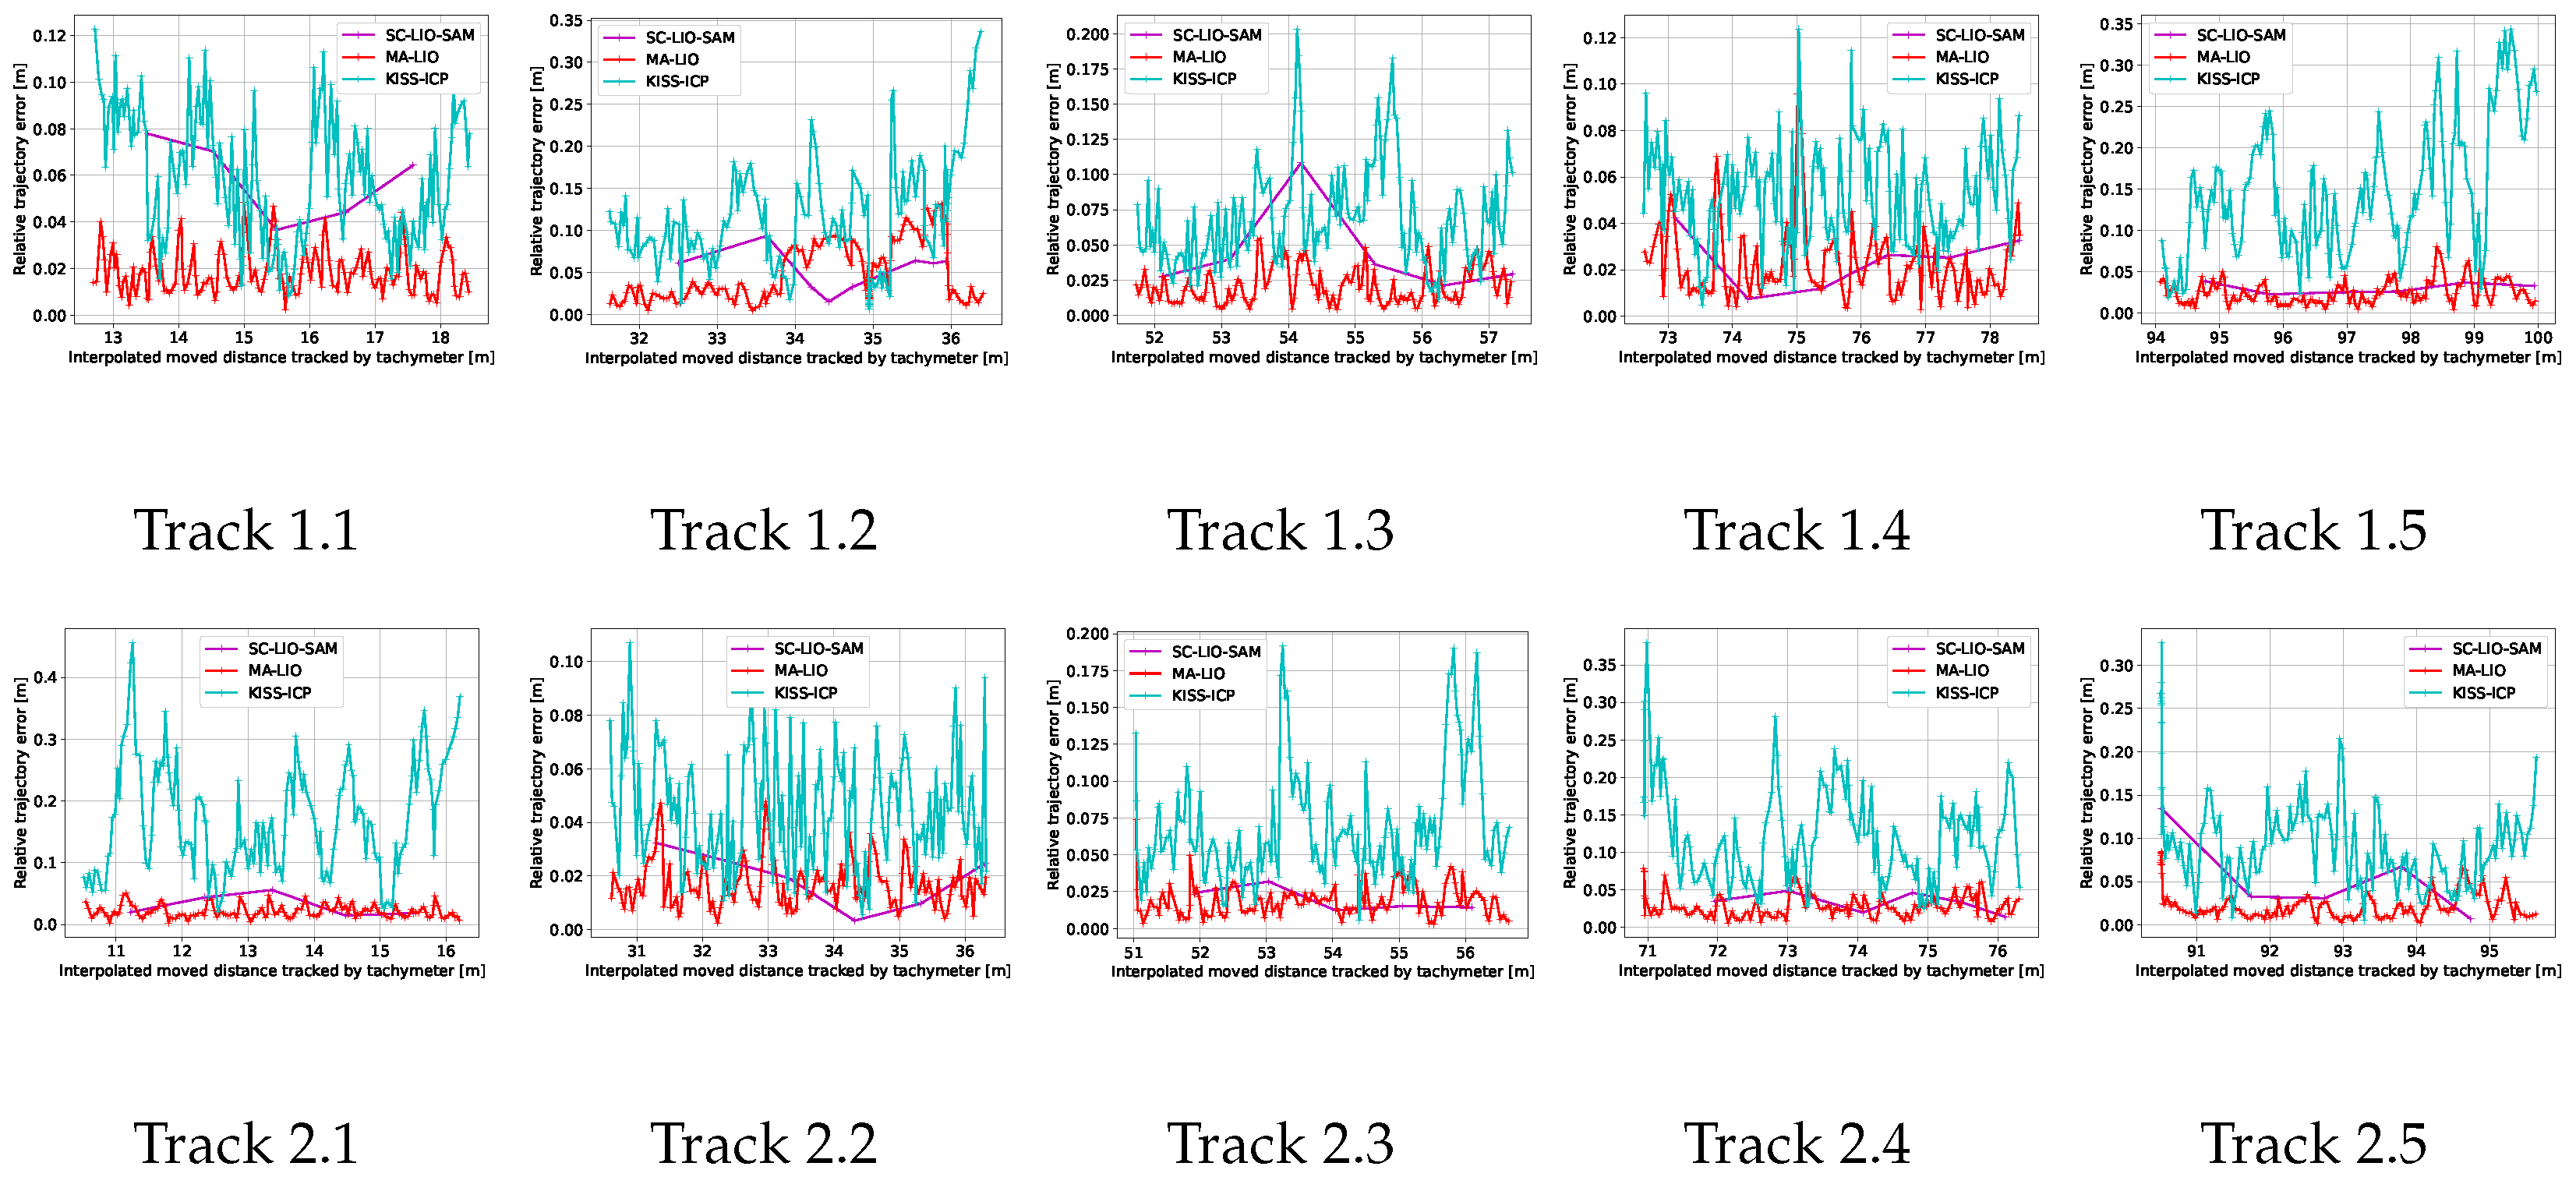
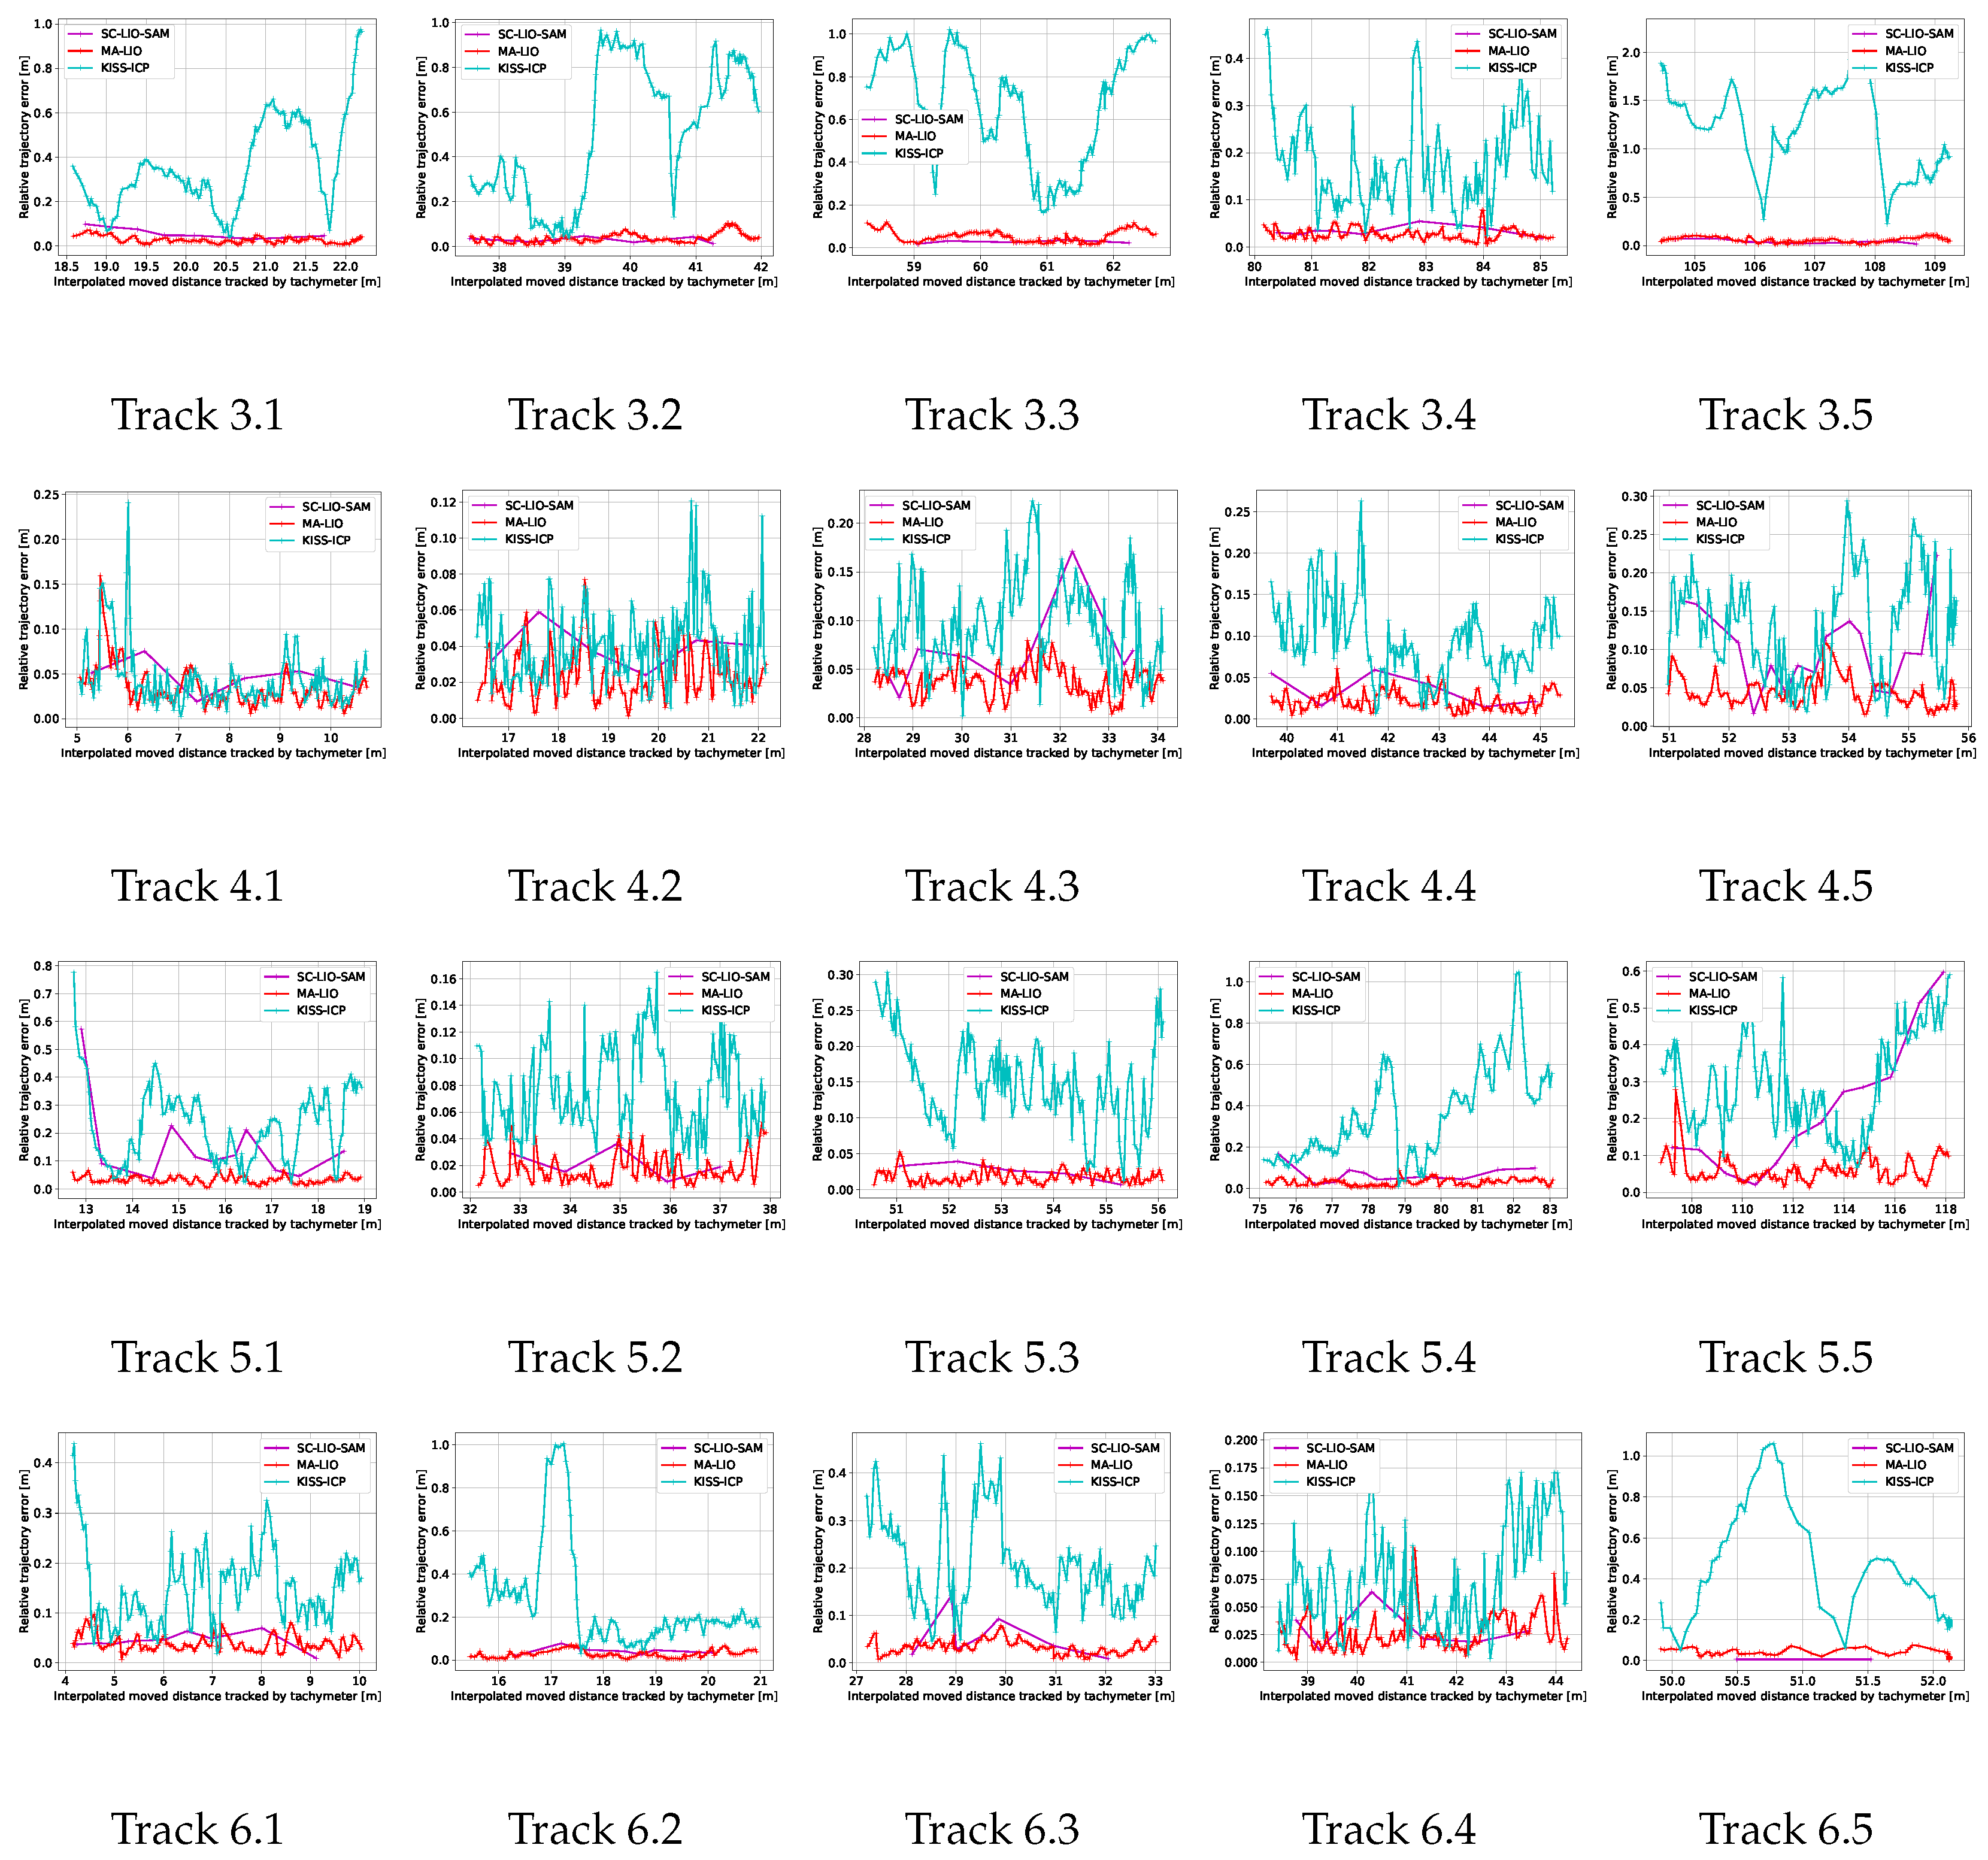
As previously stated, the relative error can give further information on the local SLAM performance. The aligned sub-trajectories for each track and SLAM method are depicted in Figure 9 and for comprehensive visualization, the detailed view of each sub-trajectory is given in Figure 10. Compared to Figure 8, most of the SLAM sub-trajectories are very close to the tachymeter reference trajectory. KISS-ICP shows good performance except from track 3, 4, and 5, which all include hills of the pump track, which cause vibrations and strong roll and pitch changes. The mean relative error is given in Table 2. Moreover, Figure 11 depicts the relative sub-trajectory errors per track for the three different SLAM methods plotted over the distance tracked by the tachymeter. Except for track 3, MA-LIO achieves the best results. MA-LIO is followed by SC-LIO-SAM and KISS-ICP. The relative trajectories are smaller than the absolute trajectory errors. This is due to the fact that even parts of the overall trajectory which are displaced due to a previous drift can locally have low errors compared to the reference trajectory. This relative trajectory error highly depends on the movement of the robot and the local environment acquired during a sub-trajectory. Moreover, for this short sub-trajectory duration, only a few key poses of SC-LIO are included. This decreases the relative error because the alignment using ICP is based on a low number of points compared to MA-LIO and KISS-ICP, which give more pose estimates in between. For KISS-ICP, the relative error is down to 10 cm. This shows that for local mapping or navigation, KISS-ICP could be sufficient.
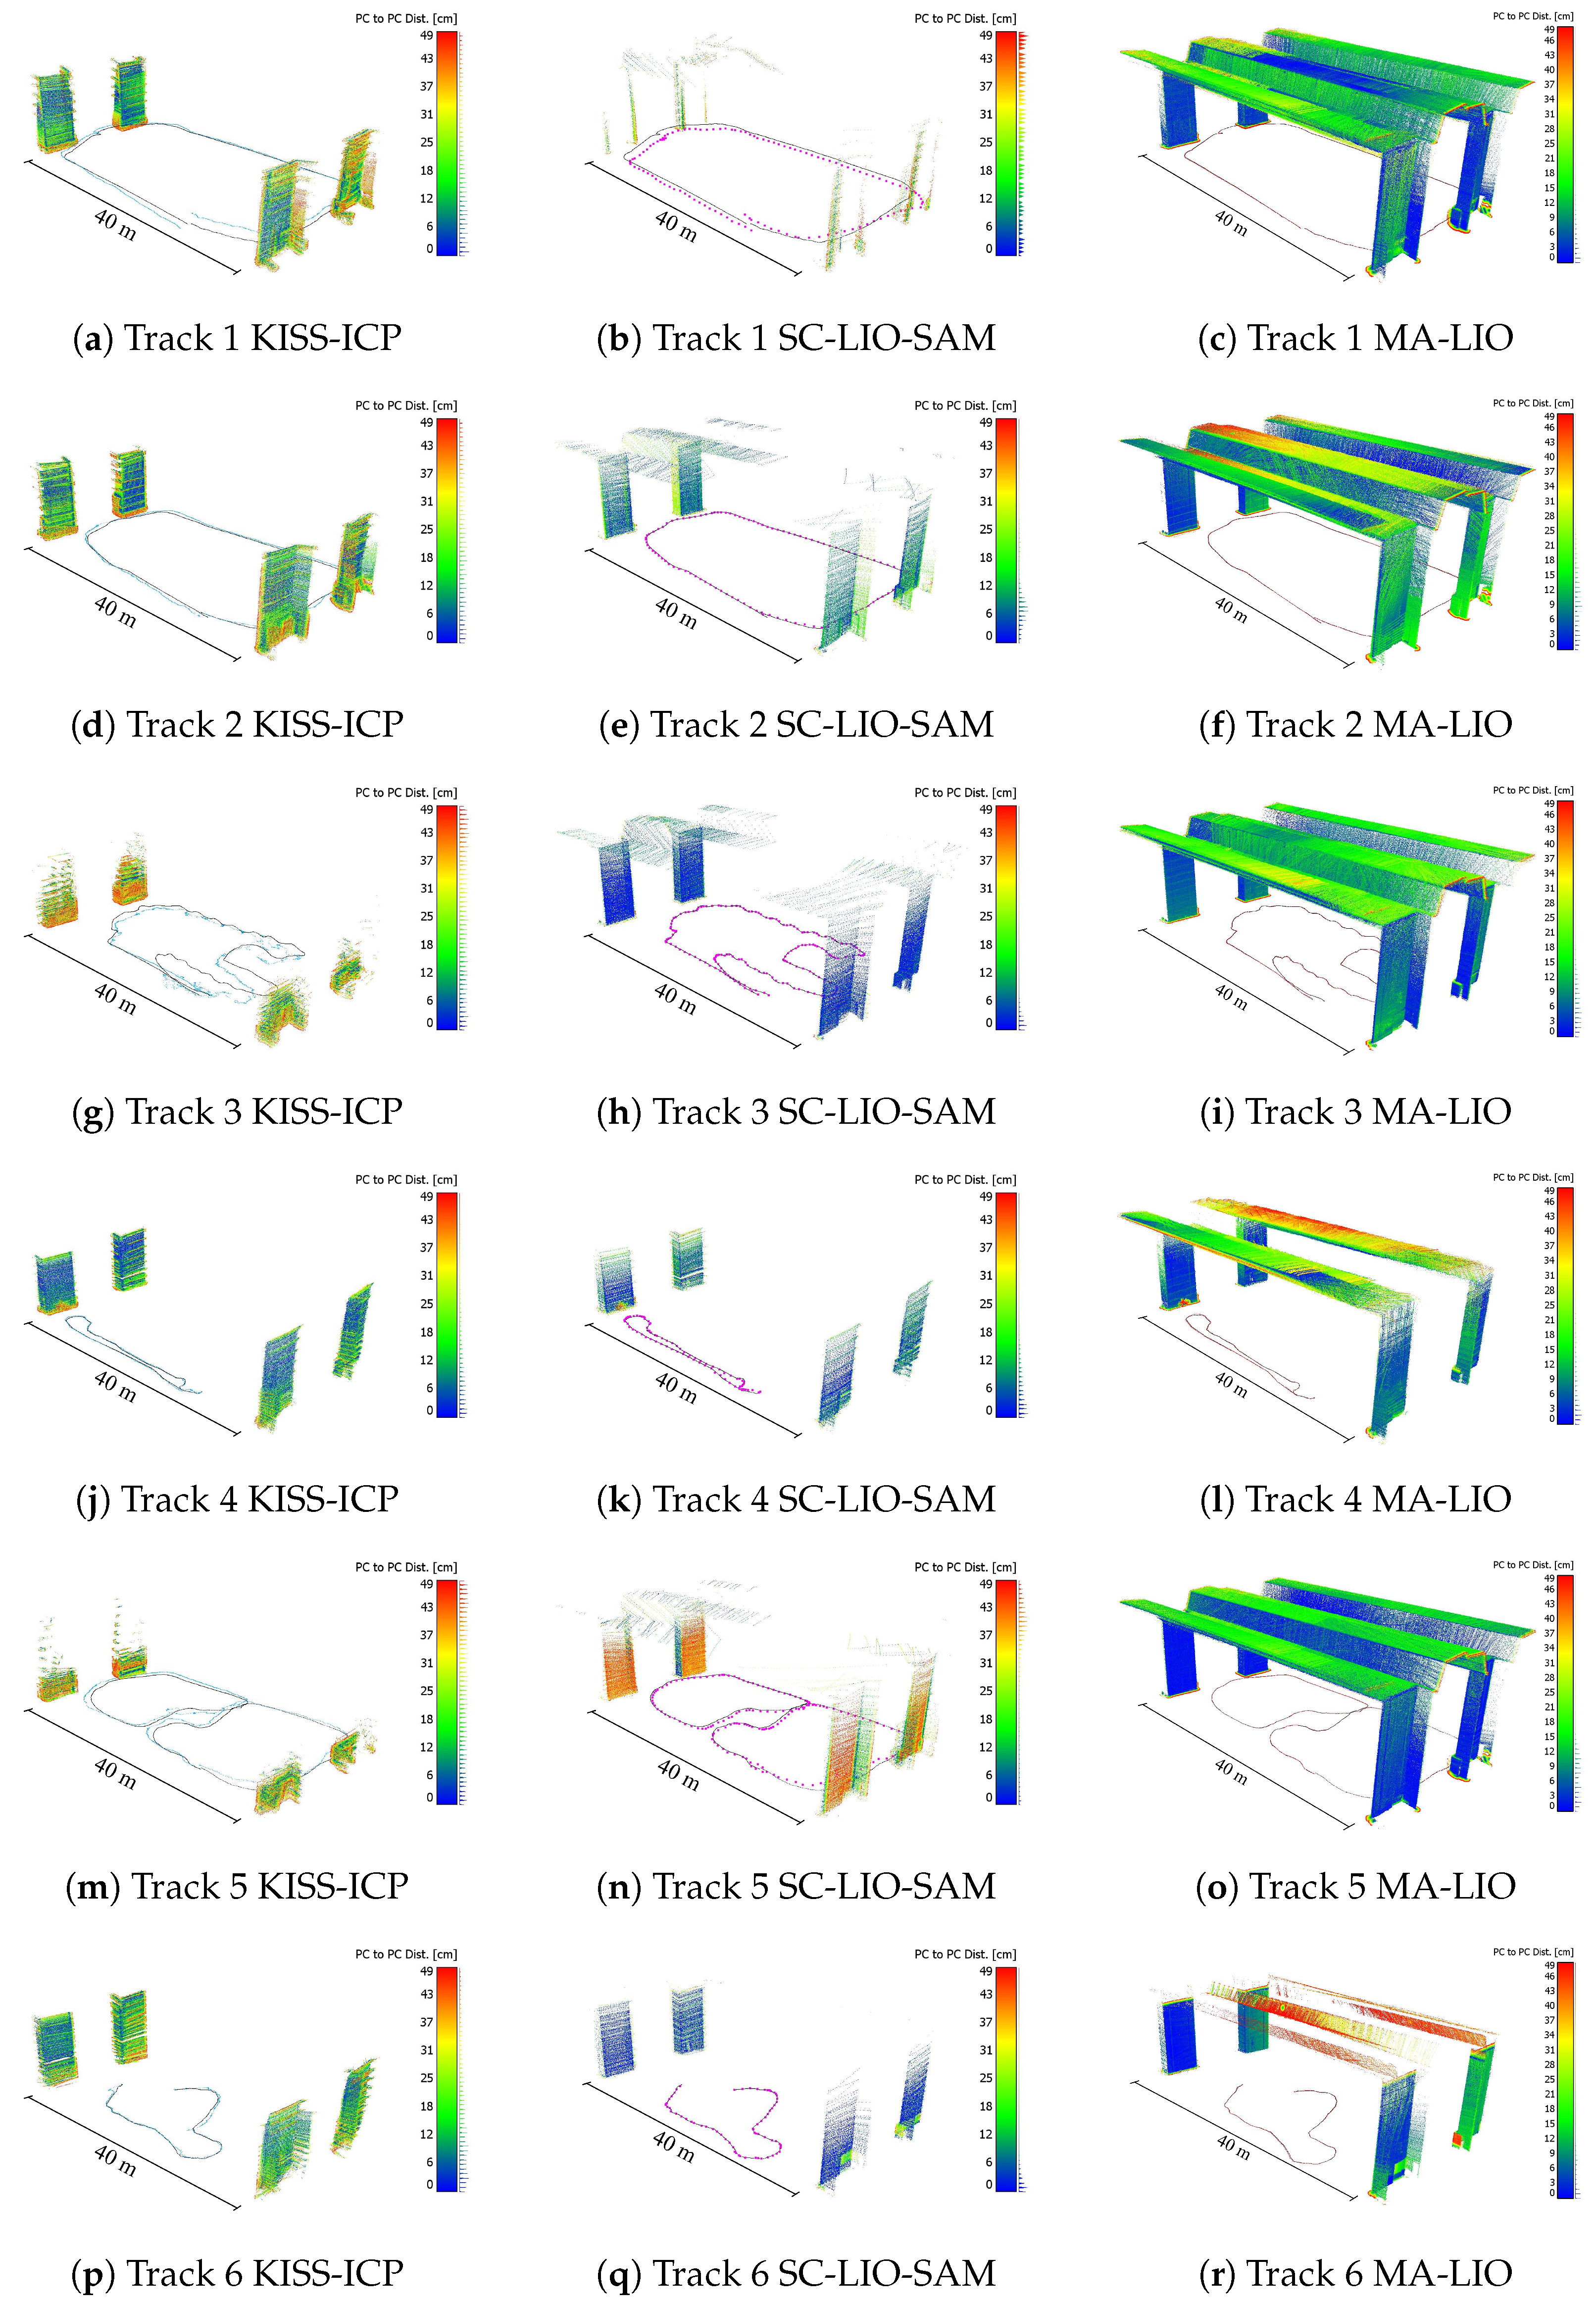
Since the tachymeter trajectory contains only position information, the next results include the distances between the point clouds, which are also a result of orientation errors. The SLAM point clouds with cloud-to-cloud distance as the color scale are shown in Figure 12. The point clouds of KISS-ICP and SC-LIO-SAM mainly cover the bridge piers, since only the horizontal LiDAR is used. Due to slopes and far scanning distances, the ceiling is partially covered by SC-LIO-SAM. KISS-ICP also covers the same areas; however, they are not included in Figure 12, since the errors are bigger than the set threshold of 50 cm. Therefore, this is the first sign that the KISS-ICP trajectory also includes orientation errors. MA-LIO covers most of the bridge underside due to the use of the horizontal and vertical LiDAR sensors. For track 4 and track 6, some areas are missing due to incomplete coverage because of the trajectory and offsets larger than 50 cm. Based on the distribution of distances, as shown in the point clouds and next to the color scale bar in Figure 12, it can be observed that there are multiple layers representing the same surfaces. Those can be partial registration errors or drifts along the trajectory. However, for MA-LIO, the biggest distances are in the ceiling area. To better compare the different results, Table 3 lists the mean cloud-to-cloud distances. It can be observed that they give a similar ranking for each track as the previously discussed trajectory errors listed in Table 1. For track 2, 3, 4, and 6, SC-LIO performs better. However, this can be due to the effect that roll and pitch errors have fewer consequences, since only a few ceiling points are scanned. In summary, the results show superior performance of MA-LIO in four of six test tracks, with 5 to 7 cm RMS trajectory error, followed by SC-LIO-SAM and KISS-ICP in last place. SC-LIO-SAM reaches the lowest point cloud-to-reference point cloud distance in four of six test tracks, with 4 to 12 cm.
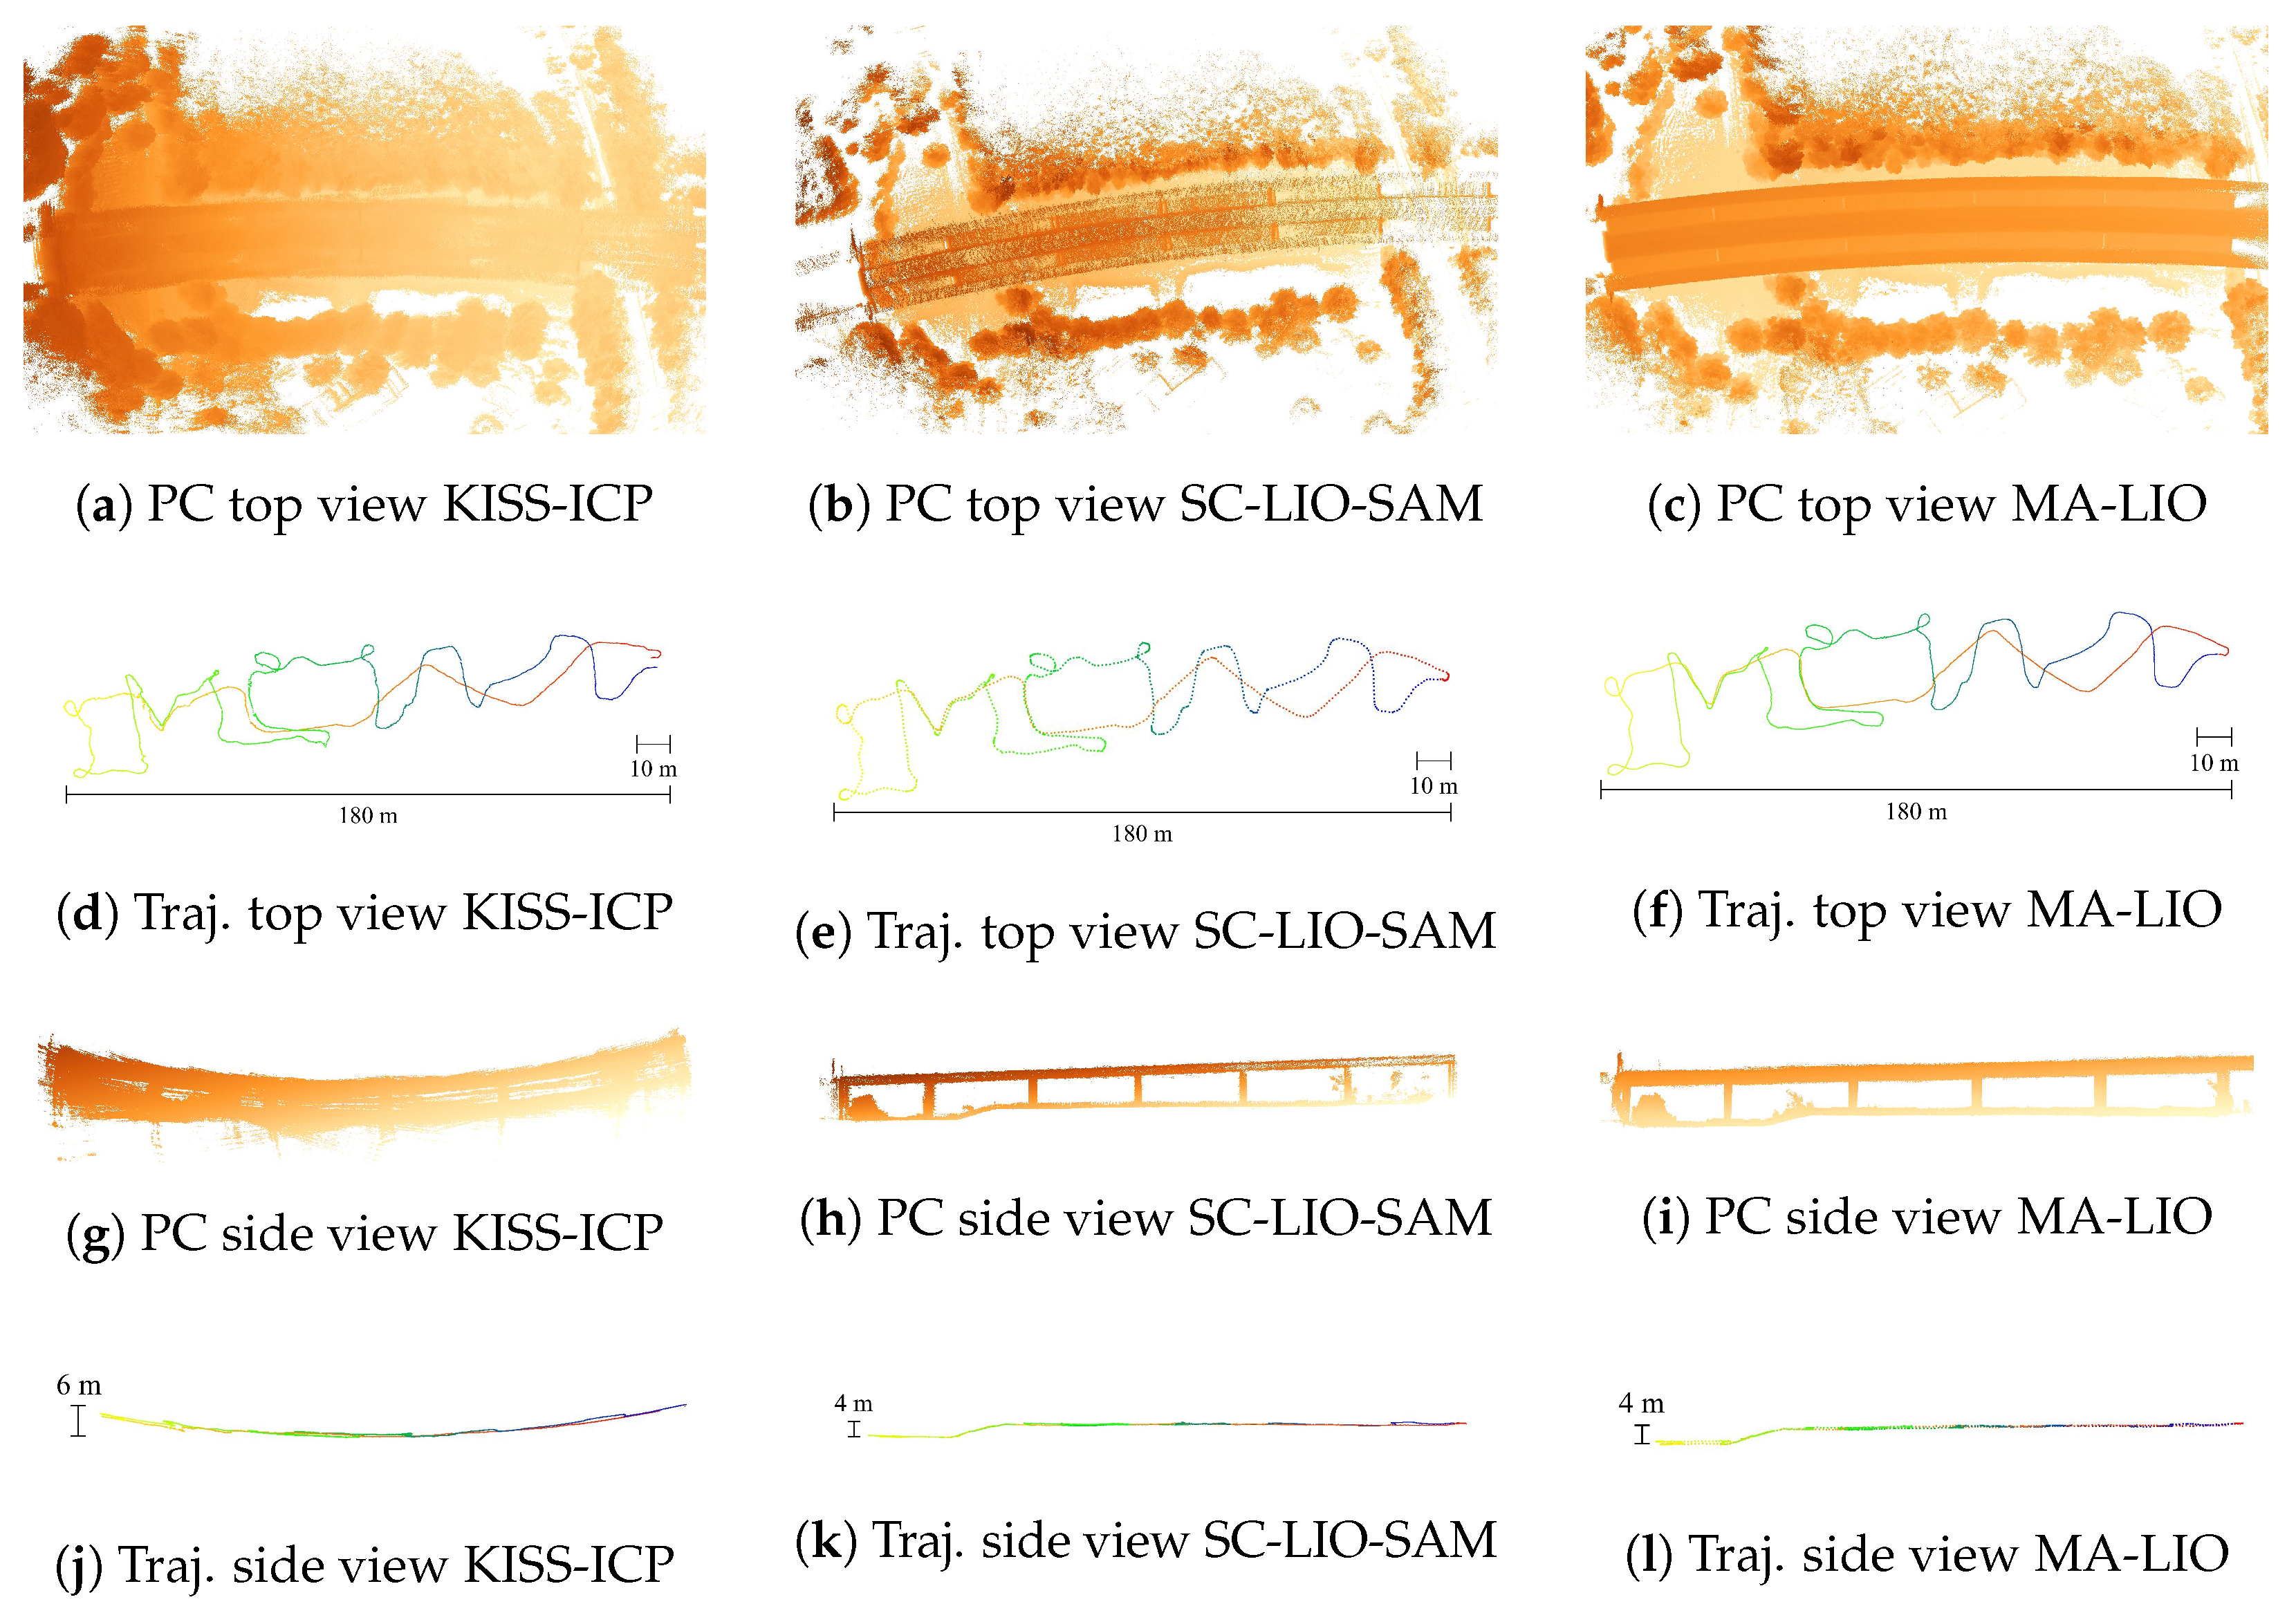
The results of the last test track passing through all test areas are depicted in Figure 13. Running KISS-ICP in real time using the default rosbag play settings led to major divergence and loss of location. Playing the rosbag at half the speed of real time and using a voxel size of 1 m, this problem is partially solved. While the horizontal poses appear to be correct, there is a huge drift in the global vertical component leading to the upward curved point cloud and trajectory data. Moreover, the hill area is not correct. In contrast, SC-LIO-SAM successfully maps the environment without major divergence and even covers big parts of the bridge ceiling. Also, the hill area is mapped correctly. However, for this result, the minimum time between frames used for loop closure is increased in such a way that no loop closure is used. With activated loop closure, two similar sections in the flat area are mistakenly matched. Depending on the minimum searching radius for loop closure, errors occur at different positions. Probably, further parameter adjustments are necessary to make the scan context-based loop closure more stable in case of homogeneous or repeating structures. Even without loop closure, MA-LIO performs best. The straight bridge ceiling indicates correct representation of the environment. Moreover, there are no bigger shifts or rotated frames. Lastly, the start and end positions are almost the same, which was manually controlled during the test drive by parking at the same spot where it started. This shows that good results can be achieved even without loop closure.
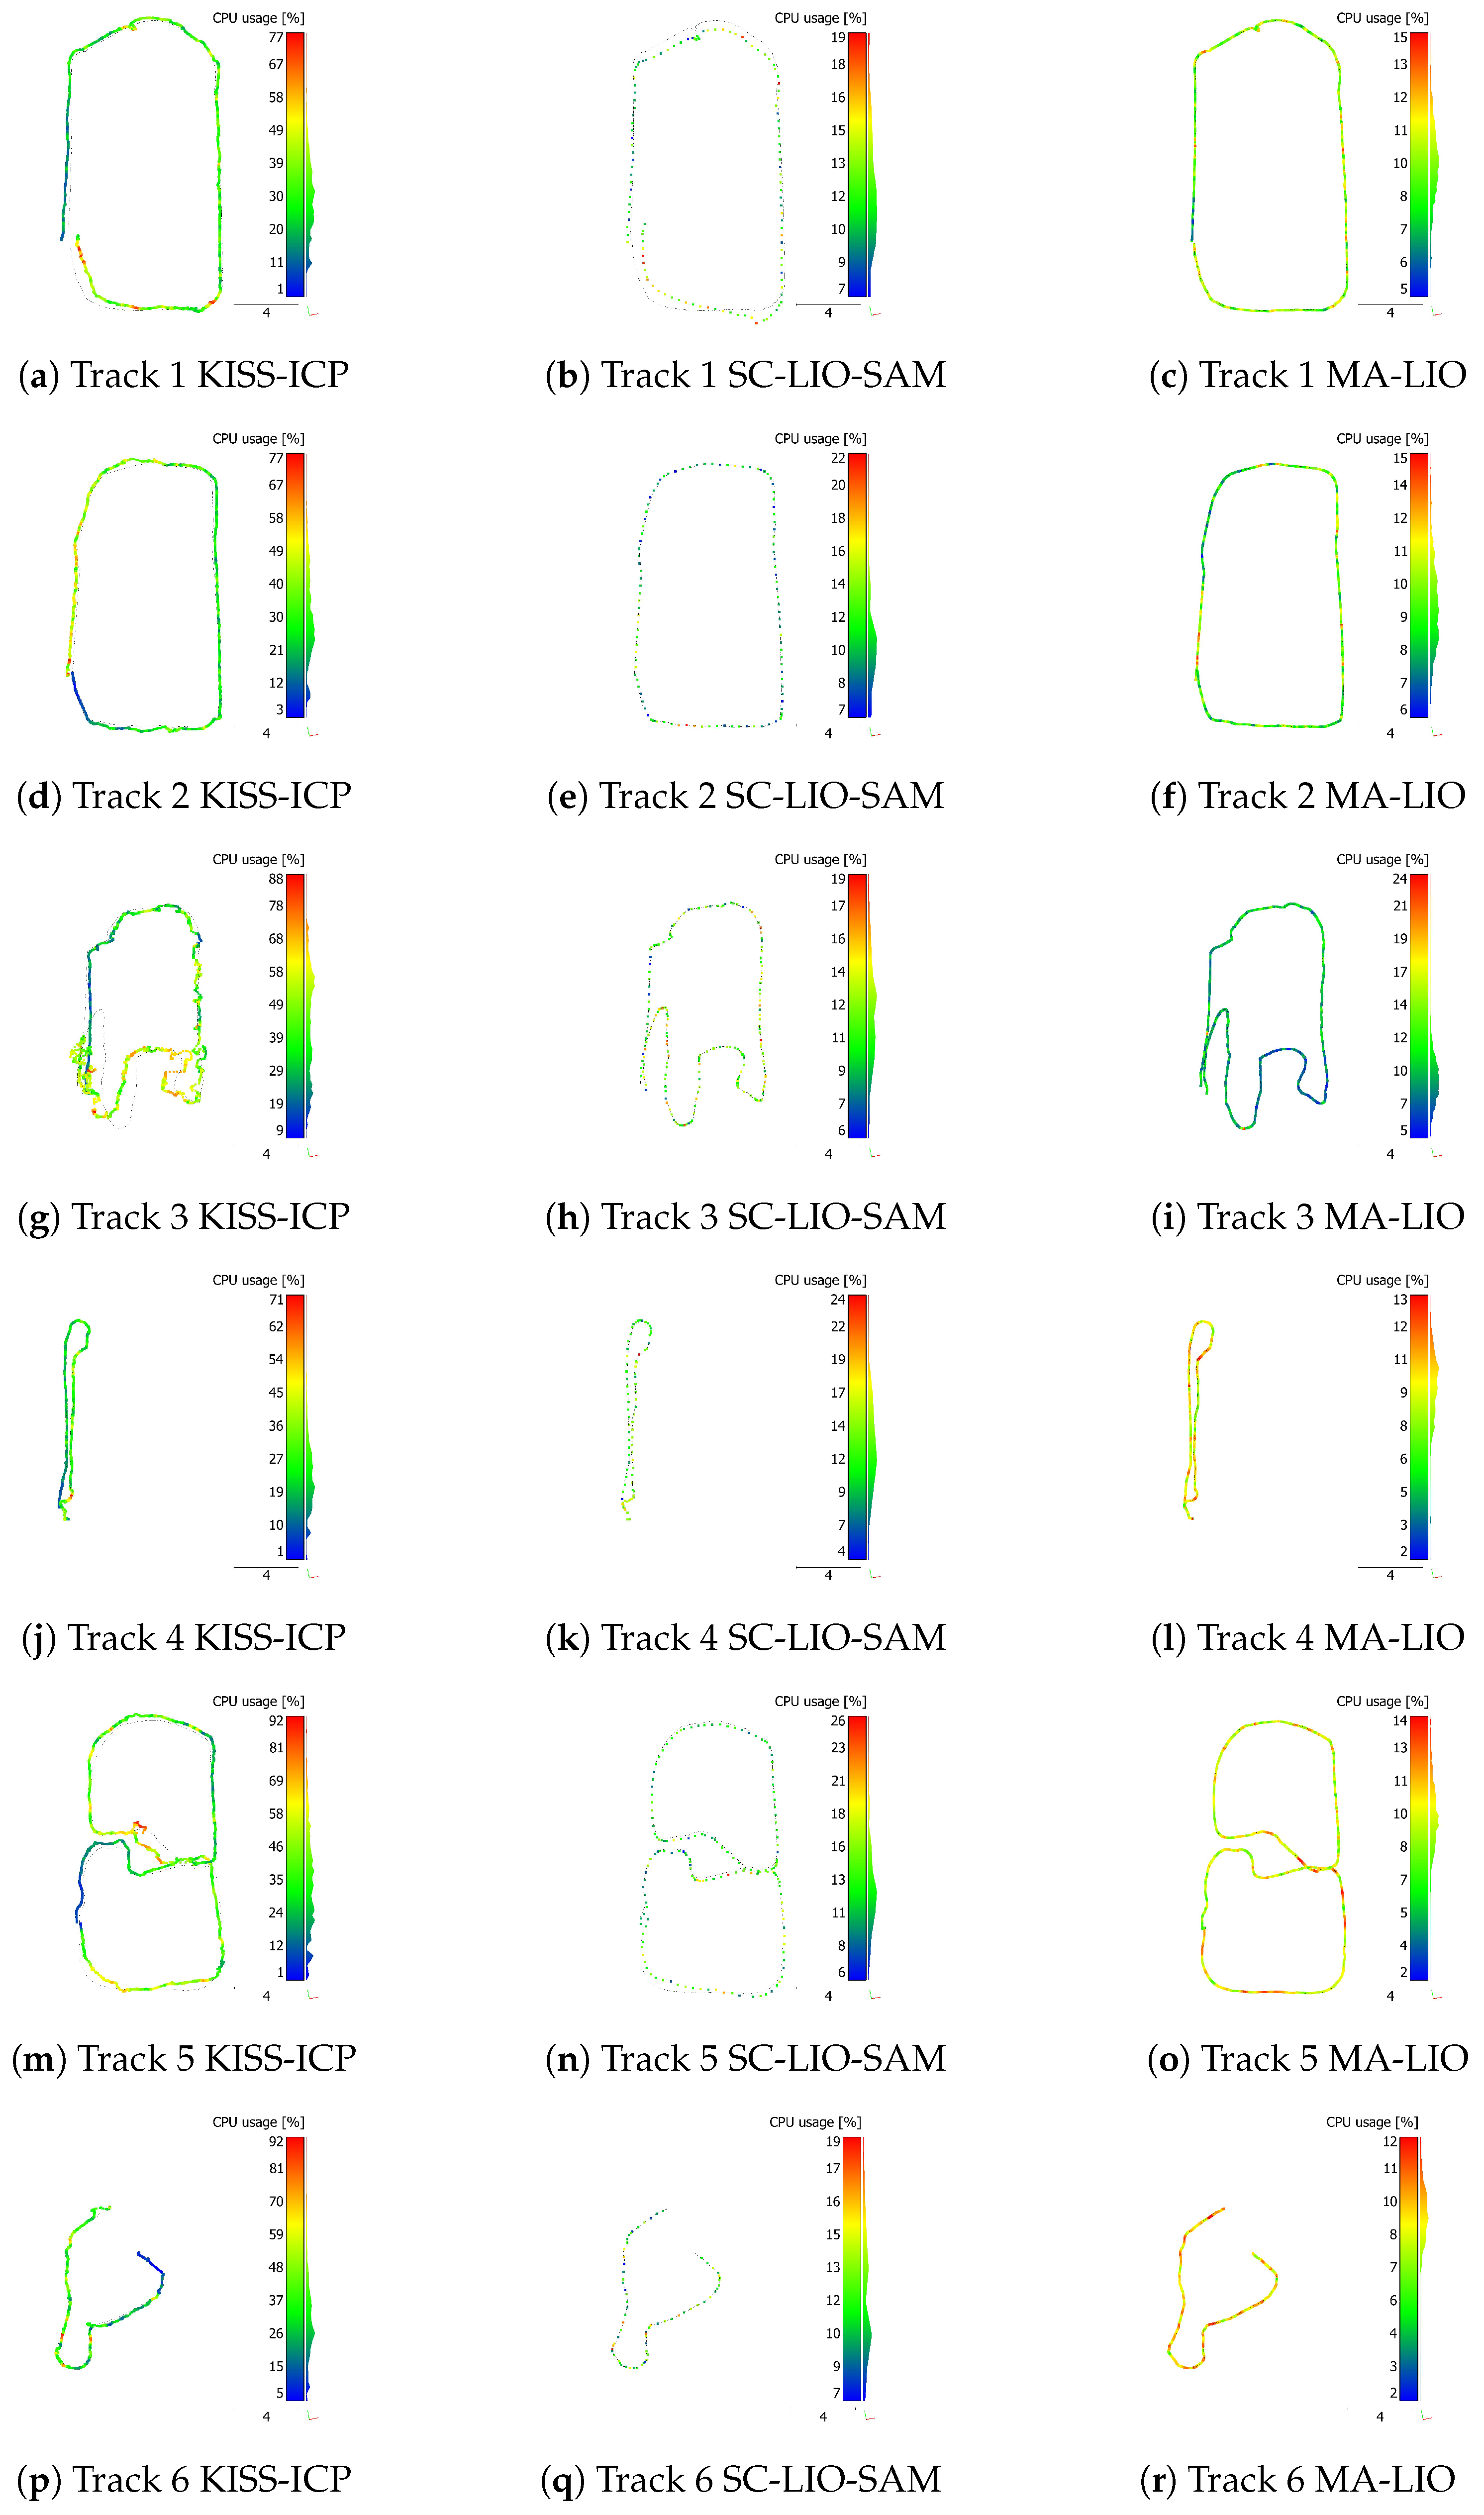
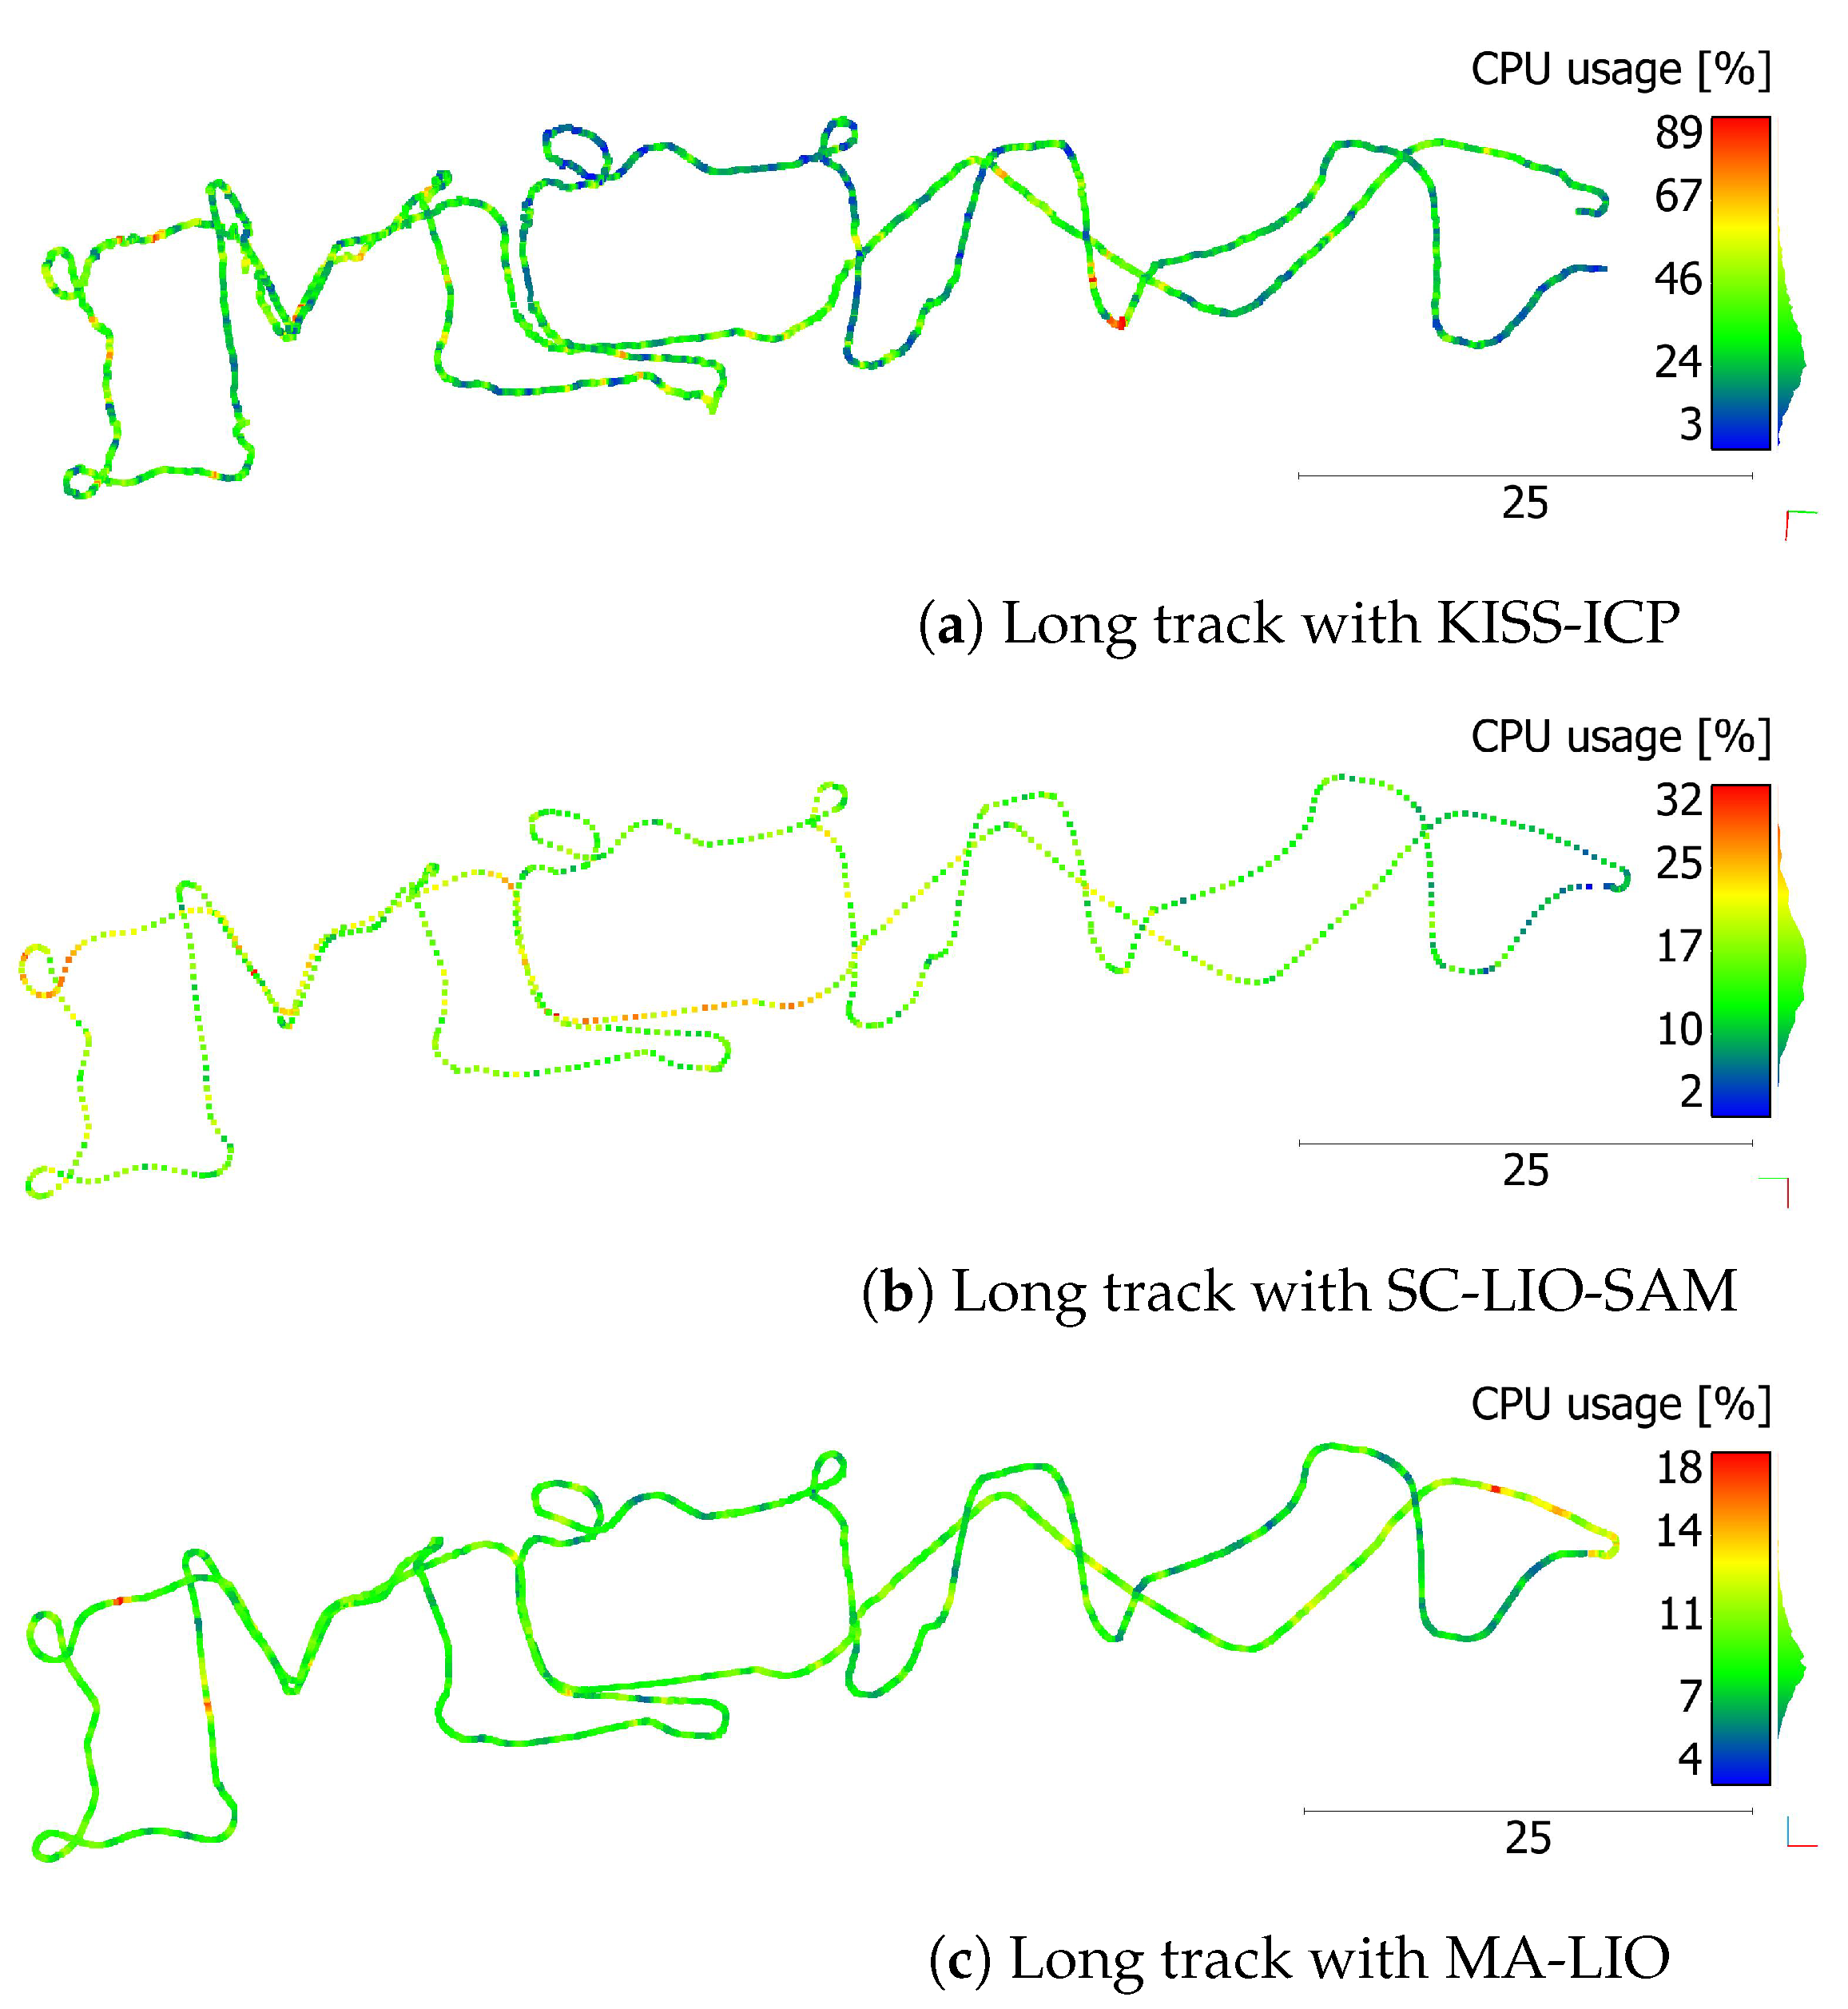
As a final test, the central processing unit (CPU) usage for all trajectories and SLAM methods is depicted in Figure 14 and Figure 15. The visualization shows that the CPU usage is linked to critical areas with larger offsets. The CPU usage of KISS-ICP is relatively high due to the small voxel size of 1 cm for track 1 to track 6. For the long track, it is reduced due to the higher voxel size of 1 m and half the rosbag play speed. Despite the second LiDAR, the CPU usage of MA-LIO is lower than the usage of SC-LIO-SAM.

4. Discussion

4.1. Method

The objective of implementing time synchronization of tachymeter and SLAM trajectory data in post-processing is successfully reached within this work. For all tracks and SLAM algorithms even with key frames only, using the absolute distance to start position is a simple approach for finding the time offset without using features or registration and it is more stable and accurate than using only the beginning and end of the movement. The time synchronization is used for absolute and relative trajectory error calculation. Compared to distance, it is more precise, since it is independent of the temporal resolution of key poses, as used in SC-LIO-SAM. An alternative approach is wireless synchronization between tachymeter and robot or at least synchronizing before starting the measurement. However, the proposed post-processing approach is simple and does not require additional hardware or preparation. One limitation is the visual line of sight, which is required for tracking of the prism. Especially in the case of indoor areas with many rooms and obstacles, the tachymeter will lose the prism. Moreover, the prism should be mounted in such a way that it is always visible. For using SLAM on a UAV, the prism should face downwards if it is tracked from the bottom.
Transforming the reference point cloud into tachymeter coordinates is performed using reference markers. For the SLAM point cloud transformation, the trajectory transformation is used, which is more accurate than detecting reference markers in sparse or noisy SLAM point cloud data. Drawbacks of this method are the need of a tachymeter and that the respective environment must allow tracking of the prism. One solution for areas behind bridge structures could be using the proposed approach only in the visible area where the robot moves in the beginning. These trajectory data can be used for deriving the required transformation. The transformation of the start area can then be applied to the overall trajectory and point cloud data. Additionally, if the trajectory ends within the starting area, a second tracking could be used since the tachymeter coordinates stay the same.
As part of this work, the proposed method is tested on three different algorithms. The gained information on absolute position error, relative error, and cloud-to-cloud distance allows comparing different algorithms or different parameters for the same SLAM approach. The RMS trajectory error and error in mean cloud-to-cloud distance for distances below 50 cm give the same ranking results for all tracks except for track 2 and track 4, where SC-LIO-SAM performs better.
Although this is not part of this work, the proposed synchronization method can be used to enhance the total accuracy by fusing the position information given by the tachymeter and the orientation information of the SLAM for enhanced mapping results in post-processing. In particular, SC-LIO-SAM which allows GNNS input could be replaced by the tachymeter information.

4.2. Test Environment

Using a pump track as a test scenario has shown to be a good way of testing SLAM when using a UGV to include more height and rotational variations. The second LiDAR sensor used for MA-LIO was expected to give better results than SC-LIO-SAM, especially on track 3, including strong height variations. However, the RMS trajectory error and the mean point cloud-to-reference point cloud distance is slightly bigger. As already stated in Section 3, this might be due to the ceiling area where roll and pitch errors have a big effect due to long distances and a bigger surface than the bridge piers. For SC-LIO, there are fewer consequences due to using only the horizontal LiDAR sensor. Moreover, the lack of loop closure can lead to multiple scanned layers of the same surface in MA-LIO. For track 1, the second LiDAR might have helped to overcome the narrow area with the limited field of view of the horizontal LiDAR. Moreover, for track 5 with the figure eight including hills and a change in direction of rotation, it obtains the best results, which could be due to more context because of the second LiDAR sensor. This outcome supports the statement of the study of Xiao et al. [13] where the second LiDAR reduced errors in staircases in indoor areas. It must be mentioned that the absolute and relative errors derived using the proposed method are dependent on the selected bridge scenario, the SLAM algorithm parameters, and the driven trajectories. For other scenarios, the absolute and relative performance can be different. This must be further studied in a variety of scenarios, which is possible using the proposed method.

4.3. Sensor Selection

Within this study, only the VLP16 LiDAR sensor with a vertical FoV of 30 with 16 scanning lines is used. For more context and resolution, there are other sensors with up to 90 FoV and up to 128 channels. In particular, single-LiDAR algorithms like SC-LIO-SAM and KISS-ICP could benefit. It is expected that the drift of KISS-ICP in the hill area could be reduced. However, it will not replace the big advantage of an IMU. Applying the proposed methods to other sensor configurations including the variation in the number and the relative orientation and distance of multiple LiDAR sensors is part of future work.

4.4. Contributions

The proposed SLAM evaluation method has several advantages over existing methods. Most ground truth data in GNSS-denied areas are usually not time-synchronized, since either checkpoints or ICP without correspondence are used. The latter can lead to the following problems. The evaluated absolute error can be smaller than the actual error of time-corresponding positions. Furthermore, selecting sub-trajectories for the evaluation of the relative trajectory error based on traveled distance is critical when comparing SLAM methods using different pose frequencies due to key frame settings. The traveled distance is shorter for more distant key frames and longer if the positions, derived using a SLAM method, jump. This problem can be amplified in the case of omni-directional movements due to vibrations as a result of uneven terrain for UGVs, windy conditions for UAVs, and complex trajectories in small or medium-sized environments required for inspection tasks or full-coverage and high-resolution mapping tasks.
Using time correspondence for registration gives more precise information on the actual absolute and relative position error. Creating time-synchronized ground truth data with millimeter accuracy is most easily possible using an external tracking system. In the case of a tachymeter, Thalmann and Neuner [34] use wireless communication with the robot and reach sub-millisecond synchronization. As part of this work, a post-processing method for time synchronization with millimeter accuracy is proposed which is independent of the used tracking system and does not require wireless communication. By optimizing the absolute distance from the trajectory start to each trajectory position using a sliding time window approach, the point-to-point distances are not optimized, but a single time offset is derived which can be used for time synchronization. The proposed time synchronization method is successfully used in this work for evaluating multiple different SLAM methods for multiple trajectories driven on uneven terrain.
Apart from the time synchronization method, this work analyzes different SLAM methods based on a LiDAR sensor with and without IMU and the effect of an additional tilted LiDAR sensor acquiring data of the bridge ceiling and higher parts of the bridge piers. Previous results of Xiao et al. [13], showing the advantages of a dual-LiDAR system in indoor scenes, are confirmed as part of this work. Most research on multi-LiDAR system configurations is conducted in the field of autonomous driving for road scenarios [35,36]. However, also for other scenarios, this is crucial due to the increasing use of multi-LiDAR systems in recent works [14,37,38]. By using the proposed time synchronization method, more combinations of different FOVs, scanning lines, and spatial alignments for different platforms can be tested using the benefits of time correspondence in GNSS-denied areas. More complex environments, like forests with occlusions due to trees or indoor environments with many obstacles, require more complex ground truth creation, as proposed by Li et al. [32] for their helmet laser scanning dataset.

4.5. Future Work

The future work will contain further study and integration of SLAM on different autonomous mobile platforms. This will include the study of different commercially available LiDAR sensors and LiDAR sensors manufactured at Fraunhofer IPM. The use or combination with visual SLAM and the integration on UAVs is also of research interest. Furthermore, multi-SLAM to solve SLAM on multiple platforms in real time, and multi-session SLAM, which is important for UAVs with limited flight time, requiring multiple flights, are further studied. The final goal is the autonomous navigation of multiple mobile platforms based on (Multi-) SLAM for full-coverage and high-quality mapping of complex engineering structures and real-time damage detection.

5. Conclusions

As part of this work, a time synchronization method based on the absolute distance between start position and current position and a sliding time window approach is presented, which was not used in previous works. It allows ICP with time correspondence for enhanced absolute and relative error evaluation without the need of implementing wireless synchronization between robot and tachymeter. Moreover, it is not limited to a tachymeter but it can be used with all tracking systems. Moreover, the evaluation of three already existing different SLAM methods using LiDAR with and without IMU and an option using an additional tilted LiDAR sensor in a GNSS-denied area with homogenous and repeating structures and uneven terrain was conducted. The results show superior performance of the dual-LiDAR system regarding absolute and relative trajectory error. Lastly, the proposed evaluation method using a tachymeter and time synchronization in post-processing shall motivate the robotic community to create more datasets with ground truth in GNSS-denied areas to test SLAM methods using different LiDAR systems and the effect of different multi-LiDAR configurations.

Author Contributions

Conceptualization, D.M.; methodology, D.M.; software, D.M.; validation, D.M.; formal analysis, D.M.; investigation, D.M.; resources, D.M.; data curation, D.M. and A.R.; writing—original draft preparation, D.M.; writing—review and editing, D.M.; visualization, D.M.; supervision, A.R.; All authors have read and agreed to the published version of the manuscript.

Funding

This research is part of the Fraunhofer project “Ganzheitliches Verfahren für eine nachhaltige, modulare und zirkuläre Gebäudesanierung—BAU-DNS”.

Data Availability Statement

Data supporting the findings of this study are available from the corresponding author upon reasonable request.

Acknowledgments

We thank Rahul Hegde for supporting the test measurements and the point cloud export for KISS-ICP.

Conflicts of Interest

The authors declare no conflict of interest.

References

  1. DIN 1076:1999-11; Engineering Structures in Connection with Roads—Inspection and Test. DIN: Berlin, Germany, 1999. [CrossRef]
  2. Vierhub-Lorenz, V.; Werner, C.; Olshausen, P.V.; Reiterer, A. Towards Automating Tunnel Inspections with Optical Remote Sensing Techniques. Allg.-Vermess.-Nachrichten AVN 2023, 130, 35–41. [Google Scholar]
  3. Aponte, J.; Meng, X.; Moore, T.; Hill, C.; Burbidge, M. Evaluating the Performance of NRTK GPS Positioning for Land Navigation Applications. In Proceedings of the Royal Institute of Navigation NAV08 and International Loran Association ILA37, London, UK, 28–30 October 2008. [Google Scholar]
  4. Charron, N.; McLaughlin, E.; Phillips, S.; Goorts, K.; Narasimhan, S.; Waslander, S.L. Automated Bridge Inspection Using Mobile Ground Robotics. J. Struct. Eng. 2019, 145, 04019137. [Google Scholar] [CrossRef]
  5. Montes, K.; Al Deen Taher, S.S.; Dang, J.; Chun, P.-J. Semi-autopilot UAV flight path control for bridge structural health monitoring under GNSS-denied environment. Artif. Intell. Data Sci. 2021, 2, 19–26. [Google Scholar] [CrossRef]
  6. Pany, T.; Eissfeller, B. Use of a Vector Delay Lock Loop Receiver for GNSS Signal Power Analysis in Bad Signal Conditions. In Proceedings of the 2006 IEEE/ION Position, Location, And Navigation Symposium, Coronado, CA, USA, 25–27 April 2006; pp. 893–903. [Google Scholar]
  7. Sivaneri, V.O.; Gross, J.N. UGV-to-UAV cooperative ranging for robust navigation in GNSS-challenged environments. Aerosp. Sci. Technol. 2017, 71, 245–255. [Google Scholar] [CrossRef]
  8. Abaspur Kazerouni, I.; Fitzgerald, L.; Dooly, G.; Toal, D. A survey of state-of-the-art on visual SLAM. Expert Syst. Appl. 2022, 205, 117734. [Google Scholar] [CrossRef]
  9. Chen, W.; Shang, G.; Ji, A.; Zhou, C.; Wang, X.; Xu, C.; Li, Z.; Hu, K. An Overview on Visual SLAM: From Tradition to Semantic. Remote Sens. 2022, 14, 3010. [Google Scholar] [CrossRef]
  10. Macario Barros, A.; Michel, M.; Moline, Y.; Corre, G.; Carrel, F. A Comprehensive Survey of Visual SLAM Algorithms. Robotics 2022, 11, 24. [Google Scholar] [CrossRef]
  11. Shan, T.; Englot, B.; Meyers, D.; Wang, W.; Ratti, C.; Rus, D. LIO-SAM: Tightly-coupled Lidar Inertial Odometry via Smoothing and Mapping. arXiv 2007, arXiv:2007.00258. [Google Scholar]
  12. Kim, G.; Kim, A. Scan Context: Egocentric Spatial Descriptor for Place Recognition within 3D Point Cloud Map. In Proceedings of the 2018 IEEE/RSJ International Conference on Intelligent Robots and Systems (IROS), Madrid, Spain, 1–5 October 2018; pp. 4802–4809. [Google Scholar] [CrossRef]
  13. Xiao, K.; Yu, W.; Liu, W.; Qu, F.; Ma, Z. High-Precision SLAM Based on the Tight Coupling of Dual Lidar Inertial Odometry for Multi-Scene Applications. Appl. Sci. 2022, 12, 939. [Google Scholar] [CrossRef]
  14. Jung, M.; Jung, S.; Kim, A. Asynchronous Multiple LiDAR-Inertial Odometry using Point-wise Inter-LiDAR Uncertainty Propagation. arXiv 2023, arXiv:2305.16792. [Google Scholar] [CrossRef]
  15. Vizzo, I.; Guadagnino, T.; Mersch, B.; Wiesmann, L.; Behley, J.; Stachniss, C. KISS-ICP: In Defense of Point-to-Point ICP—Simple, Accurate, and Robust Registration If Done the Right Way. arXiv 2022, arXiv:2209.15397. [Google Scholar] [CrossRef]
  16. Rizk, M.; Mroue, A.; Farran, M.; Charara, J. Real-Time SLAM Based on Image Stitching for Autonomous Navigation of UAVs in GNSS-Denied Regions. In Proceedings of the 2020 2nd IEEE International Conference on Artificial Intelligence Circuits and Systems (AICAS), Genova, Italy, 31 August–2 September 2020; pp. 301–304. [Google Scholar] [CrossRef]
  17. Chen, Z.; Xu, A.; Sui, X.; Wang, C.; Wang, S.; Gao, J.; Shi, Z. Improved-UWB/LiDAR-SLAM Tightly Coupled Positioning System with NLOS Identification Using a LiDAR Point Cloud in GNSS-Denied Environments. Remote Sens. 2022, 14, 1380. [Google Scholar] [CrossRef]
  18. Saleh, I.; Rahiman, W. A Review of Recent Mobile Robot Application Using V-SLAM in GNSS-Denied Environment. In Proceedings of the 11th International Conference on Robotics, Vision, Signal Processing and Power Applications, Penang, Malaysia, 5–6 April 2021; Springer: Singapore, 2022; pp. 325–330. [Google Scholar] [CrossRef]
  19. Jang, K.W.; Jeong, W.J.; Kang, Y. Development of a GPU-Accelerated NDT Localization Algorithm for GNSS-Denied Urban Areas. Sensors 2022, 22, 1913. [Google Scholar] [CrossRef] [PubMed]
  20. Petrakis, G.; Partsinevelos, P. Precision mapping through an RGB-Depth camera and deep learning. AGILE GISci. Ser. 2022, 3, 52. [Google Scholar] [CrossRef]
  21. Dai, Z.; Zhai, C.; Li, F.; Chen, W.; Zhu, X.; Feng, Y. Deep-Learning-Based Scenario Recognition With GNSS Measurements on Smartphones. IEEE Sens. J. 2023, 23, 3776–3786. [Google Scholar] [CrossRef]
  22. Antonopoulos, A.; Lagoudakis, M.G.; Partsinevelos, P. A ROS Multi-Tier UAV Localization Module Based on GNSS, Inertial and Visual-Depth Data. Drones 2022, 6, 135. [Google Scholar] [CrossRef]
  23. An, Y.; Shi, J.; Gu, D.; Liu, Q. Visual-LiDAR SLAM Based on Unsupervised Multi-channel Deep Neural Networks. Cogn. Comput. 2022, 14, 1496–1508. [Google Scholar] [CrossRef]
  24. Liu, Q.; Li, R.; Hu, H.; Gu, D. Using Unsupervised Deep Learning Technique for Monocular Visual Odometry. IEEE Access 2019, 7, 18076–18088. [Google Scholar] [CrossRef]
  25. Zhou, T.; Brown, M.; Snavely, N.; Lowe, D.G. Unsupervised Learning of Depth and Ego-Motion from Video. arXiv 2017, arXiv:1704.07813. [Google Scholar]
  26. Li, R.; Wang, S.; Gu, D. DeepSLAM: A Robust Monocular SLAM System with Unsupervised Deep Learning. IEEE Trans. Ind. Electron. 2021, 68, 3577–3587. [Google Scholar] [CrossRef]
  27. Li, R.; Wang, S.; Long, Z.; Gu, D. UnDeepVO: Monocular Visual Odometry Through Unsupervised Deep Learning. arXiv 2018, arXiv:1709.06841. [Google Scholar]
  28. Reitbauer, E.; Schmied, C.; Theurl, F.; Wieser, M. LIWO-SLAM: A LiDAR, IMU, and Wheel Odometry Simultaneous Localization and Mapping System for GNSS-Denied Environments Based on Factor Graph Optimization. In Proceedings of the 36th International Technical Meeting of the Satellite Division of The Institute of Navigation, Denver, CO, USA, 11–15 September 2023; pp. 1669–1683. [Google Scholar] [CrossRef]
  29. Abdelaziz, N.; El-Rabbany, A. INS/LIDAR/Stereo SLAM Integration for Precision Navigation in GNSS-Denied Environments. Sensors 2023, 23, 7424. [Google Scholar] [CrossRef] [PubMed]
  30. Sier, H.; Li, Q.; Yu, X.; Peña Queralta, J.; Zou, Z.; Westerlund, T. A Benchmark for Multi-Modal LiDAR SLAM with Ground Truth in GNSS-Denied Environments. Remote Sens. 2023, 15, 3314. [Google Scholar] [CrossRef]
  31. Filip, I.; Pyo, J.; Lee, M.; Joe, H. Lidar SLAM Comparison in a Featureless Tunnel Environment. In Proceedings of the 2022 22nd International Conference on Control, Automation and Systems (ICCAS), Busan, Republic of Korea, 27 November–1 December 2022; pp. 1648–1653. [Google Scholar] [CrossRef]
  32. Li, J.; Wu, W.; Yang, B.; Zou, X.; Yang, Y.; Zhao, X.; Dong, Z. WHU-Helmet: A Helmet-Based Multisensor SLAM Dataset for the Evaluation of Real-Time 3-D Mapping in Large-Scale GNSS-Denied Environments. IEEE Trans. Geosci. Remote Sens. 2023, 61, 1–16. [Google Scholar] [CrossRef]
  33. Zhang, Z.; Scaramuzza, D. A Tutorial on Quantitative Trajectory Evaluation for Visual(-Inertial) Odometry. In Proceedings of the IROS Madrid 2018, Madrid, Spain, 1–5 October 2018; pp. 7244–7251. [Google Scholar] [CrossRef]
  34. Thalmann, T.; Neuner, H. Temporal calibration and synchronization of robotic total stations for kinematic multi-sensor-systems. J. Appl. Geod. 2021, 15, 13–30. [Google Scholar] [CrossRef]
  35. Hu, H.; Liu, Z.; Chitlangia, S.; Agnihotri, A.; Zhao, D. Investigating the Impact of Multi-LiDAR Placement on Object Detection for Autonomous Driving. arXiv 2022, arXiv:2105.00373. [Google Scholar]
  36. Berens, F.; Elser, S.; Reischl, M. Genetic Algorithm for the Optimal LiDAR Sensor Configuration on a Vehicle. IEEE Sens. J. 2022, 22, 2735–2743. [Google Scholar] [CrossRef]
  37. Zheng, P.; Li, Z.; Zheng, S.; Zhang, H.; Zou, X. Dual LIDAR online calibration and mapping and perception system. Meas. Sci. Technol. 2023, 34, 095112. [Google Scholar] [CrossRef]
  38. Zhang, H.; Yu, L.; Fei, S. Design of Dual-LiDAR High Precision Natural Navigation System. IEEE Sens. J. 2022, 22, 7231–7239. [Google Scholar] [CrossRef]
Figure 1. Sensor setup with two Velodyne VLP16 LiDAR and 3DM-GX5-25 IMU and prism on top (a) and Husky robot on the pump track below the bridge with the tachymeter in the background (b). (a) Sensor setup. (b) Robotic platform.
Remotesensing 15 05141 g001
Figure 2. Calibration of the two LiDAR sensors by matching the edges of a reference plate using RViz.
Remotesensing 15 05141 g002
Figure 3. Test bridge with different areas: (a) hill area, (b) pump track area (with reference targets), and (c) flat area.
Remotesensing 15 05141 g003
Figure 4. Method to apply approximated synchronization based on SLAM and tracking data.
Remotesensing 15 05141 g004
Figure 5. Workflow for the derivation of RMS trajectory error and mean point cloud to reference point cloud distance.
Remotesensing 15 05141 g005
Figure 6. Reference point cloud acquired with Leica RTC360. Vegetation, ground, and side areas, including bridge areas not covered by SLAM methods, are manually removed.
Remotesensing 15 05141 g006
Figure 7. Approximated time synchronization based on the shortest distance to start position.
Remotesensing 15 05141 g007
Figure 8. Trajectories of tachymeter in black, MA-LIO in red, SC-LIO-SAM in pink, and KISS-ICP in blue. Point cloud from Leica RTC360 scanner with height information as background. (a) Track 1: clockwise; (b) Track 2: counterclockwise; (c) Track 3: pump track; (d) Track 4: return on same line; (e) Track 5: figure eight; (f) Track 6: different start point.
Remotesensing 15 05141 g008
Figure 9. Sub-trajectories of tachymeter in black, MA-LIO in red, SC-LIO-SAM in pink, and KISS-ICP in blue. Rest of tachymeter trajectory in grey. Point cloud from Leica RTC360 scanner with height information as background. (a) Track 1: clockwise; (b) Track 2: counterclockwise; (c) Track 3: pump track; (d) Track 4: return on same line; (e) Track 5: figure eight; (f) Track 6: different start point.
Remotesensing 15 05141 g009
Figure 10. Detailed views of sub-trajectories of tachymeter in black, MA-LIO in red, SC-LIO-SAM in pink, and KISS-ICP in blue. Point cloud from Leica RTC360 scanner with height information as background.
Remotesensing 15 05141 g010aRemotesensing 15 05141 g010b
Figure 11. Relative sub-trajectory errors of KISS-ICP (blue), SC-LIO-SAM (pink), and MA-LIO (red) in meters plotted over distance of tachymeter tracking. Y-axis is relative to maximum error.
Remotesensing 15 05141 g011aRemotesensing 15 05141 g011b
Figure 12. Point cloud for each track and algorithm with related trajectory. Color scale represents the minimum distance to the reference point cloud acquired with the Leica RTC360. Points with a distance higher than 50 cm are removed.
Remotesensing 15 05141 g012
Figure 13. Results of point clouds (PCs) and trajectories of long track starting on the right side in the flat area in blue and ending on the right side with red color. Point cloud color represents height.
Remotesensing 15 05141 g013
Figure 14. CPU usage in percent for track 1 to 6 and each algorithm approximately mapped to trajectory using an AMD Ryzen 9 5900X 12-core processor with twenty 2200 MHz and four 2800 MHz threads.
Remotesensing 15 05141 g014
Figure 15. CPU usage in percent for the long track and each algorithm approximately mapped to trajectory using an AMD Ryzen 9 5900X 12-core processor with twenty 2200 MHz and four 2800 MHz threads.
Remotesensing 15 05141 g015
Table 1. Absolute RMS errors in meters of trajectories compared to trajectory recorded by the tachymeter. The lowest errors per track are in bold.
MethodTrack 1Track 2Track 3Track 4Track 5Track 6
KISS-ICP0.7940.6032.0890.1541.1480.345
SC-LIO-SAM1.6930.1290.0760.1380.6170.055
MA-LIO0.0730.0580.0860.0730.0570.072
Table 2. Mean relative trajectory errors in meters based on five sub-trajectories at same start times and same duration of 15 s. The lowest error per track is printed in bold.
MethodTrack 1Track 2Track 3Track 4Track 5Track 6
KISS-ICP0.0980.1170.6400.0930.2460.239
SC-LIO-SAM0.0460.0360.0410.0640.1250.041
MA-LIO0.0320.0260.0450.0360.0360.035
Table 3. Mean point cloud to reference point cloud distance in cm. The lowest error per track is printed in bold.
MethodTrack 1Track 2Track 3Track 4Track 5Track 6
KISS-ICP20.522.825.714.226.318.1
SC-LIO-SAM27.411.54.39.832.56.7
MA-LIO8.412.18.111.58.49.5
Disclaimer/Publisher’s Note: The statements, opinions and data contained in all publications are solely those of the individual author(s) and contributor(s) and not of MDPI and/or the editor(s). MDPI and/or the editor(s) disclaim responsibility for any injury to people or property resulting from any ideas, methods, instructions or products referred to in the content.