Article

Integration of Geophysical and Geospatial Techniques to Evaluate Geothermal Energy at Siwa Oasis, Western Desert, Egypt

1
Department of Earth and Ocean Sciences, University of North Carolina Wilmington, 601 South College Road, Wilmington, NC 28403-5944, USA
2
Institute of Environmental Management, Faculty of Earth Science, University of Miskolc, Miskolc-Egyetemvaros, 3515 Miskolc, Hungary
3
Geology Department, Faculty of Science, Tanta University, Tanta 31527, Egypt
4
Department of Mineralogy and Geology, University of Debrecen, 4032 Debrecen, Hungary
*
Author to whom correspondence should be addressed.
Remote Sens. 2023, 15(21), 5094; https://doi.org/10.3390/rs15215094
Submission received: 31 August 2023 / Revised: 17 October 2023 / Accepted: 19 October 2023 / Published: 24 October 2023

Abstract

:
Environmental degradation is reducing crop productivity in many regions of Egypt. Moreover, unsustainable surface water drainage contributes to salinized soil conditions, which negatively impact crops. Egypt is seeking solutions to mitigate the problem of surface water drawdown and its consequences by exploring renewable and sustainable sources of energy. Geothermal energy and the desalination of saline water represent the only solutions to overcoming the fresh water shortage in agricultural industry and to providing sustainable fresh water and electricity to villages and the Bedouin livelihood. In Egypt, the Siwa Oasis contains a cluster of thermal springs, making the area an ideal location for geothermal exploration. Some of these thermal springs are characterized by high surface temperatures reaching 20 °C to 40 °C, and the bottom-hole temperatures (BHT) range from 21 °C to 121.7 °C. Pre-Cambrian basement rocks are usually more than 440 m deep, ranging from 440 m to 4724.4 m deep. It is this feature that makes the Siwa Oasis locality sufficient for geothermal power production and industrial processes. This study utilized both the Horner and the Gulf of Mexico correction methods to determine the formation temperatures from BHT data acquired from 27 deep oil wells. The present study revealed a geothermal gradient ranging from 18 to 42 °C/km, a heat flux of 24.7–111.3 mW/m2, and a thermal conductivity of 1.3–2.65 W/m/k. The derived geothermal, geophysical, and geological layers were combined together with space data and the topographic layer to map relevant physiographic variables including land surface elevation, depth to basement, lineament density, land surface temperature, and geologic rock units. The ten produced variables were integrated in GIS to model the geothermal potential map (GTP) for the Siwa Oasis region. According to the model, both the eastern side and north and northeastern portions of the study region contain high and very high geothermal potential energy. Combining bottom-hole temperature measurements with satellite remote sensing and geospatial analysis can considerably enhance geothermal prospecting in Egypt and other East African areas that have geologically and tectonically similar settings. In addition to identifying sustainable resources needed for food production, this research has implications for renewable energy resources as well.

1. Introduction

The Egyptian Supreme Energy Council has announced its plan to increase new and renewable energy production to about 20% of aggregate consumption through a national appeal [1]. Geothermal energy is one of the most promising renewable sources of energy, and new information on geothermal resources reveals vital details about this renewable energy source that is tapped from the Earth’s interior heat. There are several ways in which they can be utilized as energy sources, from large, complex power plants to small, relatively straightforward pumping systems. In addition to reducing emissions of carbon dioxide (CO2) and local air pollutants, geothermal energy can also provide a barrier against energy price shocks and contribute to energy security.
There are several extensive depressions in the Western Desert of Egypt that form inhabited oases. The Siwa Oasis lies in a depression in the northwest of Egypt’s desert and covers 1375 km2. About 65 km of distance separates it from the Libyan border, 300 km from the Mersa Matrouh Governorate, and 820 km from Cairo [2]. The Oasis is almost 18 m below sea level [3] and stretches for more than 50 km from east to west (E–W) between the Qattara Depression and the Great Sand Sea (Figure 1). Several studies have been conducted on the structure, geology, and hydrogeology of Egypt’s Western Desert; however, little is known about the geothermal potential of the region. Using gravity and borehole data, ref. [4] an artificial neural network (ANN) model was created to estimate the thickness of the main sandstone water-bearing formation in the southern part of the Western Desert of Egypt. In order to ensure the sustainability of the Siwa Oasis, ref. [5] proposed and tested chain water management scenarios. In addition, ref. [6] developed a multilayer groundwater model for water resource management in the Siwa Oasis to determine ideal pumping scenarios that could mitigate environmental impacts.
The main aim of the present work is to provide an overview of Egypt’s geothermal resource potential with a particular focus on the Siwa Oasis. Here, the magnetic geophysical data collected in the form of reduction to the pole (RTP), which is a customary part of the magnetic data processing method, especially when mapping areas of a larger scale, will be used to determine the subsurface basement configuration and its correlation with the obtained thermal characteristics. Such geophysical data will be integrated with satellite remote sensing and geological information in the GIS platform to generate the geothermal potential map (GTP) for the study region. In Egypt and East Africa, such findings will assist in identifying sustainable resources for food production and renewable energy and will also prove valuable for geothermal exploration in geologically and tectonically similar areas.

2. Geothermal Regime in Egypt

Temperature measurements including thermal gradient/heat flow studies remain the most direct and reliable methods for exploring regional geothermal phenomena. Multi-parameter methods such as geophysical, geochemical, and remote sensing techniques can also be used for these investigations, but geothermal measured temperatures are the ultimate approach [7,8,9,10,11,12,13]. Based on these methods, most of Egypt’s geothermal resources are located along the Gulf of Suez and the eastern side of the Red Sea. In eastern Egypt, heat flow values reached 175 mW/m2, which is approximately three times the normal value, and increased as the coast of the Red Sea approached [8]. Along Egypt’s eastern margin, ref. [8] also found a regional thermal high and local thermal anomaly. Several geological studies suggest that the Nubian sandstone formation can serve as geothermal fluid reservoirs [2]. This reservoir lies at a depth of at least 4 km in the Gulf of Suez and Red Sea area and may contain temperatures of 150 °C or higher. By using geoelectric techniques, ref. [14] outlined the geothermal reservoir at the Hammam Musa hot spring, which is located on the eastern coast of the Red Sea. The subsurface structure of the Hammam Musa hot spring was illustrated and determined using a 2D resistance cross-section that had been created using the Akaike information criterion least-squares method [14]. Using these geoelectric data, a 2D interpretation shows that there is considerable aquifer thickness around the hot spring, making the area suitable for geothermal drilling. Moreover, there are strong magnetic anomalies surrounding the Abou Swira hot spring in Sinai, Egypt, indicating an intrusion of high magnetic content under the surface [15]. A thermal study conducted by [16] concluded that thermal water in subsurface formations near the border of tectonically active areas is the preferred source of high conductivity in the subsurface on/near the border, especially is areas where anomalous conductivity is associated with high heat flow alongside other specific geophysical and geological parameters. In certain areas around the eastern and western coasts of the Gulf of Suez, the geothermal gradient is significantly higher than average (35.0 °C/km to 44.0 °C /km) [17]. Additionally, they assessed the geothermal potentiality of the Hammam Faraun hot spring to be 12.4 MWt. The source of the Hamman Faraun spring is deep groundwater circulation that occurs in the subsurface reservoir and is controlled by subsurface faults, according to a conceptual and numerical model developed by [12]. The hot springs along the Red Sea may not be entirely recharged by Gulf of Suez water; however, the groundwater reservoir is naturally recharged by meteoric water flowing from higher altitudes surrounding the springs [13].
The Western Desert is one of the most favorable regions in Egypt for geothermal exploitation since it hosts an evident cluster of superficial thermal springs with high surface temperatures reaching 20 °C to 40 °C. The authors of [7] reported that, in the Western Desert, subsurface temperature data from oil wells generally show low-temperature gradients of 15 and 19 °C/km. These temperature gradients are connected to sediments with low thermal conductivity, which means they also have a low heat flow. The Western Desert of Egypt has a low regional heat flow of 50 mW/m2, but many of the wells draw from deep artesian aquifers and produce water that ranges between 35 and 43 °C [18]. Wells of this type form a sort of geothermal resource that is capable of releasing low temperatures. A geothermal investigation conducted by [19] in the central part of the Northwestern Desert of Egypt, utilizing the bottom-hole temperature records from deep wells drilled for petroleum exploration to infer the distribution of geothermal gradients with the type of lithology, found that the distribution of geothermal energy increases with increasing carbonate content and decreases with decreasing clastic rock content. As a result of associating temperature records from 116 deep oil wells in the Northwestern Desert of Egypt with gravity data, ref. [20] developed a new geothermal gradient map of the Northwestern Desert of Egypt, including the Siwa Oasis, using artificial neural network techniques. Prediction maps showed geothermal gradients ranging from 20 to 40 °C/km and permanent temperature gradients of 30 °C/km in the northern Western Desert. In addition, geothermal studies in some parts of the Siwa Oasis were carried out using the device of thermo-physical properties (Isomet-104) to measure the subsurface temperature contour map (30 m below the earth’s surface) and carried out by [21]. This map illustrates that there are good geothermal regions having hot groundwater reservoirs. The study concluded that there are geothermal regions with hot groundwater reservoirs that are significant and need more study. Regional thermal study and temperature data from deep wells in the Western Desert of Egypt were used to analyze and assess some geosites in a comparative analysis for a better understanding of their potential and uniqueness, pointing to low to moderate geothermal resources including El Girba and El Ganbi hot springs [22] (Figure 1).

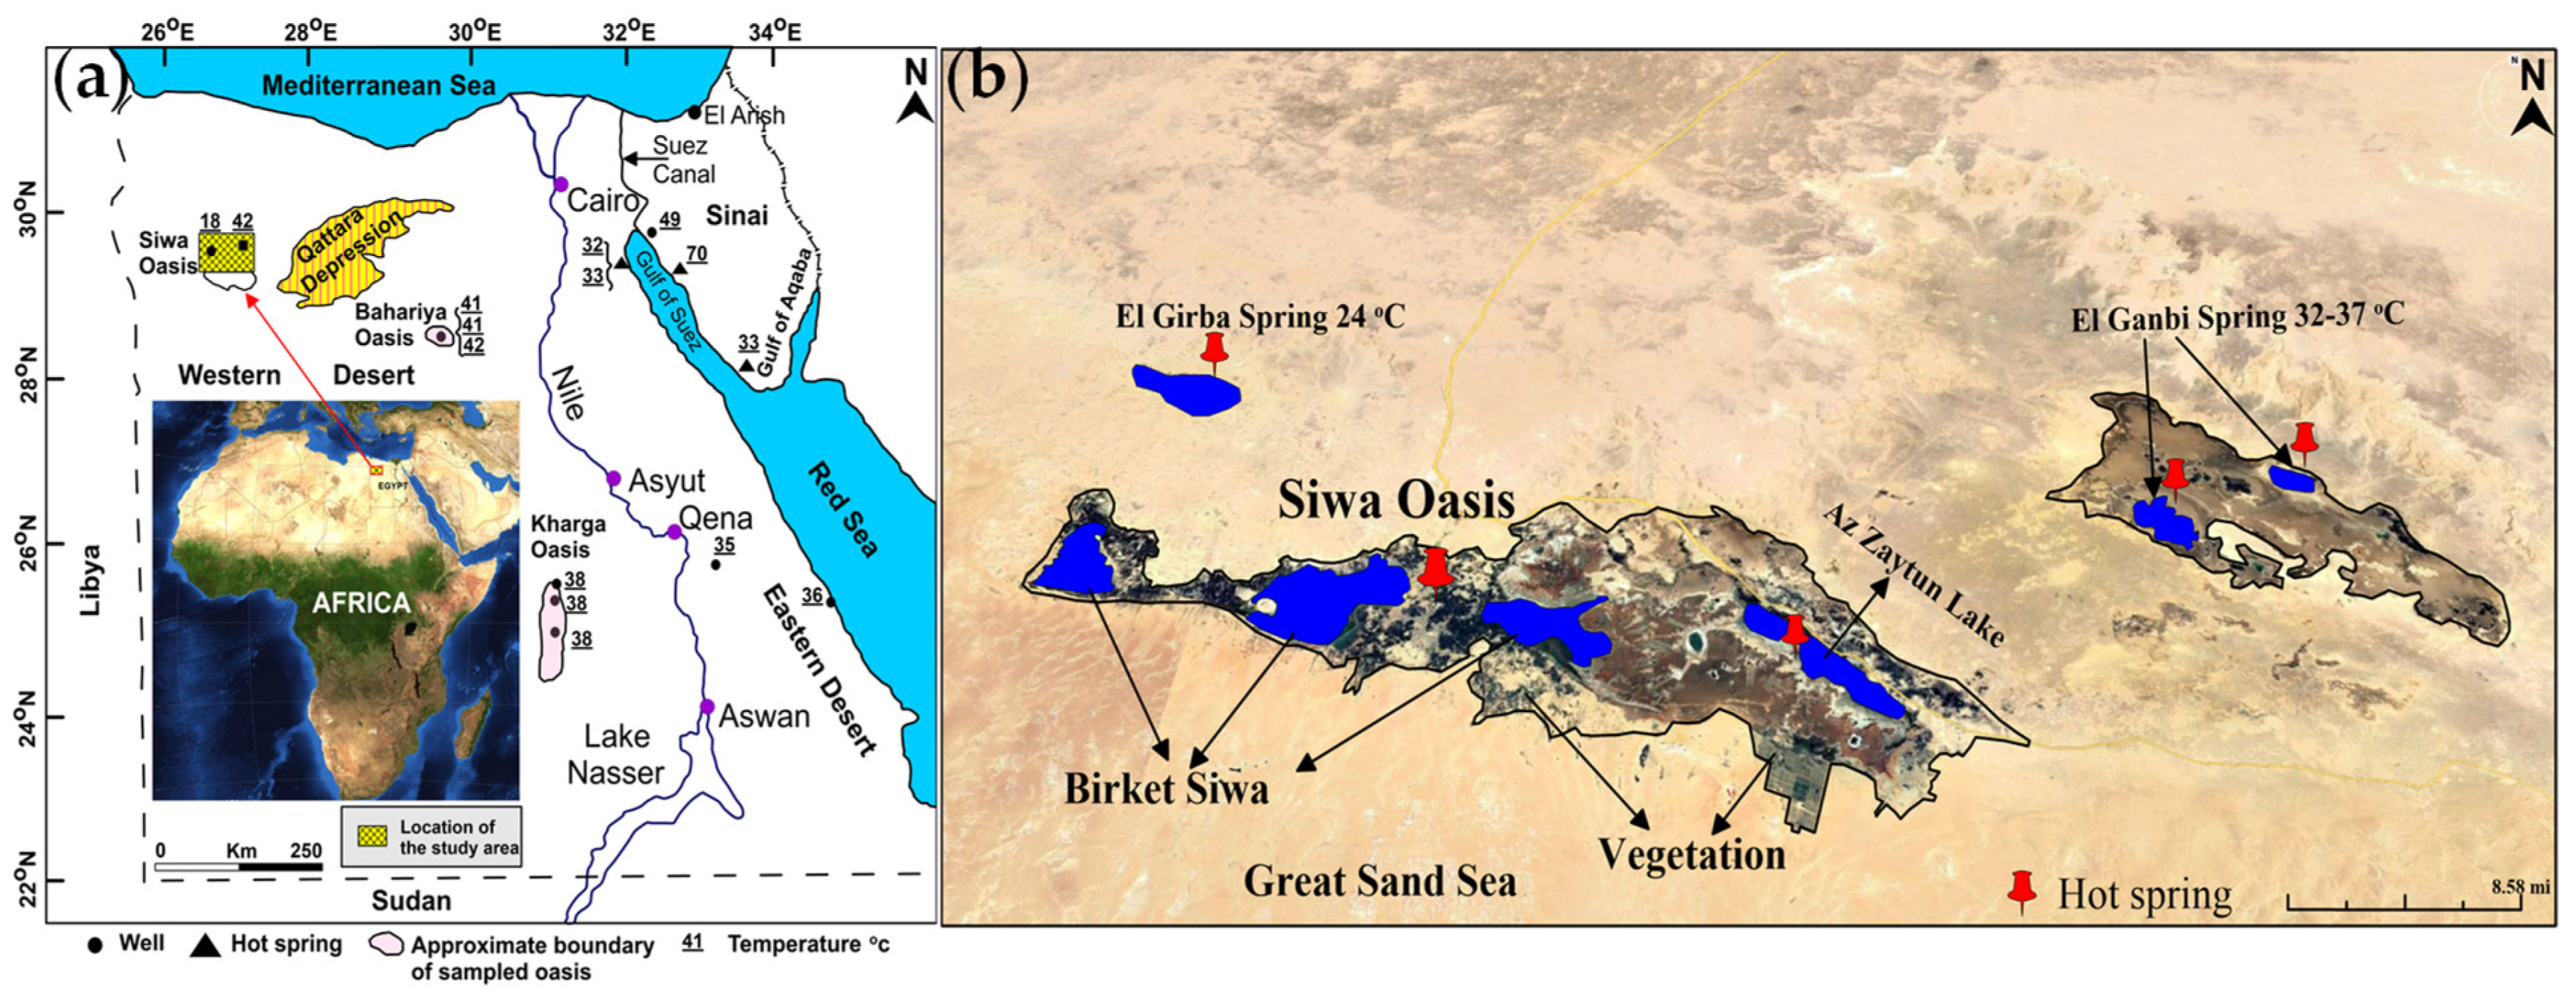
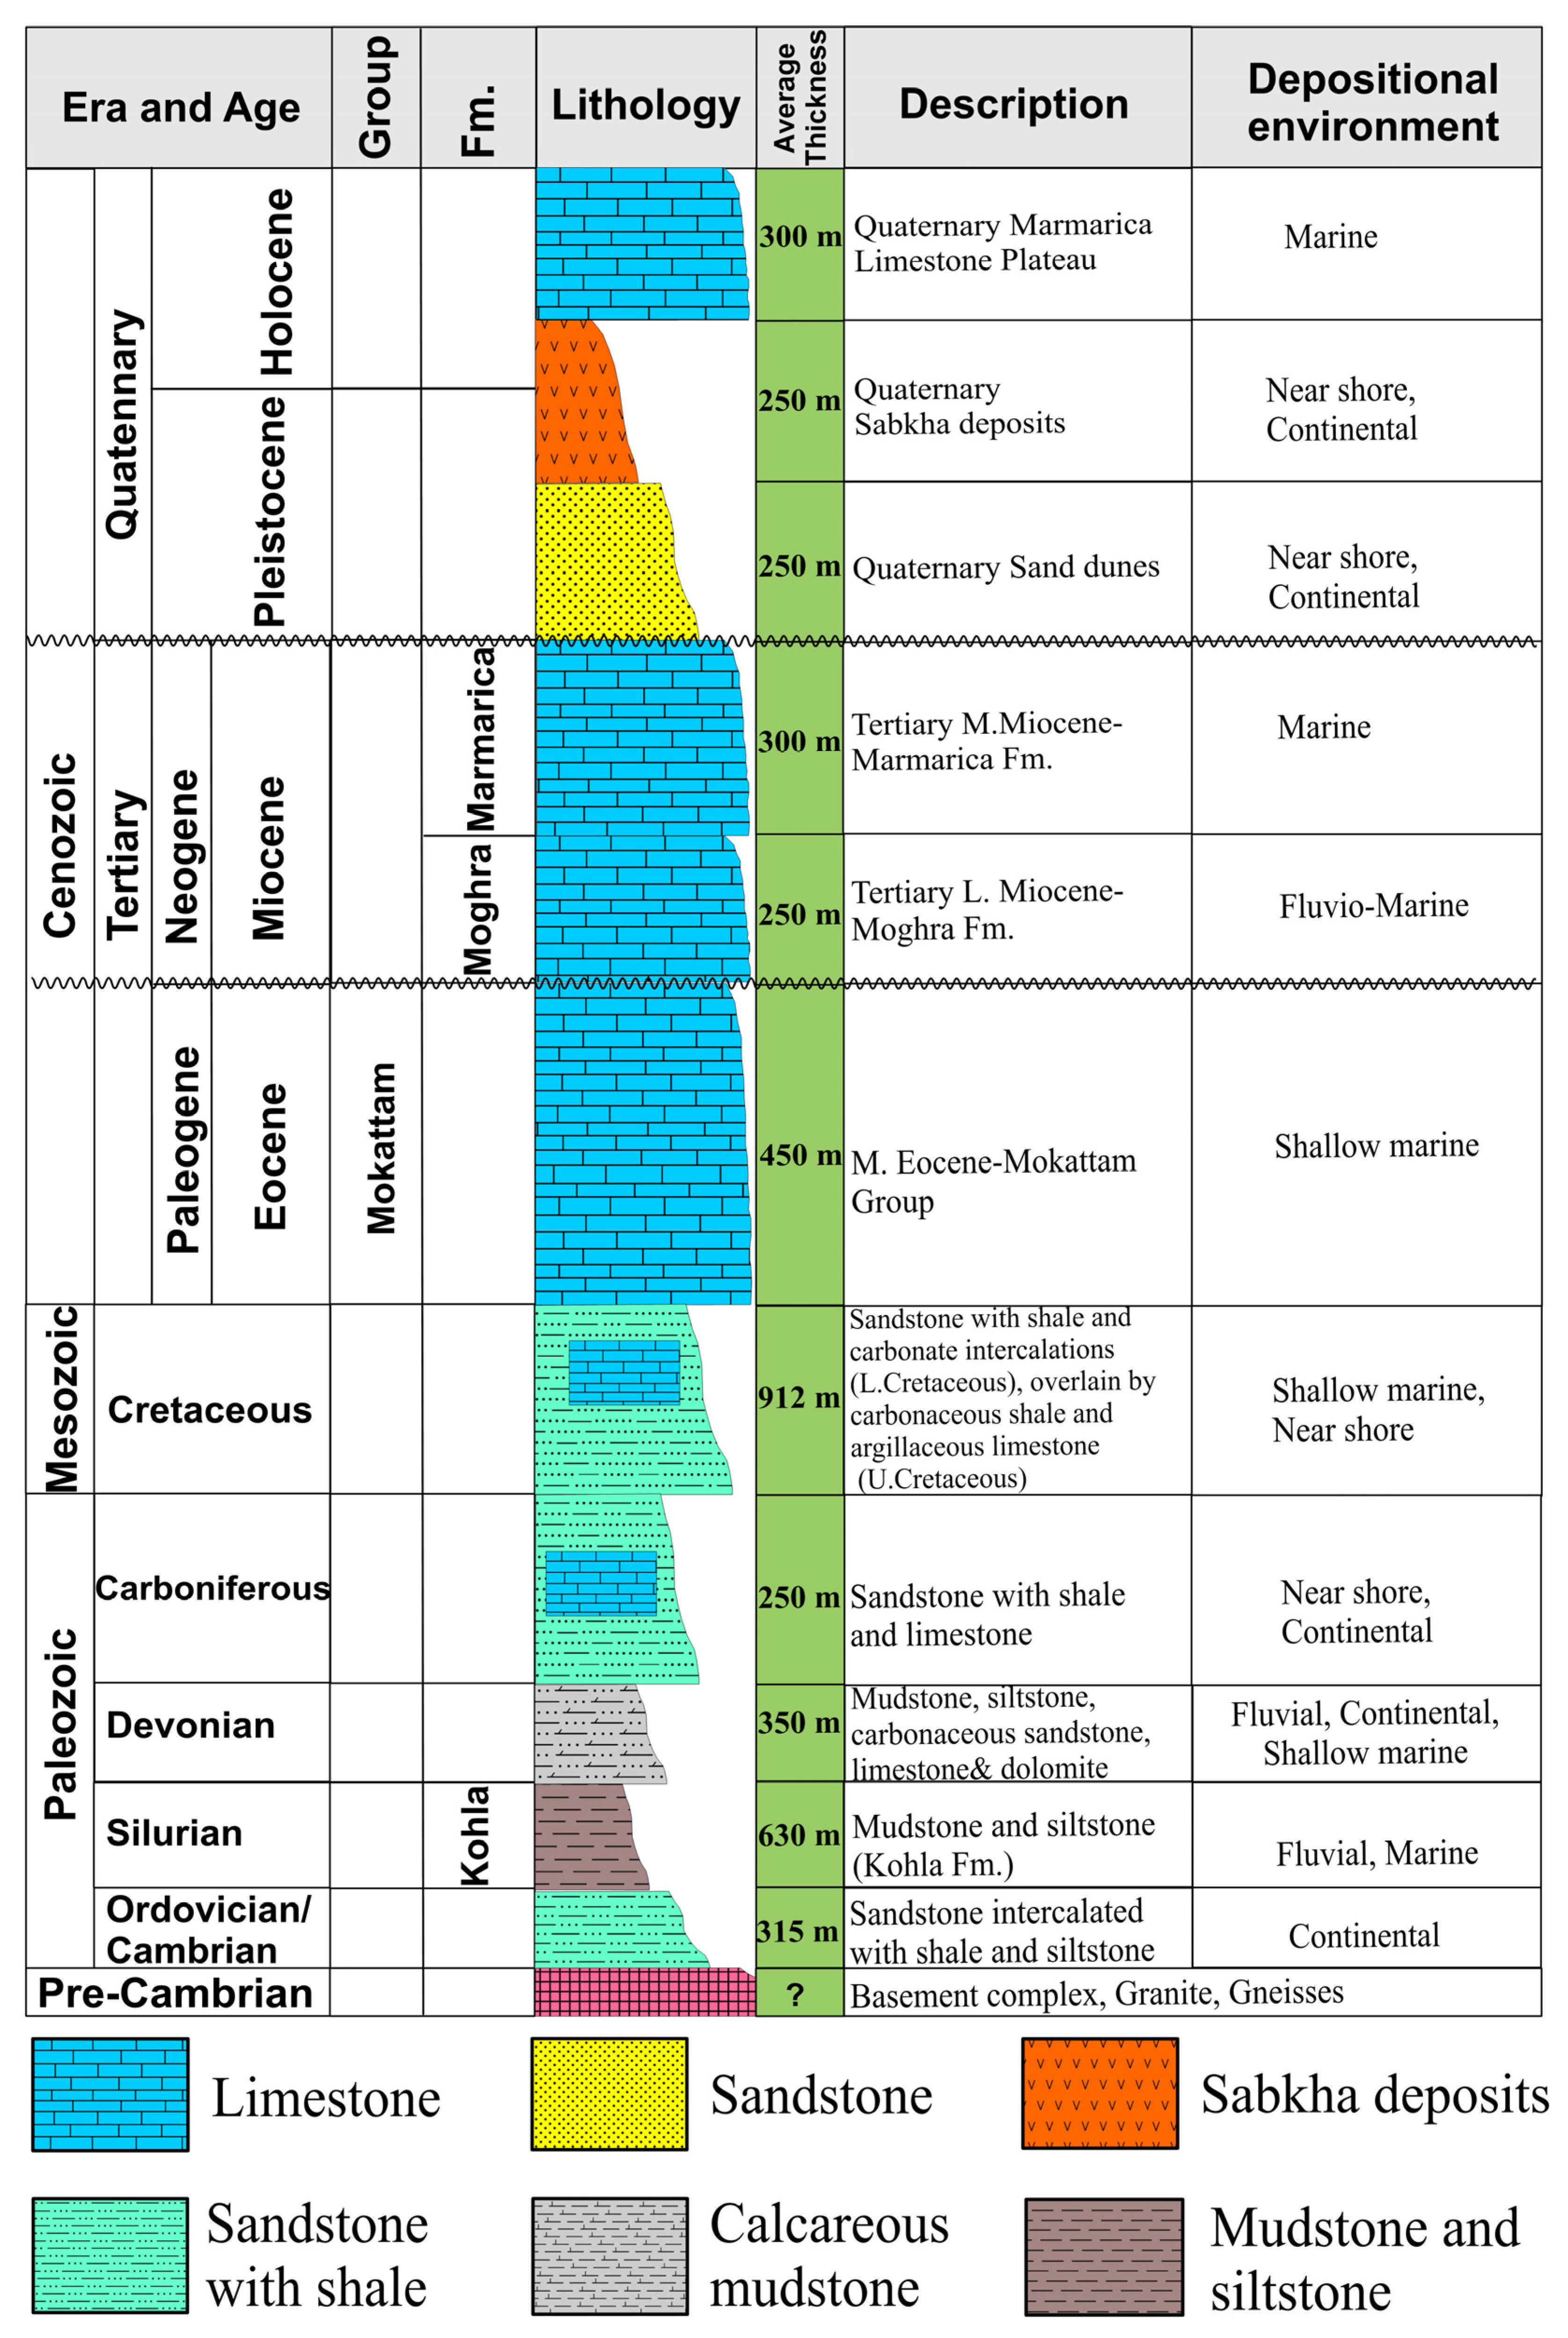
3. Geological Setting

The Western Desert of Egypt contains seven depressions including Siwa, Qattara, Fayum, Bahariya, Farafra, Dakhla, and Kharga. The north side of the Qattara-Siwa depression is the Miocene limestone plateau (northern escarpment) that extends to approximately 200 m above sea level. On its southern end, desert sand dunes rise to about 20 to 50 m asl. The Siwa Oasis stretches more than 80 km west–east and approximately 30 km north–south [23]. As shown from the 1:500,000 NH 35 SIWA Conoco Coral [24], the general geology of the Siwa Oasis exhibits a variety of stratigraphic successions, which range from the Middle Eocene through the Holocene epoch with remarkable thickness variations (Figure 2) and vertical geologic succession begin from Pre-Cambrian to Cenozoic era (Figure 3). Chalky limestone is exposed in areas west of the Timeira region but is still covered by materials like quartzitic gravel and silicified wood. Overlying the Upper Eocene formation is a clastic fluvio-marine delta front sequence of the Early Miocene Moghra Formation [25]. The Middle Miocene Marmarica Formation, which is 94 m thick, makes up the majority of the Siwa Oasis. It is composed mainly of limestone, dolomite, and shale. The usual stratigraphic sequence of the area consists of tertiary rocks that have been covered by alluvium and aeolian deposits from the Quaternary period. However, in large areas of the Siwa Oasis, the tertiary rock layer is replaced by sabkhas (salt mixed with sand). The sabkhas are then covered by Quaternary alluvium and aeolian deposits. According to structural analysis, the Siwa Oasis occupies a regional NNW–SSE synclinal fold and is characterized by strong NW–SE and ENE–WSW structural lineaments [26]. In the Siwa area, geologic evolution has been complicated by uplift and subsidence, resulting in folds, horsts, and grabens [27,28,29,30].

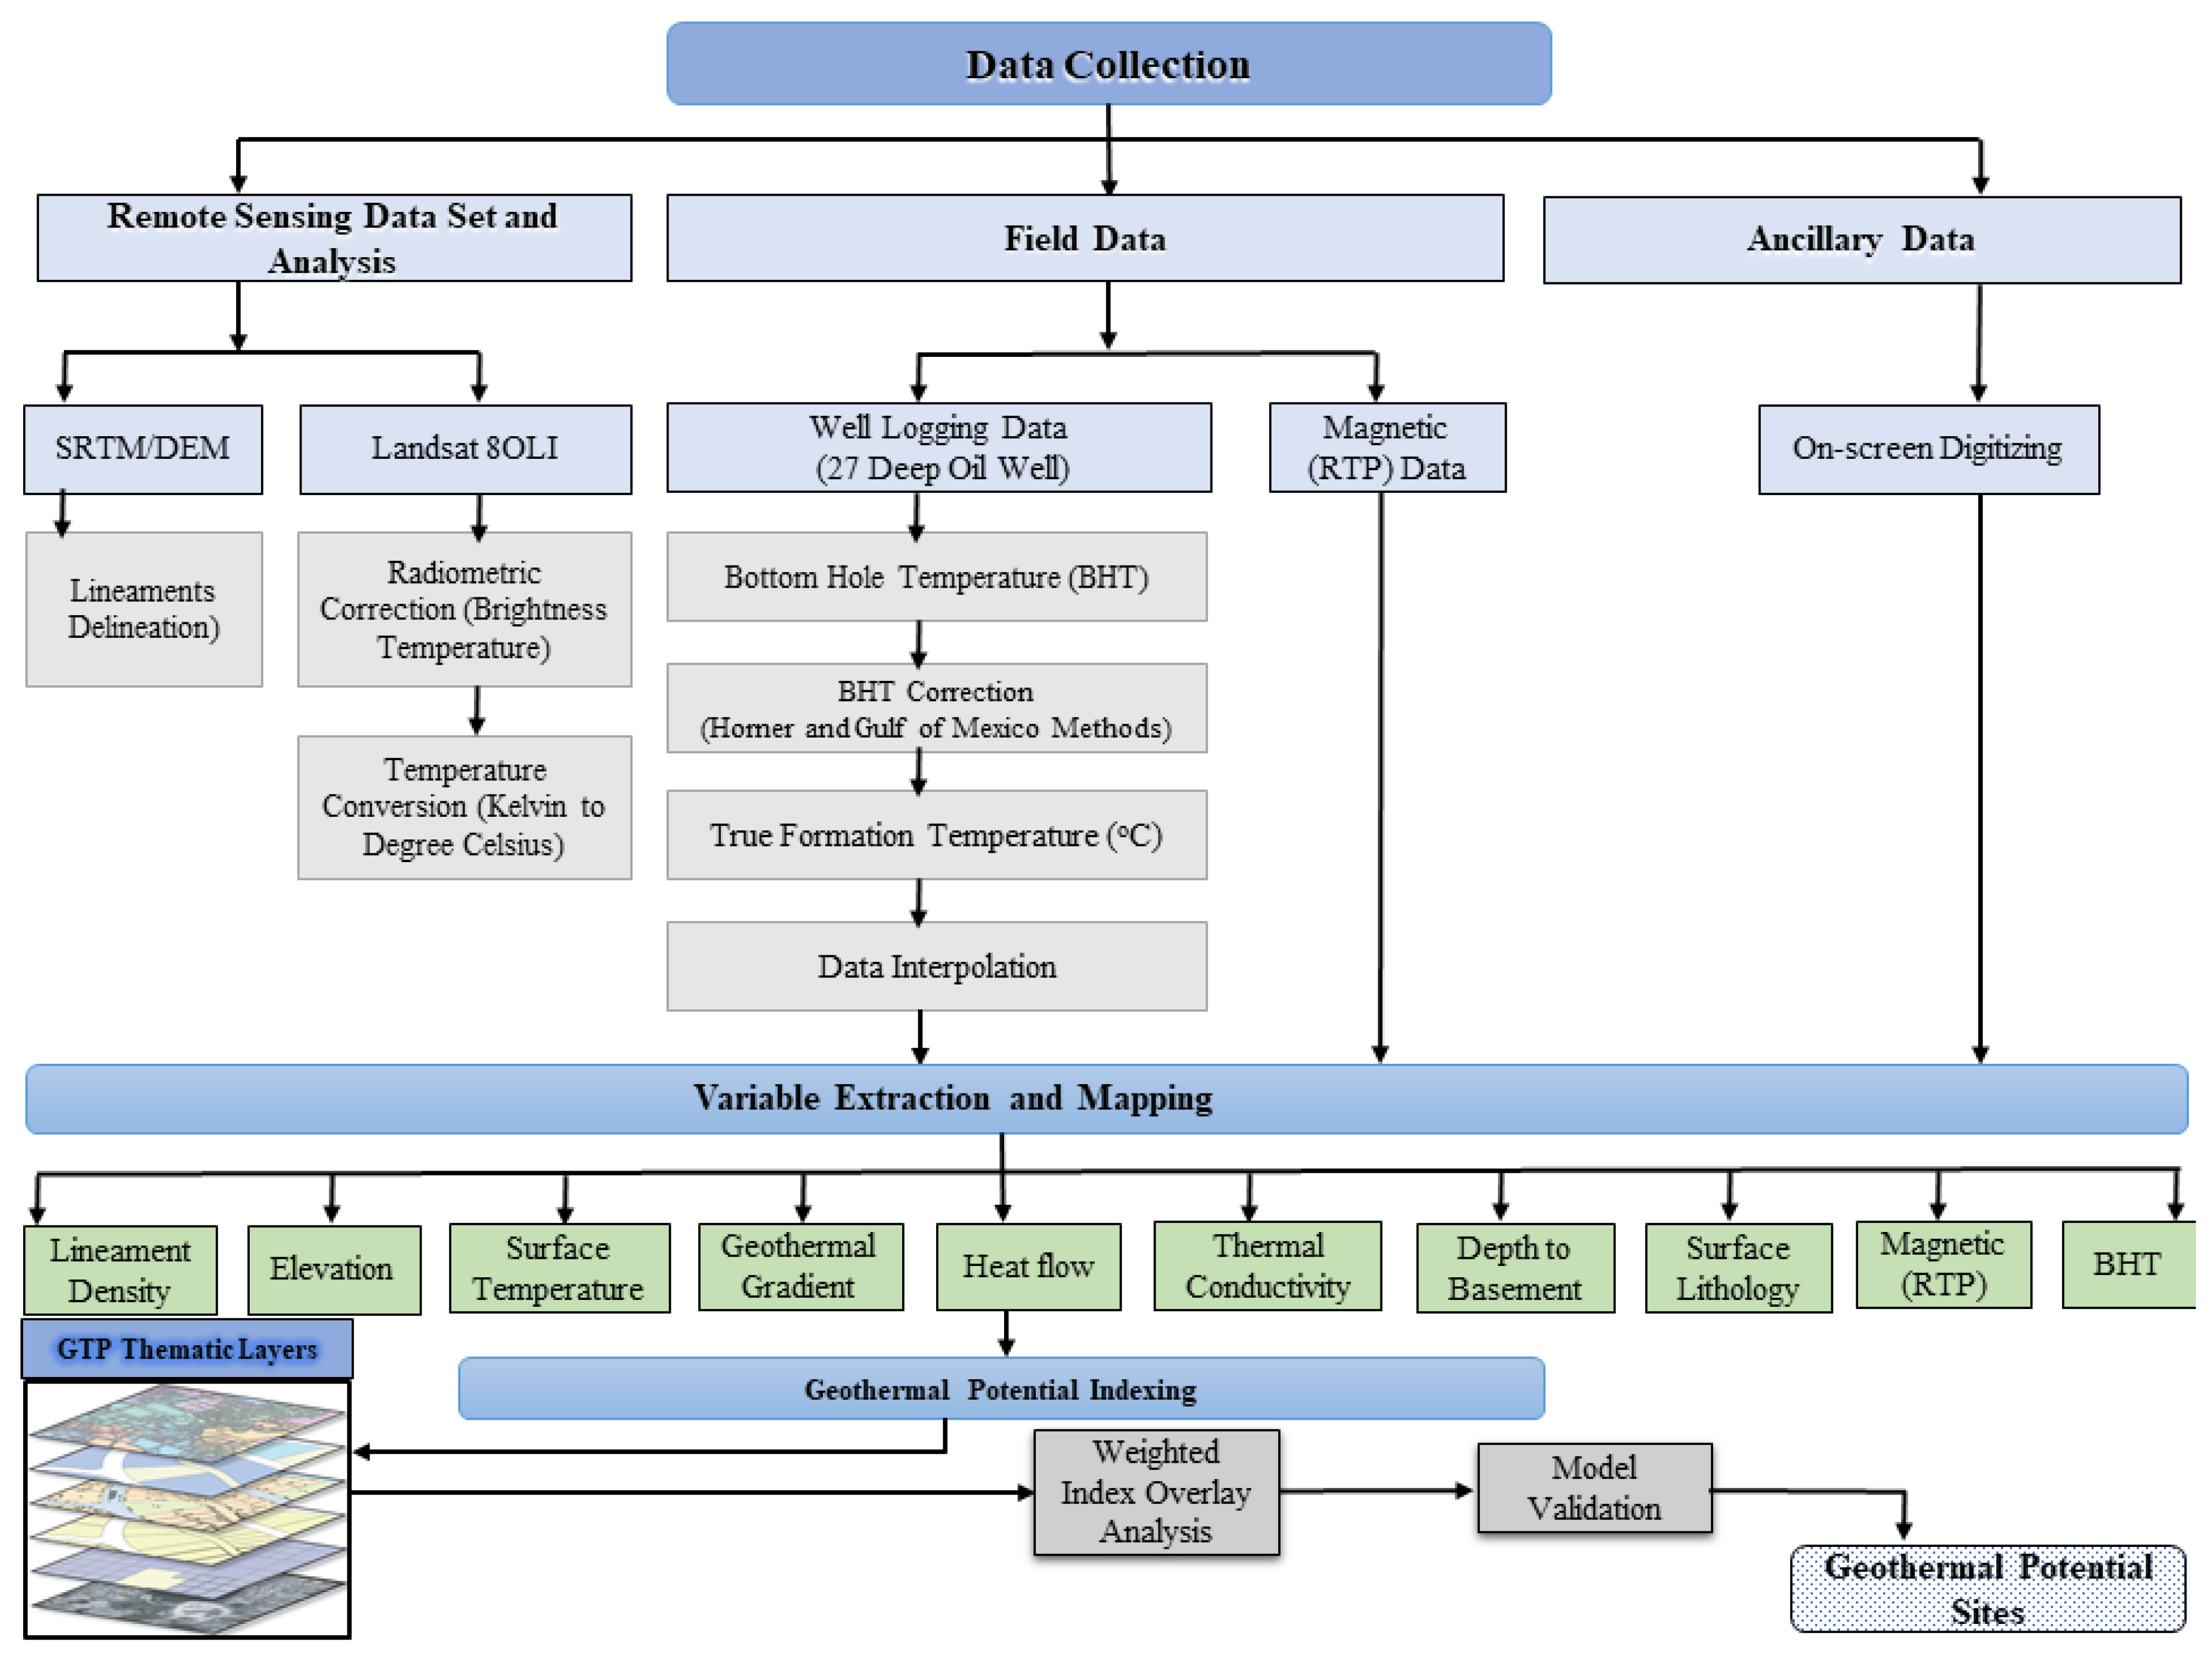
4. Materials and Methods

This research workflow (Figure 4) includes two major procedures. First, variables were extracted and mapped using well logging and geological data products. Second, geothermal potential was examined and modeled.

4.1. Magnetic Data

Geothermal exploration at the Siwa Oasis was conducted using ground magnetic data. This study used an aeromagnetic data set extracted from Getech’s compilation study to produce a 1-km grid of total magnetic intensity (TMI) taken from the African Magnetic Mapping Project (AMMP) [27,28]. Magnetic anomalies of the subsurface source will shift on the map due to the declination and inclination angles of the magnetic vector. Consequently, the RTP magnetic map was produced by reducing the total magnetic intensity map to the north pole (RTP) [29] (Figure 5). As the magnetic values decrease northward, sedimentary cover becomes thicker and less magnetic. A majority of the anomalies have trends that are oriented E–W and NE–SW. Western, northeastern, and southeastern parts of the study area show positive magnetic anomalies, which could be related to shallow subsurface sources of high magnetic susceptibility.

4.2. Well Logging Data

Well logging data were collected from 27 deep oil wells located in the Siwa Oasis area, with depths from 440 to 4724.4 m. The Egyptian General Petroleum Company (EGPC) collected bottom-hole temperatures (BHT) from well data. Subsurface temperature data can be obtained from BHT, a type of data that is used frequently in geothermal studies and is therefore easily accessible. A temperature measurement is made during or soon after the drilling process has stopped. This procedure provides temperatures dissimilar from the baseline temperature because of the convective cooling effect that occurs when fluids are introduced into the system [34,35,36]. Borehole temperatures gradually return to the formation temperature after the drilling process has been completed and cooling fluid addition ceases. It is important to note that the raw BHT measurements display temperatures cooler than the actual formation temperatures [34,35,37,38]. The temperature measurements gathered display the steadiness formed between the cool drill fluid and the hot formation beneath. Corrections for the raw BHT can be made depending on the BHT measurement, time since circulation, and/or depth of measurement, which may or may not be known. There have been various methods used to correct the temperature differentials between logged BHT measurements and the actual formation temperature [34,35,36,37,38,39,40,41]. Sequential BHT data are available for this study, meaning it was appropriate to use the Horner and Gulf of Mexico correction methods here [34,35,36,37,38,39,40,41]. There are limitations to these methods, including a reliance on assumptions because there is a lack of documentation of drilling procedures, as documentation is time-consuming and requires great resources. The actual duration of mud circulation in the well is an example of one of these limitations. The Horner correction method uses linear heat source calculations to determine the time of the drilling process. The following is the equation used to calculate the Horner correction:
T e q = T B H T = A l o g + 1 + T t
where Teq (°C) is the corrected temperature at equilibrium, T BHT (°C) is the measurement of the bottom-hole temperature. A is the measured temperature; T (hours) is the cooling duration (we assume it is 10 h, since the duration of circulation below this threshold is considered); and t (hours) is the time since circulation, or the period of time between when drilling fluid is no longer added and well logging begins.
The Gulf of Mexico correction method, developed by Waples et al., 2004 [35], is the second method. Temperatures derived from logs were corrected, and comparative calculations were made based on the log temperatures along with drill stem test temperatures taken from deep well samples, ranging from 3500 to 6500 m in depth, in the Gulf of Campeche site of the Gulf of Mexico. In addition to depth, the correction is strongly dependent on the time duration following the completion of mud circulation (TSC). The following equation was used to calculate the Gulf of Mexico subsurface temperatures (°C).
T true = T surface + f ( T measured T surface ) 0.001391 ( Z 4498 )
where T m e a s u r e d (°C) is the measurement of the log temperature; Z (m) is depth below the top of the seafloor; T   surface is the annual mean temperature of 26.7 °C at the seabed or land surface interface; and f is the factor of correction, a function of the amount of time since the end of the circulation that was obtained from Equation (3):
f = [ 0.1462     I n   ( T S C ) + 1.699 ] / 0.572     Z 0.075
In Table 1, it is shown that the derived values from both methods are very similar, which reinforces the corrected formation temperature conclusion. Based on an average annual surface temperature of 26.7 °C, corrected formation temperatures were used in Equation (3) [8] to generate geothermal gradients for each well within the study area.
In addition to geothermal gradient, heat flow, and thermal conductivity, the depth to the Pre-Cambrian basement was also extracted for the study area. Recent data of wells that had been drilled to the Pre-Cambrian basement by the Egyptian General Petroleum Corporation (ECPC 2000) were used to acquire depth data, alongside gravity and magnetic survey results. The Pre-Cambrian basement can be defined as the depth from the top surface of loose sediments or sedimentary rocks to the basement of igneous or metamorphic rock. These rock types often exhibit impedance contrasts at their interfaces.
Using the corrected well logging data, geothermal gradient, heat flow, thermal conductivity, and depth to basement, points were interpolated in ArcGIS using inverse distance weighting (IDW), which produced a continuous raster layer that was used for creating the geothermal potential model (Figure 6). The IDW method calculates estimates for values at unsampled locations throughout the study area by using the actual sampled measurements and the distances between those sampled measurements.
Geothermal gradients are measured by the change in temperature Δ T (°C) with depth Δ Z (meters) [42]. Equation (4) was used to calculate the geothermal gradient:
G G = T T s   Z = d T d Z
A geothermal gradient is given by G G (°C/m), whereas formation temperature (BHT) is given by T (°C), mean annual surface temperature ( T S ) is given by T s (26.7 °C), and Z refers to the overall depths [8]. In addition to the temperature parameter, a heat flow parameter was calculated as well. Heat flow is the amount of heat dissipated from the Earth’s interior to space through the surface per unit area of the Earth’s core [43]. This is heat produced as a result of the Earth’s core and its dissipation of heat, along with radioactive decay that occurs within its crust [42]. Based on temperature gradients, heat flow values were determined using Equation (5) [44,45]:
Q = λ   ( d T / d Z )
where Q is flow of the geothermal heat (mW/m2); λ (W/m/K) is the thermal conductivity coefficient, which suggest values of the stratigraphic section (1.8–2.6 W/m/K) in the NW Desert that was estimated by [8]; and dT (°C) is the temperature change throughout the depth interval of dZ (m). Geothermal conductivity measures how well a material conducts heat, and in the case of rocks, it is determined by their physical composition and structural properties, so the geothermal conductivity of rocks varies [46]. Equation (6) was used to determine geothermal conductivity across the area under investigation:
K = Q A Δ T
where K (W/m/K) is thermal conductivity, Q (mW/m2) is flow of geothermal heat, A (m2) is the body’s surface area, and ΔT is the temperature differential throughout the body.

4.3. Remote Sensing Data Set and Analysis

4.3.1. Digital Elevation Model (DEM)

Earth Explorer (https://earthexplorer.usgs.gov/, accessed on 21 January 2023) was used to acquire information about the topography of the Siwa Oasis. The United States Geological Survey (USGS) was used to downloaded four SRTM tiles which were then mosaicked together using ArcGIS 10.7 software (ESRI, Redlands, CA, USA). These tiles were used to derive the surface elevation and fractures of the study area. Deriving surface elevation data for the given study area is imperative in identifying the depth and sources of geothermal reservoirs. Surface terrain is also important to understand because it serves as an indicator of geothermal prospect suitability, as it affects heat contact between the surface and subsurface. Areas of low elevation are expected to have a greater potential for geothermal energy because the energy can reach the surface and then recharge quickly (Figure 7a).
Lineaments are mappable linear features, fractures, joints, and faults, which most likely reveal information about subsurface structures [47,48]. Lineaments can include fractures, joints, and faults. All of these can serve as indicators of subsurface structures, which need to be identified because they can highly influence how geothermal energy moves throughout the area. Dense lineament zones with high permeability allow hard rock zones to recharge in geothermal energy, so horizons with high fracture densities are ideal for geothermal energy production [49]. Numerous geothermal systems have high fault and fracture densities (FFD) [50,51], and the beneficial geothermal wells are correlated with permeable faults at depth [52]. This study extracted lineament data from SRTM/DEM and high-resolution imagery using visual interpretation techniques, on-screen digitizing, and on-screen interpretation of an eight-direction summed hill-shade that was generated using the DEM. The density kernel analysis in ArcGIS was used to determine the lineament density, or the total length of lineaments per unit area, for the extent of the entire study area (Figure 7b).

4.3.2. Thermal Infrared Data

Ground surface temperature variation and geothermal anomalies in the study area must be determined because geothermal potential is increased in thermally anomalous areas, or areas where the land surface temperature is warmer than surrounding areas. Geothermal systems are also believed to lose heat through conductive and convective processes, similar to natural hot springs, which can affect land surface temperatures. Geothermal anomalies have been mapped spatially in previous studies using thermal infrared (TIR) remote sensing data, such as [53], where heated ground overlying faults were detected across the Salton Sea in California and provided potential indications of geothermal upwelling zones. The authors of [54] used Landsat thermal images from the Island of Akutan, Alaska, to identify a known field of thermal springs, along with three new regions that had consistently warm surfaces and could be ideal locations for future field investigations. In this study, Landsat TM data were obtained from the USGS and were then used to map the ground surface temperature variations as well as possible geothermal anomalies throughout the Siwa Oasis area.
Four tiles of Landsat 8 OLI cloud-free thermal scenes downloaded and mosaicked with a spatial resolution of 100 m were acquired in May 2023. Nighttime scenes were used in place of daytime scenes, which would have included direct effects of solar heat. The thermal infrared bands were radiometrically calibrated using ENVI 5.5.1 software (Harris Geospatial Solutions, INC, Broomfield, CO, USA) for the surface kinetic temperature, and then converted to degrees Celsius. The TIR calibrated bands were then mosaicked together to show potential geothermal upwelling zones over large faults (Figure 7c).

4.4. Geological Units Layer

The various geological rock units that are present in a given study area are important to determine because rock types have varying capabilities in transporting geothermal energy and heat flow from Earth’s deep subsurface to its surface. Basement rocks are especially important to identify because they are generally capable of transporting geothermal energy and heat easily from the mantle. Any sedimentary rocks that are present can also be great geothermal reservoirs. The main rock types that can be found in the Siwa Oasis region include basement, Cambrian/Ordovician, Carboniferous, Cretaceous, Eocene, Miocene, and Quaternary rocks. The basement and Quaternary rocks along with Carboniferous, Eocene, and Miocene sediments serve as the sources of thermal conductivity and geothermal energy. Geothermal energy can also be exploited from geological contact zones, or areas where different geological units converge. In this study area, the main geological contact zones occur between basement and tertiary rock layers, including the Mokattam group, and the Moghra and Marmarica formations, which are Miocene in age. The basement, Miocene, and Carboniferous rocks have the greatest geothermal potential in the Siwa Oasis area. All rock units were digitized in ArcGIS from the 1:500,000 scale geological map of the Egyptian Geological Survey and Mining Authority (EGSMA) (Figure 7e).

4.5. GIS-Based Geothermal Potential Model

A GIS-based model of geothermal potential can help select new geothermal sites in the Siwa Oasis and its surrounding area. After generating 10 raster layers (geothermal gradient, heat flow, thermal conductivity, depth to basement, surface elevation, fracture density, land surface temperature, bottom-hole temperature, magnetic susceptibility, and geological rock units), they were reclassified on a scale of 1–5, according to their relative favorability, where 1 refers to very low, 2 means low, 3 mentions medium, 4 specifies high, and 5 indicates very high class (Figure 8).
It was determined that high geothermal gradient, high heat flow, high thermal conductivity, low depth to basement, high fractures, high land surface temperature, low surface elevation, and rock units had the highest values. A geothermal potential map was derived from these 10 intermediate layers using the simple additive weight (SAW) technique. The four derived field data layers (oil well data) which include (geothermal gradient, heat flow, thermal conductivity, and bottom-hole temperature) serve as great geothermal indicators and were therefore given more weight when creating the geothermal potential map.

5. Results

BHT data corrected using the Horner and the Gulf of Mexico correction methods indicated that the study area has a geothermal gradient between 18 and 42 °C/km and a heat flow between 24.7 and 111.3 mW/m2. The thermal conductivity was found to be in the range of 1.3–2.65 W/m/k, with a measured amplitude temperature maximum of 100.7 °C. Some of these hot springs are characterized by high surface temperatures and bottom-hole temperatures (BHT) ranging from 20 °C to 40 °C and from 22 °C to 121.7 °C, respectively. Additional maximum values of geothermal gradients were observed at the Siwa P-1X hot spring and five wells: Ain Quruyshat, Siwa well 1, Ain Camisa, Ain Guba, and Siwa well 2 with thermal gradient values of 42, 38.3, 29.4, 28.6, 27.1, and 26 °C/km, respectively.
The geothermal gradient and heat flow data were plotted against basement depth to understand their correlations throughout the Siwa Oasis region. The depth to basement rocks and the load of overburden rocks are both inversely related to geothermal gradient and heat flow (Figure 9) [55]. The geothermal gradient and heat flow are high in areas that have a shallow basement depth or a low overburden thickness. An example of this is Ain Quruyshat, located in the northeastern segment of the Siwa Oasis, about 20 km east of the Siwa town. Ain Quruyshat has the largest free-flowing spring in the oasis, with a shallow average depth of 710 m to the basement. This area has a high geothermal gradient, heat flow, surface temperature, bottom-hole temperature, and thermal conductivity of 38 °C/km, 91.2 mW/m2, 33 °C, 32 °C, 2.4 W/m/k, respectively. There is a general increase in basement rock depth in the northeast and southeast of the Siwa Oasis region based on geothermal data, but this depth can vary widely (between 440 and 4724.4 m) in some localities, which may be related to the presence of specific controlling structures in the Siwa Oasis tectonics. In addition to the faulted blocks, there are deep basins and uplifted basements in the Siwa Oasis area, which are likely to play a major role in geothermal exploration and oil production in the region.

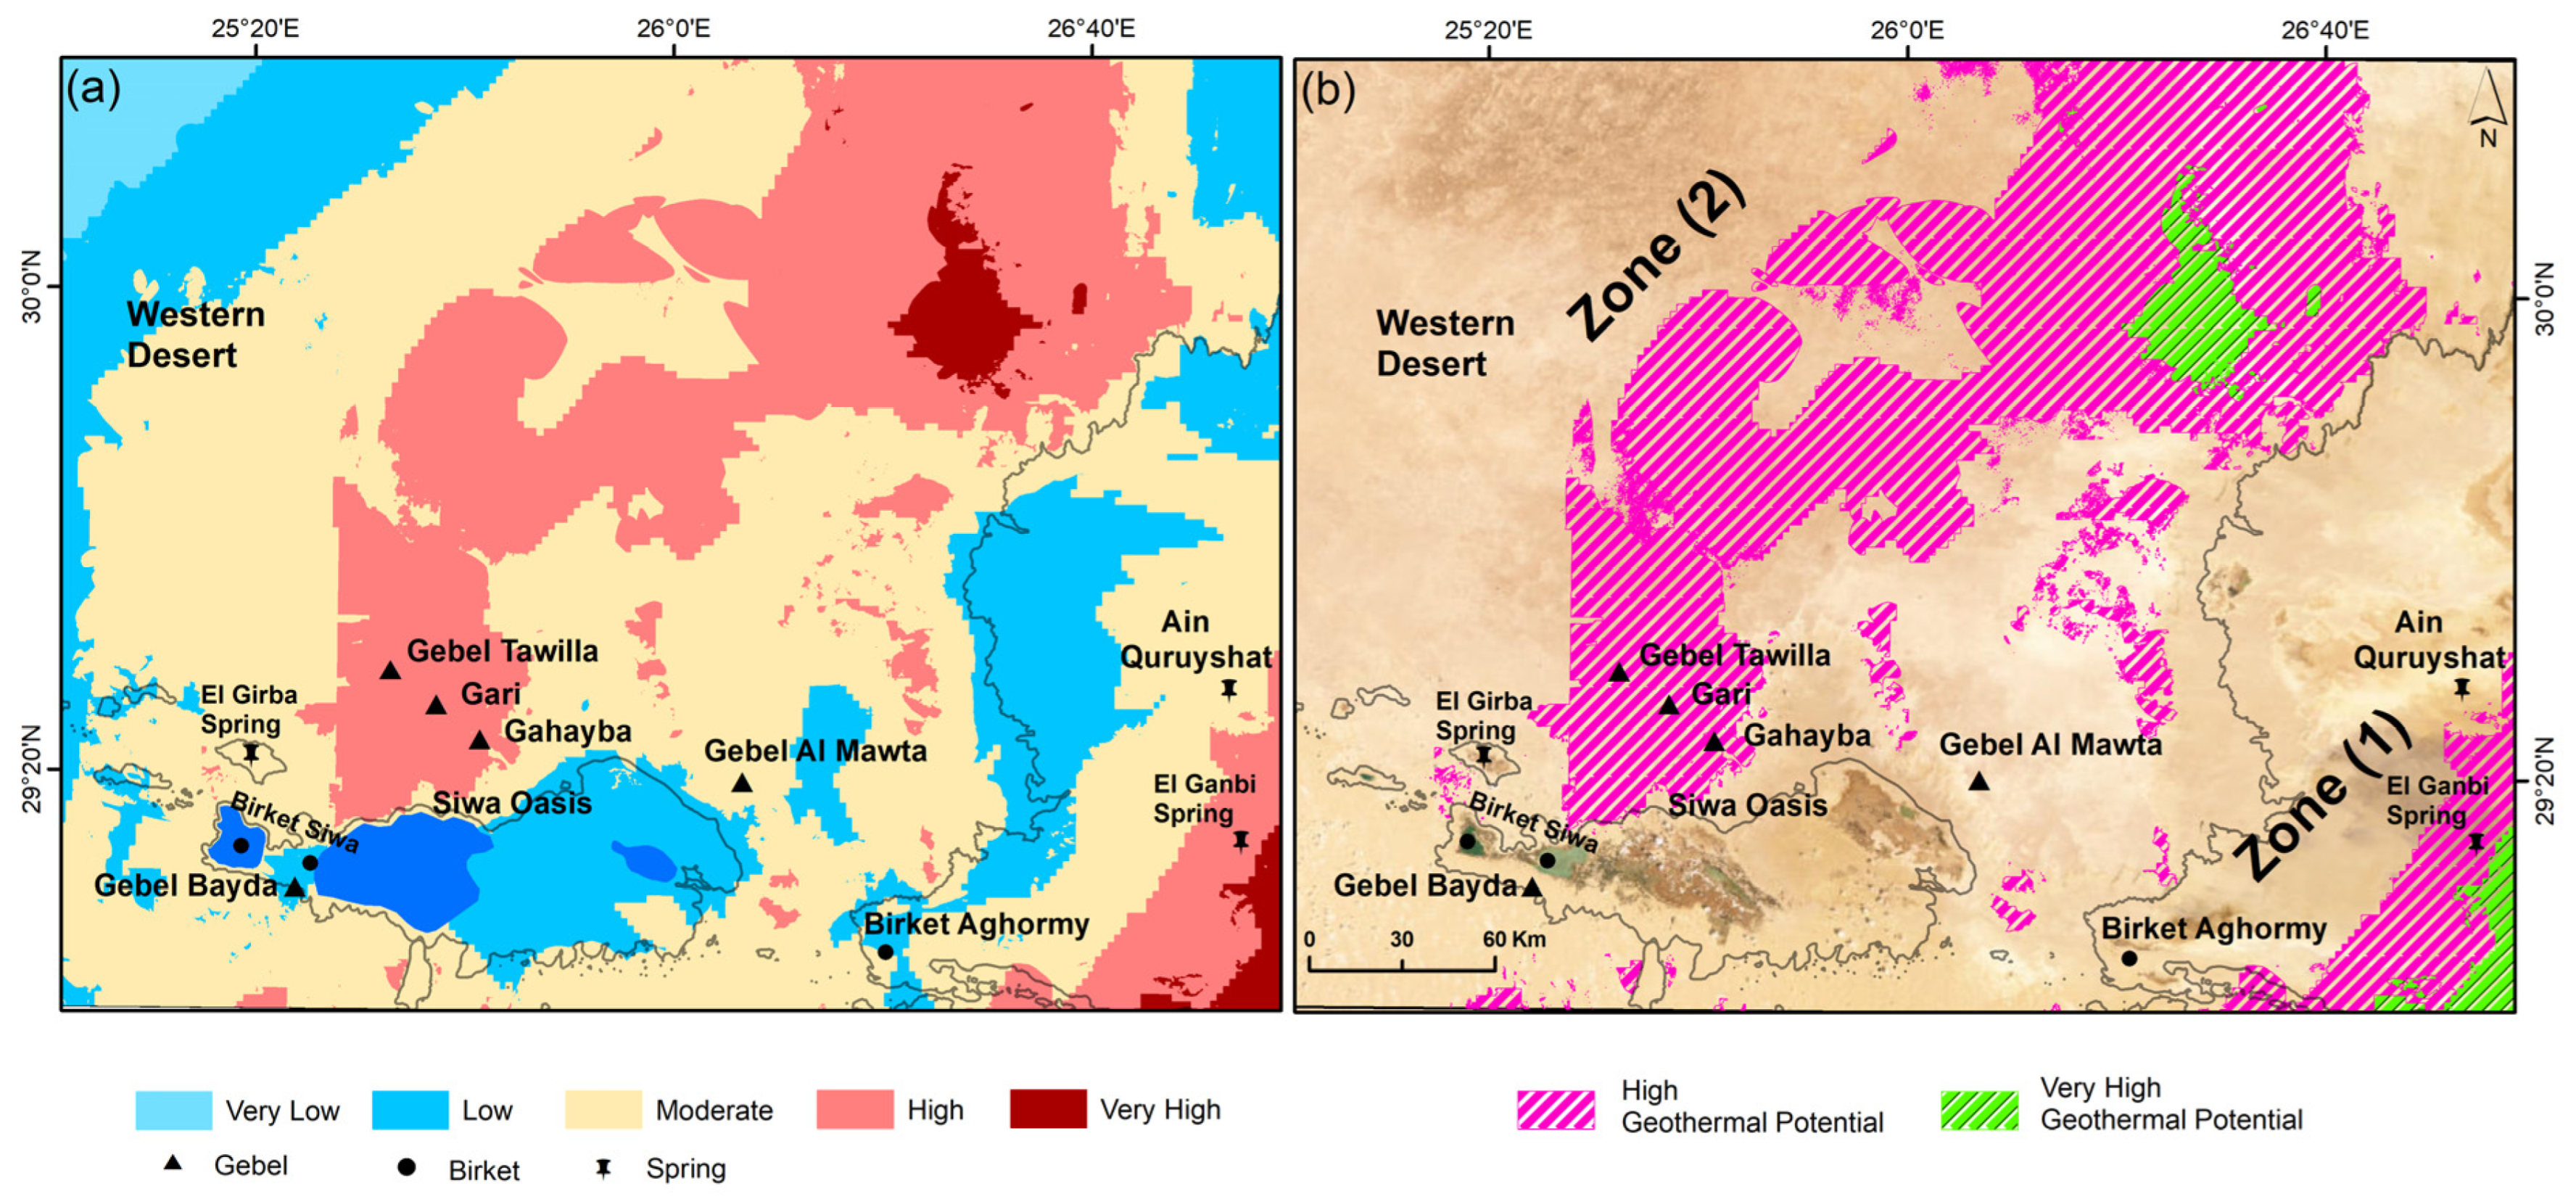
Potential Locations for Geothermal Exploration

The geothermal potential model (GTP) for the Siwa Oasis area was created by integrating 10 raster layers using the SAW method (Figure 10). There are four different zones of geothermal potential in the GTP, which range from very low to very high. As a result of the model, the northeastern and southeastern areas of the Siwa Oasis are projected to have the highest geothermal potential.
There are two resulting potential geothermal zones of high and very high geothermal energy. The total area in km2 of the high geothermal zone in the study area is equal to 6892.77 km2, while the very high geothermal zone is equal to 562.03 km2. Ain Quruyshat and Birket Aghormy and their vicinity regions on the eastern side of the Siwa Oasis are the first belt of high and very high geothermal potential. Ain Quruyshat and Birket Aghormy have an area of high geothermal potential equal to 743.63 km2 and 211.185 km2, respectively, of very high potential area in the eastern side of the Siwa Oasis. A cluster of hot springs is present at this particular location. It contains three known hot springs (Ain Quruyshat, Abu Shuru, and Birket Aghormy), generating high heat flows of approximately 91.2 m W/m2 in the western part of Egypt. Based on data analysis, this area has a high fracture density, which is a key factor affecting the contact between surface and subsurface geothermal energy. The geothermal potential is increased by the shallow depth of 440 m to basement rocks and the low surface topography because, in areas of low topography, geothermal energy reaches the ground surface quickly and is able to conduct high geothermal recharge. In addition, this area is characterized by the tectonic uplift of hot basement rocks and a sedimentary rock layer that contains underground water heated by bedrock beneath it. Heat is mainly generated by basement rocks (primarily granites and gneisses) and by Paleozoic sedimentary cover (primarily Devonian and Carboniferous sediment), which contains organic layers. The Moghra and Marmarica formations contain radioactive elements (trace elements) such as U, Th, Rb, and Sr, which are all possible indicators of high geothermal energy [55].
A second area with high and very high geothermal potential is located at the north and northeastern end of the Siwa Oasis, which contains Gebel Tawilla, Gar, Gahayba, and Gebel Al Mawta. This zone contains an area equal to 350.845 km2 of very high geothermal potential and about 6149.14 km2 of high geothermal potential. This zone displays high geothermal gradients, heat flow rates, and thermal conductivity of 42 °C/km, 111.3 mW/m2, and 2.65 W/m/K, respectively. Nubian sandstone and limestone serve as great reservoirs for geothermal energy because of their petrophysical properties (i.e., porosity and permeability). The high fracture density here also implies the region has a high level of tectonic activity as well as rejuvenation, since high fracture density increases the chance for geothermal energy to be dispersed in large amounts. Based on geomorphological data, Siwa lies in the Qattara depression, which stretches from north to west in Egypt. The deepest point of the Qattara depression is 133 m below sea level, meaning it is the second lowest point on the African continent [2]. To the north, it is bordered by steep slopes, while to the south and west, it slopes into the Great Sand Sea, which further supports its high geothermal potential. In addition, the local geothermal reservoirs are replenished rapidly due to a drainage density that is mainly controlled structurally and allows meteoric water to infiltrate.
Both the northeastern and southeastern sites of the area under investigation have high rock porosity, which assists as a vital feature that can increase the spreading of the geothermal heat through the surface. In order to determine the properties of the geothermal reservoirs underneath Siwa Oasis, particularly their thickness and geological formation, vertical stratigraphic succession around this depression were mapped; see Figure 3 (modified after [24,31,32,33]). According to the analysis of this stratigraphic succession, the thickness of the sandstone and limestone rocks reaches 1477 m and 1300 m in Siwa Oasis, respectively. There is evidence that a large geothermal reservoir exists in this particular area, and in the eastern zone this includes the southeast and the northeast of the Oasis (for instance, the Moghra and Marmarica formations) due to the presence of Miocene age deposits, which have high porosities ranging from 11 to 24% [56]. It was found in [57] that these Miocene rocks, particularly those in the Moghra and Marmarica formations, along with their basement rocks, have the highest thermal conductivity estimates (~1.3–2.65 W/m/k). High-porosity rocks also have higher heat conduction properties, so the heat flow through them is accelerated. To validate the GTP model, IDW-interpolated geothermal layers were superimposed on the corrected 27 oil wells logging data and other thematic layers. There is a relatively shallow depth to basement with a high geothermal gradient, heat flow, and bottom-hole temperature in the northeastern and southeastern segments of the Siwa Oasis (average 440 m, 42 °C /km, and 111.3 mW/m2, 121.7 °C, respectively). Figure 6, which includes geothermal parameters, shows the segments that have very high geothermal potential, validating the model’s predictions.

6. Discussion

Egypt’s growth rate has been about 1.56%, and by 2023 the expected population will be 112,716,598 million people, meaning the demand for new energy sources is constantly increasing. Energy demand is also being heightened by the expected completion of the Grand Ethiopian Dam (also known as the El-Nahda Dam). The dam is located on the Blue Nile, and the first phase of filling the reservoir was completed in July 2020. As soon as the dam is completed, Ethiopia will be able to store 74 billion cubic meters of water, generating 6000 megawatts of electricity [58], while Egypt will reduce its hydroelectric power output by 7% during wet years [59]; therefore, this dam will negatively affect Egypt, and Egypt is required to search for another source of energy to meet the needs of the Egyptian people. Egypt’s water supply and electricity generation are expected to be affected negatively by this mega-dam during prolonged periods of drought. Petroleum products supply about 94% of the nation’s energy (53% from oil and 41% from natural gas), while hydropower and coal provide the remaining 6%. Egyptian geothermal power generation has not yet been founded, despite the presence of many natural hot springs and thermal wells across the Red Sea and the Western Desert regions.
Our research project comprises a multidisciplinary approach including geological, geophysical, water desalination, and renewable energy applications. Application of satellite observations is becoming an operational technique for managing and exploring geothermal energy resources at large scales. In this regard, the use of remote sensing and GIS applications for geological studies is extremely vital where it will provide data based on many data layers and finally given the opportunity to prepare the decision support system. Multi-date images and the digital elevation model will be analyzed, and GIS software will be used to prepare the maps for this purpose.
According to the present study, there are two locations in the Siwa Oasis region that are highly suitable for geothermal energy exploration. There have been no estimates made for the entirety of Egypt’s geothermal system, but energy estimations were made for the Gulf of Suez area based on its unique geothermal characteristics. However, the Western Desert still requires more exploration for future geothermal resources. Based on geothermal analysis and numerical simulation, refs. [17,60] estimate that the Hammam Faraun could produce between 12.4 MWt and 19.8 MWt of geothermal energy, a quantity considered to be economically suitable for development and capable of supporting energy production from a small, binary power plant.
Geothermal energy is heavily utilized in many regions of the world that have abundant natural hot springs and thermal wells, much like the natural springs and wells in the Gulf of Suez and the Siwa Oasis regions in Egypt. According to the National Geothermal Resource Assessment (NGRA), the United States uses 3676 MW of geothermal power, and Indonesia (1948 MW) and the Philippines (1868 MW) also use geothermal power in significant amounts [61]. The East African Rift area has recently been explored for geothermal potential by several nations, including Tanzania, Ethiopia, Uganda, Rwanda, Djibouti, and Eritrea.
Kenya is the largest producer of geothermal energy in Africa, with an estimated quantity of 630 MW [62] from geothermal sources. Assuming all nations follow their geothermal power development plans, the global geothermal market is expected to reach 32 GW by the early 2030s [63]. It is possible that 50% of this geothermal energy will be provided by African countries alone.
In African countries, geothermal energy has an estimated 15 GW of unused potential, which, if used, could affect economic growth and development rates. There are a considerable number of geothermal resources along the Egyptian Western Desert, especially in the Siwa Oasis in Egypt, which may contribute to the total African geothermal potential.
Egypt is suffering an acute shortage of fresh and clean water. According to the report prepared by the Ministry of Water Sources and Irrigation (MWSI) and Ministry of Agriculture (MA) of Egypt (2014), the population can use only half of the internationally accepted threshold value of 1000 m3/year. Water scarcity is expected to increase due to the rapidly increasing population and adverse agricultural policies. Therefore, geothermal energy and desalination of saline water represent the only solutions to overcome the fresh water shortage in the agricultural industry. Geothermal exploration is the exploration of the subsurface in search of viable active geothermal regions with the goal of building a geothermal power plant, where hot fluids drive turbines to create electricity. Our research can be considered one of the main solutions to desert development and can provide freshwater and a power supply in desert areas that have geothermal activities.
Global concern for the environment is growing, leading to power plants being governed by increasingly strict regulations regarding their wastewater discharge. This wastewater discharge is becoming more expensive, along with fresh water, which is becoming consistently scarcer. Therefore, power plants are looking for innovative technology and new methods to reuse their wastewater discharge and saline water. Recently, there has been great interest in the development of new areas in the Egyptian desert that have sufficient groundwater potential. This development is important for conserving land in the Nile Valley and Nile Delta regions. Several integrated fields of study have been focused on these purposes. Because 96% of Egypt is desert, reclamation and utilization of the land are of great importance. Several governmental organizations and the private sector have conducted geologic, geothermal, hydrogeologic, and geophysics studies in selected Egyptian desert areas over the past two decades. New settlements had been evaluated through these studies. Good examples of these areas are the oases in the Western Desert, such as the oases of the Siwa Oasis. It is estimated that soil salinity in Siwa can range from 200 parts per million to more than 1500 parts per million, and this will affect agricultural land (Figure 11). Considering the availability of water resources in the Western Desert of Egypt, the Siwa Oasis is a promising site for geothermal exploration projects. These areas, however, suffer from land degradation problems, such as salinization of the soil (Figure 11).

7. Conclusions

Many countries on the African plate have ample Cenozoic igneous activity, meaning they may have unexplored geothermal resources. Egypt is not included in the countries with Cenozoic igneous activities, but its location on the northeastern part of the African plate still suggests that there may be undiscovered geothermal resources, especially along the eastern and western borders of the country. This study used field data from 27 deep oil wells along the Siwa Oasis. Corrected well logging data, thermal infrared tiles, and DEM tiles were processed together, which produced significant geothermal and physiographic variables for the study area. GIS was used to model the geothermal potential map (GTP) for the Siwa Oasis region using ten raster layers, including geothermal gradient, thermal conductivity, heat flow, elevation, lineament density, land surface temperature, bottom-hole temperature, depth to basement, and magnetic and major lithological units. Geothermal investigation is possible in the north and northeastern portions of the Siwa Oasis, which both have high-potential geothermal resources. At both of these sites, geothermal gradients, heat flows, shallow depths to crystalline basements, low surface elevation, and high fractures, as well as the high rock porosity of the Cretaceous and Miocene sediments, all play an important role in geothermal energy spreading out and reaching the surface as quickly as possible. The created geospatial model supports the result derived from the geothermal parameter data such as a high geothermal gradient and heat flow in the area under investigation. Using this method, we were able to identify possible geothermal hotspots quickly, which provides valuable information for planning future geothermal investigations in Egypt.

Author Contributions

A.F. performed the work, collected the data, conducted the methods and data analysis, and helped in preparing all the figures and writing the manuscript; E.G. developed the research framework, designed the research question, supervised the entire project (methodology, analysis, and interpretation), created all the figures, and wrote, reviewed, and edited the manuscript; C.H. developed the research framework for the remote sensing section, provided inputs for the remote sensing part, and reviewed and helped write the remote sensing part; A.S. and M.H. helped in data collection and contributed to the well and natural spring data set. All authors have read and agreed to the published version of the manuscript.

Funding

This research was fully funded by the USAID and the Embassy of the Arab Republic of Egypt, Cultural and Educational Bureau, Washington, DC, USA, to A. Fahil and E. Ghoneim.

Data Availability Statement

Not applicable.

Acknowledgments

This research was conducted at the UNCW Space and Drone Remote Sensing Lab (SDRS). The authors would like to express their appreciation to USAID and the Egyptian Government. We thank the anonymous reviewers for their thoughtful comments on this paper.

Conflicts of Interest

The authors declare no conflict of interest.

References

  1. Lashin, A. Review of the Geothermal Resources of Egypt: 2015–2020. In Proceedings of the World Geothermal Congress 2020, Reykjavik, Iceland, 26 April–2 May 2020. [Google Scholar]
  2. Ahmed, E.A. Assessment of the Geosites and Geodiversity in the Prospective Geopark in Siwa in the Western Desert of Egypt. Int. J. Geoheritage Parks 2023, 11, 182–201. [Google Scholar] [CrossRef]
  3. Misak, R.F.; Abdel Baki, A.A.; El-Hakim, M.S. On the Causes and Control of the Waterlogging Phenomenon, Siwa Oasis, Northern Western Desert, Egypt. J. Arid. Environ. 1997, 37, 23–32. [Google Scholar] [CrossRef]
  4. Zaher, M.A.; Senosy, M.M.; Youssef, M.M.; Ehara, S. Thickness Variation of the Sedimentary Cover in the South Western Desert of Egypt as Deduced from Bouguer Gravity and Drill-Hole Data Using Neural Network Method. Earth Planet. Space 2009, 61, 659–674. [Google Scholar] [CrossRef]
  5. Fahmy, M.; Hossary, M.; Oasis, S. Investigating the Development Challenges to Siwa Oasis, Northwestern Desert, Egypt. N. Y. Sci. J. 2013, 6, 55–61. [Google Scholar]
  6. Abdulaziz, A.M.; Faid, A.M. Evaluation of the Groundwater Resources Potential of Siwa Oasis Using Three-Dimensional Multilayer Groundwater Flow Model, Mersa Matruh Governorate, Egypt. Arab. J. Geosci. 2015, 8, 659–675. [Google Scholar] [CrossRef]
  7. Morgan, P.; Black’well, D.D.; Fanis, T.G.; Boulos, F.K.; Salib, P.G. Preliminary Temperature Gradient and Heat Flow Values for Northern Egypt and the Gulf of Suez from Oil Well Data. Proc. Int. Congr. Therm. Waters Geotherm. Energy Volcanism Mediterr. Area Geotherm. Energy 1976, 1, 424–438. [Google Scholar]
  8. Morgan, P.; Boulos, F.K.; Swanberg, C.A. Regional Geothermal Exploration in Egypt. Geophys. Prospect. 1983, 31, 361–376. [Google Scholar] [CrossRef]
  9. Morgan, P.; Boulos, F.K.; Hennin, S.F.; El-Sherif, A.A.; El-Sayed, A.A.; Basta, N.Z.; Melek, Y.S. Heat Flow in Eastern Egypt: The Thermal Signature of a Continental Breakup. J. Geodyn. 1985, 4, 107–131. [Google Scholar] [CrossRef]
  10. Sturchio, N.; Arehart, G.; Sultan, M.; Sano, Y.; Abokamar, Y.; Sayed, M. Composition and Origin of Thermal Waters in the Gulf of Suez Area, Egypt. Appl. Geochem. 1996, 11, 471–479. [Google Scholar] [CrossRef]
  11. Gad, E.Q.; Ushijima, K.; Ahmad, E.S. Delineation of A Geothermal Reservoir by 2d Inversion of Resistivity Data at Hamam Faraun Area, Sinai, Egypt. In Proceedings of the World Geothermal Congress 2000, Kyushu, Tohoku, Japan, 28 May–10 June 2000. [Google Scholar]
  12. Abdel Zaher, M.; Saibi, H.; Nouby, M.E.; Ghamry, E.; Ehara, S. A Preliminary Regional Geothermal Assessment of the Gulf of Suez, Egypt. J. Afr. Earth Sci. 2011, 60, 117–132. [Google Scholar] [CrossRef]
  13. Zaher, M.A.; Saibi, H.; Nishijima, J.; Fujimitsu, Y.; Mesbah, H.; Ehara, S. Exploration and Assessment of the Geothermal Resources in the Hammam Faraun Hot Spring, Sinai Peninsula, Egypt. J. Asian Earth Sci. 2012, 45, 256–267. [Google Scholar] [CrossRef]
  14. El-Qady, G. Exploration of a Geothermal Reservoir Using Geoelectrical Resistivity Inversion: Case Study at Hammam Mousa, Sinai, Egypt. J. Geophys. Eng. 2006, 3, 114–121. [Google Scholar] [CrossRef]
  15. Mekkawi, M.; Ebohoty, M. Delineation of Subsurface Structures and Tectonics; Geophysical Research Abstracts; European Geosciences Union: Munich, Germany, 2007; Volume 9, p. 05014. [Google Scholar]
  16. Atya, M.A.; Khachay, O.A.; Abdel Latif, A.; Khachay, O.Y.; El-Qady, G.M.; Taha, A.I. Geophysical Contribution to Evaluate the Hydrothermal Potentiality in Egypt: Case Study: Hammam Faraun and Abu Swiera, Sinai, Egypt. Earth Sci. Res. J. 2010, 14, 44–62. [Google Scholar]
  17. Lashin, A. A Preliminary Study on the Potential of the Geothermal Resources around the Gulf of Suez, Egypt. Arab. J. Geosci. 2013, 6, 2807–2828. [Google Scholar] [CrossRef]
  18. Swanberg, C.A.; Morgan, P.; Boulos, F.K. Geothermal Potential of Egypt. Tectonophysics 1983, 96, 77–94. [Google Scholar] [CrossRef]
  19. Zein El-Din, M.Y. Subsurface Geothermal Study in the Central Part of the Northern Western Desert, Egypt. Qatar Univ. Sci. Bull. 1983, 3, 207–215. [Google Scholar]
  20. Mohamed, H.S.; Abdel Zaher, M.; Senosy, M.M.; Saibi, H.; El Nouby, M.; Fairhead, J.D. Correlation of Aerogravity and BHT Data to Develop a Geothermal Gradient Map of the Northern Western Desert of Egypt Using an Artificial Neural Network. Pure Appl. Geophys. 2015, 172, 1585–1597. [Google Scholar] [CrossRef]
  21. Khalil, A.; All, E.; Rabeh, T.; Osman, S. Integrated Geophysical Study to Delineate the Subsurface Structures in Siwa Oasis, Western Desert, Egypt; NASA: Washington, DC, USA, 2015.
  22. Zaher, M.A.; Saibi, H.; Mansour, K.; Khalil, A.; Soliman, M. Geothermal Exploration Using Airborne Gravity and Magnetic Data at Siwa Oasis, Western Desert, Egypt. Renew. Sustain. Energy Rev. 2018, 82, 3824–3832. [Google Scholar] [CrossRef]
  23. Gindy, A.R.; El, A.M. Stratigraphy, Structure, and Origin of Siwa Depression, Western Desert of Egypt. Bulletin 1969, 53, 603–625. [Google Scholar] [CrossRef]
  24. Continental Oil Company; Squyres, C.H.; Klitzsch, E.; Handley, R.; List, F.K.; Pöhlmann, G.; Hay’ah al-Miṣrīyah al-‘Āmmah lil-Batrūl. Geological Map of Egypt 1:500,000. NH 36 SW, Beni Suef; Conoco: Cairo, Egypt, 1987. [Google Scholar]
  25. Said, R. The Geology of Egypt, 1st ed.; Said, R., Ed.; Routledge: Oxfordshire, UK, 2017; ISBN 978-0-203-73667-8. [Google Scholar]
  26. Elshazly, E.M.; Abdel-Hady, M.A.; Elshazly, M.M.; Elghawaby, M.A.; Khawasik, S.M.; Haraga, A.A.; Sanad, S.; Attia, S.H. Application of LANDSAT Imagery in the Geological and Soil Investigations in the Control Western Desert, Egypt. In Earth Resources and Remote Sensing, Proceedings of the International Symposium on Remote Sensing of the Environment, Manila, Philippines, 20 April 1978; NASA: Washington, DC, USA, 1978. [Google Scholar]
  27. Getech. The African Magnetic Mapping Project–Commercial Report; Paterson Grant & Watson Ltd.: Toronto, ON, Canada, 1992. [Google Scholar]
  28. Green, C.M.; Barritt, S.D.; Fairhead, J.D.; Misener, D.J. The African Magnetic Mapping Project; Paterson Grant & Watson Ltd.: Toronto, ON, Canada, 1992. [Google Scholar]
  29. Mendonça, C.A.; Silva, J.B.C. A Stable Truncated Series Approximation of the Reduction-to-the-pole Operator. Geophysics 1993, 58, 1084–1090. [Google Scholar] [CrossRef]
  30. Pirttijärvi, M. Bloxer Interactive Visualization and Editing Software for 3-D Block Models, Version 1.5, User’s Guide; Geophysical Survey of Finland: Espoo, Finland, 2004. [Google Scholar]
  31. Ibrahim, S.A. Studies on Groundwater Possibilities in the Northern Part of the Western Desert-Egypt; Cairo University: Cairo, Egypt, 1991. [Google Scholar]
  32. GPC (the Egyptian General Petroleum Corporation). A Comprehensive Overview, Western Desert, Oil and Gas Fields; EGPC: New Maadi, Cairo, Egypt, 1992; p. 431. [Google Scholar]
  33. Afifi, A.H. Assessment of the Hydrogeological Conditions of Groundwater in Siwa Oasis, North Western Desert, Egypt; Minufiya University: Al Minufiyah, Egypt, 2005. [Google Scholar]
  34. Horner, D.R. Pressure Build-Up in Wells. In Proceedings of the World Petroleum Congress (WPC), Hague, The Netherlands, 28 May 1951. Volume All Days. [Google Scholar]
  35. Waples, D.W.; Pacheco, J.; Vera, A. A Method for Correcting Log-Derived Temperatures in Deep Wells, Calibrated in the Gulf of Mexico. PG 2004, 10, 239–245. [Google Scholar] [CrossRef]
  36. Lachenbruch, A.H.; Brewer, M.C. Dissipation of the Temperature Effect of Drilling a Well in Arctic Alaska; U.S. Geological Survey: Reston, VI, USA, 1959; Bull, 1083-C; pp. 73–109.
  37. Ribeiro, F.B.; Hamza, V.M. Stabilization of Bottom-Hole Temperature in the Presence of Formation Fluid Flows. Geophysics 1986, 51, 410–413. [Google Scholar] [CrossRef]
  38. Shen, P.Y.; Beck, A.E. Stabilization of Bottom Hole Temperature with Finite Circulation Time and Fluid Flow. Geophys. J. Int. 1986, 86, 63–90. [Google Scholar] [CrossRef]
  39. Dowdle, W.L.; Cobb, W.M. Static Formation Temperature from Well Logs—An Empirical Method. J. Pet. Technol. 1975, 27, 1326–1330. [Google Scholar] [CrossRef]
  40. Middleton, M.F. A Model for Bottom-hole Temperature Stabilization. Geophysics 1979, 44, 1458–1462. [Google Scholar] [CrossRef]
  41. Luheshi, M.N. Estimation of Formation Temperatures from Borehole Measurements. Geophys. J. R. Aston. Soc. 1983, 74, 747–776. [Google Scholar]
  42. Lashin, A.; Arifi, N. Some Aspects of the Geothermal Potential of Egypt: Case Study; Gulf of Suez-Egypt. In Proceedings of the World Geothermal Congress, Bali, Indonesia, 25–29 April 2010. [Google Scholar]
  43. Burton-Johnson, A.; Dziadek, R.; Martin, C. Review Article: Geothermal Heat Flow in Antarctica: Current and Future Directions. Cryosphere 2020, 14, 3843–3873. [Google Scholar] [CrossRef]
  44. Tanaka, A.; Okubo, Y.; Matsubayashi, O. Curie Point Depth Based on Spectrum Analysis of the Magnetic Anomaly Data in East and Southeast Asia. Tectonophysics 1999, 306, 461–470. [Google Scholar] [CrossRef]
  45. Turcotte, D.L.; Schubert, G. Geodynamics, 2nd ed.; Cambridge University Press: Cambridge, UK, 2002; ISBN 978-0-521-66624-4. [Google Scholar]
  46. Prensky, S. Temperature Measurements in Boreholes: An Overview of Engineering and Scientific Applications. Log. Anal. 1992, 33, 313–333. [Google Scholar]
  47. O’Leary, D.W.; Friedman, J.D.; Pohn, H.A. Lineament, Linear, Lineation: Some Proposed New Standards for Old Terms. Geol. Soc. Am. Bull. 1976, 87, 1463. [Google Scholar] [CrossRef]
  48. Abrams, W.; Ghoneim, E.; Shew, R.; LaMaskin, T.; Al-Bloushi, K.; Hussein, S.; AbuBakr, M.; Al-Mulla, E.; Al-Awar, M.; El-Baz, F. Delineation of Groundwater Potential (GWP) in the Northern United Arab Emirates and Oman Using Geospatial Technologies in Conjunction with Simple Additive Weight (SAW), Analytical Hierarchy Process (AHP), and Probabilistic Frequency Ratio (PFR) Techniques. J. Arid. Environ. 2018, 157, 77–96. [Google Scholar] [CrossRef]
  49. Hanano, M. Two Different Roles of Fractures in Geothermal Development. In Proceedings of the World Geothermal Congress, Kyushu, Tohoku, Japan, 28 May–10 June 2000. [Google Scholar]
  50. Armandine Les Landes, A.; Guillon, T.; Peter-Borie, M.; Blaisonneau, A.; Rachez, X.; Gentier, S. Locating Geothermal Resources: Insights from 3D Stress and Flow Models at the Upper Rhine Graben Scale. Geofluids 2019, 2019, 8494539. [Google Scholar] [CrossRef]
  51. Wallis, I.C.; Mcnamara, D.D.; Rowland, J.V.; Massiot, C. The Nature of Fracture Permeability in the Basement Greywacke at Kawerau Geothermal Field, New Zealand. In Proceedings of the Thirty-Seventh Workshop on Geothermal Reservoir Engineering Stanford University, Stanford, CA, USA, 30 January–1 February 2012. [Google Scholar]
  52. Grindley, G.W. Geology, Structure, and Exploitation of the Wairakei Geothermal Field, Taupo, New Zealand. N. Z. Geol. Surv. Bull. 1965, 75, 5197846. [Google Scholar]
  53. Hodder, D.T. Application of Remote Sensing to Geothermal Prospecting. Geothermics 1970, 2, 368–380. [Google Scholar] [CrossRef]
  54. Kienholz, C.; Prakash, A.; Kolker, A. Geothermal Exploration in Akutan, Alaska, Using Multitemporal Thermal Infrared Images. In Proceedings of the AGU Fall Meeting Abstracts, San Francisco, CA, USA, 14–18 December 2009; Volume 2009. H53F-1009. [Google Scholar]
  55. Fahil, A.S.; Ghoneim, E.; Noweir, M.A.; Masoud, A. Integration of Well Logging and Remote Sensing Data for Detecting Potential Geothermal Sites along the Gulf of Suez, Egypt. Resources 2020, 9, 109. [Google Scholar] [CrossRef]
  56. Shimron, A.E. Evolution of the Kid Group, Southeast Sinai Peninsula: Thrusts, Melanges, and Implications for Accretionary Tectonics during the Late Proterozoic of the Arabian-Nubian Shield. Geology 1984, 12, 242–247. [Google Scholar] [CrossRef]
  57. Lashin, A. Geothermal Resources of Egypt: Country Update. In Proceedings of the World Geothermal Congress, Melbourne, Australia, 19–25 April 2015; pp. 1–13. [Google Scholar]
  58. Tesfa, B. Benefit of Grand Ethiopian Renaissance Dam Project (GERDP) for Sudan and Egypt. EIPSA Commun. Artic. Energy Water Environ. Econ. 2013, 1, 1–12. [Google Scholar]
  59. Mulat, A.G.; Moges, S. Assessment of the Impact of the Grand Ethiopian Renaissance Dam on the Performance of the High Aswan Dam. J. Water Resour. Prot. 2014, 6, 583–598. [Google Scholar] [CrossRef]
  60. Zaher, M.A.; Nishijima, J.; Fujimitsu, Y.; Ehara, S.E. Assessment of Low-Temperature Geothermal Resource of Hammam Faraun Hot Spring, Sinai Peninsula, Egypt. In Geothermic SGP-TR-191, Proceedings of the Thirty-Sixth Workshop on Geothermal Reservoir Engineering Stanford University, Stanford, CA, USA, 31 January–2 February 2010; Stanford University: Stanford, CA, USA, 2010. [Google Scholar]
  61. Available online: https://www.thinkgeoenergy.com (accessed on 13 January 2019).
  62. Dutiro, L. The Power of the Unknown: Geothermal Energy in Zimbabwe. The Chronicle Published. 11 June 2019. [Google Scholar]
  63. Annual U.S. & Global Geothermal Power Production Report March 2016. Available online: https://Geothermal.Org/Policy_Committee/Documents/2016_Annual_US_Global_Geothermal_Power_Production.Pdf (accessed on 20 June 2020).
  64. Abdallah, A. Assessment of Salt Weathering in Siwa Oasis (The Western Desert of Egypt). Bull. Soc. Geogrphie Egypte 2007, 80, 65–80. [Google Scholar]
Figure 1. Location map of the Siwa Oasis. (a) The location of the study site marked by the yellow box; (b) a closer view of the study site with hot springs temperatures, including the lakes and other important features in the oasis.
Remotesensing 15 05094 g001
Figure 2. The geology of the study area. (a) Description of the various geological rock units in the study area (modified after [24]); (b) a geomorphologic cross-section in NE–SW direction in the Siwa Oasis depending on elevation points from sea level, describing types of rocks and deposits and their elevation relative to sea level.
Remotesensing 15 05094 g002
Figure 3. Display of the vertical geologic succession of the Siwa Oasis, modified after [24,31,32,33].
Remotesensing 15 05094 g003
Figure 4. Outline of the flowchart of the work process.
Remotesensing 15 05094 g004
Figure 5. Display of the geophysical subsurface aeromagnetic map in the Siwa Oasis and surrounding areas in the Western Desert (with Google Earth as a basemap). These data were extracted from Geotech’s compilation study and the African magnetic mapping Project (AMMP) [28,30]. The location of the study area has been marked by a black box, and the Qattara Depression is marked by a yellow polygon.
Remotesensing 15 05094 g005
Figure 6. Geothermal thematic layers extracted from the data of the 27 deep oil wells and interpolated in ArcGIS using the IDW method in the study area and its surrounding regions. (a) The locations of the 27 deep oil wells; the plotted red points show the locations of the oil wells along the study area; (b) geothermal gradient in °C/km; (c) heat flow in mW/m2; (d) thermal conductivity in W/m/K; (e) depth to the crystalline basement in m; and (f) bottom-hole temperature data in °C in the Western Desert.
Remotesensing 15 05094 g006
Figure 7. Model layers derived from LS thermal infrared imagery, DEM data, and surface geological maps. (a) DEM data; (b) lineaments; (c) nighttime land surface temperature; (d) magnetic susceptibility layer; and (e) surface geological rock units.
Remotesensing 15 05094 g007
Figure 8. Reclassified geothermal potential thematic layers. (a) Temperature gradient; (b) heat flow; (c) thermal conductivity; (d) depth to crystalline basement; (e) bottom-hole temperature; (f) surface elevation; (g) lineament density; (h) nighttime land surface temperature; (i) geologic rock units; and (j) magnetic susceptibility.
Remotesensing 15 05094 g008
Figure 9. Inverse relationship of deep oil wells data. Depth to basement rocks compared to (a) heat flow and (b) geothermal gradient.
Remotesensing 15 05094 g009
Figure 10. (a) Geothermal potential map in the Siwa Oasis and surrounding areas; (b) the high and very high geothermal potential zones. Both the northeastern and southeastern areas of the Siwa Oasis are predicted to have high and very high geothermal potential.
Remotesensing 15 05094 g010
Figure 11. The process of land deterioration and soil salinization due to the introduction of salinity in the Siwa Oasis, Western Desert. (a) The Salt Lake in its current state; (b) soil salinization of the land; (c) the lake water intruding into the land; (d) resulting land degradation from the salinization process. Source [64].
Remotesensing 15 05094 g011
Table 1. Corrections to the bottom-hole temperature data using both the Gulf of Mexico and the Horner correction methods.
Well NameLatitudeLongitudeDepth (m)Original Measured T (°C)Gulf of MexicoHorner
(°F)(°C)(°F)(°C)
Siwa P-1X30°10′11.471′′N25°55′50.992′′E4724.4123.4245.3118.5251.06121.7
Ain Quruyshat29°11′19.42′′N25°32′34.62′′E7103488.3431.389.632
Siwa Well 130°18′14.656′′N26°01′31.652′′E5029.286.2182.1283.4186.0885.6
Ain Camisa29°11′06.09′′N25°31′29.33′′E6623090.1432.384.229
Ain Guba29°13′53.53′′N25°32′00.84′′E6203284.9229.48630
Siwa Well 229°10′9.8′′N25°33′17.4′′E96043104.1840.1107.642
Disclaimer/Publisher’s Note: The statements, opinions and data contained in all publications are solely those of the individual author(s) and contributor(s) and not of MDPI and/or the editor(s). MDPI and/or the editor(s) disclaim responsibility for any injury to people or property resulting from any ideas, methods, instructions or products referred to in the content.

