Abstract
The validation of satellite remote sensing surface reflectance products is aimed at comparing the reflectance pixel values of products with ground measurement values at the pixel scale. Due to the existence of surface heterogeneity, we cannot obtain the satellite pixel scale truth value through ground sampling, and only the satellite relative pixel scale truth value that closely approximates it can be acquired. The process of converting the point-scale spectrum of ground sampling into a pixel-scale spectrum will produce certain errors, known as point-to-pixel-scale conversion uncertainty, which is closely related to the type of sample area and the ground sampling method. In this study, we conducted research on the uncertainty of point-to-pixel-scale conversion generated via different ground sampling methods in the upscaling process. We utilized unmanned aerial vehicle (UAV) hyperspectral images to invert the surface reflectance spectral curves of wheat, corn, bare soil, and soybeans at the pixel scale, and simulate the ground measurement spectra and satellite pixel scale ground truth of different sampling methods, so as to realize the quantitative calculation of the uncertainty of the ground truth at the satellite pixel scale. On this basis, we analyzed in depth the effects of the sampling method, measurement height, and number of spectra on the scale conversion uncertainty. The research results show that airborne hyperspectral images can accurately simulate the spectra of ground measurements, and can be used as an effective means of ground spectral sampling and uncertainty analysis. When using the systematic sampling method, the more the sampling points, the smaller the uncertainty. However, the uncertainty of scale conversion tends to stabilize when the number of sampling points is increased to a certain quantity. As the height of ground measurement increases, the number of spectra within the elementary sampling unit (ESU) increases, leading to smaller scale conversion uncertainties. The research results of this study will provide support for the subsequent optimization of ground sampling methods and the improvement of measurement efficiency and measurement accuracy.
1. Introduction
Surface reflectance is the foundation of quantitative remote sensing. Most quantitative remote sensing products are based on surface reflectance products, and through further processing and analysis, it is possible to obtain more advanced products, such as leaf area index, vegetation cover, surface biomass, etc. Therefore, ensuring the quality of surface reflectance products is of great significance to maintaining the integrity of the research outcomes of these application areas [1]. Validation is an effective means of assessing the quality and reliability of remote sensing products. The validation of surface reflectance products has important research significance and practical value for quantitatively analyzing the accuracy of remote sensing products and improving the level of quantitative remote sensing applications.
Many scholars have conducted research on the validation of remote sensing products. The Committee on Earth Observing Satellites (CEOS) carried out remote sensing data calibration and validation on a global scale as early as in 1984 [2]; the National Aeronautics and Space Administration (NASA) has specifically established the MODIS Land (MODLAND) product validation team to carry out the validation of various MODIS land data products [3]. Roman et al. proposed a method to estimate the spatial representativeness of observation sites and selected better sites for the validation of MODIS BRDF/Albedo products [4]. Cescatti et al. obtained relative ground truth data from FLUXNET station data and conducted validation for MODIS 500 m albedo data [5]. Hufkens et al. conducted research on the upscaling of LAI (leaf area index) field measurements and the uncertainties associated with it [6]. Chinese scholars have also carried out many studies on validation. In 2001, the validation of the MODIS land surface parameter inversion algorithm was carried out in Shunyi, Beijing [7]. Some scholars have conducted calibration and validation for domestically produced satellites such as the FY satellite [8] and HJ satellite [9]. Li et al. conducted validation of a series of key ecological and hydrological remote sensing products [10]. Wu et al. conducted research on surface the heterogeneity measurement and optimized sampling of sample points [11], scale effects and scale conversion [12,13], etc.
The international community also attaches great importance to the high-precision measurement of surface reflectance. The Working Group on Calibration and Validation (WGCV) of the CEOS initiated the Radiometric Calibration Network (RadCalNet) in 2014 to provide automated surface and top-of-atmosphere (TOA) reflectance data from multiple participating ground sites to the worldwide user community, so as to support the radiometric calibration and validation of optical imaging sensor data [14]. RadCalNet data are used to evaluate the radiometric stability and accuracy of individual satellite sensors and assess the radiometric consistency of multiple sensors [15]. RadCalNet data can also be applied to the absolute radiometric calibration of airborne imagers [16].
Similar to other remote sensing products, the validation of surface reflectance products also presents several challenges, including, or example, how to determine the optimal ground sampling method, how to obtain the pixel-scale relative truth value, and how to quantitatively calculate the uncertainty of ground measurement value. These issues all require further research.
In traditional approaches, the absolute pixel-scale ground truth value cannot be obtained. Instead, the reference value is used as a theoretical truth, serving as a substitute value for the ground truth. An ideal ground truth measurement method is to obtain the measurement values of all points within the pixel scale through a ground carpet-style measurement method and use the average of the measurement values of all points as the ground truth value. However, this method is not suitable for ground reflectance measurement. This is because, during ground measurement processes, the reflectance of the ground measurements is affected by various factors such as measurement personnel, solar angles, atmospheric conditions, and so on. The errors caused by these factors are much greater than the errors caused due to ground heterogeneity during ground reflectance measurements. Therefore, the carpet-style measurement method cannot obtain the true value of surface reflectance.
Hyperspectral images can simultaneously acquire both ground spectral information and spatial dimensional information. Airborne hyperspectral remote sensing can acquire images that simultaneously possess high spectral resolutions and high spatial resolutions. Additionally, through processing, spectral pixels for all points within the satellite pixel scale can be obtained. Therefore, the surface reflectance products obtained from the inversion of airborne hyperspectral images can be used to simulate ground measurement spectral values for all points within the scale range, and to obtain the true value of ground spectra in a theoretical sense, providing a basis for further analyzing the uncertainty of ground measurement spectra.
Therefore, this study proposes a method for evaluating the uncertainty of ground spectral measurements based on airborne hyperspectral images. Firstly, airborne hyperspectral images are processed to achieve hyperspectral surface reflectance with a high similarity to that of the ground-measured spectra. Then, the spectral reflectance of ground measurements is simulated using different sampling methods as the measured spectra, using the average spectral reflectance of all points within the entire area as the reference spectra. By calculating the relative differences between various measured spectra and reference spectra, the uncertainty of ground spectra-scale conversion is obtained. Finally, we analyzed the effects of different sampling methods, different measurement heights, and different spectral numbers on measurement uncertainty, which provides a reference for the subsequent further improvement of the accuracy and measurement efficiency of ground spectral measurements.
2. Study Area and Data
2.1. Introduction of Study Area
There are two research areas in this study, the Xiong’an experimental site and the Yan’qing experimental site.
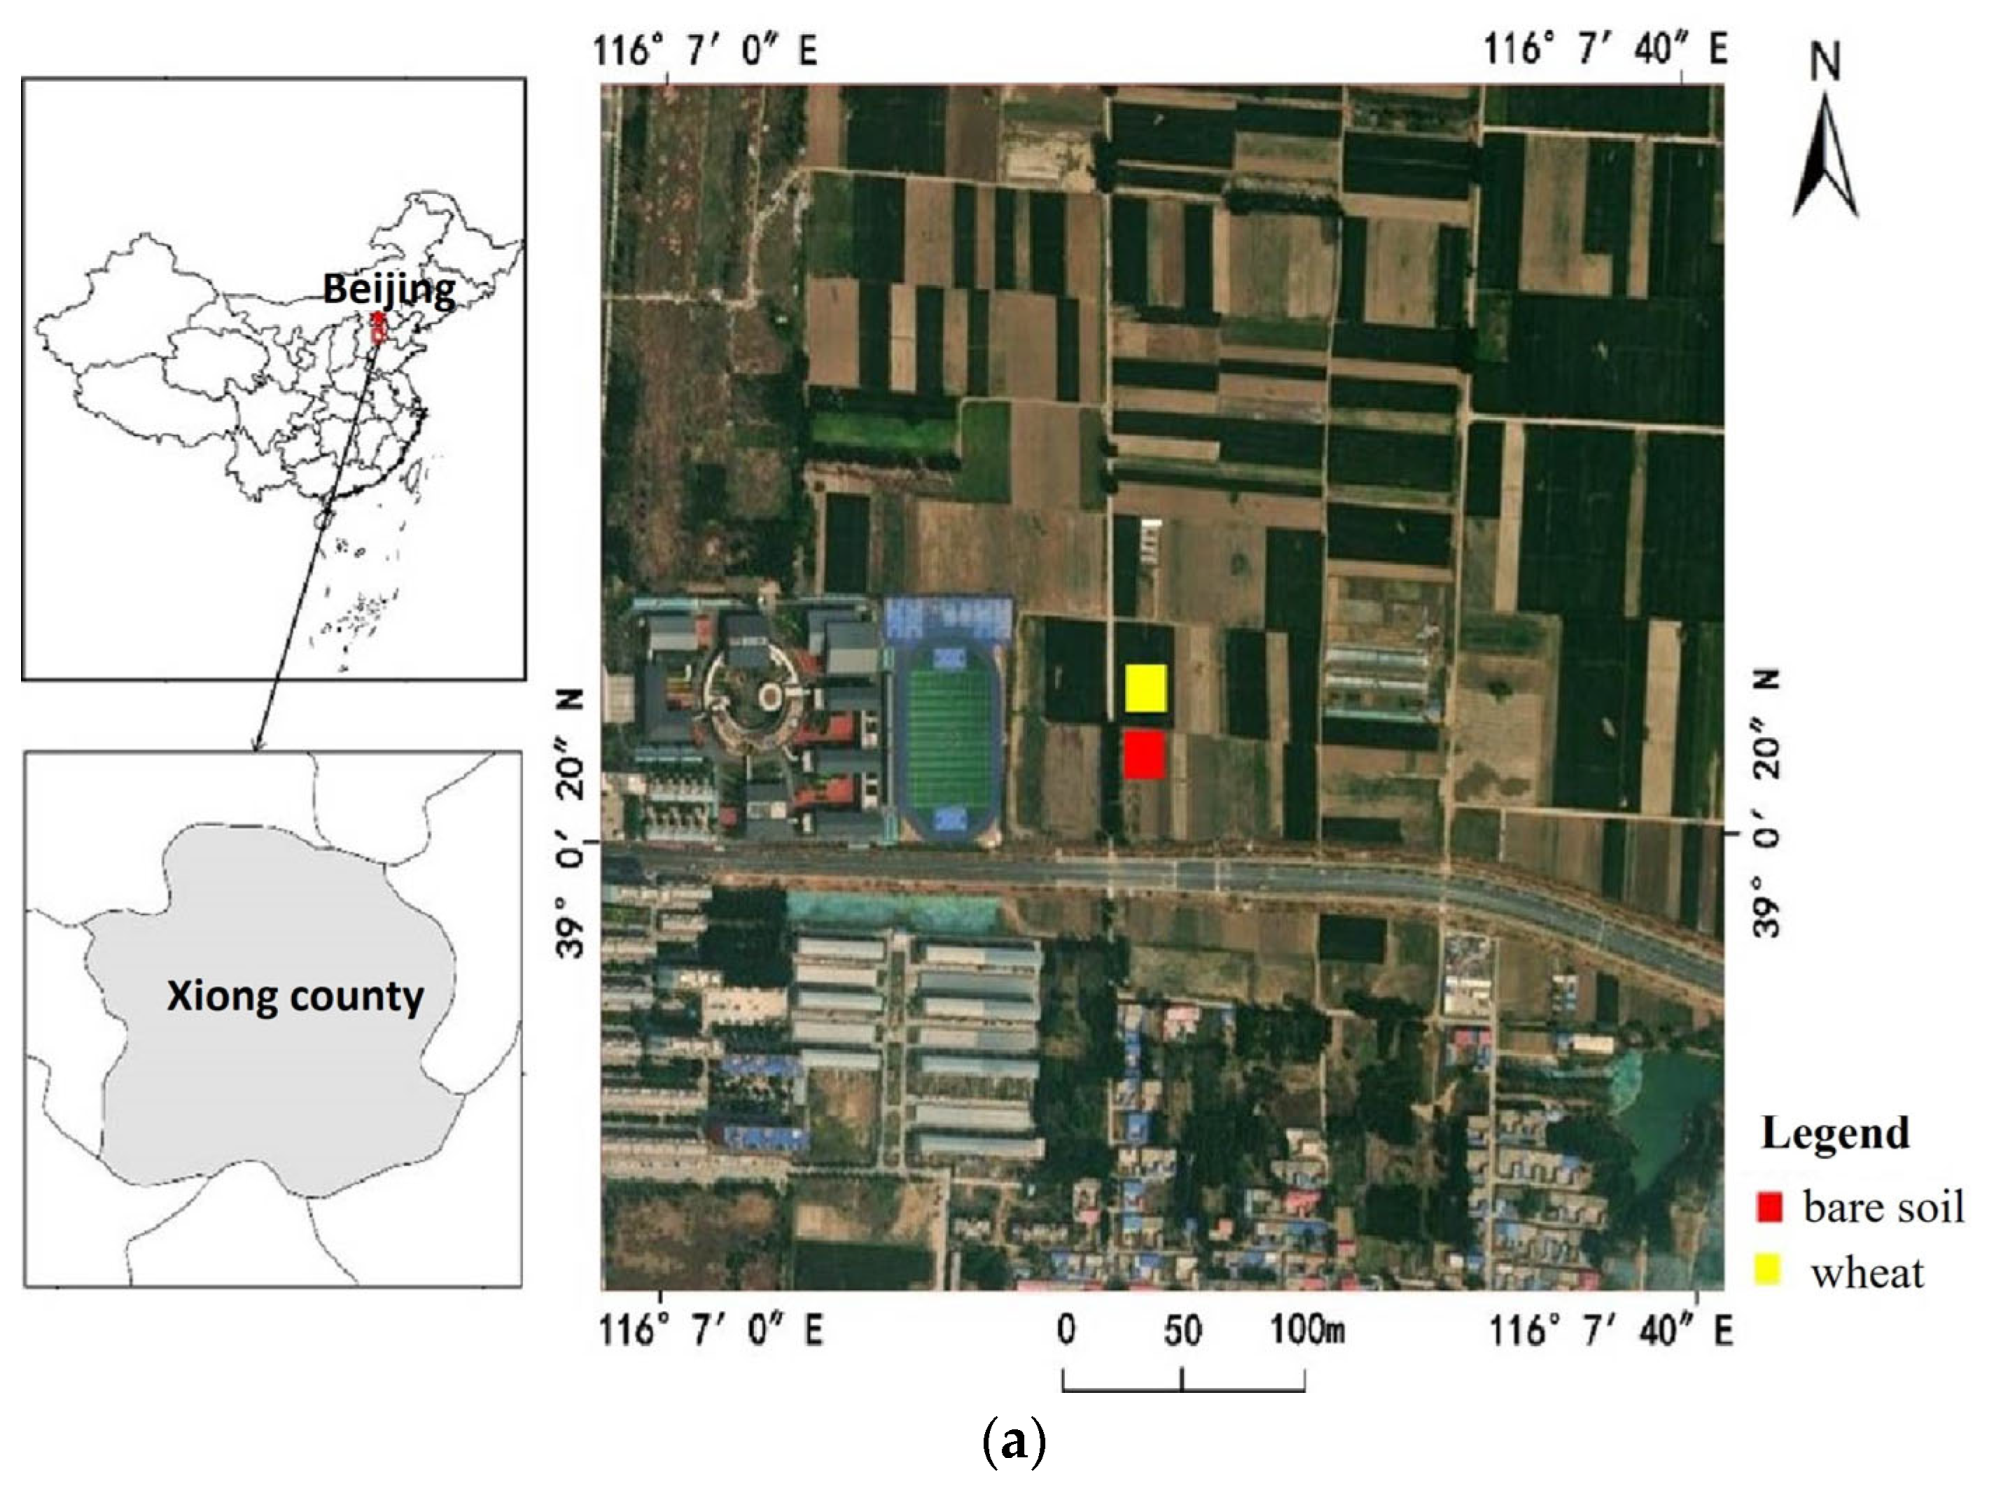
The Xiong’an experimental site is located in Xiong County, Xiong’an New Area, Hebei Province, China (Figure 1a), with geographic coordinates of 116.1161°E and 39.0053°N, and an elevation of 96 m. The experimental sites were wheat and bare soil, and ground experimentation was conducted on 28 May 2021. During this period, the wheat was in the filling stage, with full ridge sealing, and a height of approximately 50 cm. Bare soil refers to soil that has been tilled, without any vegetation cover. The two experimental areas are larger than 30 m by 30 m, serving as two pure land cover pixels for obtaining ground truth values at the satellite pixel scale. In this case, wheat represents pure vegetation cover, while bare soil represents no vegetation cover.
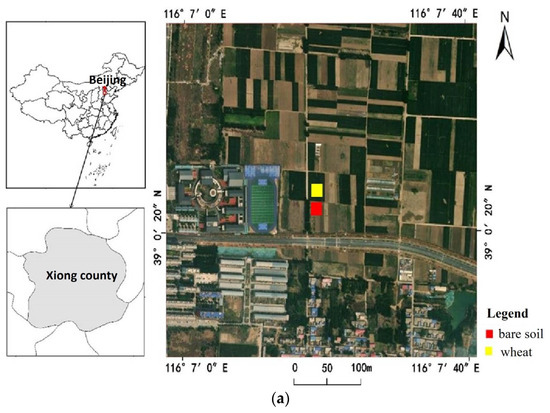
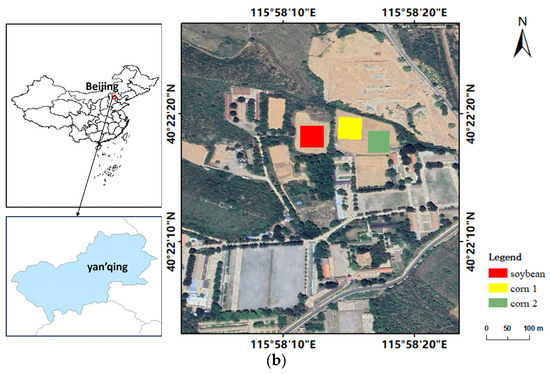
Figure 1.
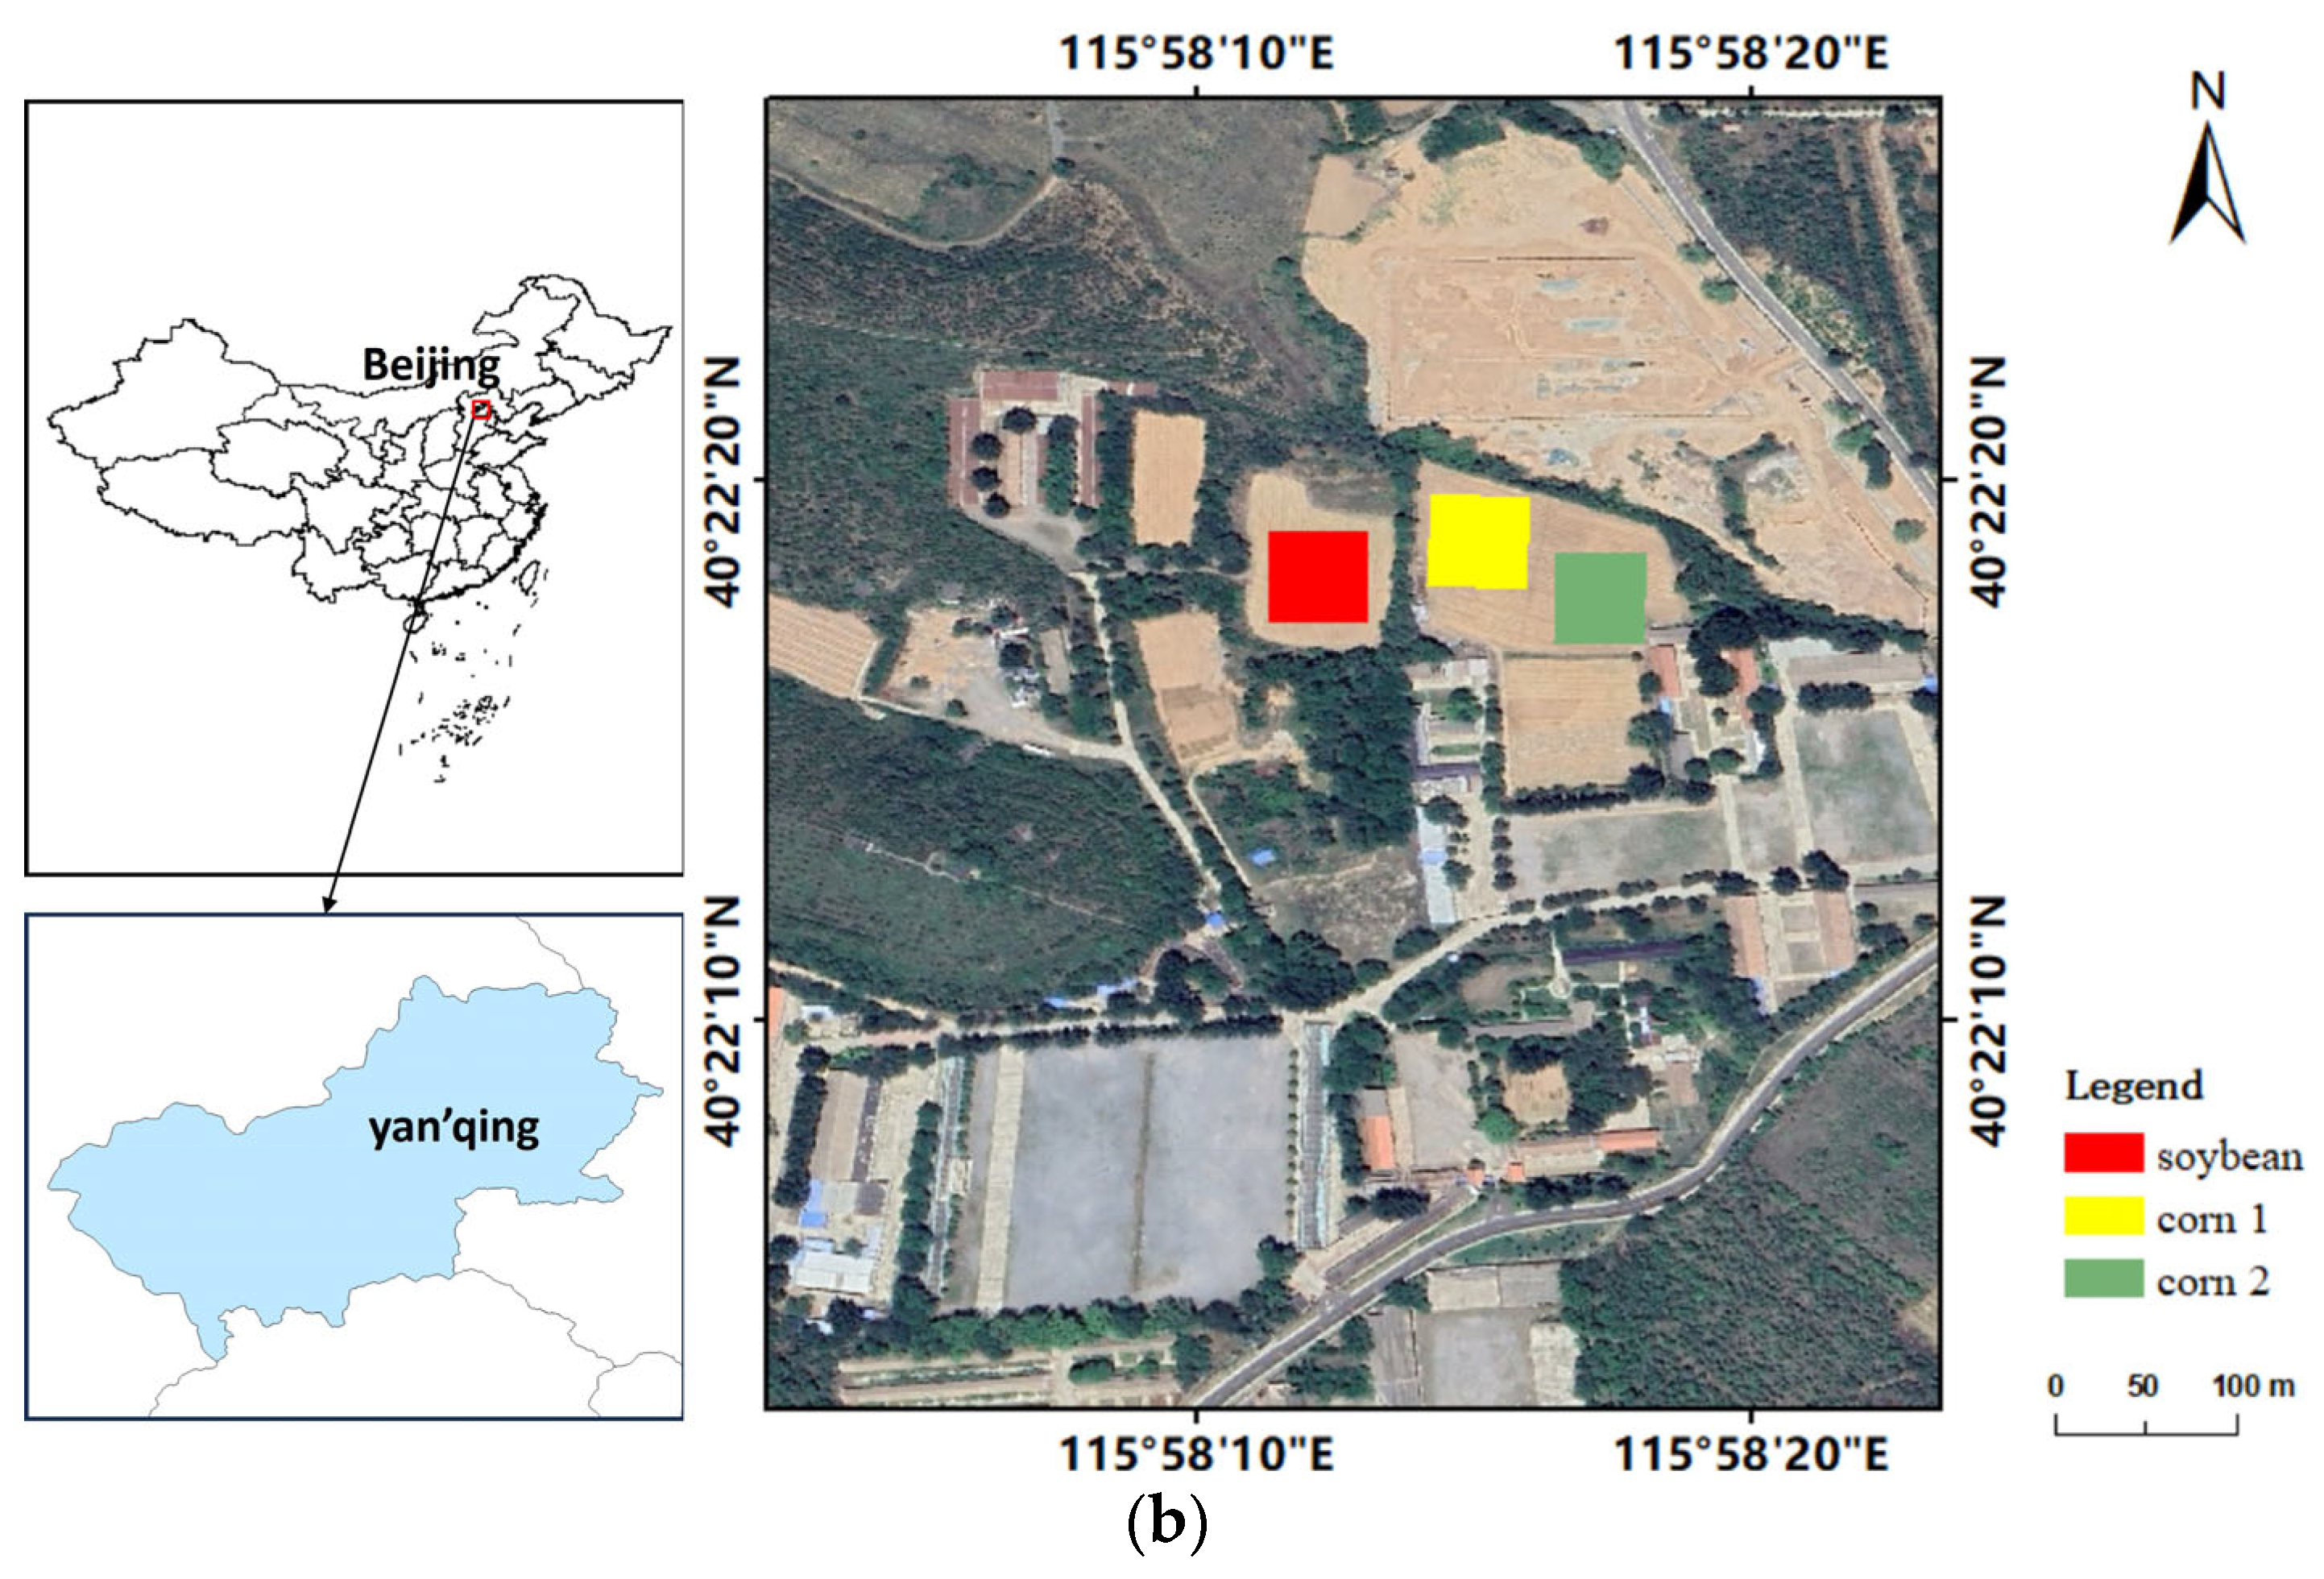
Experimental areas: (a) the xiong’an experimental area; (b) the yan’qing experimental area.
The second study area is located in Yan’qing District, Beijing (Figure 1b), with geographical coordinates of 40.3714°N and 115.9711°E, and an elevation of 607 m. The experimental sites were corn and soybean, and ground experimentation was conducted on 29 June 2023. During this period, the corn was in the jointing stage at a height of 50 cm; the soybean was in its vigorous growth stage at a height of about 20 cm. Both corn and soybean were in the growth phase, not covering the entire field, which can be considered a mixed-pixel site. In this context, the corn area can be seen as a 50 cm high site with sparse vegetation; the soybean area can be seen as a 20 cm high site with sparse vegetation.
2.2. Data
The airborne hyperspectral data of Hyspex1240 (HySpex, Oslo, Norway) are selected to simulate the uncertainty analysis of ground spectral truth acquisition. Hyspex1240 is an airborne hyperspectral camera developed in Norway (Figure 2) which can be mounted on an unmanned aerial vehicle (UAV) for imaging; its relevant parameters are shown in Table 1. During the experiment, the flying altitude was 100 m, corresponding to a spatial resolution of 2.7 cm for the hyperspectral images. Hyspex consists of 1240 probe elements and operates using the pushbroom imaging method, obtaining 200 bands through spectral splitting. Hyspex can be mounted on hexacopter UAV, with a flight time of 45 min without the payload and 30 min with the payload.

Figure 2.
Hyspex hyperspectral camera.

Table 1.
Hyperspectral camera parameters.
Figure 3 shows the hyperspectral images of five sample areas: bare soil, wheat, soybean, and corn. Among them, two sample areas were selected for corn, representing relatively dense and relatively sparse vegetation. The size of each sample area is 30 m × 30 m, and the corresponding pixel size is 1111 × 1111. During the experiment, hyperspectral images of the site and corresponding ground spectra were acquired. The size of the sample area of 30 m × 30 m was selected for two main considerations: (1) At present, the spatial resolution of most land satellites is less than or equal to 30 m, such as that of the Gaofen-1 satellite (2 m/8 m/16 m) and that of the Sentinel-2 satellite (10 m/20 m); the spatial resolution of the Gaofen-5 hyperspectral camera and Landsat8/9 are both 30 m. (2) The site with a size of 30 m is convenient for selection, and hyperspectral images of a single vegetation type in a 30 m × 30 m area can be cropped from all experimental areas.

Figure 3.
Remote sensing image of the experimental area (site size: 30 m × 30 m). (a) Bare soil, a non-vegetation experimental area; (b) wheat, a dense vegetation area; (c) soybean, a low, sparse-vegetation experimental area; (d) corn1, a medium-height, dense-vegetation experimental area; (e) is corn2, a medium-height, sparse-vegetation experimental area.
Hyperspectral image acquisition was conducted under clear and cloudless weather conditions, with each flight lasting no more than 20 min. Variations in weather between different flight paths can be disregarded. The hyperspectral UAV has its own POS (Position and Orientation System) during acquisition, which enables the geometric correction and positioning of hyperspectral images. The acquired hyperspectral images are preprocessed to obtain test data for the uncertainty assessment of ground truth acquisition at satellite pixel scales.
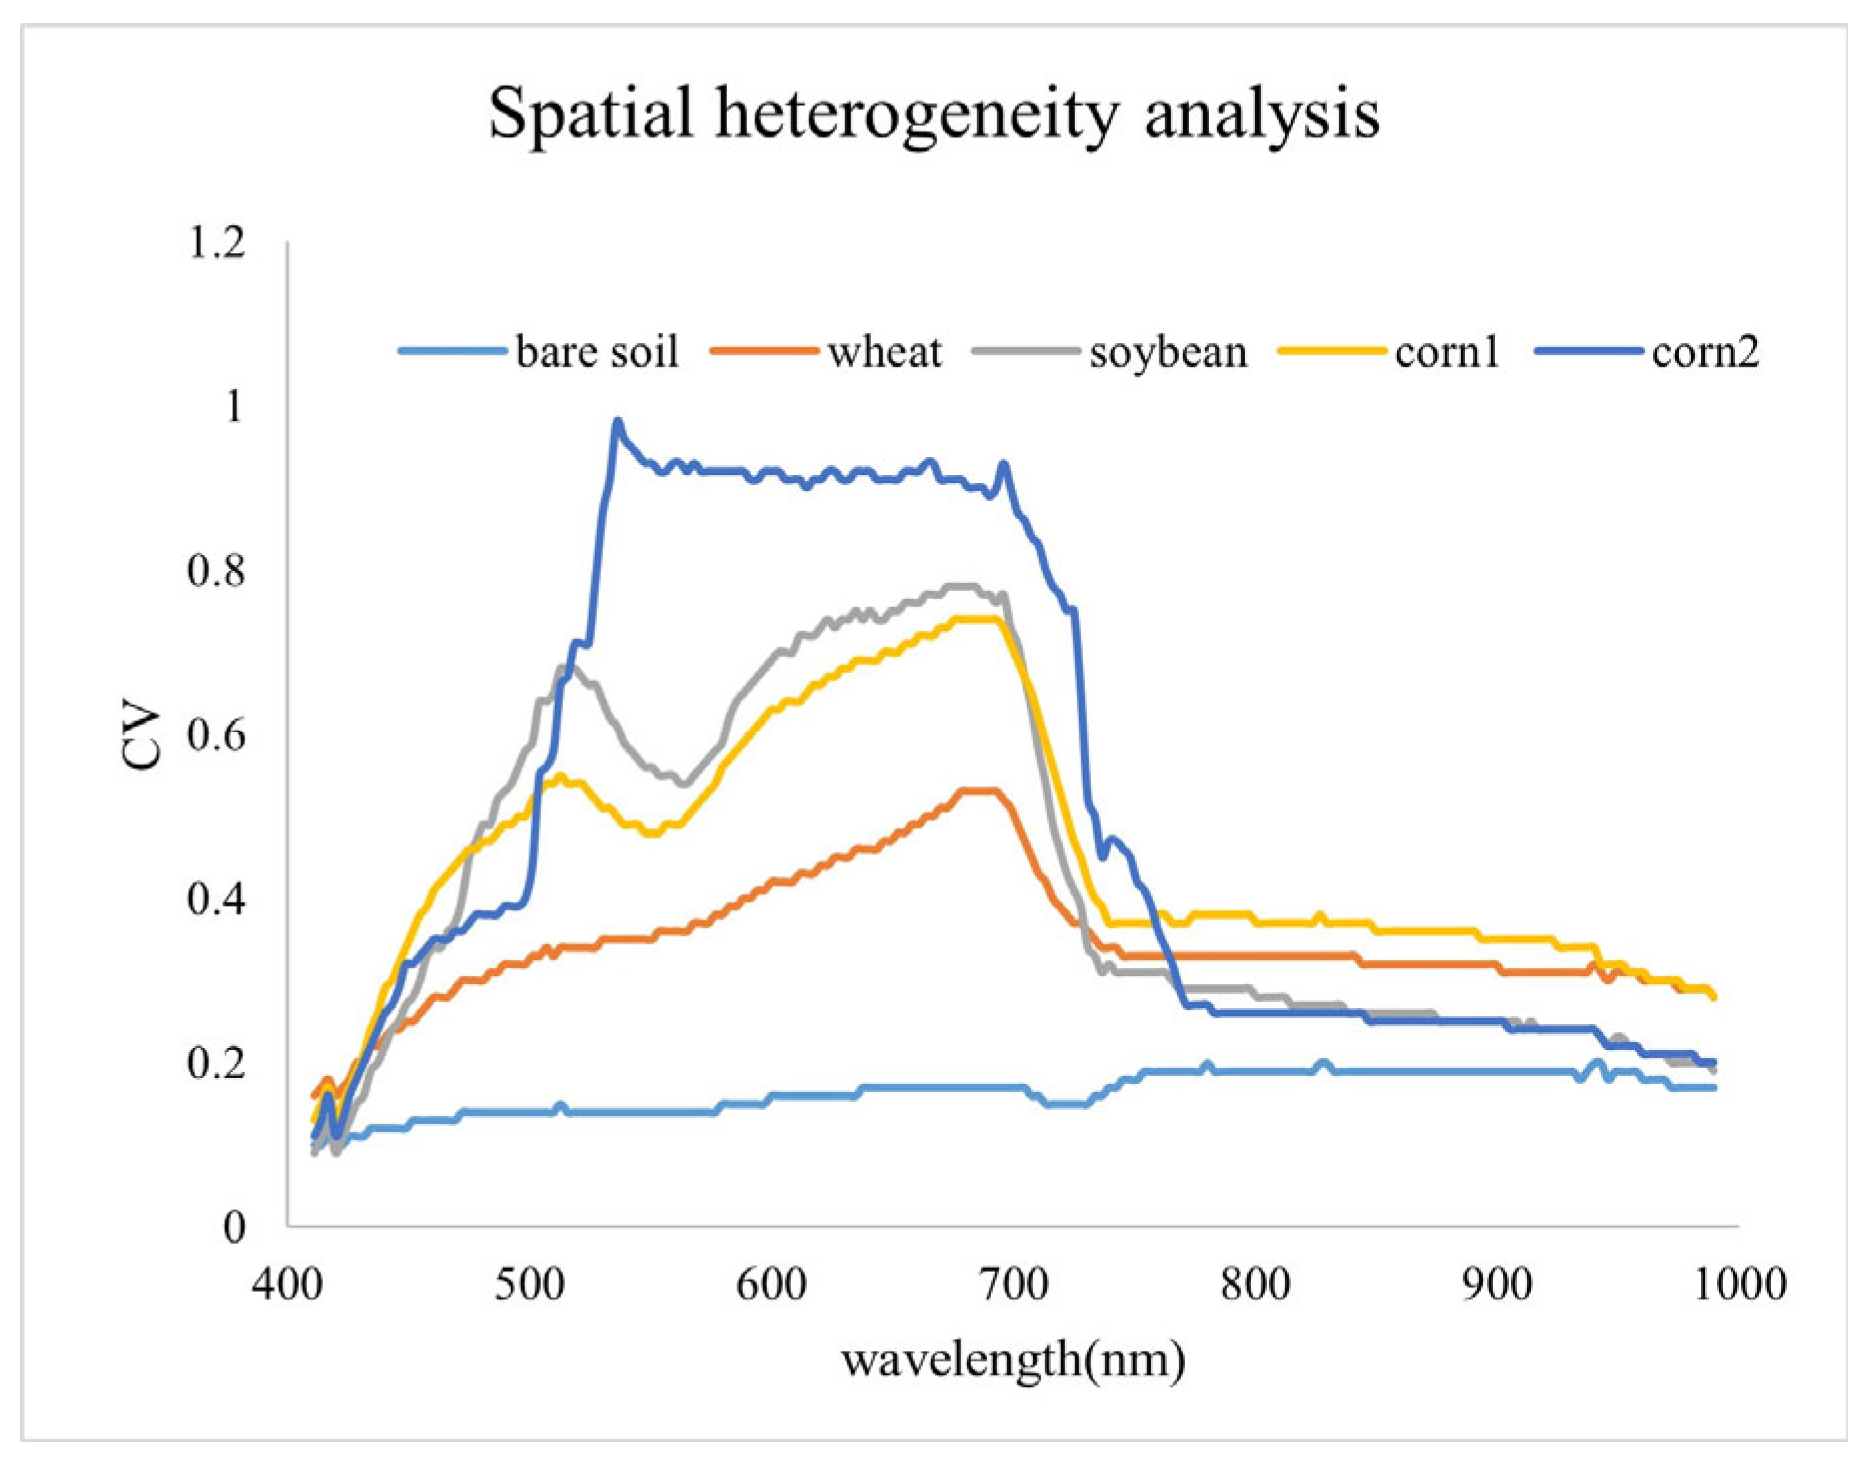
The sampling uncertainty of a sample area is closely related to its spatial heterogeneity, so it is necessary to analyze the spatial heterogeneity of the five sample areas. Spatial heterogeneity is obtained by using the coefficient of variation of hyperspectral images. The corresponding formula is as follows:
where represents the i-th band; represents the image reflectance value of the -th band; represents the standard deviation of the reflectance of the -th band; represents the average reflectance of the -th band; represents the coefficient of variation of the -th band.
Through calculation, we can obtain the spatial heterogeneity evaluation index of 200 bands of the Hypsex hyperspectral image, as shown in Figure 4. It can be seen that the spatial heterogeneity of bare soil is the smallest, and its value is below 0.2. The spatial heterogeneity of wheat increases, with values ranging from 0.2 to 0.5. Among them, the value of 400–700 nm increases with the increase in wavelength; after 700 nm, the value decreases with an increasing wavelength. The spatial heterogeneity results of soybean and corn1 are relatively close. In the range of 400–700 nm, the value varies between 0.2 and 0.8; after 700 nm, the value quickly decreases to about 0.3. Corn 2 has the highest spatial heterogeneity. Between 400 and 700 nm, the value can reach 1; after 700 nm, the value quickly decreases to below 0.3.
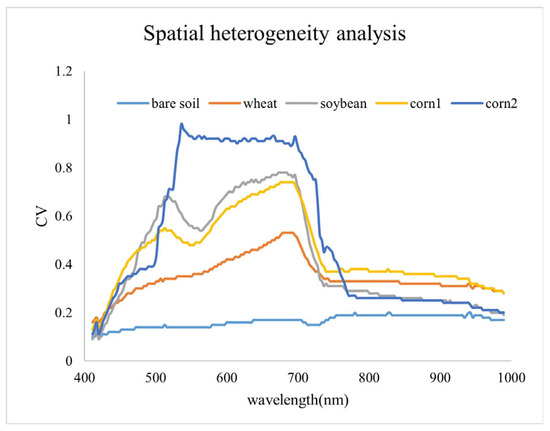
Figure 4.
Spatial heterogeneity of five sample areas.
3. Methods
3.1. Data Preprocessing
3.1.1. Hyperspectral Image Preprocessing
The hyperspectral data are preprocessed in five steps:
- Radiometric calibration of hyperspectral images is performed to convert hyperspectral images from a gray value into apparent radiance.
- Geometric correction of hyperspectral images is performed to eliminate geometric distortions caused by the hyperspectral camera or the surrounding environment, thereby improving the plane positioning accuracy of the images.
- Atmospheric correction of hyperspectral images is performed to convert hyperspectral images from apparent radiance into surface reflectance. The atmospheric correction method is based on the MODTRAN radiative transfer model, and the atmospheric parameters are input to achieve the inversion of surface reflectance. Among them, based on the imaging area and imaging date of the images, the aerosol model selects the rural type, and the atmospheric model selects the mid-latitude summer mode. The ground altitude is determined based on the experimental area’s elevation; the flying altitude is 100 m.
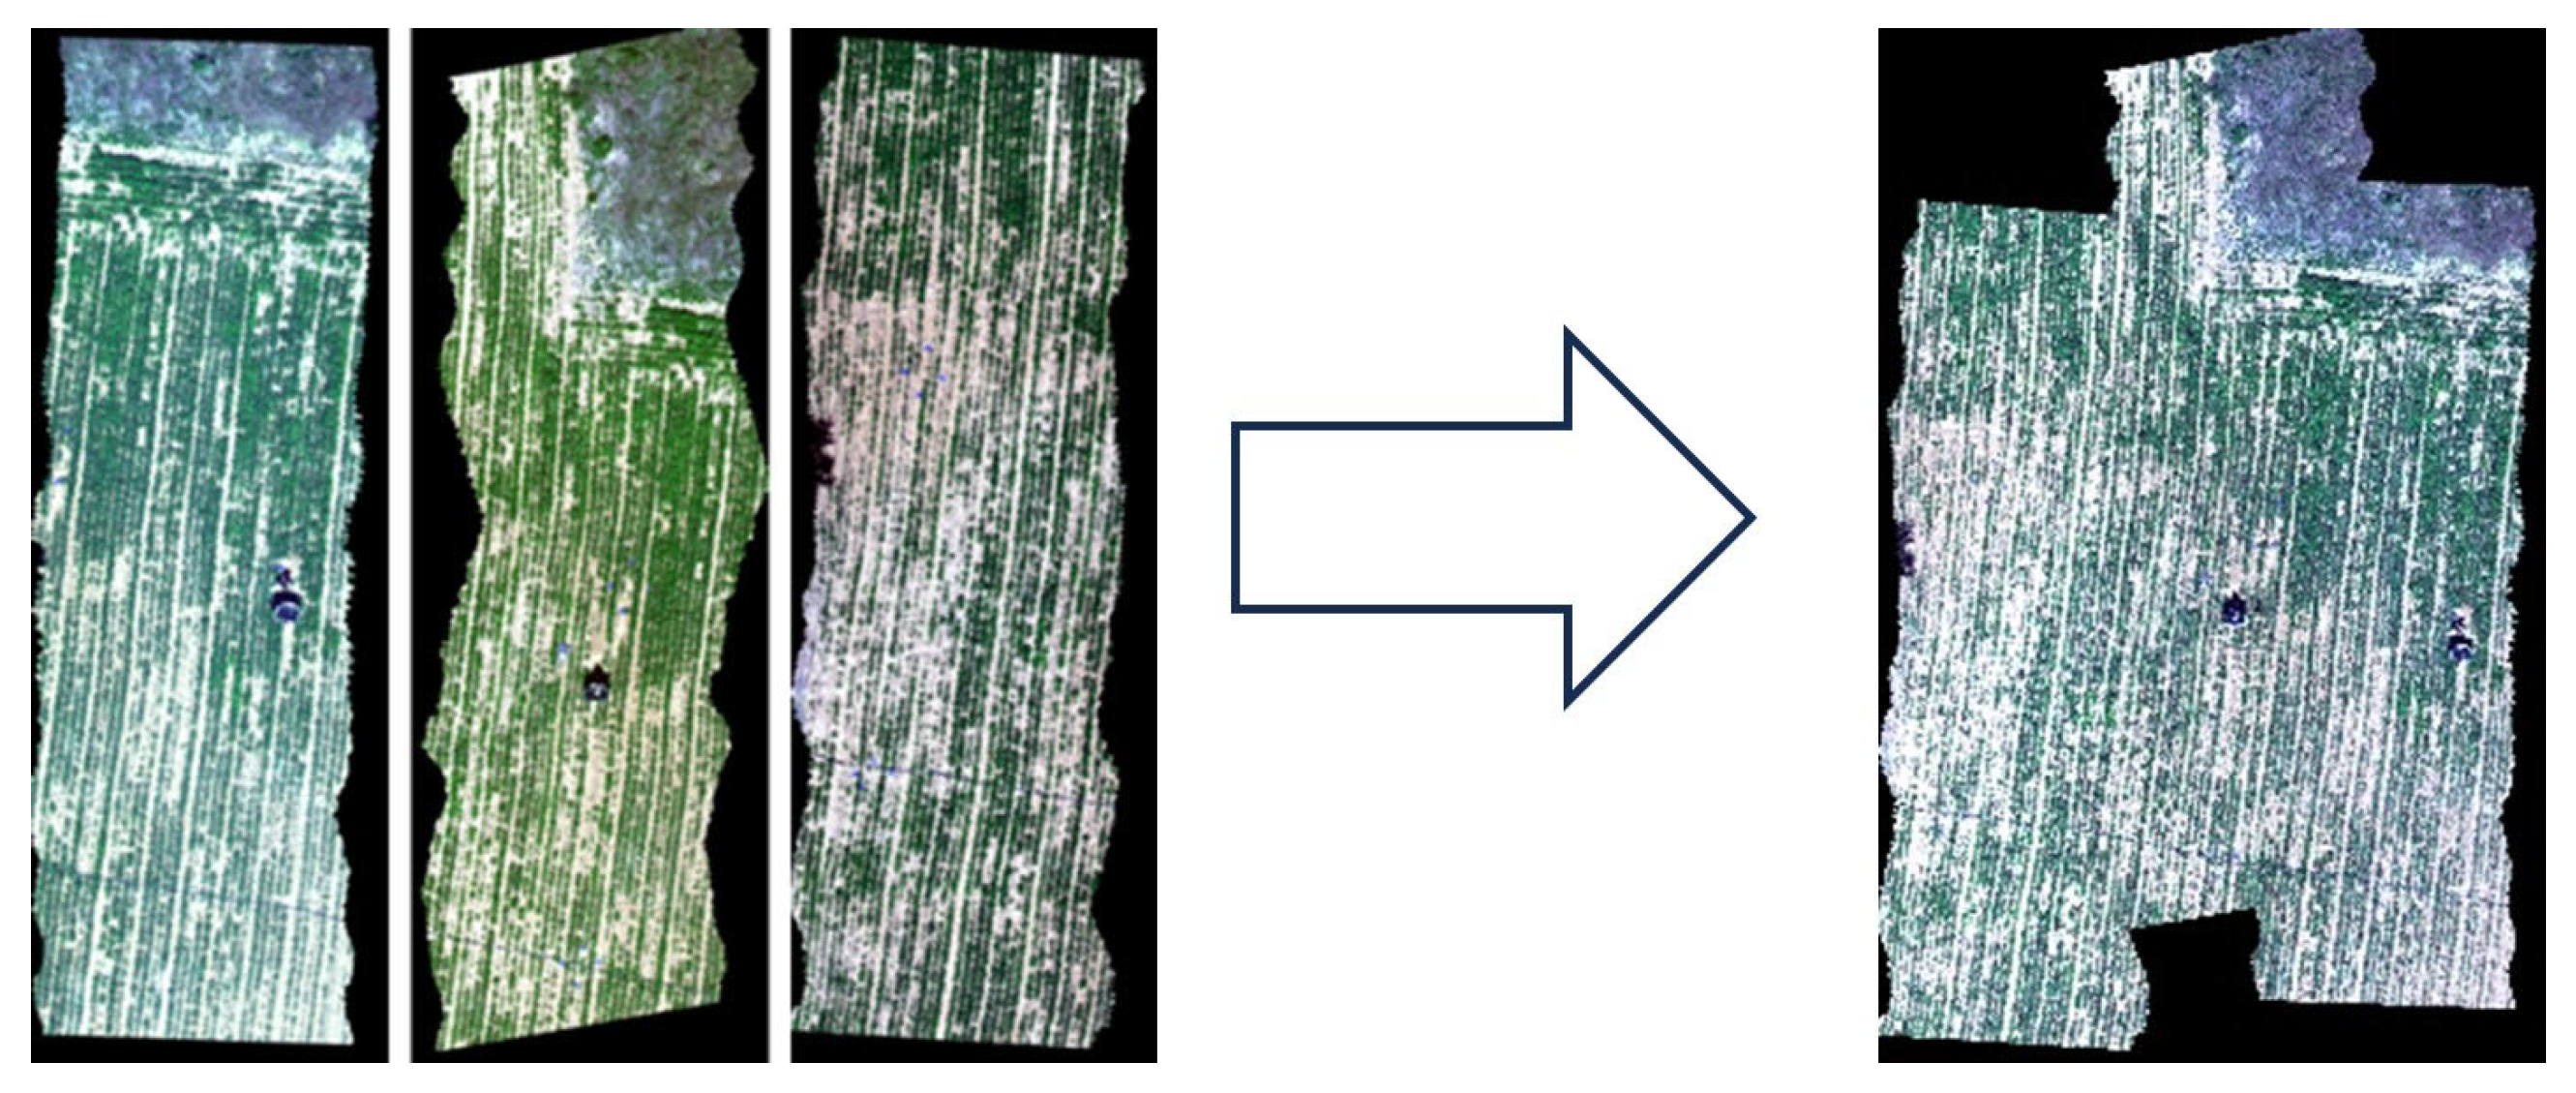
- The hyperspectral image is geometrically stitched to obtain a hyperspectral image covering the entire experimental site. The width of the site in the Xiong’an area is about 40 m, and there is only one flight strip in the whole sample area, which does not require image stitching. In the Yan’qing area, there are 4 flight strips for corn and 3 flight strips for soybeans, requiring the stitching of the hyperspectral images.
- By clipping the images, five hyperspectral images with a size of 30 m × 30 m (corresponding to the number of pixels 1111 × 1111) can be obtained. The spatial resolution is 2.7 cm, the number of bands is 200, and the spectral range is 400–1000 nm (as shown in Figure 3).
It is worth mentioning that, the hyperspectral imagery of Xiong’an is composed of images from a single flight strip without the need for stitching, while the hyperspectral imagery of the Yan’qing region is composed of 3–4 flight strips, requiring stitching and processing (Figure 5). Figure 6 shows the comparative results before and after the stitching of hyperspectral images of soybeans in the Yan’qing area. As shown in Figure 6, by stitching surface reflectance products of different flight strips that have been processed via atmospheric correction, a larger area of the hyperspectral image can be obtained. Since the imaging time interval of the three flight strips was less than 5 min, there were barely any changes in the surface and the atmosphere, so the stitched image has no chromatic aberration.

Figure 5.
Stitched images of hyperspectral flight experiment: (a) a stitched image of the corn area—horizontally stitched together from four flight strips; (b) a stitched image of the soybean area—vertically stitched together from three flight strips.
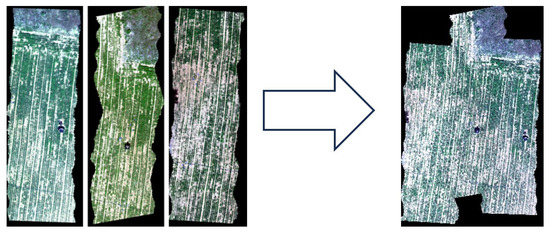
Figure 6.
Comparison of images before and after stitching of hyperspectral flight experiment.
3.1.2. Ground Object Spectrometer Data Processing
In the study, we used a ground object spectrometer (SR8800) to measure the ground object spectrum. The spectral range of the SR8800 is 350–2500 nm. In the spectral range matching that of the hyperspectral camera (i.e., 400–1000 nm), the spectral resolution in the 400–700 nm range is 2.8 nm, the spectral resolution in the range of 700–1000 nm is 8 nm, and the sampling interval of the spectrometer is 1 nm.
The ground object spectrometer directly measures the spectral radiance, which needs to be converted into the reflectance spectra that can be compared with the reflectance spectra inverted by the UAV through a certain method, thereby verifying the reliability of the reflectance spectra inverted by the UAV. The specific method is as follows:
First, the solar irradiance spectrum () is measured under field conditions. Usually, we use a calibrated diffuse reflector as a reflectance reference board, and use a spectrometer to measure the radiance spectrum of the reference board to calculate the irradiance spectrum of the solar light reaching the surface. The calculation formula of is as follows:
where represents the wavelength; represents the radiance of the reference board measured using the spectrometer, is the reflectance of the reference board, which has been obtained through laboratory calibration.
According to the definition and formula of directional reflectance, after measuring the solar irradiance spectrum, it is possible to calculate the spectral reflectance of the target by synchronously measuring the target’s reflected radiance spectrum, as shown in the following formula:
where represents the target radiance spectrum observed using the spectrometer in the direction, where and represent the zenith angle and azimuth angle of observation, respectively, and is the calculated target surface reflectance spectrum.
3.2. Construction of Ground Spectral Sampling Model
Surface sampling methods can be divided into two main categories. One is the traditional sampling method, which regularly selects one or several measurement points in the sample area for ground spectral measurement, without relying on other auxiliary image information, only using spectral information and corresponding longitude and latitude information for measurement. The other is a sampling method based on other reference images, such as stratified sampling [17,18], simulated annealing sampling [19,20,21], etc. The characteristic of this type of sampling is that the sampling method is highly dependent on the information of the reference image. On the one hand, the uncertainty of the sampling result depends on the quality of the selected reference image, and the stability of the accuracy is poor. On the other hand, measurement can only be carried out in areas with reference images, and the reference images need to be analyzed in advance, which makes the processing process complicated and the universality poor.
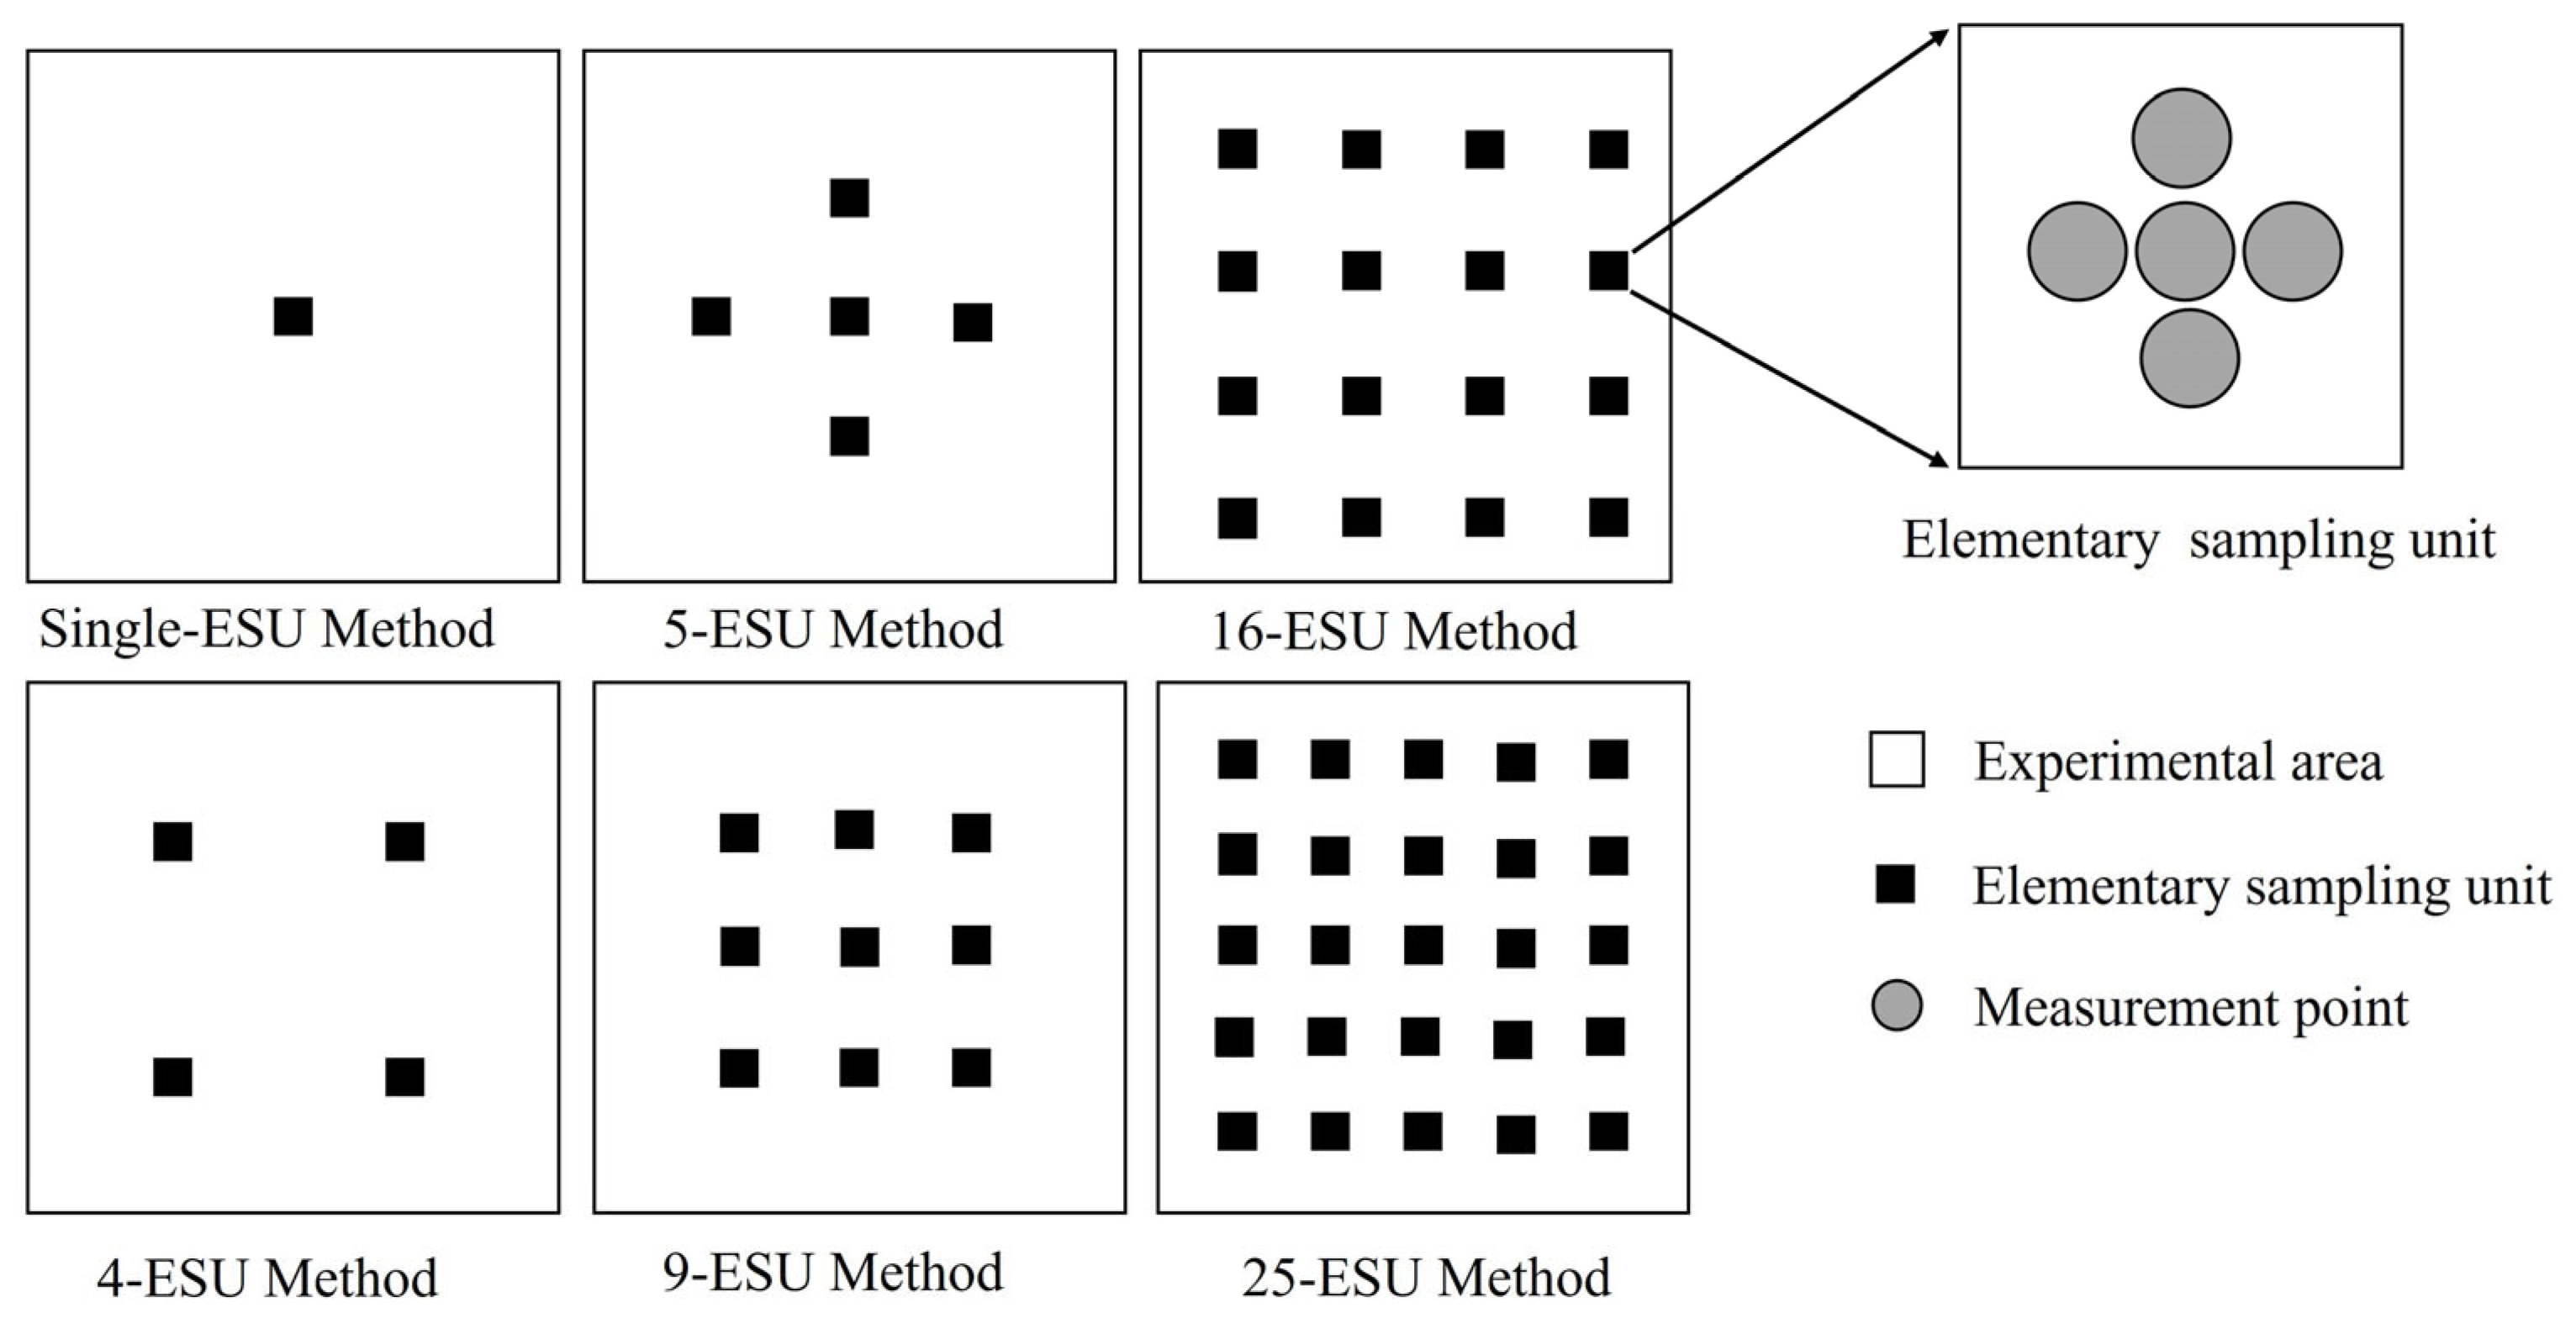
For this reason, this study only analyzes the traditional sampling method. Combining the field spectral measurement experience, measurement time, and other factors, six spectral sampling methods are proposed, namely the single-ESU method, 4-ESU method, 5-ESU method, 9-ESU method, 16-ESU method, and 25-ESU method. The area of each ESU is 2 m × 2 m. In the ESU, five spectra are selected to be measured in a “cross” pattern; this means measuring one spectrum at the top, middle, and bottom, and on the left and right of the ESU (as shown in Figure 7).
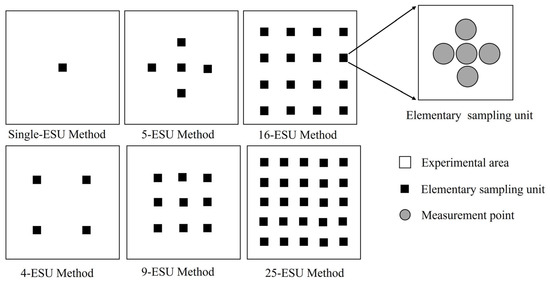
Figure 7.
Schematic diagram of ESU.
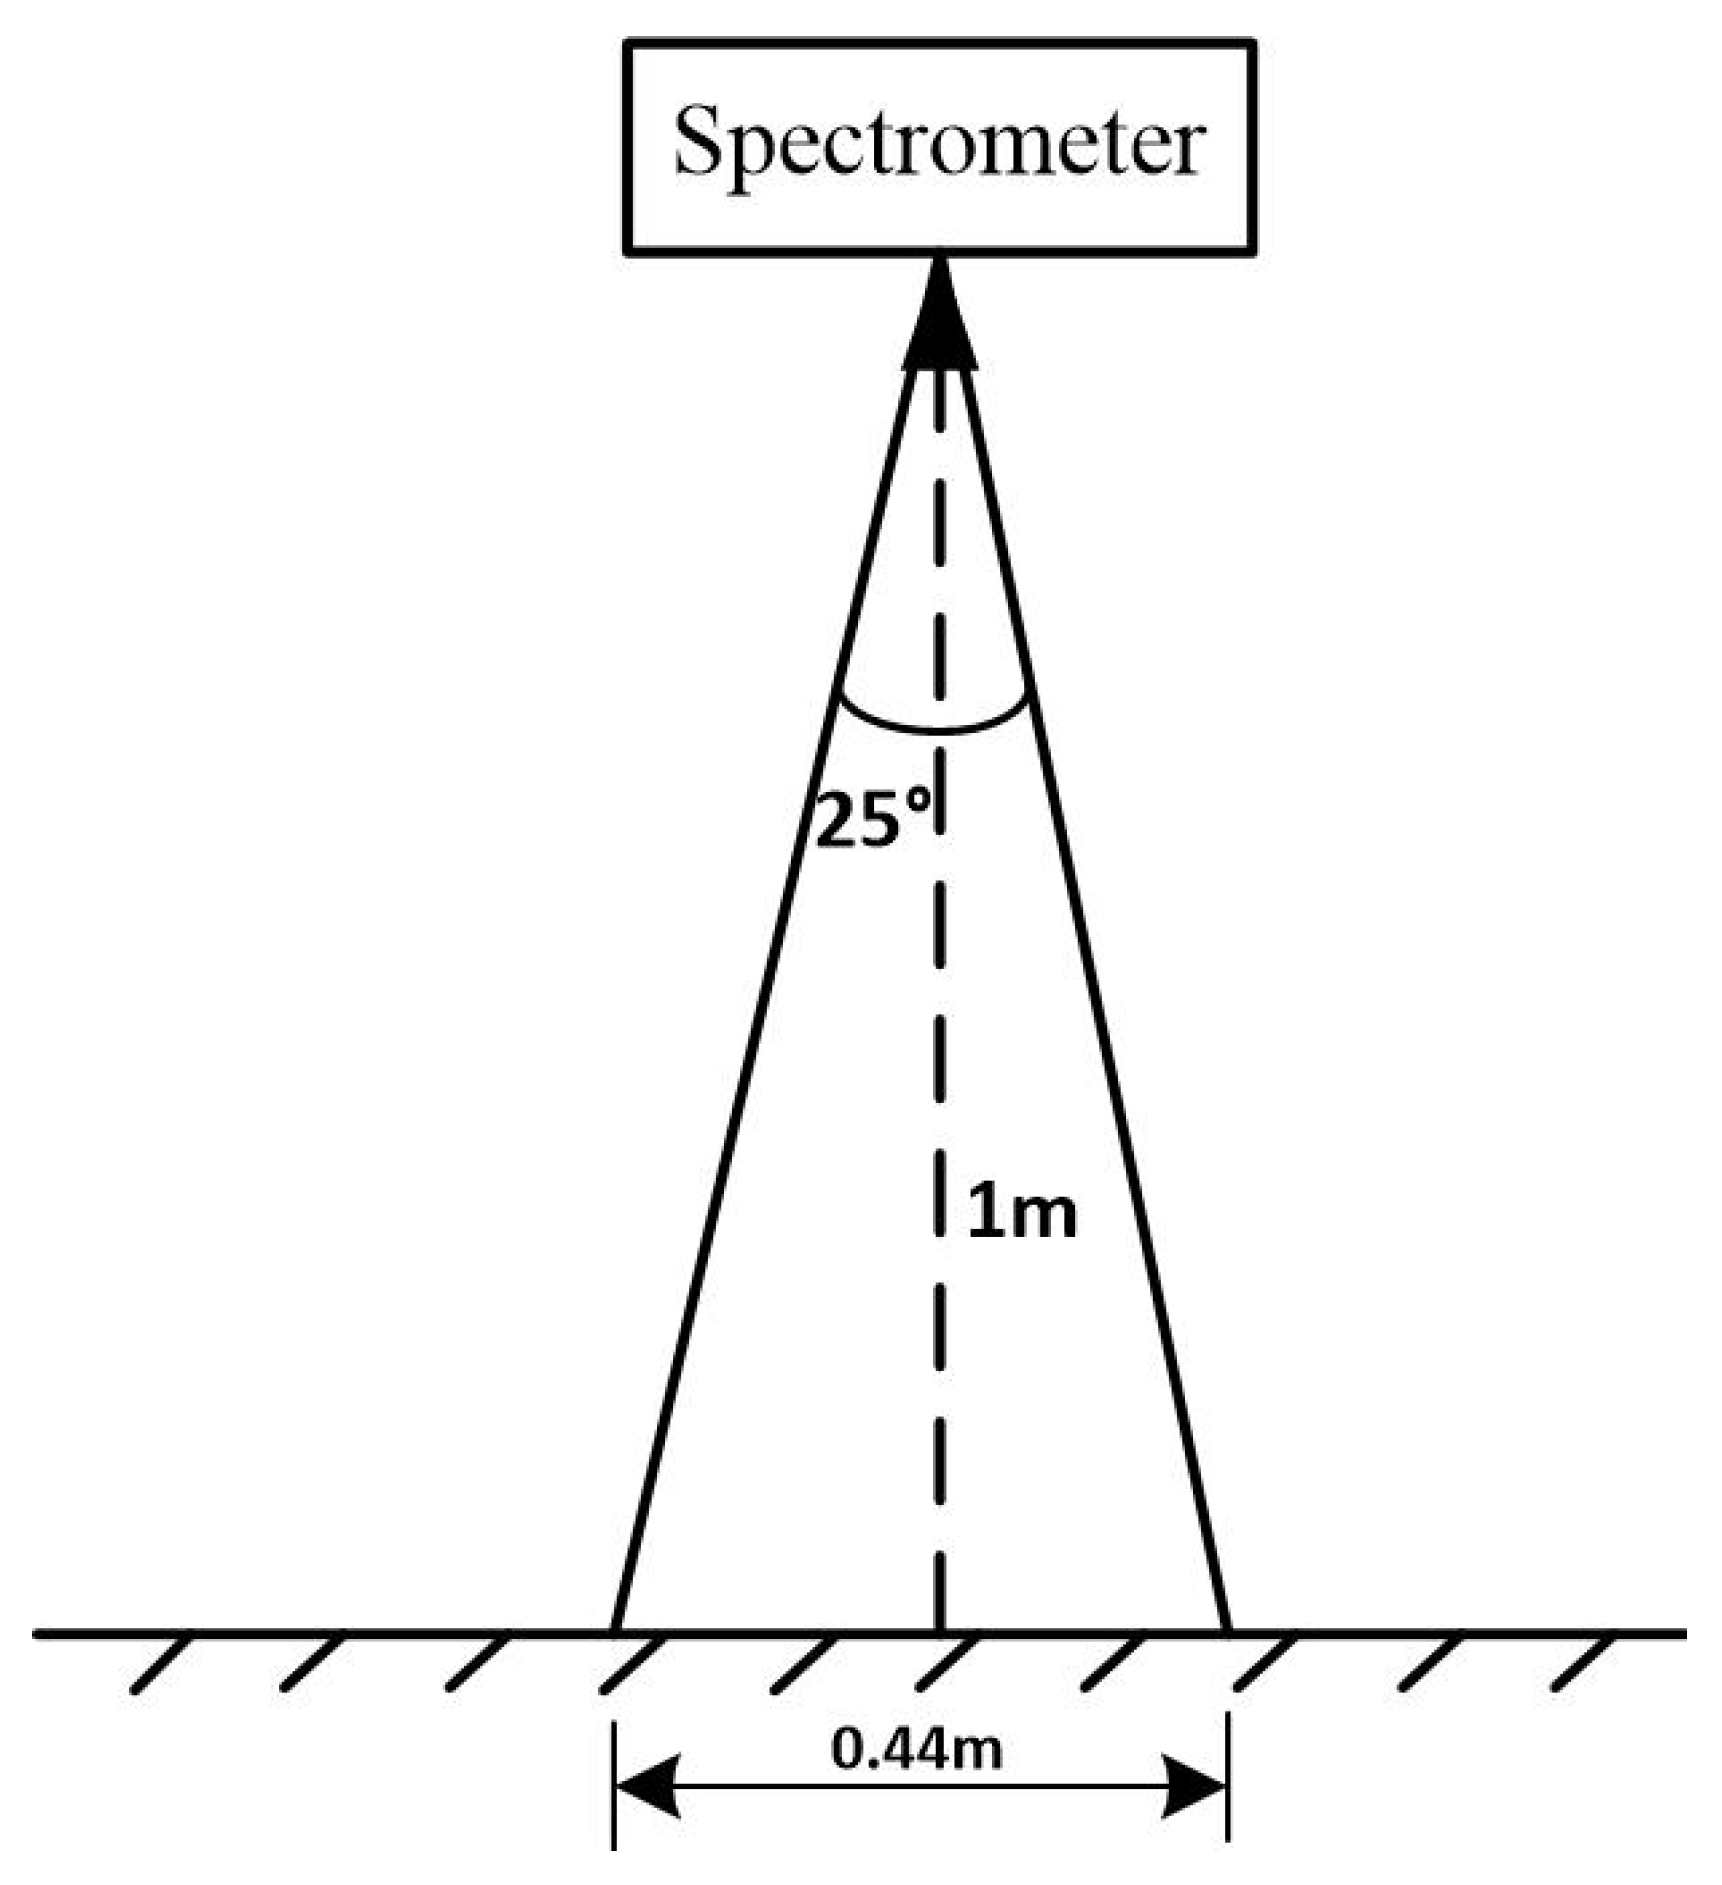
The effective spectrum numbers corresponding to the six sampling methods are 5, 20, 25, 45, 80, and 125. In order to use hyperspectral images to quantitatively simulate ground spectral measurements, a region with a size of 1111 × 1111 pixels is first simulated to determine where each ESU is located according to the location of systematic sampling. Inside each sampling unit, the field of view for five corresponding spectra are simulated. To simulate the field of view of ground spectral measurements more realistically, we quantitatively calculate the range of the spectral measurement’s field of view. Assuming that the height of the ground measurement from the observation target is 1 m, we choose the largest field of view as its field of view; that is, the FOV is 25°. According to the following formula, the radius of the observation field of view can be obtained, with a value of 0.22 m (as shown in Figure 8).
where is the height, assumed to be 1 m here. is the FOV of the ground object spectrometer at an angle of 25°, and is the radius.
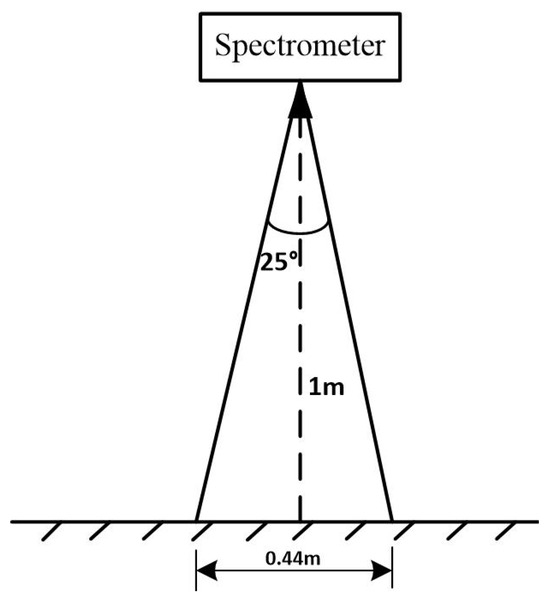
Figure 8.
Schematic diagram of spectrometer measurement.
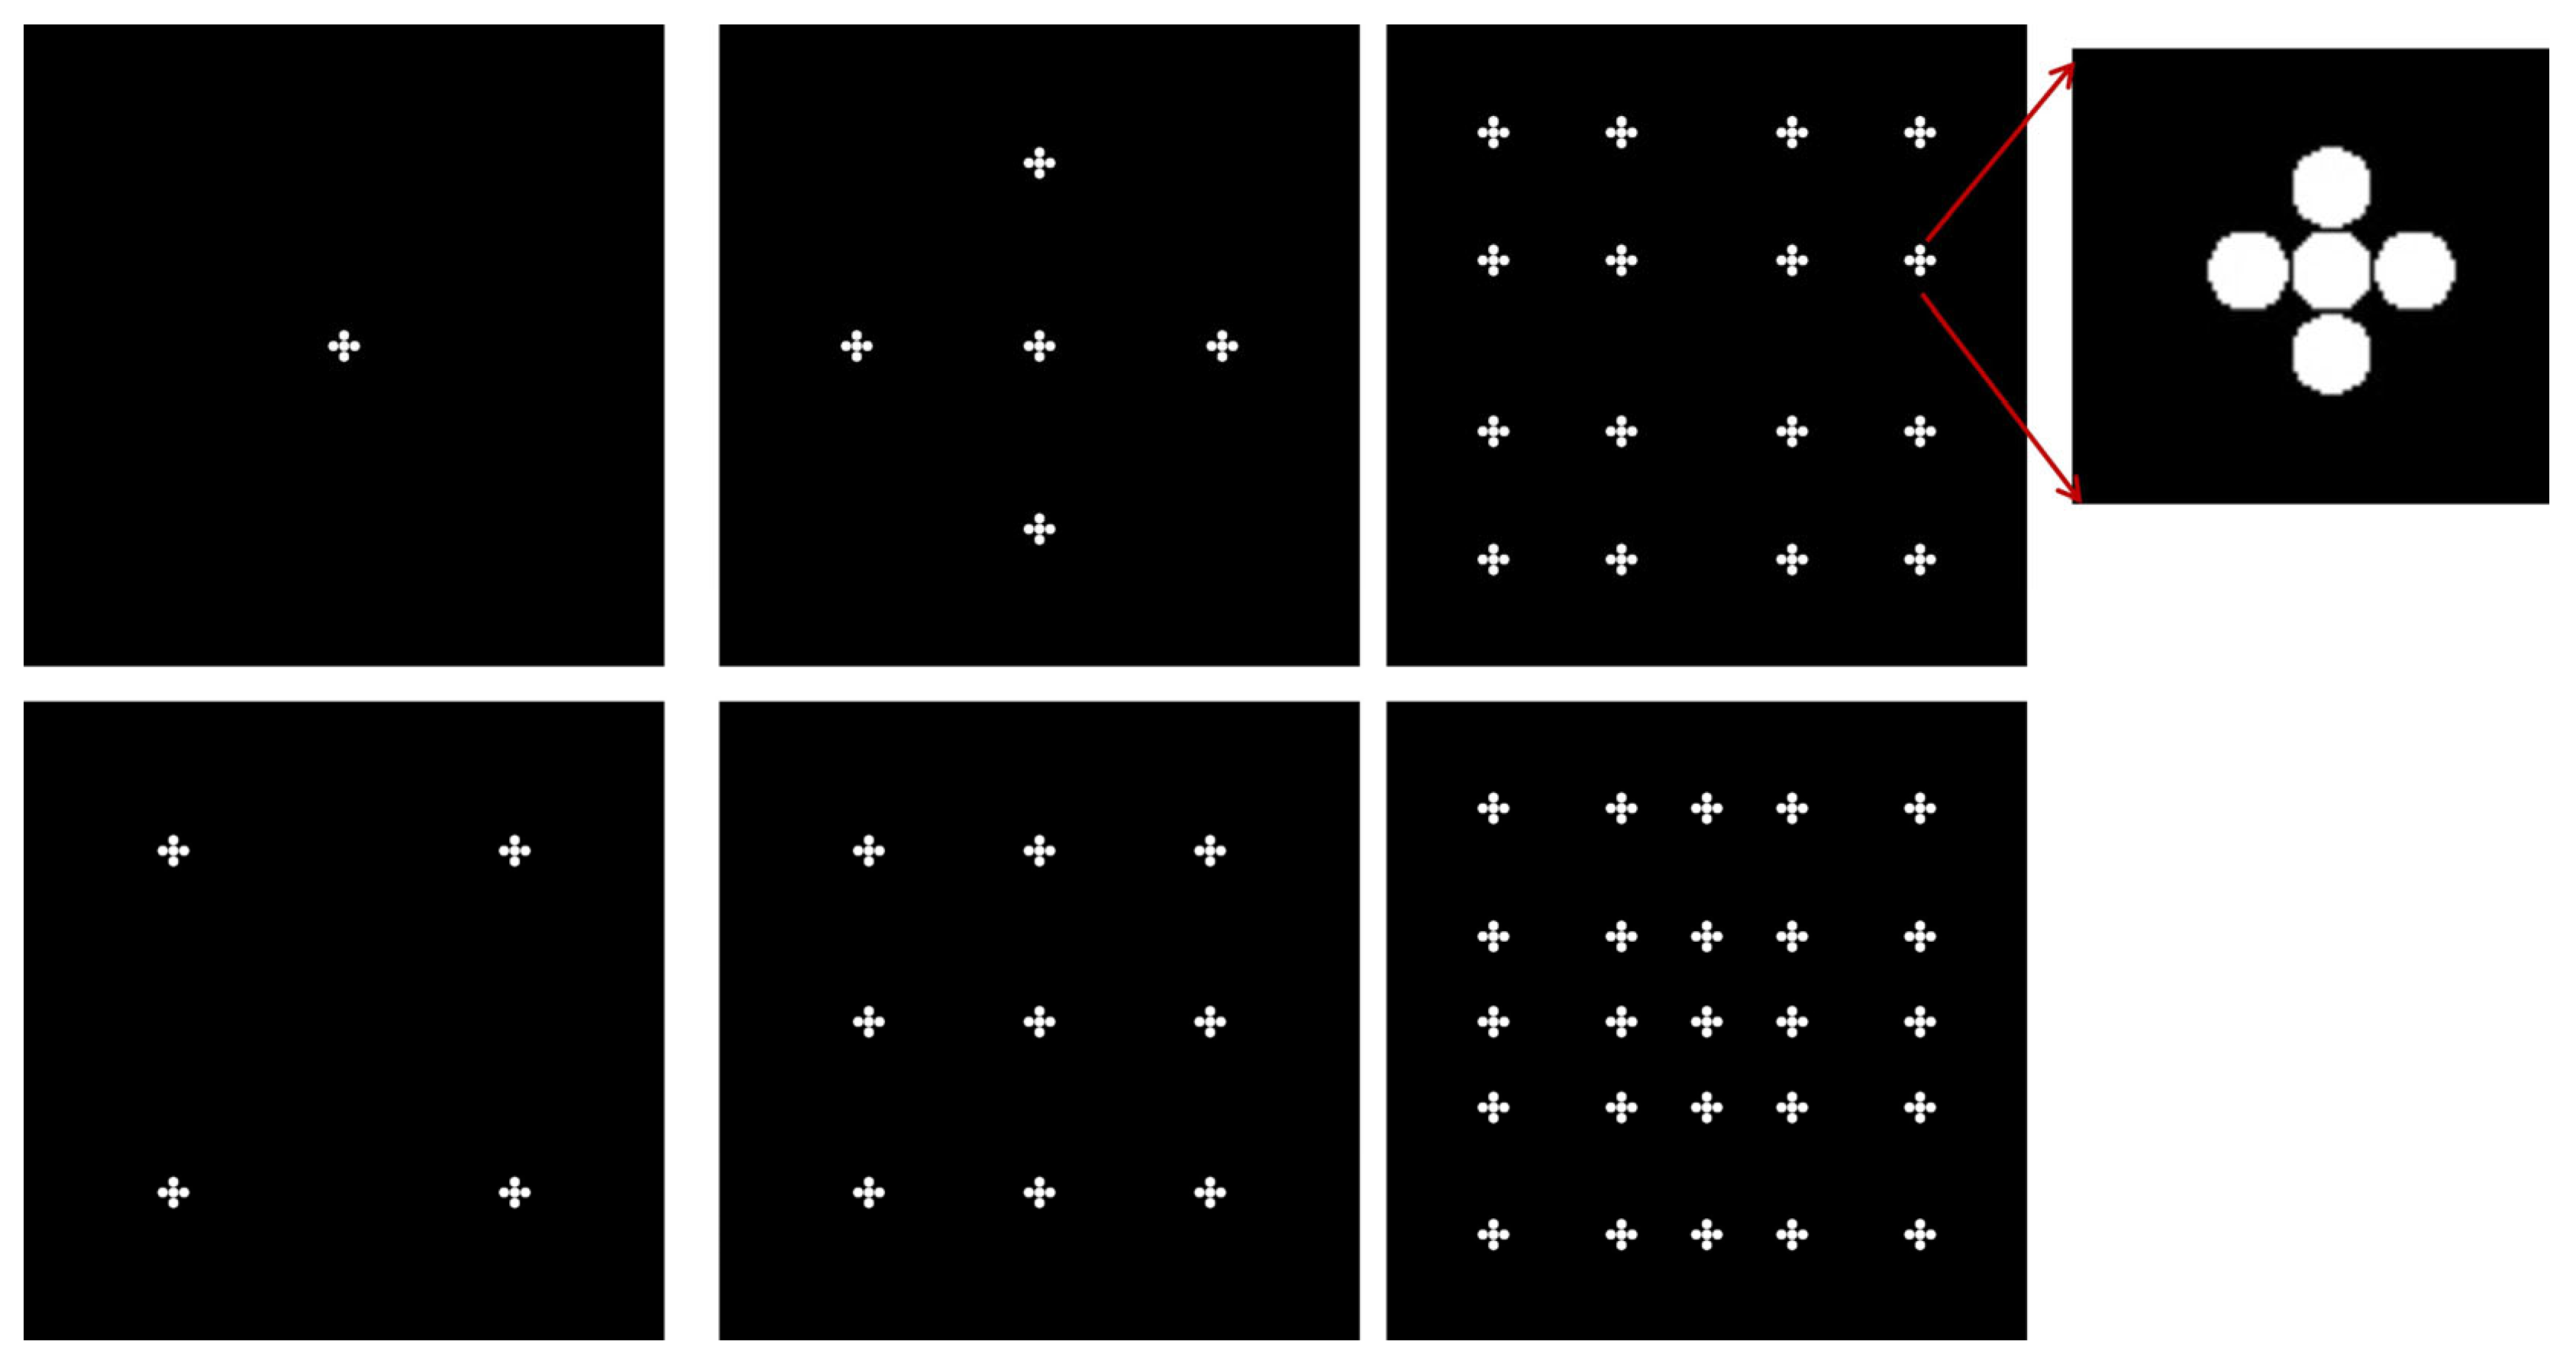
According to the position of the system sampling and the observation field of view, the hyperspectral reflectance mask template is established. In this template, the white areas represent airborne hyperspectral pixels for which there are ground-based spectral measurements, while the black areas represent airborne hyperspectral pixels for which there are no ground-based spectral measurements. The measurement mask templates for the six sampling methods are shown in Figure 9.
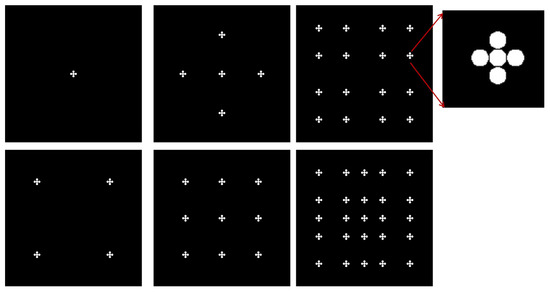
Figure 9.
The simulated ground spectral measurement mask.
When simulating ground spectral measurements, each hyperspectral pixel within the ESU is first analyzed, and in turn, all hyperspectral pixel values corresponding to the spectral measurement areas of the mask are selected and averaged to obtain the average reflectance of each ESU as the point-scale measurement spectrum. Then, the spectra of multiple ESUs in different sampling methods are averaged to obtain the measured spectrum at the satellite pixel scale. Finally, the average of all the hyperspectral image pixels is calculated as the reference truth value of the satellite pixel scale.
It should be pointed out that, in order to better simulate the conventional ground spectral measurement and data processing process, we use the arithmetic method to process the spectra inside the ESU and between different sampling units, so as to obtain the spectra of the ESU and spectra at the satellite pixel scale. There are two main reasons for using the arithmetic method. One is that the processing process is simple, and most spectral data processing processes involve using this method. The second is that other methods, such as the weighted average method, Kriging interpolation method, trend surface method, etc., either require introducing reference images as weights (such as the weighted average method) or require more measurement points (such as in the Kriging interpolation method, trend surface method, etc.). We simulate the measured spectra corresponding to the single-ESU method, 4-ESU method, 5-ESU method, 9-ESU method, 16-ESU method, and 25-ESU method, along with their corresponding ground truth spectra, for subsequent uncertainty analysis in satellite pixel-scale ground truth acquisition.
3.3. Uncertainty Analysis
The uncertainty analysis at the satellite pixel scale includes measurement uncertainty and scale conversion uncertainty [22]. Measurement uncertainty includes the uncertainty of the instrument itself and the uncertainty caused by human factors in the measurement. The uncertainty of the instrument can be reduced or eliminated through instrument calibration, while the uncertainty caused by human factors can be reduced through training. These two types of uncertainty are not very relevant to the sampling methods or the spatial heterogeneity of sites, so they are not considered in this study. The scale conversion uncertainty refers to the error that occurs during the upscaling process of converting the ground measurement point-scale spectra into the satellite pixel-scale spectra. Upscaling is the most effective and most commonly used approach for obtaining satellite relative ground truth data at the satellite pixel scale [23]. Therefore, this study mainly studies the uncertainty of the satellite pixel scale caused by scale conversion, focusing on analyzing the uncertainty of point-to-pixel-scale conversion caused by different sampling methods, to provide a basis for the determination of subsequent spectral sampling methods. The uncertainty at the satellite pixel scale can be defined as the absolute value of the difference between the measured spectrum and the ground truth spectrum, as shown in the following formula:
where is the uncertainty of the measurement, is the average value of spectra from multiple ESUs, and represents the true value of ground measurement spectra.
In hyperspectral image simulation, can be calculated using the following formula:
where represents the number of ESUs, which is 1, 4, 5, 9, 16, and 25 in this study, and represents the average reflectance value within the -th ESU.
The ground truth spectrum can be calculated using the following formula:
where represents the number of pixels in the airborne hyperspectral image within the satellite pixel scale, and the value is 1111; that is, the row and column of the image are both 1111; represents the reflectance value of the hyperspectral image in the -th row and -th column.
It can be seen that measurement uncertainty, ε, is comes in an array of values that varies with wavelength, and uncertainty varies across different spectral bands. In order to quantitatively calculate the measurement uncertainty of spectral measurements using different sampling methods, this study gives an index of the average scale conversion uncertainty factor, which calculates the mean value of the measurement uncertainty at all wavelengths to serve as the average uncertainty from the point-scale measurement spectrum to the satellite pixel-scale spectrum, as shown in the following formula:
where is the average uncertainty from the point-scale measurement spectrum to the satellite pixel-scale spectrum; is the number of bands, which is equal to 200; represents the uncertainty corresponding to each band of Hyspex.
4. Results
4.1. Results and Evaluation of Surface Reflectance Retrieval from Airborne Hyperspectral Image
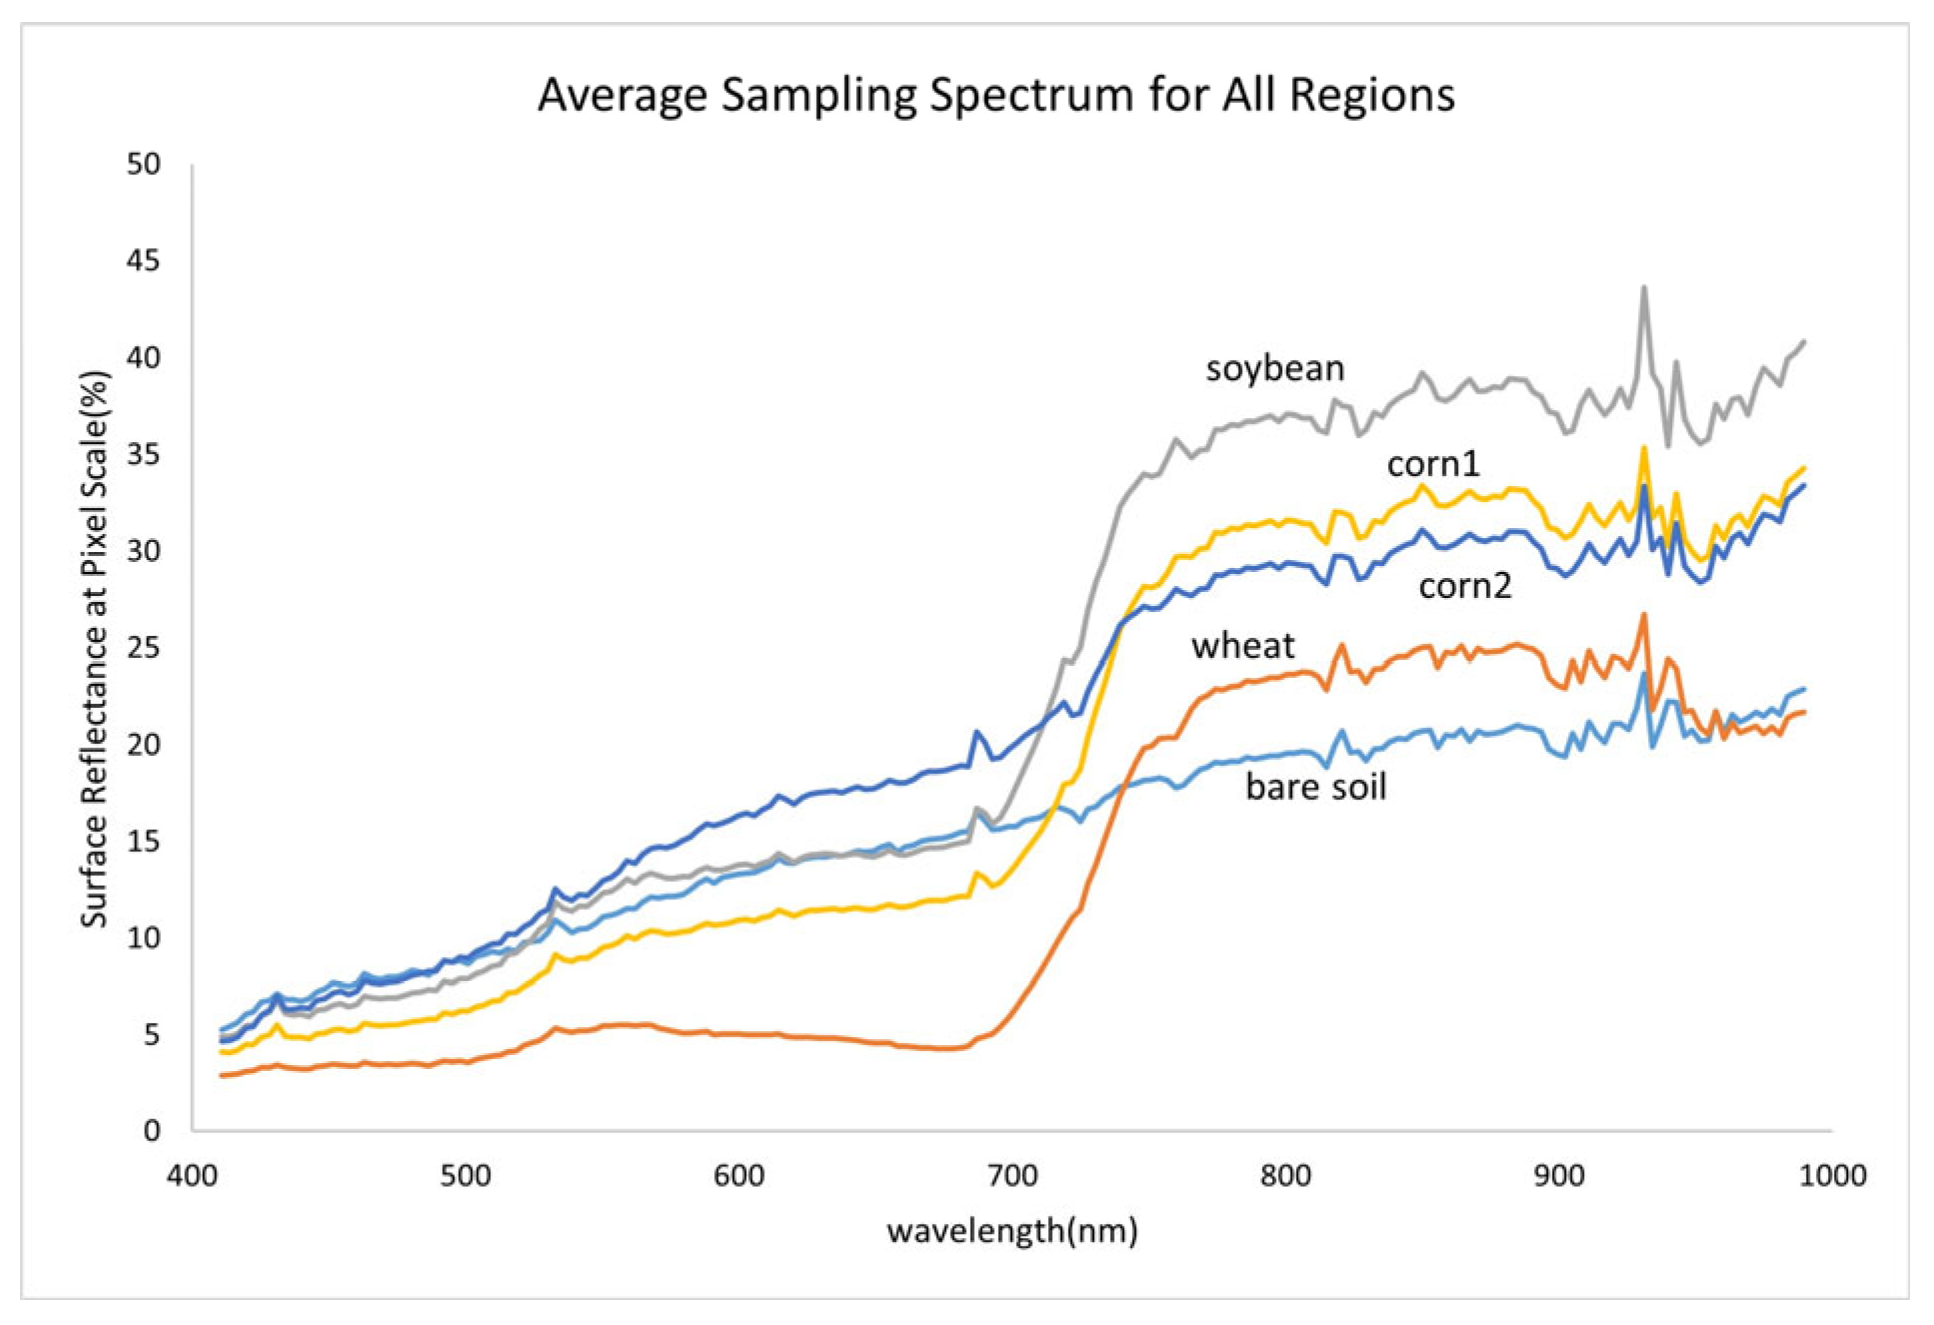
We quantitatively evaluated the acquired airborne hyperspectral images. The average spectra of the images of the five sample areas in four sites were calculated, and the results are shown in Figure 10. It can be seen that among the five spectra, except that the spectrum of bare soil presents the spectral characteristics of non-vegetation, the spectra of the wheat, corn1, corn2, and soybean all present typical vegetation spectral features. Among them, the bare soil spectrum shows a linearly increasing trend. The wheat spectrum is smaller than the bare soil spectrum before 750 nm, and its reflectance is greater than the bare soil spectrum after 750 nm. The spectrum of corn1 is smaller than that of bare soil before 720 nm, and larger than that of bare soil after 720 nm. The spectra of corn2 and soybeans are larger than those of bare soil. Since the soybean, corn1 and corn2 sample areas are all mixed pixels, their spectra include vegetation information and soil information, resulting in a higher reflectance of their spectral curves near the red band (660 nm) compared to that of those near the green band (550 nm).
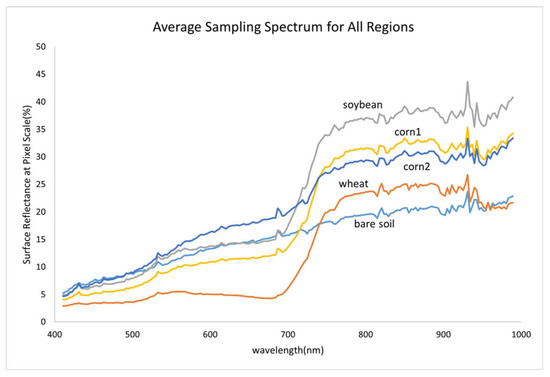
Figure 10.
Ground truth spectra at satellite pixel scale in experimental area based on UAV hyperspectral images.
In order to quantitatively analyze the consistency of the ground measurement surface reflectance and the surface reflectance retrieved by the UAV, we selected two sets of endmember spectra acquired by the UAV and the ground in the soybean area on 29 June 2023. The first group was the vegetation endmember spectra, and only vegetation was covered on the entire ground and the field of view of the UAV. The second group was the bare soil endmember spectra, and there was only bare soil information on the entire ground and the field of view of the UAV.
The ground measurement spectrum is resampled using the linear interpolation method to obtain the same spectral resolution as that of the Hyspex camera, thereby verifying the consistency of the ground measurement spectrum and the hyperspectral inversion spectrum. Then, we use two indexes, spectral correlation and the mean absolute difference of spectral reflectance, to measure the consistency between ground-measured spectra and airborne hyperspectral retrieval spectra. Among them, the spectral correlation can be expressed as follows:
where represents the covariance between variables and , is the variance of variable , and is the variance of variable . Here, represents the Hyspex-equivalent ground spectrum (referred to as the ground spectrum) obtained via the convolution of the ground measurement spectrum, and represents the surface reflectance spectrum derived from airborne hyperspectral inversion (referred to as the UAV spectrum).
The mean absolute difference of reflectance can be calculated based on the average of the absolute values of the differences between the ground measurement spectra and the hyperspectral spectra. The corresponding formula is as follows:
where represents the equivalent surface reflectance of the ground spectrum corresponding to the -th band of Hyspex; represents the reflectance of the UAV Hyspex spectrum corresponding to the -th band; represents the number of bands, which is equal to 200 here; |..| represents the absolute value.
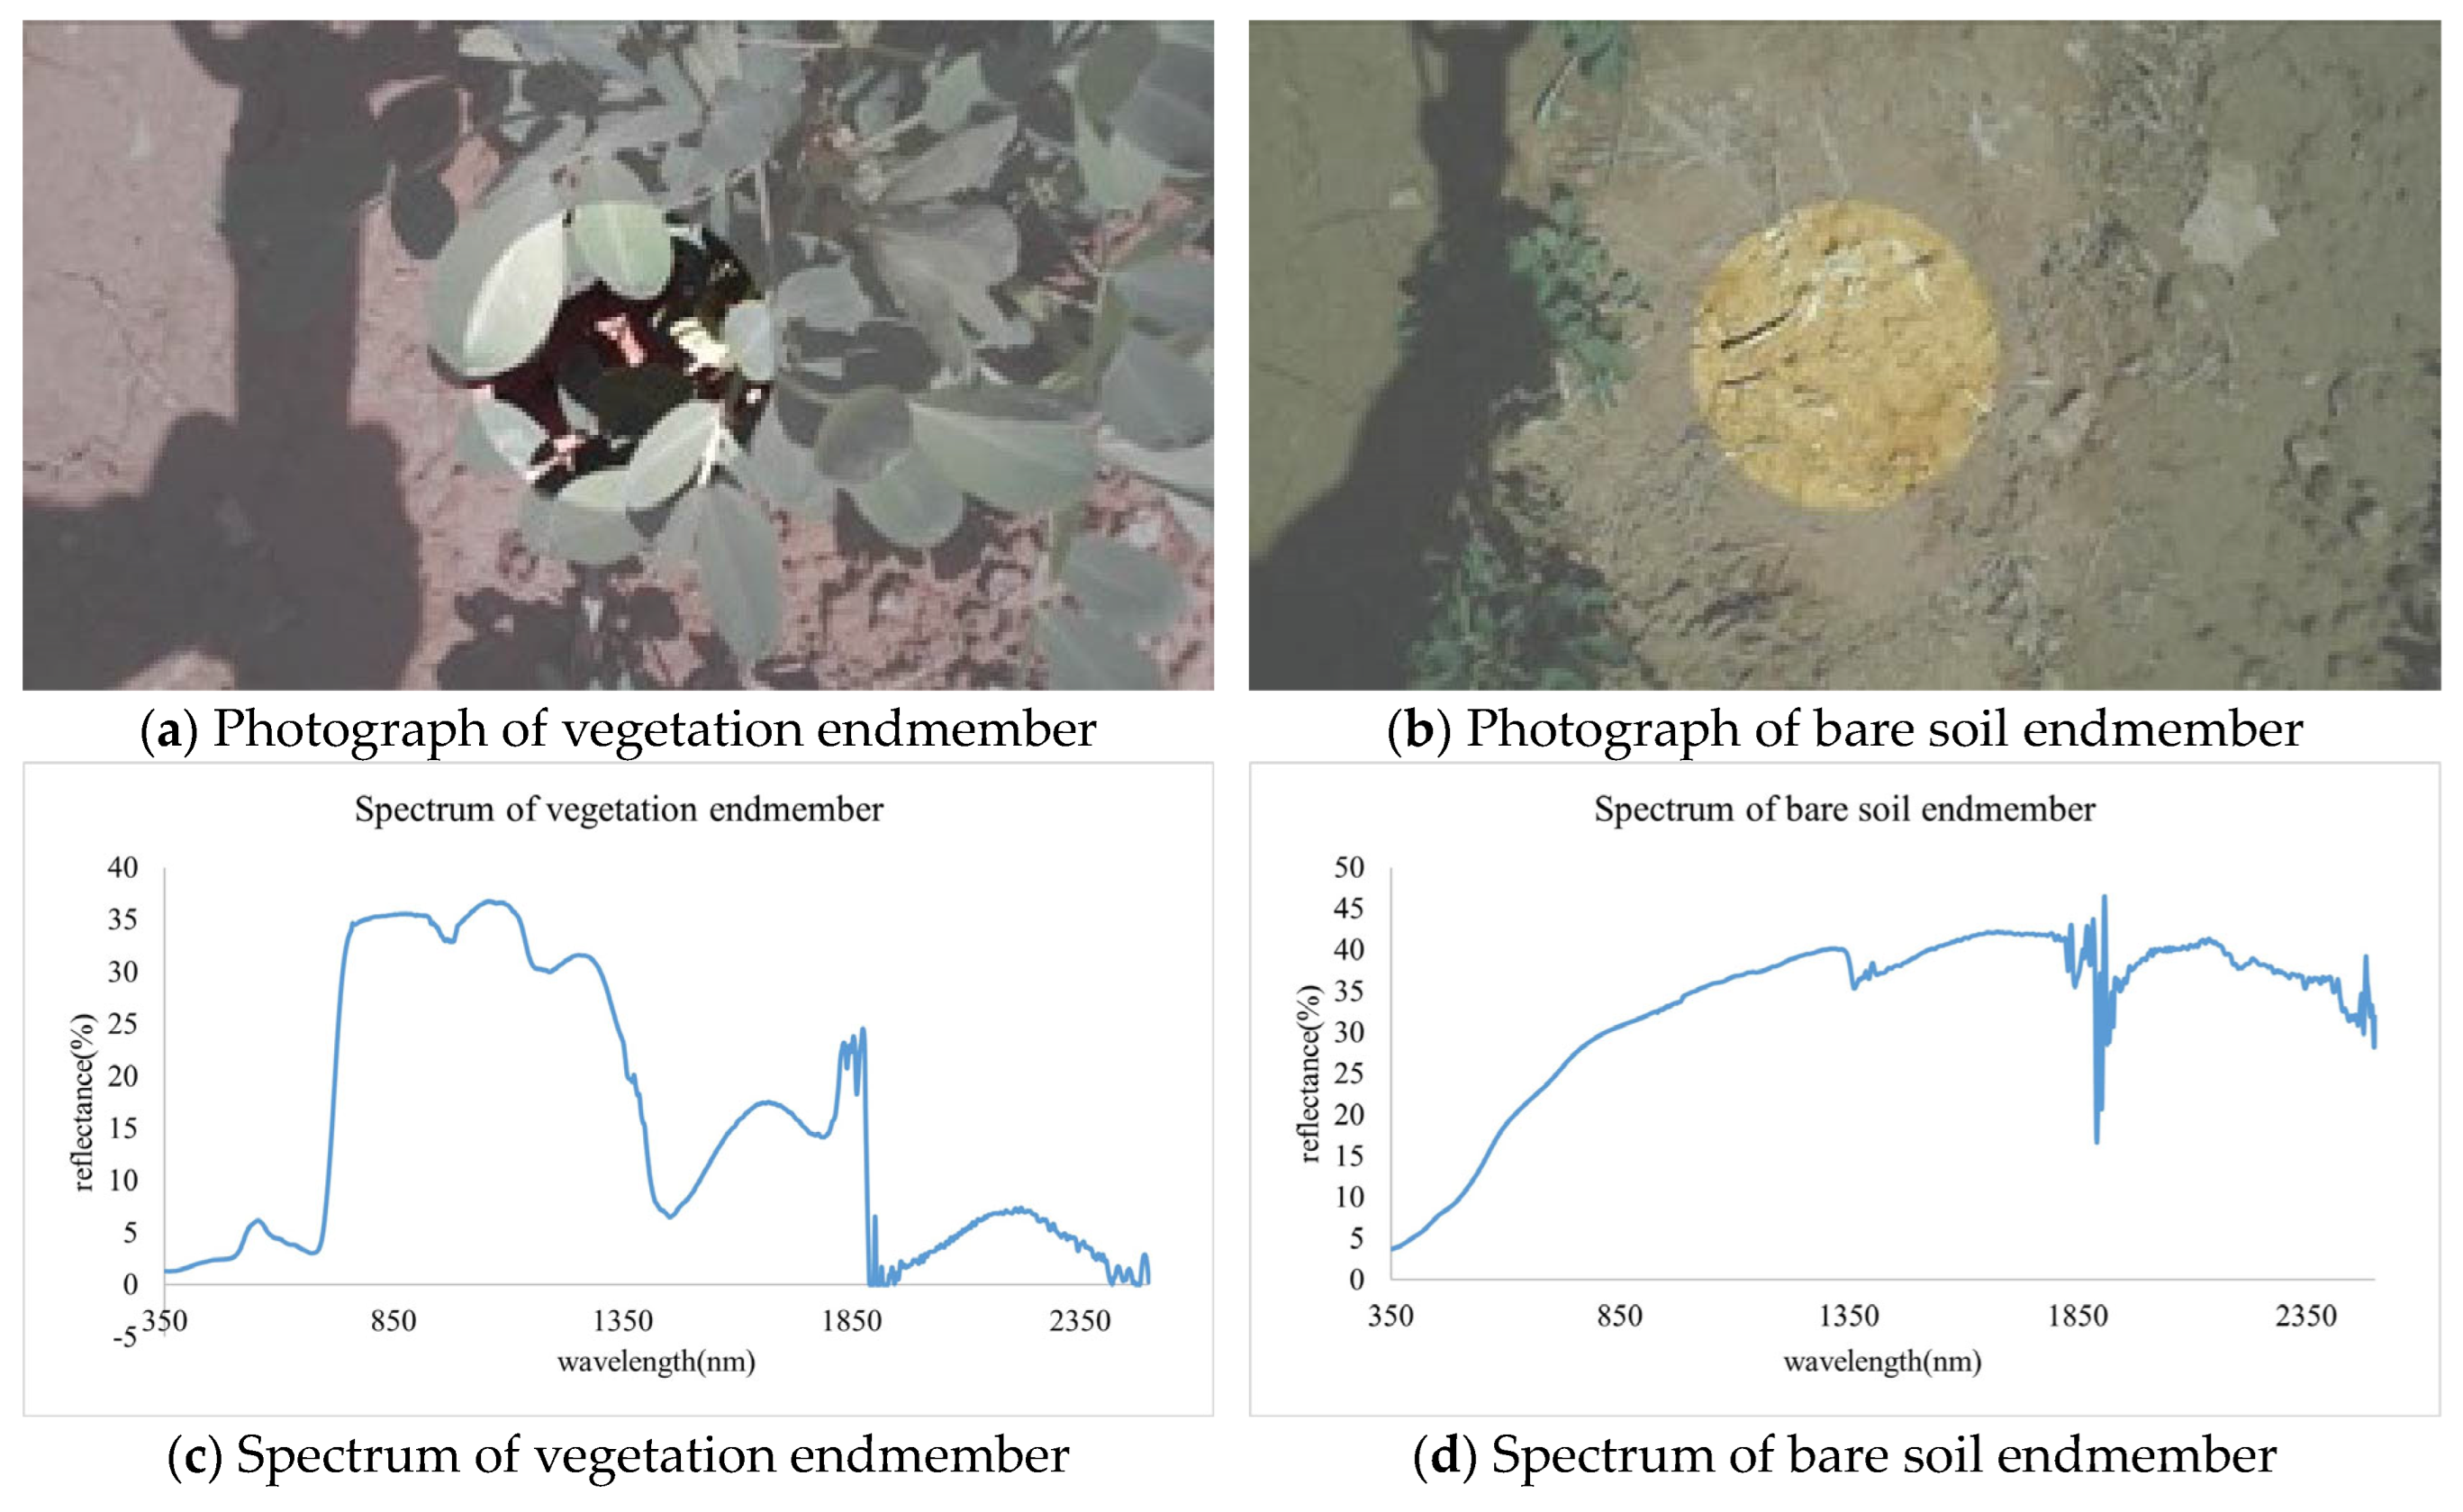
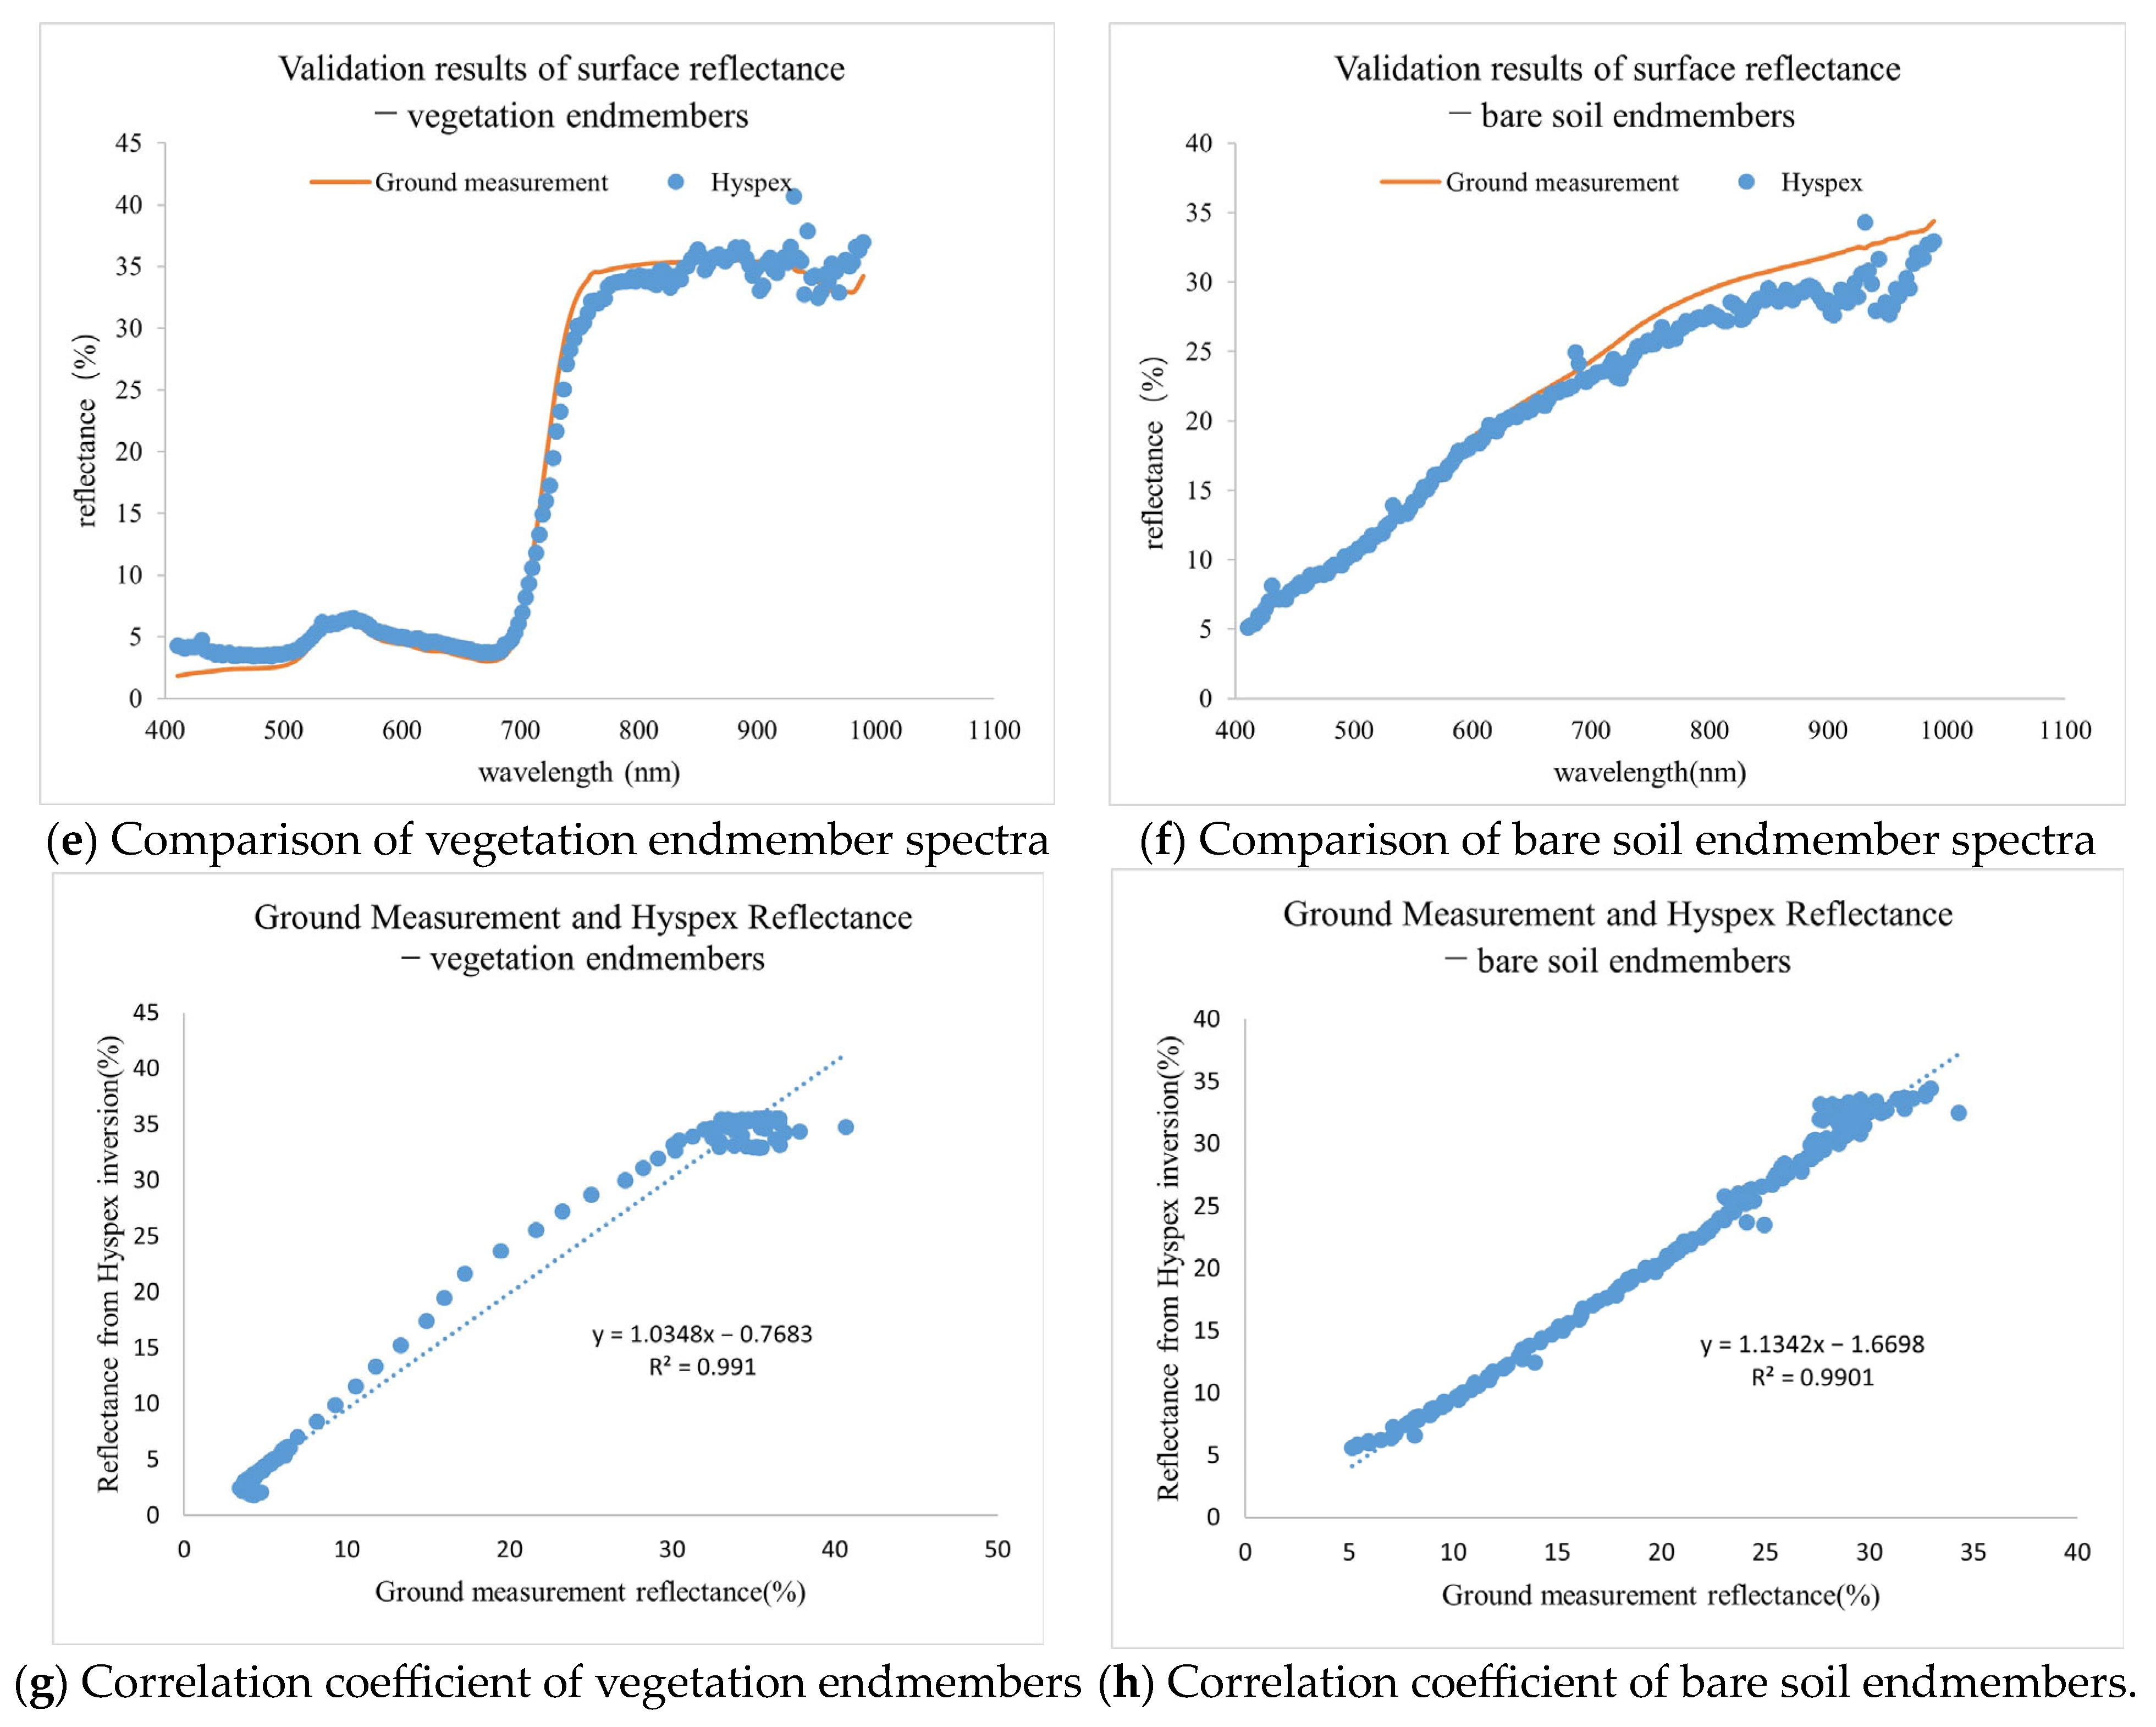
Figure 11 shows the validation results of ground and UAV endmember spectra. Among them, Figure 11a,b are the ground synchronous photos of the vegetation endmember and the bare soil endmember, respectively (at the same time, at the same angle, and at the same field of view as those of the ground measurement spectra). The spectral information of ground measurements corresponding to the vegetation endmembers and the bare soil endmembers are given in Figure 11c and Figure 11d, respectively, in the spectral range of 350–2500 nm, with a spectral sampling resolution of 1 nm, and the measuring instrument is the SR8800 ground spectrometer. Figure 11e and Figure 11f show the comparison results of the ground-equivalent measurement spectra and the UAV inversion spectra of vegetation endmembers and bare soil endmembers, respectively. Among them, the ground-equivalent measurement spectra are obtained via linear interpolation and have the same spectral resolution as that of Hyspex; the UAV inversion spectra come from the UAV hyperspectral surface reflectance image. It can be seen that the ground-equivalent measurement spectra and the UAV inversion spectra have very high consistency. Except for a few bands, the curve shapes and absolute values of the two are basically consistent. Therefore, airborne hyperspectral images can be used to simulate ground measurement spectra. Figure 11g,h show the correlation between the ground equivalent measurement spectra and the UAV inversion spectra. The horizontal axis represents the ground-equivalent measurement spectra, while the vertical axis corresponds to the UAV inversion spectra. It can be observed that the ground measurement spectra and the UAV inversion spectra have a very high correlation, with a correlation coefficient exceeding 99%. Table 2 presents the “UAV-Ground” matching results of vegetation endmember spectra and bare soil endmember spectra, as well as the correlation coefficient and average absolute difference between ground spectra and UAV spectra.
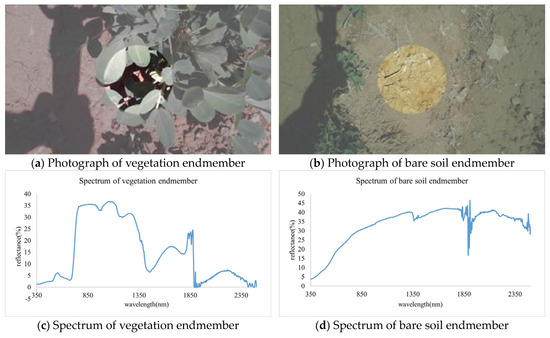
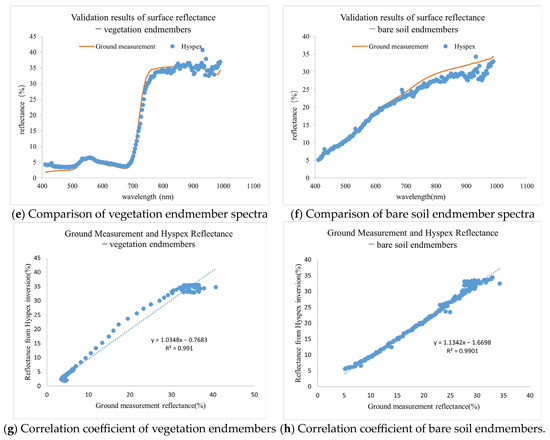
Figure 11.
Ground and UAV endmember spectral validation results. (a) A photograph of the vegetation endmember; (b) a photograph of the bare soil endmember; (c) the vegetation endmember spectrum; (d) the bare soil endmember spectrum; (e) the comparison of the ground measurement spectrum and the Hyspex spectrum of vegetation endmembers; (f) the comparison of the ground measurement spectrum and the Hyspex spectrum of bare soil endmembers; (g) the correlation coefficient between the ground measurement reflectance and Hyspex reflectance of vegetation endmembers; (h) the correlation coefficient between ground measurement reflectance and Hyspex reflectance of bare soil endmembers.

Table 2.
The correlation coefficient and the average absolute difference between ground spectra and UAV spectra.
As can be seen from Table 2, the ground spectra and UAV spectra are very highly consistent. Their correlation coefficients exceed 99%, and the average absolute difference is less than 1.5%. The above results show that the hyperspectral surface reflectance image inverted by the UAV has very good agreement with the ground measurement spectra, which can be used to simulate the sampled spectra with different spatial resolutions on the ground for the uncertainty analysis of the sampled spectra.
4.2. Ground Point-Scale and Area-Scale Spectral Simulation
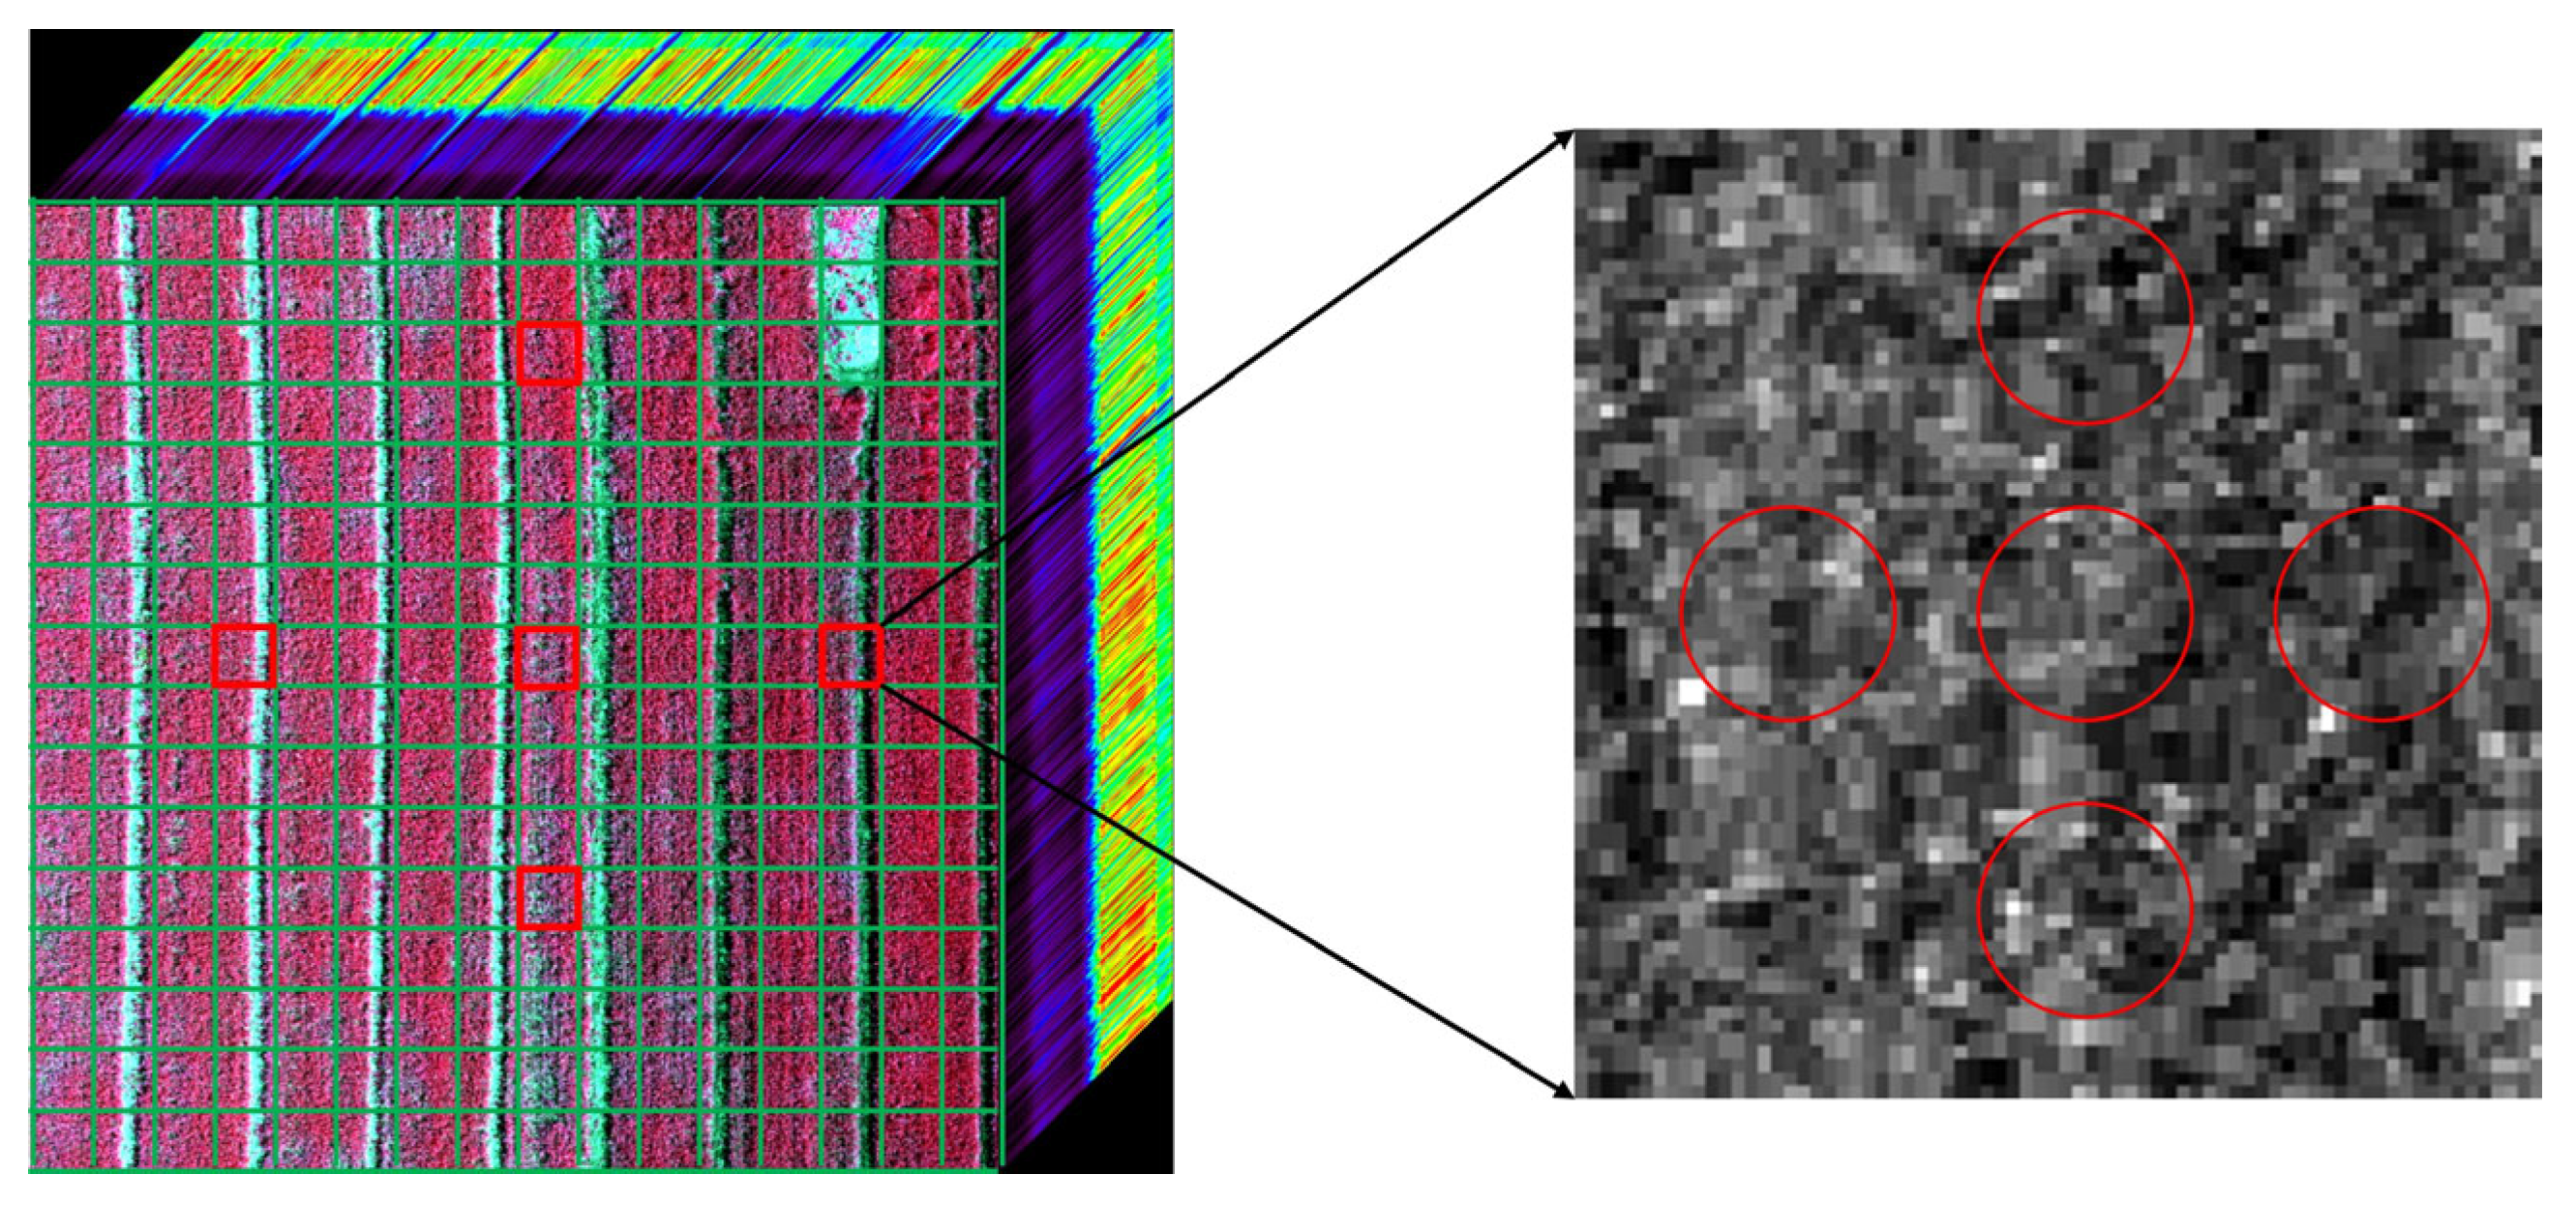
The point-scale spectrum is defined as the spectrum measured within a 2 m ESU. During ground measurements, the average of five spectra measured within a 2 m ESU was taken as the point-scale spectrum. Simulations were conducted using UAV hyperspectral surface reflectance products, as shown in Figure 12. The left figure shows the hyperspectral image used for the simulation of the ground measurement spectra, and the five red circular areas in the right figure represent the field of view of the five ground measurement spectra within the ESU. The average value of all hyperspectral pixels within the field of view of the five spectra in the 2 m ESU was used as the simulated ground measurement spectrum, and thus we obtained the simulated spectra of different ESUs as the corresponding point-scale spectra.
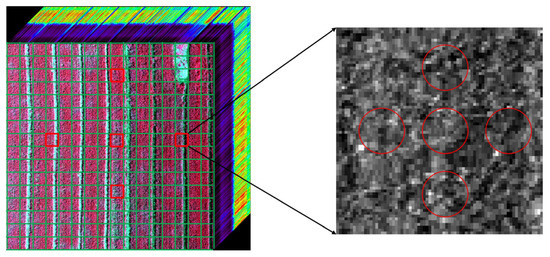
Figure 12.
Schematic of the simulated spectrum of the ESU based on UAV hyperspectral images.
The pixel-scale spectrum is defined as the average of the reflectance spectral information of all ground object information within the satellite pixel scale, also referred to as the satellite pixel-scale ground truth. In this study, airborne hyperspectral surface reflectance images within the satellite pixel scale (30 m in size) were used to simulate the ground measurement truth; specifically, we used the average value of all pixel spectra of the hyperspectral image as the ground measurement truth.
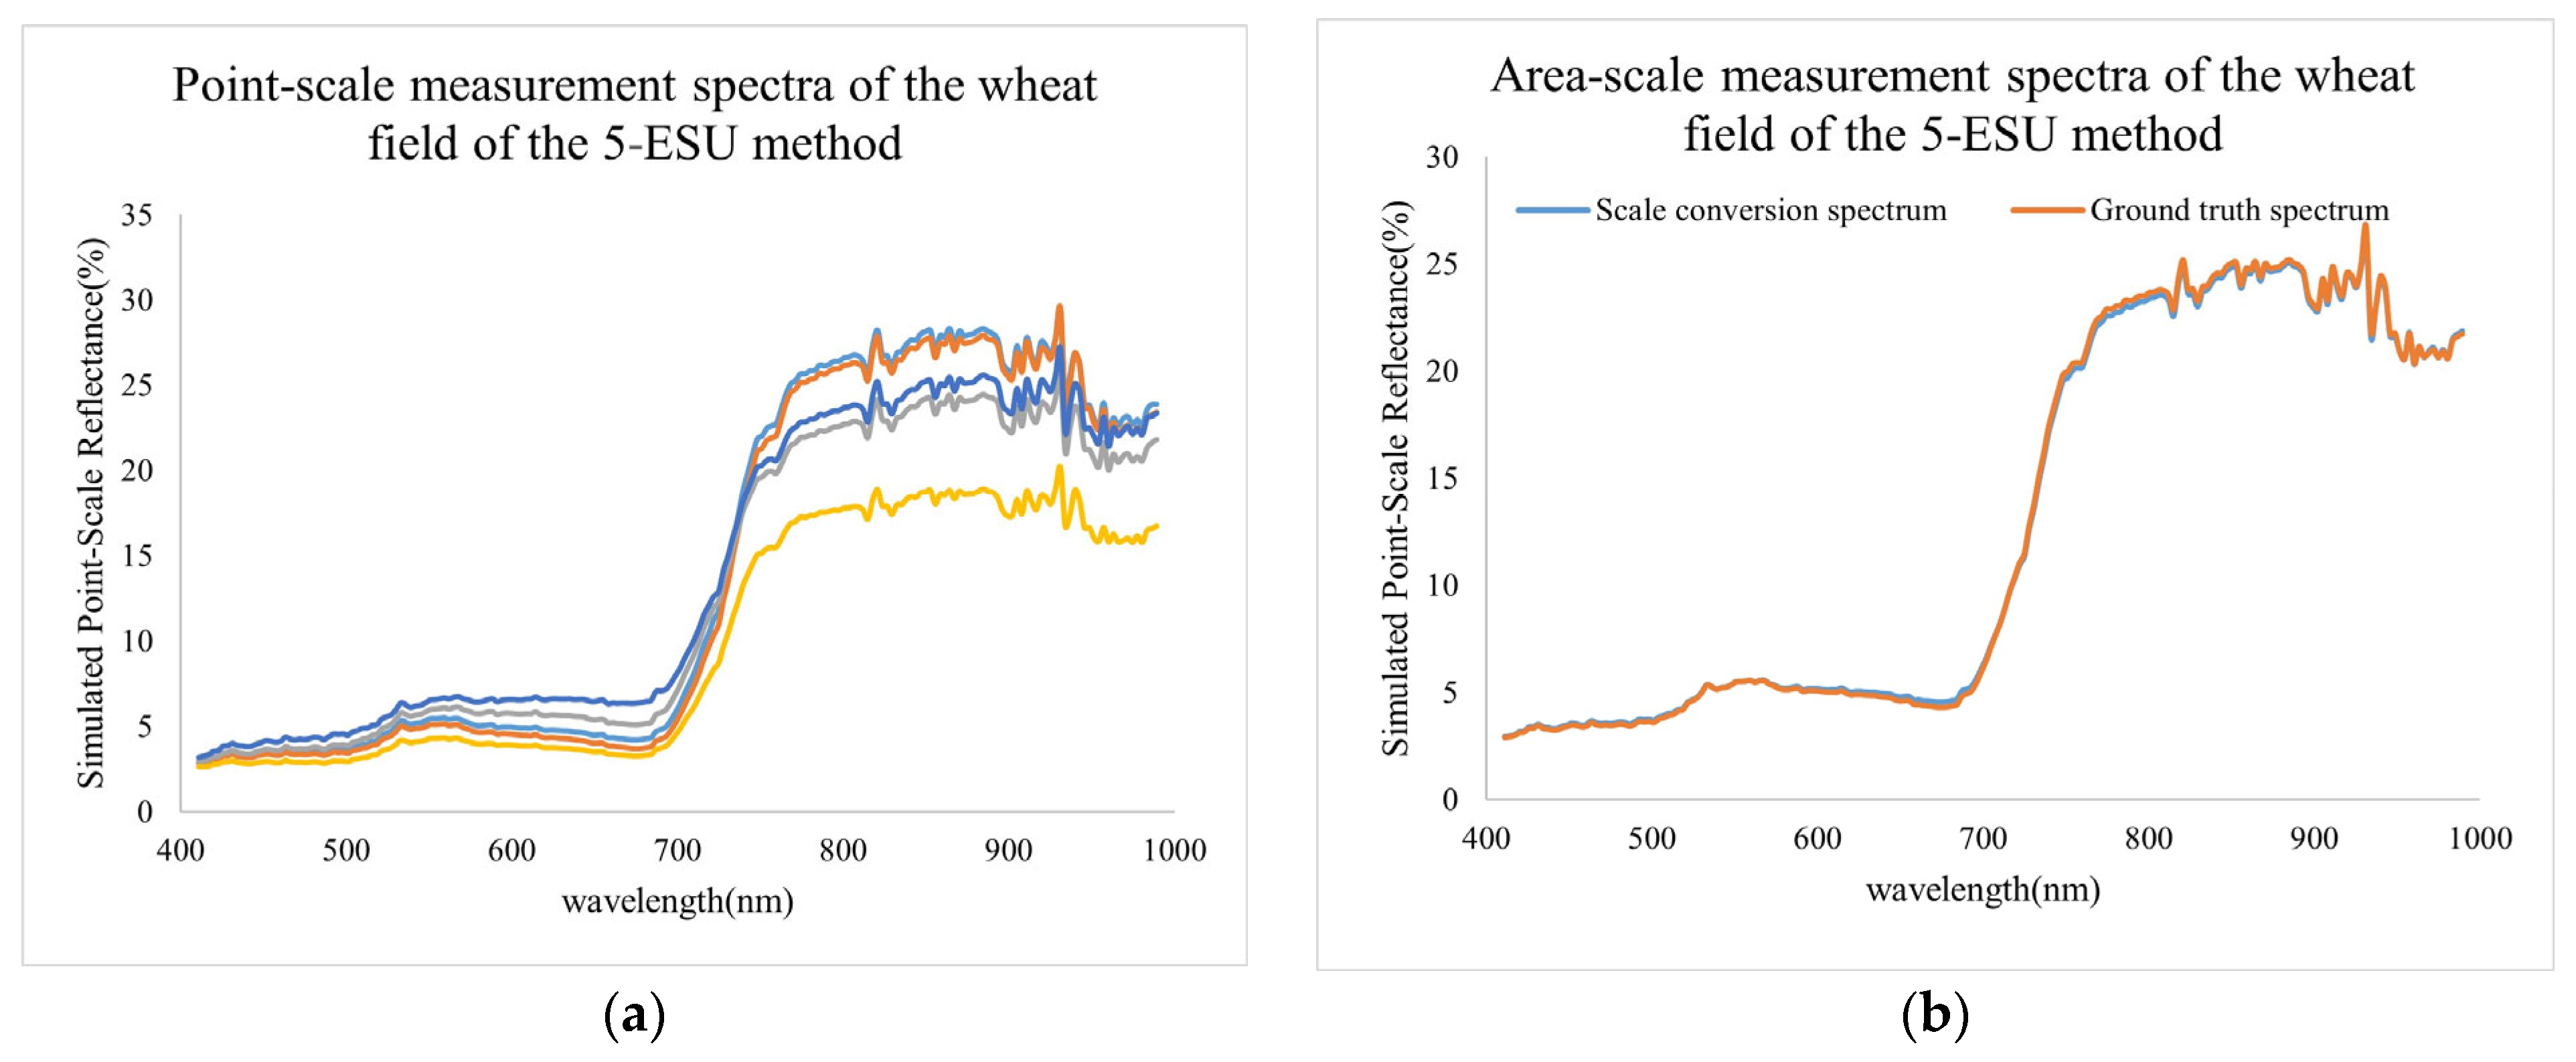
Figure 13 shows the point-scale spectra and pixel-scale spectra of the wheat field simulated via UAV hyperspectral images. Figure 13a shows the point-scale ground measurement spectra corresponding to the five-point sampling method in the wheat sample area simulated via the UAV image. Figure 13b shows the average measurement spectra (scale conversion spectra) corresponding to the five-point sampling field and the average spectra based on all hyperspectral pixels (ground truth spectra).
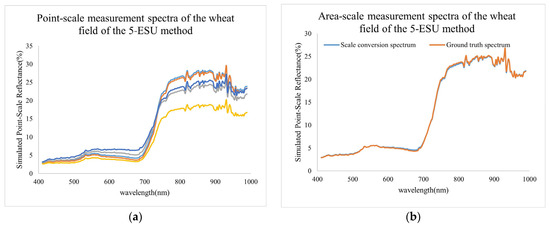
Figure 13.
The simulated point-scale and pixel-scale measurement spectra: (a) the point-scale measurement spectra of the wheat field of the five-ESU method, the five spectra of different colors correspond to the average spectra of five ESUs; (b) the pixel-scale measurement spectra of the wheat field of the five-ESU method.
4.3. Calculation Results of Ground Measurement Spectral Uncertainty
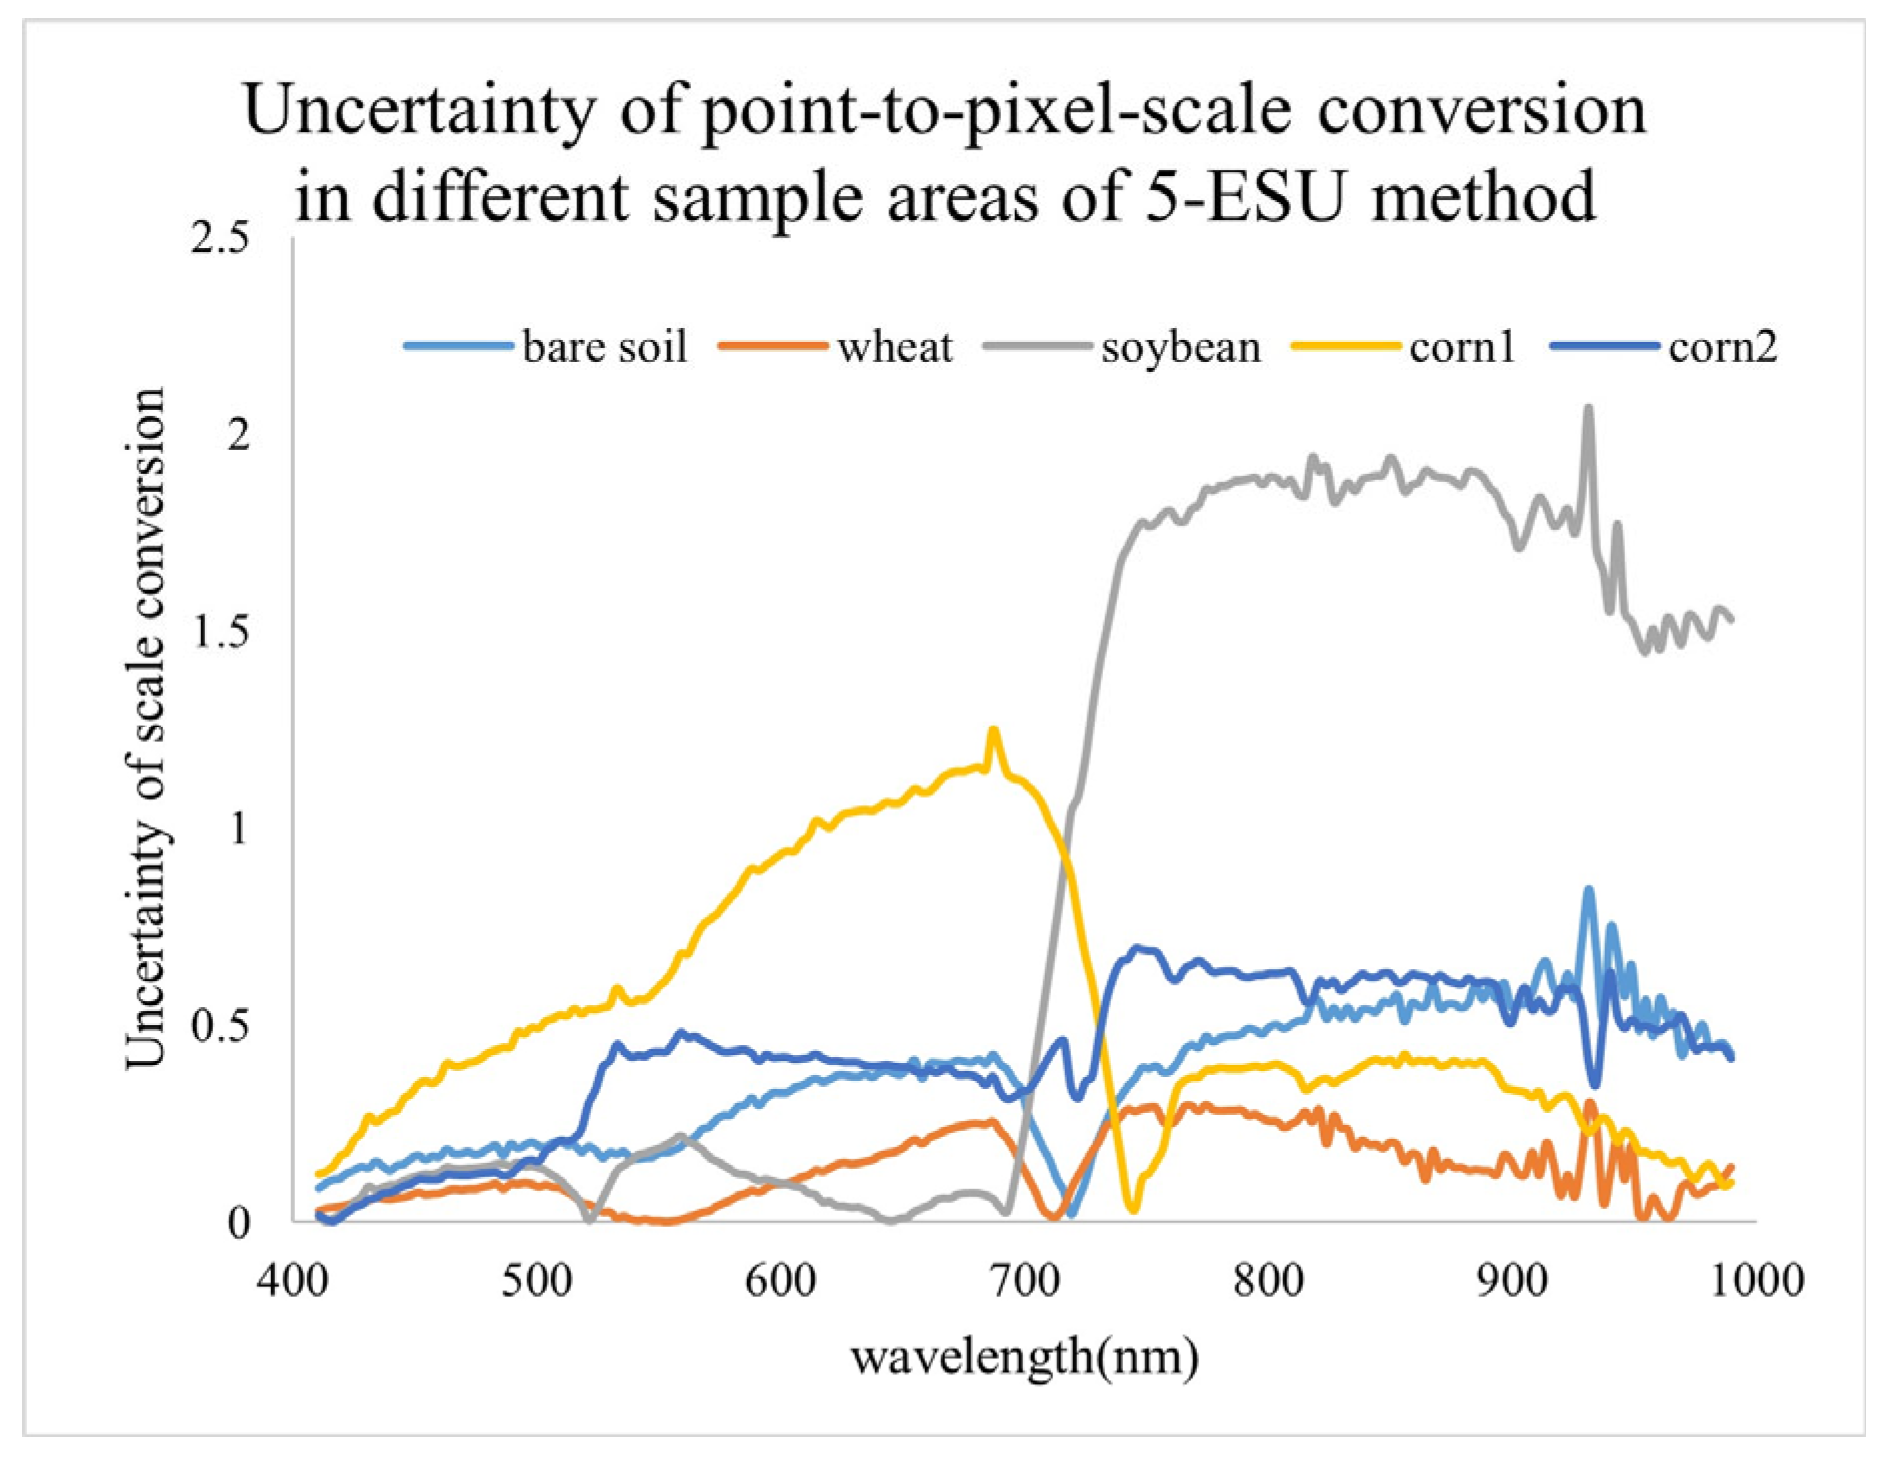
Taking the 5-ESU method as an example, the point-to-pixel-scale conversion spectrum uncertainty and the corresponding average value of the five sample areas of bare soil, wheat, soybean, corn1, and corn2 are given. The results are shown in Figure 14 and Table 3.
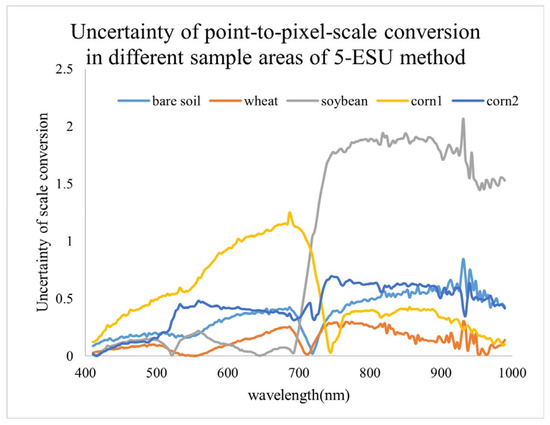
Figure 14.
Uncertainty of point-to-pixel-scale conversion in different sample areas under the 5-ESU method.

Table 3.
Calculation results of average uncertainty of point-to-pixel-scale conversion in different sample areas (unit: %).
Figure 14 shows the uncertainty of point-to-pixel-scale conversion in five sample areas. Table 3 shows the average uncertainties of the point-to-pixel-scale conversion for different sample areas, which were obtained by calculating the absolute value mean based on the uncertainties of the scale conversion for each band. The results show that when a five-ESU method is used for sampling, the point-to-pixel-scale conversion uncertainties of bare soil, wheat, soybeans, corn1 and corn2 are 0.366%, 0.137%, 0.855%, 0.534%, and 0.472%. This shows that the measurement uncertainty of the five-point sampling method is less than 1%.
5. Discussions
5.1. The Influence of Sampling Methods on the Uncertainty of Scale Conversion
To quantitatively analyze the influence of different sampling methods and measurement heights on the uncertainty of ground reflectance scale conversion, surface reflectance images of five sample areas including bare soil, wheat, soybean, corn1, and corn2, obtained from airborne hyperspectral data, were utilized. We simulated and calculated the uncertainty of scale conversion using the single-ESU method, 4-ESU method, 5-ESU method, 9-ESU method, 16-ESU method, and 25-ESU method for each of these areas, resulting in uncertainty calculation results for various sampling methods.
The single-ESU method, 4-ESU method, 5-ESU method, 9-ESU method, 16-ESU method, and 25-ESU method were used as the sampling methods. According to the calculation method in Section 4.3, we obtained the average uncertainties of the point-to-pixel-scale conversion of the different sampling methods for the bare soil sample area, the wheat sample area, the soybean sample area, corn sample area 1, and corn sample area 2. The results are shown in Table 4.

Table 4.
Calculation results of point-to-pixel-scale conversion uncertainty of different sampling methods (%).
As can be seen from Table 4, the uncertainties of the five sample areas are less than 1% in most cases. Among them, the single-ESU method has the largest uncertainty, with the maximum uncertainty reaching 4.926%, and the average uncertainty of the single-ESU method in the five sample areas is 1.677%. When the number of sampling points increases, its scale conversion uncertainty decreases, and the uncertainty of the 4-ESU method, 5-ESU method, 9-ESU method, and 16-ESU method decreases from 0.651% to 0.301%. However, when the number of sampling points increases from 16 to 25, the uncertainty does not decrease but rather increases to 0.354%. This indicates that as the number of sampling points increases to a certain quantity, the uncertainty of its scale conversion tends to stabilize. Therefore, the recommended number of sampling points is between 4 and 16. To balance the number of sampling points and the uncertainty of scale conversion, the five-ESU sampling method is preferred.
It can also be seen from Table 4 that the scale transformation uncertainty varies greatly in different sample areas. The average uncertainty of the six sampling methods was calculated. Among them, the types of sample areas with scale conversion from small to large are bare soil < wheat < corn2 < corn1 < soybean. This indicates that the uncertainty of bare soil is smaller than that of vegetation, the uncertainty of dense vegetation is smaller than that of sparse vegetation, and the uncertainty of higher sparse vegetation is smaller than that of low vegetation. Therefore, when selecting sampling methods for different sample areas in the future, the choice of sampling methods can be determined based on the uncertainty requirements of scale transformation and the types of sample areas.
5.2. The Effect of Measurement Height on Scale Conversion Uncertainty
To quantitatively analyze the influence of measurement height on the uncertainty of truth acquisition, we reduced the ground spectral measurement height from 1 m to 0.5 m and 0.2 m. The uncertainties for different sample areas and sampling methods were calculated accordingly, and the results are presented in Table 5 and Table 6.

Table 5.
Calculation results of point-to-pixel-scale conversion uncertainty for different sampling methods—0.5 m measurement height (%).

Table 6.
Calculation results of point-to-pixel-scale conversion uncertainty for different sampling methods—0.2 m measurement height (%).
Table 5 gives the point-to-pixel-scale conversion uncertainties of different sampling methods at the measurement height of 0.5 m. Compared with the 1 m measurement height, the overall uncertainty of the 0.5 m measurement height increases slightly. For example, the average uncertainty of the single-ESU method increased from 1.677% to 1.908%. The average uncertainty of different sampling methods increases by about 20%. The overall change is similar to that of the 1 m measurement height.
Table 6 shows the point-to-pixel-scale conversion uncertainties of different sampling methods at the measurement height of 0.2 m. Compared with the measurement height of 1 m, the uncertainty increase in the measurement height of 0.2 m is more obvious. For example, the average uncertainty of the single-ESU method increases from 1.677% to 2.346%. The average uncertainty increase of different sampling methods is about 50%. The changes of the single-ESU method, 9-ESU method, 16-ESU method, and 25-ESU method are similar to those at the 1 m measurement height. However, the uncertainty of the four-ESU method is close to that at a measurement height of 1 m, which increases slightly from 0.651% to 0.684%, while the uncertainty of the five-ESU method increases significantly compared with that at the measurement height of 1 m, from 0.47% of 1 m to 0.900%, and the uncertainty increases by about 90%.
Combining the results of the analysis in Table 5 and Table 6, it can be seen that the uncertainty increases as the measurement height decreases. When the measurement height is reduced from 1 m to 0.5 m or 0.2 m, the measurement uncertainty increases by approximately 20% or 50%. When measuring the height of 0.2 m, the measurement uncertainty changes under the four-ESU method and the five-ESU method are inconsistent with those at other heights.
5.3. The Effect of Number of Spectra on Scale Conversion Uncertainty
When performing spectrum measurement in the ESU, we used a “cross” pattern to measure five spectra, which were used as the point-scale measurement spectra of the ESU on the ground. If the number of sampled spectra is reduced from 5 to 1, and the measurement height is 1 m, the influence of the uncertainty of the number of different spectra is analyzed using a similar method as in Section 5.1. The results are shown in Table 7.

Table 7.
Uncertainty results of various sampling methods for one spectrum in the ESU.
Compared with Table 4, when the number of spectra of the ESU is reduced from 5 to 1, except for under the 25-ESU method, the average uncertainty of other sampling methods increases, and the average increase is about 40%. For the 25-ESU method, when the number of spectra of the ESU is reduced, the average uncertainty is reduced from 0.354% to 0.340%, which has different characteristics from those of other sampling methods.
6. Conclusions and Outlook
In this study, we use airborne hyperspectral images to obtain reflectance images of various sample areas through the processing of radiometric calibration, atmospheric correction, image stitching, and sample area clipping. Taking the vegetation endmembers and bare soil endmembers of a soybean area as an example, we use ground-measured spectra to validate the accuracy of the reflectance spectra retrieved by the hyperspectral UAV. The correlation coefficients for both cases exceed 99%, indicating that simulating sampled spectra with different spatial resolutions using hyperspectral images is reliable. Subsequently, we use the hyperspectral reflectance images to simulate the ground point-scale measurement spectra and pixel-scale spectra, and quantitatively calculate the uncertainty caused by point-to-pixel-scale conversion. On this basis, the influence of the ground sampling method, measurement height, and the number of elementary sampling unit spectra on point-to-pixel-scale conversion uncertainty is analyzed in depth, leading to the following conclusions:
- We used the nine-ESU system sampling method, a 1 m measurement height, and five spectra in the ESU to simulate the point-to-pixel-scale conversion uncertainty of different ground objects. Among them, the point-to-pixel-scale conversion uncertainties in bare soil, wheat, soybean, corn1 (denser) and corn2 (sparser) were 0.337%, 0.467%, 0.27%, 0.336%, and 0.573%, respectively. All were less than 0.6%.
- We optimized the sampling method according to the heterogeneity of the sample area. For the bare soil sample area, we recommend the four-ESU method, with an uncertainty of 0.301%. For the wheat sample area, we recommend the five-ESU method, with an uncertainty of 0.137%. For the soybean sample area, we recommend the nine-ESU method, with an uncertainty of 0.27%. For the denser corn sample area, we recommend the four-ESU method, with an uncertainty of 0.226%. For the relatively sparse corn sample area, we recommend the 16-ESU method, with an uncertainty of 0.043%. It should be noted that the above quantitative results are only applicable to the sample areas selected in this study, but this conclusion can provide a certain reference for similar ground objects or sample areas with similar scenes.
- When the measurement height was changed from 1 m to 0.5 m and 0.2 m, the scale conversion uncertainty increased by about 20% and 50%, respectively. When the five spectra in the ESU were reduced to one to calculate the point-scale spectrum of the ESU, except for under the 25-ESU method, the average uncertainty of other sampling methods increased, with an average increase of about 40%.
The research results of this study provide technical support for the subsequent optimization of ground sampling methods, the quantitative calculation of point-to-pixel-scale conversion uncertainty, and the improvement of measurement efficiency and measurement accuracy. However, this study still has some shortcomings that require improvement: (1) This study only employs uniform and homogeneous ground objects for uncertainty analysis. Therefore, the quantitative results presented in this study are only applicable to the specific scene of this study and may have a certain reference value for other similar uniform ground objects. In subsequent work, based on this work, we will calculate the percentages of soil and vegetation in more diverse areas by using image classification, thus analyzing the relationship between different sampling methods and site heterogeneity. (2) This study only analyzes the system sampling method. Other sampling methods, such as stratified sampling and simulated annealing sampling, will be used in the future to further improve sampling efficiency and accuracy. In the future, more airborne hyperspectral images can be used to analyze the ground sampling methods and uncertainties under heterogeneous surfaces through ground spectral simulation and uncertainty analysis, which will provide a basis for more spectral sampling of ground object categories and the acquisition of ground truths at the corresponding scales.
Author Contributions
Conceptualization, methodology, and writing—review and editing, H.G.; data curation, writing—original draft preparation, Q.W.; funding acquisition, X.G.; project administration, J.Y.; resources, Q.L. and Z.T.; validation, X.Q. and W.Z.; investigation, X.S.; formal analysis, X.Z. All authors have read and agreed to the published version of the manuscript.
Funding
This research was funded by the Strategic Priority Research Program of the Chinese Academy of Sciences (XDA28050401) and Common Application Support Platform for National Civil Space Infrastructure Land Observation Satellites (2017-000052-73-01-001735).
Data Availability Statement
Not applicable.
Acknowledgments
We appreciate all reviewers and editors for their comments on this paper.
Conflicts of Interest
The authors declare no conflict of interest.
References
- Origo, N.; Gorrono, J.; Ryder, J.; Nightingale, J.; Bialek, A. Fiducial Reference Measurements for validation of Sentinel-2 and Proba-V surface reflectance products. Remote Sens. Environ. 2020, 241, 111690. [Google Scholar] [CrossRef]
- Justice, C.; Belward, A.; Morisette, J.; Lewis, P.; Privette, J.; Baret, F. Developments in the ‘validation’ of satellite sensor products for the study of the land surface. Int. J. Remote Sens. 2000, 21, 3383–3390. [Google Scholar] [CrossRef]
- Morisette, J.T.; Privette, J.L.; Justice, C.O. A framework for the validation of MODIS Land products. Remote Sens. Environ. 2002, 83, 77–96. [Google Scholar] [CrossRef]
- Roman, M.O.; Schaaf, C.B.; Woodcock, C.E.; Strahler, A.H.; Yang, X.; Braswell, R.H.; Curtis, P.S.; Davis, K.J.; Dragoni, D.; Goulden, M.L.; et al. The MODIS (Collection V005) BRDF/albedo product: Assessment of spatial representativeness over forested landscapes. Remote Sens. Environ. 2009, 113, 2476–2498. [Google Scholar] [CrossRef]
- Cescatti, A.; Marcolla, B.; Vannan, S.K.S.; Pan, J.Y.; Roman, M.O.; Yang, X.; Ciais, P.; Cook, R.B.; Law, B.E.; Matteucci, G.; et al. Intercomparison of MODIS albedo retrievals and in situ measurements across the global FLUXNET network. Remote Sens. Environ. 2012, 121, 323–334. [Google Scholar] [CrossRef]
- Hufkens, K.; Bogaert, J.; Dong, Q.H.; Lu, L.; Huang, C.L.; Ma, M.G.; Che, T.; Li, X.; Veroustraete, F.; Ceulemans, R. Impacts and uncertainties of upscaling of remote-sensing data validation for a semi-arid woodland. J. Arid Environ. 2008, 72, 1490–1505. [Google Scholar] [CrossRef]
- Xiaowen, L.I. Review of the Project of Quantitative Remote Sensing of Major Factors for Spatial-Temporal Heterogeneity on the Land Surface. Adv. Earth Sci. 2006, 21, 771–780. [Google Scholar]
- Hu, X.; Liu, J.; Sun, L.; Rong, Z.; Li, Y.; Zhang, Y.; Zheng, Z.; Wu, R.; Zhang, L.; Gu, X. Characterization of CRCS Dunhuang test site and vicarious calibration utilization for Fengyun (FY) series sensors. Can. J. Remote Sens. 2010, 36, 566–582. [Google Scholar] [CrossRef]
- Gao, H.L.; Gu, X.F.; Yu, T.; Gong, H.; Li, J.G.; Li, X.Y. HJ-1A HSI on-orbit radiometric calibration and validation research. Sci. China Technol. Sci. 2010, 53, 3119–3128. [Google Scholar] [CrossRef]
- Li, X.; Liu, S.; Ma, M.; Xiao, Q.; Liu, Q.; Jin, R.; Che, T.; Wang, W.; Qi, Y.; Li, H.; et al. HiWATER: An Integrated Remote Sensing Experiment on Hydrological and Ecological Processes in the Heihe River Basin. Adv. Earth Sci. 2012, 27, 481–498. [Google Scholar]
- Wu, X.; Wen, J.; Xiao, Q.; You, D.; Wang, J.; Ma, D.; Lin, X. A Multiscale Nested Sampling Method for Representative Albedo Observations at Various Pixel Scales. IEEE J. Sel. Top. Appl. Earth Obs. Remote Sens. 2021, 14, 8193–8207. [Google Scholar] [CrossRef]
- Wu, X.; Wen, J.; Xiao, Q.; Youe, D. Upscaling of Single-Site-Based Measurements for Validation of Long-Term Coarse-Pixel Albedo Products. IEEE Trans. Geosci. Remote Sens. 2020, 58, 3411–3425. [Google Scholar] [CrossRef]
- Wu, X.; Wen, J.; Tang, R.; Wang, J.; Zeng, Q.; Li, Z.; You, D.; Lin, X.; Gong, B.; Xiao, Q. Quantification of the uncertainty in multiscale validation of coarse-resolution satellite albedo products: A study based on airborne CASI data. Remote Sens. Environ. 2023, 287, 113465. [Google Scholar] [CrossRef]
- Jing, X.; Uprety, S.; Liu, T.C.; Zhang, B.; Shao, X. Evaluation of SNPP and NOAA-20 VIIRS Datasets Using RadCalNet and Landsat 8/OLI Data. Remote Sens. 2022, 14, 3913. [Google Scholar] [CrossRef]
- Kim, K.; Lee, K. A Validation Experiment of the Reflectance Products of KOMPSAT-3A Based on RadCalNet Data and Its Applicability to Vegetation Indexing. Remote Sens. 2020, 12, 3971. [Google Scholar] [CrossRef]
- Wenny, B.N.; Thome, K.; Czapla-Myers, J. Evaluation of vicarious calibration for airborne sensors using RadCalNet. J. Appl. Remote Sens. 2021, 15, 034501. [Google Scholar] [CrossRef]
- Visschers, R.; Finke, P.A.; de Gruijter, J.J. A soil sampling program for the Netherlands. Geoderma 2007, 139, 60–72. [Google Scholar] [CrossRef][Green Version]
- Sankey, J.B.; Brown, D.J.; Bernard, M.L.; Lawrence, R.L. Comparing local vs. global visible and near-infrared (VisNIR) diffuse reflectance spectroscopy (DRS) calibrations for the prediction of soil clay, organic C and inorganic C. Geoderma 2008, 148, 149–158. [Google Scholar] [CrossRef]
- Zhu, Z.Y.; Stein, M.L. Spatial sampling design for prediction with estimated parameters. J. Agric. Biol. Environ. Stat. 2006, 11, 24–44. [Google Scholar] [CrossRef]
- Vasat, R.; Heuvelink, G.B.M.; Boruvka, L. Sampling design optimization for multivariate soil mapping. Geoderma 2010, 155, 147–153. [Google Scholar] [CrossRef]
- Li, R.; Zhou, X.; Lyu, T.; Tao, Z.; Wang, J.; Xie, F. Optimal sampling strategy for authenticity test in heterogeneous vegetated areas. Trans. Chin. Soc. Agric. Eng. 2021, 37, 177–186. [Google Scholar]
- Wu, X.; Xiao, Q.; Wen, J.; Liu, Q.; Peng, J.; Li, X. Advances in uncertainty analysis for the validation of remote sensing products: Take leaf area index for example. J. Remote Sens. 2014, 18, 1011–1023. [Google Scholar]
- Li, X.; Liu, S.; Yang, X.; Ma, Y.; He, X.; Xu, Z.; Xu, T.; Song, L.; Zhang, Y.; Hu, X.; et al. Upscaling Evapotranspiration from a Single-Site to Satellite Pixel Scale. Remote Sens. 2021, 13, 4072. [Google Scholar] [CrossRef]
Disclaimer/Publisher’s Note: The statements, opinions and data contained in all publications are solely those of the individual author(s) and contributor(s) and not of MDPI and/or the editor(s). MDPI and/or the editor(s) disclaim responsibility for any injury to people or property resulting from any ideas, methods, instructions or products referred to in the content. |
© 2023 by the authors. Licensee MDPI, Basel, Switzerland. This article is an open access article distributed under the terms and conditions of the Creative Commons Attribution (CC BY) license (https://creativecommons.org/licenses/by/4.0/).

