Abstract
Density maps support a bird’s eye view of vessel traffic, through providing an overview of vessel behavior, either at a regional or global scale in a given timeframe. However, any inaccuracies in the underlying data, due to sensor noise or other factors, evidently lead to erroneous interpretations and misleading visualizations. In this work, we propose a novel algorithmic framework for generating highly accurate density maps of shipping activities, from incomplete data collected by the Automatic Identification System (AIS). The complete framework involves a number of computational steps for (1) cleaning and filtering AIS data, (2) improving the quality of the input dataset (through trajectory reconstruction and satellite image analysis) and (3) computing and visualizing the subsequent vessel traffic as density maps. The framework describes an end-to-end implementation pipeline for a real world system, capable of addressing several of the underlying issues of AIS datasets. Real-world data are used to demonstrate the effectiveness of our framework. These experiments show that our trajectory reconstruction method results in significant improvements up to 15% and 26% for temporal gaps of 3–6 and 6–24 h, respectively, in comparison to the baseline methodology. Additionally, a use case in European waters highlights our capability of detecting “dark vessels”, i.e., vessel positions not present in the AIS data.
1. Introduction
The European Commission has set a goal of achieving zero emissions of greenhouse gases by 2050 [1], in line with the Paris Agreement [2], where countries globally have agreed to pursue efforts to limit global warming to below 2 degrees Celsius, compared to pre-industrial levels. Scenarios explored in this context suggested that achieving this will require doubling electricity production with about a quarter of it being produced offshore [1], resulting in enormous changes to European waters. Up to a quarter of certain countries’ waters could be devoted to wind farms, inevitably impacting other different marine activities. Current sea-related uses and activities involve maritime shipping, fishing, extended aquaculture, oil and gas exploration and drilling, leisure and boating activities, cultural heritage conservation initiatives and many more. Improving our understanding of activities that take place at sea, including their spatial and temporal aspects, is vital in the light of an intensified use of maritime space [3].
For the purpose of detailed analyses on the activities occurring at sea, the constant monitoring of vessel behavior is necessary. Systematic monitoring techniques can be split into two separate categories, depending on whether the subject in question, i.e., the vessels, take part in the process. The first group rely on the detections from sensors such as RADAR, Sonar and satellite imagery, and are able to extract the location and movement of vessels through processing their input [4]. Recently, the advancements of remotely operated and autonomous vehicles have lead to some works on the constant monitoring areas near the coast [5]. Such systems do not require the aid or even the permission of the vessels to operate and thus are more suitable for studying illegal or malicious activity [6]; however, their accuracy largely depends on hardware specifications, the coverage over an area of interest and post-processing methods. On the other hand, the second group is comprised from systems whose function depends on the cooperation of the vessels themselves. In other words, these systems work through the transmission of positional messages from the vessels, allowing others to record their movement. A few systems have been introduced and are operating today, with the most prominent ones being the Long-range Identification and Tracking (LRIT) and the Automatic Identification System (AIS) [7,8]. The main reason that vessels use such systems to transmit their positions, or other relevant information, is mainly to ensure safety while travelling. Regardless of the effectiveness of any system, capturing the accurate and complete trajectory of a moving object is almost impossible in real conditions. This is mainly due to the inherent limitations of data acquisition and storage mechanisms used. As a result, the continuous movement of an object is usually obtained as an approximate form of discrete samples of spatio-temporal locations [9]. Sometimes the error is acceptable for a given use case while in other occasions it may lead to erroneous interpretations.
Since being declared as mandatory for large vessels in 2004, the most commonly used datasets for vessel tracking have been based on the AIS. Besides their location, the vessels broadcast their identification information, characteristics and destination, along with other information originating from on-board devices and sensors, such as their speed and heading [9,10,11]. Due to the large number of vessels transmitting their positions globally, advanced analysis is required to interpret these data. Towards an improved understanding of such datasets, visualizations through density maps is commonly used. The added value of density maps is that they support a bird’s eye view of maritime traffic, through providing an overview of vessel behavior either at a regional or a global scale. From density maps, one can determine the patterns of life in a given study area. Patterns of life are understood as observable human activities that can be described as patterns in the maritime domain related to a specific activity (e.g., fishing) [9]. Essentially, vessel-based maritime activity can be described in space and time while being classified to a number of known activities at sea (fishing etc.). The spatial element describes recognized areas where maritime activity takes place, including ports, fishing grounds, offshore energy infrastructure, dredging areas, etc. The transit paths to and from these areas also describe the spatial element (e.g., commercial shipping, ferry routes), while the temporal element often holds additional information for categorizing these activities (e.g., fishing period, time of year, etc.) [12].
In this setting, we identify two main tasks that we address in this paper. The first task is to design and develop a pipeline capable of producing sound and clear interpretations of shipping activity in a given area of interest from noisy and often inaccurate AIS data, extending the high-level description in [13]. We design and implement a number of algorithmic methods that support the handling of these data and their transformation into accurate density maps. We provide modules for the data transformation process, from data cleaning and smoothing, to the final result visualization. In light of an intensified use of maritime space, there will be a growing need for such applications in the near future.
The second task is to create mechanisms for improving the quality of the AIS datasets, by including additional vessel positions. Such mechanisms would result in more complete datasets and in turn would assist in generating more accurate density map depictions of vessel activity. Two techniques are described for this task. First, a novel method for trajectory gap filling is proposed. This method leverages historical data to restore missing positional messages in any given ship trajectory, improving the completeness and quality of the underlying data. In order to evaluate our approach, we validated its performance on a real-world dataset of AIS messages, covering European waters from October of 2021. The results indicate that our suggested method can effectively reconstruct a ship trajectory with higher accuracy (up to 26%), compared to a straight-line interpolation. Furthermore, we present a dedicated mechanism that is able to extract vessel positions based on satellite imagery. This mechanism is suitable for both radar and optical data, allowing for the monitoring of vessels in cases where the AIS does not. This approach is based on a Convolutional Neural Network (CNN) architecture and allows for extracting vessel coordinates in cases where AIS data are not available, making an excellent complementing data source. Preliminary results of this latter framework can also be observed in [14].
The overall framework describes an end-to-end implementation pipeline for a real world system, capable of addressing several of the underlying issues of AIS datasets and producing highly accurate density maps. Specific components of the framework, demonstrate several advantages over existing algorithms, while the overall complete framework is unique for producing this type of visualization for AIS data. The contributions of this work can be described as follows:
- We provide an overview of the AIS system and how it can be used to capture vessel movement, while also highlighting some of the issues with the fitness of AIS data.
- We describe two mechanisms for improving the quality of an input AIS dataset, in cases of significant temporal gaps in the trajectories. The first mechanism suggests the most probable path the vessel followed during its AIS-messages gap, using historical mobility information over the area of interest. The other leverages satellite imagery to enrich our original dataset with additional vessel positions through an accurate detection technique based on CNN architecture.
- We present a complete configurable framework that is capable of creating effective density visualizations based on raw data.
- We conduct extensive experiments to demonstrate the effectiveness of our approach, using real AIS data and satellite images from the European waters from a one-month period. The results indicate significant improvement over the straight-line-interpolation baseline technique, for the trajectory reconstruction, and highlight the frameworks ability to detect vessels that do not transmit AIS messages.
The rest of the paper is organized as follows: first we mention related work regarding AIS manipulation, reconstruction and visualization, as well as works that deal with vessel identification through satellite imagery (Section 2). Then, we describe our process for creating density maps from raw AIS messages (Section 3). Following this, we describe the two mechanisms for improving the quality of the AIS dataset (Section 4) and present the subsequent results of the experimental evaluation (Section 5). A discussion on the results of our experiments and the effectiveness of our proposed framework is described in Section 6. Finally, we conclude our work with a discussion on the end results and possible future steps for further improvements on our method’s accuracy (Section 7).
2. Background
In this section, we provide important definitions regarding vessel movement and density map visualization. Moreover, we provide a brief review of past work concerning vessel trajectory reconstruction and vessel identification through satellite imagery.
2.1. Spatio-Temporal Data and the Automatic Identification System (AIS)
A trajectory can be captured as a time-stamped series of location points denoted as , where represents geographic coordinates of the moving object at time and n is the total number of elements in the series (e.g., Figure 1 demonstrates a trajectory of 16 points). To generate the trajectory, a sensor needs to acquire its coordinates at time t.
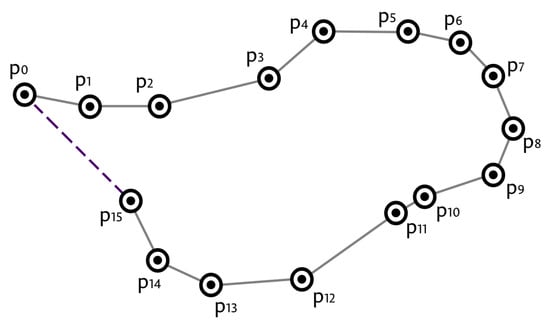
Figure 1.
In grey is the true trajectory, while in purple the approximated trajectory is captured by a given sensor.
Notice that the approximated trajectory can also be represented as a series of line segments between the stamped positions (given that there is a unique identifier grouping these positions into the same trajectory, usually the moving object id):
AIS messages are broadcasted periodically and can be received by other vessels equipped with the appropriate transceivers, as well as by on-the-ground or satellite-based sensors [15]. This information is transmitted at regular intervals ranging anywhere from 2 s to 3 min, depending on the vessel’s behavior. Since 31 December 2004, AIS must be fitted aboard all vessels of 300 gross tonnage and upwards engaged on international voyages, cargo vessels of 500 gross tonnage and upwards not engaged on international voyages and all passenger vessels, irrespective of size [16].
Even though the AIS protocol is mainly targeted for larger vessels, a large number of smaller boats are also equipped with transceivers to ensure their safety while travelling. The vessels required to carry AIS are equipped with Class A AIS transponders, whereas other vessels can carry either Class A or Class B AIS transponders. The Class A transponder has a more powerful signal and transmits messages more frequently than the Class B transponders; therefore, Class A transponders typically have a finer spatial and temporal resolution. Vessels which may carry Class B transponders include recreational vessels, fishing vessels or small passenger vessels [17].
Ground-based (Terrestrial AIS or TER-AIS) and space-based AIS (Satellite AIS or SAT-AIS) datasets have some considerable differences:
- Terrestrial receivers are land-based stations which receive messages from vessels within their line of sight. Once the message is received, it is relayed via network connection to a computer for storage, processing and visualization. Typically, with an optimal terrestrial receiver setup, messages from up to 40–60 nautical miles away can be received.
- Satellite receivers function similarly to terrestrial receivers by transmitting the received AIS message to a computer for data storage, processing and visualization. Having a large field of view (up to 5000 km), satellite receivers are always in view of the transponders [18].
2.1.1. Data Fitness
The concept of data quality is somewhat vague, but an effective and commonly used definition for data quality is “fitness for use”, which is the ability of the data collected to meet user requirements [12]. Many works have focused on addressing such uncertainty in location data related to modelling and representation. Specific applications may allow some imprecision based on their requirements. AIS datasets have long been used for maritime density maps and researchers have identified some of the underlying difficulties affecting the data fitness [19,20,21,22,23,24].
Although AIS datasets are some of the most important sources of information for maritime traffic, the resulting spatial trajectories may have several missing data points due to several factors, including design features or malicious activity:
- Firstly, datasets that have been collected by Satellites and those by Terrestrial stations will have different granularities and resolutions. Earth orbiting satellite collecting AIS messages are easily congested when there is a large number of vessels within their given field of view. AIS is based on the Time Division Multiple Access (TDMA) radio access scheme which ensures that no two ships within radio range of each other are transmitting at the same time. The TDMA defined in the AIS standard creates 4500 available time-slots in each minute but this can be easily overwhelmed by the large satellite reception footprints and the increasing numbers of AIS transceivers, resulting in message collisions, which the satellite receiver cannot process. Schemes such as the TDMA were designed for successful ship-to-ship or ship-to-shore communication, not for ship-to-satellite communication, which heavily degrades their efficiency [25]. However, in the case of the satellite segment of the AIS, the efficiency of the implemented access schemes is heavily degraded due to the high ratio of the AIS packets’ collisions.
- Additionally, according to the AIS specifications, Class A transceivers reserve their time slots for transmission via Self Organized Time Division Multiple Access (SOTDMA). After performing a scan to ascertain which slots have already been reserved by other vessels, they reserve an empty slot. The device lets nearby AIS devices know that it intends to use this slot for future broadcasts. On the other hand, Class B transceivers are permitted to transmit via Carrier Sense Time Division Multiple Access (CSTDMA), where, unlike SOTDMA, slots are not reserved. They instead simply scan for available space and transmit when a free one is determined to be available. Transmission priority is given to Class A transceivers, which use SOTDMA since they reserve time slots. The timing of Class B transmissions via CSTDMA must work around the time slots reserved by Class A transceivers. If a Class B transceiver is unable to find an empty space, their transmissions are delayed.
- Recently, a different type of Class B transmitter that uses SOTDMA, namely Class B “SO” (Self-Organizing), was produced. Class B “SO” and Class A transmitters fitted aboard vessels have a critical difference which also affects Satellite reception. According to the International Telecommunications Union specifications, provision should be made for two levels of nominal power (high power and low power), as required by some applications. The default operation of the AIS station should be on the high nominal power level. The two power settings should be 1 W and 12.5 W or 1 W and 5 W for Class B “SO”. Evidently, the weaker signal of Class B devices means it is more difficult to receive these signals from space.
Additionally, SAT-AIS cannot capture the signal of all transmitting vessels at once; several orbits are required in order to capture a representative density sample. In previous studies [26], the data compilation approach for acquiring information relevant to the vessel population was based on the generation of vessel position ‘snapshots’ in a specified time window. As the duration of this window increases, the amount of information gained in terms of distinct vessels, newly detected by the available sensors, tends to decrease. On the other hand, coastal reception from the terrestrial receivers is only possible if a vessel is within the line of sight or approximately 40 nautical miles in ideal conditions, which is affected by bad weather and other conditions [27].
Besides its limitations, AIS remains the go-to source of data for understanding maritime activities and for this several works have focused on identifying the issues [27,28,29] and developing techniques that improve the existing AIS by offering better tracking accuracies and guarantees.
Definition 1 (Incomplete Trajectory).
Given the sparse spatial data , , , , , , of a moving ship, consisting of its time stamped locations, the resulting trajectory can be defined as:
It should be noted that .
Such inaccuracies of sparse trajectories, can easily lead to faulty analysis and conclusions regarding vessel movement, if not dealt with appropriately. In the following sections, two techniques for improving the quality of sparse trajectories are described.
2.1.2. Incomplete Trajectories
Despite the high rate of transmission of AIS messages, sparse trajectories often occur in datasets. Reconstructing the trajectories during large gaps is no simple task. Most current approaches to density map generation will simply remove interpolate trajectories with large missing parts [30,31]. Several works have proposed strategies for dealing with the imperfections of AIS data and specifically for completing or filling the gaps in trajectories. The majority of these works assume that at least in theory, the trajectory of a ship can be approximated as a straight line for a short time interval. Therefore, linear interpolation is the most widely used gap-filling method [32,33,34,35]. According to this method, the positions of the ship between two points are calculated by interpolating their coordinates (latitude and longitude) according to the desired timestamp. However, this method is only suitable for small forecasting windows (e.g., several minutes), high frequency data and in situations when the vessel is expected to follow uniform linear motion. Additional interpolation methods have been proposed, such as polynomial, cubic spline interpolation, Lagrange and Hermite interpolation methods, which take into consideration additional features such as direction, heading and speed to reconstruct trajectories with curves [34,36]. Unfortunately, the above methods do not take into account the environment or prior information regarding a travel area. They also show degraded accuracy in scenarios where ships conduct maneuvers often (e.g., rivers).
Several works have attempted to combine the methods above with the ships’ navigational status to improve results. Zhang et al. proposed a trajectory reconstruction approach considering the navigation states, namely hotelling, maneuvering, and normal-speed sailing [37]. In this work, both linear interpolation and cubic spline interpolation for straight and curve sub-trajectories, respectively, are applied to reconstruct a new smooth trajectory. The majority of these approaches remain geometry-based approaches, unfortunately not making use of the kinematic information of the ship or historical information of the area; thus, the accuracy of the results is limited [38].
Recently, advances in machine learning have led to numerous works with applications in transportation [39], with a large portion being about processing vessel trajectories. For example, in [20], CNNs are utilized to reconstruct AIS trajectories. Experimental results show that the proposed method is capable of higher accuracy than the cubic spline interpolation baseline method, especially when the trajectories are curved and have a high loss rate. Unfortunately, the test results cover only a small geographical area. In [30], a Long Short-Term Memory (LSTM)-based supervised learning method is used to reconstruct the vessel trajectories, achieving good results in short-term forecasts, without taking into account the environmental factors of ship sailing. Similarly, [40] uses an LSTM-based architecture that addresses some of the AIS-related issues, giving predictions to horizons up to 1 h in the future. Authors in [41] apply a deep learning method based on Bi-directional Long Short-Term Memory Recurrent Neural Networks (BLSTM-RNNs) for trajectory restoration. The method demonstrates higher accuracy than linear interpolation methods in complex waterways such as the Yangtze River, but the deep learning approach comes with a higher computational cost.
In [42] a novel sequence-to-sequence vessel trajectory prediction model based on encoder–decoder recurrent neural networks (RNNs) that are trained on historical trajectory data to predict future trajectory samples given previous observations is proposed. The suggested method showcases superior accuracy than baseline methods but relies heavily upon the historical data of paths belonging to the same motion pattern of the test trajectory, i.e., a large and representative sample of data from the domain. The authors mention that this potentially limits the method’s applicability since it may be sensitive to the training dataset, in particular the number of ship trajectories available and domain representativeness.
2.2. Satellite Images
As stated above, there are situations where the AIS protocols are not enough to capture the presence of a vessel in an area. These may be caused by the nature of the AIS system, such as packet collisions for dense areas or coverage issues, as well as the intentional switch-off of the transmitter. To overcome such issues and to have a more complete situational awareness, additional data sources should be included to complement AIS data.
One of the most prominent data sources that can be used for monitoring an area are satellite images, both optical and Synthetic Aperture Radar (SAR). Being a non-cooperative source, it does not rely on the vessels themselves for receiving data. Additionally, since such data are collected by satellites, global coverage can be considered a possibility [43,44]. Of course, as in all cases, relying solely on satellite imagery for monitoring an area comes with its own disadvantages. More specifically, optical imagery is often affected by weather conditions and environmental effects, while SAR data have limited spatial resolution. Moreover, a common issue with satellite images are long periods between consecutive visits of the satellite to the target area, resulting in sparse data [45]. Nevertheless, both optical and SAR images can be greatly useful—complementing AIS data—while trying to detect vessels in an area of interest, especially when dealing with gaps in the respective ship trajectories.
In the related literature, the problem of vessel detection in satellite imagery has been the focus of many academic and industrial research activities [43,44]. These activities can be classified into two broad categories:
- The approaches that are based on the employment of threshold-based algorithms, such as the Constant False Alarm Rate (CFAR) algorithms [46]. The CFAR is a group of adaptive algorithms that vary the detection threshold as a function of the sensed environment, rather than a single value, in order to try to fix the probability of false alarms due to noise or jamming at a predefined value. Different tools were presented for SAR imagery through CFAR algorithms over the years, as mentioned in [47]. Amongst them, the European Commission’s Joint Research Centre has released the Search for Unidentified Maritime Objects (SUMO), a tool specifically designed for detecting vessels in such images [48].
- AI-based approaches that employ Neural Networks (NNs) in order to detect vessels based on trained models [49].
Ref. [43] presents a detailed, up-to-date overview of approaches for vessel detection in optical imagery covering both categories. The processing chain that we used to perform vessel detection in satellite imagery for the needs of this project is based on our previous work that belongs to the AI-based category and is partially covered in [50]. However, in order to address the known scalability problems that come with the use of NNs in large volumes of satellite data [51], in this work, we further extend the approach described in [50] and developed a hybrid approach that employs both threshold-based mechanisms and CNNs, in order to obtain the best of both worlds: high accuracy results provided by CNNs while addressing scalability issues by using thresholding to filter out redundant image tiles.
2.3. Density Maps
Together with being a widely used visualization tool for mobility data, density maps allow for a further understanding of the traffic and subsequent activity in a specific area of interest [52,53]. Analyzing density maps as they evolve over time also supports traffic changes and pattern distribution interpretation. Moreover,
The term “vessel density” has several co-notations and is thus used with several meanings in the maritime domain. Therefore, vessel density can refer to:
- The average number of vessels detected within a defined geographical area (spatial grid) in a given timeframe;
- The average number of crossings within a defined geographical area (spatial grid) in a given timeframe (often also referred to as “vessel traffic density”);
- The total time of the presence of a vessel within a defined geographical area (spatial grid) in a given timeframe;
There is a considerable difference in the methods used for the creation of density maps according to the definition used, including calculations based on the number of vessel positions detected, the number of vessel tracks, their length crossing a given area and many more variations.
3. Generating Density Maps from Raw AIS Data
In this section, we illustrate the steps followed to produce highly accurate density maps of shipping activity from raw AIS data. The overall view of the process, as depicted in Figure 2, begins with the decoding of the data and the removal of erroneous and irrelevant messages. This step is followed by the calculation of the traffic density with the subsequent maps generated according to the grid resolution selected. For more accurate results, the option of improving the quality of the AIS dataset through additional vessel positions (orange component in Figure 2) may be considered. The two techniques proposed in this work for this step are described in detail in the following sections.

Figure 2.
Flowchart for extracting density maps from raw AIS, by decoding and cleaning the data and calculating the corresponding density. Improving the AIS dataset through the gap filling mechanism or fusing the data with satellite image detections (orange) may be incorporated for more accurate results.
For the implementation of our pipeline, we relied mainly on open-source libraries in Python for all steps. Moreover, to boost the performance of our system we used Python’s process parallelization option for the steps of cleaning, filtering and density calculation. For the handling of the geometries, during the grid generation and land-masking, the Shapely library was utilized, along with the GDAL library for the rasterization process.
3.1. Data Cleaning
As raw AIS messages have different types, static and dynamic information should be coupled manually. Information regarding the type and class of the vessel is extracted by ‘Static and Voyage Related Data’ messages and merged with the dynamic (positional) messages for the corresponding vessel, resulting in a more complete AIS dataset.
Furthermore, removing erroneous and unnecessary messages from AIS datasets is a crucial component for any further analysis of maritime movement. In this step, we clean the data through a series of filters on AIS messages, in order to smooth the noise and potentially decrease the error in their measurements. More precisely, the filters applied to each input message are the following:
- Empty fields: messages that monitor movement, like the AIS messages, may include a plethora of features. Besides primary features (positional and temporal) that denote the exact position of the moving vessel, other fields regarding its characteristics or its current state are usually provided. For the purpose of effectively analyzing the input data, we require that each positional message includes non-empty values in the following fields:
- Positional features: Vessel Longitude, Vessel Latitude, Timestamp of AIS occurrence (expressed in UNIX time in milliseconds).
- Movement measurements: Vessel Speed-over-Ground (SoG-measured in knots) and Vessel Course-over-Ground (CoG-measured in degrees).
- Invalid movement fields: While most messages include the fields regarding a vessel’s movement (SoG, CoG), in some instances, these fields carry invalid values. In such cases, the messages are characterized as erroneous and are discarded. The thresholds indicating valid movement are as follows:
- Speed-over-Ground: a real number between 0 and 80 knots.
- Course-over-Ground: a real number between 0 and 360 degrees.
- Invalid vessel identification number: With each AIS message referring to a single vessel, a field dedicated for its identification is needed. The Maritime Mobile Service Identity (MMSI) convention is widely used while referring to AIS transmitters (i.e., vessels) [11], with each single entry being a series of nine characters. Messages with a shorter or longer MMSI length, as well as messages whose MMSI falls into some exception values (123456789, 0.12345, 000000000, 111111111, et al.), are discarded.
- Areas of interest/Land-masking: While our approach may be applied regardless of the area in question, defining the space of reference is a crucial part for moving forward for two reasons:
- Removing data that refer to areas outside of the purpose of the execution scenario.
- Removing data that include erroneous coordinates, i.e., not valid longitude/latitude or points on land.
- Down-sampling: Although the frequency where each vessel is transmitting a positional message is usually desired to be as high as possible, having too many messages may result in considerable delays while processing. In order to overcome this issue, a down-sampling is performed upon the input data. The question at this point is whether we are able to disregard some sample points without sacrificing the quality of the trajectory data required for the target application. For this purpose, the trajectories are filtered so that consecutive messages from the same vessel have at least k minutes between them, which also remove all duplicate messages as a result.
- Time-frame: Restricting the time-frame where AIS messages are to be included in the end result may be useful for creating a custom dataset for analysis and removing messages with erroneous timestamps, due to noise. This filter can also be used for excluding messages referring to a time before the dataset’s specifications, caused by delays during their transmission.
- Noise-filter: In some cases, consecutive AIS messages of a single vessel indicate an invalid transition between the two points [54,55]. More precisely, if the distance between consecutive messages is so large that it would not be possible for a vessel to cover in the corresponding time frame, this transition is considered noise in our data and the second AIS message is removed. A transition is considered to be improbable if the calculated speed for the vessel to cover the distance in question exceeds the threshold of 92 km/h (approximately 50 knots).
- Insignificant tracks: For the purpose of processing only meaningful trajectories, all data regarding vessels that have less than 10 AIS messages after the merging step of our processing are discarded. This threshold can be adjusted depending on the use case.
Although these filters should be applied in most scenarios, the appropriate thresholds for some heavily rely on the input dataset quality, as well as the nature of the desired analysis for each use case. The filters considered—along with all steps of the suggested framework—are suitable for all types of vessels. Nevertheless, since some studies focus solely on specific types of vessels, a selection mechanism that keeps only vessels of a specific type can also be incorporated for more targeted results.
3.2. Creating the Grid
In order to generate density maps, the area of interest needs to be partitioned into square cells of equal size, creating a corresponding grid. Each grid is characterized by the edge length of its cells (in meters), with grids of smaller cells resulting in more accurate visualizations (see Figure 3).

Figure 3.
Grids for the area of the United Kingdom, for cell lengths of 500 km, 200 km, 100 km and 10 km (left to right).
For the process of creating such grids, it is important to select the appropriate projection system for the areas in question. As an example, for the European seas, the ETRS89 European Terrestrial Reference System [56] may be used. Although this step allows for an easier navigation through the data and area partition, an additional step of removing all cells that include solely land areas further improves the performance of our approach. While this can be applied in all resolutions, its use is more apparent in more detailed maps (see Figure 4).
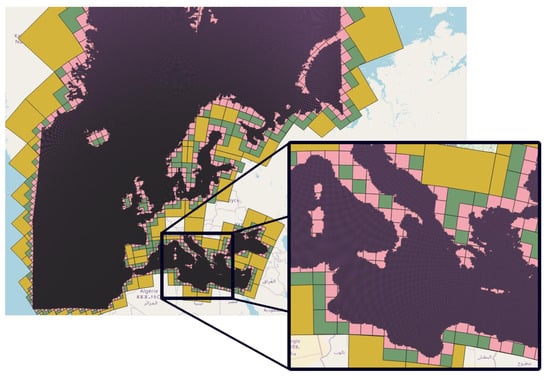
Figure 4.
Grids only with cells that include water areas for the EU seas, using the EPSG:3035 projection system, for cells lengths of 500 km (orange), 200 km (green), 100 km (pink) and 10 km (purple).
3.3. Computing Traffic Density
After cleaning the raw AIS data and creating the grid, we proceed with the computation of shipping density for the area over a specific time frame. It is worth noting that several different metrics can be used for calculating the shipping density within a given cell, according to the definitions previously mentioned (e.g., number of crossings, time spent etc.). For the purposes of this study, the density is extracted by calculating the cumulative interval that the vessels in question spent within each cell. In order to do so, trajectory segments are created from the cleaned AIS data; a segment is created for each pair of consecutive messages of the same vessel. During these segments, the vessel is considered to follow a linear path. As already mentioned, this approach may be considered accurate for relatively small time intervals and for small distances, but cannot be used universally. Thus, to avoid inaccurate measurements, segments that originate from AIS intervals larger than 6 h or have a length larger than 30 km are discarded. Also, similarly to the cleaning process, segments that indicate a vessel speed larger than 50 knots are also removed. Afterwards, each segment is split according to the grid, and the respective time for each cell is computed (see Figure 5).
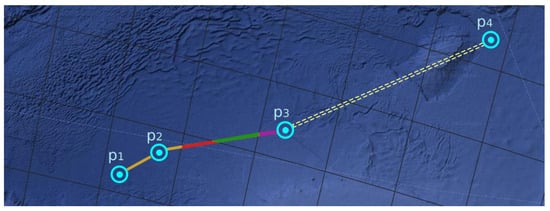
Figure 5.
The time-at-cells density calculated from a vessel’s positions (p1 ⇒ p2 ⇒ p3 ⇒ p4).
In this example, for the first segment () in Figure 5, the full time-interval is assigned to a single cell, since the vessel stays within its borders. For the second segment (), the line is split so that the corresponding sub-segment intervals are assigned to four cells in total. Lastly, the third segment () does not provide any additional measurements, since the distance between its confines is greater than the threshold.
After the density calculation, each cell is matched to the appropriate color, according to its value. More precisely, a series of density thresholds is provided for the map generation, along with the corresponding colors; cells with values between these predefined thresholds are assigned colors using a logarithmic scale (Figure 6). The resolution of the produced maps depends solely on the needs of the user; examples for four different resolutions for the whole area of Europe can be found in Figure 7.
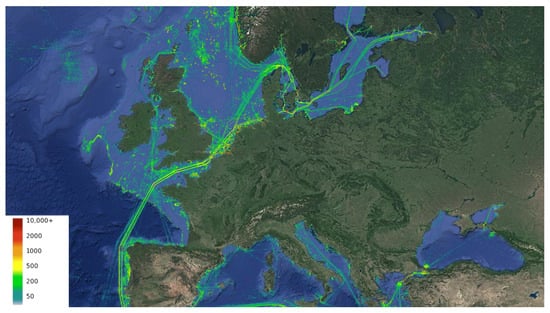
Figure 6.
Density map for the cleaned SAT-AIS messages from the month of October 2021 from central European waters, depicting the total time vessels spent in each grid cell in hours (according to the color caption).
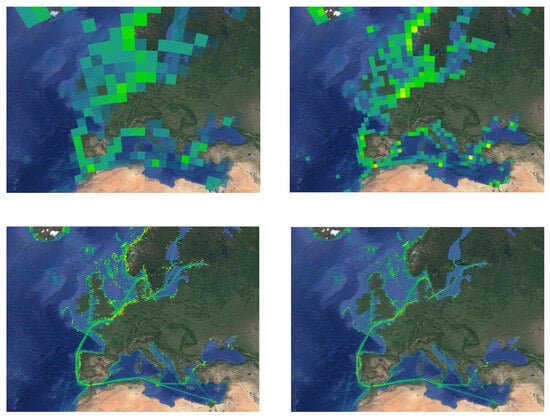
Figure 7.
Density maps for four different resolutions (in terms of grid cell length in km, top: left 200 × 200 and right 100 × 100, bottom: left 10 × 10 and right 1 × 1) for SAT-AIS data from the month of October 2021 from central European waters (depicting the total time vessels spent in each grid cell in hours).
4. Improving AIS Data
In this section, two methods for improving the trajectories given by the AIS data are provided. First, we propose a grid-based reconstruction technique for filling large temporal gaps on the AIS data. After that, we describe a pipeline for generating additional vessel positions using satellite images. The following methods can be applied to any AIS dataset in order to improve its quality and in turn lead to more accurate depictions of vessel traffic. The presented techniques are suitable for different types of vessels. Most precisely, the trajectory reconstruction can be applied to all vessel types that follow repetitive patterns. On the contrary, results have shown that most vessels that often diverge such patterns, like pleasure crafts or small fishing boats, do not benefit from such techniques. Regarding satellite imagery, due to the specifications of the images used, vessels of small dimensions are more difficult to be identified. More specifically, since the maximum pixel resolution is of 10 m length, vessels whose size is smaller than a few pixels may not be recognized by the CNN.
4.1. Trajectory Reconstruction
As previously noted, sparse AIS data are problematic for vessel movement analysis, since the reconstructed trajectories from straight line segments between the positional messages do not represent the vessels’ real paths. Tasks such as the creation of line-based density maps depend on the validity of these data and may in turn suffer in accuracy. In this section, a mechanism for effectively reconstructing large gaps on vessel trajectories is presented. This mechanism allows for the transformation of sparse AIS data into more detailed trajectories.
The implemented technique takes advantage of historical data to discover frequently followed paths using graph theory methods. Firstly, the movement space, i.e., the sea areas of interest, is partitioned and transformed into a grid; for the purposes of accuracy, a grid cell edge length of 1km can be selected. Furthermore, movement from historical data is modelled using vessel transitions between neighboring cells. Cells are considered to be neighboring if they have no other cells in between them, i.e., each cell has at most eight neighbors (see Figure 8).
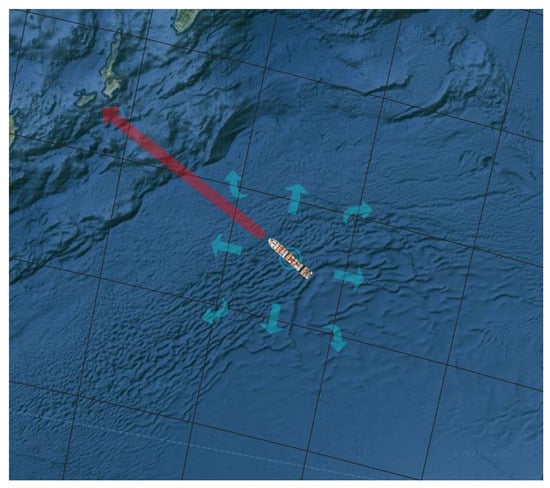
Figure 8.
Each grid cell has at most eight (8) neighbours; the light blue arrows indicate all the possible transitions that may be followed by a vessel, while there cannot be a single transition to the cell with the island (represented by the red arrow).
After extracting all transitions between the cells, we transform the grid into a directed weighted graph. Each graph node represents a grid cell, while the edges of the graph are used to model transitions between neighboring cells. The weight of each edge is calculated as the (Euclidean) distance between the cells. Additionally, a second weight-penalty modelling the patterns of vessel movement is assigned to each edge, from node to node , using the formula:
where is the second weight between the nodes, are the corresponding neighbouring cells, is the number of transitions between these cells and is the total number of outgoing transitions for cell . Finally, for neighboring cells with no transitions observed between them, a predefined weight-penalty equal to is assigned. This penalty should be a real number equal to or greater than 1, indicating that a larger price needs to be paid for such a path. Note that all other weight-penalties can be bounded by 0 and 1, with smaller values assigned to more frequent transitions.
The resulting graph incorporates both historical information and spatial characteristics of the grid, through its inclusion of two weights. Thus, the generated paths are informed by past movement while also following routes of low cost, in terms of total distance covered by the vessel. This way, instances where common traffic patterns distort apparent and self-evident suggestions between AIS points, like the one depicted in Figure 9, can be easily avoided. The way each weight (historical information or spatial characteristics) affects the accuracy of the results may vary depending on the usecase. More details are provided in the following paragraphs that describe the path-finding algorithm used.
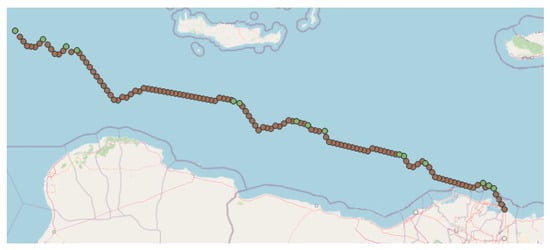
Figure 9.
Depiction of trajectory reconstruction using solely historical information. The green points represent the real AIS messages while the brown ones represent the generated paths between them. As observed, common patterns of movement may in some cases distort the trajectories created, compared to what was expected, when spatial information is not taken into account.
This process extracts useful information regarding vessel movement in the area that can be used to generate possible paths during AIS gaps. The process of estimating a path, depicted in Figure 10 and described in the form of a pseudo-code in Algorithm 1, consists of the following steps:
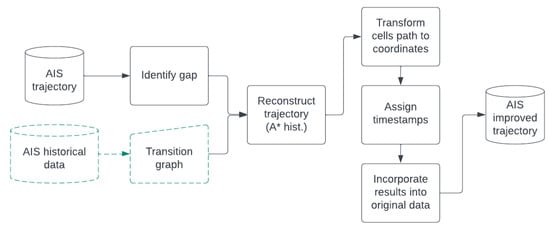
Figure 10.
Process for improving AIS trajectories with gaps; the transition graph is exported once, using historical data (green), and is used for every identified gap.
- Identify the AIS gap within a trajectory and the two cells where the gap started and ended.
- Use the transition graph to extract a path between these cells, through an enhanced A* algorithm [57].
- Transform the returned path, expressed as a series of grid cells, to a series of real coordinates.
- Assign a timestamp for each generated point, based on the length of the resulting path and the overall gap interval.
- Incorporate the resulting coordinate-timestamp pairs in the original AIS trajectory.
| Algorithm 1 Trajectory reconstruction |
| Require:
Transition grid (), cleaned AIS trajectory, trajectory length (n), gap temporal thresholds, factor for considering historical information () Ensure: Returns gap-filled vessel trajectory ▹each point in the input trajectory is comprised of the coordinates and the timestamp for i:=2 to n do if () is in gap temporal thresholds then for to do ▹ list is comprised of cells ▹ obtain coordinates for each cell ▹ calculate the timestamp for each cell add to AIS trajectory end for end if end for |
A modified version of the A-star algorithm (A*) [57] is used to generate the possible path the vessel followed during its communication gap. Designed for obtaining the shortest path between two nodes in a directed weighted graph, the A* uses two major components: (i) the weighted graph and (ii) a heuristic function that returns an estimation of the distance required to travel from a node to another.
Beginning from the ‘start’ node, at each step of the algorithm, the neighbours of an already visited node are investigated. For each neighbour, A* combines information from both the graph and the heuristic equation, in order to update a calculated cost, in case it is part of the shortest graph. After assigning an estimated total cost to each neighbour, the current node is discarded. Then, the algorithm moves on examining the node with the smallest total cost of all previously visited nodes. The A* algorithm terminates when the ‘end’ node is reached, resulting in the shortest path in terms of the graph’s weights. For the calculation of the estimated total cost of each neighbour, the following formula is used:
where is the cumulative total cost from the start node to the current node , is the graph weight between the current node and the neighbour in question and is the result of the heuristic function that estimates the cost from the neighbor to the target node .
In our approach, we alter the A* algorithm by incorporating the knowledge extracted from the historical data within the cost functions. More precisely, a penalty function is added to the calculation of the total cost:
where:
with being the weight (distance) between the two nodes as above and being the weight-penalty based on historical data, is a factor that determines the importance of the historical information during the gap-filling, normally ranging from 0 to 1. Additionally, since both are bounded by 0 and 1 (with the exception of the penalty defined as larger than one), the function is in turn bounded by 0 and the real distance between the cells, thus providing a penalty normalized to the original graph. A high-level description of this shortest path method can also be found in Algorithm 2.
| Algorithm 2 ShortestPath |
| Require: Transition grid (), ‘start’ cell (), ‘end’ cell (), factor for considering historical information () Ensure: Return the shortest path according to weights from to ▹getTransitionWeight is a function that calculates the transition cost using historical information from the graph and the distance between the cells, taking into account the factor. h is the heuristic function, returning an estimated cost from a cell to the target while is not empty do cell in with smallest total estimated cost (pop) if then Return full path ▹ the algorithm found the shortest path end if for each neighbor () of do (cost until ) + getTransitionWeight(, , , ) if < current min. cost of then update min. cost of to if not in then total estimated cost of add to end if end if end for end while |
4.2. Vessel Detection Based on Satellite Images
Several steps are required for extracting detections of vessels from satellite imagery. In this work, we present a pipeline suitable for both optical and SAR images, as provided by the European initiative Copernicus (https://www.copernicus.eu/en, (accessed on 6 September 2023)); with data coming from Sentinel-2 and Sentinel-1, respectively [58,59].
Since optical images are very different from SAR images, different preprocessing steps for each kind of imagery are required. For SAR imagery (i.e., Sentinel-1 data), we perform corrections, such as converting SAR geometries to geo-referenced geometries using GDAL tools in Python (e.g., gdalwarp). SAR images come as single band images in three different resolutions: 10 m, 20 m and 60 m. The optical images (i.e., Sentinel-2 data) come in RGB bands together with an infrared (IR) band. We stack the RGB and the SWIR bands together and we compose a panchromatic image in the GeoTIFF format, using 16-bit encoding, and we perform pan-sharpening to increase its resolution. The panchromatic image is created by computing the average of all the 10 m resolution bands, that is, RGB and IR in order to obtain a single high-resolution image. The aim of the pan-sharpening technique is to fuse the higher spatial information from the panchromatic image and the spectral information from a lower spatial information multi-spectral image. A true color image (TCI) in 10 m is readily available in a Sentinel-2 image directory; however, we prefer to compose the panchromatic pan-sharpened image using the individual bands since the TCI image comes in 8-bit encoding, which is lossy. Maintaining a 16-bit encoding will be crucial for the filter stage which follows.
After we have preprocessed the images, we divide them into smaller tiles, with dimensions of 256 × 256 pixels, in order to be further processed more easily. Each pixel is of 10m length in each side, meaning that it covers an area of 100 m. Since we intend to use an AI-based approach for detecting vessels in satellite imagery, feeding thousands of satellite images which correspond to several Terabytes of data into the network can create a serious bottleneck; it will compromise the performance and applicability of our approach in a density maps use case, in which thousands of satellite images need to be processed. Thus, we filter out the image tiles which are redundant, meaning the ones for which we have indications that they do not contain vessels before we feed them to the neural network. For example, a Sentinel-1 tile that is totally black depicts the sea and no object appears in it. For Sentinel-1 image tiles, we use statistics and thresholding (i.e., amount of black/white pixels), while for Sentinel-2 image tiles, we use thresholds that are based on the difference of pixel values between the red band and the infrared band (R-SWIR). We also use the ACL as a mask to filter out clouds. Eventually, the filtering step results in image tiles sizing up to at least one order of magnitude less than the size of the original image.
For the vessel identification in the preprocessed satellite images, the YOLOv4 neural network architecture [60] was selected. The YOLO network is a CNN-based state-of-the-art solution that has proven to be very efficient in similar tasks of determining moving objects in images (ranging from moving cars to aircrafts) [61,62,63,64,65]. Providing high accuracy with low response time, the YOLOv4 is highly suitable for handling large volumes of data in an effective manner. In recent years, the effectiveness of the YOLOv4 version has been evaluated for detecting vessels in SAR and optical images [66,67]. We train the NN with vessels detected in satellite images, using AIS data as ground truth. Since we also want to detect the precise location of vessels, we used an object detection framework instead of a simple CNN. The object detection framework deploys a CNN per image pixel and determines the bounding box of the detected object. Our trained model is able to detect vessels with a precision of 92%, as shown in the experiment results provided in Table 1.

Table 1.
Vessel detection experiment results using 400 semi-manually labelled Sentinel-1 and Sentinel-2 satellite imagery. A total of 80% of images in the benchmark dataset were used as training set and 20% of the images were used as test set.
For each image, the output of the vessel detection includes (a) the bounding box of the detected vessel (with respect to the centre of the image), (b) the class of the detected object (e.g., vessel, tanker, etc.), and (c) a confidence value that indicates the possibility of the detected object belonging to the detected class. In a post-processing task, we retain only the detections that were classified with high-confidence (>0.6), and we geo-reference the coordinates of the detected objects by transforming them from topological coordinates, so that they can be correlated with the respective AIS coordinates. Hence, our results includes a list of detections that include the image tile that the detected object belongs to, its geo-referenced location (the geo-referenced centre of its bounding box), the acquisition time of the image. Different results were produced per vessel type detected (e.g., Tanker, Cargo and Tug for Sentinel-1 imagery).
After we detect vessels in satellite images, we correlate this dataset with the respective AIS positions. The correlation task involves the following steps:
- Spatio-temporal filtering: The temporal resolution of satellite images is significantly lower than the temporal resolution of AIS messages (i.e., the revisit time of Sentinel satellites is 2–3 days in high coverage areas, whereas vessels with AIS transponders transmit AIS messages every few seconds or minutes, depending on their navigational status and speed). In order to be able to correlate these two data sources, for every image, we extract all AIS positions that are located into the area covered by the image during a 1 hour time window, spanning 30 min before and after the image acquisition time. For the filter, we create a temporal index on the geo-dataframe where we load all AIS positions, filtering out all positions that fall out of the time window; then, we perform spatial joins that retain only the positions that are covered by the spatial extent of the image.
- Interpolation: Then, we create trajectories for each vessel contained in the dataset. For each trajectory, we retrieve the position of the vessel at the time the image was acquired by interpolating the vessel’s locations before and after the acquisition time of the image. The output of this step is a snapshot of all AIS vessel positions which spatio-temporally intersect with the image. More specifically, we produce a file for each image, storing the position of every vessel located in the spatial extent of the image footprint at the time the image was acquired.
- Fusion: The fusion task matches the interpolated AIS-positions of the previous step with the vessels detected in the image that are the output of the vessel detection step and the post-processing step. Since the AIS dataset contains an identifier for each vessel, the fusion task assigns each detection to a vessel position. We perform a kNN-join between the two datasets in the following way: For each vessel detected in a satellite image, we search for the nearest AIS neighbor (i.e., nearest interpolated position of a vessel). To achieve this, we store the interpolated positions that are the output of the previous step in a KD-Tree [68] in order to speed up the distance joins.
At the end of this process, the image vessels are annotated according to their matched AIS trajectory, hence being an additional source of vessel tracking to the original AIS datasets. Vessels detected in satellite images that do not have matching AIS messages, given a distance threshold, are considered as “dark vessels”, meaning that they are either located in a low coverage area or they have intentionally switched off their transponders. In general, a vessel can only be visible via AIS and not in a satellite image due to one of the following reasons:
- The resolution of Sentinel-1 and Sentinel-2 imagery does not allow for the detection of small vessels with high confidence. As previously mentioned, with the highest resolution provided by the satellite images, each pixel corresponds to an area of 100 m (since each pixel is of 10 m length). This means that vessels of small sizes can in some cases be ignored by the CNN.
- The AIS position of the vessel might be wrong. Since AIS is a collaborative maritime reporting system, a vessel’s crew might alter the GPS position of the vessel when transmitting the AIS messages. The phenomenon is called spoofing and has been the subject of several studies over the years [24,55,69,70].
- Interpolation error: when the AIS messages that we have around the acquisition time of an image transmitted by a vessel are not enough, and the vessel has changed its navigational status in the meantime (e.g., a vessel suddenly stops or it accelerates and changes heading), the estimated position of the vessel in the interpolation step might differ considerably from the actual position of the vessel.
5. Experimental Results and Evaluation
In this section, the experimental results of the two aforementioned techniques are presented. First, the AIS datasets used, along with the respective metrics, are described. Then, for both methods, we present and analyze the results of our experiments.
5.1. AIS Trajectory Reconstruction
5.1.1. Dataset
For the purpose of an experimental evaluation of the proposed approach, a dataset of synthetic AIS gaps was created. More precisely, focusing on the eastern part of the Mediterranean Sea, i.e., the Aegean and Levantine Sea, a sample of 3000 trajectories was provided by MarineTraffic. A cleaned dataset from the month of October (5–31 October 2021) was used as a starting point. The extracted trajectories were continuous vessel paths, with no temporal gaps larger than 15 min between consecutive messages. Additionally, in order to avoid including vessel stops at port areas, segments shorter than 30 min where the vessel remained stopped or idle were removed from the trajectories. These segments were substituted by a single transition, from the start of the stop until the end, with the corresponding time interval subtracted from the total trip duration. For each extracted trajectory, a synthetic “gap” was formed using their starting and ending points. Overall, in our evaluation we consider large temporal gaps, meaning that the synthetic gaps range from a duration of 1 h to a full day (24 h).
Additionally, we demonstrate the impact of this gap-filling technique by comparing the density maps for the original cleaned AIS and the corresponding improved dataset. For this task, we employ a dataset from the month of October originating from SAT-AIS, focusing again on the Aegean and Levantine Sea (Figure 11). During the cleaning process, a 3 min downsampling is applied to the data.
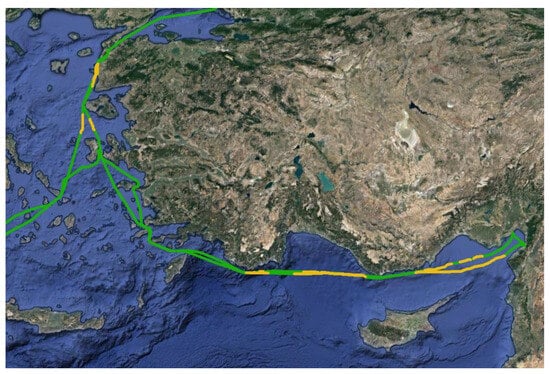
Figure 11.
Improved trajectory of a single vessel; in green—the segments from the original AIS messages, in orange—the reconstructed parts of the trajectory using the proposed method.
The AIS datasets were provided by MarineTraffic (https://www.marinetraffic.com, (accessed on 6 September 2023)). Due to the nature of the research and commercial restrictions, supporting data are not available.
5.1.2. Evaluation Metrics
For each synthetic gap, the reconstructed trajectory given by the proposed algorithm is evaluated, as compared with the vessel’s true path. Since we only consider large (temporal) gaps in this evaluation, the straight-line-interpolation is used as a baseline approach to compare it with the proposed gap-filling technique. Even though there have been a number of methods proposed for short-term forecasting (usually up to a 1 h horizon), to the best of our knowledge, there are no other works published that cover such large time intervals that can be used as baselines.
Since the resulting trajectory does not necessarily have the same number of points to the original, the FastDTW (Fast Dynamic Time Warping) [71] metric was used to determine the approach’s accuracy. The FastDTW is an efficient mechanism that creates a matching for any given two trajectories between their points, resulting to a wrapped path along with the total distance between each matched pair. In this work, the mean distance between the vessel’s true path and the reconstructed trajectory is considered. The end results are categorized according to the respective gap duration into three groups (1–3, 3–6 and 6–24 h), with the mean distance calculated for each category.
5.1.3. Results
For the purposes of a more complete study, we experimented with our approach using different historical penalty factors () and compared their accuracy. Table 2 provides the results for the proposed approach, as well as the total rate of improvement over the straight-line interpolation, calculated as follows:
where is the mean FastDTW for the straight-line interpolation and is the respective accuracy of the proposed method.

Table 2.
Table Accuracy for the straight-line interpolation, the proposed gap filling method (A* hist.) and the subsequent improvement (%). The mean distance between the reconstructed trajectories and the vessel’s true path (in km) is calculated using the FastDTW metric.
5.2. Vessel Detections Based on EO Images
In the second part of our experiments, we generated three types of density maps based on EO detections. First, we visualize the density of all vessels detected in satellite images, for both Sentinel-1 and Sentinel-2 images. Then, we visualize the density of all dark vessels detected in satellite images, i.e., vessels that were only detected in satellite images without matching AIS positions. This set of density maps will help us identify “dark” areas (e.g., grid cells) with increased traffic of “dark” vessels, which can either be areas of low AIS coverage or areas associated with illegal activities (e.g., sanctioned areas). Finally, an improved map based on both AIS and EO detection is provided.
5.2.1. Dataset
For this evaluation, we focus again on vessel activity in European waters for the month of October 2021. EO data include images from both Sentinel-1 and Sentinel-2 for the period. Regarding AIS data, we use datasets from both Terrestrial stations for the maps showcasing the detection of dark vessels. Furthermore, SAT-AIS are used, combined with EO detections, to demonstrate the effectiveness of the proposed approach. Our CNN model was trained with 2019 data and is able to distinguish vessels from clouds (in the case of Sentinel-2), waves, and land parcels. One of the advantages of the deep learning-based methods is that the model can be trained to detect vessels regardless of the background in contrast to the threshold-based methods. This is mostly highlighted in optical (Sentinel-2) images. A few examples of detections with high confidence can be observed in Figure 12.
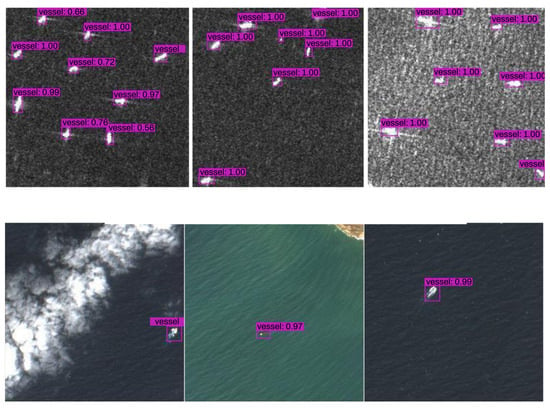
Figure 12.
Positive detections from the proposed CNN-based framework, for both SAR images from Sentinel-1 (top three) and optical images from Sentinel-2 (bottom three), from October 2021.
We acquire Sentinel-1 and Sentinel-2 data from the Copernicus open access hub using the SentinelSat Python API (https://scihub.copernicus.eu, (accessed on 6 September 2023)). We also use the Alaska Satellite Facility repositories for Sentinel-1 imagery (https://asf.alaska.edu, (accessed on 6 September 2023)) as a back-up repository. For Sentinel-1 data, we download IW GRD products coming from both S1A and S1B satellites, and for Sentinel-2 data, we download all bands available for S2A and S2B products. The AIS datasets were provided by MarineTraffic (https://www.marinetraffic.com, (accessed on 6 September 2023)); due to the nature of the research and due to commercial restrictions, supporting data are not available.
5.2.2. Results
First, following the pipeline described in the methodology chapter, we extracted detections of vessels for the European waters for the full month of October. This process was conducted for both the Sentinel-1 and Sentinel-2 datasets. Moreover, a density map was generated for each data source, based on the total number of detections located in each grid cell. For the purposes of this work, we used a grid with cells of lengths of 10 km (see Figure 13).
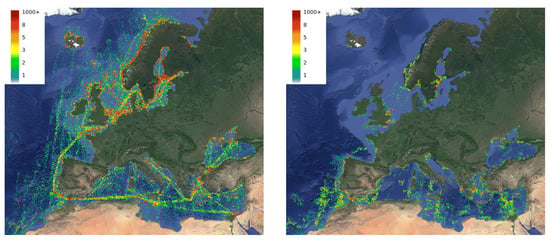
Figure 13.
Density maps based on vessel detections from EO imagery, for both Sentinel-1 (left) and Sentinel-2 (right) data, for vessels in EU waters for the month of October 2021. The grid is comprised of cells with edges of 10 km length, with the density computed as the total number of detections for each cell (according to the color caption).
Furthermore, we use the respective AIS data for that period and area to determine which of the detections cannot be matched to the existing trajectories and thus correspond to dark vessels. In an initial review of our findings, the correlation between highly congested areas and dark vessels was noted [14]. This phenomenon can be attributed to a possible high number of packet-collisions in the area [72,73], where, due to high traffic, some AIS messages are not being received. In order to counter that effect and to differentiate between low AIS coverage due to packet collision and intentional switch-off of AIS transponders, we performed an analysis described in this section, which is based on identifying areas (e.g., grid cells) where vessels are in close distance, thus increasing the risk of losing AIS packets due to congestion.
To achieve this, we applied the following formula to different snapshots of AIS data (we used the same snapshots of the respective Sentinel-1 images used to identify dark “cells”). For each grid cell, we calculated the mean nearest neighbour distance, i.e., the mean distance between a vessel and its neighbours:
with being the Distance with the Nearest Neighbour vessel and n the total number of vessels. This metric indicates that the lower the mean distance between neighboring vessels is, the higher the risk of congestion. Thus, we define the “detectability” maps as the maps that showcase congested areas that might lead to detectability issues. We constructed detectability maps for the whole area of interest; for visualization purposes, we include the respective map for the Mediterranean Sea in Figure 14.
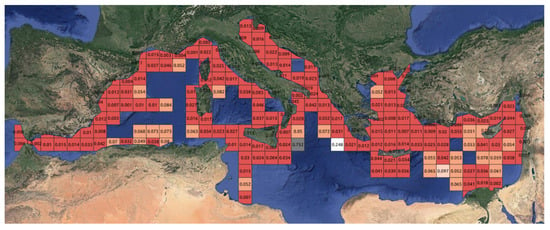
Figure 14.
Detectability map for the Mediterranean Sea area for the month of October 2021.
Using such information, a corrected density is calculated for each grid cell with the resulting density map depicted in Figure 15.
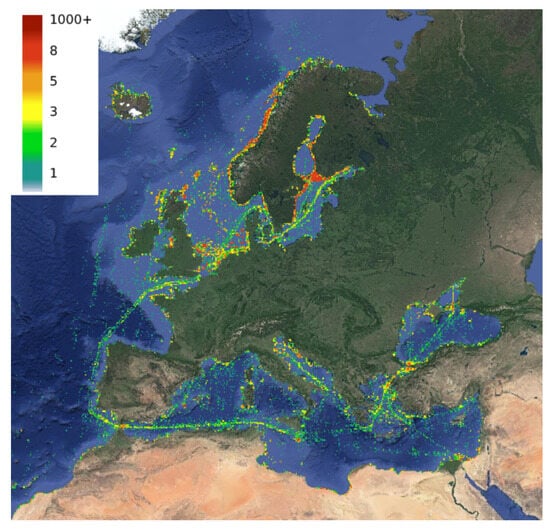
Figure 15.
Density map of dark vessels detected using imagery from Sentinel-1 correlated with SAT-AIS data, for the month of October 2021 (according to the color caption).
Finally, after producing the dark vessel density maps, we use this information to complement the Sat-AIS based density maps. Here, first we generated density maps for October 2021 using only SAT-AIS data (number of positions/cell). Then, the respective density map of dark vessels for the same period was created. We consider only the dark vessels, and not all vessels detected by satellites for duplicate elimination (so that we do not count the same vessel position twice); using this combination of data sources (SAT-AIS and Sentinel-1), we produce the combined density map, as shown in Figure 16.
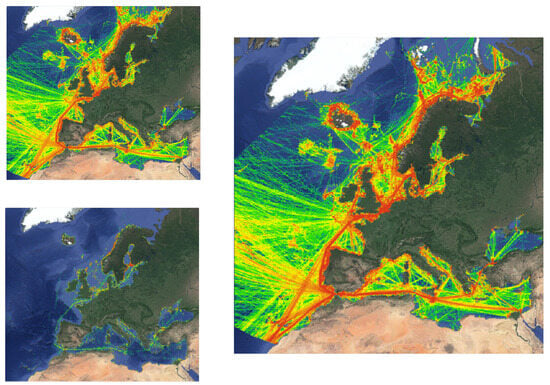
Figure 16.
Density maps for vessels in EU waters for the month of October 2021, counting number of vessels per cell of 10 km edge length, from SAT-AIS only (top left), detections from Sentinel-1 data (bottom left) and for the combined dataset (right).
6. Discussion
6.1. AIS Trajectory Reconstruction
As indicated by the results, the proposed method provides a significant improvement over the straight-line interpolation technique, especially for larger temporal gaps. More precisely, our experiments show that if the AIS gap lasts between 3 and 6 h, the proposed method provides an improvement up to 16.91% over the straight-line interpolation results, while this number goes up to 26.37% for even larger gaps (6–24 h). The inclusion of the historical information during the trajectory reconstruction is quite beneficial; a factor of 0.3 upon the respective weights results in a better accuracy. Lastly, since the incorporated graph is based solely on grid cells that include sea areas, transitions over land is avoided in most cases. This fact deems the proposed approach as more suitable for all AIS gaps over 1 h than the straight-line interpolation.
Using the proposed mechanism for improving a dataset with AIS gaps, we experimented on SAT-AIS messages from October 2021 and extracted a new set of trajectories (Figure 11). Density maps for both the original as well as the improved datasets (Figure 17) were generated using a 10 km grid cell resolution. As seen in the results, our approach creates meaningful trajectories in place of the AIS gaps. Major pathways between ports are either uncovered or enhanced in the improved dataset, while a clearer image about traffic in less traversed waters is also provided.
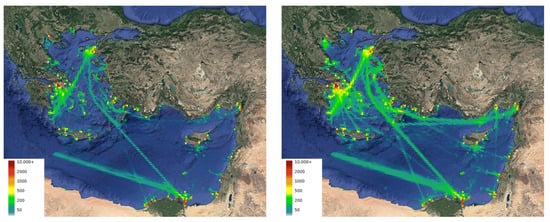
Figure 17.
Density maps for the cleaned transmitted AIS data (left) and for corresponding the improved trajectories generated using the proposed method (right). The dataset refers to SAT-AIS messages from the month of October 2021 for the Aegean and Levantine Sea, while the maps depict the total time vessels spent in each grid cell in hours), according to the color caption.
6.2. Dark Vessel Identification
We demonstrated the capabilities of detecting dark vessels, i.e., ships that do not transmit AIS positional messages, through the use of EO imagery of Europe for a full month period. Evaluating the given EO images and comparing the data from the two data sources, one can note that the cloud coverage problem is obvious in the case of Sentinel-2. Moreover, we can observe that even in Sentinel-1 there are significant gaps in coverage, especially in areas far away from the coastline. This is a known issue of both European Space Agency (ESA) and also some commercial satellites. For example, the Sentinel-1 October orbits can be observed in Figure 18, demonstrating limited coverage in the high seas. These observations highlight the need of having multiple sources of data complementing each other to achieve better situational awareness over an area of interest.
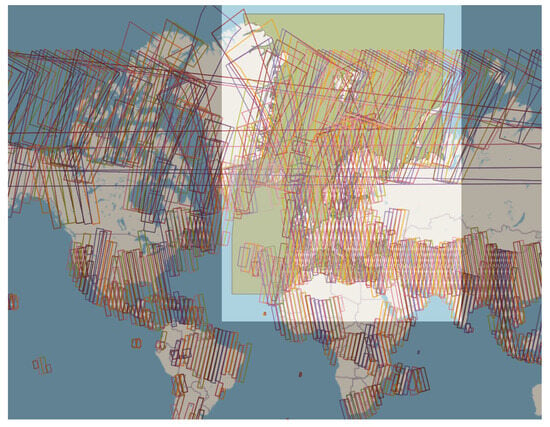
Figure 18.
Satellite coverage based on Sentinel-1 orbit for the month of October 2021, indicating limited coverage in the high seas. The yellow rectangle is the area of interest for this study.
Reasonably, the combined density map of AIS- and EO-based detections resembles the SAT-AIS density map, as the limited revisit time of Sentinel satellites compared to the AIS message frequency do not allow for significant differences to be highlighted (Figure 16). However, looking at the combined density map more carefully, we can observe that some areas that appear in orange/red appear slightly darker (e.g., Gibraltar, Norway, Iceland, English Channel, etc.). This means that areas that are known to be dense using SAT-AIS are even denser in reality. Areas that are both of high SAT-AIS density and dark vessel density are prone to packet collisions; although ESA satellites are limited by their low revisit time and coverage, they can still be used to highlight these areas, although the differences of the combined density map and the SAT-AIS density map are not significant.
7. Conclusions and Future Work
In this work, a prototype of a AIS data handling pipeline capable of producing improved density maps was presented. First, a series of filters were presented in order to clean the raw AIS messages and restrict the data to the appropriate area and timeframe of interest. Furthermore, two techniques for improving the AIS data, completing it with additional vessel positions, were described. The first is a graph-based technique for reconstructing trajectories when large temporal gaps occur in the data, while the seconds extracts vessel detections from satellite imagery. Finally, the pipeline allows for creating a spatial grid according to the user’s requirements and calculating the cumulative time the vessels spent within its cells, as well as the generation of the density map visualization of the results.
In order to reconstruct trajectories with large temporal gaps between their messages, a gap-filling mechanism was also introduced. Based on historical data, this process repurposes the A* algorithm so that patterns of movement of past trajectories are considered when discovering the path the vessel followed during the AIS gap. Experiments on real AIS data have shown that our method results in a significant improvement over the linear interpolation approach, up to 15% and 26% for temporal gaps of 3–6 and 6–24 h, respectively. This allows for the improvement of AIS datasets and consequently the creation of more accurate density visualizations. Furthermore, the multi-step process of extracting geo-referenced vessel detections from optical and SAR images relies on the combinations of detailed preprocessing, a CNN architecture and a fusion mechanism. The proposed approach allows for not only completing AIS trajectories with additional vessel positions, but also discover “dark vessels”, whose positions cannot be accounted for by the AIS. Real world data from Copernicus and AIS stations were used to demonstrate the effectiveness of this mechanism.
In the future, we intend to study the effect of limiting the historical data used during the trajectory reconstruction to the vessel type in question, for a result more suited to the occasion. Additionally, life-long learning mechanisms will be utilized so that recent activity has a larger role in the gap-filling process, by appropriately updating the penalty weights. Also, a framework will be designed to operate such reconstructions on a larger scale, combining the different techniques for even more accurate results. Finally, other sources for monitoring vessel movement not captured by AIS or satellite imagery, like cameras for smaller boats near the coast, can be easily incorporated into our framework, resulting in more accurate maps.
Author Contributions
Conceptualization, D.Z.; Methodology, A.T.-K., D.Z., K.B., M.V., G.S. and G.K.; Software, A.T.-K., D.Z., K.B., M.V., G.S. and G.K.; Writing—original draft, A.T.-K., D.Z., K.B., M.V., G.S. and G.K.; Writing—review & editing, A.T.-K., D.Z., K.B., M.V., G.S. and G.K. All authors contributed equally to this work. All authors have read and agreed to the published version of the manuscript.
Funding
This work was supported by the European Maritime and Fisheries Fund (EMFF) through service contract No. CINEA/EMFF/2020/3.1.16/Lot2/SI2.850940, and by European Union’s Horizon 2020 research and innovation program under grant agreement No. 101092749, project “Critical Action Planning over Extreme-Scale Data (CREXDATA)”.
Data Availability Statement
Third Party Data-Restrictions apply to the availability of these data. Data were obtained from MarineTraffic (marinetraffic.com, (accessed on 6 September 2023)).
Conflicts of Interest
The authors declare no conflict of interest.
Abbreviations
The following abbreviations are used in this manuscript:
| AIS | Automatic Identification System |
| TER-AIS | Terrestrial-based AIS |
| SAT-AIS | Space-based (satellite) AIS |
| TDMA | Time Division Multiple Access |
| SOTDMA | Self Organized Time Division Multiple Access |
| CSTDMA | Carrier Sense Time Division Multiple Access |
| SAR | Synthetic Aperture Radar |
| CFAR | Constant False Alarm Rate |
| SUMO | Search for Unidentified Maritime Objects |
| AI | Artificial Intelligence |
| LSTM | Long Short-Term Memory |
| NNs | Neural Networks |
| RNN | Recurrent Neural Networks |
| SoG | Vessel Speed-over-Ground |
| CoG | Vessel Course-over-Ground |
| MMSI | Maritime Mobile Service Identity |
| A* | A-star algorithm |
| FastDTW | Fast Dynamic Time Warping |
| TCI | True Color Image |
| R-SWIR | Red Band and the Infrared Band |
| ESA | European Space Agency |
| EMFF | European Maritime and Fisheries Fund |
| CREXDATA | Critical Action Planning over Extreme-Scale Data |
References
- European-Commission. A Clean Planet for all A European Strategic Long-Term Vision for a Prosperous, Modern, Competitive and Climate Neutral Economy/Communication from the Commission to the European Parliament, the European Council, the Council, the European Economic and Social Committee, the Committee of the Regions and the European Investment Bank. Technical Report. 2018. Available online: https://climatecooperation.cn/climate/a-clean-planet-for-all-a-european-long-term-strategic-vision-for-a-prosperous-modern-competitive-and-climate-neutral-economy/ (accessed on 7 September 2023).
- European-Commission. Climate Action. 2022. Available online: https://commission.europa.eu/about-european-commission/departments-and-executive-agencies/climate-action_en (accessed on 7 September 2023).
- Science-Direct. Marine Renewable Energy–An Overview|ScienceDirect Topics. 2022. Available online: https://www.sciencedirect.com/topics/engineering/marine-renewable-energy (accessed on 7 September 2023).
- Pastina, D.; Santi, F.; Pieralice, F.; Antoniou, M.; Cherniakov, M. Passive radar imaging of ship targets with GNSS signals of opportunity. IEEE Trans. Geosci. Remote Sens. 2020, 59, 2627–2642. [Google Scholar] [CrossRef]
- Wu, J.; Li, R.; Li, J.; Zou, M.; Huang, Z. Cooperative unmanned surface vehicles and unmanned aerial vehicles platform as a tool for coastal monitoring activities. Ocean. Coast. Manag. 2023, 232, 106421. [Google Scholar] [CrossRef]
- Kline, L.R.; DeAngelis, A.I.; McBride, C.; Rodgers, G.G.; Rowell, T.J.; Smith, J.; Stanley, J.A.; Read, A.D.; Van Parijs, S.M. Sleuthing with sound: Understanding vessel activity in marine protected areas using passive acoustic monitoring. Mar. Policy 2020, 120, 104138. [Google Scholar] [CrossRef]
- Alessandrini, A.; Alvarez, M.; Greidanus, H.; Gammieri, V.; Arguedas, V.F.; Mazzarella, F.; Santamaria, C.; Stasolla, M.; Tarchi, D.; Vespe, M. Mining vessel tracking data for maritime domain applications. In Proceedings of the 2016 IEEE 16th International Conference on Data Mining Workshops (ICDMW), Barcelona, Spain, 12–15 December 2016; IEEE: Piscataway, NJ, USA, 2016; pp. 361–367. [Google Scholar]
- Cheng, Y. Satellite-based AIS and its Comparison with LRIT. TransNav Int. J. Mar. Navig. Saf. Sea Transp. 2014, 8, 183–187. [Google Scholar]
- MacLeod, M.R.; Wardrop, W.M. Operational analysis at combined maritime forces. In Proceedings of the 32nd International Symposium of Military Operational Research, Egham, UK, 21–24 July 2015; p. 3. [Google Scholar]
- Forti, N.; d’Afflisio, E.; Braca, P.; Millefiori, L.M.; Willett, P.; Carniel, S. Maritime anomaly detection in a real-world scenario: Ever Given grounding in the Suez Canal. IEEE Trans. Intell. Transp. Syst. 2021, 23, 13904–13910. [Google Scholar] [CrossRef]
- Ferreira, M.D.; Campbell, J.; Purney, E.; Soares, A.; Matwin, S. Assessing compression algorithms to improve the efficiency of clustering analysis on AIS vessel trajectories. Int. J. Geogr. Inf. Sci. 2023, 37, 660–683. [Google Scholar] [CrossRef]
- Zissis, D.; Chatzikokolakis, K.; Spiliopoulos, G.; Vodas, M. A distributed spatial method for modeling maritime routes. IEEE Access 2020, 8, 47556–47568. [Google Scholar] [CrossRef]
- Troupiotis-Kapeliaris, A.; Spiliopoulos, G.; Vodas, M.; Zissis, D. Navigating through dense waters: A toolbox for creating maritime density maps. In Proceedings of the 12th Hellenic Conference on Artificial Intelligence, Corfu, Greece, 7–9 September 2022; pp. 1–4. [Google Scholar]
- Bereta, K.; Karantaidis, I.; Zissis, D. Vessel Traffic Density Maps Based on Vessel Detection in Satellite Imagery. In Proceedings of the IGARSS 2022-2022 IEEE International Geoscience and Remote Sensing Symposium, Kuala Lumpur, Malaysia, 17–22 July 2022; pp. 2845–2847. [Google Scholar] [CrossRef]
- Kontopoulos, I.; Varlamis, I.; Tserpes, K. A distributed framework for extracting maritime traffic patterns. Int. J. Geogr. Inf. Sci. 2021, 35, 767–792. [Google Scholar] [CrossRef]
- Zissis, D.; Xidias, E.K.; Lekkas, D. A cloud based architecture capable of perceiving and predicting multiple vessel behaviour. Appl. Soft Comput. 2015, 35, 652–661. [Google Scholar] [CrossRef]
- Hasbi, W.; Mukhayadi, M.; Renner, U. The impact of space-based AIS antenna orientation on in-orbit AIS detection performance. Appl. Sci. 2019, 9, 3319. [Google Scholar] [CrossRef]
- Krishna, A.; Nimbal, A.; Makam, A.; Sambasiva Rao, V. Implementation of fast independent component analysis on field-programmable gate array for resolving the slot collision issue in the space-based automatic identification system. Int. J. Satell. Commun. Netw. 2020, 38, 480–498. [Google Scholar] [CrossRef]
- McFadden, D.; Lennon, R.; O’Raw, J. AIS Transmission Data Quality: Identification of Attack Vectors. In Proceedings of the 2019 International Symposium ELMAR, Zadar, Croatia, 23–25 September 2019; IEEE: Piscataway, NJ, USA, 2019; pp. 187–190. [Google Scholar]
- Li, S.; Liang, M.; Wu, X.; Liu, Z.; Liu, R.W. AIS-based vessel trajectory reconstruction with U-Net convolutional networks. In Proceedings of the 2020 IEEE 5th International Conference on Cloud Computing and Big Data Analytics (ICCCBDA), Chengdu, China, 10–13 April 2020; IEEE: Piscataway, NJ, USA, 2020; pp. 157–161. [Google Scholar]
- Iphar, C.; Napoli, A.; Ray, C. Detection of false AIS messages for the improvement of maritime situational awareness. In Proceedings of the Oceans 2015-MTS/IEEE Washington, Washington, DC, USA, 19–22 October 2015; IEEE: Piscataway, NJ, USA, 2015; pp. 1–7. [Google Scholar]
- Fu, X.; Xiao, Z.; Xu, H.; Jayaraman, V.; Othman, N.B.; Chua, C.P.; Lind, M. AIS data analytics for intelligent maritime surveillance systems. In Maritime Informatics; Springer: Berlin/Heidelberg, Germany, 2020; pp. 393–411. [Google Scholar]
- Natale, F.; Gibin, M.; Alessandrini, A.; Vespe, M.; Paulrud, A. Mapping Fishing Effort through AIS Data. PLoS ONE 2015, 10, e0130746. [Google Scholar] [CrossRef] [PubMed]
- Katsilieris, F.; Braca, P.; Coraluppi, S. Detection of malicious AIS position spoofing by exploiting radar information. In Proceedings of the 16th International Conference on Information Fusion, Istanbul, Turkey, 9–12 July 2013; IEEE: Piscataway, NJ, USA, 2013; pp. 1196–1203. [Google Scholar]
- Wawrzaszek, R.; Waraksa, M.; Kalarus, M.; Juchnikowski, G.; Górski, T. Detection and decoding of AIS navigation messages by a low earth orbit satellite. In Aerospace Robotics III; Springer: Berlin/Heidelberg, Germany, 2019; pp. 45–62. [Google Scholar]
- Technical Note 4.1 Vessel Density Mapping. Preparatory Action for Assessment of the Capacity of Spaceborne Automatic Identification System Receivers to Support EU Maritime Policy. DG MARE Service Contract: No MARE/2008/06/SI2.517298. Technical Report. 2010. Available online: https://maritime-forum.ec.europa.eu/system/files/6039_PASTA%20MARE_LXS_FR-002_Final%20Report_Issue3.pdf (accessed on 15 May 2022).
- Last, P.; Hering-Bertram, M.; Linsen, L. How automatic identification system (AIS) antenna setup affects AIS signal quality. Ocean. Eng. 2015, 100, 83–89. [Google Scholar] [CrossRef]
- Last, P.; Bahlke, C.; Hering-Bertram, M.; Linsen, L. Comprehensive analysis of automatic identification system (AIS) data in regard to vessel movement prediction. J. Navig. 2014, 67, 791–809. [Google Scholar] [CrossRef]
- Redoutey, M.; Scotti, E.; Jensen, C.; Ray, C.; Claramunt, C. Efficient vessel tracking with accuracy guarantees. In Proceedings of the Web and Wireless Geographical Information Systems: 8th International Symposium, W2GIS 2008, Shanghai, China, 11–12 December 2008; Proceedings 8. Springer: Berlin/Heidelberg, Germany, 2008; pp. 140–151. [Google Scholar]
- Liang, M.; Liu, R.W.; Zhong, Q.; Liu, J.; Zhang, J. Neural network-based automatic reconstruction of missing vessel trajectory data. In Proceedings of the 2019 IEEE 4th International Conference on Big Data Analytics (ICBDA), Suzhou, China, 15–18 March 2019; IEEE: Piscataway, NJ, USA, 2019; pp. 426–430. [Google Scholar]
- Falco, L.; Pittito, A.; Adnams, W.; Earwaker, N.; Greidanus, H. EU Vessel Density Map-Detailed Method. Technical Report. 2019. Available online: https://www.emodnet-humanactivities.eu/documents/Vessel%20density%20maps_method_v1.5.pdf (accessed on 7 September 2023).
- Wang, C.; Wang, X.; Zhu, J.; Wang, G. A survey of radar and AIS information fusion. Command Control Simul. 2009, 31, 1–4. [Google Scholar]
- Mosskull, H. Performance and robustness evaluation of dc-link stabilization. Control Eng. Pract. 2015, 44, 104–116. [Google Scholar] [CrossRef]
- Jie, X.; Chaozhong, W.; Zhijun, C.; Xiaoxuan, C. A novel estimation algorithm for interpolating ship motion. In Proceedings of the 2017 4th International Conference on Transportation Information and Safety (ICTIS), Banff, AB, Canada, 8–10 August 2017; IEEE: Piscataway, NJ, USA, 2017; pp. 557–562. [Google Scholar]
- Brandoli, B.; Raffaetà, A.; Simeoni, M.; Adibi, P.; Bappee, F.K.; Pranovi, F.; Rovinelli, G.; Russo, E.; Silvestri, C.; Soares, A.; et al. From multiple aspect trajectories to predictive analysis: A case study on fishing vessels in the Northern Adriatic sea. GeoInformatica 2022, 26, 551–579. [Google Scholar] [CrossRef]
- Kolendo, P.; Śmierzchalski, R. Experimental comparison of straight lines and polynomial interpolation modeling methods in ship evolutionary trajectory planning problem. In Advanced and Intelligent Computations in Diagnosis and Control; Springer: Berlin/Heidelberg, Germany, 2016; pp. 331–340. [Google Scholar]
- Zhang, L.; Meng, Q.; Xiao, Z.; Fu, X. A novel ship trajectory reconstruction approach using AIS data. Ocean. Eng. 2018, 159, 165–174. [Google Scholar] [CrossRef]
- Guo, S.; Mou, J.; Chen, L.; Chen, P. Improved kinematic interpolation for AIS trajectory reconstruction. Ocean. Eng. 2021, 234, 109256. [Google Scholar] [CrossRef]
- Barua, L.; Zou, B.; Zhou, Y. Machine learning for international freight transportation management: A comprehensive review. Res. Transp. Bus. Manag. 2020, 34, 100453. [Google Scholar] [CrossRef]
- Chondrodima, E.; Pelekis, N.; Pikrakis, A.; Theodoridis, Y. An Efficient LSTM Neural Network-Based Framework for Vessel Location Forecasting. IEEE Trans. Intell. Transp. Syst. 2023, 24, 4872–4888. [Google Scholar] [CrossRef]
- Zhong, C.; Jiang, Z.; Chu, X.; Liu, L. Inland ship trajectory restoration by recurrent neural network. J. Navig. 2019, 72, 1359–1377. [Google Scholar] [CrossRef]
- Capobianco, S.; Millefiori, L.M.; Forti, N.; Braca, P.; Willett, P. Deep learning methods for vessel trajectory prediction based on recurrent neural networks. IEEE Trans. Aerosp. Electron. Syst. 2021, 57, 4329–4346. [Google Scholar] [CrossRef]
- Kanjir, U.; Greidanus, H.; Oštir, K. Vessel detection and classification from spaceborne optical images: A literature survey. Remote Sens. Environ. 2018, 207, 1–26. [Google Scholar] [CrossRef]
- Wang, L.; Fan, S.; Liu, Y.; Li, Y.; Fei, C.; Liu, J.; Liu, B.; Dong, Y.; Liu, Z.; Zhao, X. A review of methods for ship detection with electro-optical images in marine environments. J. Mar. Sci. Eng. 2021, 9, 1408. [Google Scholar] [CrossRef]
- Amabdiyil, S.; Thomas, D.; Pillai, V. Marine vessel detection comparing GPRS and satellite images for security applications. In Proceedings of the 2016 International Conference on Wireless Communications, Signal Processing and Networking (WiSPNET), Chennai, India, 23–25 March 2016; pp. 1082–1086. [Google Scholar] [CrossRef]
- Gao, G.; Liu, L.; Zhao, L.; Shi, G.; Kuang, G. An adaptive and fast CFAR algorithm based on automatic censoring for target detection in high-resolution SAR images. IEEE Trans. Geosci. Remote Sens. 2008, 47, 1685–1697. [Google Scholar] [CrossRef]
- Zhang, Y.; Hao, Y. A Survey of SAR Image Target Detection Based on Convolutional Neural Networks. Remote Sens. 2022, 14, 6240. [Google Scholar] [CrossRef]
- Greidanus, H.; Alvarez, M.; Santamaria, C.; Thoorens, F.X.; Kourti, N.; Argentieri, P. The SUMO Ship Detector Algorithm for Satellite Radar Images. Remote Sens. 2017, 9, 246. [Google Scholar] [CrossRef]
- Corbane, C.; Najman, L.; Pecoul, E.; Demagistri, L.; Petit, M. A complete processing chain for ship detection using optical satellite imagery. Int. J. Remote Sens. 2010, 31, 5837–5854. [Google Scholar] [CrossRef]
- Bereta, K.; Grasso, R.; Zissis, D. Vessel detection using image processing and neural networks. In Proceedings of the IGARSS 2020-2020 IEEE International Geoscience and Remote Sensing Symposium, Waikoloa, HI, USA, 26 September–2 October 2020; IEEE: Piscataway, NJ, USA, 2020; pp. 2276–2279. [Google Scholar]
- Aiello, M.; Vezzoli, R.; Gianinetto, M. Object-based image analysis approach for vessel detection on optical and radar images. J. Appl. Remote Sens. 2019, 13, 014502. [Google Scholar] [CrossRef]
- Hey, A.; Bill, R. Placing dots in dot maps. Int. J. Geogr. Inf. Sci. 2014, 28, 2417–2434. [Google Scholar] [CrossRef]
- Ahas, R.; Aasa, A.; Yuan, Y.; Raubal, M.; Smoreda, Z.; Liu, Y.; Ziemlicki, C.; Tiru, M.; Zook, M. Everyday space–time geographies: Using mobile phone-based sensor data to monitor urban activity in Harbin, Paris, and Tallinn. Int. J. Geogr. Inf. Sci. 2015, 29, 2017–2039. [Google Scholar] [CrossRef]
- d’Afflisio, E.; Braca, P.; Willett, P. Malicious AIS spoofing and abnormal stealth deviations: A comprehensive statistical framework for maritime anomaly detection. IEEE Trans. Aerosp. Electron. Syst. 2021, 57, 2093–2108. [Google Scholar] [CrossRef]
- Androjna, A.; Perkovič, M.; Pavic, I.; Mišković, J. AIS data vulnerability indicated by a spoofing case-study. Appl. Sci. 2021, 11, 5015. [Google Scholar] [CrossRef]
- EPSG. EPSG KT ETRS89-Extended/LAEA Europe-EPSG:3035. 2023. Available online: https://www.klokantech.com/ (accessed on 7 September 2023).
- Hart, P.; Nilsson, N.; Raphael, B. Systems Science and Cybernetics. IEEE Trans. 1968, 4, 100. [Google Scholar]
- Geudtner, D.; Torres, R.; Snoeij, P.; Davidson, M.; Rommen, B. Sentinel-1 system capabilities and applications. In Proceedings of the 2014 IEEE Geoscience and Remote Sensing Symposium, Quebec City, QC, Canada, 13–18 July 2014; IEEE: Piscataway, NJ, USA, 2014; pp. 1457–1460. [Google Scholar]
- Gascon, F.; Cadau, E.; Colin, O.; Hoersch, B.; Isola, C.; Fernández, B.L.; Martimort, P. Copernicus Sentinel-2 mission: Products, algorithms and Cal/Val. In Proceedings of the Earth Observing Systems XIX, San Diego, CA, USA, 17–21 August 2014; SPIE: Bellingham, WA, USA, 2014; Volume 9218, pp. 455–463. [Google Scholar]
- Bochkovskiy, A.; Wang, C.Y.; Liao, H.Y.M. Yolov4: Optimal speed and accuracy of object detection. arXiv 2020, arXiv:2004.10934. [Google Scholar]
- Wang, R.; Wang, Z.; Xu, Z.; Wang, C.; Li, Q.; Zhang, Y.; Li, H. A real-time object detector for autonomous vehicles based on YOLOv4. Comput. Intell. Neurosci. 2021, 2021. [Google Scholar] [CrossRef]
- Sindhu, V.S. Vehicle identification from traffic video surveillance using YOLOv4. In Proceedings of the 2021 5th International Conference on Intelligent Computing and Control Systems (ICICCS), Madurai, India, 6–8 May 2021; IEEE: Piscataway, NJ, USA, 2021; pp. 1768–1775. [Google Scholar]
- Zhao, J.; Hao, S.; Dai, C.; Zhang, H.; Zhao, L.; Ji, Z.; Ganchev, I. Improved vision-based vehicle detection and classification by optimized YOLOv4. IEEE Access 2022, 10, 8590–8603. [Google Scholar] [CrossRef]
- Humayun, M.; Ashfaq, F.; Jhanjhi, N.Z.; Alsadun, M.K. Traffic management: Multi-scale vehicle detection in varying weather conditions using yolov4 and spatial pyramid pooling network. Electronics 2022, 11, 2748. [Google Scholar] [CrossRef]
- Xi, X.; Wu, Y.; Xia, C.; He, S. Feature fusion for object detection at one map. Image Vis. Comput. 2022, 123, 104466. [Google Scholar] [CrossRef]
- Jiang, J.; Fu, X.; Qin, R.; Wang, X.; Ma, Z. High-speed lightweight ship detection algorithm based on YOLO-v4 for three-channels RGB SAR image. Remote Sens. 2021, 13, 1909. [Google Scholar] [CrossRef]
- Yildirim, E.; Kavzoglu, T. Ship detection in optical remote sensing images using YOLOv4 and Tiny YOLOv4. In Proceedings of the International Conference on Smart City Applications, Safranbolu, Turkey, 27–29 November 2021; Springer: Berlin/Heidelberg, Germany, 2021; pp. 913–924. [Google Scholar]
- Bentley, J.L. Multidimensional Binary Search Trees Used for Associative Searching. Commun. ACM 1975, 18, 509–517. [Google Scholar] [CrossRef]
- Ray, C.; Gallen, R.; Iphar, C.; Napoli, A.; Bouju, A. DeAIS project: Detection of AIS spoofing and resulting risks. In Proceedings of the OCEANS 2015-Genova, Genova, Italy, 18–21 May 2015; IEEE: Piscataway, NJ, USA, 2015; pp. 1–6. [Google Scholar]
- Kontopoulos, I.; Spiliopoulos, G.; Zissis, D.; Chatzikokolakis, K.; Artikis, A. Countering real-time stream poisoning: An architecture for detecting vessel spoofing in streams of AIS data. In Proceedings of the 2018 IEEE 16th Intl Conf on Dependable, Autonomic and Secure Computing, 16th Intl Conf on Pervasive Intelligence and Computing, 4th Intl Conf on Big Data Intelligence and Computing and Cyber Science and Technology Congress (DASC/PiCom/DataCom/CyberSciTech), Athens, Greece, 12–15 August 2018; IEEE: Piscataway, NJ, USA, 2018; pp. 981–986. [Google Scholar]
- Salvador, S.; Chan, P. Toward accurate dynamic time warping in linear time and space. Intell. Data Anal. 2007, 11, 561–580. [Google Scholar] [CrossRef]
- Carson-Jackson, J. Satellite AIS–developing technology or existing capability? J. Navig. 2012, 65, 303–321. [Google Scholar] [CrossRef]
- Clazzer, F.; Munari, A.; Berioli, M.; Blasco, F.L. On the characterization of AIS traffic at the satellite. In Proceedings of the OCEANS 2014-TAIPEI, Taipei, Taiwan, 7–10 April 2014; pp. 1–9. [Google Scholar] [CrossRef]
Disclaimer/Publisher’s Note: The statements, opinions and data contained in all publications are solely those of the individual author(s) and contributor(s) and not of MDPI and/or the editor(s). MDPI and/or the editor(s) disclaim responsibility for any injury to people or property resulting from any ideas, methods, instructions or products referred to in the content. |
© 2023 by the authors. Licensee MDPI, Basel, Switzerland. This article is an open access article distributed under the terms and conditions of the Creative Commons Attribution (CC BY) license (https://creativecommons.org/licenses/by/4.0/).