In this section, we evaluate our proposed SID-TGAN model for speckle denoising through extensive experiments. We first introduce our experimental setup in
Section 4.1. Then, the evaluation metrics for the quality of speckle denoising with and without reference images are introduced in
Section 4.2. Next, the performance of SID-TGAN compared to the state-of-the-art denoising methods is presented in
Section 4.3. Finally, we conduct ablation studies on SID-TGAN in
Section 4.4.
4.1. Experimental Setup
Dataset. A clean sonar image
X and a noisy sonar image
Y should be input into SID-TGAN to train a speckle denoising model. However, clean sonar images are often not available in practice, whereas obtaining clean optical images is much easier. Thus, we adopted a transfer learning approach that first trains SID-TGAN on paired optical images and then tested it on sonar images. We utilized one optical image dataset and four sonar image datasets. For the optical image dataset, we randomly selected 5500 images of various categories from the ImageNet dataset [
31]. Each optical color image was transformed into its corresponding grayscale image to serve as a reference image. Subsequently, we introduced synthetic speckle noise by applying additive noise following a Rayleigh distribution with a mean of 0 and a variance of 1, as well as Gaussian additive noise, to the reference images using Equation (
6). This allowed us to create the corresponding synthetic speckle noisy images:
where
represents the Rayleigh-distributed noise with parameter
denoting its variance and
signifies additive Gaussian noise.
For sonar image datasets, the first two are derived from ocean debris data captured by the ARIS Explorer 3000 [
32] forward-looking sonar (FLS), the third is a publicly available side-scan sonar (SSS) image dataset from the 2021 CURPC Competition (
https://www.curpc.com.cn, accessed on 21 October 2023), and the fourth is obtained from the SASSED Synthetic Aperture Sonar (SAS) dataset (
https://github.com/isaacgerg/synthetic_aperture_sonar_autofocus, accessed on 21 October 2023). Detailed information on the five datasets is provided in
Table 1. In the speckle removal task, we randomly selected 4500 optical images as the training set. For the test sets, we chose 500 optical images, 500 forward-looking sonar images, 500 side-scan sonar images, and 100 synthetic aperture sonar images. To further assess the speckle removal performance of different methods, we employed 1457 noisy (or denoised) forward-looking sonar images for training and 111 noisy (or denoised) forward-looking sonar images for testing in the context of target detection. Due to the lack of ground truth, we did not test the side-scan and synthetic aperture sonar images in the target detection task.
Methods and Implementation. The following despeckling methods are compared in our experiments.
We implemented all models in Python 3 with PyTorch. For a fair comparison, we trained all baseline models in the same configuration, using the source code released by their authors. The hyper-parameters we used include (1) the initial learning rate , (2) the batch size 4, (3) the number of pre-train epochs from 1 to 150, and (4) the weights of loss functions and . In addition, Adam was used as the default optimizer. Data augmentation was performed by flipping horizontally and vertically at random.
All experiments were carried out on a desktop with an Intel® Core™ i5-9600KF CPU @ 3.70 GHz, 16 GB DDR4 RAM, and a Nvidia® GeForce® RTX™ 3090SUPER GPU with 24 GB GDDR6 RAM.
4.2. Evaluation Criteria
Metrics for Despeckling Quality with Reference Images. When clean reference images and noisy images are both available and have been paired, we use the Peak Signal-to-Noise Ratio (PSNR), Structural Similarity Index Measure (SSIM), and Coincidence degree of the Gray Histogram (GHC) to evaluate the despeckling performance of different methods.
PSNR is an engineering term that represents the ratio of the maximum possible power of a signal to the destructive noise power that affects its representation accuracy. A higher PSNR value represents that the despeckled image is closer to the clean image, thus implying better quality. The calculation of PSNR is presented in Equation (
7):
where
is the mean square error between the clean image
X and the despeckled image
, and
n is the width of the image
X.
SSIM measures the structural similarity between the clean images
X and the despeckled image
. Unlike PSNR, SSIM considers not only the brightness information but also the contrast and structural information of the image, thus having higher accuracy and reliability in evaluating image quality. A larger SSIM value implies a higher similarity between two images. The calculation of SSIM is shown in Equation (
8):
and
where
,
, and
measure the brightness, contrast, and structure of
X and
, respectively;
,
, and
are the weights to adjust the relative importance of
,
, and
;
and
, and
and
are the mean and standard deviations of
X and
, respectively;
is the covariance of
X and
; and
,
, and
are all constants to maintain the stability of
,
, and
.
GHC calculates the coincidence rate of the gray pixel value distribution of two images. When the gray distribution of the two images completely overlaps, the value of GHC is 1. Equation (
12) presents how GHC is computed:
where
and
represent the grayscale pixel distribution of the despeckled image
and the reference image
X, and
n is the range of the pixel values.
Metrics for Despeckling Quality without Reference. When reference images were not available, we used the Equivalent Number of Looks (ENL), Speckle Suppression Index (SSI), and Speckle suppression and Mean Preservation Index (SMPI) as metrics for the quality of the despeckling.
ENL measures the smoothness of a uniform area and reflects the ability to remove speckle noise. A higher ENL value represents a higher smoothing efficiency of the speckle noise in homogeneous areas. The calculation of ENL is presented in Equation (
13):
where
is the mean value of the image, and
is the standard deviation of the image. Generally speaking, the mean of an image represents its information, while its standard deviation represents its noise severity.
SSI evaluates the speckle noise suppression effect of the denoising model by comparing the mean and standard deviation of pixel values between the noisy image
Y and the denoised image
. The smaller the SSI value, the better the speckle denoising performance. SSI is defined in Equation (
14):
Compared with ENL and SSI, SMPI considers the difference in the mean value between the despeckled image
and the noisy image
Y. When the mean value of the despeckled image deviates too much from the noisy image, the reliability of the SMPI value is higher than that of ENL and SSI. A lower SMPI value indicates better model performance in terms of mean preservation and noise reduction. SMPI is defined in Equation (
15):
Metrics for Accuracy of Target Detection. In addition, we further evaluate the accuracy of target detection on despeckled image output by different methods using three metrics, named mAP, mAP@50, and mAP@75. mAP is the mean of average precision (AP) of detecting all target categories. AP is expressed as the area under the PR (precision and recall) curve from Equation (
16):
where
P represents the proportion of correctly predicted positive samples among all the predicted positive samples, and
R represents the proportion of correctly predicted positive samples among all the correctly predicted samples. A higher mAP value represents a higher despeckling quality. mAP50 is the mean of average precision calculated at the IoU (Intersection over Union) threshold value of 0.5. mAP75 is the mean of average precision calculated at the IoU threshold value of 0.75. The mean of the average precision calculated at the IoU thresholds from 0.5 to 0.95 with an interval of 0.05 is called mAP.
4.3. Performance Evaluation
Despeckling Quality for Optical Images with Reference Images. We compare SID-TGAN with five baselines for their performance on the Optical-Despeckling dataset. The despeckling performance of the six methods is shown in
Table 2.
From
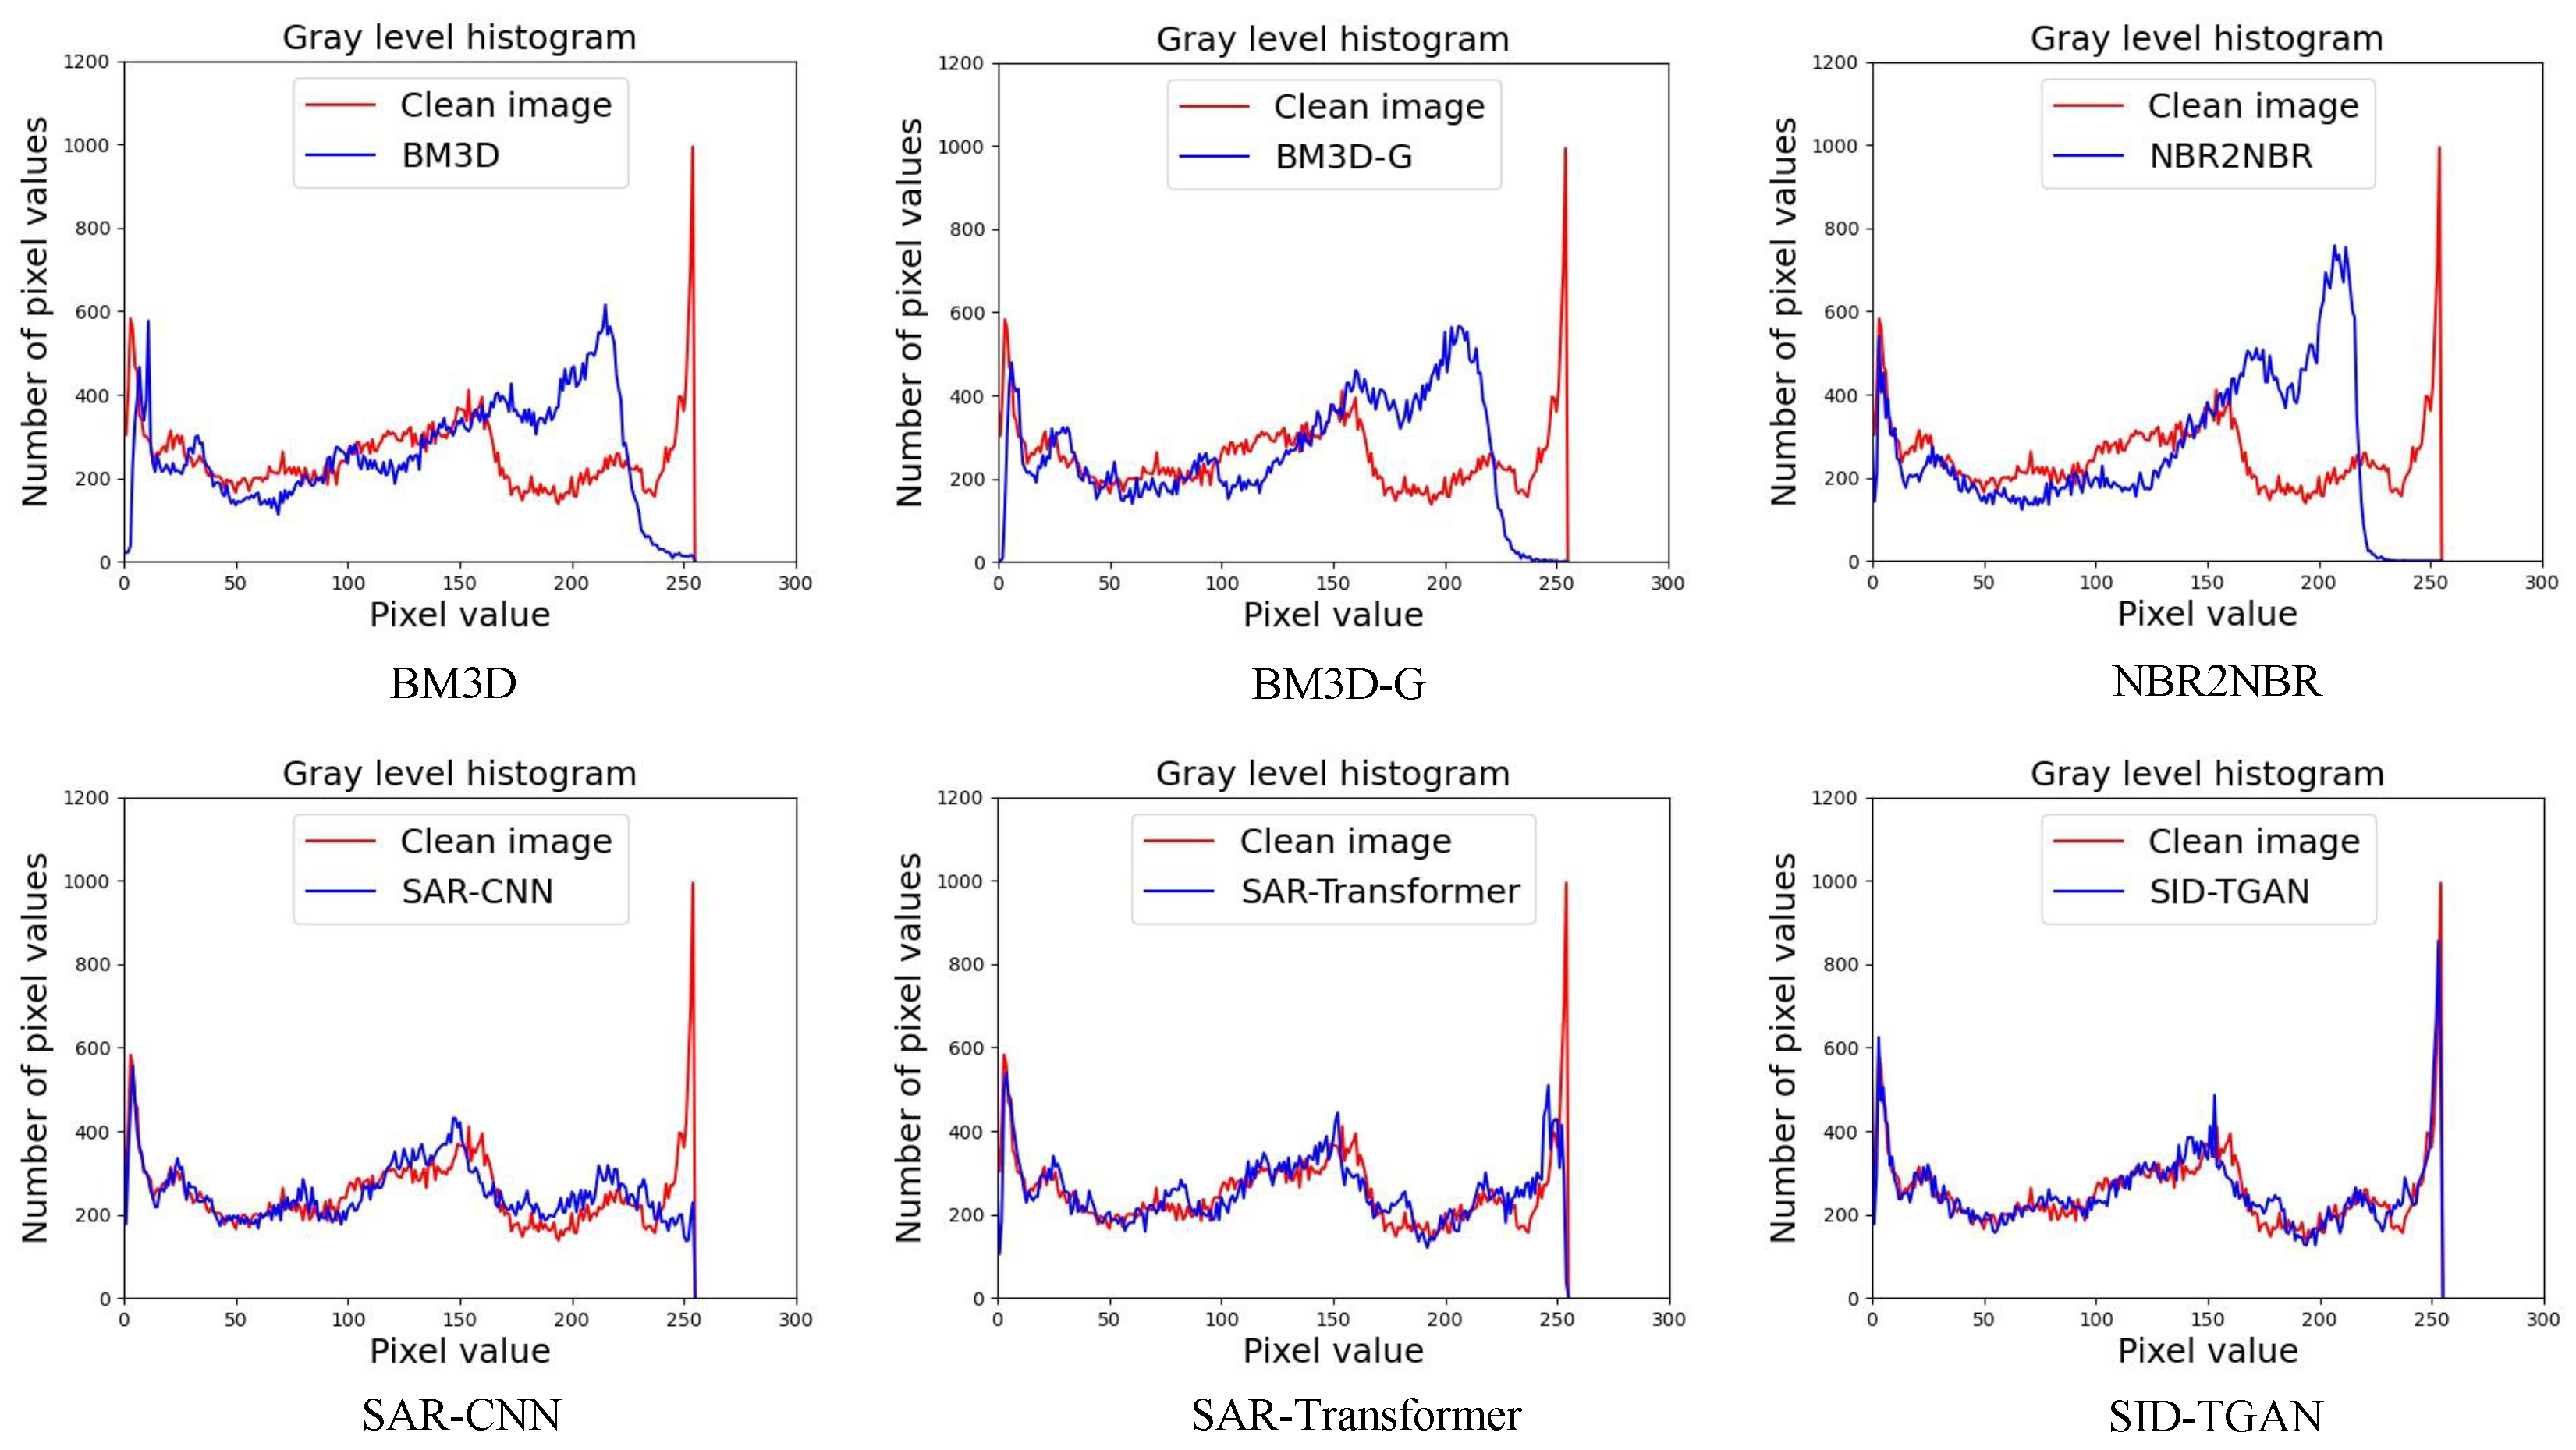
Table 2, we observe that SID-TGAN achieves the best despeckling performance in all metrics on optical images. SID-TGAN improves on the existing methods in terms of PSNR, SSIM, and GHC by at least 0.326, 0.020, and 0.013, and at most 6.788, 0.196, and 0.244. SAR-Transformer and SID-TGAN outperform the other four baselines in the PSNR metric, indicating that transformer blocks better capture the global dependencies between different image regions, mitigate the shortcomings of CNNs, and improve the despeckling performance. Unlike SAR-Transformer, SID-TGAN adopts the architecture of GAN and the adversarial loss to generate higher-quality images. Both SID-TGAN and SAR-CNN use discriminative model learning for image despeckling. They achieve the best and second-best GHC values, indicating that the discriminative model drives the local texture and style toward consistency in an adversarial fashion. In addition, we also provide a comparison of the coincidence of the grayscale histogram between the despeckled image returned by each method and the clean image in
Figure 4. We can see that the grayscale histogram of the despeckled image returned by SID-TGAN highly overlaps with the grayscale histogram of the clean image. The despeckling performance of SID-TGAN significantly outperforms all other baselines in all evaluation metrics.
We further visualize the despeckled optical images returned by different methods in
Figure 5. The despeckled images generated by SID-TGAN are also closer to clean images from a sensory perspective.
Despeckling Quality for Sonar Images without References. We compare SID-TGAN with five baseline methods on the despeckling performance in the forward-looking sonar (FLS), side-scan sonar (SSS), and synthetic aperture sonar (SAS) image datasets. For each input sonar image with a size of
, we adopt six different methods to generate the despeckled images. Then, a homogeneous area with a size of
and the smallest variance from the noisy sonar image is selected as a homogeneous image patch. The same homogeneous area from six different despeckled images is selected to evaluate the despeckling performance for each method in terms of three quality metrics (i.e., ENL, SSI, and SMPI). The results are shown in
Table 3,
Table 4 and
Table 5. We also compute the mean standard deviation (MSD) of the homogeneous area from each selected despeckled image patch in
Table 3,
Table 4 and
Table 5.
Based on the denoising results of each method on the FLS images, as shown in
Table 3, SID-TGAN and SAR-Transformer achieve the best and second-best results on the ENL, SSI, and MSD values, once again showing that transformer-based despeckling methods are superior to CNN-based methods. The transformer and CNN blocks of SID-TGAN capture the global and local dependencies between pixels, respectively. Thus, it generates fine despeckled images of the highest quality using the proposed loss function. SID-TGAN is superior to the second-best result by a large margin, with increases of 29% and 34% in terms of SSI and MSD. SID-TGAN is slightly inferior to BM3D in terms of SMPI since SMPI is highly correlated with the size of the selected homogeneous area.
As depicted in
Table 4, SID-TGAN demonstrates outstanding speckle suppression performance on SSS images. Its performance notably surpasses that of other comparative methods. Across all four evaluation metrics, SID-TGAN achieves the best results and, compared to the second-best method, shows performance improvements of 17%, 21%, and 13% in terms of SSI, SMPI, and MSD, respectively. These results underscore the exceptional applicability of SID-TGAN in the context of speckle reduction for SSS images.
Upon scrutinizing the results in
Table 5, we find that SID-TGAN demonstrates commendable denoising capabilities on SAS images as well. Notably, our chosen SAS dataset predominantly exhibits images with lower overall brightness. BM3D-G [
18] involves gamma correction, a preprocessing step that adjusts the brightness and contrast of input images. This adjustment has a substantial influence on the calculation of the ENL value in the evaluation, which ultimately results in considerably higher ENL values for the output images produced by BM3D-G that surpass those of any other method. We also note that the noise distribution in SAS images differs markedly from those of FLS and SSS images. However, the training set employed in the experiment is tailored to simulate the speckle noise distribution from FLS and SSS images by generating synthetically matched pairs from optical grayscale images. Consequently, the model parameters are not ideally suited for SAS images, which leads to the degraded performance of SID-TGAN. In contrast, BM3D [
4] does not depend on the types of noise distribution and outperforms SID-TGAN. Nevertheless, we observe that SID-TGAN still performs much better than other deep learning-based methods on SAS images.
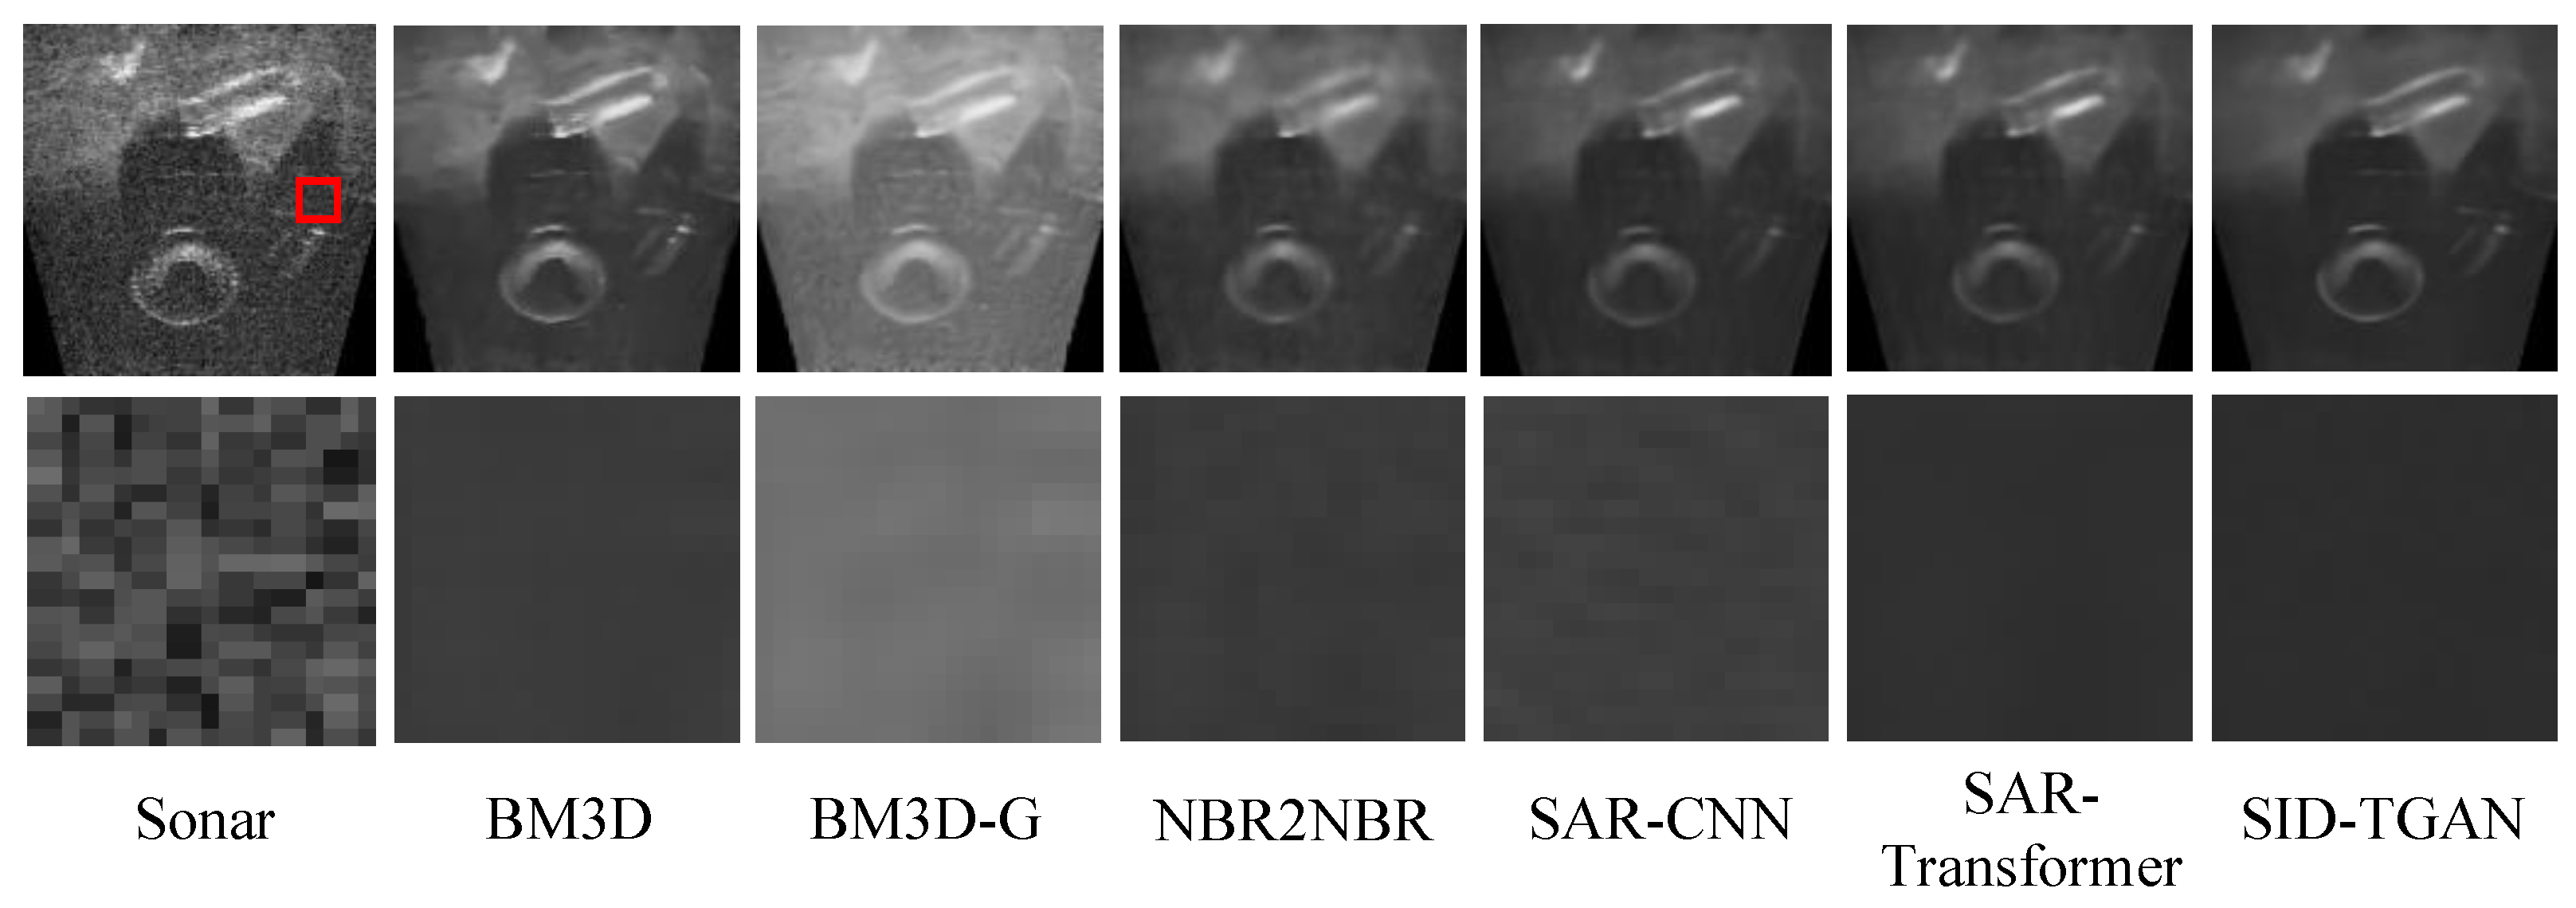
We present the visualizations of the despeckled sonar images returned by different methods in
Figure 6. The first row depicts the despeckled sonar image of size
, while the second row portrays the despeckled homogeneous area image patch, sized
extracted from the red box in the first row of
Figure 6. In summary, SID-TGAN outperforms all other methods in terms of quantitative and sensory analysis on forward-looking sonar images.
Accuracy for Target Detection on Despeckled Sonar Images. We compare the accuracy of target detection using Faster-RCNN [
33] on noisy and despeckled sonar images to evaluate the improvements of different despeckling methods in image quality. The results for target detection on the sonar-detection dataset are shown in
Table 6. Undoubtedly, despeckled sonar images provided by SID-TGAN and SAR-Transformer [
24] exhibit superior image quality. Compared to noisy sonar images, despeckled sonar images provided by SID-TGAN show a remarkable improvement in all three accuracy metrics for target detection, i.e., mAP, mAP@50, and mAP@75 by 4.5%, 1.7%, and 8.4%, respectively. It is surprising that the mAP, mAP@50, and mAP@75 of the despeckled sonar images returned by NBR2NBR [
13] and SAR-CNN [
10] are even lower than those of noisy sonar images. This implies that NBR2NBR [
13] and SAR-CNN [
10] fail to effectively remove the speckle noise in the sonar images. After despeckling sonar images with two filtering-based methods, namely BM3D [
4] and BM3D-G [
18], the mAP, mAP@50, and mAP@75 metrics show marginal improvements but are still inferior to transformer-based despeckling methods, i.e., SID-TGAN and SAR-Transformer [
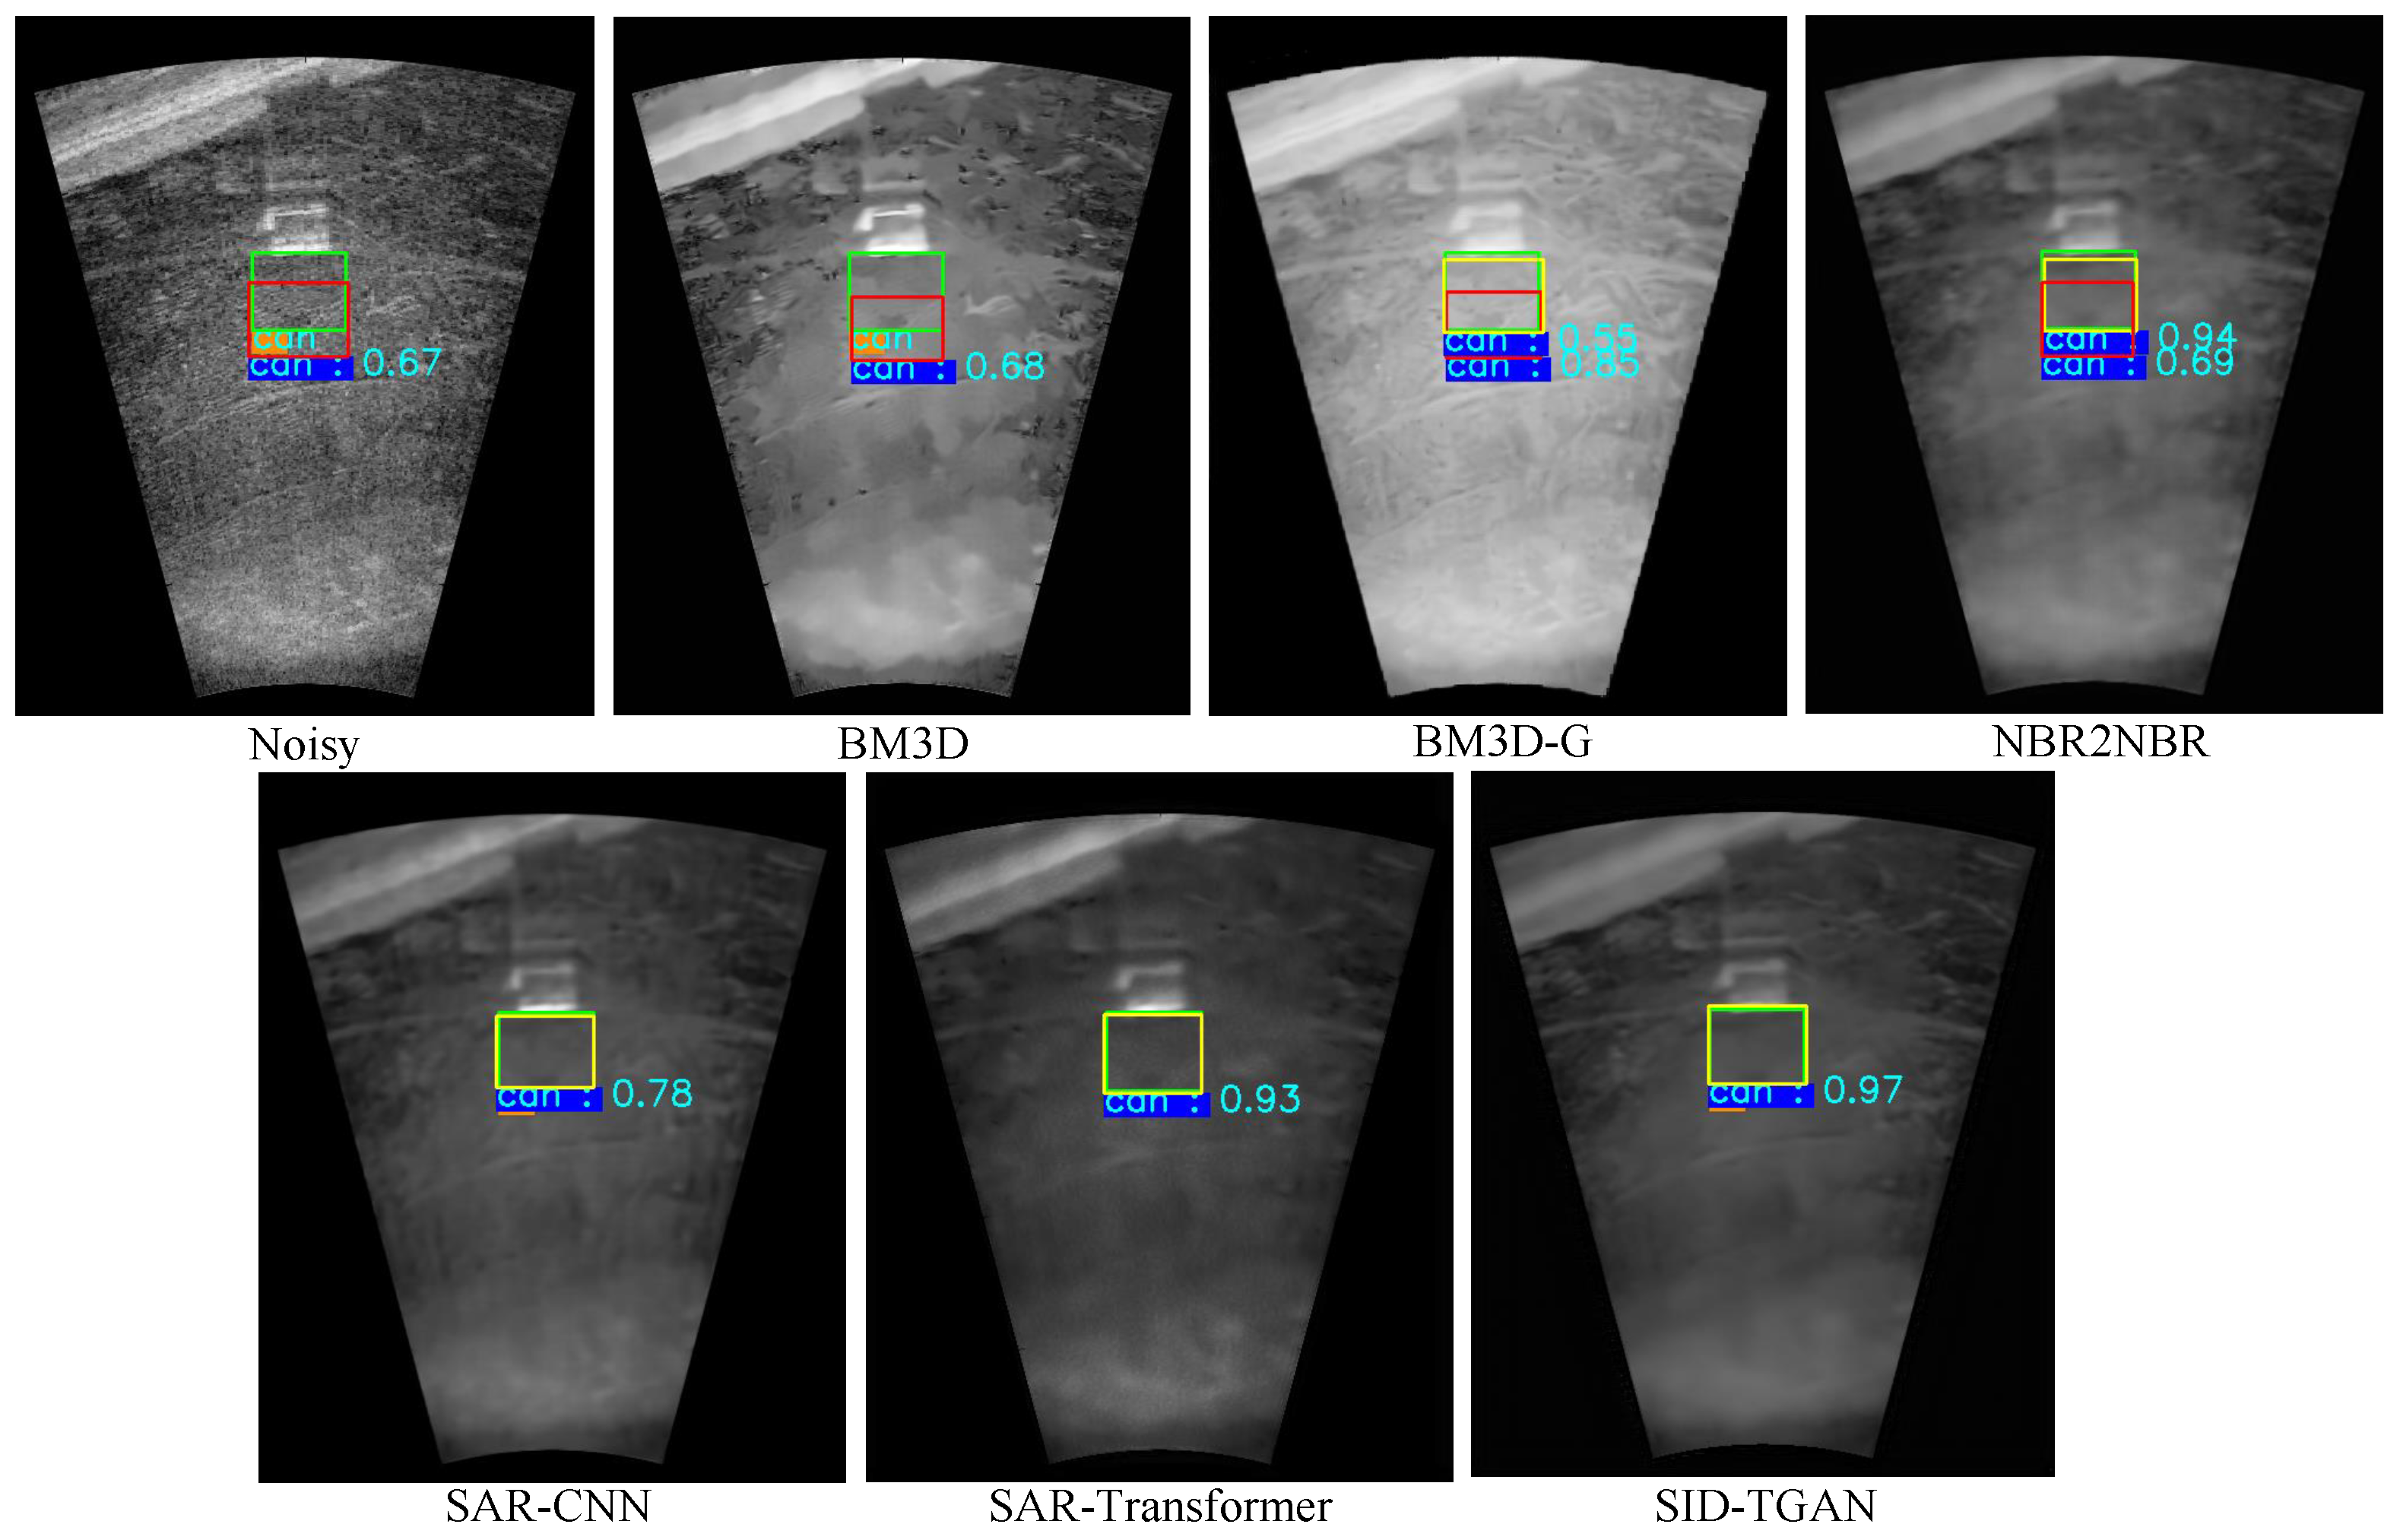
24]. We also visualize the effects of using despeckled images by different methods for the target detection task in
Figure 7. The above results confirm that SID-TGAN achieves better despeckling performance and provides sonar images of higher quality for target detection compared to existing despeckling methods.
Efficiency Evaluation. We present the running time required by each method to train the model and to perform the denoising process on a single image in
Table 7. It should be noted that SID-TGAN, in comparison to CNN-based denoising methods, exhibits slightly higher training and denoising time. This can be attributed to the fact that the transformer model needs to extract global positional information when processing input data, which, in contrast to the localized nature of convolutional operations, results in prolonged processing time. In addition, filtering-based approaches do not require any training procedure in advance but take more than three orders of magnitude longer time in the denoising process.
4.4. Ablation Studies
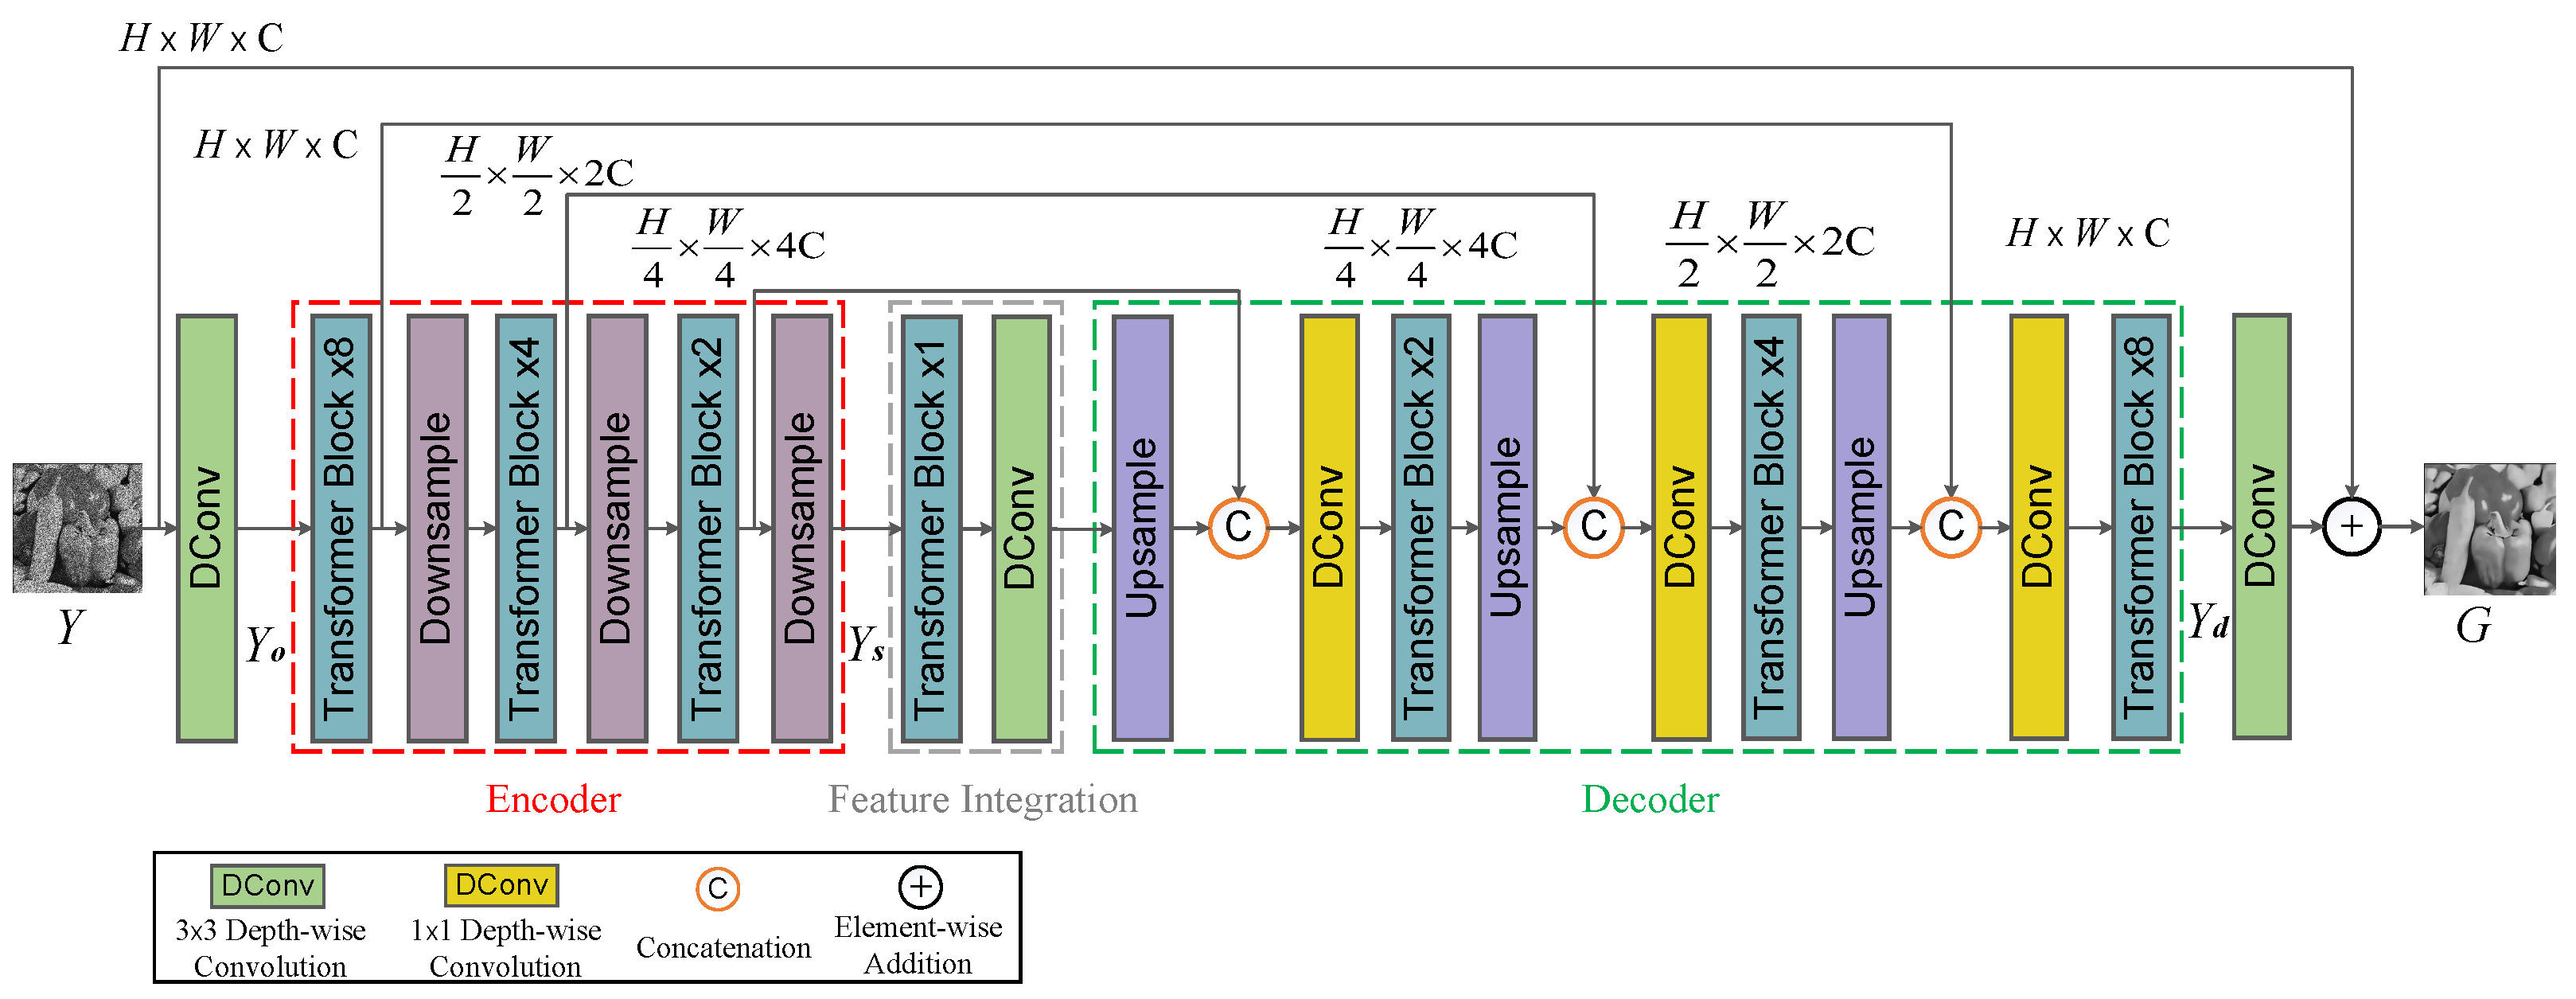
The despeckling performance of SID-TGAN is improved through the following key contributions. First, it integrates the transformer layer into the GAN framework to capture global dependencies among image pixels. Second, it optimizes Restormer [
25] by removing the final refinement stage and introducing deep convolutional layers in the feature integration component to improve the extraction of global features while retaining local features. Third, it proposes a new loss function that promotes the generation of high-quality images in SID-TGAN by considering global similarity, image content, and local texture and style. To evaluate the impact of each factor on the despeckling performance of SID-TGAN, we conduct ablation studies on the optical-despeckling and sonar-despeckling datasets. We utilize two widely adopted full reference image quality metrics, PSNR and SSIM, to evaluate the despeckling performance on the optical images. Similarly, two image quality metrics without references, SSI and SMPI, are employed to evaluate the despeckling performance on the sonar images.
Effect of Transformer Module. We compare the denoising performance of SID-TGAN with and without the transformer layer on FLS, SSS, and SAS images in
Table 8 and
Table 9. Another baseline is the original WGAN [
30] model with weight clipping and gradient penalty. From
Table 8, we can see that adding transformer layers to the discriminator of SID-TGAN marginally improves its performance, while adding transformer layers to the generator of SID-TGAN improves its performance much more significantly. After adding transformer layers to the generator of SID-TGAN, the values of PSNR, SSIM, SSI, and SMPI increase by 15%, 27%, 31%, and 78%, respectively. When transformer layers are added to both the generator and discriminator networks, SID-TGAN achieves the best despeckling performance.
Table 9 reveals that the incorporation of the transformer module into SID-TGAN leads to significant improvements in the denoising performance for SSS and SAS images as well. For SSS images, the SSI and SMPI values increase by 93% and 94%. For SAS images, the SSI and SMPI values also show improvements of 58% and 89%. The above results indicate that the transformer module effectively captures global dependencies between pixels, compensating for the limitations of convolutional operations that only capture local dependencies between pixels, thus significantly improving the despeckling performance of SID-TGAN.
Improvements upon Restormer’s Performance. We conducted a series of experiments to show how the performance of SID-TGAN is improved upon Restormer to highlight the exceptional capabilities of SID-TGAN.
Table 10 and
Table 11 present the results, where the baseline model is Restormer itself, and ResGAN replaces the generator with Restormer while utilizing the discriminator from SID-TGAN. The results in
Table 10 and
Table 11 demonstrate that by introducing the discriminator into the Restormer model, removing the refinement layers in Restormer, and adding deep convolutional layers in the encoder output stage, as well as incorporating dimensionality reduction operations in the primary decoder, we further extract advanced and refined global and local features. This improvement has had a significant impact on the despeckling performance across three sonar image datasets. On FLS images, the SSI and SMPI values increase by 63% and 76%. On SSS images, the SSI and SMPI values show improvements of 22% each. On the SAS images, the SSI and SMPI values increase by 20% and 13%.
Effect of Loss Function Component. The loss function of SID-TGAN consists of the global similarity loss
, the image content loss
, and the local texture and style loss
. We evaluate the impact of each component of the loss function on the despeckling performance of SID-TGAN in
Table 12 and
Table 13. Since SID-TGAN is a GAN model,
is the default adversarial loss function. After
or
is added to
, the despeckling performance of SID-TGAN improves significantly for both optical images and sonar images. These results confirm that the global similarity loss function
better retains global information while removing noise. Similarly, the image content loss function
also effectively improves image quality by better preserving the original information in the image. After both
and
are added to
, SID-TGAN achieves the best performance.
By examining
Table 12 and
Table 13, we can deduce that the
loss function has a significantly greater impact on the performance of the model compared to the
loss function. When considering the comprehensive loss in Equation (
5) and after extensive experimentation involving parameter adjustments, we observe that when the hyperparameter
is set too small, the contribution of
to the total loss becomes marginal, resulting in the retention of certain levels of blur in the denoised images. Conversely, when
is set too high, the prominence of the
model’s weight interferes with
’s ability to handle image details and edge information, thus adversely affecting the overall model performance. As a result, based on our experimental findings, we accordingly configured the values of
and
as
and 1, respectively, where the model achieves the best overall performance.


