Article

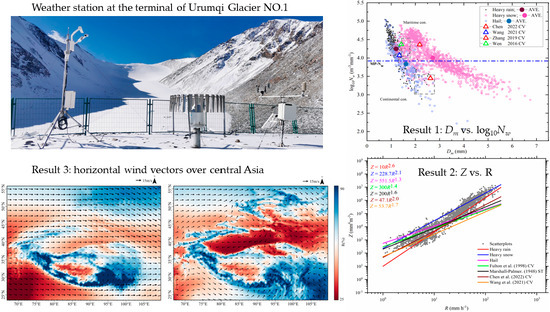
Raindrop Size Distribution Characteristics of Heavy Precipitation Events Based on a PWS100 Disdrometer in the Alpine Mountains, Eastern Tianshan, China

1
State Key Laboratory of Cryosphere Science, Northwest Institute of Eco-Environment and Resources, Chinese Academy of Sciences, Lanzhou 730000, China
2
University of Chinese Academy of Sciences, Beijing 100049, China
3
College of Science, Shihezi University, Shihezi 832000, China
4
College of Geography and Environmental Science, Northwest Normal University, Lanzhou 730000, China
5
College of Software Engineering, Chengdu University of Information Technology, Chengdu 610103, China
*
Author to whom correspondence should be addressed.
Remote Sens. 2023, 15(20), 5068; https://doi.org/10.3390/rs15205068
Submission received: 29 August 2023 / Revised: 11 October 2023 / Accepted: 16 October 2023 / Published: 23 October 2023

Abstract

:
As a key component of the hydrological cycle, knowledge and comprehension of precipitation formation and evolution are of leading significance. This study investigates the statistical characteristics of raindrop size distribution for heavy precipitation events with observations collected by a Present Weather Sensor (PWS100) disdrometer located in the alpine area of eastern Tianshan, China. The characteristics are quantified based on heavy rain, heavy snow, and hail precipitation events classified using the rainfall intensity and the precipitation-related weather codes (US National Weather Service). On average, the heavy precipitation events in the headwaters of the Urumqi River are dominated by medium-sized (2–4 mm) raindrops. As well, we investigate mass-weighted mean diameter–normalized intercept parameter scatterplots, which demonstrate that the heavy precipitation events in alpine regions of the Tianshan Mountains can be identified as maritime-like clusters. The concentration of raindrops in heavy precipitation is the highest overall, while the concentration of raindrops in heavy snow is the lowest when the diameter is lower than 1.3 mm. The power–law relationships of radar reflectivity (Z) and rain rate (R) [Z = ARb] for the heavy rain, heavy snow, and hail precipitation events are also calculated. The Z–R relationship of heavy rain and heavy snow in this work has a lower coefficient value of A (10 and 228.7, respectively) and a higher index value of b (2.6 and 2.1, respectively), and the hail events are the opposite (A = 551.5, b = 1.3), compared to the empirical relation (Z = 300R1.4). Furthermore, the possible thermodynamics and general atmospheric circulation that cause the distinctions in the raindrop size distribution characteristics between alpine areas and other parts of the Tianshan Mountains are also debated in this work. The headwaters of the Urumqi River in alpine areas have relatively colder and wetter surroundings in the near-surface layer than the foothills of the Tianshan Mountains during the precipitation process. Meanwhile, a lower temperature, a higher relative humidity, a more efficient collision coalescence mechanism, and glacier local microclimate effects (temperature jump, inverse glacier temperature, glacier wind) at the headwaters of the Urumqi River during the precipitation process are probably partly responsible for more medium- and large-size drops in the mountains.

Graphical Abstract

1. Introduction

Raindrop size distribution (DSD) is a function of raindrop number density with raindrop size. DSD is highly interrelated to the physical processes of rainfall events, and its properties are crucial for understanding the upper-layer mechanisms of clouds and precipitation [1,2,3,4]. At the same time, it can also be used in scientific research, urban construction, agricultural development, and other fields, such as weather forecasting, heavy rainfall monitoring and early warning, remote sensing detection, and soil erosion [5,6,7,8,9]. DSD studies have improved the accuracy of quantitative precipitation estimation (QPE) products associated with precipitation radar measurements, especially in the use of integrated meteorology radars and the era of global precipitation measurement missions centered on dual-frequency phased-array precipitation radars [10,11,12,13]. Moreover, the kinetic energy of rainfall calculated by DSD is of great significance for evaluating the erosion coefficient of precipitation and further comprehending natural hazards such as landslides and debris flow [6,14,15,16].
The characteristics of DSD show disparate distribution characteristics with different climate types, topographies, and precipitation types [17,18,19,20,21,22,23]. Severe mesoscale convective systems often cause extreme rainfall, hailstones and even tornadoes [24]. In recent years, the frequency of abrupt heavy rainfall has gradually increased [25] and has caused grievous economic losses [26]. For the sake of comprehending the variability in extreme precipitation events, there are numerous studies on the DSD characteristics of extreme precipitation events. The main limitation of DSD variation in extreme precipitation is largely due to the insufficient parameterization of the Collision-merging (break-up) processes [27]. In addition, factors such as evaporation, particle size sorting, natural fragmentation, and rain shaft mixing also affect the characteristics of DSD [28]. Luo et al. [24] analyzed the characteristics of the DSD of heavy rainstorm events in Beijing and found that, in all events, the rain was dominated by small to mid-sized raindrops (diameter: 2–4 mm) and a small amount of large particles (diameter higher than 4 mm). Ding et al. [29] believed that rainstorms are characterized by small drops; in their study, the contribution of drops with a diameter D > 4 mm to the radar reflectivity factor was 53.74%. Similar conclusions were reached by Dolan et al. [30], who identified two distinct DSD types from global observations, both of which resulted in heavy rainfall characterized by relatively large average raindrop sizes (smaller), the number concentration was relatively low (high), corresponding to warm rain (ice-based) convection. The characteristics of DSD also varied significantly within specific convective systems [31,32,33]. Such complexity of heavy precipitation DSD observations has posed a major challenge to the comprehensive parameterization of microphysics and the accuracy of quantitative precipitation forecasts.
The Tianshan Mountains have a complex terrain and vast territory, which is located at the center of Eurasia, and is the world’s farthest mountain range from the ocean [34]. As the "water tower of Central Asia”, it is also the region with the richest water resources in arid Central Asia and plays a key role in water security [35]. There are many studies on the characteristics of DSD in mountainous areas, and most of the observation points are at the foot of high mountain slopes or in the middle and lower parts of valleys [23,36,37,38,39,40,41]. Restricted by terrain and alpine conditions, there are few meteorological stations distributed in alpine areas. Meanwhile, the low frequency of observation and lack of data limit researchers’ in-depth understanding of precipitation patterns in mountain areas. A recent study showed that the DSD characteristics and microphysical parameters in the alpine region were quite different from those in other areas of the Tianshan Mountains, monsoon regions, and arid regions [42].
However, the studies on the DSDs of extreme rainfall in the alpine areas of the Tianshan Mountains are still sparse. The phenomenon of temperature jump, ice surface inversion, and glacier winds caused by the cooling effect of the surface of glaciers all affect the regional microclimate [43,44,45]. As a consequence, the PWS100 Present Weather Sensor was installed at the terminus of Urumqi Glacier No. 1 in 2017 by the Tianshan Glaciological Station, Chinese Academy of Sciences. This paper aims to solve the following questions: (1) what are the characteristics of the DSDs and microphysical aspects of extreme precipitation in an alpine region which has been classified as heavy rainfall, heavy snow, hail, and freezing rain? (2) What are the differences between the DSD characteristics of extreme precipitation in mountains and those in other regions? (3) What are the possible microphysical processes responsible for these differences? The research results of this paper will reveal the microphysical characteristics of heavy precipitation events in alpine areas, and the application of DSD in alpine regions will also be broadened.

2. Datasets and Methodology

2.1. PWS100 Disdrometer and Dataset

To comprehend the DSD characteristics and microphysical parameters of extreme precipitation in alpine regions, the PWS100 was installed in the meteorological observation field (Urumqi, 3850 m a.s.l), located at the terminus of Urumqi Glacier No. 1, southeastern part of the Tianshan Mountains, with a Geonor T-200B precipitation gauge and other meteorological observation instruments (Figure 1b). There are seven glaciers in the source area, the largest of which is Urumqi Glacier No. 1, which is the "reference glacier" of the World Glacier Monitoring Service (WGMS) in the arid region of Central Asia [46]. The locations of the observational station and the terrain are shown in Figure 1a. The head watershed of the Urumqi River is strongly affected by a westerly circulation in summer. Precipitation is mainly concentrated from May to September, and is mainly in the form of solid precipitation such as snow, hail, and graupel. The winter, controlled by the Siberian anticyclone circulation, is extremely cold with little precipitation. The average annual precipitation is 468 mm and the average annual temperature is approximately −5.1 °C [34,46].
Figure 2a shows the PWS100 disdrometer. The disdrometer consists of four parallel horizontal light sheets. When the precipitation drops pass through the light sheet, the light is blocked, and then the detector detects the blocking time at two angles, so that the speed and size of the drops can be calculated [47]. Single raindrop particle diameter measurement ranges from 0.1 to 30 mm, and velocity measurements range from 0.1 to 30 m s−1. The diameter and velocity are divided into 34 graded intervals, and the outputs are arranged in 34 by 34 size and velocity bins. The disdrometer classified precipitation as drizzle, freezing drizzle, freezing rain, rain, snow grains, snowflakes, ice pellets, hail, and graupel. The PWS100 can also output weather codes related to visibility and precipitation, as detailed in World Meteorological Organization (WMO) SYNOP codes. The disdrometer has a good accuracy in measuring the particle diameter and speed of raindrops, and the accuracy can reach 5% [48]. The datasets (Table 1) used in this work are 3976 min of raindrop spectral data from 2019 to 2022, corresponding to a total rainfall of 521.6 mm.
In addition to the observations made using the PWS100 disdrometer, the relative humidity, wind direction, and wind speed of the 5th reanalysis data of the European Center for Medium-Range Weather Forecasting (ERA5) with a spatial resolution of 0.25° × 0.25° and a temporal resolution of one month were also used, and are available at https://cds.climate.copernicus.eu, (accessed on 18 August 2023).

2.2. Methodology

The raindrop concentration (N(Di), mm−1 m−3) can be obtained by using the following equation:
N D i = j = 1 34 n i j v j · S · t · Δ D i
where N(Di) (mm−1 m−3) is the number concentration of raindrops for raindrop diameter Di (mm); nij is the number of raindrops within the size bin i and velocity bin j; S(m2) is set to 0.004 m2; t(s) is set to 60 s; and Vj (m s−1) represents the falling speed for velocity bin j. ∆Di (mm) is the gap between each diameter class.
The integral rainfall parameters of rain rate R (mm h−1), liquid water content W (g m−3), total concentration of raindrops Nt (m−3), and radar reflectivity factor Z (mm6 m−3) are as follows:
R = 6 π × 10 4 i = 1 34 j = 1 34 D i 3 V j N D i Δ D i
W = π 6 × 10 3 i = 1 34 D i 3 N D i Δ D i
N t = i = 1 34 N D i Δ D i
Z = i = 1 34 D i 6 N D i Δ D i
The three-parameter gamma function is widely used to represent the measured raindrop spectrum [49,50], which can be expressed as follows:
N D = N 0 D μ exp Λ D
where N0 (m−3 mm−(1+µ)) is the intercept parameter, μ is the shape parameter (dimensionless), and Λ (mm−1) is the slope parameter.
Since it can proportionally fit the moments of the above integral rainfall parameters, the method of moments is considered in this study [50,51]. The nth moment of the DSD is defined as:
M n = 0 D n N D d D = i = 1 34 N D i D i n Δ D i
Computing the gamma distribution parameters requires three moments. In this paper, the 3/4/6 moments are used (note that the superscripts 2 and 3 of M in Equation (9) are square and cubic, respectively) [17,49,52]:
μ = 11 G 8 + G G + 8 2 1 G
where
G = M 4 3 M 3 2 M 6
Λ = μ + 4 M 3 M 4
N 0 = Λ μ + 4 M 3 Γ μ + 4
where Γ(x) is expressed as:
Γ x = 2 π e x x x 1 2
To address the non-independence of the three parameters in the gamma DSD model, a normalized gamma distribution was presented [53,54], which is defined as:
N D = N w f μ D D m μ exp 4 + μ D D m
where Nw (mm−1 m−3) is the normalized intercept parameter, and Dm (mm) is the mass-weighted mean diameter. f(μ), Nw, and Dm can be expressed as follows:
f μ = 6 · 4 + μ 4 + μ 4 4 · Γ 4 + μ
N w = 4 4 π ρ ω 10 3 W D m 4
where ρω (1.0 g cm−1) is the density of water.
D m = M 4 M 3

2.3. Quality Control

The PWS100 and Geonor T-200B are installed in the meteorological observation field, A recent study showed a high correlation between the two instruments (0.8, n ≥ 731), which ensures that the observations from the PWS100 are valid [42]. The PWS100’s built-in algorithm assumes that raindrops are deformed when they fall, and its internal code will exclude particles with unusual velocities [55].
Small raindrops with a significantly higher velocity and larger raindrops with a significantly lower velocity in the particle spectrum will affect the quality of the raindrop spectrum and the calculated microphysical characteristics. Therefore, the DSD data were quality controlled in this work. Firstly, we removed observed data with tiny drop counts lower than 4 and rain rates below 0.002 mm h−1 (the manufacturer claims that the PWS100 can measure the rain rate down to 0.001 mm h−1, and counts raindrops with a threshold of 3 particles). Secondly, the disdrometer data with a precipitation duration of lower than 30 min were excluded to reduce statistical errors, since most rainfall events are intermittent. Finally, there must be at least one hour of no precipitation between rainfall events [56]. The classification threshold for identifying heavy precipitation is shown in Table 2 [55].

3. Results and Analyses

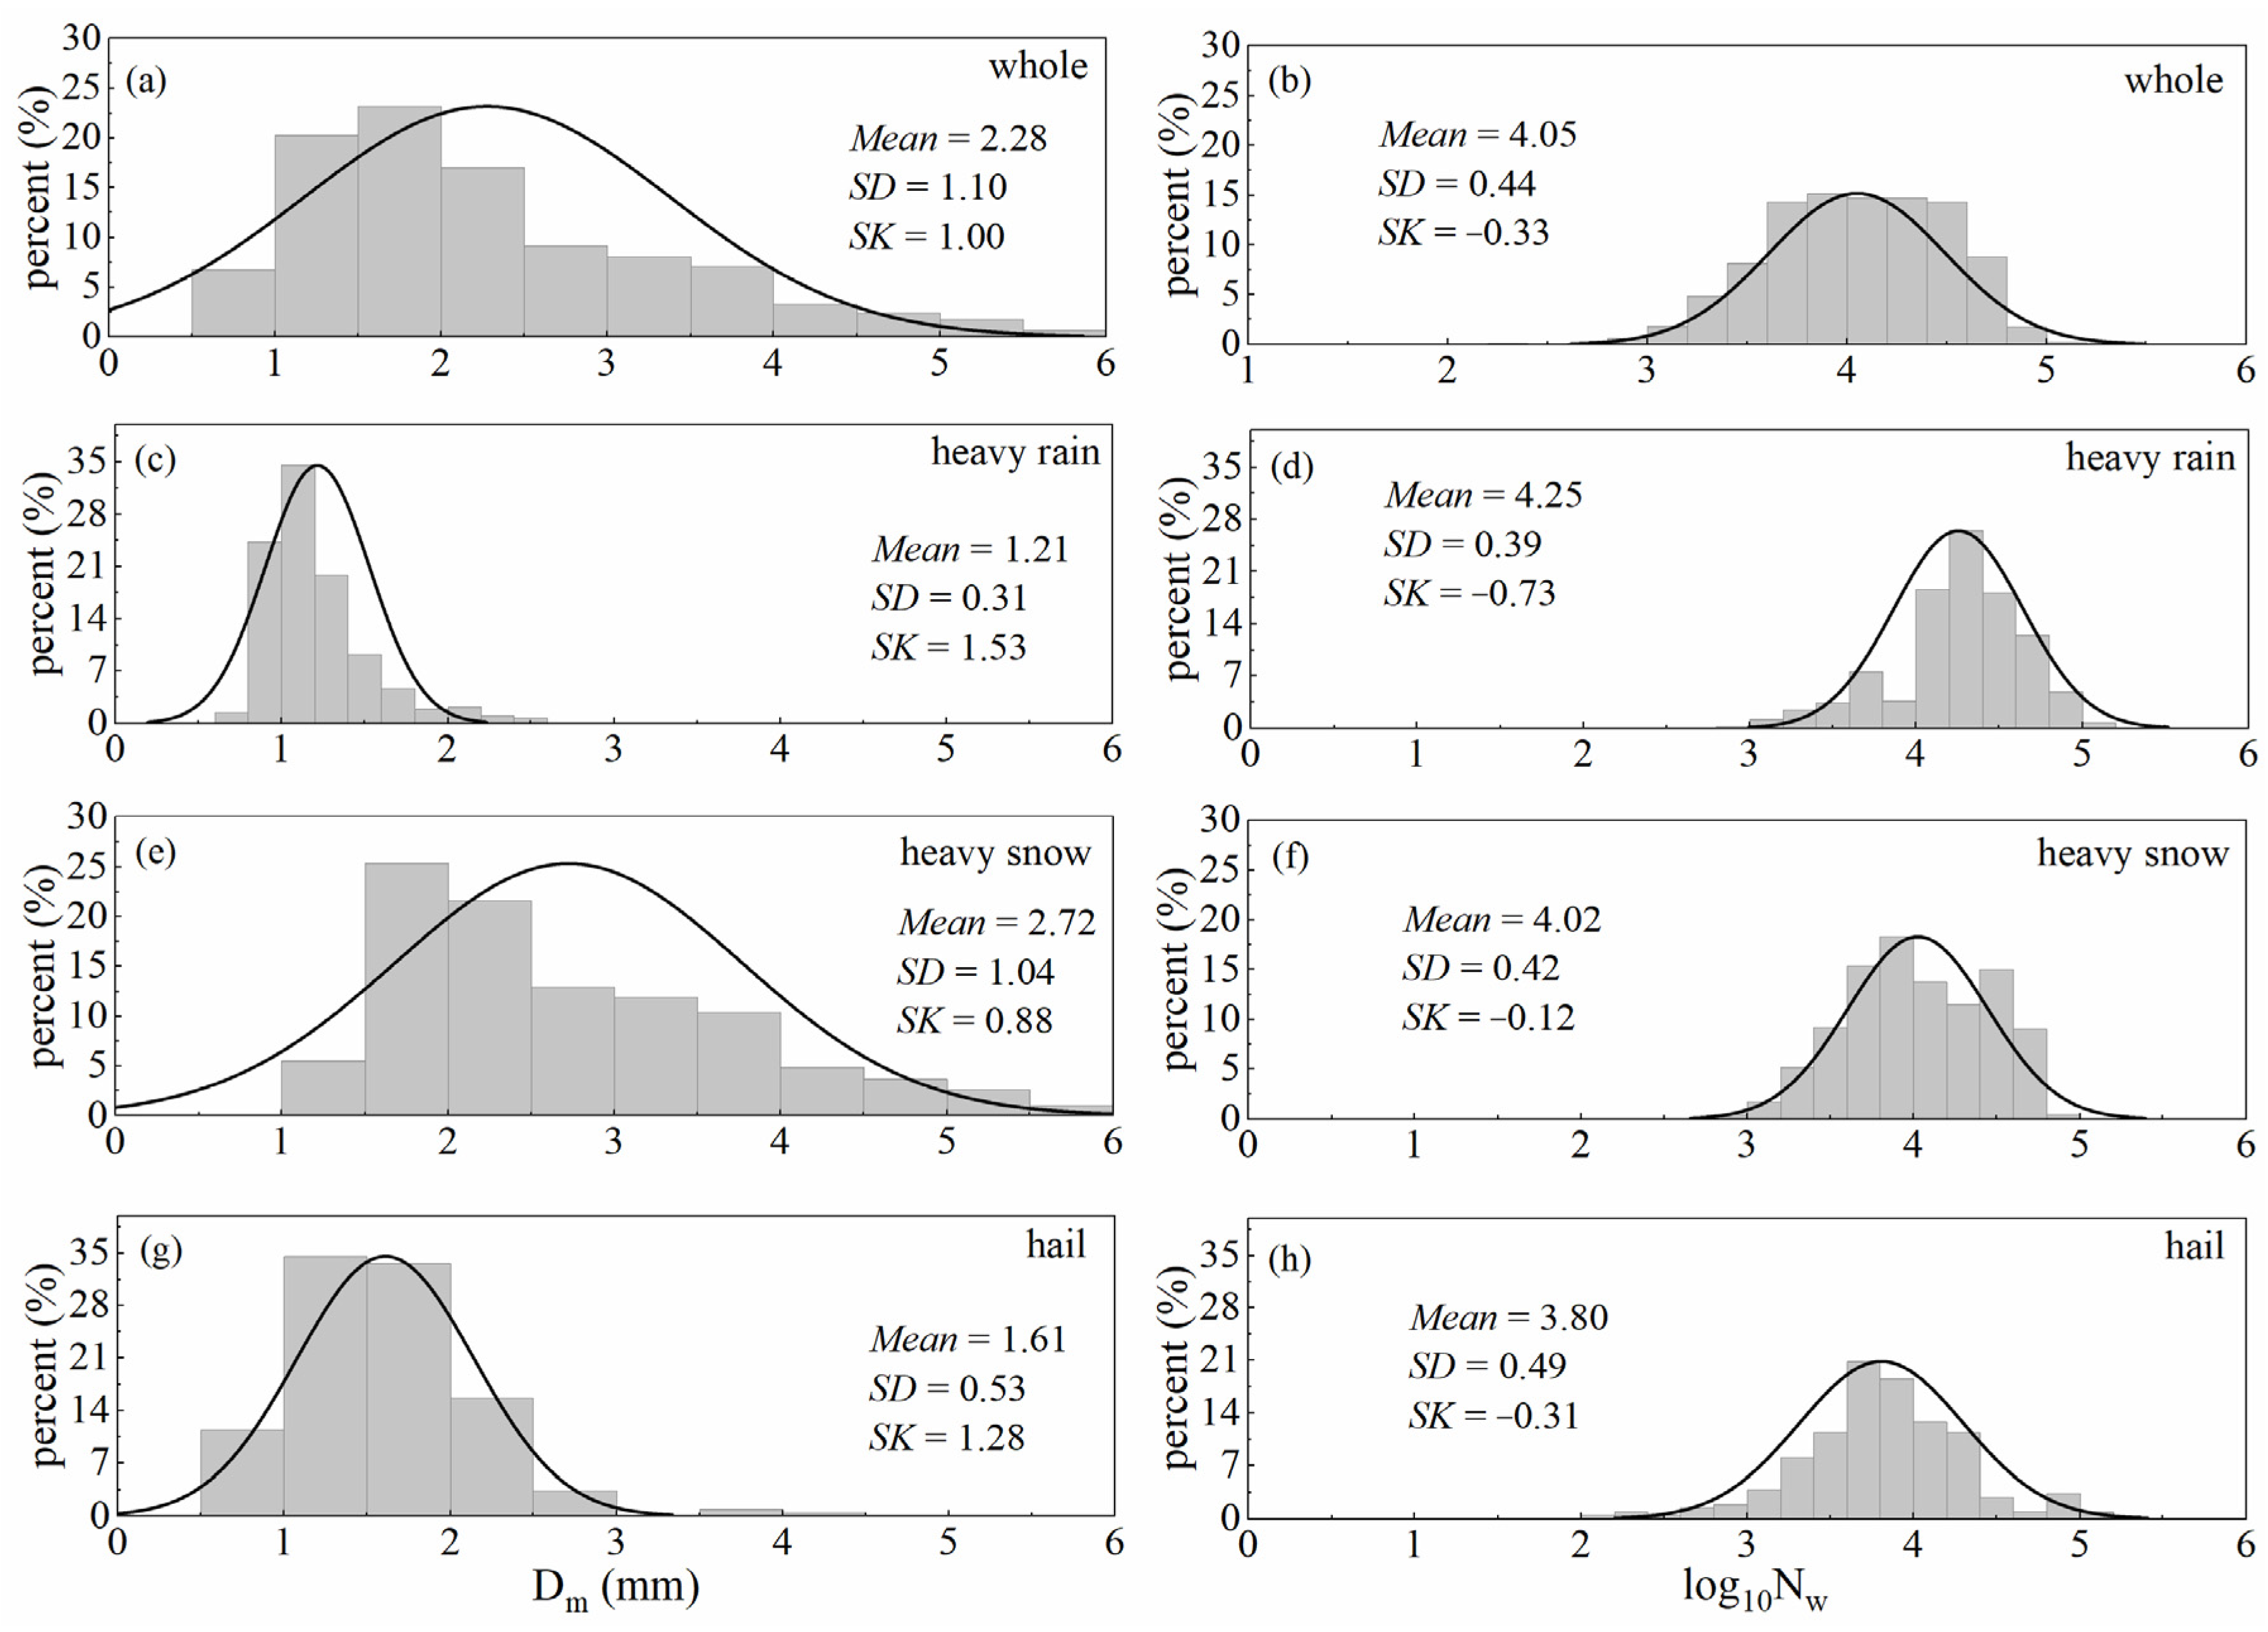
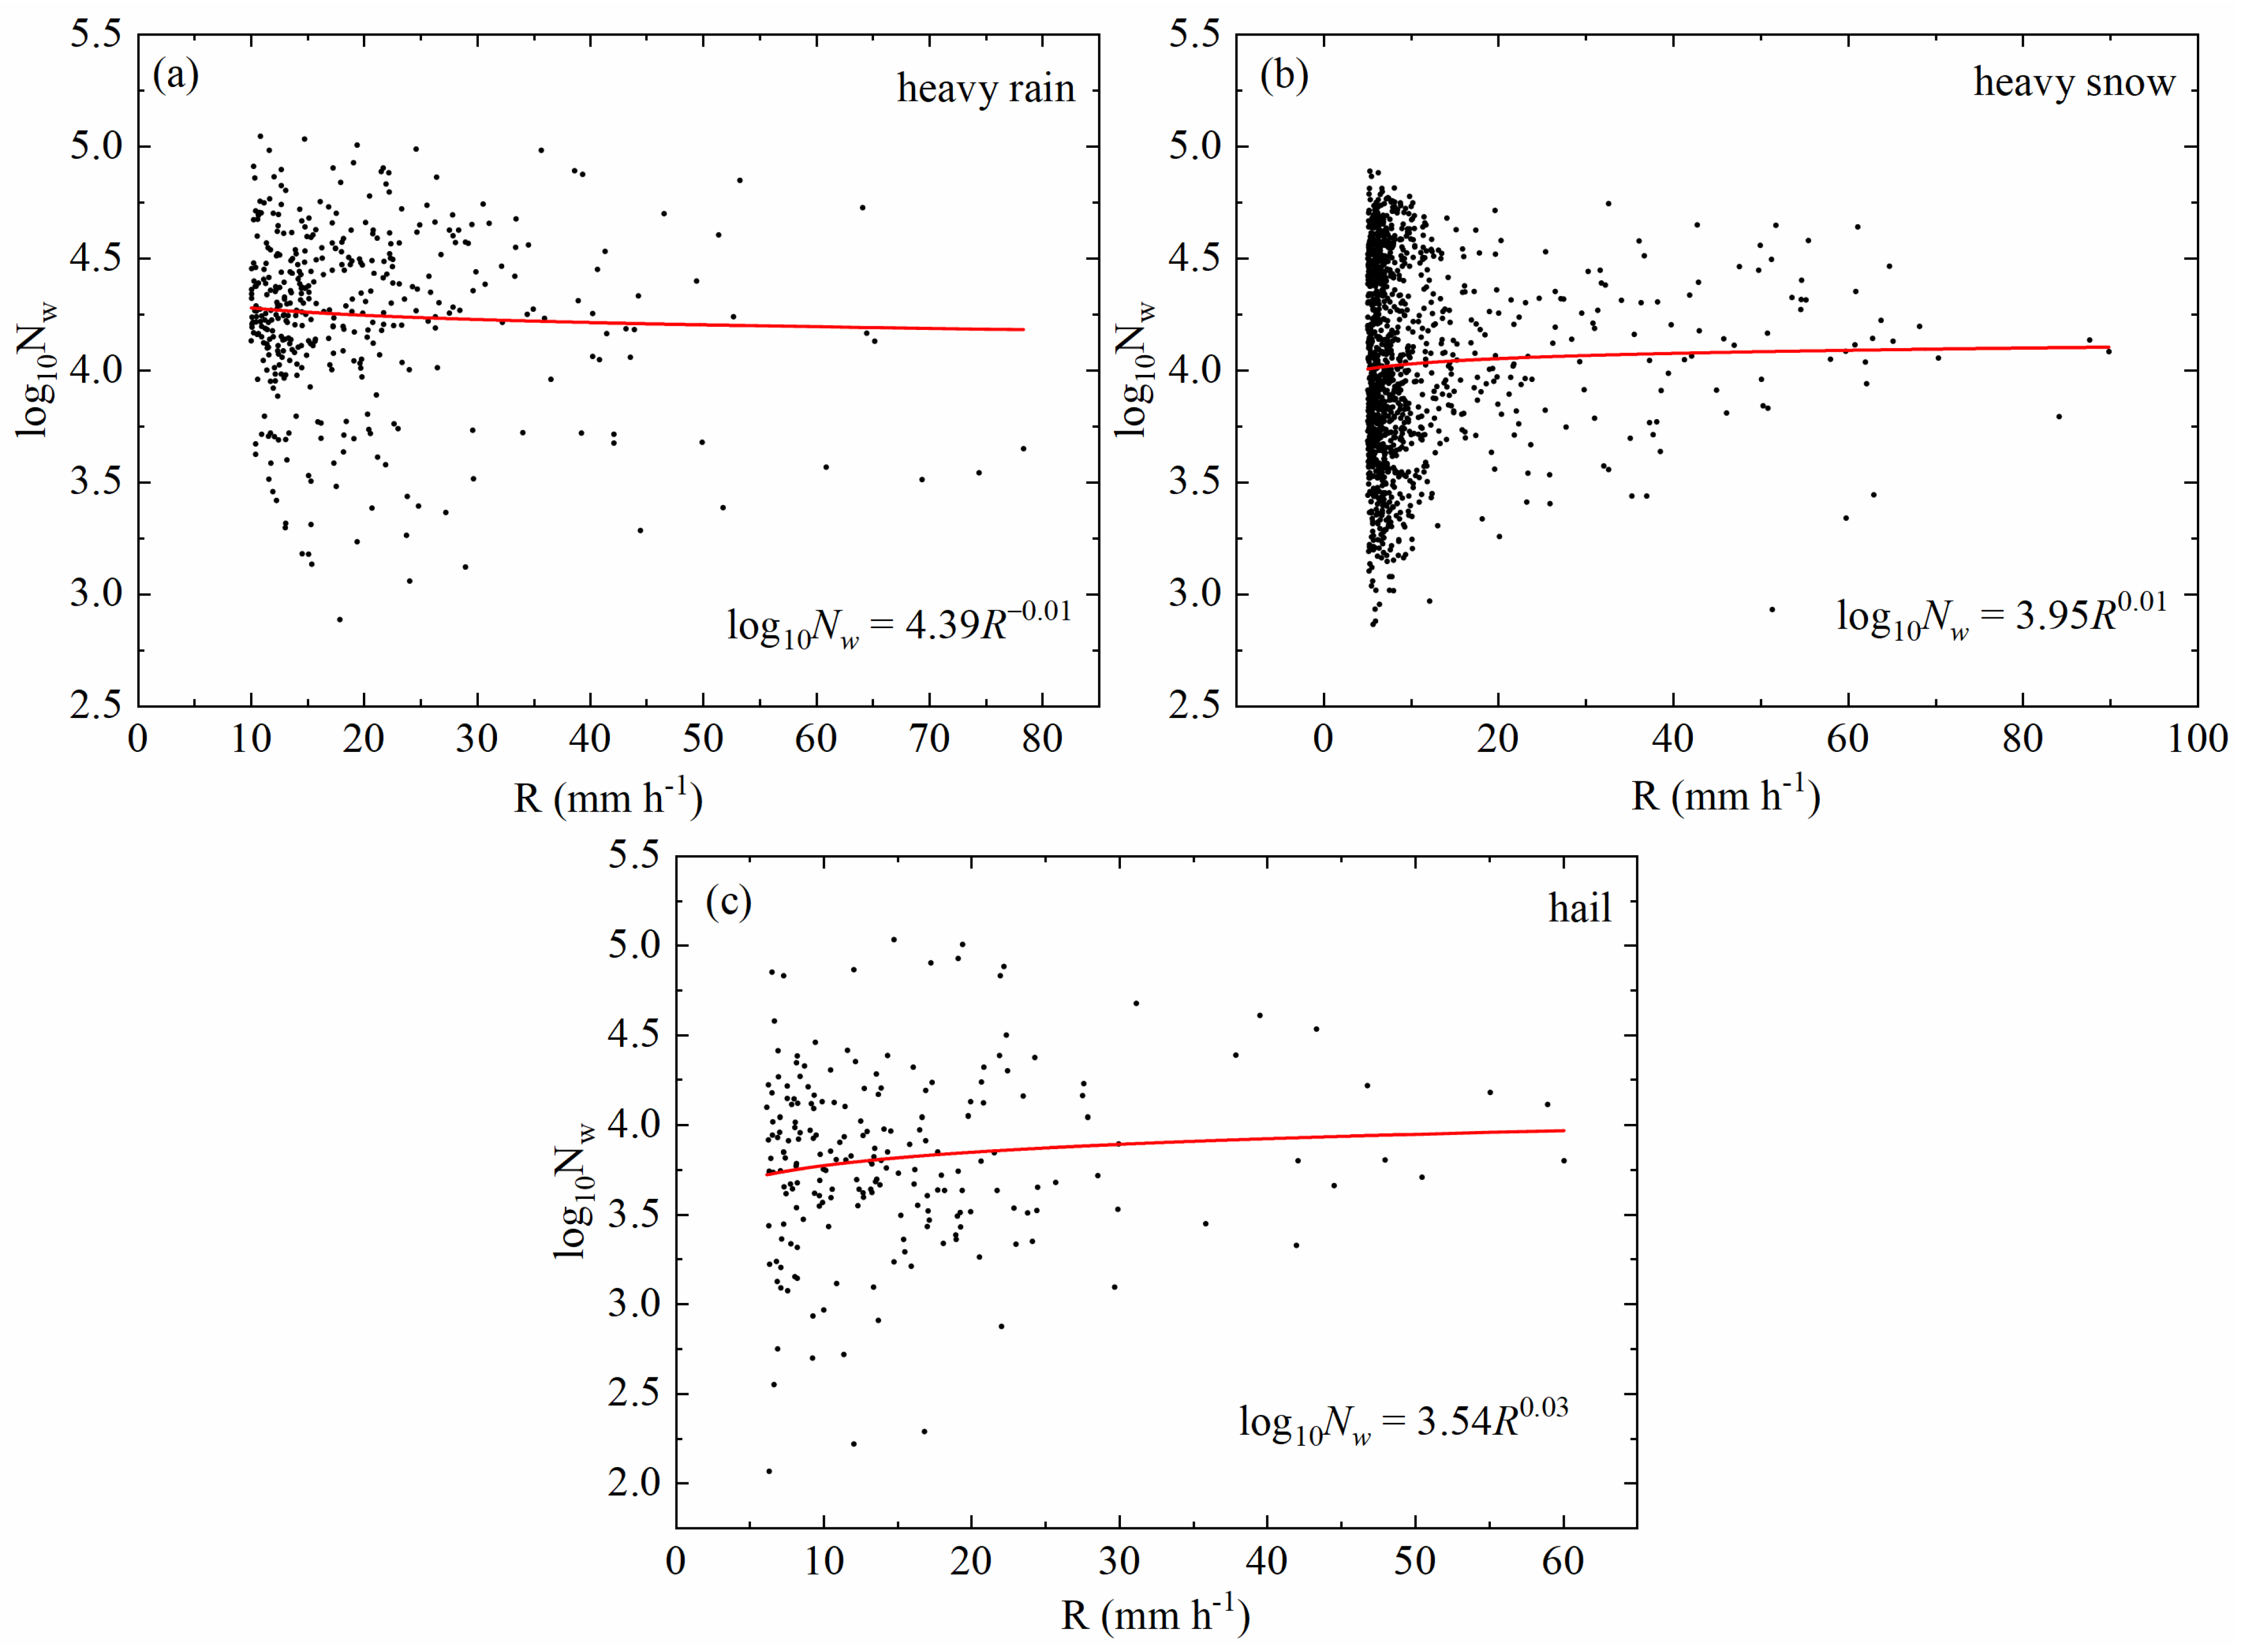
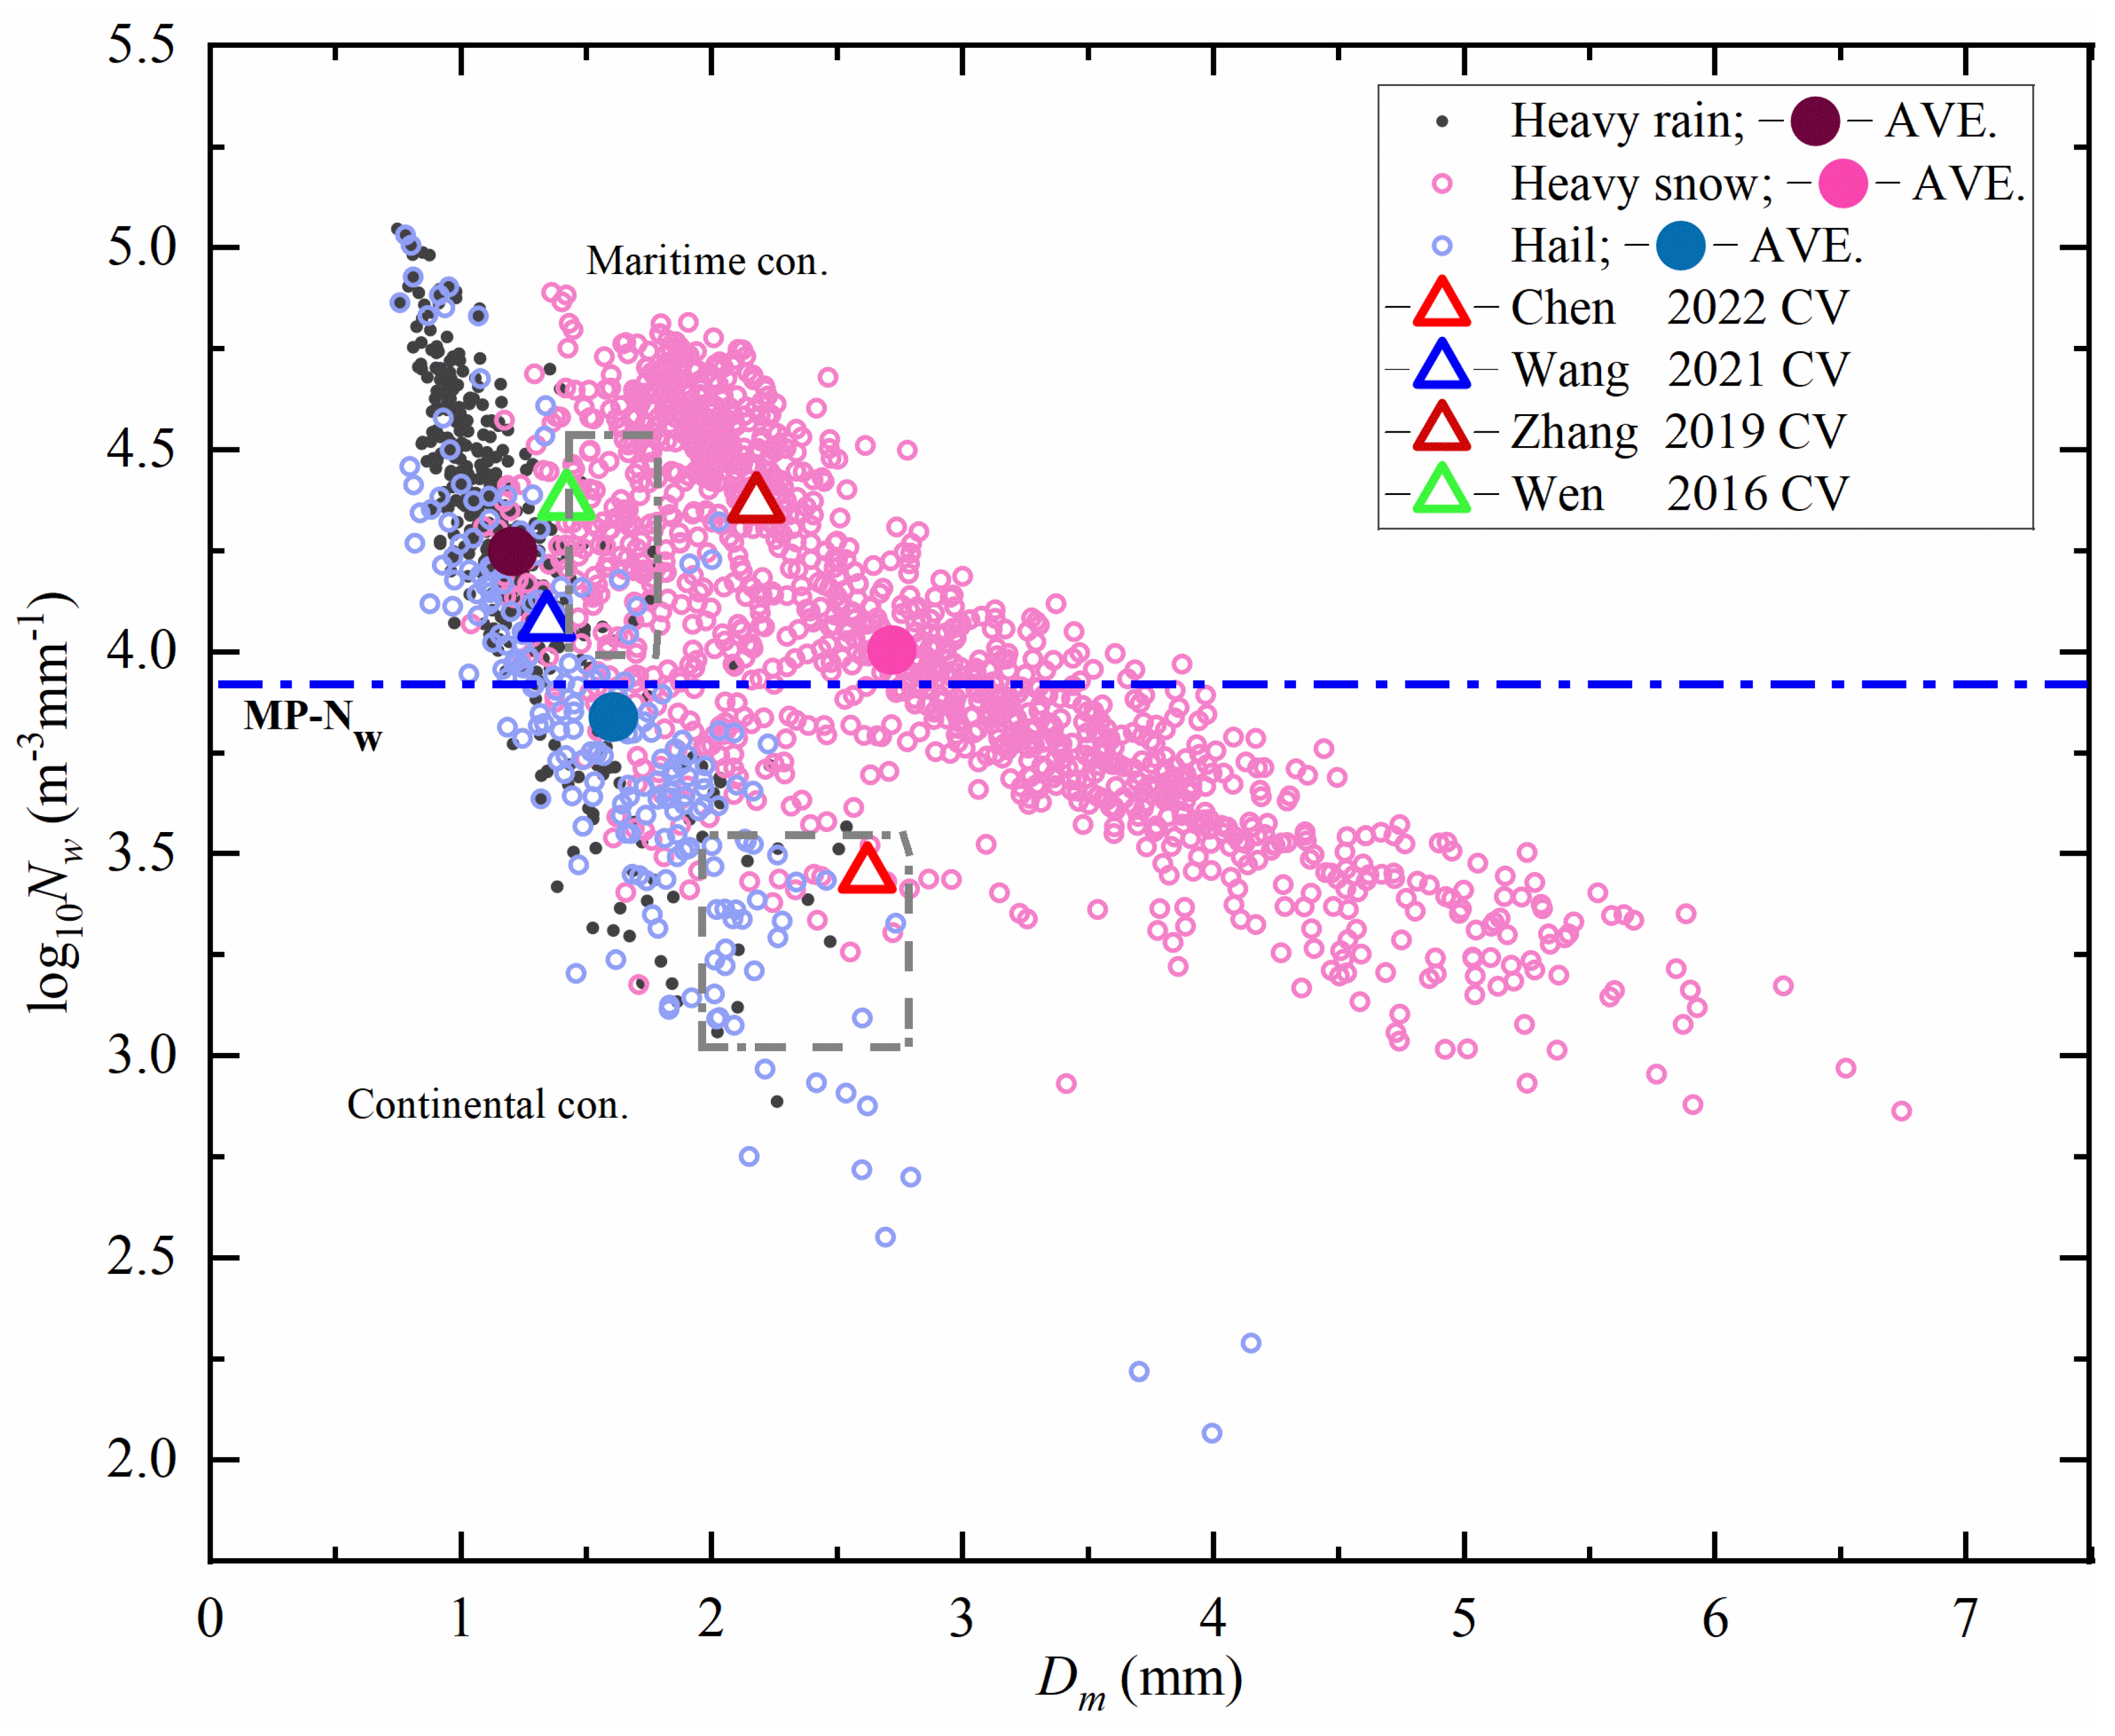
3.1. Characteristics of Dm and Nw

The relative frequency histograms of Dm and log10Nw for the entire datasets, as well as the subsets of heavy rain, heavy snow, and hail calculated by the PWS100 disdrometer, are shown in Figure 3. The mean values of Dm and log10Nw for the whole heavy precipitation events are 2.28 mm and 4.05, respectively, which are similar to the mean values for convective precipitation in southern China (2.21 mm and 4.36, respectively) [57]. The histogram of Dm is highly positively skewed, and it is slightly negatively skewed for log10Nw. The Dm and log10Nw have a large SD (1.10 mm and 0.44, respectively), suggesting higher variability in Dm and Nw. Dividing the entire dataset into heavy rain, heavy snow, and hail, it can be found that the mean value of the histogram of heavy snow Dm is 2.72 mm, which is higher than those for heavy rain (1.21 mm) and hail (1.61 mm), and the histogram mean of log10Nw for heavy rain is 4.25, which is higher than those for heavy snow (4.02) and hail (3.80). The histograms of the Dm of heavy rain, heavy snow, and hail are positively skewed (1.53, 0.88, and 1.28, respectively). On the other hand, the log10Nw histograms show a negative skewness (−0.73, −0.12, and −0.31, respectively). On average, the DSD features in alpine areas of the Tianshan Mountains have higher number concentrations compared with other regions of the Tianshan Mountains (4.05 vs. 3.97 for log10Nw), and relatively large-sized drops [23]. Except for the difference in altitude, the underlying surface effects (temperature jump, ice surface inversion, and glacier wind) at the headwaters of the Urumqi River are a significant reason for the variation in the DSD characteristics.
Figure 4 shows the scatterplots of Dm vs. R for heavy rain, heavy snow, and hail events. The red lines represent the power law relationship obtained by fitting the least square method. The dots in Dm vs. R are dispersive, particularly for heavy rain, which indicates that the Dm of heavy rain has high variability with the change in the rain rate. The index in the DmR relationship is positive for heavy rain and hail events, indicating that, at a higher rainfall rate, the Dm is larger. On the contrary, the relationship is negative for heavy snow events. Similarly, the Dm values are apt to be steady (1.5–2.0 mm) for both rain types at a higher rainfall intensity, indicating that the DSD tended to be equilibrium-like [17]. For the Dm–R relationship, the coefficient of heavy snow events is higher than for the other two precipitation types, with a lowest exponent; meanwhile, when the rain rate is approximately 7 mm h−1, the Dm of heavy snow shows a large variability.
The results for Nw vs. R are shown in Figure 5 (the units of Nw are in mm−1m−3). Nevertheless, the relationship of Nw vs. R is more scattered than that of Dm vs. R in Figure 4, especially for hail events. The exponential relationship of all precipitation types is approximately a straight line. The Nw values tend to be stable (4.0 mm−1m−3) for heavy snow and hail events at higher rainfall rates, while the Nw value of heavy rain tends to be stable at 4.25 mm−1m−3. The Nw vs. R relationship index of heavy snow and hail is positive, indicating that, at higher rainfall rates, the Nw is larger, which is due to the more-efficient mechanism of the coalescing and fragmentation processes.
Figure 6 shows the scatterplots of Dm vs. log10Nw for the three different rain types. The mean values of Dm and log10Nw for the heavy rain subset are approximately 1.21 mm and 4.25, respectively. This suggests that heavy rain in the Tianshan Mountains is formed by the melting of tiny, compact graupel and rimed ice particles. Only part of the Dm–log10Nw data appear in the maritime convective clusters region, and less data are observed for the continental convective clusters. A recent study showed that convective precipitation (rainfall intensity: 5.87 mm h−1) at the headwaters of the Urumqi River can be regarded as continental-like clusters [42]. However, in the present study, the log10Nw mean of the entire dataset computed in Figure 3 is roughly in the maritime-like clusters, and the Dm value is marginally higher, indicating that the Dm value of the heavy precipitation events in the Tianshan region is higher than that for the maritime-like clusters.

3.2. Characteristics of the DSD for Different Precipitation Patterns

We further investigated the characteristics of the DSDs for heavy rain, heavy snow, and hail events. The average raindrop spectra for the heavy rain, heavy snow, and hail precipitation types at the headwaters are shown in Figure 7. Obviously, as the diameter of raindrops increases, the gap between these three types of precipitation becomes larger, and the spectral width of heavy snow is larger than that of heavy rain and hail events. When the raindrop diameter is lower than 1.3 mm, the raindrop concentration of heavy precipitation is the highest, and that of heavy snowfall is the lowest. On the contrary, when the raindrop diameter is higher than 1.3 mm, the concentration of the raindrops in heavy snow is the highest, corresponding to a higher Nt of raindrops, more W, and a higher Z (Table 3). The integral microphysical parameters are calculated in Table 3.
Furthermore, in order to comprehend the distribution of the raindrop diameter and its relative contribution to the total rainfall events, the observed samples in the Urumqi River Basin were divided into six categories of raindrop diameter. As shown in Figure 8, the raindrop diameter of 1~3 mm contributes the most to the total concentration of raindrops, accounting for 77.4%; 2~4 mm accounts for 57.7% of the rain rate. The results are similar to those of Ding et al. [29], who believed that, in extreme precipitation, the mid-sized drops with a diameter D of 2–4 mm contributed 61.28% to the rain rate. In general, the heavy precipitation events at the headwaters are dominated by medium-sized raindrops.

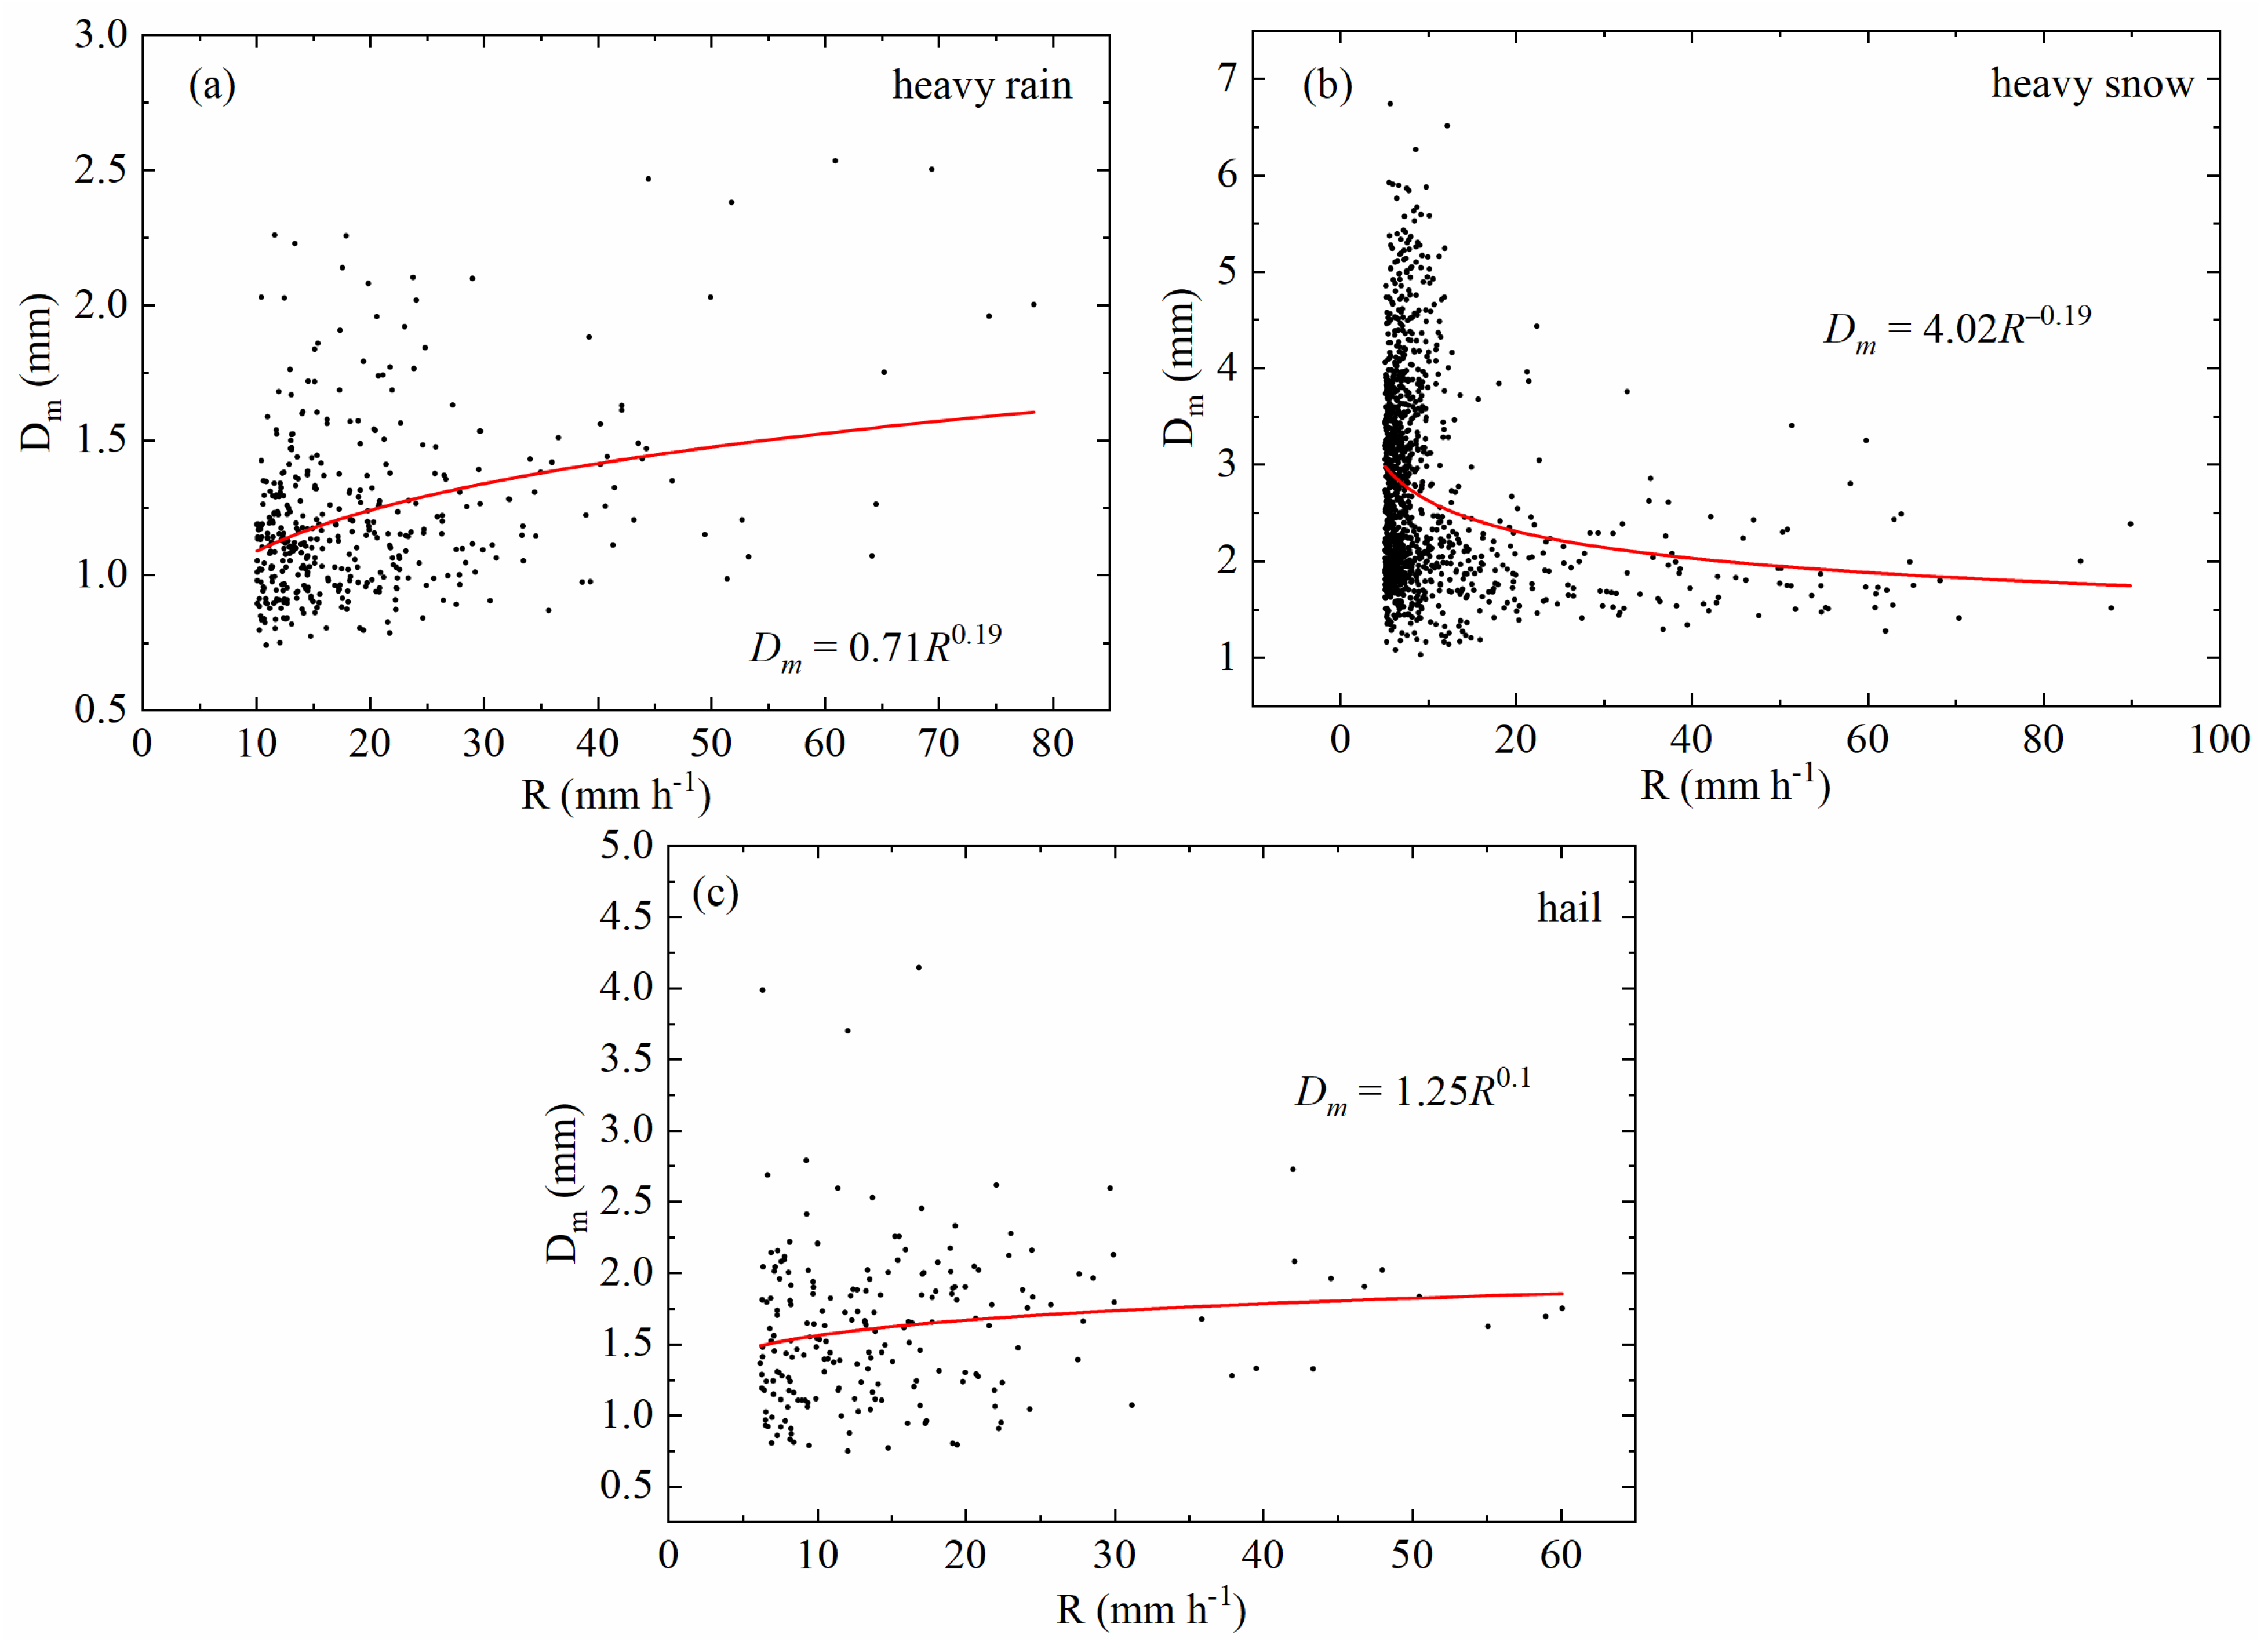
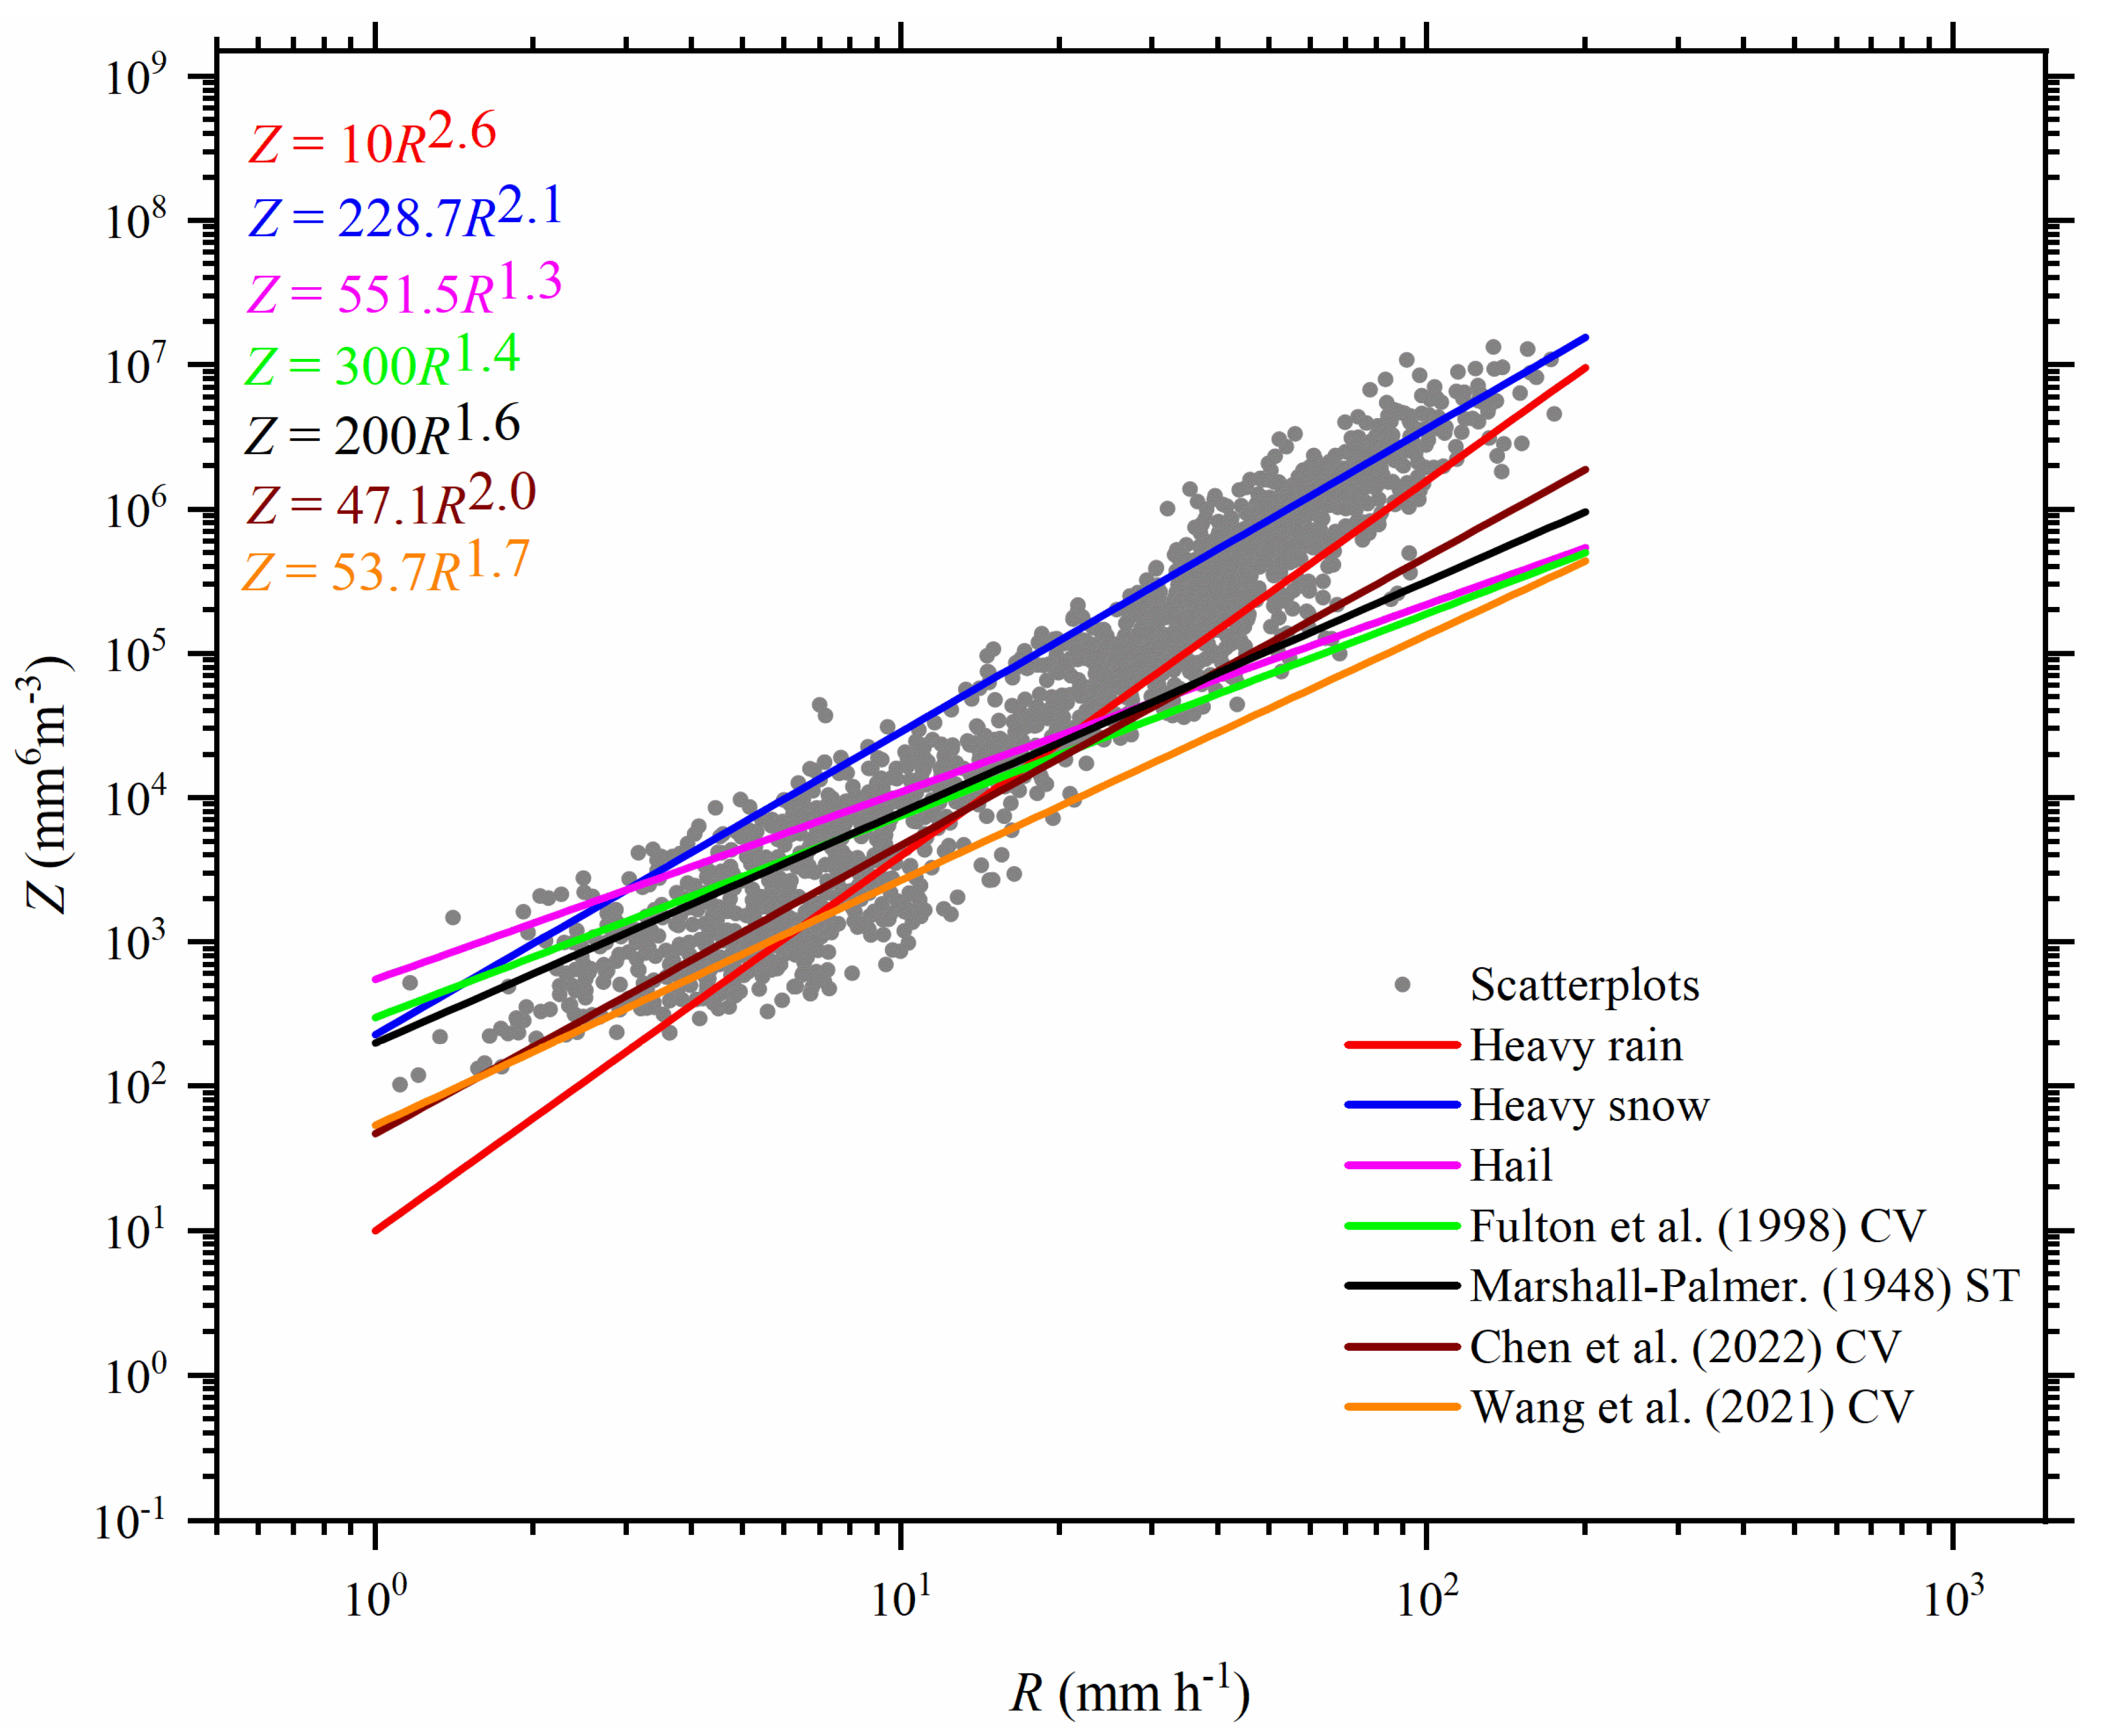
3.3. Z-R Relationship

The exponential relationship between the radar reflectivity and rainfall rate in the study of DSD characteristics provides significant support for the radar quantitative estimation of precipitation. In this section, the R and Z derived from Equations (2) and (5) were applied to analyze the empirical relation of Z–R (Z = ARb) by a least-squares method. Figure 9 shows the Z–R fitting curves and relational expressions of the three heavy precipitation patterns in the study area. In order to facilitate comparison, the mid-latitude convective precipitation relationship (solid green line) Z = 300R1.4 proposed by Fulton et al. [57]; the Z–R relationship (solid burgundy line) Z = 47.1R2.0 proposed by Chen et al. [42] through the study of DSD in the headwaters; and the power law relationship (solid orange line) Z = 53.7R1.7 of Moto convective precipitation over the Tibetan Plateau proposed by Wang et al. [58] are all superimposed on Figure 9.
Compared to the standard empirical relation Z = 300R1.4, similarly to the Z–R relationship for the convective precipitation of the headwaters of the Urumqi River [42], the fitted power law relationships of heavy rain and heavy snow in this work have lower coefficients A (10 and 228.7, respectively) and higher indexes b (2.6 and 2.1, respectively), while the opposite is true for hail events (A = 551.5, b = 1.3). The relationship of Z = 200R1.6 was recommended in mid-latitude areas for stratiform rain [60], it has a higher coefficient and a lower index than heavy rain, and a lower coefficient than hail and heavy snow, indicating that, under the same rainfall rates, heavy snow and heavy rain have lower radar reflectivity than standard empirical relation and the M–P relationship. The Z–R relationship of heavy rain is basically consistent with that of the whole sample, indicating that heavy rain plays a dominant role in total precipitation. When the rainfall rate is larger, there is a larger Z value of heavy snow, and the slope of the heavy rain relationship is larger in this range. This results in heavy rains with lower rainfall intensities having lower Z values than other types of precipitation.

4. Discussion

The DSD characteristics observed in heavy precipitation events in the alpine region of eastern Tianshan, China are studied by using observations from the PWS100. The regional climate of the headwaters can be divided into three types with different scales (mountain dynamic thermodynamic circulation, valley wind circulation, and glacier local circulation). Compared with the lowlands outside the mountains, the precipitation in the area near the glacier shows a different annual variation process. The high-value precipitation in summer is due to the vigorous development of convective clouds caused by strong slope heating, so that local convective precipitation dominates the total summer precipitation. In addition, clouds often touch the slopes of mountainous areas when they are in motion, so small water droplets in clouds or fog can easily fall directly. This kind of precipitation is called horizontal precipitation. On the glaciers and permafrost surfaces of Norway, Iceland, and Spitsbergen, the hoarfrost (different from rime) produced by the contact cooling of moist air from the sea greatly increases the effective precipitation in these alpine latitudes. It is inferred that, when warm air flows over the surface of a glacier in the Central Asia Alpine region, its water vapor condenses directly onto the surface of the glacier, so there is also horizontal precipitation on Urumqi Glacier No. 1.
The DSD datasets observed by the PWS100 indicate that the physical parameters of rain rate (R), liquid water content (W), total concentration of raindrops (Nt), and radar reflectivity factor (Z) are higher in alpine regions (Table 4). Despite mountain regions being influenced by a similar climatic system, the effects of elevation, underlying surface, and topography may be the main reasons for this difference. The DSD of heavy precipitation events in headwaters is more similar to maritime-like clusters, which are connected with the underlying surface. In addition, their Z–R relationship is different from the others. Previous studies showed that, with the variations in climate conditions, elevation, and other possible causes such as quality control, the coefficients and indices will change accordingly.
In order to find out the possible reasons explaining the difference in DSD between the alpine areas and other parts of the Tianshan Mountains, the mean relative humidity (shaded) and mean horizontal wind vectors over central Asia from 2019 to 2022 at the 550 hpa (left) and 850 hpa (right) levels was analyzed using ERA5 reanalysis data as shown in Figure 10. The precipitation in the headwaters of the Urumqi River in the Eastern Tianshan Alpine region is controlled by the northwest air flow in front of the mid-upper trough system (550 hpa) and is accompanied by the closed circulation of the lower atmosphere (850 hpa). Furthermore, in the foothills of the Tianshan Mountains, the northern slope is dominated by west or northwest winds while the southern slope is dominated by mountain breeze or easterly winds at 850 hpa. Global warming will accelerate the water vapor cycle, although the total amount of water in the world has not changed, which can easily cause extreme weather. Another aspect is that the evaporation rate of small raindrops is higher in the foothills, resulting in fewer small raindrops. Meanwhile, a lower temperature, a higher relative humidity, a stronger collision coalescence mechanism, and the phenomena of temperature jump, ice surface inversion, and glacier wind caused by the cooling effect of the surface of the glaciers may be partly responsible for more medium-and large-size raindrops in alpine areas. Moreover, the reduction in air pressure and density in the upper reaches of the Urumqi River affects the microphysical processes of precipitation formation, condensation, and falling velocity. The empirical relationship between the raindrop diameter and terminal velocity at different pressure levels shows that, for large-sized raindrops, the 600 hPa raindrop velocity is expected to increase by 30% compared to the 1000 hPa raindrop velocity. This may also affect the collision breakup mechanism and particle size of raindrops [64]. The results mentioned above may further confirm that the altitude, underlying surface, and orographic effects make the rainfall microphysical parameters such as total number concentration, liquid water content, and mass-weighted mean diameter (Table 4) in the alpine area significantly higher than those in other areas of the Tianshan Mountains [23,61,62], and make the DSD characteristics which are significantly different from the general atmospheric circulation more complicated.

5. Conclusions

Based on the observation data of a disdrometer in the headwaters of the Urumqi River, located in the mountains of eastern Tianshan, the DSD characteristics and the integral parameters of rainfall in the process of heavy precipitation events are studied. The following conclusions can be drawn.
(1) The frequency distribution histogram of the mass-weighted mean diameter (Dm) of heavy rain, heavy snow, and hail is positively skewed, while the frequency distribution histogram of the normalized intercept parameter (log10Nw) is negatively skewed for heavy rain, heavy snow, and hail. The histogram’s mean of Dm for heavy snow is 2.72 mm, which is higher than those for heavy rain (1.21 mm) and hail (1.61 mm), and the histogram’s mean of log10Nw for heavy rain is 4.25, which is higher than those for heavy snow (4.02) and hail (3.80). On the average of the entire dataset, the average values of Dm and log10Nw are similar to those of convectional precipitation in southern China. Furthermore, the Dm–log10Nw scatterplot demonstrates that the heavy precipitation events in the Tianshan Mountains can be identified as maritime-like clusters.
(2) The gaps between heavy rain, heavy snow, and hail precipitation events become wider as the raindrop diameters increase and the spectral widths of heavy snow become even larger than those of heavy rain and hail events. When the drops’ diameters are lower than 1.3 mm, the raindrop concentration of heavy precipitation is the highest, and that of heavy snowfall is the lowest. On the contrary, the raindrop concentration of heavy snow is the highest when the drops are larger than 1.3 mm. The raindrop diameter of 1~3 mm contributes the most to the total concentration of raindrops, accounting for 77.4% of the rain rate, with 2~4 mm accounting for 57.7%. In general, the heavy precipitation at the headwaters is dominated by medium-sized raindrops.
(3) Using the quality-controlled observation data of the disdrometer, the radar reflectivity (Z) and rain rate (R) relationships for heavy rain, heavy snow, and hail are derived during the heavy rainfall process in the alpine mountains of the eastern Tianshan Mountains. Compared with empirical relation for the convective precipitation of the Z–R relationship Z = 300R1.4, the fitted power law relationships of heavy rain and heavy snow in this study have a lower coefficient value of A (10 and 228.7, respectively) and a higher exponent value of b (2.6 and 2.1, respectively), while the opposite is true for hail events (A = 551.5, b = 1.3).
(4) Due to the difference in elevation, the near-surface conditions in the foothills of the Tianshan Mountains are hotter and drier than those in the upper reaches of the Urumqi River Basin in the alpine region during the rainfall period; therefore, the evaporation rate of small raindrops is higher in the foothills, resulting in fewer small raindrops. Meanwhile, a lower temperature, higher relative humidity, and the phenomena of temperature jump, ice surface inversion, and glacier wind caused by the cooling effect of the surface of the glaciers at the headwaters during the rainfall period may be partly responsible for more medium- and large-size raindrops in alpine regions during the rainfall period.
The statistical properties of DSD will help developers improve the accuracy of quantitative precipitation estimation (QPE) products associated with precipitation radar measurements, especially in integrated meteorology radar and the era of global precipitation measurement missions centered on dual-frequency phased-array precipitation radars. What is noteworthy is that the findings of this work are limited to PWS100 disdimeter measurements. Different types of disdrometers (such as 2DVD, OT-parsivel2, and Thies) should also be considered, and more detailed studies are required in future work.

Author Contributions

Conceptualization, P.C., P.W. and Z.L.; methodology, P.C., J.P. and M.Y.; software, P.C. and M.Y.; validation, P.W., H.L. and Z.L.; formal analysis, P.C. and P.W.; investigation, P.C. and Z.L.; resources, P.W.; data curation, P.C., Y.J. and Y.Y.; writing—original draft preparation, P.C.; writing-review and editing, P.C., M.Y. and P.W.; visualization, P.C., H.L. and Y.Y.; supervision, P.W. and Z.L.; project administration, P.W.; funding acquisition, P.W. All authors have read and agreed to the published version of the manuscript.

Funding

This research was jointly funded by Supported by the Third Xinjiang Scientific Expedition Program (Grant No. 2021xjkk0801), the National Natural Science Foundation of China (42371148), the Youth Innovation Promotion Association of the Chinese Academy of Sciences (Y2021110), and the State Key Laboratory of Cryospheric Science (SKLCS-ZZ-2023).

Data Availability Statement

Not applicable.

Conflicts of Interest

The authors declare no conflict of interest.

References

  1. Rincon, R.F.; Lang, R.H. Microwave link dual-wavelength measurements of path-average attenuation for the estimation of drop size distributions and rainfall. IEEE Trans. Geosci. Remote Sens. 2002, 40, 760–770. [Google Scholar] [CrossRef]
  2. Caracciolo, C.; Prodi, F.; Battaglia, A.; Porcu, F. Analysis of the moments and parameters of a gamma DSD to infer precipitation properties: A convective stratiform discrimination algorithm. Atmos. Res. 2006, 80, 165–186. [Google Scholar] [CrossRef]
  3. Zhang, G.; Sun, J.; Brandes, E.A. Improving parameterization of rain microphysics with disdrometer and radar observations. J. Atmos. Sci. 2006, 63, 1273–1290. [Google Scholar] [CrossRef]
  4. Adirosi, E.; Baldini, L.; Lombardo, F.; Russo, F.; Napolitano, F.; Volpi, E.; Tokay, A. Comparison of different fittings of drop spectra for rainfall retrievals. Adv. Water Resour. 2015, 83, 55–67. [Google Scholar] [CrossRef]
  5. Angulo-Martínez, M.; Barros, A.P. Measurement uncertainty in rainfall kinetic energy and intensity relationships for soil erosion studies: An evaluation using PARSIVEL disdrometers in the Southern Appalachian Mountains. Geomorphology 2015, 228, 28–40. [Google Scholar] [CrossRef]
  6. Nanko, K.; Moskalski, S.M.; Torres, R. Rainfall erosivity–intensity relationships for normal rainfall events and a tropical cyclone on the US southeast coast. J. Hydrol. 2016, 534, 440–450. [Google Scholar] [CrossRef]
  7. Wen, J.; Zhao, K.; Huang, H.; Zhou, B.; Yang, Z.; Chen, G.; Wang, M.; Wen, L.; Dai, H.; Xu, L.; et al. Evolution of microphysical structure of a subtropical squall line observed by a polarimetric radar and a disdrometer during OPACC in Eastern China. J. Geophys. Res. Atmos. 2017, 122, 8033–8050. [Google Scholar] [CrossRef]
  8. Kavian, A.; Mohammadi, M.; Cerda, A.; Fallah, M.; Abdollahi, Z. Simulated raindrop’s characteristic measurements. A new approach of image processing tested under laboratory rainfall simulation. Catena 2018, 167, 190–197. [Google Scholar] [CrossRef]
  9. Wang, M.; Zhao, K.; Lee, W.C.; Zhang, F. Microphysical and kinematic structure of convective-scale elements in the inner rainband of Typhoon Matmo (2014) after landfall. J. Geophys. Res. Atmos. 2018, 123, 6549–6564. [Google Scholar] [CrossRef]
  10. Beard, K.V.; Johnson, D.B.; Baumgardner, D. Aircraft observations of large raindrops in warm, shallow, convective clouds. Geophys. Res. Lett. 1986, 13, 991–994. [Google Scholar] [CrossRef]
  11. Ryzhkov, A.V.; Zrnić, D.S. Comparison of dual-polarization radar estimators of rain. J. Atmos. Ocean. Technol. 1995, 12, 249–256. [Google Scholar] [CrossRef]
  12. Ji, L.; Chen, H.; Li, L.; Chen, B.; Xiao, X.; Chen, M.; Zhang, G. Raindrop size distributions and rain characteristics observed by a PARSIVEL disdrometer in Beijing, Northern China. Remote Sens. 2019, 11, 1479. [Google Scholar] [CrossRef]
  13. McFarquhar, G.M.; Hsieh, T.L.; Freer, M.; Mascio, J.; Jewett, B.F. The characterization of ice hydrometeor gamma size distributions as volumes in N0–λ–μ phase space: Implications for microphysical process modeling. J. Atmos. Sci. 2015, 72, 892–909. [Google Scholar] [CrossRef]
  14. Caracciolo, C.; Napoli, M.; Porcù, F.; Prodi, F.; Dietrich, S.; Zanchi, C.; Orlandini, S. Raindrop size distribution and soil erosion. J. Irrig. Drain. Eng. 2012, 138, 461–469. [Google Scholar] [CrossRef]
  15. Saygin, S.D.; Erpul, G. Modeling aggregate size distribution of eroded sediment resulting from rain-splash and raindrop impacted flow processes. Int. J. Sediment Res. 2019, 34, 166–177. [Google Scholar] [CrossRef]
  16. Janapati, J.; Seela, B.K.; Lin, P.L.; Wang, P.K.; Kumar, U. An assessment of tropical cyclones rainfall erosivity for Taiwan. Sci. Rep. 2019, 9, 15862. [Google Scholar] [CrossRef]
  17. Bringi, V.N.; Chandrasekar, V.; Hubbert, J.; Gorgucci, E.; Randeu, W.L.; Schoenhuber, M. Raindrop size distribution in different climatic regimes from disdrometer and dual-polarized radar analysis. J. Atmos. Sci. 2003, 60, 354–365. [Google Scholar] [CrossRef]
  18. Krishna UV, M.; Reddy, K.K.; Seela, B.K.; Shirooka, R.; Lin, P.L.; Pan, C.J. Raindrop size distribution of easterly and westerly monsoon precipitation observed over Palau islands in the Western Pacific Ocean. Atmos. Res. 2016, 174, 41–51. [Google Scholar] [CrossRef]
  19. Janapati, J.; Reddy, V.; Reddy, K.; Lin, P.L.; Liu, C.Y. A study on raindrop size distribution variability in before and after landfall precipitations of tropical cyclones observed over southern India. J. Atmos. Sol.-Terr. Phys. 2017, 159, 23–40. [Google Scholar] [CrossRef]
  20. Seela, B.K.; Janapati, J.; Lin, P.L.; Reddy, K.K.; Shirooka, R.; Wang, P.K. A comparison study of summer season raindrop size distribution between Palau and Taiwan, two islands in western Pacific. J. Geophys. Res. Atmos. 2017, 122, 787-11,805. [Google Scholar] [CrossRef]
  21. Sumesh, R.K.; Resmi, E.A.; Unnikrishnan, C.K.; Jash, D.; Sreekanth, T.S.; Resmi, M.M.; Rajeevan, k.; Nita, S.; Ramachandran, K.K. Microphysical aspects of tropical rainfall during Bright Band events at mid and high-altitude regions over Southern Western Ghats, India. Atmos. Res. 2019, 227, 178–197. [Google Scholar] [CrossRef]
  22. Zhang, Y.; Han, H.; Kang, X.; Tian, J.; Guo, S. Characteristics of Raindrop Size Distribution for Different Precipitation Clouds in Longbao Area of the Three-River Source Region. Plateau Mt. Meteorol. Res. 2022, 42, 24–29. [Google Scholar]
  23. Zeng, Y.; Yang, L.; Zhou, Y.; Tong, Z.; Jiang, Y.; Chen, P. Characteristics of orographic raindrop size distribution in the Tianshan Mountains, China. Atmos. Res. 2022, 278, 106332. [Google Scholar] [CrossRef]
  24. Luo, L.; Xiao, H.; Yang, H.; Chen, H.; Guo, J.; Sun, Y.; Feng, L. Raindrop size distribution and microphysical characteristics of a great rainstorm in 2016 in Beijing, China. Atmos. Res. 2020, 239, 104895. [Google Scholar] [CrossRef]
  25. Zhao, S.X.; Sun, J.H.; Lu, R.; Fu, S. Analysis of the 20 July 2016 unusual heavy rainfall in North China and Beijing. Meteorol. Mon. 2018, 44, 351–360. [Google Scholar]
  26. Min, A.; Liao, Y.; Deng, W. The analysis of the distribution and trend for heavy rainfall based on the precipitation data from 2008 to 2013 in China. Torrential Rain Disasters 2016, 35, 576–584. [Google Scholar]
  27. Chen, G.; Lu, Y.; Hua, S.; Liu, Q.; Zhao, K.; Zheng, Y.; Wang, M.; Zhang, S.; Wang, X. Evaluating the Variability of Simulated Raindrop Size Distributions in the “21· 7” Henan Extremely Heavy Rainfall Event. Geophys. Res. Lett. 2023, 50, e2023GL102849. [Google Scholar] [CrossRef]
  28. McFarquhar, G.M. Raindrop size distribution and evolution. Rainfall State Sci. 2010, 191, 49–60. [Google Scholar]
  29. Ding, J.; Tian, W.; Xiao, H.; Cheng, B.; Liu, L.; Sha, X.; Song, C.; Sun, Y.; Shu, W. Raindrop size distribution and microphysical features of the extremely severe rainstorm on 20 July 2021 in Zhengzhou, China. Atmos. Res. 2023, 289, 106739. [Google Scholar] [CrossRef]
  30. Dolan, B.; Fuchs, B.; Rutledge, S.A.; Barnes, E.A.; Thompson, E.J. Primary modes of global drop size distributions. J. Atmos. Sci. 2018, 75, 1453–1476. [Google Scholar] [CrossRef]
  31. Hamada, A.; Takayabu, Y.N.; Liu, C.; Zipser, E.J. Weak linkage between the heaviest rainfall and tallest storms. Nat. Commun. 2015, 6, 6213. [Google Scholar] [CrossRef] [PubMed]
  32. Murata, F.; Terao, T.; Chakravarty, K.; Syiemlieh, H.J.; Cajee, L. Characteristics of orographic rain drop-size distribution at Cherrapunji, Northeast India. Atmosphere 2020, 11, 777. [Google Scholar] [CrossRef]
  33. Xu, W.; Chen, H.; Wei, H.; Luo, Y.; Zhao, T. Extreme precipitation produced by relatively weak convective systems in the tropics and subtropics. Geophys. Res. Lett. 2022, 49, e2022GL098048. [Google Scholar] [CrossRef]
  34. Sorg, A.; Bolch, T.; Stoffel, M.; Solomina, O.; Beniston, M. Climate change impacts on glaciers and runoff in Tien Shan (Central Asia). Nat. Clim. Change 2012, 2, 725–731. [Google Scholar] [CrossRef]
  35. Chen, Y.; Li, W.; Deng, H.; Fang, G.; Li, Z. Changes in Central Asia’s water tower: Past, present and future. Sci. Rep. 2016, 6, 35458. [Google Scholar] [CrossRef] [PubMed]
  36. Campos, E.F.; Zawadzki, I.; Petitdidier, M.; Fernandez, W. Measurement of raindrop size distributions in tropical rain at Costa Rica. J. Hydrol. 2006, 328, 98–109. [Google Scholar] [CrossRef]
  37. Dai, Q.; Zhu, J.; Zhang, S.; Zhu, S.; Han, D.; Lv, G. Estimation of rainfall erosivity based on WRF-derived raindrop size distributions. Hydrol. Earth Syst. Sci. 2020, 24, 5407–5422. [Google Scholar] [CrossRef]
  38. Zeng, Y.; Yang, L.; Tong, Z.; Jiang, Y.; Zhang, Z.; Zhang, J.; Zhou, Y.; Li, J.; Liu, F.; Liu, J. Statistical characteristics of raindrop size distribution during rainy seasons in Northwest China. Adv. Meteorol. 2021, 2021, 6667786. [Google Scholar] [CrossRef]
  39. Chang, Y.; Ma, Q.; Guo, L.; Duan, J.; Li, J.; Zhang, X.; Guo, X.; Lou, X.; Chen, B. Characteristics of raindrop size distributions during Meiyu season in Mount Lushan, eastern China. J. Meteorol. Soc. Japan. Ser. II 2022, 100, 57–76. [Google Scholar] [CrossRef]
  40. Kim, H.J.; Jung, W.; Suh, S.H.; Lee, D.I.; You, C.H. The characteristics of raindrop size distribution at windward and leeward side over mountain area. Remote Sens. 2022, 14, 2419. [Google Scholar] [CrossRef]
  41. Mao, W.; Zhang, W.; Kou, M. Statistical characteristics of raindrop size distribution during rainy seasons in Complicated Mountain Terrain. Hydrol. Earth Syst. Sci. Discuss. 2022, 1–24. [Google Scholar] [CrossRef]
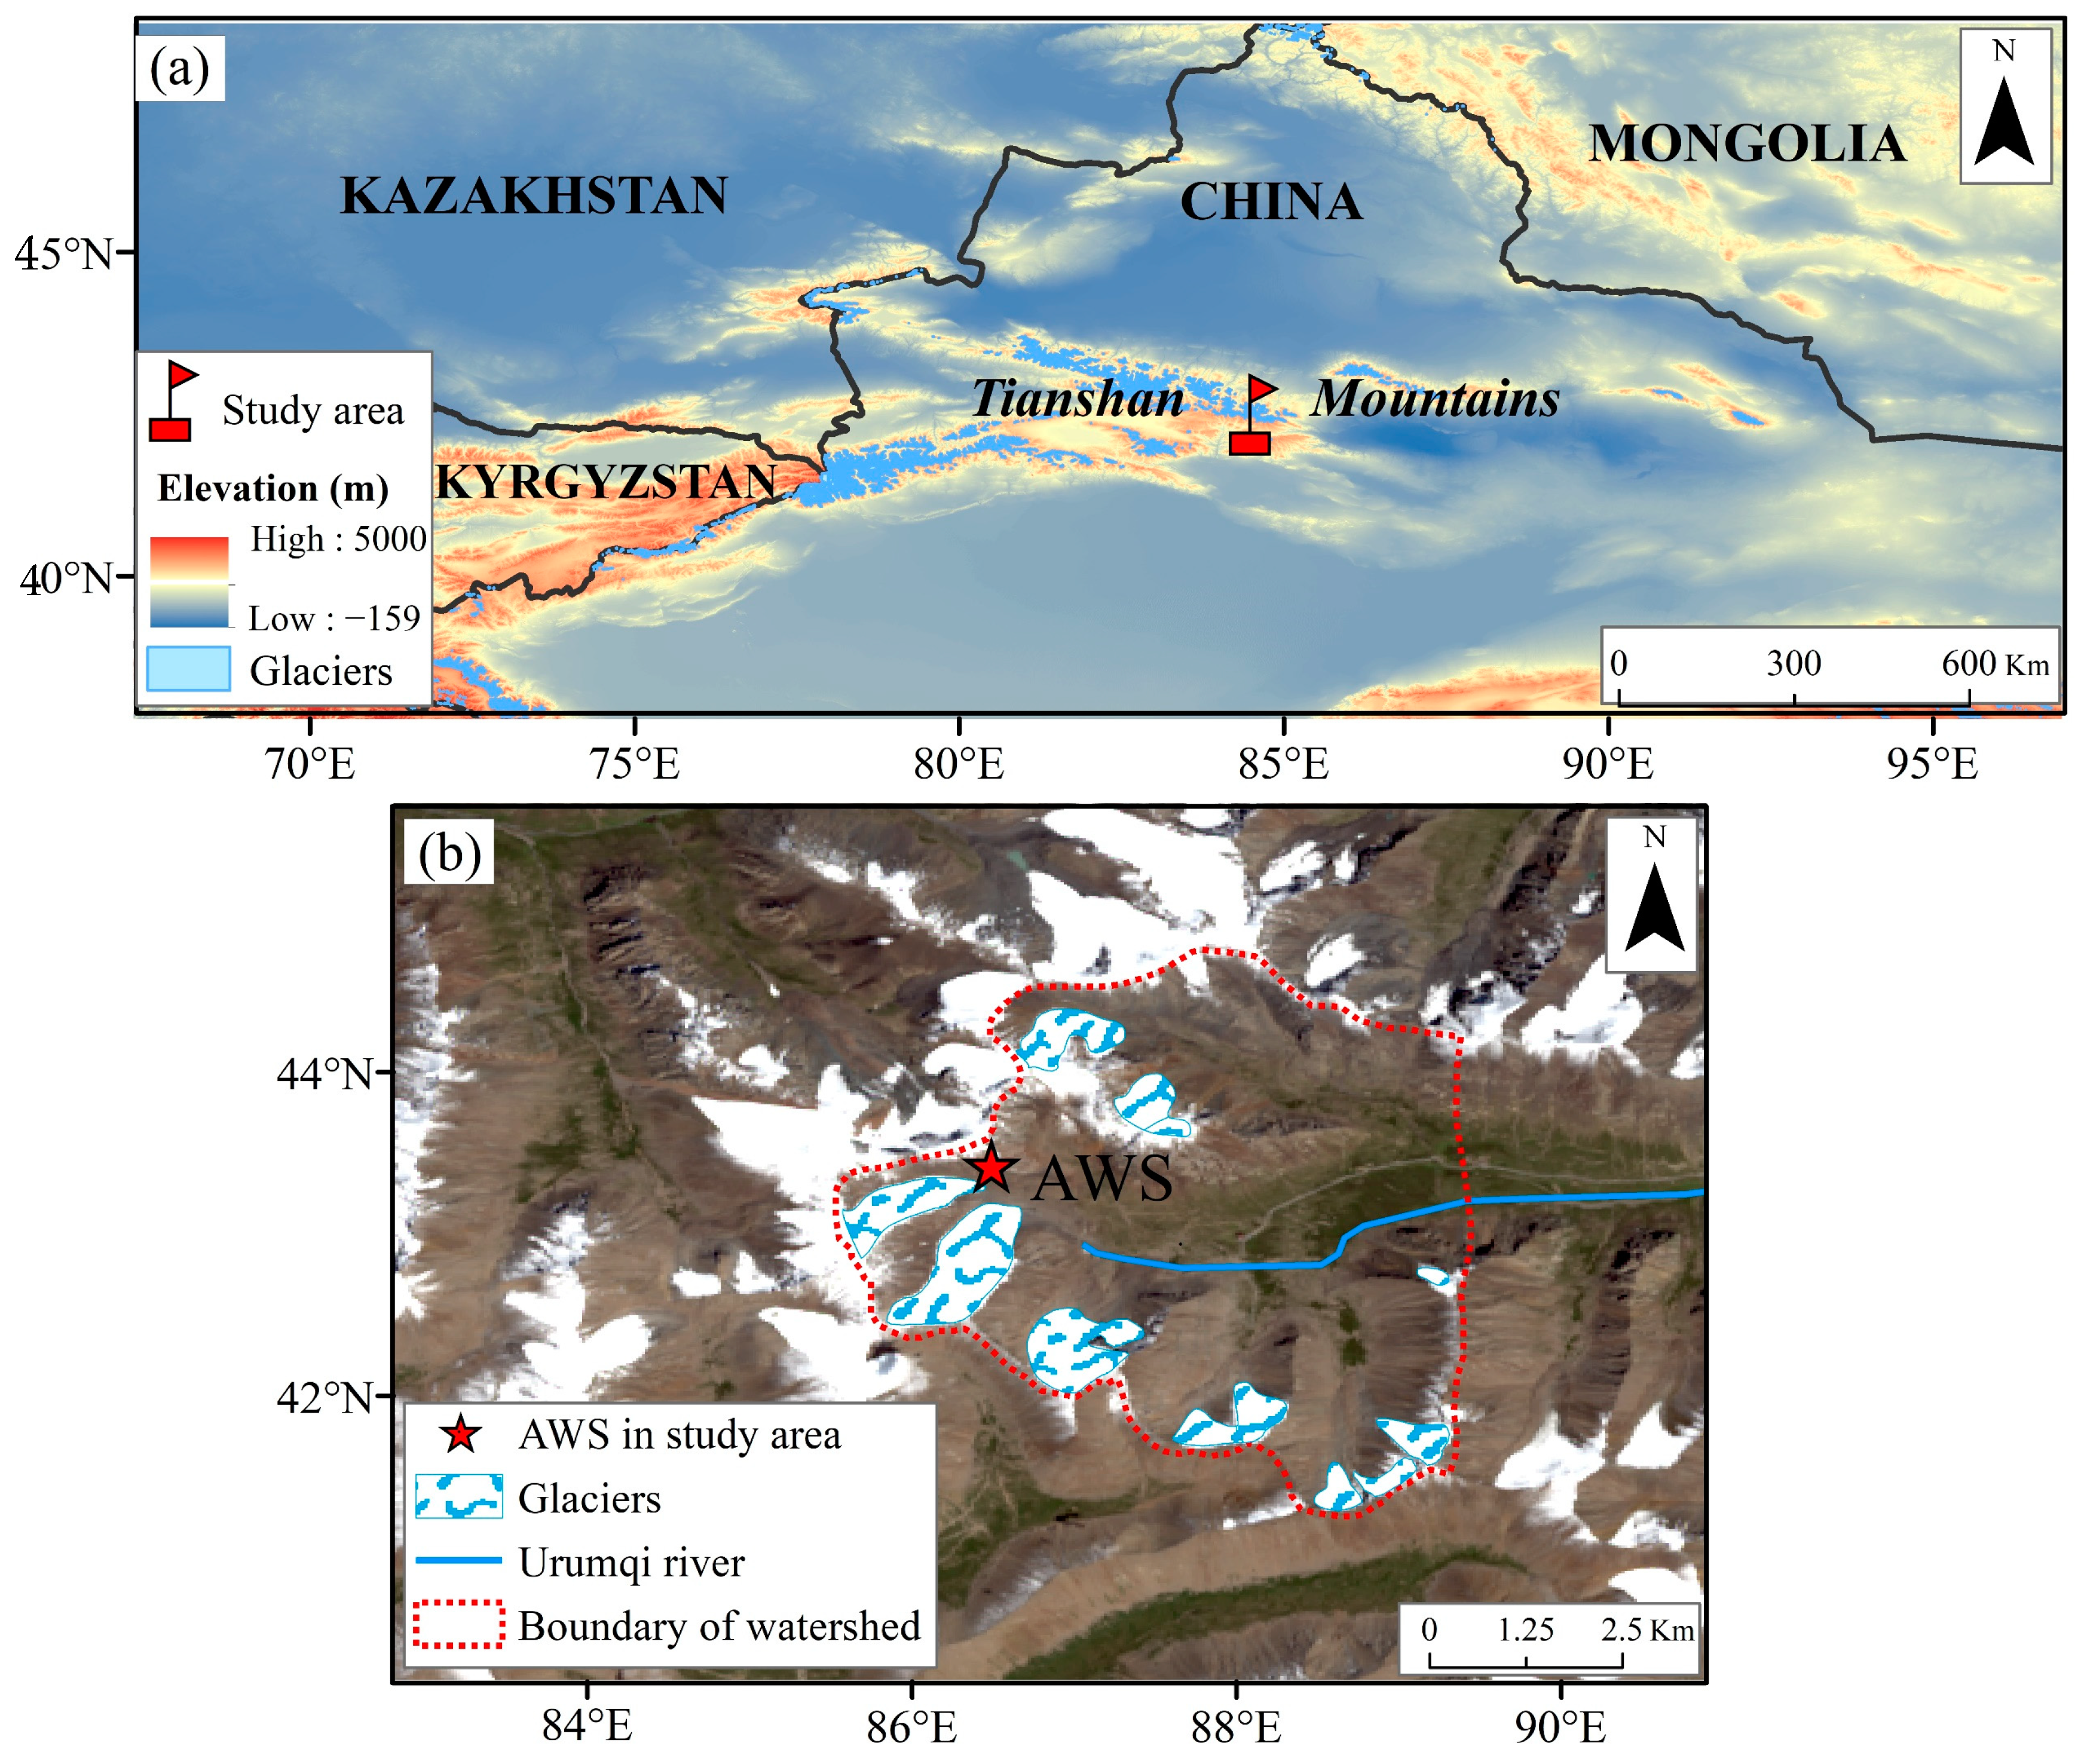
  42. Chen, P.; Li, Z.; Wang, P.; Yang, M.; Jia, Y.; Peng, J. Raindrop size distribution characteristics in summer of a nival glacial zone in eastern Tianshan, Central Asia. Front. Earth Sci. 2022, 10, 976732. [Google Scholar] [CrossRef]
  43. Tstsuo, O.; Bai, Z.; Ding, L. Development of Local Climate in the Glaciated Area in the Head of Urumqi River. J. Glaciol. Geocryol. 1989, 11, 325–335. [Google Scholar]
  44. Zhang, D.; Zhou, S. Quantitative Analysis of the Glacial Effect on Precipitation of Glacier No.1 at the Headwaters of the Urumqi River, Tianshan Mountains. J. Glaciol. Geocryol. 2000, 22, 243–249. [Google Scholar]
  45. Zhang, D.; Ming, J.; Wei, W. Microclimate measurements related to glacier cooling effect at No. 1 glacier, headwater of Urumqi River, Tianshan Mountains. Arid. Land Geo 2011, 34, 449–457. [Google Scholar]
  46. Li, Z.; Wang, W.; Zhang, M.; Wang, F.; Li, H. Observed changes in streamflow at the headwaters of the Urumqi River, eastern Tianshan, central Asia. Hydrol. Process. Int. J. 2010, 24, 217–224. [Google Scholar] [CrossRef]
  47. Johannsen, L.L.; Zambon, N.; Strauss, P.; Dostal, T.; Neumann, M.; Zumr, D.; Cochrane, T.A.; Blöschl, G.; Klik, A. Comparison of three types of laser optical disdrometers under natural rainfall conditions. Hydrol. Sci. J. 2020, 65, 524–535. [Google Scholar] [CrossRef]
  48. Ellis, R.A.; Sandford, A.P.; Jones, G.E.; Richards, J.; Petzing, J.; Coupland, J.M. New laser technology to determine present weather parameters. Meas. Sci. Technol. 2006, 17, 1715. [Google Scholar] [CrossRef]
  49. Ulbrich, C.W. Natural variations in the analytical form of the raindrop size distribution. J. Clim. Appl. Meteorol. 1983, 22, 1764–1775. [Google Scholar] [CrossRef]
  50. Ulbrich, C.W.; Atlas, D. Rainfall microphysics and radar properties: Analysis methods for drop size spectra. J. Appl. Meteorol. 1998, 37, 912–923. [Google Scholar] [CrossRef]
  51. Zhang, G.; Vivekanandan, J.; Brandes, E.A.; Meneghini, R.; Kozu, T. The shape–slope relation in observed gamma raindrop size distributions: Statistical error or useful information? J. Atmos. Ocean. Technol. 2003, 20, 1106–1119. [Google Scholar] [CrossRef]
  52. Montero-Martínez, G.; Gómez-Balvás, S.S.; García-García, F. Study of rain classification and the tendency of gamma DSD parameterizations in Mexico. Atmos. Res. 2021, 252, 105431. [Google Scholar] [CrossRef]
  53. Willis, P.T. Functional fits to some observed drop size distributions and parameterization of rain. J. Atmos. Sci. 1984, 41, 1648–1661. [Google Scholar] [CrossRef]
  54. Testud, J.; Oury, S.; Black, R.A.; Amayenc, P.; Dou, X. The concept of “normalized” distribution to describe raindrop spectra: A tool for cloud physics and cloud remote sensing. J. Appl. Meteorol. Climatol. 2001, 40, 1118–1140. [Google Scholar] [CrossRef]
  55. Campbell Scientific, Inc. PWS100 Present Weather Sensor; Instruction Manual. Revision 9/15; Campbell Scientific, Inc.: Logan, UT, USA, 2012. [Google Scholar]
  56. Chen, B.; Yang, J.; Pu, J. Statistical characteristics of raindrop size distribution in the Meiyu season observed in eastern China. J. Meteorol. Soc. Japan. Ser. II 2013, 91, 215–227. [Google Scholar] [CrossRef]
  57. Fulton, R.A.; Breidenbach, J.P.; Seo, D.J.; Miller, D.A.; O’Bannon, T. The WSR-88D rainfall algorithm. Weather. Forecast. 1998, 13, 377–395. [Google Scholar] [CrossRef]
  58. Wang, G.; Zhou, R.; Zhaxi, S.; Liu, S. Raindrop size distribution measurements on the Southeast Tibetan Plateau during the STEP project. Atmos. Res. 2021, 249, 105311. [Google Scholar] [CrossRef]
  59. Zhang, A.; Hu, J.; Chen, S.; Hu, D.; Liang, Z.; Huang, C.; Xiao, L.; Min, C.; Li, H. Statistical characteristics of raindrop size distribution in the monsoon season observed in southern China. Remote Sens. 2019, 11, 432. [Google Scholar] [CrossRef]
  60. Marshall, J.S.; Palmer, W.M.K. The distribution of raindrops with size. J. Atmos. Sci. 1948, 5, 165–166. [Google Scholar] [CrossRef]
  61. Zeng, Y.; Yang, L.; Tong, Z.; Jiang, Y.; Chen, P.; Zhou, Y. Characteristics and Applications of Summer Season Raindrop Size Distributions Based on a PARSIVEL2 Disdrometer in the Western Tianshan Mountains (China). Remote Sens. 2022, 14, 3988. [Google Scholar] [CrossRef]
  62. Zeng, Y.; Yang, L.; Zhou, Y.; Tong, Z.; Jiang, Y. Statistical Characteristics of Summer Season Raindrop Size Distribution in the Western and Central Tianshan Mountains in China. J. Meteorol. Soc. Japan. Ser. II 2022, 100, 855–872. [Google Scholar] [CrossRef]
  63. Chen, B.; Hu, Z.; Liu, L.; Zhang, G. Raindrop size distribution measurements at 4,500 m on the Tibetan Plateau during TIPEX-III. J. Geophys. Res. Atmos. 2017, 122, 11092–11106. [Google Scholar] [CrossRef]
  64. Porcù, F.; D’adderio, L.P.; Prodi, F.; Caracciolo, C. Effects of altitude on maximum raindrop size and fall velocity as limited by collisional breakup. J. Atmos. Sci. 2013, 70, 1129–1134. [Google Scholar] [CrossRef]
Figure 1. (a) Locations of the study area (the red flag) and the topography (m) of the Tianshan Mountains; (b) headwaters of the Urumqi River; the red star indicates the automatic weather station (AWS) where PWS100 is located.
Remotesensing 15 05068 g001
Figure 2. (a) PWS100 disdrometer, (b,c) photography of hail taken at the study area.
Remotesensing 15 05068 g002
Figure 3. Frequency distribution histogram of Dm (left side) and log10Nw (right side) for the (a,b) whole dataset and (c,d) heavy rain, (e,f) heavy snow, and (g,h) hail subsets. The black curve represents the normal distribution curve.
Remotesensing 15 05068 g003
Figure 4. Scatterplots of Dm vs. R for (a) heavy rain, (b) heavy snow, and (c) hail types. The red line represents the fitted power law relationships.
Remotesensing 15 05068 g004
Figure 5. Scatter plots of Nw vs. R for (a) heavy rain, (b) heavy snow, and (c) hail types. The red line represents the fitted power law relationships.
Remotesensing 15 05068 g005
Figure 6. Scatterplots of Dm and log10Nw for heavy rain, heavy snow, and hail events. The dark grey rectangles correspond to the maritime and continental convective clusters presented by Bringi et al. [17]. The triangle symbols represent the average value of convective precipitation in different regions investigated by Chen et al. [42], Wang et al. [58], Zhang et al. [59] and Wen et al. [7], respectively. The solid circles represent the average values of heavy rain, heavy snow, and hail events.
Remotesensing 15 05068 g006
Figure 7. Raindrop size distribution for heavy rain (blue), heavy snow (red), and hail (dark grey).
Remotesensing 15 05068 g007
Figure 8. The relative contribution of each size category to the rainfall rate and total precipitation contribution in the source region of the Urumqi River.
Remotesensing 15 05068 g008
Figure 9. Scatterplots of Z vs. R for heavy rain, heavy snow, and hail. The red, blue, and purple solid lines indicate the fitting power-law relationships of heavy rain, heavy snow, and hail, respectively. Previous results of Fulton et al. [57], Marshall-Palmer. [60], Chen et al. [42] and Wang et al. [58] for stratiform (ST) and convective (CV) rainfall are presented with corresponding colors.
Remotesensing 15 05068 g009
Figure 10. Relative humidity (shaded) and horizontal wind vectors over central Asia at 550 hpa (left) and 850 hpa (right) level by using ERA5 reanalysis data.
Remotesensing 15 05068 g010
Table 1. Datasets.
Table 1. Datasets.
Precipitation PatternNo. of Rain EventsNo. of Minute SpectraRain Accumulation (mm)Rain Rate (mm h−1)
Heavy rainfall43931176.619.4
Heavy snow692266277.410.6
Hail3165167.415.4
Table 2. Intensity bounds of heavy rainfall, heavy snow, and hail.
Precipitation PatternIntensity Bounds of Rain, Snow and Hail (mm h−1)
Heavy rainfallR ≥ 10.0
Heavy snowR ≥ 5.0
HailR ≥ 6.7
Table 3. Physical Parameters of Raindrop Spectrum under Different Rain Types 1.
Rain TypeNtWZDmLog10NwN0μΛ
m−3g m−3dBZmmNw in m−3mm−1m−3mm−(1+μ) mm−1
Heavy rain6150.4931.31.214.253,845,0436.908.39
Heavy snow8157.6752.32.724.0230794.842.67
Hail3310.5434.71.613.80272,2877.886.80
Whole7195.3445.82.284.05---
1 Parameters Nt, W, Z, Dm, Nw, N0, μ, and Λ are total number concentration, liquid water content, radar reflectively factor, mass-weighted mean diameter, normalized intercept parameter, intercept parameter, shape parameter, and slope parameter, respectively.
Table 4. Comparison of physical parameters 1 of convective precipitation.
Location CloudRNtWZDmLog10Nw
mm h−1m−3g m−3dBZmmNw in m−3mm−1
Zhuhai, GuangdongZhang et al. (2019) [59]CV32.67588.07-2.214.36
Shunyi, BeijingWen et al. (2017) [7]CV17.615220.8642.11.78-
Zhaosu, XinjiangZeng et al. (2022) [61]CV13.6-0.5640.22.113.44
Urumqi, XinjiangZeng et al. (2022) [62]CV--0.6938.11.563.97
Nilek, XinjiangZeng et al. (2022) [62]CV--0.5440.22.083.36
Naqu, XizangChen et al. (2017) [63]CV-4510.3639.81.873.4
Motuo, XizangWang et al. (2021) [58]CV-7930.4736.01.423.98
Urumqi River source areaThis study-29.67195.3445.82.284.05
Note: “-” indicates a null value, and “CV” means convective precipitation. 1 Parameters R, Nt, W, Z, Dm, and Nw are rain rate, total number concentration, liquid water content, radar reflectively factor, mass-weighted mean diameter, and normalized intercept parameter, respectively.
Disclaimer/Publisher’s Note: The statements, opinions and data contained in all publications are solely those of the individual author(s) and contributor(s) and not of MDPI and/or the editor(s). MDPI and/or the editor(s) disclaim responsibility for any injury to people or property resulting from any ideas, methods, instructions or products referred to in the content.

