Article

Assessment of Spatio-Temporal Variations in PM2.5 and Associated Long-Range Air Mass Transport and Mortality in South Asia

1
Media Lab, Massachusetts Institute of Technology, Cambridge, MA 02139, USA
2
Department of Environmental Science and Resource Management, Mawlana Bhashani Science and Technology University, Tangail 1902, Bangladesh
3
Department of Geosciences, Florida Atlantic University, Boca Raton, FL 33431, USA
4
Department of Political Science and Geography, Old Dominion University, Norfolk, VA 23529, USA
*
Author to whom correspondence should be addressed.
Remote Sens. 2023, 15(20), 4975; https://doi.org/10.3390/rs15204975
Submission received: 17 July 2023 / Revised: 3 October 2023 / Accepted: 12 October 2023 / Published: 16 October 2023

Abstract

:
Fine particulate matter (PM2.5) is associated with adverse impacts on ambient air quality and human mortality; the situation is especially dire in developing countries experiencing rapid industrialization and urban development. This study assessed the spatio-temporal variations of PM2.5 and its health impacts in the South Asian region. Both satellite and station-based data were used to monitor the variations in PM2.5 over time. Additionally, mortality data associated with ambient particulate matter were used to depict the overall impacts of air pollution in this region. We applied the Mann–Kendall and Sen’s slope trend analysis tool to investigate the trend of PM2.5. At the same time, clustering of backward trajectories was used for identifying the long-range air mass transport. The results revealed that the mean annual PM2.5 mass concentration was the highest (46.72 µg/m3) in Bangladesh among the South Asian countries during 1998–2019, exceeding the national ambient air quality standards of Bangladesh (i.e., 15 µg/m3) and WHO (10 µg/m3), while lower PM2.5 was observed in the Maldives and Sri Lanka (5.35 µg/m3 and 8.69 µg/m3, respectively) compared with the WHO standard. The trend analysis during 1998–2019 suggested that all South Asian countries except the Maldives experienced an increasing trend (p < 0.05) of PM2.5. The study showed that among the major cities, the mean annual PM2.5 value was the highest in New Delhi (110 µg/m3), followed by Dhaka (85 µg/m3). Regarding seasonal variation, the highest PM2.5 was found during the pre-monsoon season in all cities. The findings of this research would help the concerned governments of South Asian countries to take steps toward improving air quality through policy interventions or reforms. Moreover, the results would provide future research directions for studying the trend and transport of atmospheric PM2.5 in other regions.

Graphical Abstract

1. Introduction

Air pollution poses a serious threat to the environment and global public health. Approximately 16% of worldwide annual mortality has been related to air pollutant exposure via inhalation of toxic air [1]. Among various atmospheric pollutants, particulate matter (PM) has been receiving substantial attention worldwide because of its high potential to cause severe health problems, environmental (haze) pollution, and economic losses [2,3,4]. More emphasis has been placed on particulate matter pollution because research has demonstrated more robust associations between elevated fine PM concentrations and negative health impacts [5].
South Asia is one of the most densely populated regions, with 22% of the world’s population living on approximately 3% of the global landmass [6]. According to the WHO (2016), 10 out of 20 of the world’s most polluted cities in terms of PM2.5 are located in South Asia [7]. All South Asian countries (Afghanistan, Bangladesh, Bhutan, India, Maldives, Nepal, Pakistan, and Sri Lanka) are currently experiencing rapid economic development and are involved in industrialization, urbanization, and other development activities that result in large amounts of air pollutant emissions, including PM2.5 [6,
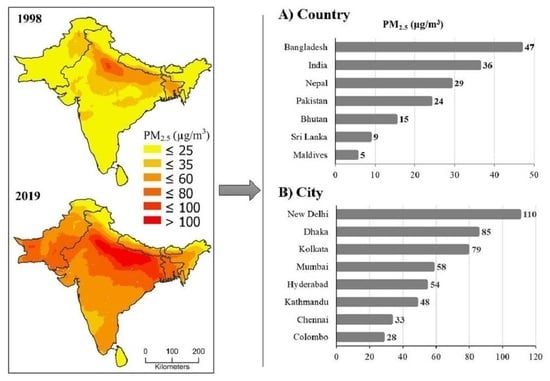
8]. However, these countries lack adequate technologies and structure for implementing existing air pollution control policies or regulations, resulting in poor ambient air quality (AAQ) standards compared with the WHO-recommended AAQ standards. For instance, the mean PM2.5 (µg/m3) in Bangladesh, India, Pakistan, and Sri Lanka ranges between 15–40 (annual) and 35–65 µg/m3 (24 h), which exceeds the WHO-recommended AAQ standards (i.e., 10 and 25 µg/m3, respectively) [9,10,11,12].
Consequently, deaths attributed to ambient PM2.5 exposure have increased in the South Asian region over the last few decades. A recent study by Krishna et al. (2017) found that the third-ranking risk factor for mortality in South Asia was exposure to ambient PM2.5 in 2015 [13]. They also found that Bangladesh, India, and Pakistan have a higher burden of PM2.5 exposure due to larger populations and increased growth. David et al. (2019) reported 1.1 million annual premature deaths caused by PM2.5 exposure in India [14], whereas Shi et al. (2018) reported 163,000, 134,600, and 16,200 premature deaths annually in Bangladesh, Pakistan, and Nepal, respectively [15]. A study by Xue et al. [16] estimated the impact of ambient air pollution on pregnancy losses in South Asia. They revealed approximately 349,681 pregnancy losses are attributed to air pollution each year in Bangladesh, India, and Pakistan. Thus, PM2.5 and associated risks are continuously receiving more attention from public health experts, governments, and international bodies worldwide in the effort to control ambient PM2.5 emissions at local, regional, and global scales [17]. In South Asia, collective regional action is needed to monitor and regulate air pollution. Countries have implemented particulate monitoring programs in recent years, but such initiatives have lacked the comprehensive regional coordination necessary to effect lasting change.
The South Asian population is among the most heavily exposed to PM2.5 worldwide [13]. In 2015, the Global Burden of Disease (GBD) study indicated that the population-weighted mean PM2.5 concentration in South Asia was 73 μg/m3, or 63.3% of the global average of 44 µg/m3. This study also reported that population-weighted PM2.5 concentrations increased by 24% in South Asia between 1990 and 2015. Increased exposure to particulate matter pollution can cut life expectancy by more than five years per person in South Asia. According to the latest Air Quality Life Index developed by the University of Chicago, the countries, including Bangladesh, India, Nepal, and Pakistan, account for more than half of the total life years lost globally to pollution. Bangladesh alone loses 6.8 years of life on average per person, compared to 3.6 months in the United States [18]. It is evident that the sources of ambient air pollution vary across the region and rural and urban settings [13,19]. Therefore, developing an understanding of the spatiotemporal distribution of PM2.5 at local and regional scales is necessary to model the pollution status and dynamics of specific sites, and in the design and implementation of site-specific policies to control PM2.5 pollution.
Data derived from satellite and ground-station monitoring provide insights into PM2.5 exposure, but the quality and availability of datasets vary regionally. Given the high expense of establishing and maintaining in situ measurement stations, satellite retrieval of PM2.5 is a cost-efficient alternative for PM2.5 monitoring at a large spatio-temporal scale. Despite substantial monitoring efforts over past decades, observational networks are not dense enough to examine the spatial distribution of air pollutants in South Asia [20]. Satellite data provide a means to fill this gap. The integration of in situ and satellite observations of air pollution has significantly improved monitoring efforts, with in situ data providing important data validation.
This study aimed to explore the spatiotemporal variations of PM2.5 concentrations in South Asian countries using both in situ and satellite data. Per our review of current literature, few studies have been conducted to comprehensively assess the long-term and large-scale spatiotemporal variations in PM2.5 pollution in South Asia using both in situ and satellite measurements of PM2.5. Additionally, the origin and long-range transport of PM2.5 pollution and the number of deaths associated with ambient particulate matter in the South Asian countries were also investigated in this study. The specific objectives of this study were to (1) reveal the spatiotemporal characteristics of PM2.5 concentrations in South Asian countries between 1998–2019 using satellite data, (2) examine the spatiotemporal changes in PM2.5 concentrations in major South Asian cities between 2016–2019 using in situ measurements, and (3) assess the long-range transport of particulate mass to the South Asian cities. The results of this study will aid in understanding the characteristics of the long-term trends of PM2.5 in South Asia and their health effects on massive regional populations. It will also inform the design of effective strategies to mitigate air pollution and its health damage in this region and developing countries elsewhere.

2. Materials and Methods

This study assesses the dynamics of PM2.5 pollution in South Asian countries using both in situ and satellite-based observations. The South Asian region is one of the most polluted regions in the world. The monsoon plays an important role in air quality in this region. According to a study by Lelieveld et al. [21], the South Asian monsoon not only efficiently purifies the air of pollutants but also distributes them across the globe. The South Asian monsoon is a critical weather phenomenon for the region, as it brings most of the annual rainfall needed for agriculture and sustenance. It is a seasonal wind pattern characterized by a shift in the direction of prevailing winds. The monsoon in South Asia typically lasts from June to September [22]. However, the monsoon can also lead to flooding and other weather-related challenges, making it both a blessing and a challenge for the people of South Asia. The Himalayan Mountain range plays a significant role in influencing the direction and intensity of the monsoon winds in this region.

2.1. Satellite Observed PM2.5 Data

High spatial resolution (0.01° × 0.01°) PM2.5 concentration data from 1998–2019 were acquired from the Socioeconomic Data and Applications Center (SEADC) at Columbia University (available at https://sedac.ciesin.columbia.edu/, accessed on 22 September 2022) [23]. This global annual PM2.5 dataset combines Aerosol Optical Depth (AOD) retrievals from multiple satellite instruments by means of Geographically Weighted Regression and incorporates data from the Moderate Resolution Imaging Spectroradiometer (MODIS), Multiangle Imaging Spectro Radiometer (MISR), and Sea-Viewing Wide Field-of-View Sensor (SeaWiFS). The GEOS-Chem chemical transport model and GWR were used to measure PM2.5 concentrations [24,25]. Resultant PM2.5 estimates were highly consistent (R2 = 0.81) with cross-validated PM2.5 concentrations from globally distributed ground concentrations. However, it was also reported that estimates in regions with mineral dust emissions due to mining operations were associated with higher uncertainty [26]. In this study, we extracted yearly data for South Asian countries.

2.2. In-Situ PM2.5 Concentration Data

Hourly PM2.5 concentration data for different South Asian cities were collected from the AirNow website (
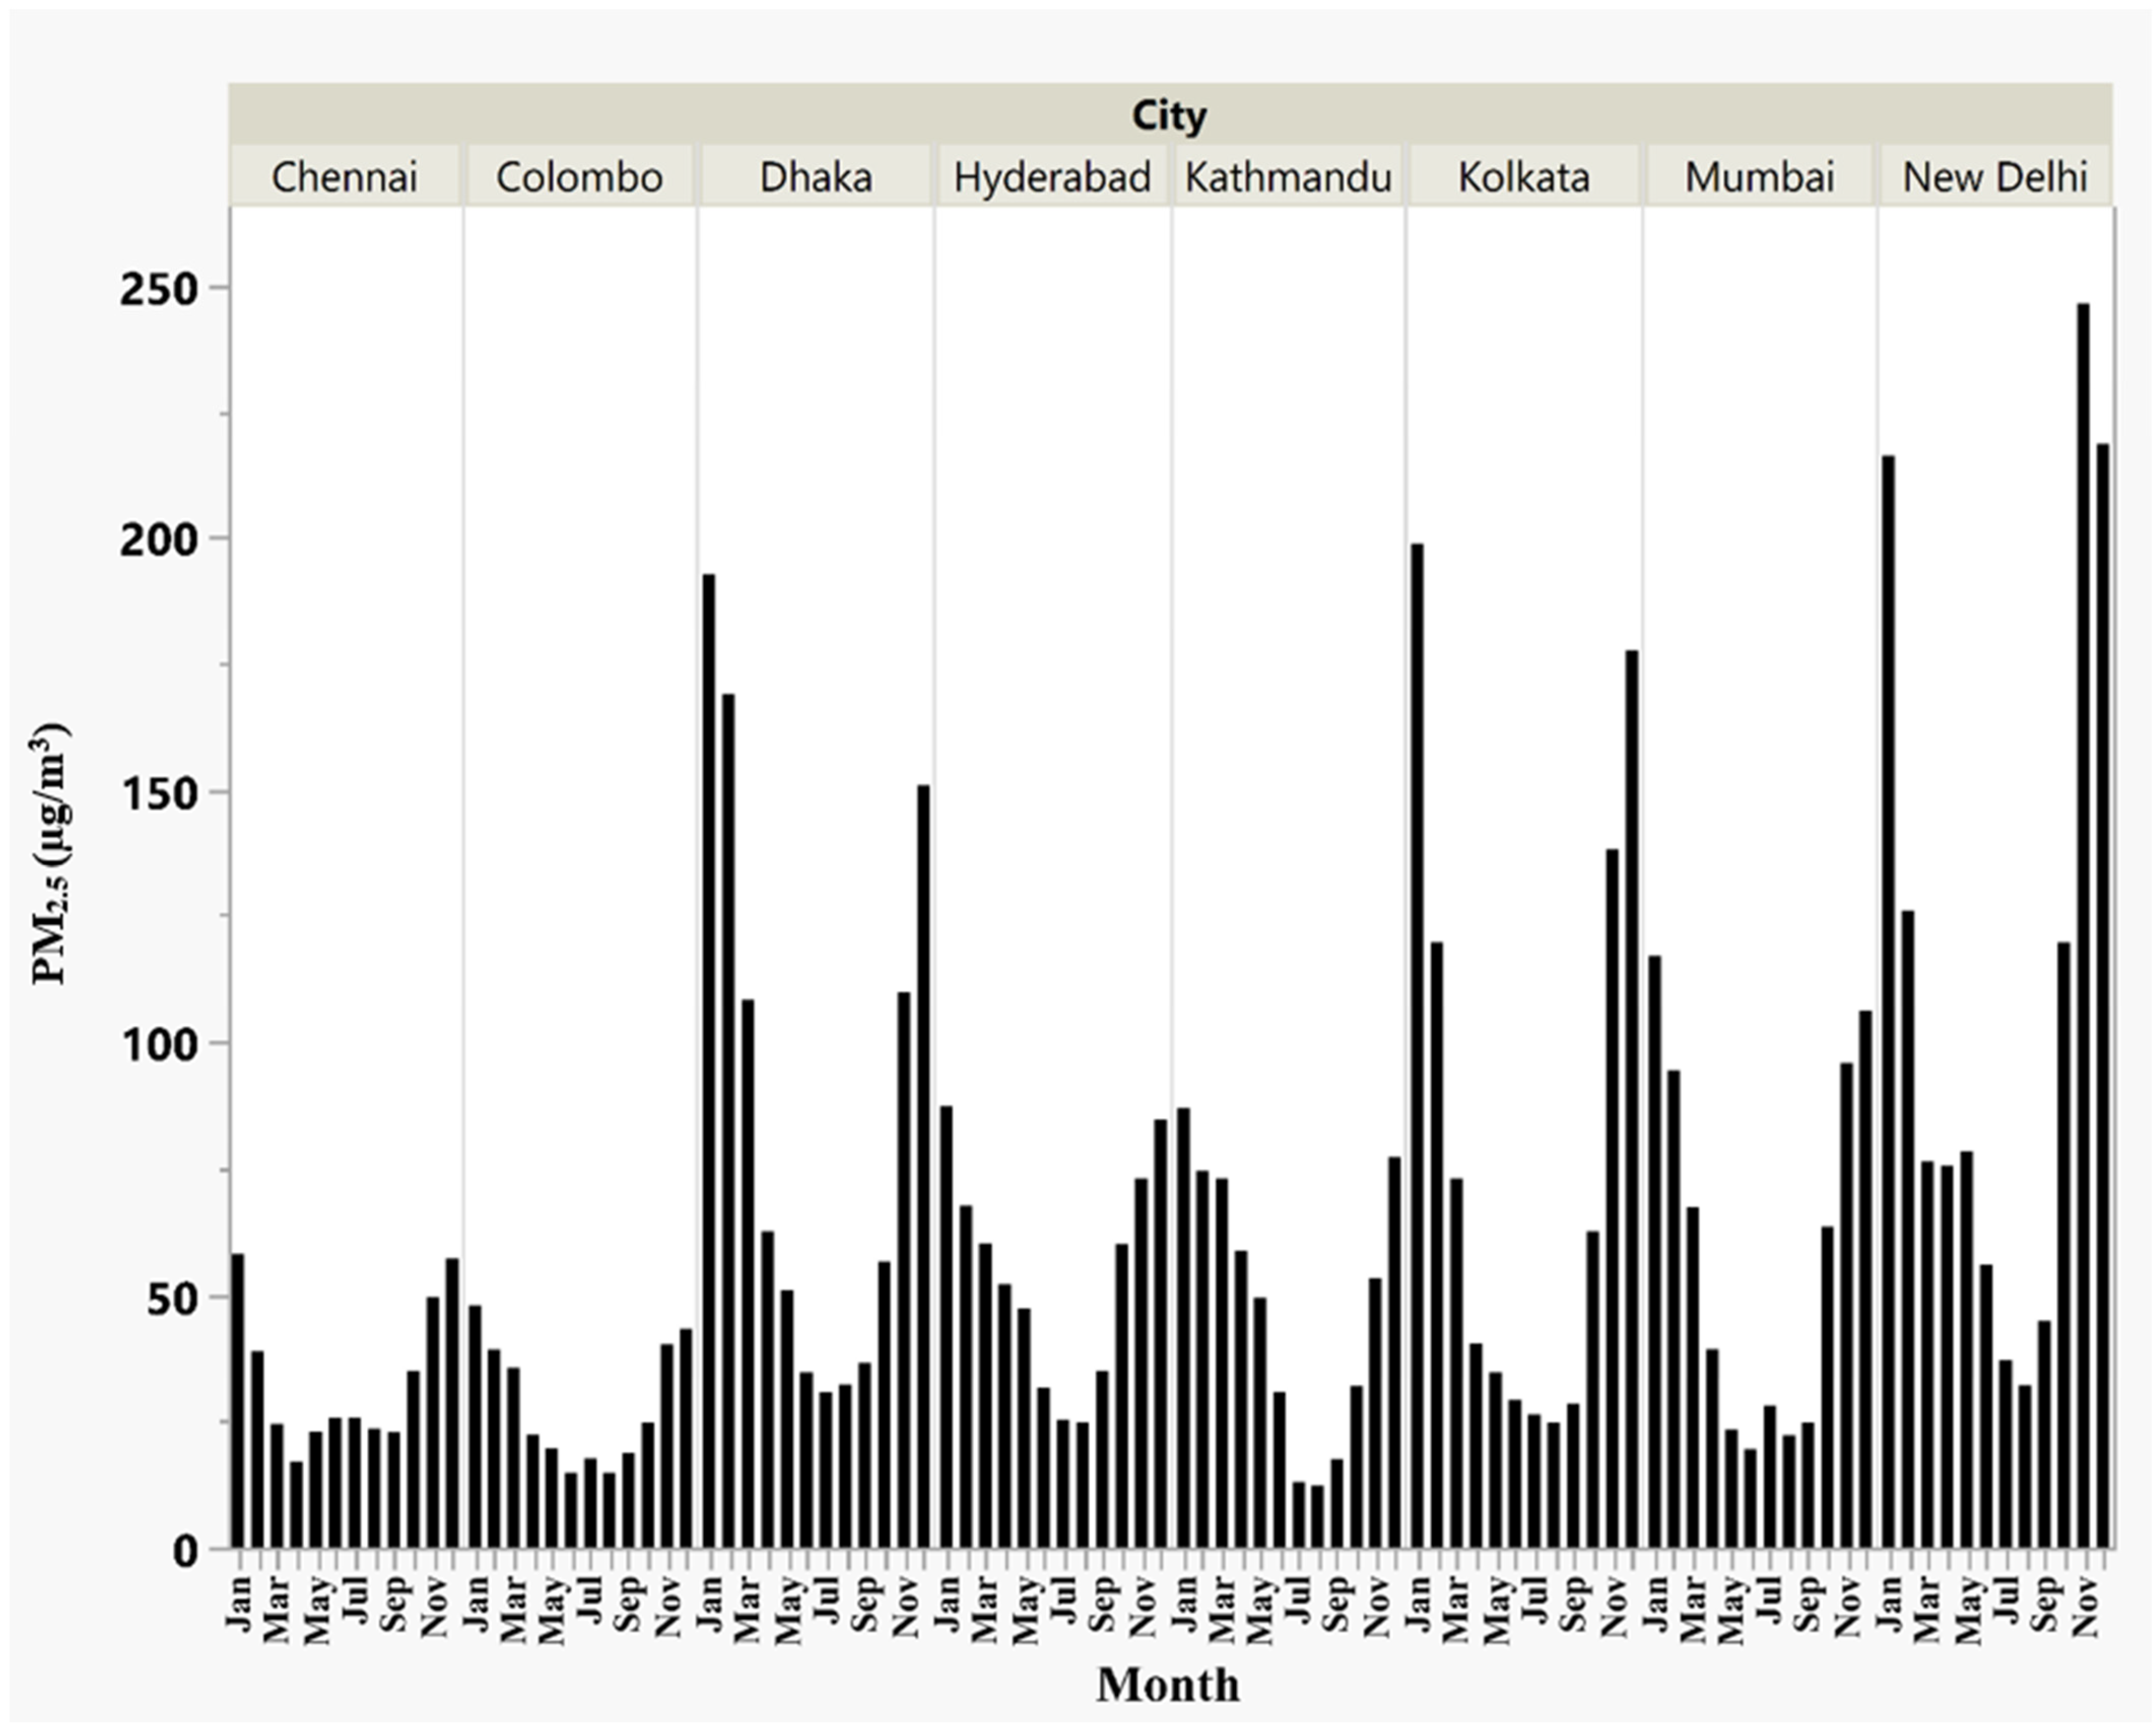
https://airnow.gov/, accessed on 22 September 2022) that is freely available for public use. AirNow Department of States (DOS) collects air quality monitoring data from U.S. embassies and consulates worldwide. For this study, we collected data for eight major South Asia cities (Table 1). All these monitoring stations are located in urban areas. Among the South Asian cities we considered for this study, we selected cities with at least two and a half years of data available. As a result, we could not include major cities including Islamabad and Lahore in Pakistan, Thimphu in Bhutan, and Chattogram in Bangladesh. The datasets were used for calculating daily means by setting a threshold of at least 75% (18 h) of data availability. Detailed information on the station-based data used in this study can be found in Table 1.

2.3. PM2.5 Mean Exposure and Mortality Data

Data on mean annual exposure to PM2.5 pollution (µg/m3) and the total number of deaths associated with ambient PM pollution (PM2.5) in the South Asian countries (Bangladesh, Bhutan, India, Maldives, Nepal, Pakistan, Sri Lanka) during 2000–2015 were collected from the World Bank (https://data.worldbank.org/indicator/EN.ATM.PM25.MC.M3, accessed on 22 September 2022) and Global Burden of Disease Study (GBD) 2015 results published by the Institute for Health Metrics and Evaluation (IHME) (https://ourworldindata.org/grapher/absolute-number-of-deaths-from-ambient-particulate-air-pollution?region=Asia, accessed on 22 September 2022).

2.4. Meteorological Data

Daily mean data on different meteorological variables (precipitation, temperature, relative humidity, and wind speed) for other South Asian cities (Chennai, Colombo, Dhaka, Hyderabad, Kathmandu, Kolkata, Mumbai, and New Delhi) were collected from the NASA POWER database (https://power.larc.nasa.gov/data-access-viewer/, accessed on 22 September 2022). The meteorological data in POWER are derived from Goddard’s Global Modeling Assimilation Office (GMAO) Modern Era Retrospective-Analysis for Research and Applications (MERRA-2) assimilation model products and GMAO Forward Processing–Instrument Teams (FP-IT) GEOS 5.12.4 near-real-time products.

2.5. Data Analysis

To determine the trends of variations in PM2.5 concentrations, the study adopted the Mann–Kendall (MK) test [27,28] and Sen’s slope estimator [29]. The MK test is a widely used statistical tool for studying the trend of air pollutants [30,31,32]. The MK test is a non-parametric test used to test temporal trends that do not require data to be normally distributed or linear [33]. Sen’s slope method is used to estimate the slope of a regression line that fits data based on a least square estimate. In our study, annual mean PM2.5 concentrations were used for the long-term trend analysis. A p < 0.05 was considered statistically significant.
Zonal statistics tool in ArcMap was used to extract annual descriptive statistics of PM2.5 concentrations. Annual mean, maximum, minimum, and standard deviation of PM2.5 concentration at the country level were estimated and reported. ArcGIS Pro (version 3.0) software was used to visualize data to show the spatiotemporal variations of PM2.5 over South Asia. In addition, the daily Air Quality Index (AQI) was estimated as a percentage for the studied period. According to the USEPA, it is crucial to understand the AQI forecast, which is different from the pollutants’ actual values. Generally, the AQI is sub-divided into six classes based on the level of air pollutants.
Pearson’s correlation coefficient (PCC) analysis was used to analyze the correlation between PM
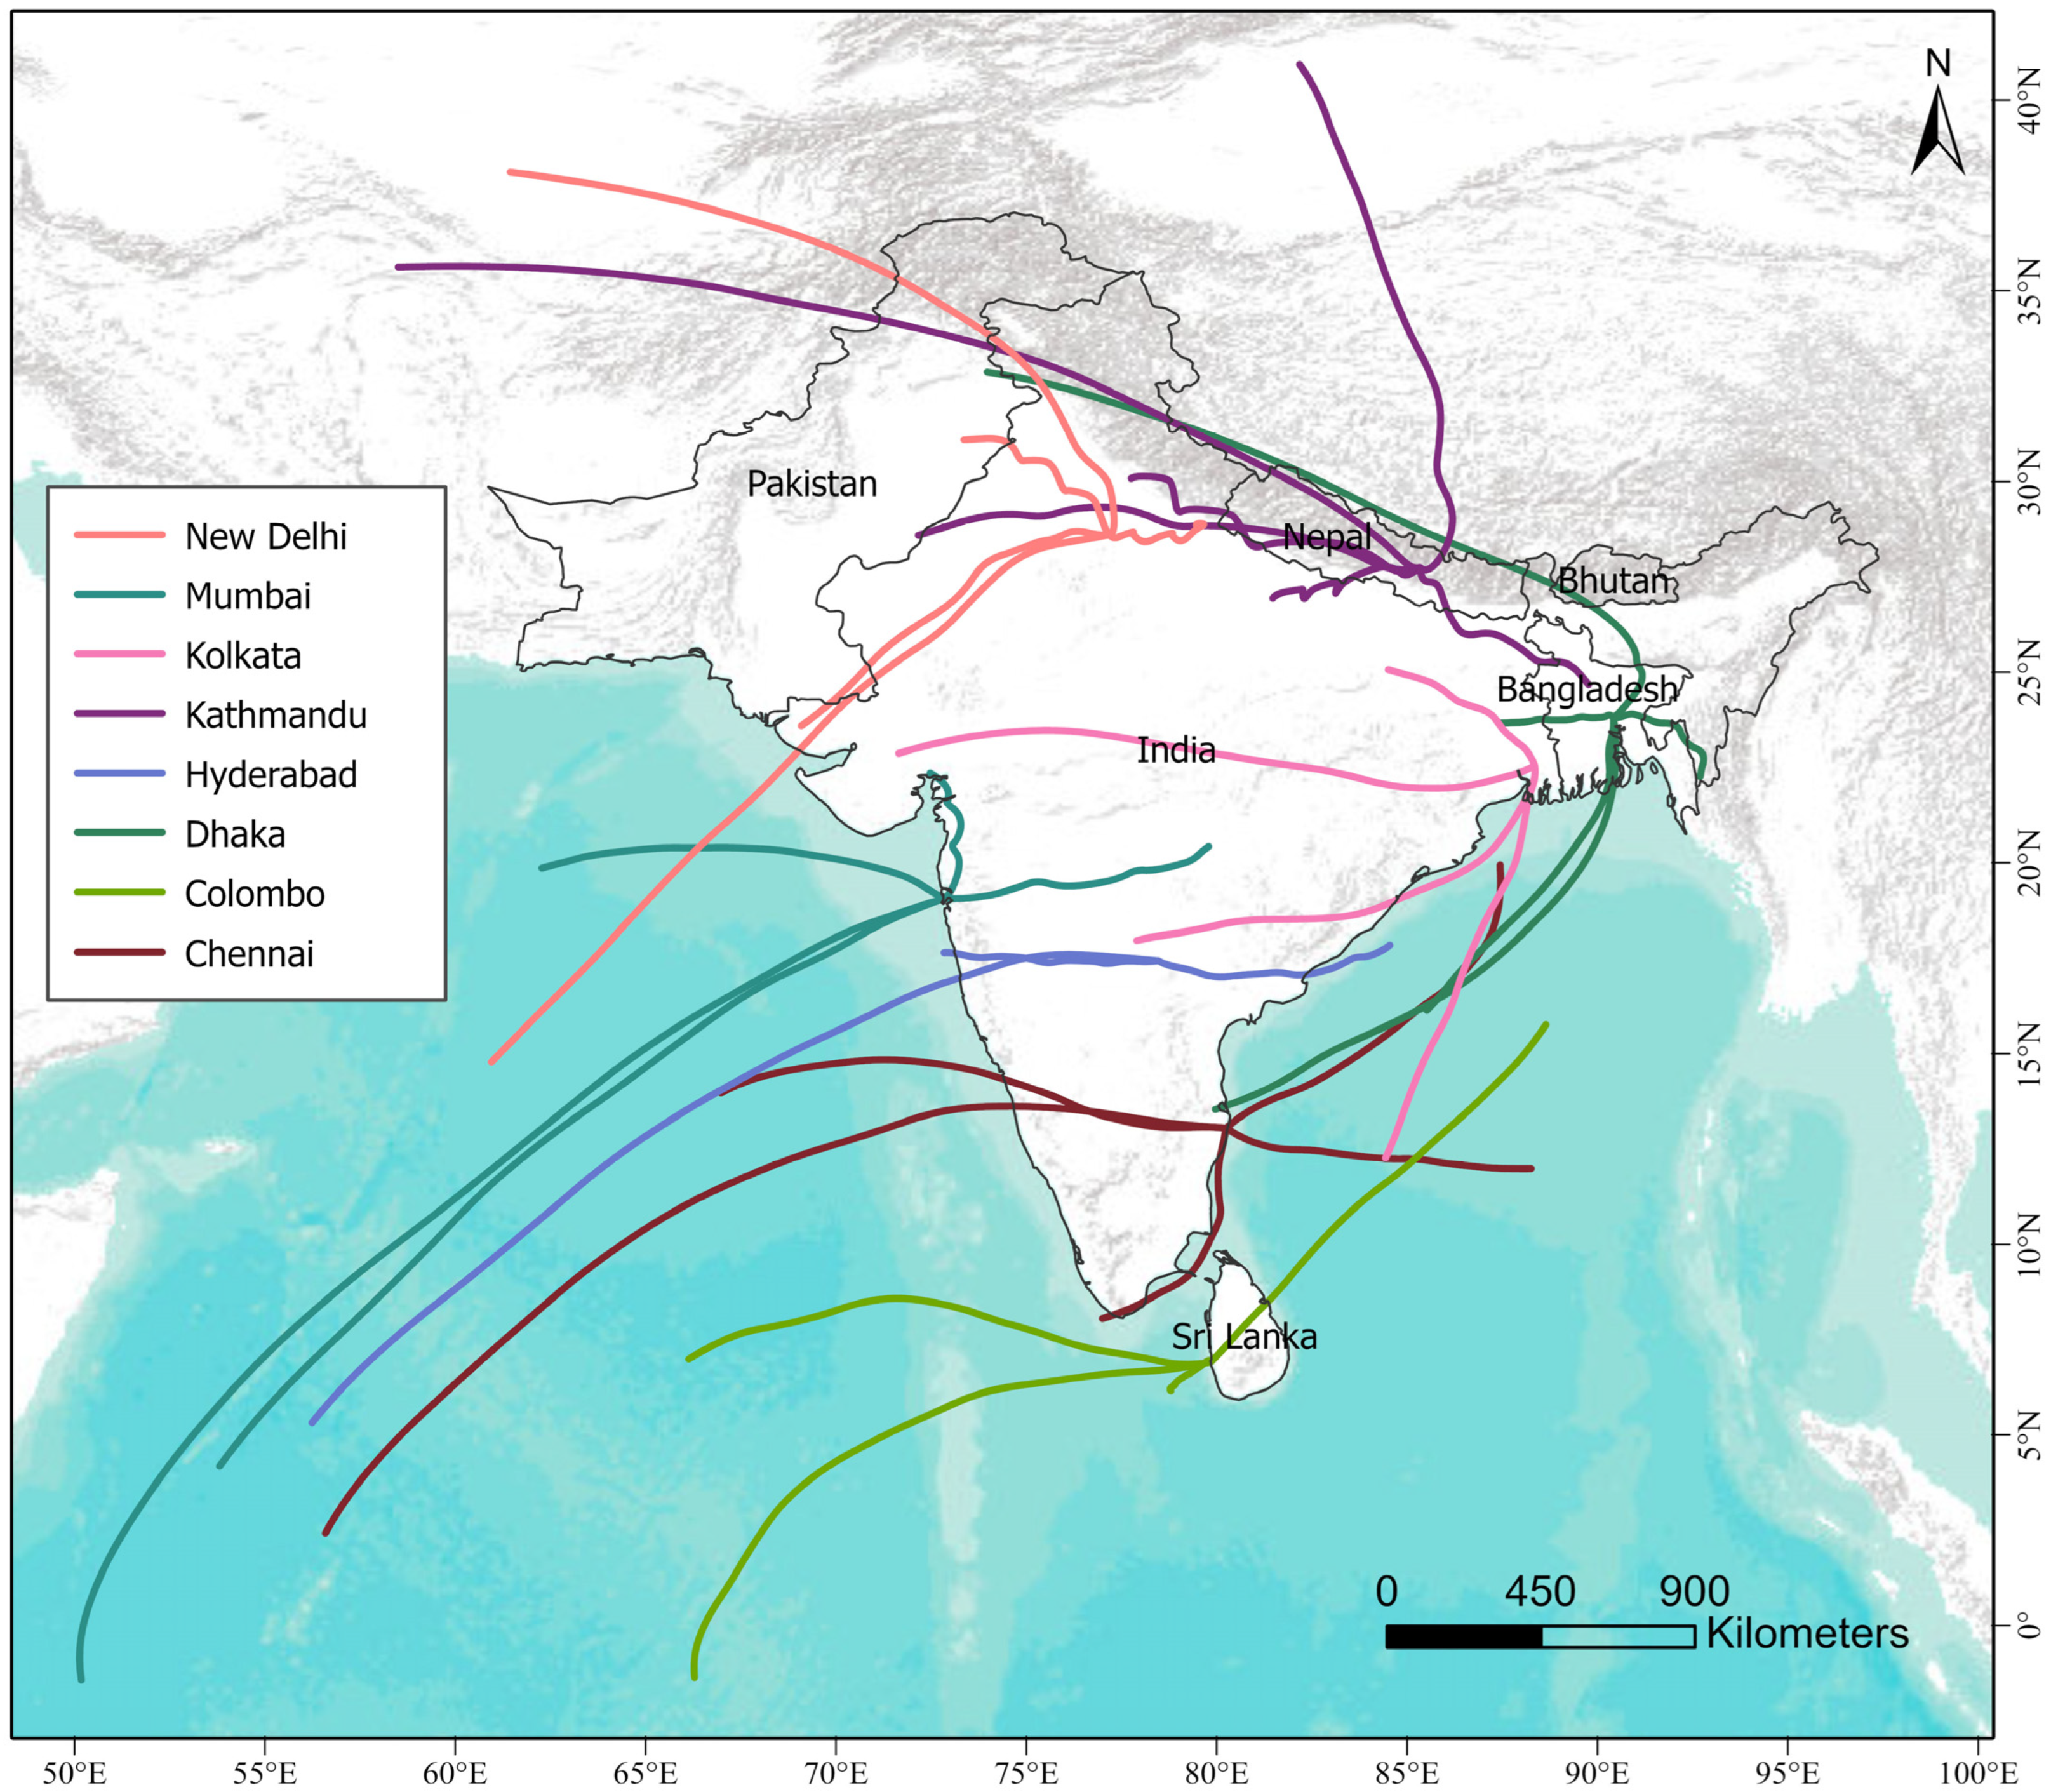
2.5 and meteorological variables. PCC measures how strong a relationship is between two random variables. In addition, the backward air mass trajectories have been used to assess the origin and long-range transport of PM2.5. Hybrid Single-Particle Lagrangian Integrated Trajectory (HYSPLIT) model with gridded reanalysis global meteorological data were used in the backward trajectory analysis. Backward air mass trajectory is widely used and helpful in tracing long-distance transport of atmospheric pollutants like PM2.5 [34,35,36]. This study computed 72 h air mass back trajectories at 500 m above the ground level over different cities in the South Asian region to assess the long-term transport of PM2.5. To calculate air mass trajectories, we used a software package called TrajStat (version 1.5.3), a GIS (Geographic Information System)-based platform [37]. The model was run daily starting at 0600 UTC every day during 2018. We have selected the year 2018 for the trajectory analysis for two reasons. First, hourly PM2.5 datasets were available for the whole year for all cities. Second, carrying out back trajectory analysis daily for 8 different cities is very time-consuming. To analyze transport pathways, clustering of air mass trajectories was applied in TrajStat software version 1.5.3. Trajectory clustering analysis is a multivariate statistical technique which groups similar trajectories based on trajectory space. TrajStat software uses K-means clustering to cluster trajectories [37]. The optimal number of clusters was determined by the Total Spatial Variance (TSV) method [38].
This study projected the mean annual exposure of PM2.5 pollution (µg/m3) and the number of deaths attributed to ambient (outdoor) PM2.5 air pollution for 2020 and 2025. The simple linear extrapolation method has been used for the projections. For instance, the mean annual exposure of PM2.5 pollution has been projected considering the average annual growth rate of PM2.5 values between 2000–2015. The number of deaths from ambient PM2.5 pollution has been projected considering the average number of deaths per year between 2000–2015. To project potential exposure to PM2.5 and the number of associated deaths, 2015 was selected as the base case based on the data availability. Additionally, we assess the correlation between mean PM2.5 concentrations and related mortality for the year 2015. To normalize the mortality rate by the total population of the country, we calculate the rate per 100,000 populations.

3. Results and Discussion

3.1. Spatio-Temporal Patterns of PM2.5 in South Asian Countries

The spatial distribution of PM2.5 suggested that pollution concentration was the highest in the areas of the capital cities of South Asian countries (Figure 1). For instance, high PM2.5 concentration has been observed in New Delhi (India), Dhaka (Bangladesh), and Islamabad (Pakistan) during 1998–2019. In addition to spatial heterogeneity, the study also recognized temporal heterogeneity in the region. The temporal distribution of PM2.5 revealed an increasing trend in PM2.5 pollution from 1998–2019 across the entire region (Table 2). It is well established that factors like heterogeneous climate, land use, and anthropogenic activities (e.g., fossil fuel burning, biomass burning, etc.) dramatically impact local air quality [39,40]. Our study showed that the highest mean annual PM2.5 concentrations were in Bangladesh (46.72 µg/m3), India (36.17 µg/m3), and Nepal (29.06 µg/m3). From 1998 to 2019, Pakistan and Bhutan experienced a moderate level of PM2.5 pollution with mean annual values of 23.90 and 15.16 µg/m3, respectively. Shi et al. (2018) reported similar findings, with the lowest annual PM2.5 concentrations for Sri Lanka and Bhutan from 1999 to 2014 [15]. However, the mean annual PM2.5 concentrations in Sri Lanka and the Maldives were remarkably lower (8.69 µg/m3 and 5.35 µg/m3, respectively) than in the rest of the South Asian region (Table 2). The possible reasons behind the relatively lower PM2.5 concentrations than other South Asian countries include less industrialization, smaller urban areas, and fewer vehicular emissions.
The trend of mean annual PM2.5 concentrations in the South Asian countries during 1998–2019 shows that all South Asian countries except the Maldives experienced an increasing trend of PM2.5 (p < 0.05) (Table 3). The highest and lowest trends of PM2.5 concentrations were found to be in Bangladesh and Pakistan, respectively, with an estimated Kendall’s tau values of 0.86 and 0.52. Based on Sen’s slope, the highest increasing trend was found in Bangladesh (1.37 µg/m3/year). A similar study by Shi et al. (2018) also found that among the South and South-East Asian countries, the PM2.5 trend was highest for Bangladesh during 1999–2014 [15]. Other countries, including India (0.83), Nepal (0.83), Bhutan (0.77), and Sri Lanka (0.57), also showed a significant increasing trend. On the other hand, both the MK test and Sen’s slope estimator suggest that the Maldives is the only country in South Asia experiencing a decreasing trend of PM2.5. The current trend of PM2.5 pollution in South Asia indicates that, without effective regulatory measures, the situation will worsen in the future.

3.2. Variations of PM2.5 in South Asian Cities

The highest PM2.5 concentrations were observed during the coldest months of the year (Table 4). This is reasonable as low temperatures and weak winds lead to the accumulation of PM2.5 [41]. Moreover, among the selected South Asian cities, the winter concentration of PM2.5 was much higher in New Delhi (188 µg/m3), Dhaka (170 µg/m3), and Kolkata (166 µg/m3) compared with other cities, which is believed to be due to these three having lower temperatures than other cities during this season. A study by Begum et al. (2013) found that the combination of meteorological conditions and long-range transport during the winter resulted in much higher PM concentrations in Bangladesh [42]. The annual PM2.5 concentrations were also higher in these cities, with the highest in New Delhi (110 µg/m3). In contrast, a significant reduction in PM2.5 concentrations was observed during monsoons in most South Asian countries due to intense rainfall (Table 4). While looking at the impacts of Indian summer monsoons on air pollutants, Yin et al. [43] also found that the PM2.5 concentrations are lowest in the monsoon months.
Based on the hourly variations in PM2.5 concentrations in the studied South Asian cities, the cities can be categorized into two groups (Figure 2) depending on the patterns of diurnal variations in PM2.5 concentrations: (1) Chennai, Colombo, Hyderabad, Kathmandu; and (2) Dhaka, Kolkata, Mumbai, New Delhi. The cities that belong to group 1 show bimodal patterns, while unimodal patterns are observed for the group 2 (Figure 2). Guan et al. (2017) also reported such bimodal and unimodal distributions in PM concentrations in different cities of Gansu Province, western China [44]. For group 1, the highest PM2.5 concentration was observed in the morning (7:00–10:00) and before midnight (21:00–23:00), and the lowest concentration from both noon to afternoon (12:00–17:00) and midnight to early in the morning (00:00–5:00). For group 2, the highest PM2.5 concentration was observed before or at midnight until early in the morning (22:00–8:00), whereas the lowest values were detected in the afternoon (13:00–18:00). The high PM2.5 concentration observed early in the morning can be attributed to increased vehicular traffic emissions resulting from the morning traffic due to school or workplaces start times [45,46], while the highest PM2.5 concentrations at midnight are attributed to enhanced vehicular freight traffic [47]. The lowest PM2.5 concentrations in the afternoon might be due to better dispersion and dilution of PM due to increased boundary layer height and wind speed accompanied by less public movement [44,48].
In addition, variations in monthly mean PM2.5 concentrations were also observed following the seasonal fluctuations (Figure 3), which largely depend on several contributing factors, including local emissions, regional transmission rate, and meteorological conditions (e.g., wind speed, wind direction, and solar radiation) [44,49]. The monthly PM2.5 concentrations form a U-shaped trend with higher concentrations in the winter months and lower concentrations in the summer months. A similar result was also found when Singh et al. [50] assessed the trends of particulate matter (PM2.5) in five Indian cities. The highest monthly PM2.5 concentrations were in December and January for all cities. High PM2.5 values in December and January may have been caused by local emission sources and meteorological conditions with weak winds in the winter season throughout the region. While assessing the seasonal and diurnal patterns of PM2.5 pollution in New Delhi, Tiwari et al. [51] found that the high concentrations in the winter months are related to increased emissions and lower Planetary Boundary Layer Height (PBLH). In contrast, the lowest PM2.5 concentrations were found between April and August varied by cities. For instance, in Chennai, the lowest PM2.5 concentrations (i.e., 17µg/m3) were found in April, while in cities like Colombo (14.8 µg/m3) and New Delhi (32 µg/m3), it was in August.

3.3. Correlation of Meteorological Variables with PM2.5 Concentration

The Pearson’s correlation analysis results between daily mean PM2.5 concentrations and meteorological variables (i.e., precipitation, relative humidity, temperature, and wind speed) showed that temperature, precipitation, and wind speed are negatively correlated with PM2.5 concentrations throughout the South Asian cities (Table 5). In Chennai, relative humidity showed a positive correlation with daily mean PM2.5 concentrations (r = 0.32), while other variables (precipitation, temperature, and wind speed) exhibited a negative correlation (r = −0.17, −0.74, and −0.18, respectively). A varied correlation of particulate matter and relative humidity was observed by Tariq et al. [52] while looking at aerosol optical depth and its relationship with meteorological parameters over South Asia. They found that the relative humidity is positively correlated for central India, whereas over Bangladesh, Bhutan, and Nepal it was negatively correlated. In other cities (Colombo, Dhaka, Hyderabad, Kathmandu, Kolkata, Mumbai, and New Delhi), all meteorological variables are negatively correlated with daily mean PM2.5 concentrations. It is evident that PM2.5 distribution in the atmosphere is significantly correlated with meteorological parameters including precipitation, relative humidity, temperature, and wind speed [53,54]. Our findings align reasonably well with other studies on PM2.5 in South Asian countries and cities [51,55].
In Chennai, Kolkata, Mumbai, and New Delhi, the highest correlation coefficient (r = −0.74, −0.83, −0.52, −0.70, respectively) was observed between temperature and PM2.5 concentrations. In Colombo, the highest correlation coefficient (r = −0.53) was found between relative humidity and PM2.5 concentrations. In Dhaka, all the meteorological variables and PM2.5 concentrations had a strong coefficient correlation (r = −0.54 to −0.82). In Hyderabad, the highest correlation coefficient (r = −0.64) was seen between wind speed and PM2.5 concentrations, followed by relative humidity (r = −0.61). It is apparent from the correlation analysis that the meteorological variables affect the local PM2.5 concentration. However, the influence of different meteorological variables can vary between cities, which is attributable to the differences in geographical location and climatic variations between cities. Zhao et al. (2018) reported that PM2.5 concentrations vary from city to city due to the impact of the local climatic conditions [56].

3.4. Regional Air Pollutant Transport

The 72 h backward trajectories for every day during 2018 were clustered for each city (Figure 4). The backward trajectory analysis shows that the northwest and southwest direction trajectories substantially influence long-term particulate air mass transport. Notably, the cities like Dhaka, Kolkata, Kathmandu, and New Delhi seemed to follow the same air mass transport belt. This long-range air mass transportation route was found to be the most polluted region in South Asia (Figure 1). On the other hand, the cities like Chennai, Hyderabad, Mumbai, and Colombo seemed to follow the same belt of air mass transport, which receives most long-range air mass from the southwest direction. Figure 4 shows that the polluted airflows are coming to the South Asian region from the cities in Iran and China. Other studies also found that air parcels are coming to South Asian cities from Iran, China and even sometimes from North Africa [57,58]. The route it followed is close to deserts and rich in dust aerosols, transported to the most polluted northern cities in the South Asian region by northwest airflow. The trajectory analysis also found that air pollution in some cities is influenced by the air quality of the surrounding region or cities through long-range transport of pollutants. For instance, the airflow of Mumbai is mostly influenced by nearby cities (e.g., Surat, Pune, or Hyderabad). In the case of Hyderabad, it was influenced by the cities like Nagpur and Vishakhapatnam.

3.5. Impacts of Air Pollution on South Asia

For better understanding, this study presents the average percentage of hourly AQI based on PM2.5 in different South Asia cities (Table 6), considering six subdivisions of AQI proposed by the United States Environmental Protection Agency (USEPA). This study shows a poor AQI for most South Asian cities (Delhi, Dhaka, Kolkata, Mumbai, and Hyderabad), where unhealthy air quality was recorded for almost half of the day (Table 6). For instance, AQI is observed to be unhealthy (including unhealthy for sensitive groups) for >78% of the duration of each day in New Delhi. For Dhaka, Hyderabad, Kolkata, Mumbai, and Kathmandu, a similar percentage of AQI has been observed (70.40%, 66%, 62.70%, 54.20%, and 52.30%, respectively), which reflects degraded air quality in these cities. However, a comparatively moderate AQI has been observed for Chennai and Colombo (58%); AQI is observed to be unhealthy (including unhealthy for sensitive groups) for 27–28.50% of the duration of each day and is found to be good for 14–15.20% of the duration of the day (Table 6). Krishna et al. (2017) reported that more than 99% of South Asia’s population lives in areas with air quality worse than WHO’s recommended minimum standards and is heavily exposed to PM2.5 emissions [13]. Therefore, this study indicates alarming AQI conditions for almost half of the day in New Delhi, Dhaka, Kolkata, Mumbai, and Hyderabad.
The result shows that in the South Asian countries, the mean exposure of PM2.5 pollution has increased considerably between 2000–2015, with substantial growth in Nepal, Bangladesh, and India (i.e., 6.10–8.30%), which results in a significant increase in the total number of deaths, mainly in India, Pakistan, and Bangladesh (Table 7). This increasing number of deaths is believed to be due to poor AQI and high exposure to air pollution, resulting in cardiovascular diseases and lung cancer. A similar finding has been reported by [13] for these South Asian countries. It should be noted that although the proportion of mean exposure to PM2.5 pollution in Pakistan was observed to be negative between 2000–2015, the total number of deaths increased, which could be attributed to the long-term health impacts due to the high exposure to air pollution. However, between 2000 and 2015, the death rate increased by 100%, 43%, 27.19%, 23.65%, 22%, 8.45%, and 0% in Bhutan, Bangladesh, India, Nepal, Pakistan, Sri Lanka and Maldives, respectively (Table 7). We project that compared to 2015, the range of the total number of deaths could increase approximately by 0–5.60% and 0–11.10% in 2020 and 2025, respectively, in these South Asian countries (Table 7).
The correlation analysis between mean exposure to PM2.5 and number of deaths per 100,000 population from ambient PM2.5 suggests that there is a very strong positive correlation (r = 0.87) between them (p < 0.05). This high correlation value indicates that the high the PM2.5 concentrations, the higher the death rates are. Other studies also found similar results [61,62]. For instance, a study in Colombo city in Sri Lanka found that the particulate matter level is strongly correlated (r = 0.717) with morbidity cases of emphysema, bronchitis and other chronic obstructive pulmonary diseases [62].

3.6. Limitations and Future Research

This study leveraged both satellite and ground-based data to monitor spatio-temporal variations in PM2.5 concentrations in South Asia. Additionally, this study explored the long-range transport of air pollutants and subsequent health impacts of PM2.5 exposure in this region. However, this study had several limitations. First, this study analyzed data for only eight cities in South Asia. More study is needed to look at other cities (i.e., Chittagong in Bangladesh, Islamabad or Lahore in Pakistan) that were excluded from this study due to a lack of data. Inadequate ground-based monitors are an issue in this region. For each city, we found and used data from only one monitoring site. More monitoring sites might result in better and accurate estimation. The evaluation of potential cofounding factors is important in air pollution trend analysis. Though this study used annual mean values for trend analysis, the inter-annual meteorological effects can still exacerbate the changes in concentrations. Since this study did not account for the influence of confounding factors in trend analysis, this is another limitation of the study. Third, this study utilized satellite data with more than 1 km pixel resolution. Satellite imagery with finer resolution might better estimate PM2.5 concentrations. Lastly, long term data on PM2.5 concentrations might be useful in better estimation of local or regional trend. Further study is warranted to model the influence of seasonal weather conditions on local PM2.5 concentrations.

4. Conclusions

Particulate matter pollution in the South Asian region has drawn much attention in recent years as it has increased significantly over the past decades resulting in severe impacts on ambient air quality and human health. The study showed that among the South Asian countries, the mean annual PM2.5 was the highest in Bangladesh during 1998–2019. During this period, all South Asian countries except the Maldives have experienced an increasing trend of PM2.5. Among the South Asian cities, air quality was worse in New Delhi (110 µg/m3), which was much higher than the WHO ambient air quality standards. In terms of seasonal variations in PM2.5 concentrations, the worst situation was observed during the winter season compared to post-monsoon, pre-monsoon, and monsoon. The backward trajectory analysis shows that the northwest and southwest direction trajectories have the most considerable influence on long-term particulate air mass transport in the South Asian region. Our study also projects that human mortality associated with particulate matter pollution could increase considerably in South Asian countries in the future. In summary, it is apparent that PM2.5 pollution caused significant impacts on air quality in the past decades and could worsen the air quality and its associated impact on human mortality in the future. Therefore, this study recommends strong air pollution control regulation and policy intervention (e.g., increased use of public transportation, clean fuels, renewable alternatives, etc.) in South Asian countries to reduce air pollution and its subsequent impact on human mortality.

Author Contributions

Conceptualization, M.S.I.; methodology, M.S.I.; software, M.S.I.; validation, M.S.I.; formal analysis, M.S.I.; data curation, M.S.I. and S.R.; writing—original draft preparation, M.S.I., S.R., T.R.T. and M.R.; writing—review and editing, M.S.I., S.R., T.R.T. and R.C.H.; visualization, M.S.I.; supervision, M.S.I.; project administration, M.S.I. All authors have read and agreed to the published version of the manuscript.

Funding

This research received no external funding.

Data Availability Statement

The data presented in this study are available on request from the corresponding author.

Acknowledgments

The authors would like to thank Aaron van Donkelaar and others for making the global annual PM2.5 gridded products in the socioeconomic data and applications center (SEDAC) available online. We would also like to thank three anonymous reviewers for their valuable feedback.

Conflicts of Interest

The authors declare no conflict of interest.

References

  1. Landrigan, P.J.; Fuller, R.; Acosta, N.J.; Adeyi, O.; Arnold, R.; Basu, P.N.; Baldé, A.B.; Bertollini, R.; Bose-O’Reilly, S.; Boufford, J.I.; et al. The Lancet Commission on Pollution and Health. Lancet 2018, 391, 462–512. [Google Scholar] [CrossRef] [PubMed]
  2. Dominici, F.; Greenstone, M.; Sunstein, C.R. Particulate Matter Matters. Science 2014, 344, 257–259. [Google Scholar] [CrossRef] [PubMed]
  3. Han, F.; Lu, X.; Xiao, C.; Chang, M.; Huang, K. Estimation of Health Effects and Economic Losses from Ambient Air Pollution in Undeveloped Areas: Evidence from Guangxi, China. Int. J. Environ. Res. Public Health 2019, 16, 2707. [Google Scholar] [CrossRef] [PubMed]
  4. Sun, L.; Wei, J.; Duan, D.H.; Guo, Y.M.; Yang, D.X.; Jia, C.; Mi, X.T. Impact of Land-Use and Land-Cover Change on Urban Air Quality in Representative Cities of China. J. Atmos. Sol.-Terr. Phys. 2016, 142, 43–54. [Google Scholar] [CrossRef]
  5. Vilcassim, R.; Thurston, G.D. Gaps and Future Directions in Research on Health Effects of Air Pollution. eBioMedicine 2023, 93, 104668. [Google Scholar] [CrossRef]
  6. Gurjar, B.R.; Ohara, T.; Khare, M.; Kulshrestha, P.; Tyagi, V.; Nagpure, A.S. South Asian Perspective: A Case of Urban Air Pollution and Potential for Climate Co-Benefits in India. In Mainstreaming Climate Co-Benefits in Indian Cities: Post-Habitat III Innovations and Reforms; Sethi, M., Puppim de Oliveira, J.A., Eds.; Exploring Urban Change in South Asia; Springer: Singapore, 2018; pp. 77–98. ISBN 978-981-10-5816-5. [Google Scholar]
  7. WHO. WHO Global Urban Ambient Air Pollution Database (Update 2016); WHO: Geneva, Switzerland, 2016.
  8. Kumar, R.; Barth, M.C.; Monache, L.D.; Ghude, S.D.; Pfister, G.; Naja, M.; Brasseur, G.P. An Overview of Air Quality Modeling Activities in South Asia. In Air Pollution in Eastern Asia: An Integrated Perspective; Bouarar, I., Wang, X., Brasseur, G.P., Eds.; ISSI Scientific Report Series; Springer International Publishing: Cham, Switzerland, 2017; pp. 27–47. ISBN 978-3-319-59489-7. [Google Scholar]
  9. BNAAQS BNAAQS; 2005, Bangladesh Gazette. Ministry of Forest and Environment, People’s Republic of Bangladesh: Dhaka, Bangladesh, 2005.
  10. Chowdhury, S.; Dey, S.; Guttikunda, S.; Pillarisetti, A.; Smith, K.R.; Di Girolamo, L. Indian Annual Ambient Air Quality Standard Is Achievable by Completely Mitigating Emissions from Household Sources. Proc. Natl. Acad. Sci. USA 2019, 116, 10711–10716. [Google Scholar] [CrossRef]
  11. Colbeck, I.; Nasir, Z.A.; Ali, Z. The State of Ambient Air Quality in Pakistan--a Review. Env. Sci. Pollut. Res. Int. 2010, 17, 49–63. [Google Scholar] [CrossRef]
  12. Nandasena, Y.L.S.; Wickremasinghe, A.R.; Sathiakumar, N. Air Pollution and Health in Sri Lanka: A Review of Epidemiologic Studies. BMC Public Health 2010, 10, 300. [Google Scholar] [CrossRef]
  13. Krishna, B.; Balakrishnan, K.; Siddiqui, A.R.; Begum, B.A.; Bachani, D.; Brauer, M. Tackling the Health Burden of Air Pollution in South Asia. BMJ 2017, 359, j5209. [Google Scholar] [CrossRef]
  14. David, L.M.; Ravishankara, A.R.; Kodros, J.K.; Pierce, J.R.; Venkataraman, C.; Sadavarte, P. Premature Mortality Due to PM2.5 Over India: Effect of Atmospheric Transport and Anthropogenic Emissions. Geohealth 2019, 3, 2–10. [Google Scholar] [CrossRef]
  15. Shi, Y.; Matsunaga, T.; Yamaguchi, Y.; Li, Z.; Gu, X.; Chen, X. Long-Term Trends and Spatial Patterns of Satellite-Retrieved PM2.5 Concentrations in South and Southeast Asia from 1999 to 2014. Sci. Total Environ. 2018, 615, 177–186. [Google Scholar] [CrossRef] [PubMed]
  16. Xue, T.; Guan, T.; Geng, G.; Zhang, Q.; Zhao, Y.; Zhu, T. Estimation of Pregnancy Losses Attributable to Exposure to Ambient Fine Particles in South Asia: An Epidemiological Case-Control Study. Lancet Planet. Health 2021, 5, e15–e24. [Google Scholar] [CrossRef] [PubMed]
  17. Cao, J.; Chow, J.C.; Lee, F.S.C.; Watson, J.G. Evolution of PM2.5 Measurements and Standards in the U.S. and Future Perspectives for China. Aerosol Air Qual. Res. 2013, 13, 1197–1211. [Google Scholar] [CrossRef]
  18. AQLI Air Quality Life Index 2023. Available online: https://aqli.epic.uchicago.edu/the-index/ (accessed on 27 September 2023).
  19. Tu, J.; Tu, W. How the Relationships between Preterm Birth and Ambient Air Pollution Vary over Space: A Case Study in Georgia, USA Using Geographically Weighted Logistic Regression. Appl. Geogr. 2018, 92, 31–40. [Google Scholar] [CrossRef]
  20. Kumar, R.; Barth, M.C.; Pfister, G.G.; Delle Monache, L.; Lamarque, J.F.; Archer-Nicholls, S.; Tilmes, S.; Ghude, S.D.; Wiedinmyer, C.; Naja, M.; et al. How Will Air Quality Change in South Asia by 2050? J. Geophys. Res. Atmos. 2018, 123, 1840–1864. [Google Scholar] [CrossRef]
  21. Lelieveld, J.; Bourtsoukidis, E.; Brühl, C.; Fischer, H.; Fuchs, H.; Harder, H.; Hofzumahaus, A.; Holland, F.; Marno, D.; Neumaier, M.; et al. The South Asian Monsoon—Pollution Pump and Purifier. Science 2018, 361, 270–273. [Google Scholar] [CrossRef]
  22. Almazroui, M.; Saeed, S.; Saeed, F.; Islam, M.N.; Ismail, M. Projections of Precipitation and Temperature over the South Asian Countries in CMIP6. Earth Syst. Environ. 2020, 4, 297–320. [Google Scholar] [CrossRef]
  23. Hammer, M.S.; van Donkelaar, A.; Li, C.; Lyapustin, A.; Sayer, A.M.; Hsu, N.C.; Levy, R.C.; Garay, M.J.; Kalashnikova, O.V.; Kahn, R.A.; et al. Global Annual PM2.5 Grids from MODIS, MISR and SeaWiFS Aerosol Optical Depth (AOD), 1998–2019, V4.GL.03; NASA Socioeconomic Data and Applications Center (SEDAC): Palisades, NY, USA, 2022. [Google Scholar] [CrossRef]
  24. van Donkelaar, A.; Martin, R.V.; Brauer, M.; Hsu, N.C.; Kahn, R.A.; Levy, R.C.; Lyapustin, A.; Sayer, A.M.; Winker, D.M. Global Annual PM2.5 Grids from MODIS, MISR and SeaWiFS Aerosol Optical Depth (AOD) with GWR, 1998-2016; NASA Socioeconomic Data and Applications Center (SEDAC): Palisades, NY, USA, 2018. [Google Scholar]
  25. Hammer, M.S.; van Donkelaar, A.; Li, C.; Lyapustin, A.; Sayer, A.M.; Hsu, N.C.; Levy, R.C.; Garay, M.J.; Kalashnikova, O.V.; Kahn, R.A.; et al. Global Estimates and Long-Term Trends of Fine Particulate Matter Concentrations (1998–2018). Environ. Sci. Technol. 2020, 54, 7879–7890. [Google Scholar] [CrossRef]
  26. van Donkelaar, A.; Martin, R.V.; Brauer, M.; Hsu, N.C.; Kahn, R.A.; Levy, R.C.; Lyapustin, A.; Sayer, A.M.; Winker, D.M. Global Estimates of Fine Particulate Matter Using a Combined Geophysical-Statistical Method with Information from Satellites, Models, and Monitors. Environ. Sci. Technol. 2016, 50, 3762–3772. [Google Scholar] [CrossRef]
  27. Mann, H.B. Nonparametric Tests Against Trend. Econometrica 1945, 13, 245–259. [Google Scholar] [CrossRef]
  28. Kendall, M.G. Rank Correlation Methods; Griffin: Oxford, UK, 1948. [Google Scholar]
  29. Sen, P.K. Estimates of the Regression Coefficient Based on Kendall’s Tau. J. Am. Stat. Assoc. 1968, 63, 1379–1389. [Google Scholar] [CrossRef]
  30. Chaudhuri, S.; Dutta, D. Mann–Kendall Trend of Pollutants, Temperature and Humidity over an Urban Station of India with Forecast Verification Using Different ARIMA Models. Environ. Monit. Assess. 2014, 186, 4719–4742. [Google Scholar] [CrossRef] [PubMed]
  31. Jaiswal, A.; Samuel, C.; Kadabgaon, V.M. Statistical Trend Analysis and Forecast Modeling of Air Pollutants. Glob. J. Environ. Sci. Manag. 2018, 4, 427–438. [Google Scholar] [CrossRef]
  32. Yousefian, F.; Faridi, S.; Azimi, F.; Aghaei, M.; Shamsipour, M.; Yaghmaeian, K.; Hassanvand, M.S. Temporal Variations of Ambient Air Pollutants and Meteorological Influences on Their Concentrations in Tehran during 2012–2017. Sci. Rep. 2020, 10, 292. [Google Scholar] [CrossRef]
  33. Yue, S.; Pilon, P.; Cavadias, G. Power of the Mann–Kendall and Spearman’s Rho Tests for Detecting Monotonic Trends in Hydrological Series. J. Hydrol. 2002, 259, 254–271. [Google Scholar] [CrossRef]
  34. Wang, Q.; Liu, M.; Yu, Y.; Li, Y. Characterization and Source Apportionment of PM2.5-Bound Polycyclic Aromatic Hydrocarbons from Shanghai City, China. Environ. Pollut. 2016, 218, 118–128. [Google Scholar] [CrossRef]
  35. Lasko, K.; Vadrevu, K. Improved Rice Residue Burning Emissions Estimates: Accounting for Practice-Specific Emission Factors in Air Pollution Assessments of Vietnam. Environ. Pollut. 2018, 236, 795–806. [Google Scholar] [CrossRef]
  36. Xiao, H.-W.; Xiao, H.-Y.; Luo, L.; Shen, C.-Y.; Long, A.-M.; Chen, L.; Long, Z.-H.; Li, D.-N. Atmospheric Aerosol Compositions over the South China Sea: Temporal Variability and Source Apportionment. Atmos. Chem. Phys. 2017, 17, 3199–3214. [Google Scholar] [CrossRef]
  37. Wang, Y.Q.; Zhang, X.Y.; Draxler, R.R. TrajStat: GIS-Based Software That Uses Various Trajectory Statistical Analysis Methods to Identify Potential Sources from Long-Term Air Pollution Measurement Data. Environ. Model. Softw. 2009, 24, 938–939. [Google Scholar] [CrossRef]
  38. Draxler, R.R.; Stunder, B.; Rolph, G.; Stein, A.; Taylor, A. HYSPLIT_4 User’s Guide; NOAA Air Resources Laboratory: Silver Spring, MD, USA, 2012. Available online: https://www.arl.noaa.gov/documents/reports/hysplit_user_guide.pdf (accessed on 12 October 2022).
  39. Yang, Q.; Yuan, Q.; Yue, L.; Li, T. Investigation of the Spatially Varying Relationships of PM2.5 with Meteorology, Topography, and Emissions over China in 2015 by Using Modified Geographically Weighted Regression. Environ. Pollut. 2020, 262, 114257. [Google Scholar] [CrossRef]
  40. Song, R.; Yang, L.; Liu, M.; Li, C.; Yang, Y. Spatiotemporal Distribution of Air Pollution Characteristics in Jiangsu Province, China. Available online: https://www.hindawi.com/journals/amete/2019/5907673/ (accessed on 24 October 2020).
  41. Xiao, K.; Wang, Y.; Wu, G.; Fu, B.; Zhu, Y. Spatiotemporal Characteristics of Air Pollutants (PM10, PM2.5, SO2, NO2, O3, and CO) in the Inland Basin City of Chengdu, Southwest China. Atmosphere 2018, 9, 74. [Google Scholar] [CrossRef]
  42. Begum, B.A.; Hopke, P.K.; Markwitz, A. Air Pollution by Fine Particulate Matter in Bangladesh. Atmos. Pollut. Res. 2013, 4, 75–86. [Google Scholar] [CrossRef]
  43. Yin, X.; Kang, S.; de Foy, B.; Rupakheti, D.; Rupakheti, M.; Cong, Z.; Wan, X.; Zhang, G.; Zhang, Q. Impacts of Indian Summer Monsoon and Stratospheric Intrusion on Air Pollutants in the Inland Tibetan Plateau. Geosci. Front. 2021, 12, 101255. [Google Scholar] [CrossRef]
  44. Guan, Q.; Cai, A.; Wang, F.; Yang, L.; Xu, C.; Liu, Z. Spatio-Temporal Variability of Particulate Matter in the Key Part of Gansu Province, Western China. Environ. Pollut. 2017, 230, 189–198. [Google Scholar] [CrossRef]
  45. Chen, P.; Bi, X.; Zhang, J.; Wu, J.; Feng, Y. Assessment of Heavy Metal Pollution Characteristics and Human Health Risk of Exposure to Ambient PM2.5 in Tianjin, China. Particuology 2015, 20, 104–109. [Google Scholar] [CrossRef]
  46. San Martini, F.M.; Hasenkopf, C.A.; Roberts, D.C. Statistical Analysis of PM2.5 Observations from Diplomatic Facilities in China. Atmos. Environ. 2015, 110, 174–185. [Google Scholar] [CrossRef]
  47. Hu, J.; Wang, Y.; Ying, Q.; Zhang, H. Spatial and Temporal Variability of PM2.5 and PM10 over the North China Plain and the Yangtze River Delta, China. Atmos. Environ. 2014, 95, 598–609. [Google Scholar] [CrossRef]
  48. Zhao, X.; Zhang, X.; Xu, X.; Xu, J.; Meng, W.; Pu, W. Seasonal and Diurnal Variations of Ambient PM2.5 Concentration in Urban and Rural Environments in Beijing. Atmos. Environ. 2009, 43, 2893–2900. [Google Scholar] [CrossRef]
  49. Li, R.; Li, Z.; Gao, W.; Ding, W.; Xu, Q.; Song, X. Diurnal, Seasonal, and Spatial Variation of PM2.5 in Beijing. Sci. Bull. 2015, 60, 387–395. [Google Scholar] [CrossRef]
  50. Singh, V.; Singh, S.; Biswal, A. Exceedances and Trends of Particulate Matter (PM2.5) in Five Indian Megacities. Sci. Total Environ. 2021, 750, 141461. [Google Scholar] [CrossRef]
  51. Tiwari, S.; Srivastava, A.K.; Bisht, D.S.; Parmita, P.; Srivastava, M.K.; Attri, S.D. Diurnal and Seasonal Variations of Black Carbon and PM2.5 over New Delhi, India: Influence of Meteorology. Atmos. Res. 2013, 125–126, 50–62. [Google Scholar] [CrossRef]
  52. Tariq, S.; Qayyum, F.; Ul-Haq, Z.; Mehmood, U. Long-Term Spatiotemporal Trends in Aerosol Optical Depth and Its Relationship with Enhanced Vegetation Index and Meteorological Parameters over South Asia. Environ. Sci. Pollut. Res. 2022, 29, 30638–30655. [Google Scholar] [CrossRef] [PubMed]
  53. Islam, M.S.; Rahman, M.; Tusher, T.R.; Roy, S.; Razi, M.A. Assessing the Relationship between COVID-19, Air Quality, and Meteorological Variables: A Case Study of Dhaka City in Bangladesh. Aerosol Air Qual. Res. 2021, 21, 200609. [Google Scholar] [CrossRef]
  54. Tiwari, S.; Hopke, P.K.; Pipal, A.S.; Srivastava, A.K.; Bisht, D.S.; Tiwari, S.; Singh, A.K.; Soni, V.K.; Attri, S.D. Intra-Urban Variability of Particulate Matter (PM2.5 and PM10) and Its Relationship with Optical Properties of Aerosols over Delhi, India. Atmos. Res. 2015, 166, 223–232. [Google Scholar] [CrossRef]
  55. Rahman, M.M.; Mahamud, S.; Thurston, G.D. Recent Spatial Gradients and Time Trends in Dhaka, Bangladesh, Air Pollution and Their Human Health Implications. J. Air Waste Manag. Assoc. 2019, 69, 478–501. [Google Scholar] [CrossRef]
  56. Zhao, D.; Chen, H.; Sun, X.; Shi, Z. Spatio-Temporal Variation of PM2.5 Pollution and Its Relationship with Meteorology among Five Megacities in China. Aerosol Air Qual. Res. 2018, 18, 2318–2331. [Google Scholar] [CrossRef]
  57. Begum, B.A.; Biswas, S.K.; Pandit, G.G.; Saradhi, I.V.; Waheed, S.; Siddique, N.; Seneviratne, M.C.S.; Cohen, D.D.; Markwitz, A.; Hopke, P.K. Long–Range Transport of Soil Dust and Smoke Pollution in the South Asian Region. Atmos. Pollut. Res. 2011, 2, 151–157. [Google Scholar] [CrossRef]
  58. Kulshrestha, U.; Kumar, B. Airmass Trajectories and Long Range Transport of Pollutants: Review of Wet Deposition Scenario in South Asia. Adv. Meteorol. 2014, 2014, e596041. [Google Scholar] [CrossRef]
  59. World Bank. Mean Annual Exposure of PM2.5 Pollution; World Bank: Bretton Woods, NH, 2021. [Google Scholar]
  60. Global Burden of Disease (GBD). Global Burden of Disease Study 2017 Results. Seattle, United States: Institute for Health Metrics and Evaluation (IHME), 2018; Institute for Health Metrics and Evaluation (IHME): Seattle, DC, USA, 2018. [Google Scholar]
  61. Zhu, R.-X.; Nie, X.-H.; Chen, Y.-H.; Chen, J.; Wu, S.-W.; Zhao, L.-H. Relationship Between Particulate Matter (PM2.5) and Hospitalizations and Mortality of Chronic Obstructive Pulmonary Disease Patients: A Meta-Analysis. Am. J. Med. Sci. 2020, 359, 354–364. [Google Scholar] [CrossRef]
  62. Thishan Dharshana, K.G.; Coowanitwong, N. Ambient PM10 and Respiratory Illnesses in Colombo City, Sri Lanka. J. Environ. Sci. Health Part A 2008, 43, 1064–1070. [Google Scholar] [CrossRef]
Figure 1. Spatial and temporal variations of PM2.5 (µg/m3) in South Asian countries during 1998–2019.
Remotesensing 15 04975 g001
Figure 2. Diurnal variations of the mean PM2.5 concentrations in different South Asian cities during 2016–2019.
Remotesensing 15 04975 g002
Figure 3. Monthly variations of PM2.5 concentrations in different South Asian cities during 2016–2019.
Remotesensing 15 04975 g003
Figure 4. Backward trajectories clustering of different South Asian cities during 2018. Using HYSPLIT model (Draxler and Rolph 2010), this study computed 72 h air mass back trajectories at an altitude of 500 m above the ground level over eight different cities in the South Asian region. The model was run daily starting at 0600 UTC every day during 2018.
Remotesensing 15 04975 g004
Table 1. Station-based PM2.5 concentrations in selected major cities of South Asia during 2016–2019.
NumberCityCountryLatLongData AvailabilityTemporal Coverage
1ChennaiIndia13.0580.25Feb 2015–Oct 201985%
2ColomboSri Lanka06.9179.84Sep 2017–Oct 201993%
3DhakaBangladesh23.7990.42Mar 2016–Oct 201993%
4HyderabadIndia17.4478.47Feb 2015–Oct 201990%
5KathmanduNepal27.7385.33Feb 2017–Oct 201995%
6KolkataIndia22.5488.35Feb 2015–Oct 201993%
7MumbaiIndia19.0672.86Feb 2015–Oct 201987%
8New DelhiIndia28.5977.18Feb 2015–Oct 201993%
Table 2. Summary statistics of the annual average PM2.5 in South Asian countries during 1998–2019.
CountryMinimumMaximumMeanStandard DeviationCoefficient of Variance (CV)
Bangladesh32.4173.2346.7211.0823.71
Bhutan7.2729.5115.166.5843.39
India24.4962.2536.1710.2628.37
Maldives2.846.405.350.7213.50
Nepal19.2244.8429.067.0624.31
Pakistan14.4764.7523.9013.9458.34
Sri Lanka2.5025.438.695.9167.99
Note: Maldives data is available until 2016.
Table 3. The Mann–Kendall test to assess the trend for particulate matters during 1998–2019.
CountryMann-KendallSen’s Slope Estimator
Bangladesh0.86 ***1.37
Bhutan 0.77 ***0.77
India0.83 ***0.96
Maldives−0.12−0.02
Nepal0.83 ***0.82
Pakistan0.52 **0.37
Sri Lanka0.57 **0.26
Note: α = 0.05 were considered statistically significant. *** indicates p < 0.0001 and ** indicates p < 0.001. Maldives data is available until 2016.
Table 4. Summary of PM2.5 concentrations in South Asian cities during 2016–2019.
CityMean ± SD (µg/m3)
AnnualWinterPre-MonsoonMonsoonPost-Monsoon
(DJF)(MAM)(JJA)(SON)
Chennai33 ± 1651 ± 1522 ± 625 ± 336 ± 17
Colombo28 ± 1444 ± 1126 ± 1016 ± 328 ± 12
Dhaka85 ± 59170 ± 3774 ± 2933 ± 767 ± 37
Hyderabad54 ± 2380 ± 1553 ± 827 ± 5.456 ± 20
Kathmandu48 ± 2880 ± 1660 ± 1519 ± 1034 ± 17
Kolkata79 ± 65166 ± 4849 ± 1927 ± 576 ± 55
Mumbai58 ± 38106 ± 2143 ± 2223 ± 661 ± 33
New Delhi110 ± 81188 ± 56 77 ± 1641 ± 13136 ± 102
Note: SD—standard deviation. Months are in parentheses.
Table 5. Pearson’s correlation analysis between daily averaged PM2.5 concentrations and meteorological variables in 2018.
CityPrecipitationRelative HumidityTemperatureWind Speed
Chennai−0.17 **0.32 **−0.74 **−0.18 **
Colombo−0.23 **−0.53 **−0.22 **−0.21 **
Dhaka−0.54 **−0.65 **−0.82 **−0.58 **
Hyderabad−0.38 **−0.61 **−0.32 **−0.64 **
Kathmandu−0.45 **−0.86 **−0.70 **−0.07
Kolkata−0.39 **−0.39 **−0.83 **−0.42 **
Mumbai−0.13 *−0.41 **−0.52 **−0.29 **
New Delhi−0.33 **−0.31 **−0.70 **−0.04
Level of significance: * p < 0.05; ** p < 0.01.
Table 6. Hourly air quality index (AQI) in South Asian cities during 2016–2019.
City Air Quality Index (%)
GoodModerateUnhealthy for Sensitive GroupsUnhealthyVery UnhealthyHazardous
Chennai13.7057.8016.6011.700.100.10
Colombo15.2057.8019.107.9000
Dhaka2.8026.8021.3033.3012.203.60
Hyderabad3.3030.702836.801.100.10
Kathmandu13.3034.4022.60281.600.10
Kolkata6.303120.4027.7010.703.90
Mumbai10.7035.1015.40344.400.40
New Delhi1.5020.3018.903713.608.70
Table 7. Deaths attributed to ambient PM2.5 air pollution in South Asian countries.
Country/YearMean Annual Exposure of PM2.5 Pollution (µg/m3) aNumber of Deaths from Ambient PM2.5 Pollution b
20002005201020152020 c2025 c20002005201020152020 d2025 d
Bangladesh6368.970.86767.768.485,700101,000110,300122,400126,478130,556
Bhutan39.7434439.839.940200300300400422444
India84.290.395.889.39090.8857,300895,900957,0001,090,4001,116,3001,142,200
Maldives11.111.411.39.407.76100100100100100100
Nepal88.993.2100.896.397.298.114,80015,300160,0018,30018,68919,078
Pakistan61.163.46860.16059.9110,800115,700123,600135,100137,800140,500
Sri Lanka31313125.323.321.3710082007400770077677833
Notes: a. [59]; b. [60]; grey color represents the projected values; c. considering the average annual growth rate of PM2.5 values between 2000–2015; d. considering the average number of deaths per year between 2000–2015.
Disclaimer/Publisher’s Note: The statements, opinions and data contained in all publications are solely those of the individual author(s) and contributor(s) and not of MDPI and/or the editor(s). MDPI and/or the editor(s) disclaim responsibility for any injury to people or property resulting from any ideas, methods, instructions or products referred to in the content.

