


Trailing Equatorial Plasma Bubble Occurrences at a Low-Latitude Location through Multi-GNSS Slant TEC Depletions during the Strong Geomagnetic Storms in the Ascending Phase of the 25th Solar Cycle
 , ,
, , 
Abstract
:1. Introduction
2. Materials and Methods
3. Results and Discussion
4. Summary and Conclusions
Author Contributions
Funding
Data Availability Statement
Acknowledgments
Conflicts of Interest
References
- Gentile, L.C.; Burke, W.J.; Rich, F.J. A Global Climatology for Equatorial Plasma Bubbles in the Topside Ionosphere. Ann. Geophys. 2006, 24, 163–172. [Google Scholar] [CrossRef]
- Katamzi-Joseph, Z.T.; Habarulema, J.B.; Hernández-Pajares, M. Midlatitude Postsunset Plasma Bubbles Observed over Europe during Intense Storms in April 2000 and 2001. Space Weather 2017, 15, 1177–1190. [Google Scholar] [CrossRef]
- Kumar, S. Morphology of Equatorial Plasma Bubbles during Low and High Solar Activity Years over Indian Sector. Astrophys. Space Sci. 2017, 362, 93. [Google Scholar] [CrossRef]
- Xiong, C.; Stolle, C.; Lühr, H.; Park, J.; Fejer, B.G.; Kervalishvili, G.N. Scale Analysis of Equatorial Plasma Irregularities Derived from Swarm Constellation. Earth Planets Space 2016, 68, 121. [Google Scholar] [CrossRef]
- Patil, A.S.; Nade, D.P.; Taori, A.; Pawar, R.P.; Pawar, S.M.; Nikte, S.S.; Pawar, S.D. A Brief Review of Equatorial Plasma Bubbles. Space Sci. Rev. 2023, 219, 16. [Google Scholar] [CrossRef]
- Lühr, H.; Xiong, C.; Park, J.; Rauberg, J. Systematic Study of Intermediate-Scale Structures of Equatorial Plasma Irregularities in the Ionosphere Based on CHAMP Observations. Front. Phys. 2014, 2, 15. [Google Scholar]
- Bhattacharyya, A. Equatorial Plasma Bubbles: A Review. Atmosphere 2022, 13, 1637. [Google Scholar] [CrossRef]
- Seemala, G.K.; Valladares, C.E. Statistics of Total Electron Content Depletions Observed over the South American Continent for the Year 2008. Radio Sci. 2011, 46, 1–14. [Google Scholar] [CrossRef]
- Ndinya, B.; George, O.; Uluma, E. Occurrence Characteristics of Equatorial Plasma Bubbles over Kisumu, Kenya during Solar Maximum of Solar Cycle 24. Int. J. Adv. Astron. 2021, 9, 1–9. [Google Scholar] [CrossRef]
- Patra, A.K.; Taori, A.; Chaitanya, P.P.; Sripathi, S. Direct Detection of Wavelike Spatial Structure at the Bottom of the F Region and Its Role on the Formation of Equatorial Plasma Bubble. J. Geophys. Res. Space Phys. 2013, 118, 1196–1202. [Google Scholar] [CrossRef]
- Li, G.; Ning, B.; Abdu, M.A.; Wan, W.; Hu, L. Precursor Signatures and Evolution of Post-Sunset Equatorial Spread-F Observed over Sanya. J. Geophys. Res. Space Phys. 2012, 117, A08321. [Google Scholar] [CrossRef]
- Ott, E. Theory of Rayleigh-Taylor Bubbles in the Equatorial Ionosphere. J. Geophys. Res. Space Phys. 1978, 83, 2066–2070. [Google Scholar] [CrossRef]
- Magdaleno, S.; Cueto, M.; Herraiz, M.; Rodríguez-Caderot, G.; Sardón, E.; Rodríguez, I. Ionospheric Bubbles Detection Algorithms: Analysis in Low Latitudes. J. Atmos. Sol.-Terr. Phys. 2013, 95–96, 65–77. [Google Scholar] [CrossRef]
- Portillo, A.; Herraiz, M.; Radicella, S.M.; Ciraolo, L. Equatorial Plasma Bubbles Studied Using African Slant Total Electron Content Observations. J. Atmos. Sol.-Terr. Phys. 2008, 70, 907–917. [Google Scholar] [CrossRef]
- Kriegel, M.; Jakowski, N.; Berdermann, J.; Sato, H.; Mersha, M.W. Scintillation Measurements at Bahir Dar during the High Solar Activity Phase of Solar Cycle 24. Ann. Geophys. 2017, 35, 97–106. [Google Scholar] [CrossRef]
- Kintner, P.M.; Ledvina, B.M.; de Paula, E.R. GPS and Ionospheric Scintillations. Space Weather 2007, 5, S09003. [Google Scholar] [CrossRef]
- Demyanov, V.V.; Yasyukevich, Y.V. Space Weather: Risk Factors for Global Navigation Satellite Systems. Solnechno-Zemn. Fiz. 2021, 7, 30–52. [Google Scholar] [CrossRef]
- Pradipta, R.; Doherty, P.H. Assessing the Occurrence Pattern of Large Ionospheric TEC Gradients over the Brazilian Airspace. NAVIGATION 2016, 63, 335–343. [Google Scholar] [CrossRef]
- Li, Q.; Zhu, Y.; Fang, K.; Fang, J. Statistical Study of the Seasonal Variations in TEC Depletion and the ROTI during 2013–2019 over Hong Kong. Sensors 2020, 20, 6200. [Google Scholar] [CrossRef]
- De Michelis, P.; Consolini, G.; Pignalberi, A.; Lovati, G.; Pezzopane, M.; Tozzi, R.; Giannattasio, F.; Coco, I.; Marcucci, M.F. Ionospheric Turbulence: A Challenge for GPS Loss of Lock Understanding. Space Weather 2022, 20, e2022SW003129. [Google Scholar] [CrossRef]
- De Michelis, P.; Consolini, G.; Tozzi, R.; Pignalberi, A.; Pezzopane, M.; Coco, I.; Giannattasio, F.; Marcucci, M.F. Ionospheric Turbulence and the Equatorial Plasma Density Irregularities: Scaling Features and RODI. Remote Sens. 2021, 13, 759. [Google Scholar] [CrossRef]
- De Michelis, P.; Consolini, G.; Alberti, T.; Tozzi, R.; Giannattasio, F.; Coco, I.; Pezzopane, M.; Pignalberi, A. Magnetic Field and Electron Density Scaling Properties in the Equatorial Plasma Bubbles. Remote Sens. 2022, 14, 918. [Google Scholar] [CrossRef]
- Pezzopane, M.; Pignalberi, A.; Coco, I.; Consolini, G.; De Michelis, P.; Giannattasio, F.; Marcucci, M.F.; Tozzi, R. Occurrence of GPS Loss of Lock Based on a Swarm Half-Solar Cycle Dataset and Its Relation to the Background Ionosphere. Remote Sens. 2021, 13, 2209. [Google Scholar] [CrossRef]
- Dashora, N.; Taori, A.; Patra, A. Multi-Instrument Observations of Winter-Solstice F Region Irregularities during the Low Solar Activity: New Results and Present Understanding. In Proceedings of the 39th COSPAR Scientific Assembly, Mysore, India, 14–22 July 2012; Volume 39, p. 415. [Google Scholar]
- Mohanty, S.; Singh, G.; Carrano, C.; Sripathi, S. Ionospheric Scintillation Observation Using Space-Borne Synthetic Aperture Radar (SAR) Data. Radio Sci. 2018, 53, 1187–1202. [Google Scholar] [CrossRef]
- McNamara, L.F.; Caton, R.G.; Parris, R.T.; Pedersen, T.R.; Thompson, D.C.; Wiens, K.C.; Groves, K.M. Groves Signatures of Equatorial Plasma Bubbles in VHF Satellite Scintillations and Equatorial Ionograms. Radio Sci. 2013, 48, 89–101. [Google Scholar] [CrossRef]
- Woodman, R.F.; La Hoz, C. Radar Observations of F Region Equatorial Irregularities. J. Geophys. Res. (1896–1977) 1976, 81, 5447–5466. [Google Scholar] [CrossRef]
- Whalen, J.A. Equatorial Bubbles Observed at the North and South Anomaly Crests: Dependence on Season, Local Time, and Dip Latitude. Radio Sci. 1997, 32, 1559–1566. [Google Scholar] [CrossRef]
- Pimenta, A.A.; Fagundes, P.R.; Sahai, Y.; Bittencourt, J.A.; Abalde, J.R. Equatorial F-Region Plasma Depletion Drifts: Latitudinal and Seasonal Variations. Ann. Geophys. 2003, 21, 2315–2322. [Google Scholar] [CrossRef]
- Haridas, S.; Unnikrishnan, K.; Choudhary, R.K.; Bose, P.D.; Rao, P.B. A Study on Equatorial Plasma Bubbles over Indian Sub-Continent Using Various Satellite Constellations and Techniques. AIP Conf. Proc. 2021, 2379, 020003. [Google Scholar] [CrossRef]
- Huang, F.; Lei, J.; Xiong, C.; Zhong, J.; Li, G. Observations of Equatorial Plasma Bubbles during the Geomagnetic Storm of October 2016. Earth Planet. Phys. 2021, 5, eepp2021043. [Google Scholar] [CrossRef]
- Kelley, M.C.; Larsen, M.F.; LaHoz, C.; McClure, J.P. Gravity Wave Initiation of Equatorial Spread F: A Case Study. J. Geophys. Res. Space Phys. 1981, 86, 9087–9100. [Google Scholar] [CrossRef]
- Pillat, V.G.; Fagundes, P.R.; Guimarães, L.N.F. Automatically Identification of Equatorial Spread-F Occurrence on Ionograms. J. Atmos. Sol.-Terr. Phys. 2015, 135, 118–125. [Google Scholar] [CrossRef]
- Li, G. Equinoctial and June Solstitial F-region Irregularities over Sanya. Indian J. Radio Space Phys. 2012, 42, 184. [Google Scholar]
- Nakata, H.; Takahashi, A.; Takano, T.; Saito, A.; Sakanoi, T. Observation of Equatorial Plasma Bubbles by the Airglow Imager on ISS-IMAP. Prog. Earth Planet. Sci. 2018, 5, 66. [Google Scholar] [CrossRef]
- Zakharenkova, I.; Cherniak, I. Effects of Storm-Induced Equatorial Plasma Bubbles on GPS-Based Kinematic Positioning at Equatorial and Middle Latitudes during the September 7–8, 2017, Geomagnetic Storm. GPS Solut. 2021, 25, 132. [Google Scholar] [CrossRef]
- Astafyeva, E.; Yasyukevich, Y.V.; Maletckii, B.; Oinats, A.; Vesnin, A.; Yasyukevich, A.S.; Syrovatskii, S.; Guendouz, N. Ionospheric Disturbances and Irregularities During the 25–26 August 2018 Geomagnetic Storm. J. Geophys. Res. Space Phys. 2022, 127, e2021JA029843. [Google Scholar] [CrossRef]
- Mersha, M.W.; Lewi, E.; Jakowski, N.; Wilken, V.; Berdermann, J.; Kriegel, M.; Damtie, B. A Method for Automatic Detection of Plasma Depletions by Using GNSS Measurements. Radio Sci. 2020, 55, e2019RS006978. [Google Scholar] [CrossRef]
- Nishioka, M.; Saito, A.; Tsugawa, T. Occurrence Characteristics of Plasma Bubble Derived from Global Ground-Based GPS Receiver Networks. J. Geophys. Res. Space Phys. 2008, 113, 1–12. [Google Scholar] [CrossRef]
- Nguyen, V.K.; Rovira-Garcia, A.; Juan, J.M.; Sanz, J.; González-Casado, G.; La, T.V.; Ta, T.H. Measuring Phase Scintillation at Different Frequencies with Conventional GNSS Receivers Operating at 1 Hz. J. Geod. 2019, 93, 1985–2001. [Google Scholar] [CrossRef]
- Panda, S.K.; Moses, M.; Ansari, K.; Walo, J. Ionospheric Scintillation Characteristics over Indian Region from Latitudinally-Aligned Geodetic GPS Observations. Earth Sci. Inform. 2023, 16, 2675–2691. [Google Scholar] [CrossRef]
- Vankadara, R.K.; Panda, S.K.; Amory-Mazaudier, C.; Fleury, R.; Devananboyina, V.R.; Pant, T.K.; Jamjareegulgarn, P.; Haq, M.A.; Okoh, D.; Seemala, G.K. Signatures of Equatorial Plasma Bubbles and Ionospheric Scintillations from Magnetometer and GNSS Observations in the Indian Longitudes during the Space Weather Events of Early September 2017. Remote Sens. 2022, 14, 652. [Google Scholar] [CrossRef]
- Zakharenkova, I.; Astafyeva, E.; Cherniak, I. GPS and in Situ Swarm Observations of the Equatorial Plasma Density Irregularities in the Topside Ionosphere. Earth Planets Space 2016, 68, 120. [Google Scholar] [CrossRef]
- Cherniak, I.; Zakharenkova, I.; Sokolovsky, S. Multi-Instrumental Observation of Storm-Induced Ionospheric Plasma Bubbles at Equatorial and Middle Latitudes. J. Geophys. Res. Space Phys. 2019, 124, 1491–1508. [Google Scholar] [CrossRef]
- Huang, C.Y.; Burke, W.J.; Machuzak, J.S.; Gentile, L.C.; Sultan, P.J. Equatorial Plasma Bubbles Observed by DMSP Satellites during a Full Solar Cycle: Toward a Global Climatology. J. Geophys. Res. Space Phys. 2002, 107, SIA 7-1. [Google Scholar] [CrossRef]
- Eastes, R.W.; McClintock, W.E.; Burns, A.G.; Anderson, D.N.; Andersson, L.; Codrescu, M.; Correira, J.T.; Daniell, R.E.; England, S.L.; Evans, J.S.; et al. The Global-Scale Observations of the Limb and Disk (GOLD) Mission. Space Sci. Rev. 2017, 212, 383–408. [Google Scholar] [CrossRef]
- Martinis, C.; Daniell, R.; Eastes, R.; Norrell, J.; Smith, J.; Klenzing, J.; Solomon, S.; Burns, A. Longitudinal Variation of Postsunset Plasma Depletions From the Global-Scale Observations of the Limb and Disk (GOLD) Mission. J. Geophys. Res. Space Phys. 2021, 126, e2020JA028510. [Google Scholar] [CrossRef]
- Cai, X.; Burns, A.G.; Wang, W.; Coster, A.; Qian, L.; Liu, J.; Solomon, S.C.; Eastes, R.W.; Daniell, R.E.; McClintock, W.E. Comparison of GOLD Nighttime Measurements With Total Electron Content: Preliminary Results. J. Geophys. Res. Space Phys. 2020, 125, e2019JA027767. [Google Scholar] [CrossRef]
- Karan, D.K.; Eastes, R.W.; Martinis, C.; Daniell, R.E.; Solomon, S.C.; McClintock, W.E. Unique Combinations of Differently Shaped Equatorial Plasma Bubbles Occurring Within a Small Longitude Range. ESS Open Arch. 2023. [Google Scholar] [CrossRef]
- Karan, D.K.; Eastes, R.W.; Daniell, R.E.; Martinis, C.R.; McClintock, W.E. GOLD Mission’s Observation About the Geomagnetic Storm Effects on the Nighttime Equatorial Ionization Anomaly (EIA) and Equatorial Plasma Bubbles (EPB) During a Solar Minimum Equinox. Space Weather 2023, 21, e2022SW003321. [Google Scholar] [CrossRef]
- Aa, E.; Zhang, S.-R.; Liu, G.; Eastes, R.W.; Wang, W.; Karan, D.K.; Qian, L.; Coster, A.J.; Erickson, P.J.; Derghazarian, S. Statistical Analysis of Equatorial Plasma Bubbles Climatology and Multi-Day Periodicity Using GOLD Observations. Geophys. Res. Lett. 2023, 50, e2023GL103510. [Google Scholar] [CrossRef]
- Atıcı, R.; Sağır, S. Global Investigation of the Ionospheric Irregularities during the Severe Geomagnetic Storm on September 7–8, 2017. Geod. Geodyn. 2020, 11, 211–221. [Google Scholar] [CrossRef]
- Kassa, T.; Damtie, B. Ionospheric Irregularities over Bahir Dar, Ethiopia during Selected Geomagnetic Storms. Adv. Space Res. 2017, 60, 121–129. [Google Scholar] [CrossRef]
- Huang, C.-S. Continuous Penetration of the Interplanetary Electric Field to the Equatorial Ionosphere over Eight Hours during Intense Geomagnetic Storms. J. Geophys. Res. Space Phys. 2008, 113, A11305. [Google Scholar] [CrossRef]
- Oladipo, O.A.; Adeniyi, J.O.; Olawepo, A.O.; Doherty, P.H. Large-Scale Ionospheric Irregularities Occurrence at Ilorin, Nigeria. Space Weather 2014, 12, 300–305. [Google Scholar] [CrossRef]
- Nayak, C.; Tsai, L.-C.; Su, S.-Y.; Galkin, I.A.; Caton, R.G.; Groves, K.M. Suppression of Ionospheric Scintillation during St. Patrick’s Day Geomagnetic Super Storm as Observed over the Anomaly Crest Region Station Pingtung, Taiwan: A Case Study. Adv. Space Res. 2017, 60, 396–405. [Google Scholar] [CrossRef]
- Dugassa, T.; Habarulema, J.B.; Nigussie, M. Longitudinal Variability of Occurrence of Ionospheric Irregularities over the American, African and Indian Regions during Geomagnetic Storms. Adv. Space Res. 2019, 63, 2609–2622. [Google Scholar] [CrossRef]
- Palmroth, M.; Laakso, H.; Fejer, B.G.; Pfaff, R.F., Jr. DE 2 Observations of Morningside and Eveningside Plasma Density Depletions in the Equatorial Ionosphere. J. Geophys. Res. Space Phys. 2000, 105, 18429–18442. [Google Scholar] [CrossRef]
- Kuai, J.; Liu, L.; Liu, J.; Sripathi, S.; Zhao, B.; Chen, Y.; Le, H.; Hu, L. Effects of Disturbed Electric Fields in the Low-Latitude and Equatorial Ionosphere during the 2015 St. Patrick’s Day Storm. J. Geophys. Res. Space Phys. 2016, 121, 9111–9126. [Google Scholar] [CrossRef]
- Timoçin, E.; Inyurt, S.; Temuçin, H.; Ansari, K.; Jamjareegulgarn, P. Investigation of Equatorial Plasma Bubble Irregularities under Different Geomagnetic Conditions during the Equinoxes and the Occurrence of Plasma Bubble Suppression. Acta Astronaut. 2020, 177, 341–350. [Google Scholar] [CrossRef]
- Tulasi Ram, S.; Rama Rao, P.V.S.; Prasad, D.S.V.V.D.; Niranjan, K.; Gopi Krishna, S.; Sridharan, R.; Ravindran, S. Local Time Dependent Response of Postsunset ESF during Geomagnetic Storms. J. Geophys. Res. Space Phys. 2008, 113, A07310. [Google Scholar] [CrossRef]
- Sripathi, S.; Banola, S.; Emperumal, K.; Suneel Kumar, B.; Radicella, S.M. The Role of Storm Time Electrodynamics in Suppressing the Equatorial Plasma Bubble Development in the Recovery Phase of a Geomagnetic Storm. J. Geophys. Res. Space Phys. 2018, 123, 2336–2350. [Google Scholar] [CrossRef]
- Brahmanandam, P.S.; Uma, G.; Pant, T.K. Ionosphere VHF Scintillations over Vaddeswaram (Geographic Latitude 16.31° N, Geographic Longitude 80.30° E, Dip 18° N), a Latitude Indian Station—A Case Study. Adv. Space Res. 2017, 60, 1688–1697. [Google Scholar] [CrossRef]
- Tadivaka, R.V.; Paruchuri, B.P.; Miriyala, S.; Koppireddi, P.R.; Devanaboyina, V.R. Detection of Ionospheric Scintillation Effects Using LMD–DFA. Acta Geophys. 2017, 65, 777–784. [Google Scholar] [CrossRef]
- Sridhar, M.; Raju, K.P.; Rao, C.S.; Ratnam, D.V. Mitigation of Ionospheric Scintillations for GPS Signals under Geomagnetic Storm Conditions Using LMS Adaptive Filter. Int. J. Inf. Commun. Technol. 2016, 9, 389–407. [Google Scholar] [CrossRef]
- Ratnam, D.V.; Sivavaraprasad, G.; Lee, J. Automatic Ionospheric Scintillation Detector for Global Navigation Satellite System Receivers. IET Radar Sonar Navig. 2015, 9, 702–711. [Google Scholar] [CrossRef]
- Raghunath, S.; Ratnam, D.V. Detection of Low-Latitude Ionospheric Irregularities From GNSS Observations. IEEE J. Sel. Top. Appl. Earth Obs. Remote Sens. 2015, 8, 5171–5176. [Google Scholar] [CrossRef]
- Vankadara, R.K.; Reddybattula, K.D.; Panda, S.K. Multi-Constellation GNSS Ionospheric Scintillation Monitoring through PolaRx5S Receiver at a Low Latitude Station in India. In Proceedings of the 2021 IEEE International Women in Engineering (WIE) Conference on Electrical and Computer Engineering (WIECON-ECE), Dhaka, Bangladesh, 4–5 December 2021; pp. 184–187. [Google Scholar]
- Vankadara, R.K.; Sasmal, S.; Maurya, A.K.; Panda, S.K. An Autoregressive Integrated Moving Average (ARIMA) Based Forecasting of Ionospheric Total Electron Content at a Low Latitude Indian Location. In Proceedings of the 2022 URSI Regional Conference on Radio Science (USRI-RCRS), Indore, India, 1–4 December 2022; pp. 1–4. [Google Scholar]
- Vankadara, R.K.; Ratnam Devanaboyina, V.; Panda, S.K. Zonal Irregularity Drift Characteristics of Ionospheric Scintillations from Two Closely-Spaced Global Navigation Satellite System Receivers at an Indian Low Latitude Location. In Proceedings of the 2022 IEEE 11th International Conference on Communication Systems and Network Technologies (CSNT), Indore, India, 23–24 April 2022; pp. 510–514. [Google Scholar]
- Vankadara, R.K.; Panda, S.K. Loss of Lock Characteristics of Global Positioning System Signals Under Ionospheric Scintillations at Guntur, India. In Proceedings of the 2023 International Conference on Smart Systems for applications in Electrical Sciences (ICSSES), Tumakuru, India, 7–8 July 2023; pp. 1–4. [Google Scholar]
- Yasyukevich, Y.V.; Mylnikova, A.A.; Polyakova, A.S. Estimating the Total Electron Content Absolute Value from the GPS/GLONASS Data. Results Phys. 2015, 5, 32–33. [Google Scholar] [CrossRef]
- Yasyukevich, Y.V.; Mylnikova, A.A.; Kunitsyn, V.E.; Padokhin, A.M. Influence of GPS/GLONASS Differential Code Biases on the Determination Accuracy of the Absolute Total Electron Content in the Ionosphere. Geomagn. Aeron. 2015, 55, 763–769. [Google Scholar] [CrossRef]
- Mylnikova, A.A.; Yasyukevich, Y.V.; Kunitsyn, V.E.; Padokhin, A.M. Variability of GPS/GLONASS Differential Code Biases. Results Phys. 2015, 5, 9–10. [Google Scholar] [CrossRef]
- Seemala, G.K. Chapter 4—Estimation of Ionospheric Total Electron Content (TEC) from GNSS Observations. In Atmospheric Remote Sensing; Kumar Singh, A., Tiwari, S., Eds.; Elsevier: Amsterdam, The Netherlands, 2023; pp. 63–84. ISBN 978-0-323-99262-6. [Google Scholar]
- Magdaleno, S.; Herraiz, M.; Altadill, D.; de la Morena, B.A. Climatology Characterization of Equatorial Plasma Bubbles Using GPS Data. J. Space Weather Space Clim. 2017, 7, 12. [Google Scholar] [CrossRef]
- Blanch, E.; Altadill, D.; Juan, J.M.; Camps, A.; Barbosa, J.; González-Casado, G.; Riba, J.; Sanz, J.; Vazquez, G.; Orús-Pérez, R. Improved Characterization and Modeling of Equatorial Plasma Depletions. J. Space Weather Space Clim. 2018, 8, A38. [Google Scholar] [CrossRef]
- Aa, E.; Zou, S.; Eastes, R.; Karan, D.K.; Zhang, S.-R.; Erickson, P.J.; Coster, A.J. Coordinated Ground-Based and Space-Based Observations of Equatorial Plasma Bubbles. J. Geophys. Res. (Space Phys.) 2020, 125, e27569. [Google Scholar] [CrossRef]
- Yasyukevich, Y.V.; Kiselev, A.V.; Zhivetiev, I.V.; Edemskiy, I.K.; Syrovatskii, S.V.; Maletckii, B.M.; Vesnin, A.M. SIMuRG: System for Ionosphere Monitoring and Research from GNSS. GPS Solut. 2020, 24, 69. [Google Scholar] [CrossRef]
- Bojilova, R.; Mukhtarov, P. Analysis of the Ionospheric Response to Sudden Stratospheric Warming and Geomagnetic Forcing over Europe during February and March 2023. Universe 2023, 9, 351. [Google Scholar] [CrossRef]
- Lan, T.T.; Fleury, R.; Amory-Mazaudier, C.; Thang, N.C.; Thanh, N.H. TEC Variations and Ionospheric Disturbances during the Magnetic Storm in March 2015 Observed from Continuous GPS Data in the Southeast Asia Region. Vietnam J. Earth Sci. 2016, 38, 267–285. [Google Scholar] [CrossRef]
- Alves, M.V.; Echer, E.; Gonzalez, W.D. Geoeffectiveness of Corotating Interaction Regions as Measured by Dst Index. J. Geophys. Res. Space Phys. 2006, 111, A07S05. [Google Scholar] [CrossRef]
- Fejer, B.G. Effects of the Vertical Plasma Drift Velocity on the Generation and Evolution of Equatorial Spread F. J. Geophys. Res. Space Phys. 1999, 104, 19859–19869. [Google Scholar] [CrossRef]
- Biktash, L.Z. Role of the Magnetospheric and Ionospheric Currents in the Generation of the Equatorial Scintillations during Geomagnetic Storms. Ann. Geophys. 2004, 22, 3195–3202. [Google Scholar] [CrossRef]
- Tsurutani, B.; Mannucci, A.; Iijima, B.; Abdu, M.A.; Sobral, J.H.A.; Gonzalez, W.; Guarnieri, F.; Tsuda, T.; Saito, A.; Yumoto, K.; et al. Global Dayside Ionospheric Uplift and Enhancement Associated with Interplanetary Electric Fields. J. Geophys. Res. Space Phys. 2004, 109, A08302. [Google Scholar] [CrossRef]
- Liu, Y.; Fu, L.; Wang, J.; Zhang, C. Studying Ionosphere Responses to a Geomagnetic Storm in June 2015 with Multi-Constellation Observations. Remote Sens. 2018, 10, 666. [Google Scholar] [CrossRef]
- Hussien, F.; Ghamry, E.; Fathy, A. A Statistical Analysis of Plasma Bubbles Observed by Swarm Constellation during Different Types of Geomagnetic Storms. Universe 2021, 7, 90. [Google Scholar] [CrossRef]
- Rama Rao, P.; Gopi Krishna, S.; Niranjan, K.; Prasad, D. Study of Spatial and Temporal Characteristics of L-Band Scintillations over the Indian Low-Latitude Region and Their Possible Effects on GPS Navigation; Copernicus GmbH: Göttingen, Germany, 2006; Volume 24, pp. 1567–1580. [Google Scholar]
- Yang, Z.; Morton, Y.T.J. Low-Latitude GNSS Ionospheric Scintillation Dependence on Magnetic Field Orientation and Impacts on Positioning. J. Geod. 2020, 94, 59. [Google Scholar] [CrossRef]
- Magdaleno, S.; Herraiz, M.; de la Morena, B.A. Characterization of Equatorial Plasma Depletions Detected from Derived GPS Data in South America. J. Atmos. Sol.-Terr. Phys. 2012, 74, 136–144. [Google Scholar] [CrossRef]
- Deng, B.; Huang, J.; Kong, D.; Xu, J.; Wan, D.; Lin, G. Temporal and Spatial Distributions of TEC Depletions with Scintillations and ROTI over South China. Adv. Space Res. 2015, 55, 259–268. [Google Scholar] [CrossRef]


| S.No. | GNSS Constellation (RINEX Symbols) | Available Frequencies (GHz) for Scintillation Indices | Signal Combinations for TEC | ||
|---|---|---|---|---|---|
| Signal 1 | Signal 2 | Signal 3 | |||
| 1 | GPS (G) | L1 (1.57) | L2 (1.22) | L5 (1.17) | L1P-L2P |
| 2 | GLONASS (R) | L1 (1.60) | L2 (1.24) | NA | L1CA-L2CA |
| 3 | Galileo (E) | E1 (1.57) | E5a (1.17) | E5b (1.20) | E1-E5a |
| 4 | BeiDou (C) | B1 (1.56) | B3 (1.26) | B2 (1.20) | B1-B2 |
| 5 | GAGAN (S) | L1 (1.57) | NA | L5 (1.17) | L1CA-L5 |
| 6 | IRNSS/NavIC (I) | NA | NA | L5 (1.17) | NA |
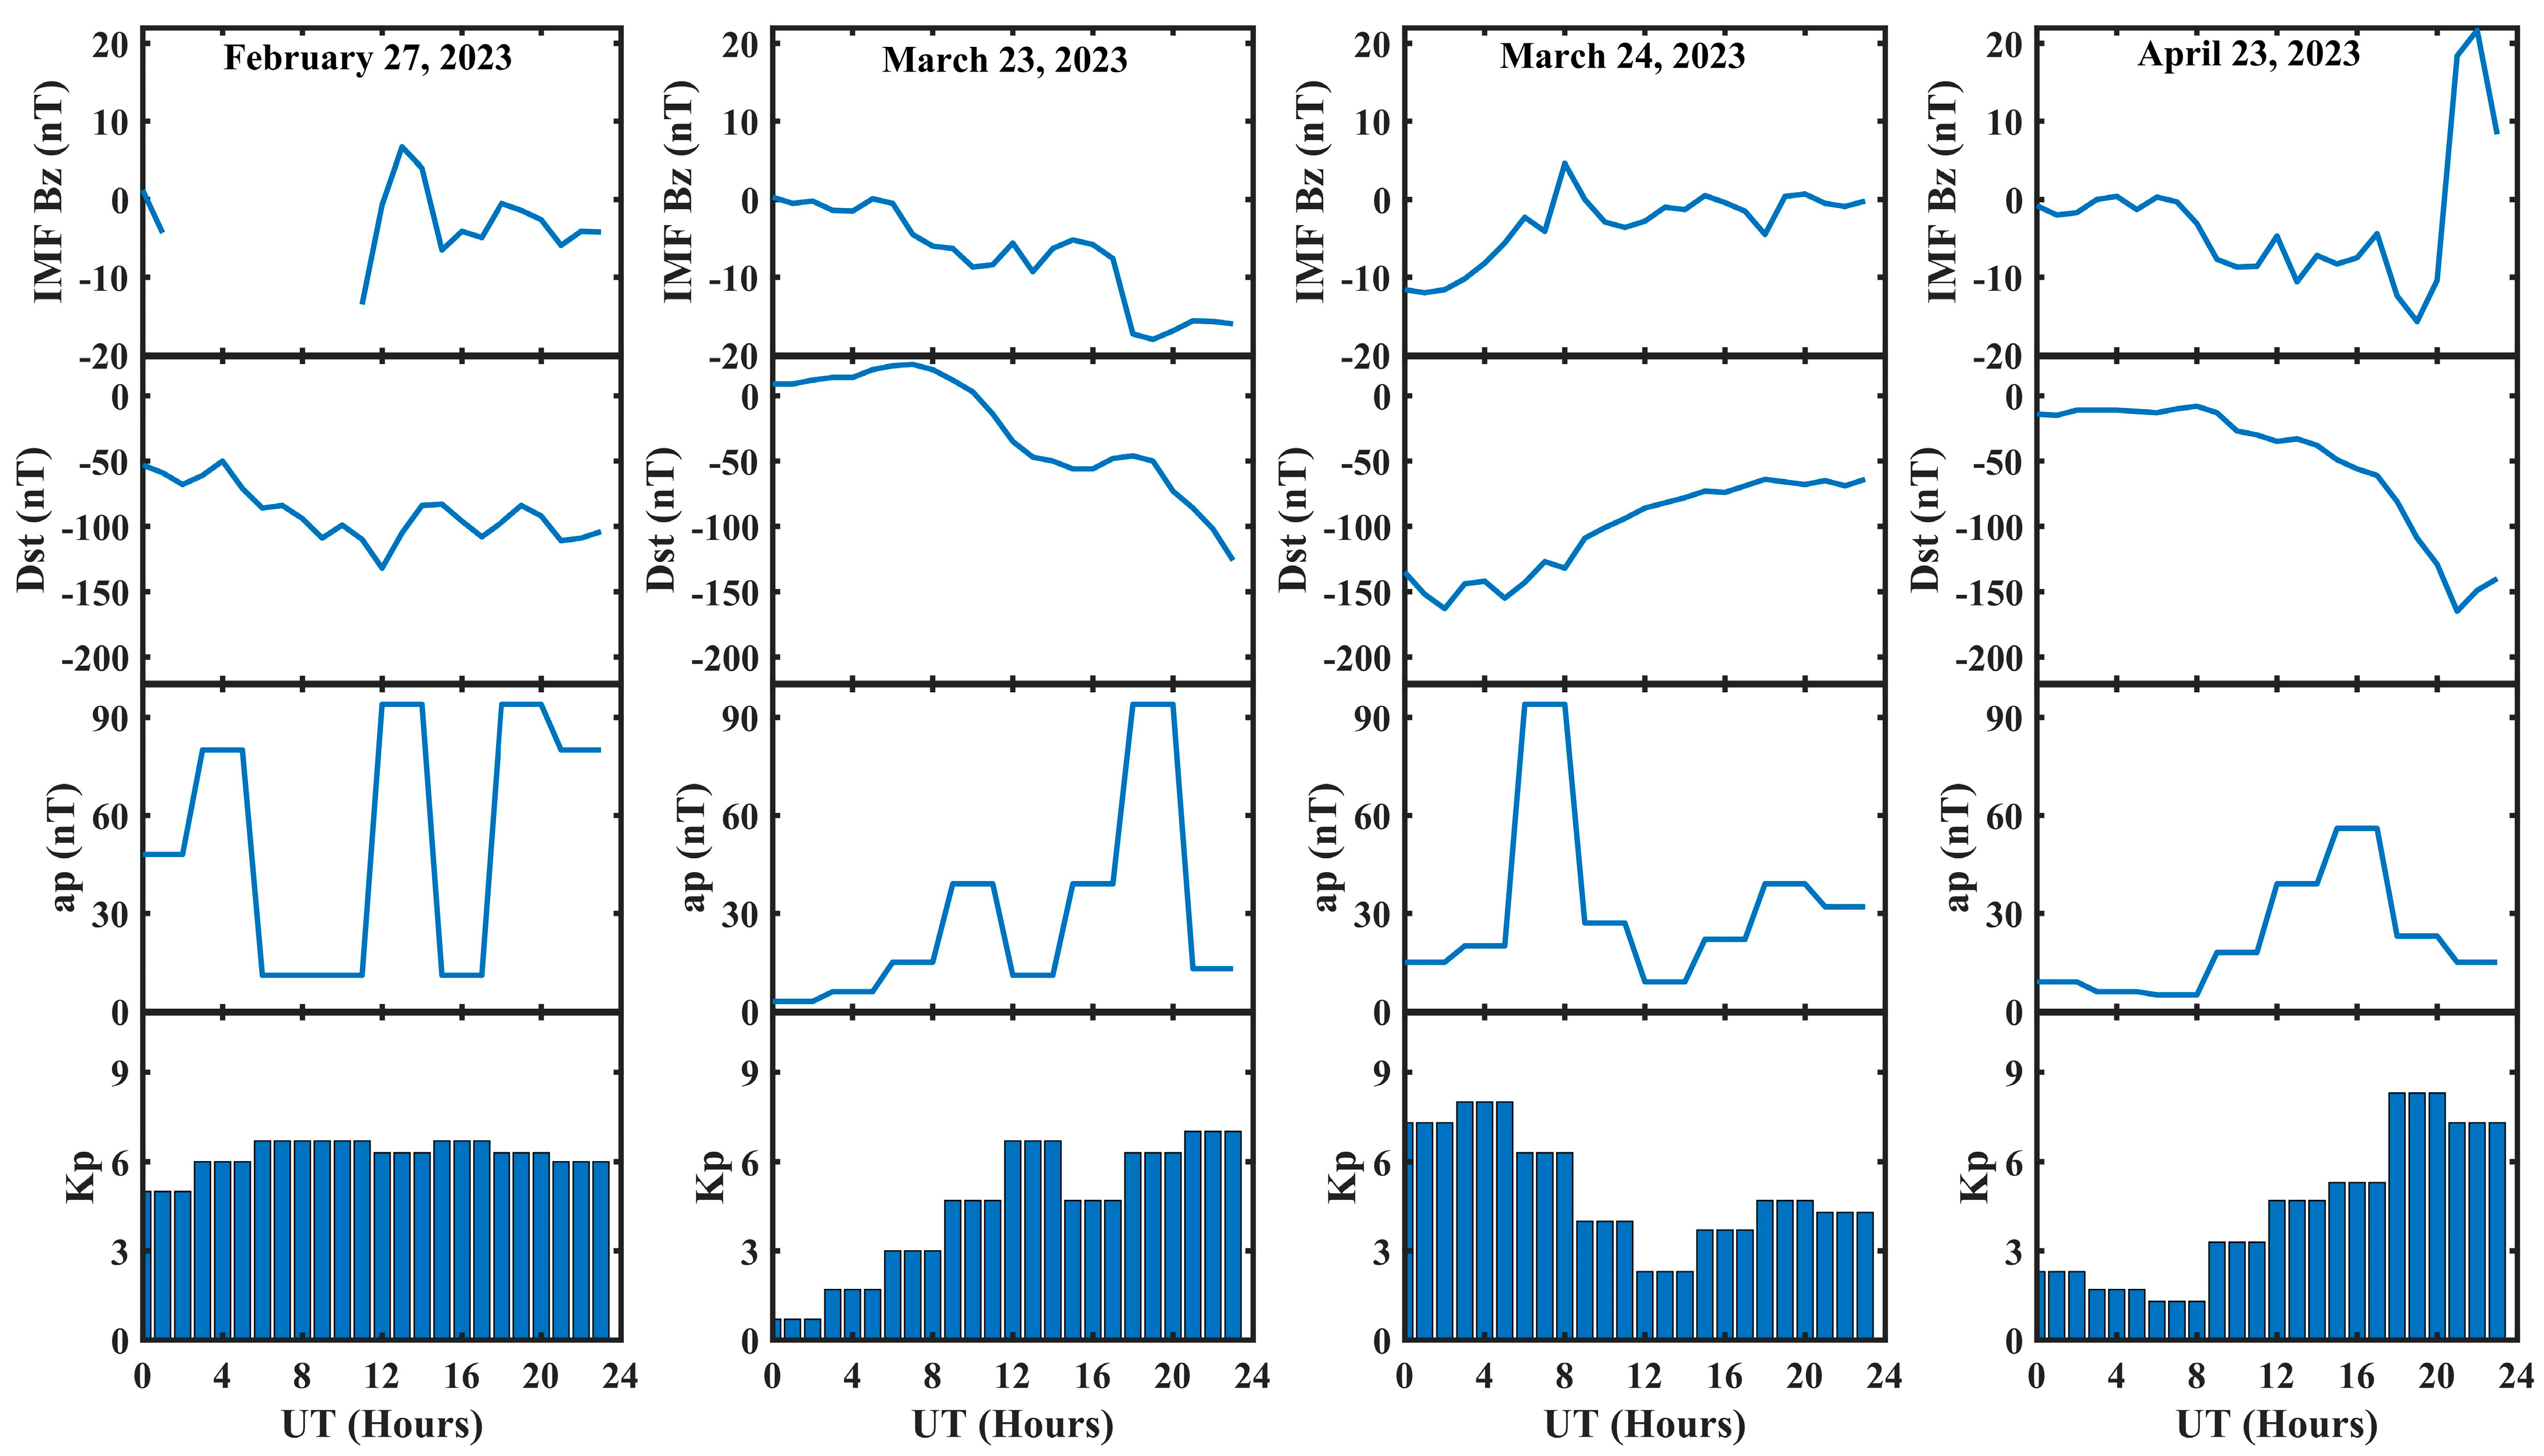
| S. No | Geomagnetic Indices | 27 February 2023 | 23 March 2023 | 24 March 2023 | 23 April 2023 |
|---|---|---|---|---|---|
| 1 | IMF Bz (nT) | 6.7 | 0.3 | 4.6 | 21.7 |
| 2 | Dst (nT) | −132 | −126 | −156 | −165 |
| 3 | ap (nT) | 94 | 94 | 94 | 56 |
| 4 | Kp | 6.7 | 7 | 8 | 8.3 |
| S. No | GNSS Constellation | Maximum Depletion Depth Δ(sTEC) in TECU | Apparent Duration (tsTEC) in Minutes | Ionospheric Delays in Meters | ||
|---|---|---|---|---|---|---|
| Signal 1 | Signal 2 | Signal 3 | ||||
| 1 | GPS (G) | 45 | 48 | 7.29 | 12.05 | 13.09 |
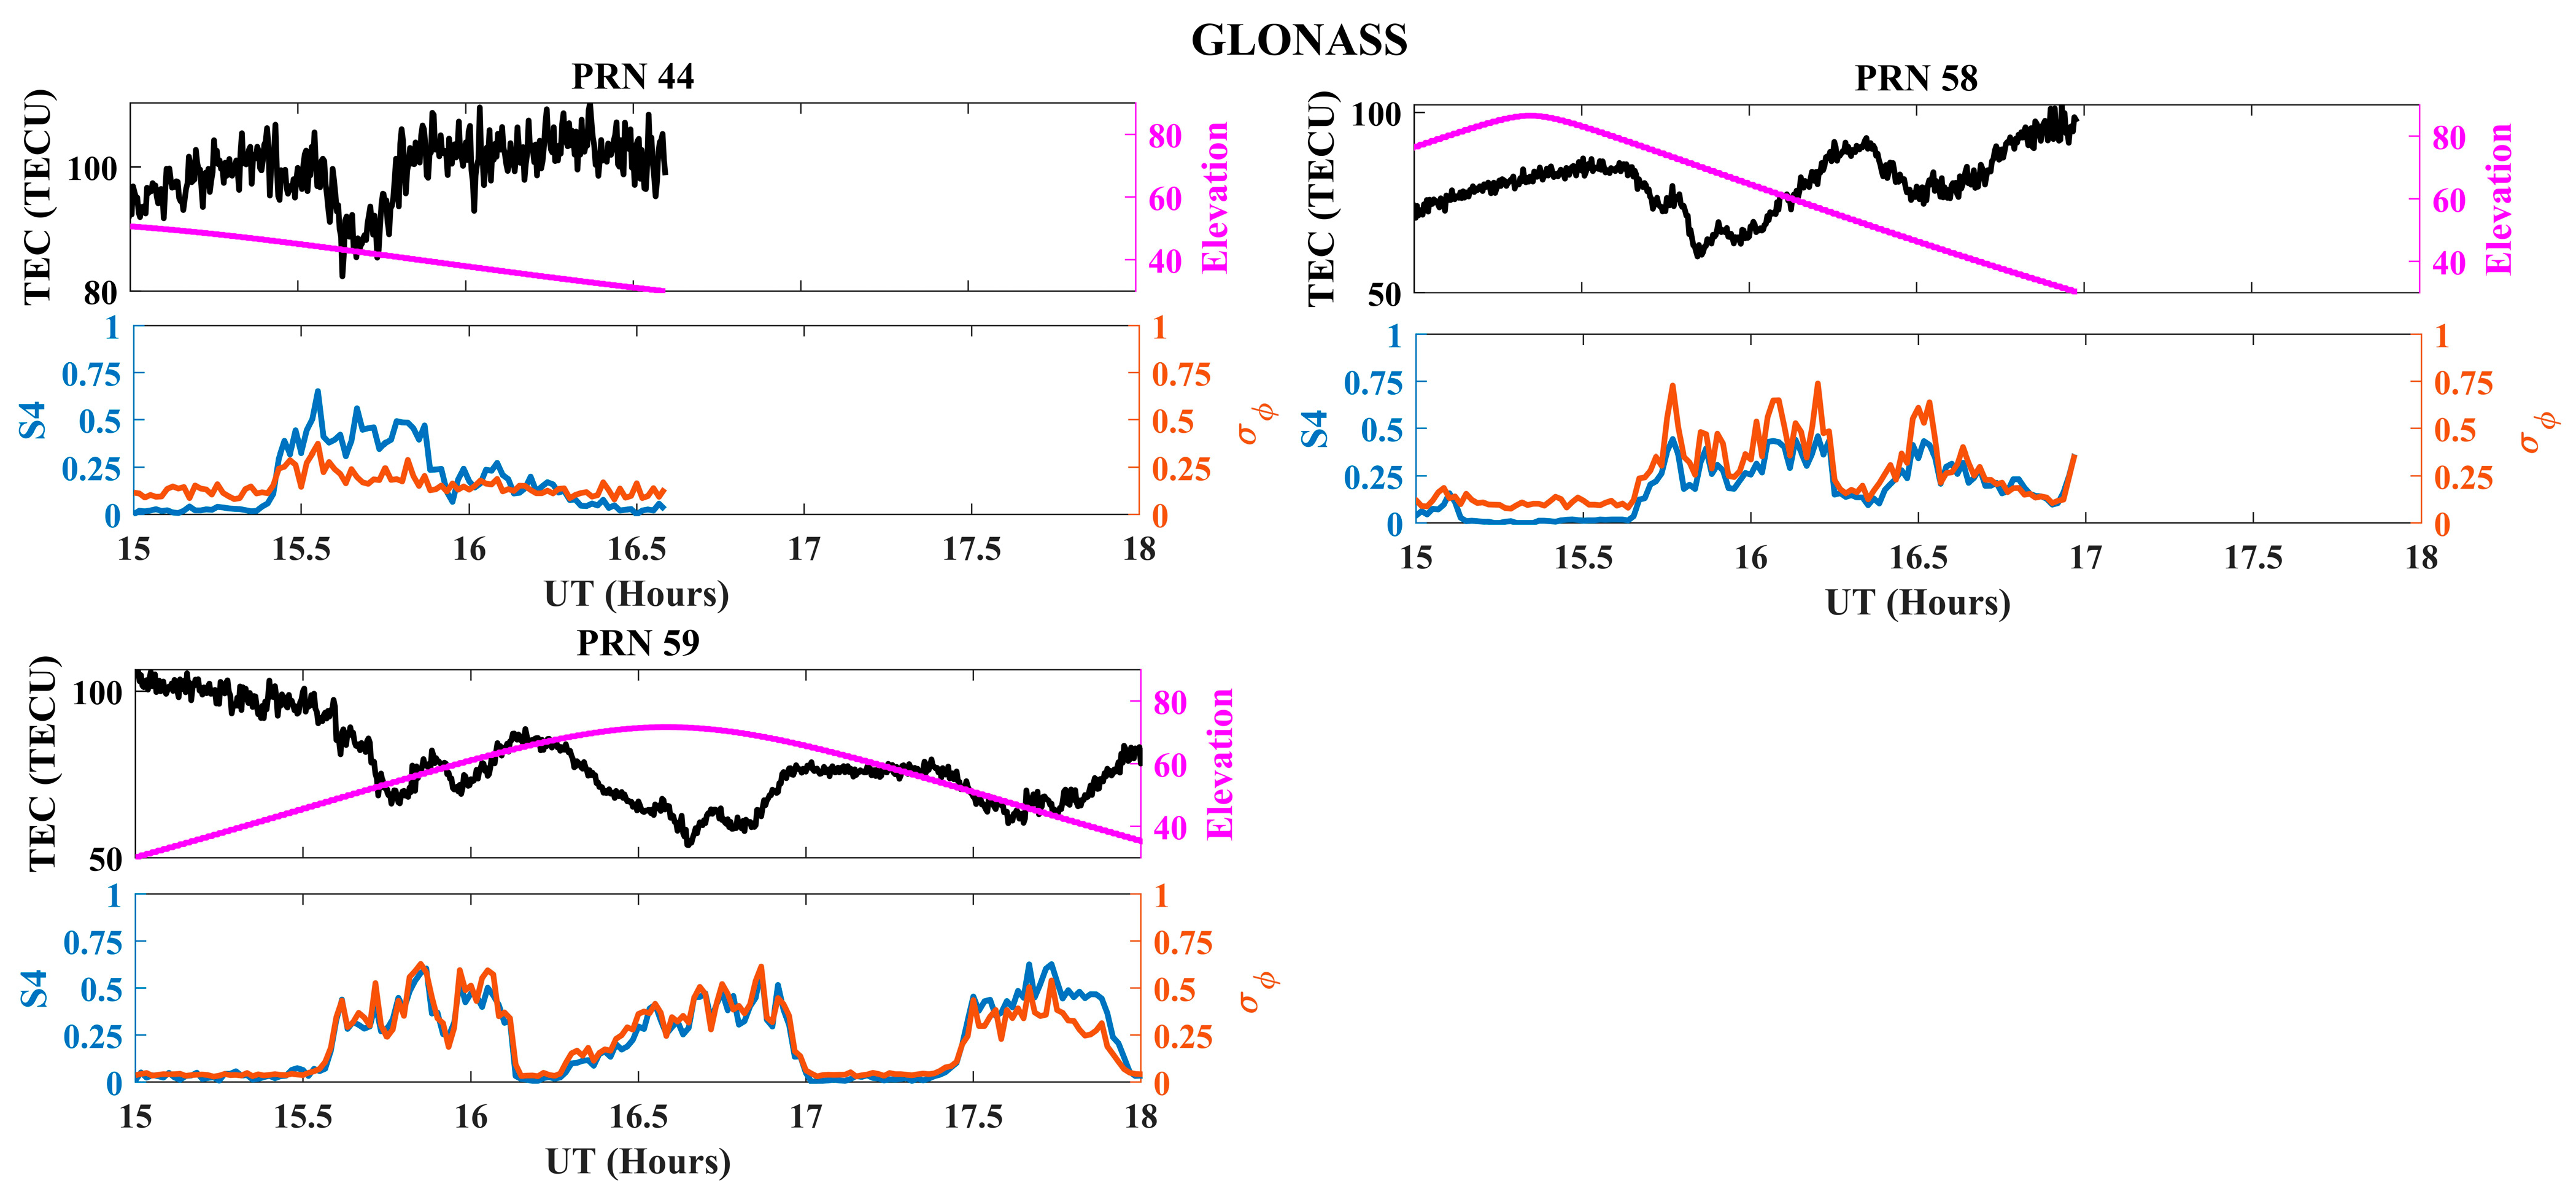
| 2 | GLONASS (R) | 25 | 45 | 3.92 | 6.47 | - |
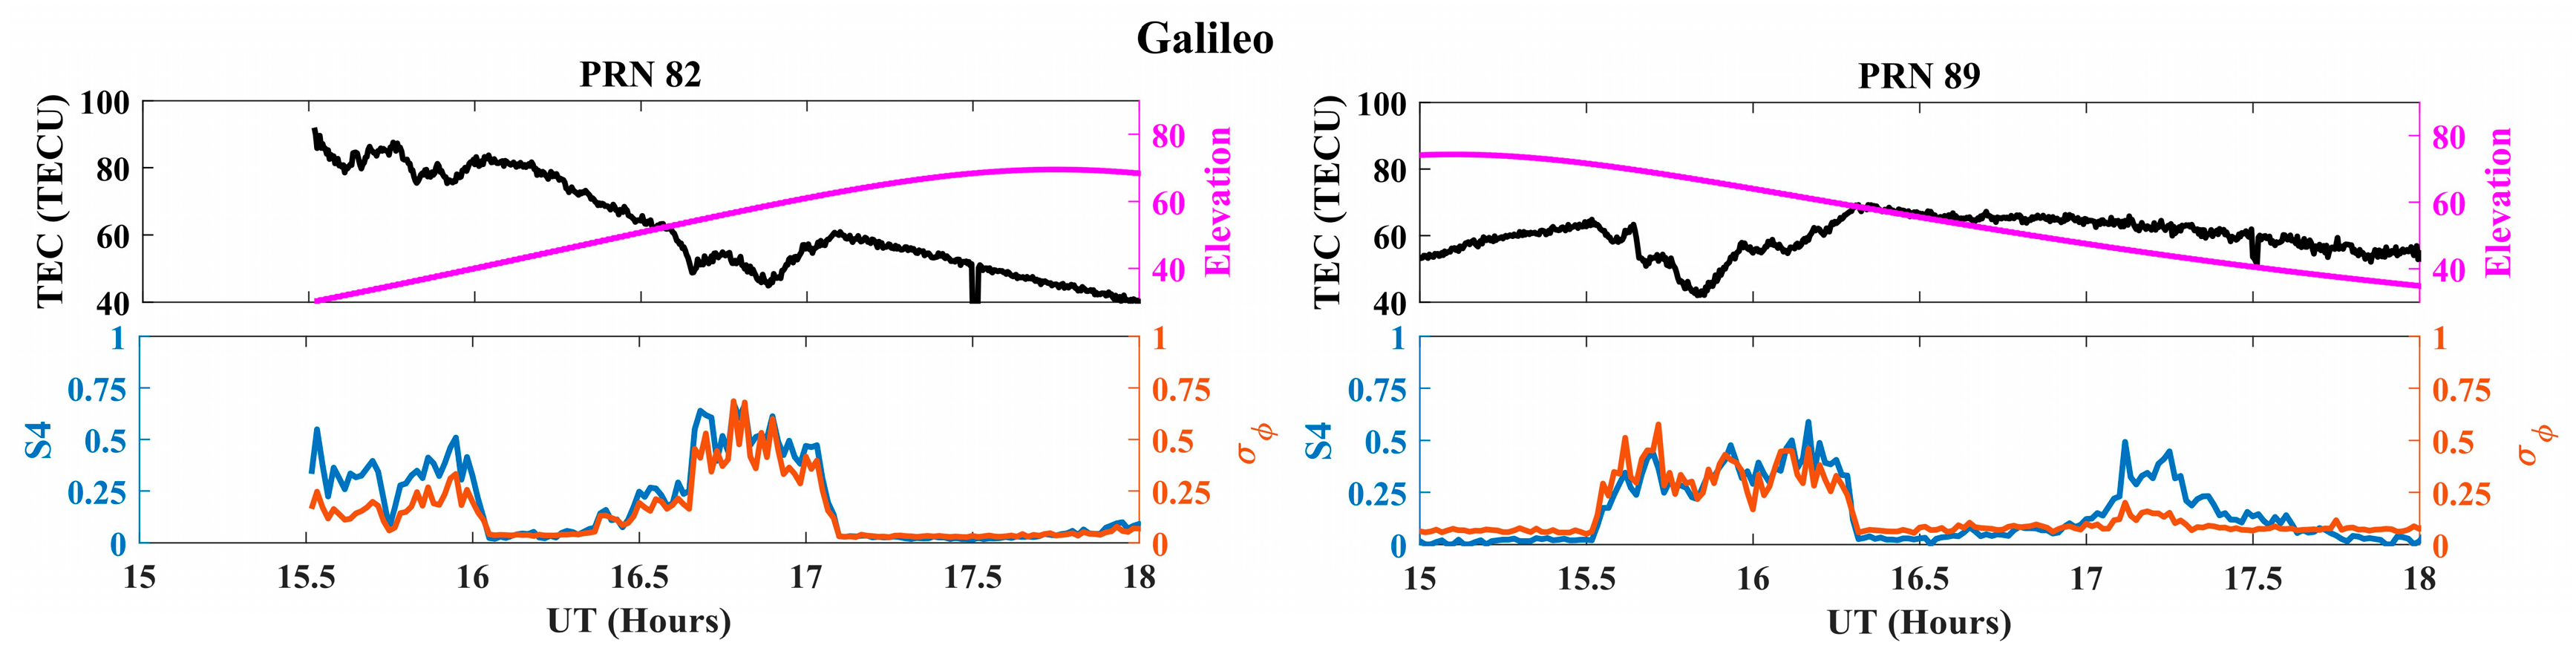
| 3 | Galileo (E) | 22 | 40 | 3.56 | 5.87 | 6.40 |
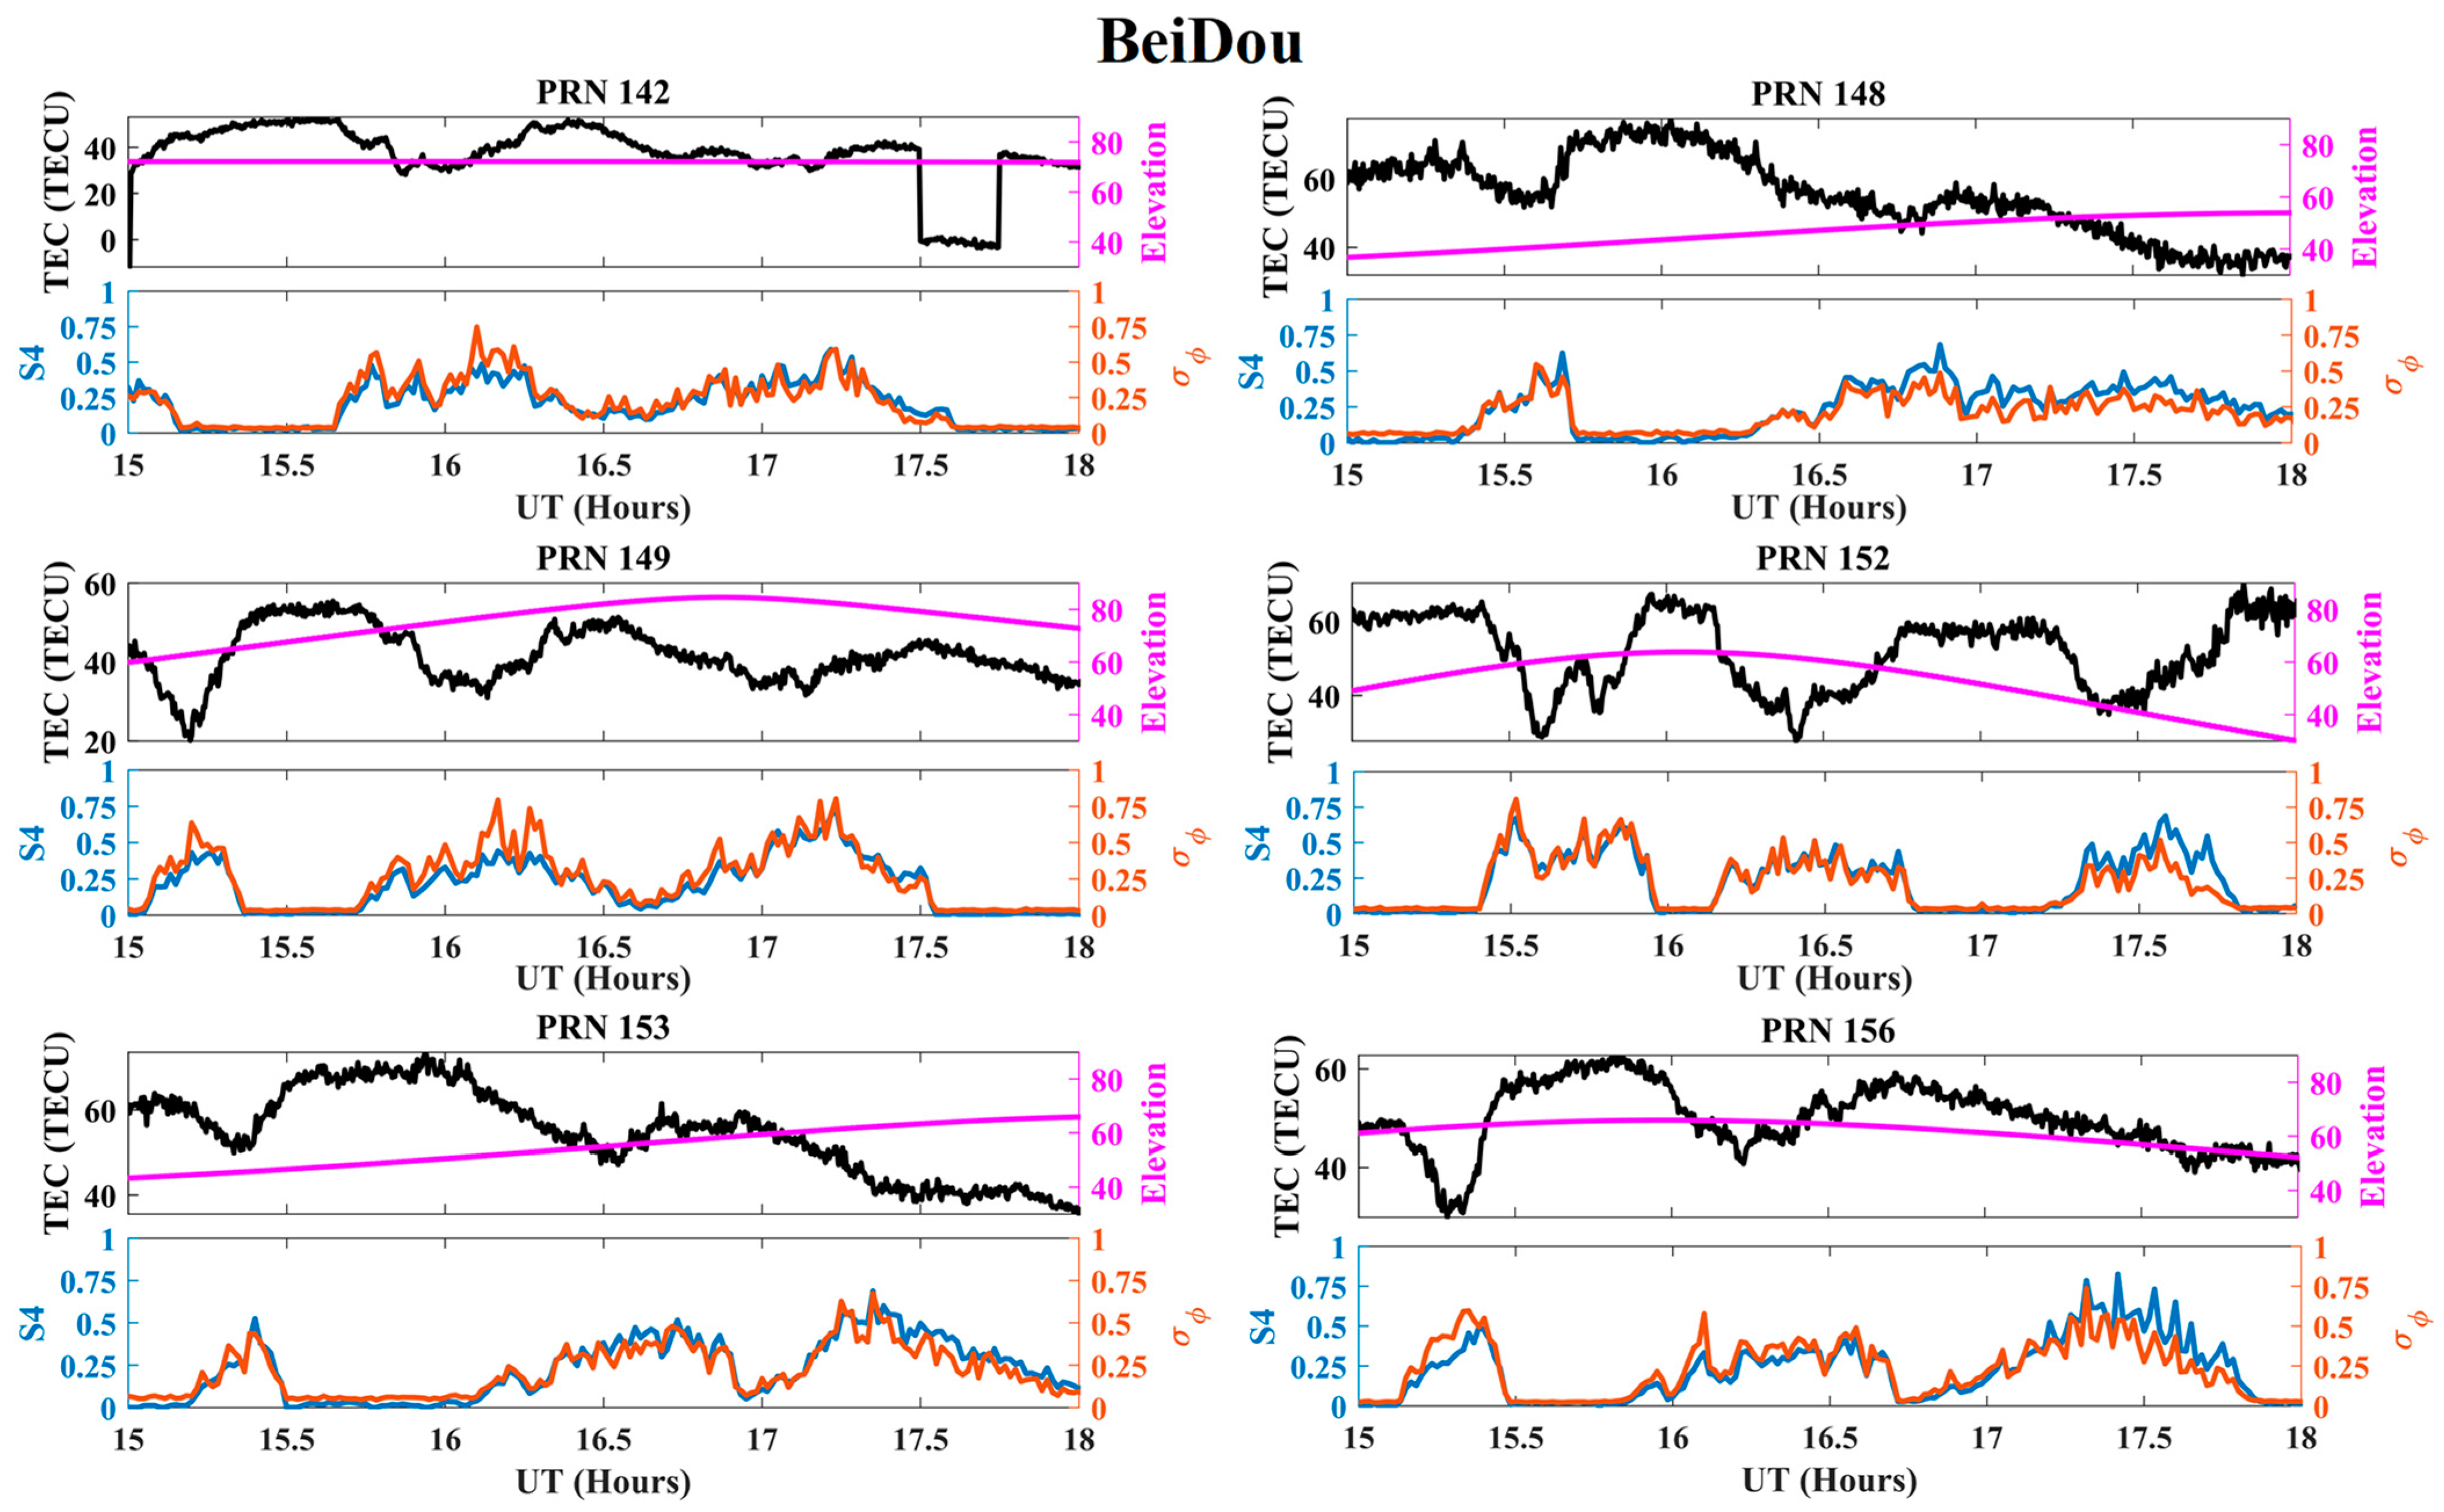
| 4 | BeiDou (C) | 32 | 28 | 5.28 | 8 | 8.83 |
| 5 | GAGAN (S) | NA | NA | NA | NA | NA |
| 6 | IRNSS/NavIC (I) | NA | NA | NA | NA | NA |
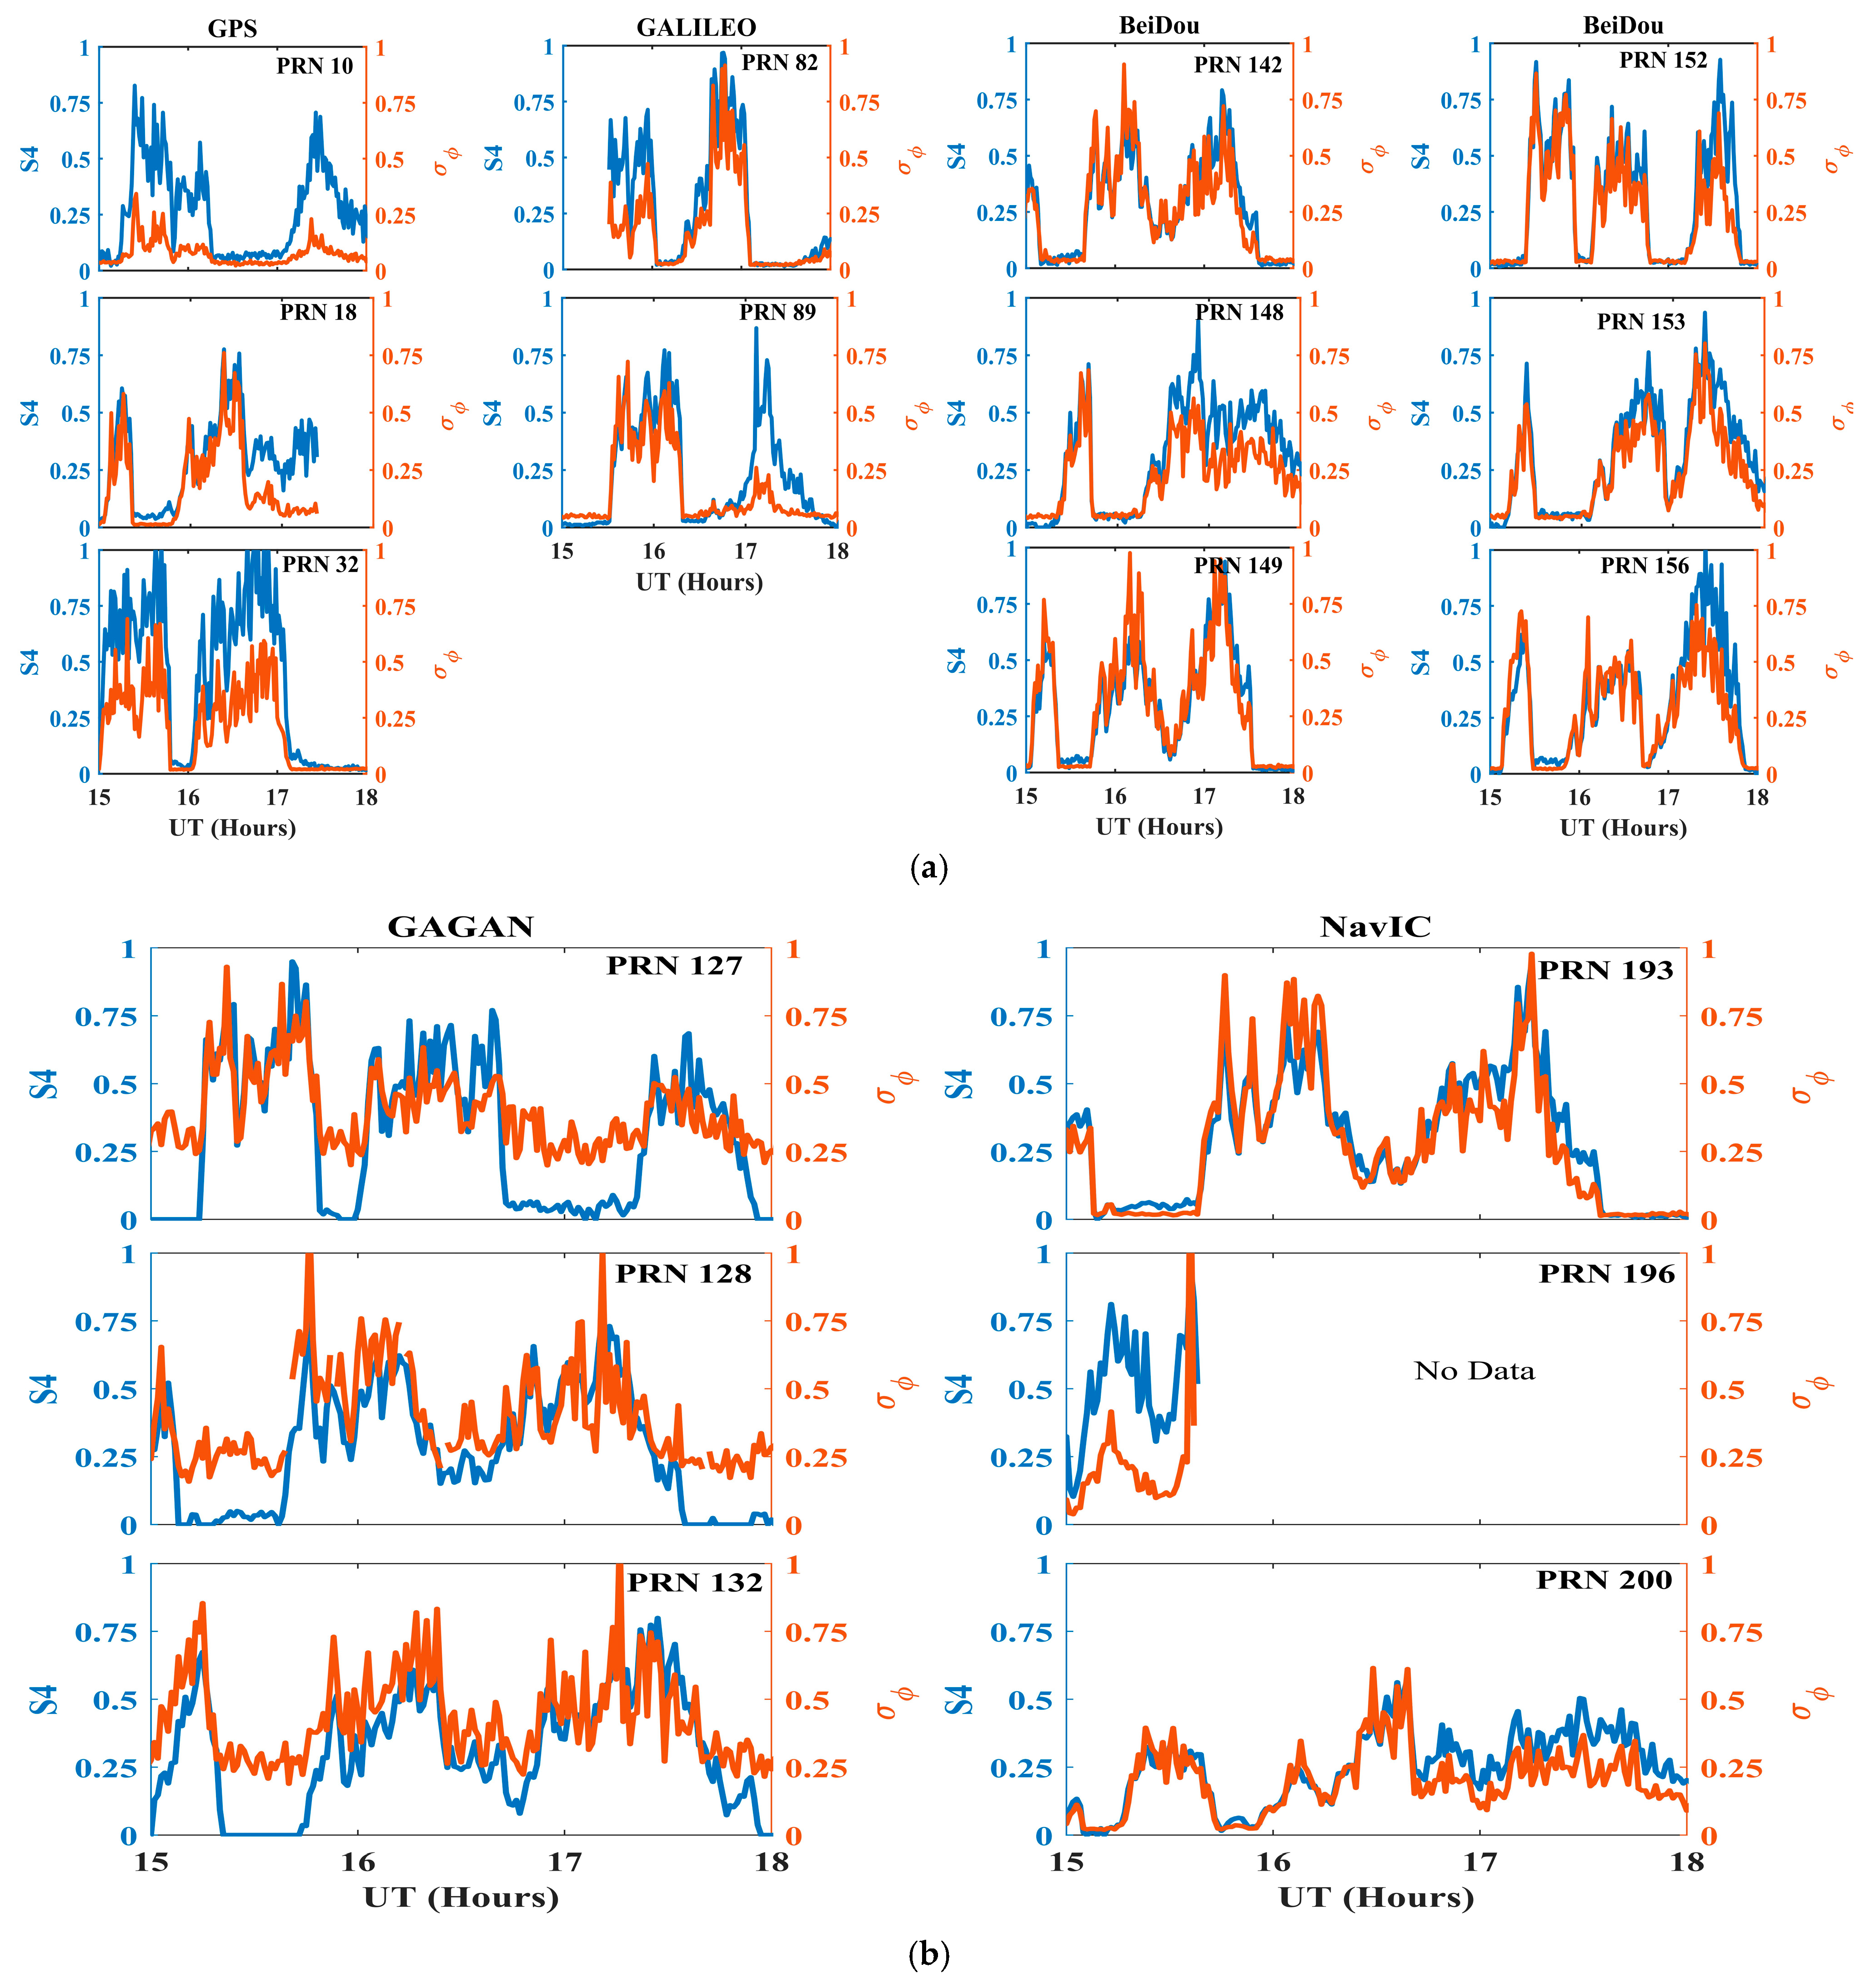
| S.No | GNSS Constellation | Signal 1 | Signal 2 | Signal 3 | |||
|---|---|---|---|---|---|---|---|
| Max S4 | Max σφ | Max S4 | Max σφ | Max S4 | Max σφ | ||
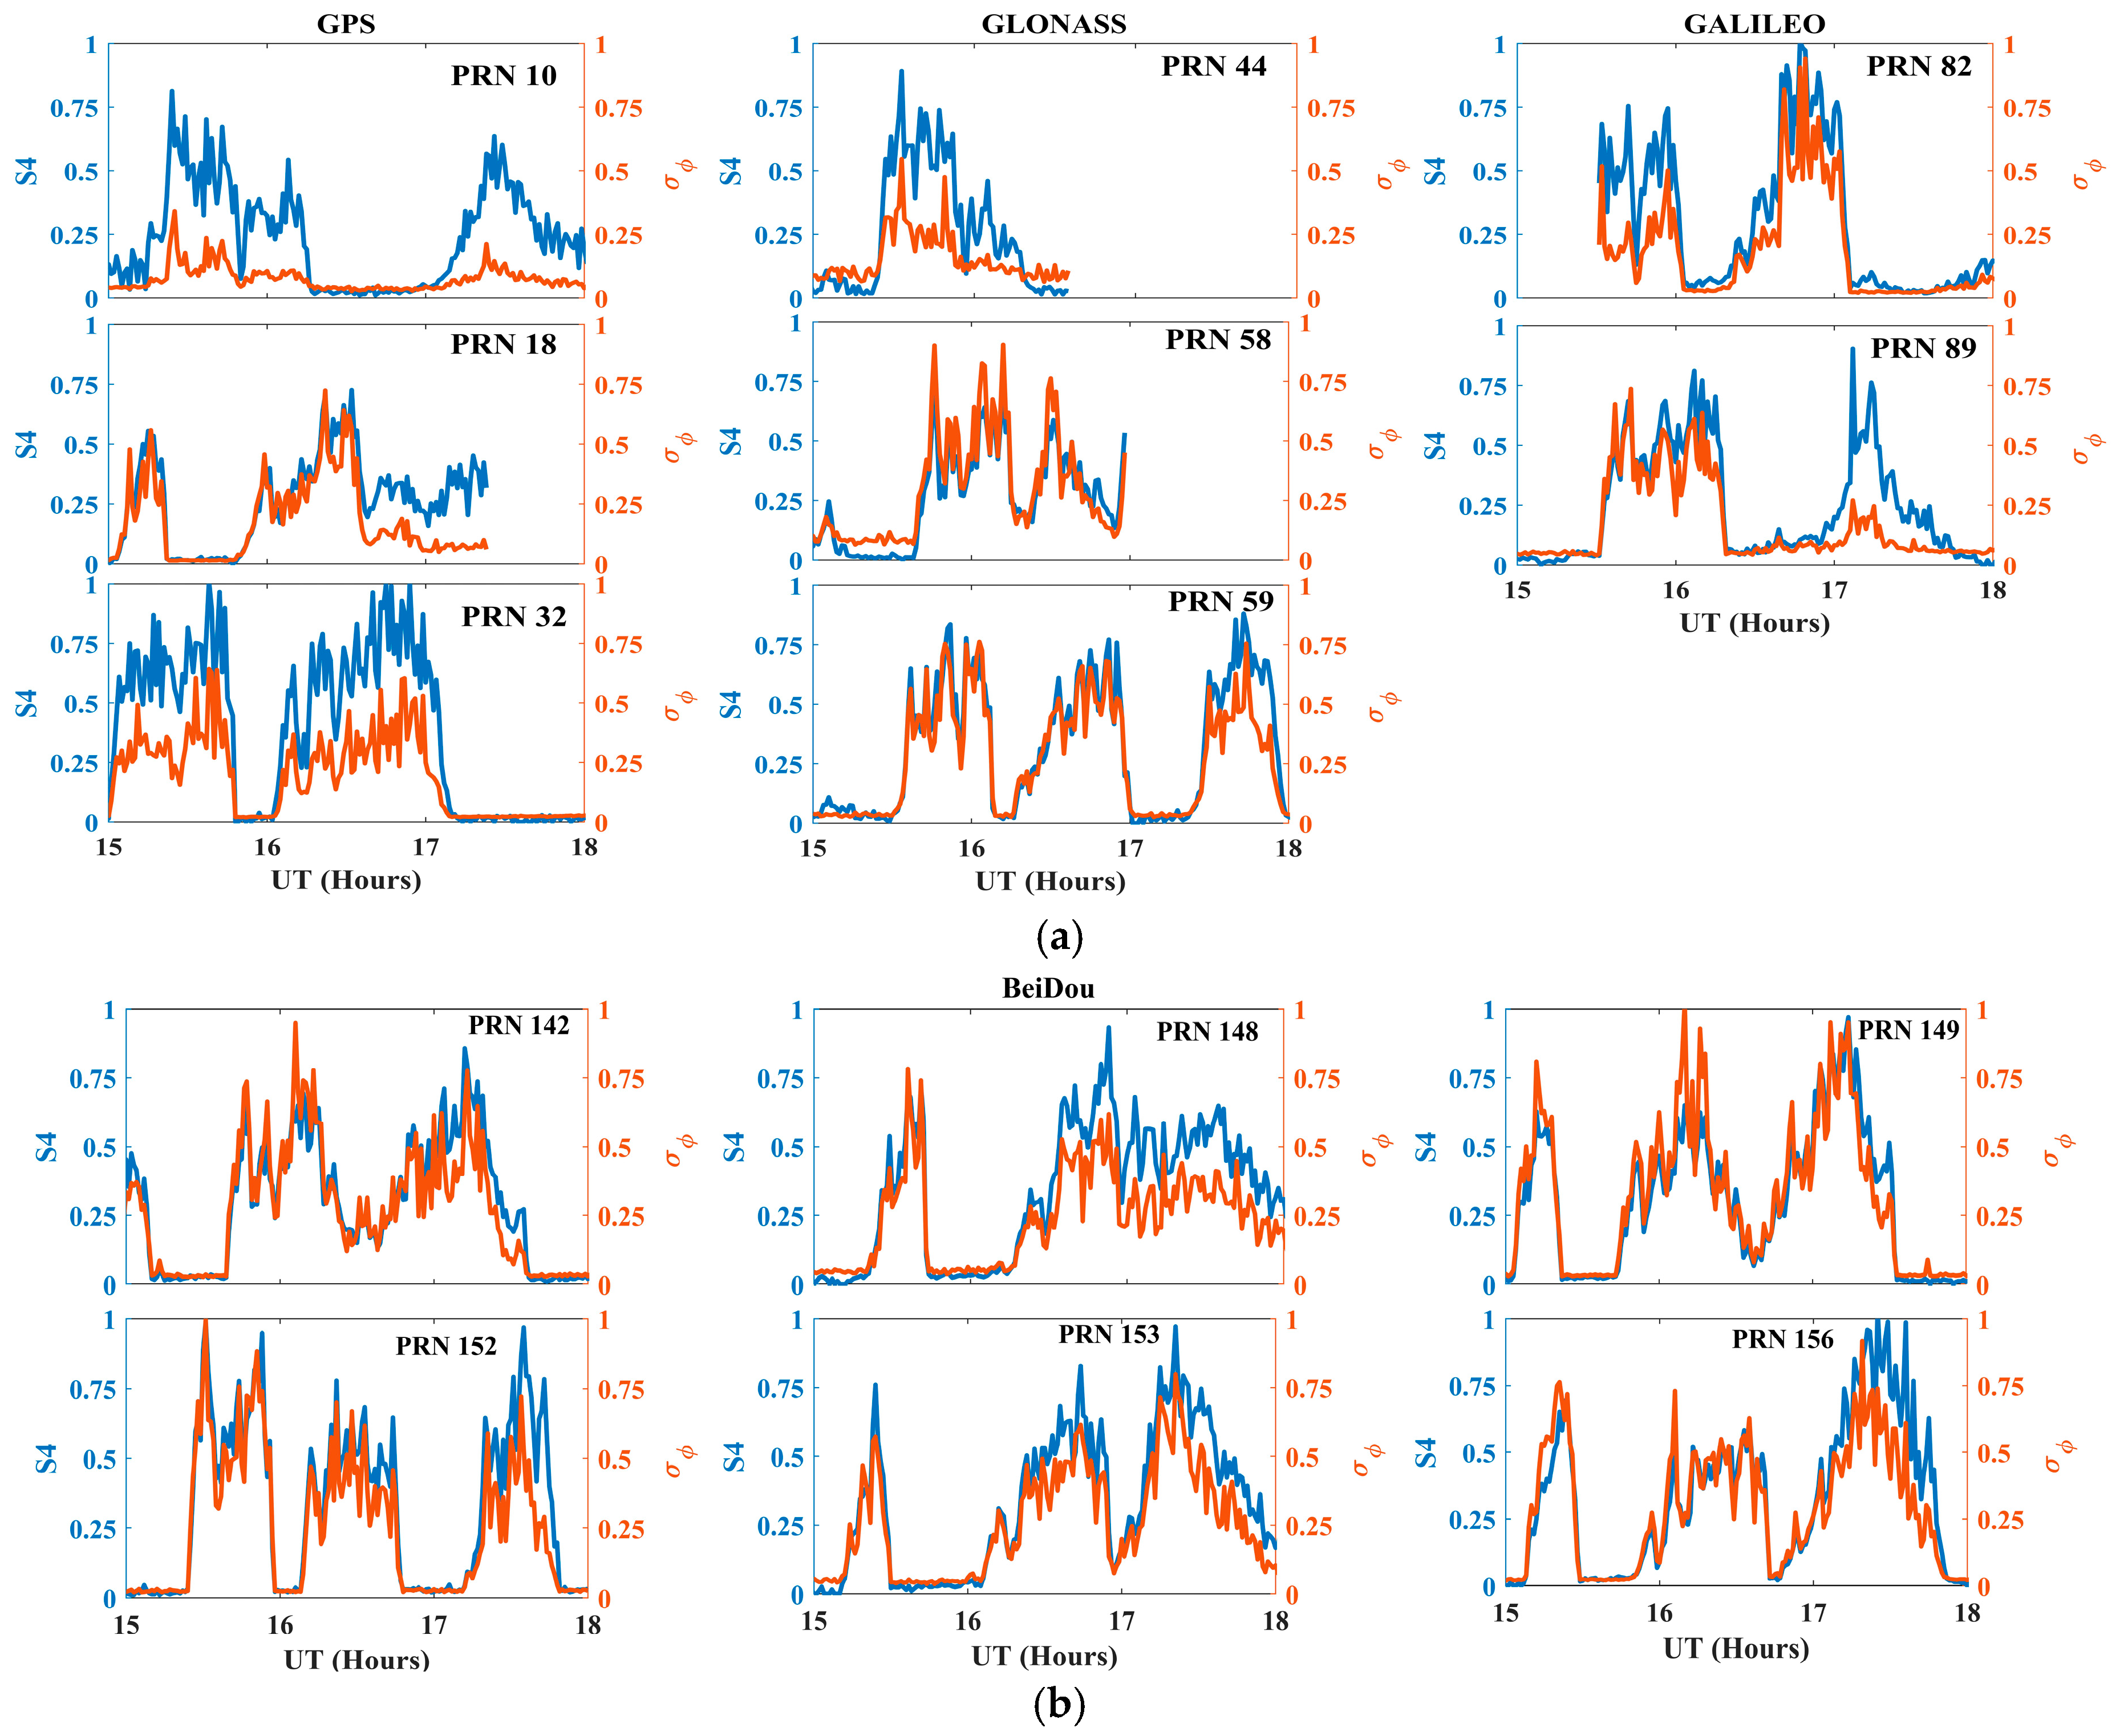
| 1 | GPS (G) | 0.79 | 0.61 | 1.00 | 0.64 | 1.09 | 0.69 |
| 2 | GLONASS (R) | 0.45 | 0.73 | 0.70 | 0.90 | NA | NA |
| 3 | Galileo (E) | 0.58 | 0.57 | 0.90 | 0.73 | 0.86 | 0.72 |
| 4 | BeiDou (C) | 0.68 | 0.80 | 0.99 | 0.99 | 0.92 | 0.86 |
| 5 | GAGAN (S) | 0.62 | 0.75 | NaN | NaN | 0.94 | 0.93 |
| 6 | IRNSS/NavIC (I) | NA | NA | NA | NA | 0.97 | 0.98 |
Disclaimer/Publisher’s Note: The statements, opinions and data contained in all publications are solely those of the individual author(s) and contributor(s) and not of MDPI and/or the editor(s). MDPI and/or the editor(s) disclaim responsibility for any injury to people or property resulting from any ideas, methods, instructions or products referred to in the content. |
© 2023 by the authors. Licensee MDPI, Basel, Switzerland. This article is an open access article distributed under the terms and conditions of the Creative Commons Attribution (CC BY) license (https://creativecommons.org/licenses/by/4.0/).
Share and Cite
Vankadara, R.K.; Jamjareegulgarn, P.; Seemala, G.K.; Siddiqui, M.I.H.; Panda, S.K. Trailing Equatorial Plasma Bubble Occurrences at a Low-Latitude Location through Multi-GNSS Slant TEC Depletions during the Strong Geomagnetic Storms in the Ascending Phase of the 25th Solar Cycle. Remote Sens. 2023, 15, 4944. https://doi.org/10.3390/rs15204944
Vankadara RK, Jamjareegulgarn P, Seemala GK, Siddiqui MIH, Panda SK. Trailing Equatorial Plasma Bubble Occurrences at a Low-Latitude Location through Multi-GNSS Slant TEC Depletions during the Strong Geomagnetic Storms in the Ascending Phase of the 25th Solar Cycle. Remote Sensing. 2023; 15(20):4944. https://doi.org/10.3390/rs15204944
Chicago/Turabian StyleVankadara, Ram Kumar, Punyawi Jamjareegulgarn, Gopi Krishna Seemala, Md Irfanul Haque Siddiqui, and Sampad Kumar Panda. 2023. "Trailing Equatorial Plasma Bubble Occurrences at a Low-Latitude Location through Multi-GNSS Slant TEC Depletions during the Strong Geomagnetic Storms in the Ascending Phase of the 25th Solar Cycle" Remote Sensing 15, no. 20: 4944. https://doi.org/10.3390/rs15204944
APA StyleVankadara, R. K., Jamjareegulgarn, P., Seemala, G. K., Siddiqui, M. I. H., & Panda, S. K. (2023). Trailing Equatorial Plasma Bubble Occurrences at a Low-Latitude Location through Multi-GNSS Slant TEC Depletions during the Strong Geomagnetic Storms in the Ascending Phase of the 25th Solar Cycle. Remote Sensing, 15(20), 4944. https://doi.org/10.3390/rs15204944