Article

Substantial Reduction in Vegetation Photosynthesis Capacity during Compound Droughts in the Three-River Headwaters Region, China

1
College of Hydrology and Water Resources, Hohai University, Nanjing 211100, China
2
School of Earth Science and Engineering, Hohai University, Nanjing 211100, China
3
School of Geography and Planning, Huaiyin Normal University, Huai’an 223300, China
*
Author to whom correspondence should be addressed.
Remote Sens. 2023, 15(20), 4943; https://doi.org/10.3390/rs15204943
Submission received: 5 September 2023 / Revised: 5 October 2023 / Accepted: 11 October 2023 / Published: 13 October 2023
(This article belongs to the Special Issue Ecological Environment Satellite System: Research and Application)

Abstract

:
Solar-induced chlorophyll fluorescence (SIF) is a reliable proxy for vegetative photosynthesis and is commonly used to characterize responses to drought. However, there is limited research regarding the use of multiple high-resolution SIF datasets to analyze reactions to atmospheric drought and soil drought, especially within mountain grassland ecosystems. In this study, we used three types of high-spatial-resolution SIF datasets (0.05°), coupled with meteorological and soil moisture datasets, to investigate the characteristics of atmospheric, soil, and compound drought types. We centered this investigation on the years spanning 2001–2020 in the Three-River Headwaters Region (TRHR). Our findings indicate that the TRHR experienced a combination of atmospheric drying and soil wetting due to increases in the standardized saturation vapor pressure deficit index (SVPDI) and standardized soil moisture index (SSMI). In the growing season, atmospheric drought was mainly distributed in the southern and eastern parts of the TRHR (reaching 1.7 months/year), while soil drought mainly occurred in the eastern parts of the TRHR (reaching 2 months/year). Compound drought tended to occur in the southern and eastern parts of the TRHR and trended upward during 2001–2020. All three SIF datasets consistently revealed robust photosynthetic activity in the southern and eastern parts of the TRHR, with SIF values generally exceeding 0.2 mW · m−2 · nm−1 · sr−1. Overall, the rise in SIF between 2001 and 2020 corresponds to enhanced greening of TRHR vegetation. Vegetation photosynthesis was found to be limited in July, attributable to a high vapor pressure deficit and low soil moisture. In the response of CSIF data to a drought event, compound drought (SVPDI ≥ 1 and SSMI ≤ −1) caused a decline of up to 14.52% in SIF across the source region of the Yellow River (eastern TRHR), while individual atmospheric drought and soil drought events caused decreases of only 5.06% and 8.88%, respectively. The additional effect of SIF produced by compound drought outweighed that of atmospheric drought as opposed to soil drought, suggesting that soil moisture predominantly governs vegetation growth in the TRHR. The reduction in vegetation photosynthesis capacity commonly occurring in July, characterized by a simultaneously high vapor pressure deficit and low soil moisture, was more pronounced in Yellow River’s source region as well. Compound drought conditions more significantly reduce SIF compared to singular drought events. Soil drought evidently played a greater role in vegetation growth stress than atmospheric drought in the TRHR via the additional effects of compound drought.

Graphical Abstract

1. Introduction

As highlighted in the Sixth Assessment Report of the Intergovernmental Panel on Climate Change (IPCC AR6), the global surface temperature increased by 0.99 [0.84–1.1] °C during the years between 2001 and 2020 compared to the period of 1850–1900, with land areas experiencing more pronounced warming than oceans [1]. The frequency, duration, and intensity of global land-based droughts are projected to increase significantly under global warming, especially during the summer months [2,3]. These increasingly frequent and severe droughts pose substantial threats to the structure and function of terrestrial ecosystems [4,5]. In broader terms, soil drought and atmospheric drought are recognized as important factors affecting plant hydraulic processes and ecosystem productivity [5,6]. The significance of these drought types lies in their impact on vegetative photosynthesis. Plant roots extract water molecules from the soil, facilitating the process of vegetative photosynthesis. Soil drought, which is usually characterized by diminished available soil moisture (SM), signifies reduced water availability. This condition marks vegetation stress, which significantly impacts productivity [7,8]. Atmospheric drought, conversely, is defined by a high vapor pressure deficit (VPD), which causes plants to reduce water loss at the leaf level, thereby curtailing photosynthesis across the ecosystem [8,9]. Both soil and atmospheric droughts can significantly limit plant photosynthesis, consequently reducing terrestrial carbon uptake and crop yields.
Grassland ecosystems are vital carbon sinks due to their capacity to absorb carbon dioxide through photosynthesis [10,11]. However, the susceptibility of grassland ecosystems to drought raises concerns regarding their potential transformation from carbon sinks to carbon sources. Such shifts have the potential to reshape the structure and functions of terrestrial ecosystems [12]. Notably, mountain grassland ecosystems are particularly sensitive to SM and temperature. The combined stress of low SM and elevated temperature, often accompanied by a high VPD, can severely impact vegetation growth [9,13]. Soil drought events reduce water uptake through plant roots, while atmospheric droughts prompt the closure of plant stomata, thus affecting vegetation photosynthesis. Interestingly, atmospheric droughts, often induced by heatwaves, can coincide with soil droughts. For example, the simultaneous occurrence of atmospheric and soil droughts in southern China during the 2019 summer–autumn transition season had severe repercussions for both crops and ecosystems [14]. The scientific community and the public alike are growing increasingly aware of such compound events, given their heightened capacity to inflict damage compared to singular or isolated events [15,16]. The alignment of atmospheric and soil droughts into a compound drought exemplifies this concept. A compound drought can significantly amplify the adverse consequences inherent to individual drought events. While previous research has centered on singular atmospheric drought or soil drought events over large scales (typically at spatial resolutions around 0.5°) or within specific small areas [9,11,17,18,19], research on compound droughts in grassland ecosystems is still very limited [5,6], especially in the case of mountain grasslands based on high-resolution data.
Vegetation is a crucial component of terrestrial ecosystems, serving as a natural linkage connecting soil, atmosphere, and water dynamics. Modern advances in remote sensing technology have facilitated the utilization of various vegetation indicators, such as the normalized difference vegetation index (NDVI) and the leaf area index (LAI), for comprehensive vegetation monitoring. These indicators are advantageous in terms of their extensive spatial coverage and provision of continuous temporal observations [9,20,21,22]. Further, to assess the terrestrial carbon balance, gross primary productivity (GPP) and net ecosystem productivity (NEP) are often used to explore the relationships between droughts and carbon fluxes [6]. For example, Deng, et al. [23] assessed the carbon cycle response to extreme drought conditions in China from 2000 to 2015 based on GPP and NEP datasets, concluding that the Loess Plateau and a segment of the Tibetan Plateau suffered severe losses under extreme drought conditions. Chlorophyll fluorescence, the long-wave radiation emitted during vegetation photosynthesis, is also promising as an effective remote sensing indicator. Solar-induced chlorophyll fluorescence (SIF) is a significant optical indicator of photosynthetic status and associated stress effects in terrestrial vegetation [24]. SIF has heightened responsiveness to drought compared to traditional vegetation indicators and offers the unique capability to directly capture dynamic fluctuations during vegetation photosynthesis [18,25]. SIF is mechanistically related to photosynthesis and shows a nearly linear correlation with GPP, making it a suitable surrogate indicator for GPP at the ecosystem level. Liu et al. [8] disentangled the relative roles of SM and the VPD in determining the response of vegetation (SIF) to drought using a decoupling method. They found that SM played a dominant role over the VPD in determining dryness stress impacting ecosystem productivity across terrestrial vegetated regions. However, previous studies have mainly focused on single sets of SIF data at large scales (typically around 0.5° spatial resolution) [8,18,26], with few studies on the response of vegetation photosynthesis to drought based on multiple high-resolution SIF datasets. This gap is particularly pronounced in terms of the response of SIF to compound droughts in mountain grasslands.
The standardized precipitation evapotranspiration index (SPEI) can effectively reflect the dynamics of dry and wet conditions across multiple timescales [27]. Recently, scholars have explored the relationship between SPEI and SIF and analyzed the feedback characteristics of vegetation photosynthesis under drought conditions [11,28]. For example, Geng et al. [25] investigated the response characteristics of different vegetation types to drought in the Yellow River basin based on SPEI and SIF data, finding that the SIF of croplands responded to drought most rapidly, followed by grasslands and forest areas. Others have used VPD and SM datasets to investigate the responses of vegetation growth to droughts directly from the perspective of atmospheric and soil dryness [5,8,19]. The coupling effect of a high VPD and low SM is more obvious in warmer seasons [6], which increases the probability of simultaneous atmospheric and soil drought events, which exacerbate the adverse effects of droughts on terrestrial ecosystems. There is an urgent need for quantitative analyses of multiple SIF datasets with high spatial resolution under compound drought conditions at regional scales, particularly in alpine grasslands during the warmest months.
In this study, we used the Three-River Headwaters Region (TRHR) as an illustrative case, representing the mountain grasslands in the hinterlands of the Tibetan Plateau. Our objective is to build a comprehensive understanding of the response of vegetation photosynthesis to atmospheric drought, soil drought, and compound drought based on high-resolution gridded meteorological, SM, and SIF datasets. The primary goals of this work include (1) an exploration of atmospheric drought, soil drought, and compound drought, especially as they affect the vegetation growing season (GS); (2) an investigation of the changes in vegetation photosynthesis capacity during 2001–2020; and (3) an evaluation of SIF feedback characteristics to atmospheric drought, soil drought, and compound drought in the TRHR, especially during the hottest month (July). The compound drought criteria defined in this study can be applied to most regions of the world. To this effect, our results may provide an in-depth understanding of the impacts of drought on the carbon cycle in regions with similar climatic and vegetation characteristics. This work also may provide a valuable reference for developing new strategies to prevent and mitigate drought disasters in ecologically fragile regions.

2. Materials and Methods
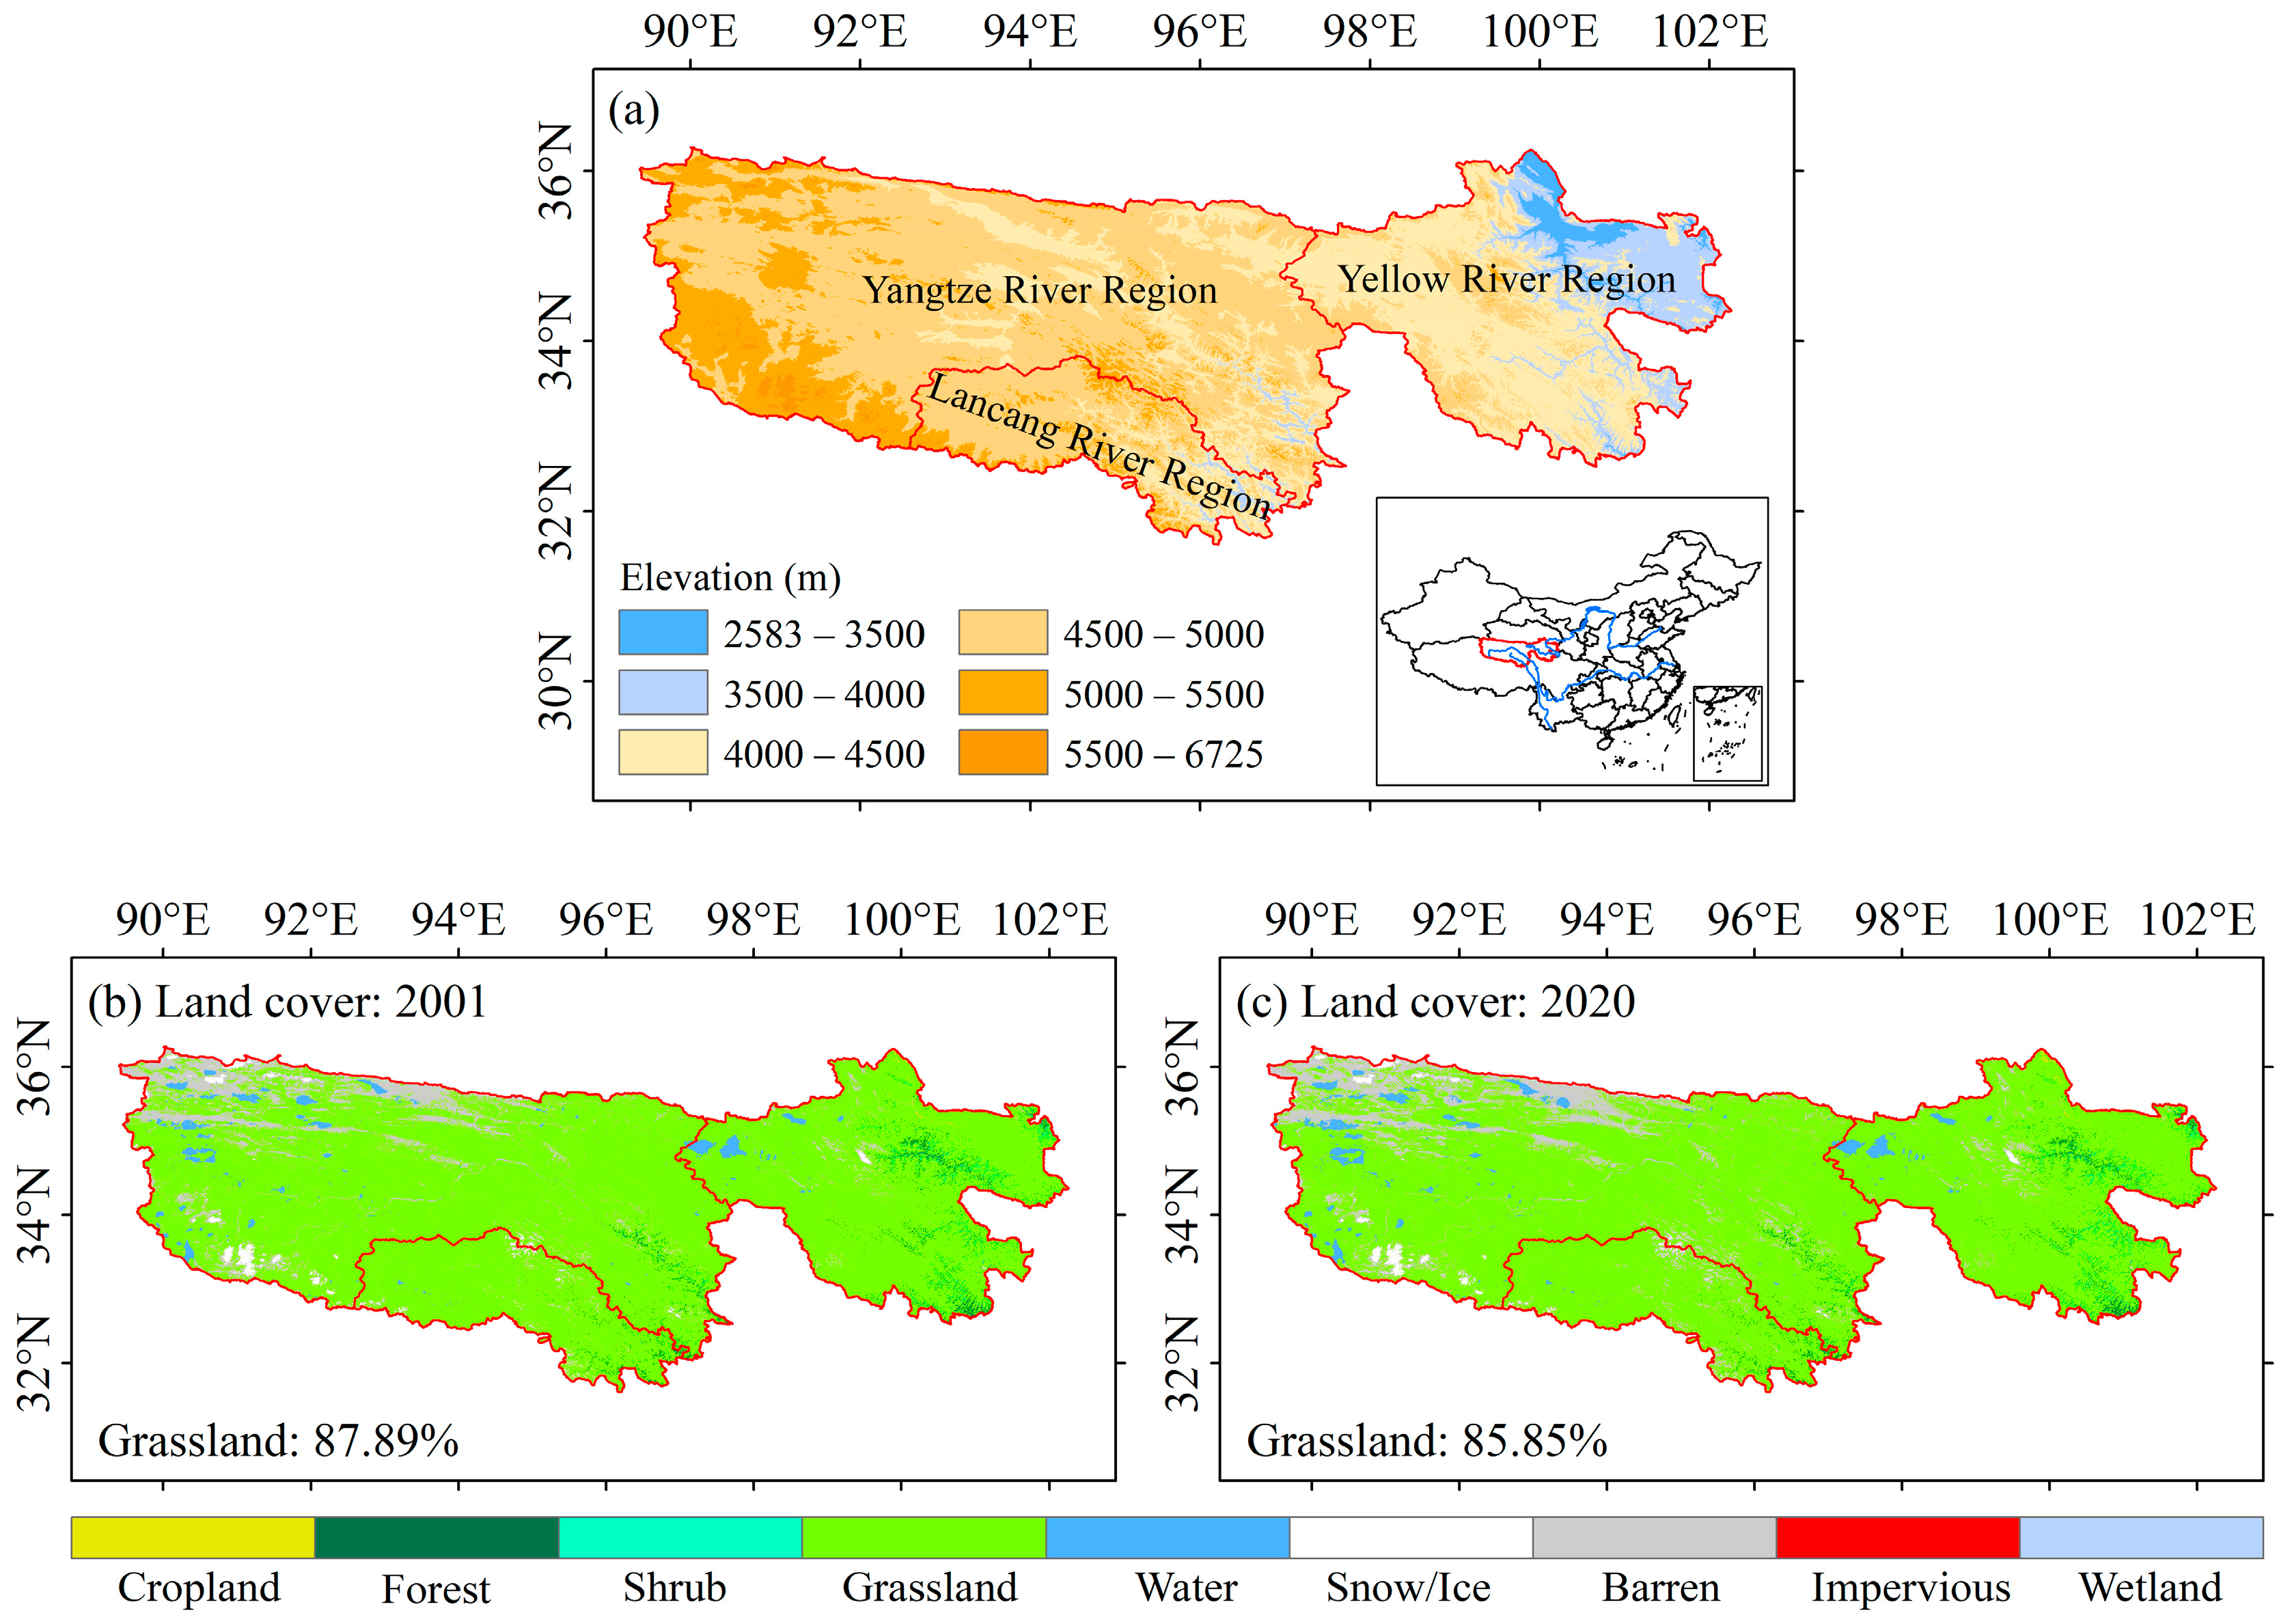
2.1. Study Area

The TRHR is located in the southern part of Qinghai Province, China, the hinterlands of the Tibetan Plateau. It has an average elevation surpassing 4000 m (Figure 1a). The topography of the TRHR gradually descends from the southwest to the northeast, marked by elevations exceeding 5000 m in the southwest, 4000–5000 m in the central region, and 3000–4000 m in the northeast. TRHR is the origin of the Yangtze, Yellow, and Lancang rivers, encompassing an area of approximately 3.6 × 10⁵ km2. The TRHR is one of the most concentrated areas of high-altitude biodiversity in the world. This region features dense river networks, rich lakes, extensive snowy mountains, and an interwoven landscape of glaciers [20]. These features earned the TRHR the moniker of the “Chinese Water Tower”. The climate in the TRHR is typical of plateau continental climates [29]. Its annual mean maximum temperature, minimum temperature, and precipitation are 4.9 °C, −8.8 °C, and 498.9 mm, respectively (Supplementary Materials, Figure S1). The months from May through September constitute the GS in the TRHR [13]. During the GS, the average temperatures (calculated as the mean of the maximum and minimum temperatures) consistently exceed 0 °C, and GS precipitation accounts for 85% of the annual total. The spatial distribution of the annual mean precipitation declines from over 600 mm in the southeast to under 300 mm in the northwestern corners (Supplementary Materials, Figure S2a). This pattern echoes in the GS precipitation distribution, albeit with slightly lesser magnitudes (Supplementary Materials, Figure S2b). The annual mean temperatures are >0 °C in the eastern and southern parts of the TRHR (Supplementary Materials, Figure S2c), further escalating during the GS in these locales (Supplementary Materials, Figure S2d). According to the land cover data with a 30 m spatial resolution [30], grasslands accounted for 87.89% (Figure 1b) and 85.85% (Figure 1c) of the TRHR’s total area in 2001 and 2020, respectively. This illustrates a subtle decline in grassland coverage over the past two decades, though it is still the predominant land cover type in the region.

2.2. Data

Daily precipitation, relative humidity, maximum temperature (Tmax), and minimum temperature (Tmin) data spanning the period of 2001–2020 were obtained from the Climate Change Research Center of the Chinese Academy of Sciences (https://ccrc.iap.ac.cn/, accessed on 1 September 2023). This dataset has a 0.25° spatial resolution and incorporates observations from around 2400 meteorological stations across China. It was subjected to rigorous quality checks prior to its release.
To gather daily SM values, we utilized the Chinese version 1.0 of in situ data, SMCI1.0, accessed through the National Tibetan Plateau/Third Pole Environment Data Central, China (https://data.tpdc.ac.cn/zh-hans/data/49b22de9-5d85-44f2-a7d5-a1ccd17086d2, accessed on 1 September 2023). We focused on SMCI1.0 data for the period 2001–2020, which has a spatial granularity of 0.1° (approximately 9 km), encompassing 10 layers spaced at 10 cm intervals. For ease of understanding and analysis, SM at 10 cm is referred to as the 0–10 cm average SM in this study, the SM at 20 cm is referred to as the 10–20 cm average SM, and so on, and the SM at 100 cm is referred to as the 90–100 cm average SM. The dataset was enriched by incorporating various inputs, including ERA5-Land meteorological forcing data, leaf area index, land cover types, topography, and soil properties, using a robust machine learning approach (random forest) [31]. The in situ SM observations from 1648 stations were employed as the SM modeling target after quality control procedures. After the SMCI1.0 dataset was validated by in situ SM observations, it became a useful complement to existing model-based and satellite-based SM datasets for various hydrological, meteorological, and ecological analyses and modeling processes. The 0–100 cm SM was used as the root-zone SM, which was calculated by combining the weights of each soil thickness.
SIF is an intrinsic tool for studying the relationship between vegetation photosynthesis and environmental dynamics [8]. This pivotal role positions SIF as a suitable approximation of GPP in terrestrial ecosystems. In this study, three types of SIF datasets (2001–2020) were used to investigate vegetation growth under compound drought conditions in the TRHR: the contiguous SIF (CSIF), the global orbiting carbon observatory-2 (OCO-2) SIF (GOSIF), and the reconstructing tropospheric monitoring instrument (TROPOMI) SIF (RTSIF). These three SIF datasets were subjected to rigorous quality control prior to release. The CSIF dataset was generated based on moderate-resolution imaging spectroradiometer (MODIS) surface reflectance and OCO-2 SIF data using a trained neural network approach [32]. The CSIF has a 0.05° spatial resolution and four-day temporal resolution under clear-sky conditions. The CSIF was obtained from the National Tibetan Plateau/Third Pole Environment Data Central, China, and is available online at https://data.tpdc.ac.cn/zh-hans/data/d7cccf31-9bb5-4356-88a7-38c5458f052b, accessed on 1 September 2023. The GOSIF dataset was constructed with discrete OCO-2 SIF soundings, MODIS remote sensing data, and a meteorological reanalysis [33]. Monthly GOSIF data with a 0.05° spatial resolution were utilized in this study. The GOSIF can be accessed at http://data.globalecology.unh.edu/data/GOSIF_v2/Monthly/, accessed on 1 September 2023. Additionally, the RTSIF was reconstructed by TROPOMI SIF under clear-sky conditions using a machine learning approach [34]. TROPOMI, which embarked on the Copernicus Sentinel-5P mission, significantly increased the spatial and temporal resolution of SIF observations. Our analysis hinged on the deployment of eight-day RTSIF data with a 0.05° spatial resolution. The RTSIF was obtained from the National Tibetan Plateau/Third Pole Environment Data Central, China, and was downloaded from https://data.tpdc.ac.cn/zh-hans/data/2b8ffbf4-90ac-4e3d-9ae4-a8be31ae93d4, accessed on 1 September 2023. Finally, the GOSIF GPP data were applied to assess the reliability and consistency of the three SIF datasets. These GPP data were derived through robust linear correlations linking GOSIF with tower GPP measurements [11,33]. The GPP data were obtained from the National Tibetan Plateau/Third Pole Environment Data Central, China, and are available for download at http://data.globalecology.unh.edu/data/GOSIF-GPP_v2/Monthly/, accessed on 1 September 2023. We employed monthly GOSIF GPP data with a 0.05° spatial resolution to verify the reliability of the above three SIF datasets in the context of the TRHR.
The grid coordinates of the CSIF data were used as a benchmark in this study. We interpolated the meteorological and SM data uniformly to a 0.05° resolution using the bilinear interpolation method. The grid coordinates of the GOSIF, GOSIF GPP, and RTSIF data were slightly shifted to align with the corresponding CSIF spatial coordinates. These datasets were spatially processed to streamline spatial computations, validation procedures, and spatial visualizations specific to the TRHR. All data time-series were converted to monthly series to facilitate the calculation of drought characteristics and vegetation photosynthesis capacity in specific months of the year. The area covered by vegetation was defined as an annual GS mean CSIF greater than 0 mW · m−2 · nm−1 · sr−1. Subsequent analyses were carried out only for this vegetation area.

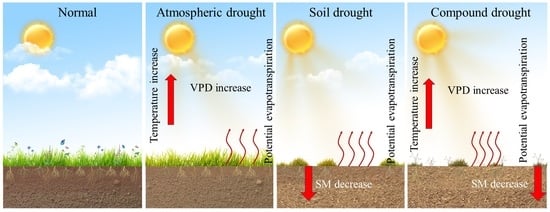
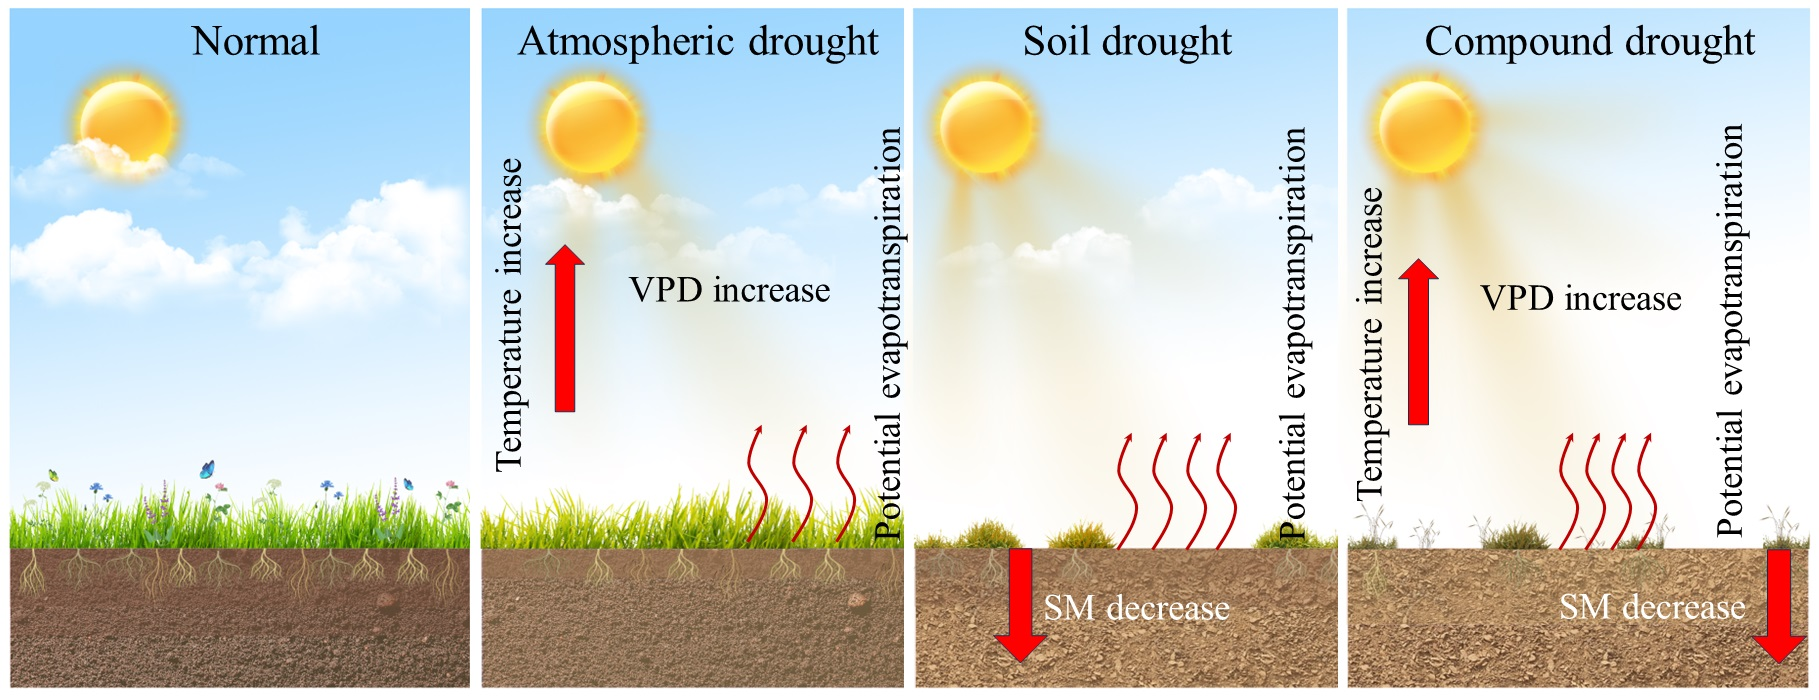
2.3. Definition of Compound Droughts

The VPD is defined by the difference between saturation ( e s ) and actual ( e s ) vapor pressure and is an effective indicator of atmospheric drought [6,8,9]. The relationship between saturation vapor pressure and air temperature is expressed as follows:
e 0 T = 0.6108 · exp 17.27 · T T + 237.3
where e 0 T is the saturation vapor pressure (kPa) at an air temperature of T (°C). The Food and Agriculture Organization recommends the following formula [35] to calculate the saturation vapor pressure ( e s ):
e s = e 0 T m a x + e 0 T m i n 2
where e s is the average saturation vapor pressure at the daily Tmax and Tmin. The actual vapor pressure is calculated as:
e a = e s · R H 100
where RH is the relative humidity (0–100).
The standardized precipitation index (SPI), based on a two-parameter gamma distribution, is widely used to identify meteorological drought conditions over a range of various timescales [27,36,37,38]. The SPI at short timescales can reflect SM conditions, and the SPI at long timescales can describe runoff, groundwater, and reservoir conditions. Here, we converted the monthly VPD and root-zone SM into the standardized vapor pressure deficit index (SVPDI) and standardized soil moisture index (SSMI) via a similar SPI calculation method (i.e., the two-parameter gamma distribution). The probability density distribution f(x) and cumulative distribution F(x) functions of the gamma distribution can be calculated as follows [37,39]:
f x = 1 β α Γ α x α 1 e x / β
F x = 1 β α Γ α 0 x α 1 e x / β d x
where β is a scale parameter, α is a shape parameter, x denotes the monthly data, and Γ α   is the gamma function. In this study, the SVPDI and SSMI were used to describe the dry and wet conditions of monthly-scale atmospheric and soil conditions in the TRHR. The wet and dry classification criteria for the SVPDI and SSMI are similar to those of the SPI [37], as shown in Table 1.
Compound atmospheric and soil droughts, referred to here as simply “compound droughts”, were defined in this study as simultaneously meeting the definition of atmospheric drought and soil drought for the same month at a given grid. Generally, atmospheric droughts can occur when the VPD is high. We adopted 1-month SVPDI ≥ 0.5 as the threshold for an atmospheric drought. Similarly, soil droughts can occur when SM is low. We used 1-month SSMI ≤ −0.5 as the threshold for a soil drought. We used 12-month SVPDI/SSMI values in December of each year and 5-month SVPDI/SSMI values in September of each year to identify atmospheric/soil droughts throughout each whole year and their GS.

2.4. SIF Reduction Rate

We used the anomaly percentage approach [25] to characterize the impact of drought stress on vegetation photosynthesis in the TRHR.
A n o m a l y = X N N × 100 %
where Anomaly is the reduction rate of SIF caused by drought, X denotes the SIF value under drought conditions, and N denotes the mean SIF values for a specific time period (e.g., the GS or July).

2.5. Overview of Methodologies

As illustrated in Figure 2, we first calculated the monthly SM and VPD based on the daily SM, Tmax, Tmin, and RH, then calculated SSMI and SVPDI using the gamma distribution function. Next, we obtained the spatial and temporal patterns of the photosynthetic capacity of vegetation based on the three sets of SIF data, then analyzed changes in the SIF under the conditions of different combinations of the SSMI and SVPDI. Finally, we investigated the effects of atmospheric droughts, soil droughts, and compound droughts on the SIF and analyzed the response characteristics of the SIF through a typical compound drought event.

3. Results

3.1. Characteristics of Atmospheric Droughts, Soil Droughts, and Compound Droughts

The SVPDI trend showed an upward trajectory from 2001 to 2010, followed by a decline. This temporal pattern reflects a pre-2010 phase of atmospheric drying followed by a post-2010 period of wetting (Figure 3a). When viewed across the entirety of the 2001–2020 period, the atmosphere showed a subtle increase in moisture levels (Figure 3a) with a distinct drying trend within the GS (Figure 3b). The rates of change are −0.007/decade for the entire observation period and 0.224/decade during the GS. Conversely, the SSMI showed a significant upward trend on both annual and GS timescales throughout 2001–2020, indicating a wetting trend of the soil in the TRHR.
The annual SVPDI showed a clear increasing trend in the western parts of the TRHR (>0.5/decade) and a clear decreasing trend in the eastern parts of the TRHR (<−0.5/decade) (Figure 4a,b). This spatial differentiation underscores a discernible shift towards dryness in the western parts of the region, accompanied by a pronounced tendency towards wetness in the eastern parts. The spatial trends of the GS SVPDI were generally similar to those of the annual SVPDI, but the areas characterized by wetting trends shrank in the eastern parts while areas marked by drying trends expanded in the western parts (Figure 4c,d). The annual SSMI showed a clear decreasing trend (<−0.5/decade) in the central and eastern regions of the TRHR and a clear upward trend (>0.5/decade) in most of the remainder of the region (Figure 4e,f). These changes suggest that the soil is trending wetter in most areas of the TRHR, with a tendency to become drier in a small portion of the east-central areas. The spatial trends of the GS SSMI are generally similar to those of the annual SSMI (Figure 4g,h).
The spatial durations of the annual (Figure 5a) and GS (Figure 5b) atmospheric droughts were generally similar, with longer durations in the southern parts of the TRHR. Soil droughts with relatively long duration occurred mainly in the eastern parts of the TRHR, at up to 5 months/year (Figure 5c) and 2 months/year (Figure 5d) on the annual and GS timescales, respectively. Annual compound droughts generally lasted from 1 to 2.5 months/year (Figure 5e), while GS compound droughts generally lasted from 0.3 to 1.2 months/year (Figure 5f). Areas with lengthy annual compound droughts reaching 2 months/year were distributed throughout the western and southern parts of the TRHR. The spatial durations of GS compound droughts were broadly similar to those of annual compound droughts, but generally longer in southern and eastern parts.
As depicted in Figure 6a, the atmospheric drought duration increased more intensely on the GS timescale (0.23 months/decade) than on the annual timescale (0.11 months/decade). We estimated the trends of atmospheric drought durations during equal time periods (2001–2010 and 2011–2020) to further analyze trend characteristics across distinct temporal divisions. For both the annual and GS timescales, the atmospheric drought showed significant increasing trends from 2001 to 2010 (6.35 months/decade on the annual timescale and 2.61 months/decade on the GS timescale), which reversed in 2011 and markedly decreased from 2011 to 2020 (−1.63 months/decade on the annual timescale and −1.08 months/decade on the GS timescale). The more recent decreasing rates of atmospheric droughts were substantially smaller than the increasing rates before 2011. Although the soil drought durations generally showed no significant upward or downward trends during 2001–2020, a downward trend during 2011–2020 was observed (Figure 6b). The increasing rate of compound drought durations on the GS timescale was slightly higher than that on the annual timescale (Figure 6c). The upward rate of compound drought durations on the annual timescale during 2001–2010 was about twice as high as the downward rate during 2011–2020, whereas the upward and downward rates of the preceding and following decades were approximately equal on the GS timescale.

3.2. SIF Characteristics

As illustrated in Figure 7, the spatial distributions of the CSIF, GOSIF, and RTSIF during the GS were similar. The SIF values were relatively high in the eastern and southern parts of the TRHR (CSIF and GOSIF reaching 0.2 mW · m−2 · nm−1 · sr−1, with RTSIF reaching 0.3 mW · m−2 · nm−1 · sr−1), whereas they were relatively low in the western parts of the region (CSIF and GOSIF below 0.05 mW · m−2 · nm−1 · sr−1, and RTSIF below 0.1 mW · m−2 · nm−1 · sr−1). The correlation coefficients of the annual GS-averaged GOSIF GPP with CSIF, GOSIF, and RTSIF, respectively, were high—especially in eastern parts of the TRHR (>0.9). These results together indicate that SIF effectively captures vegetation photosynthesis dynamics.
The annual GS-averaged SIF showed increasing trends during 2001–2020 (Figure 8), which was especially the case for GOSIF (0.0068 mW · m−2 · nm−1 · sr−1 · decade−1). This suggests that vegetation greening significantly increased in the TRHR during those years. The annual variations in GPP and SIF were more consistent, with a trend value of 4.12 gC · m−2 · month−1·decade−1. The correlation coefficients of GPP and the three types of SIFs exceed 0.9 on the annual timescale, indicating that SIF responds well to GPP characteristics in the TRHR.
The spatial characteristics of the three distinct SIF trends exhibited a consistent pattern across the TRHR (Figure 9), with positive trends in most areas and especially in the northeastern parts of the region (0.05 mW · m−2 · nm−1 · sr−1 · decade−1). The TRHR shows far more areas with significant greening than those with significant browning trends in terms of vegetation areas, especially in the east–central areas. These observations indicate enhanced photosynthetic capacity in the TRHR’s vegetation. There were fewer areas with significant greening in the RTSIF dataset than in CSIF or GOSIF datasets, especially in the western parts of the region.
The annual mean temperature and precipitation in the TRHR trended upward (Figure 10a), reaching 0.34 °C/decade and 33.04 mm/decade, respectively, indicating that warming and wetting have become more pronounced in the TRHR over the past two decades. The variations in the GS temperature and precipitation (Figure 10b) were similar to those occurring on the annual scale, but with a more intense warming of temperature (0.42 °C/decade). Grass grew more prolifically under these warmer and wetter conditions in the TRHR, which supports the significant increases in the SIFs observed previously.

3.3. Response of SIF to Compound Droughts

The SVPDI and SSMI were found to be negatively correlated, especially in the 1-month SVPDI and 1-month SSMI for July and August (Supplementary Materials, Figure S3). This suggests a strong coupling between the SVPDI and SSMI in warmer seasons and a higher probability of simultaneous occurrence. We extracted valid grids with time period means greater than 0.01 mW · m−2 · nm−1 · sr−1 for SIF to calculate the SIF anomaly percentages corresponding to different drought thresholds. We divided the monthly SVPDI and SSMI into 8×8 bins at 0.5 index value intervals, then assessed the SIF anomalies at different thresholds of compound droughts. As shown in Figure 11, low SSMI and low SVPDI combination events during the GS correspond to low SIF values. This may be due to the low SVPDI caused by low temperatures, thus limiting the growth of vegetation in the TRHR during the GS [6,40]. High SVPDIs corresponding to high temperatures in the GS favor the growth of vegetation (i.e., promote photosynthesis) and thus correspond to positive SIF anomalies. The hottest month (July) was analyzed instead of the GS to find that a further increase in the SVPDI under relatively dry conditions corresponded to a decrease in SIF due to the closure of vegetative stomata, which prevents vegetative photosynthesis [6,41]. Therefore, low SSMI and high SVPDI values corresponded to negative anomalies of SIF in July in the TRHR.
The constraints imposed by elevated SVPDIs and diminished SSMIs in July on vegetation photosynthesis prompted a meticulous exploration of SIF anomalies within the TRHR. In scrutinizing the effects of atmospheric, soil, and compound droughts, we found that SIF exhibited negative anomalies in the central and eastern parts of the TRHR under atmospheric stress, which is particularly evident in the CSIF dataset (Figure 12a–c). In the western part of the region, atmospheric droughts did not cause a decrease in SIF, which was particularly evident in the RTSIF dataset. This phenomenon stems from the heightened SVPDI values attributed to warming temperatures, effectively alleviating temperature constraints within alpine ecosystems. This climatic shift facilitated vegetation growth by mitigating the temperature-induced restrictions, hence accentuating vegetative photosynthesis, as indicated by the elevated SIF levels. Warming also forces snow and ice to melt, which bolsters the SM available for vegetation to absorb. The area with declining SIF caused by soil drought was substantially larger than that caused by atmospheric drought (Figure 12d–f), which suggests that the mountain ecosystem is more constrained by SM than by atmospheric water demand during the hottest months. The areas with declining SIF caused by compound drought in the central and western parts of the TRHR occupy an intermediary position between the SIF reduction triggered by SIF caused by atmospheric drought and that caused by soil drought. Compound droughts in the eastern parts of the TRHR resulted in a significantly greater decrease in SIF than singular drought events. The eastern parts of the TRHR are characterized by a relatively low elevation and favorable thermal and hydrological conditions, which are beneficial for vegetative regrowth. Vegetation photosynthesis in the eastern parts of the TRHR was significantly weaker under compound droughts than under individual drought events due to land–atmosphere coupling in those areas (Figure 12g–i). Therefore, compound droughts in the TRHR’s grassland ecosystems pose a significantly higher threat to carbon uptake than singular droughts.
Across the Yellow River source region, the pronounced interplay between high SVPDI and low SSMI in July triggered a discernible reduction in vegetation. This distinctive set of interactions underpins a more explicit manifestation of these conditions compared to other parts of the TRHR. To further analyze this phenomenon, we posed singular anomalies arising from atmospheric drought, soil drought, and compound drought, each contributing to the decline in SIF within the Yellow River source region. The delineation was based on atmospheric drought (SVPDI ≥ 0.5), soil drought (SSMI ≤ −0.5), and compound drought (both SVPDI ≥ 0.5 and SSMI ≤ −0.5) conditions as defining criteria. As shown in Figure 13a, atmospheric droughts caused SIF anomalies of −3.46%, −0.47%, and 1.2% in the CSIF, GOSIF, and RTSIF datasets, respectively. The decline in SIF under the soil drought constraint was slightly greater than that corresponding to atmospheric drought, with anomalies of −5.36%, −4.43%, and −3.46% in the CSIF, GOSIF, and RTSIF datasets, respectively. Compound droughts caused larger decreases in SIF than singular drought events, with SIF anomalies of −11.29%, −9.09%, and −5.13%, respectively. The SIF values also markedly decreased as drought severity increased, the sole exception being atmospheric drought in the RTSIF (Figure 13b). When the criterion of compound drought was SVPDI ≥ 1 and SSMI ≤ −1, the SIF anomalies were −14.52%, −12.15%, and −7.02% in the CSIF, GOSIF, and RTSIF datasets, respectively.
The compound drought magnitude index in the Yellow River source region was the largest in July of 2017 (Supplementary Materials, Figure S4), so we used the July 2017 compound drought event as a typical case to analyze the decline in SIF. The average SIF anomalies of the Yellow River source region in that month were −13.14%, −10.32%, and −6.54% in the CSIF, GOSIF, and RTSIF datasets, respectively (Figure 14a–c). Almost the whole region presented negative SIF anomalies in the CSIF and GOSIF datasets, though these anomalies were especially pronounced in the western and southern parts of the region, where SIF decreased by up to 20%. We further analyzed the additional impact of compound droughts on SIF compared to individual drought events. In comparison to a singular atmospheric drought, the additional effect of a compound drought was significantly amplified, resulting in SIF anomalies reaching −9.83%, −9.67%, and −7.68%. These changes were especially accentuated in the southern parts of the region (Figure 14d–f). There was a more pronounced decline in SIF attributable to the compound drought in July 2017, surpassing that observed under atmospheric drought conditions; these effects further inhibited vegetation photosynthesis. The additional effects of compound drought were less impactful when juxtaposed with atmospheric drought than soil drought (Figure 14g–i), suggesting that the magnitude of SIF decline triggered by compound drought was closer to that of a singular soil drought than an atmospheric drought. This reinforces the significant impact of soil droughts on carbon assimilation.

4. Discussion

Both the SVPDI and SSMI showed significant increasing trends across the TRHR during the GS, suggesting an increasing trend in both atmospheric dryness and SM. An increase in the VPD can be primarily attributed to the increased saturated vapor pressure due to warming [9]. This warming, coupled with increased precipitation and the melting of ice, snow, and permafrost, has led to increased SM levels in the TRHR [42]. Geospatially, the SVPDI distribution exhibited a clear dichotomy between the eastern and western parts of the TRHR, with the atmosphere in the eastern areas becoming wetter, while the western parts became drier. SM, on the other hand, demonstrated marked upward trends, barring a small section of the east–central region. The concurrent rise in the SVPDI and SSMI underscores the significant warming and wetting that has occurred across the TRHR [43].
There is an increased probability of heat-related events under global warming, which in turn increases the probability of atmospheric droughts characterized by a high VPD [9,44]. An atmospheric drought can actively drive terrestrial evapotranspiration and thus accelerate SM depletion. The reduction in SM leads to a decrease in evapotranspiration, which reduces latent heat and increases sensible heat, which further increases temperature and the VPD [5]. Ultimately, there is an increasing probability of concurrent atmospheric and soil droughts through strong land–atmosphere coupling [6]. Compound droughts showed a general upward trend in the TRHR, with larger increases in the GS compared to the entire year during 2001–2020. A similar pattern was observed by Wu and Hu [45], who pointed out that compound drought and heat events have significantly increased on the Tibetan Plateau. Further, the probability of the occurrence of low SM in tandem with compound drought and heat events is greater than that of individual events.
The spectral emission profile of SIF encompasses approximately 650–800 nm within intact leaves, with two peaks in the red spectral region (around 685–690 nm) and near-infrared spectral region (about 730–740 nm) [24]. The inherent capacity of SIF to directly capture the dynamic processes of plant photosynthesis makes it a valuable indicator for monitoring vegetation growth and stress responses [19,46]. All three of the SIF datasets used in this study showed high values in the southern and eastern regions of the TRHR, which mirror the spatial patterns derived previously from net primary productivity data by Song et al. [47]. These regions, due to their lower elevations, higher temperatures, and increased precipitation compared to other parts of the region, offer favorable conditions for robust vegetation growth. The notably high correlation coefficients observed between SIF and GPP, especially in the eastern parts of the TRHR (>0.9), further suggest that SIF can be used as a proxy for GPP to explore vegetation dynamics and carbon cycling processes across the region. The SIF exhibited a clear overall upward trend in the TRHR, indicating a clear greening signal from the region’s vegetation. The discernible increase in temperature and precipitation within the TRHR has engendered substantial warming and increased moisture availability, thereby fostering an environment conducive to plant growth. Notably, the decadal attenuation of the summer westerly wind regime, accompanied by increased wetting, has also played an important role in vegetation greening within the TRHR [48].
The SMCI1.0 data used in this study closely align with in situ SM data for the entirety of China, but SMCI1.0 is not guaranteed to be of high quality in every region of China due to the uneven distribution of in situ SM stations, especially in the western part of the country [31]. Multiple SM datasets from different sources (e.g., observations, remote sensing, and model simulations) can be fused via a triple collocation analysis [49,50] to further assess the changes in SM and soil drought in the TRHR.
Droughts generally affect vegetation through cumulative and lagged effects. Different vegetation types respond to a drought at different speeds. The response of grassland ecosystems to short-term droughts, for example, is more pronounced than that of other land types [51]. Regarding grasslands, the cumulative and lagged effects of droughts are mainly confined to shorter timescales (1–3 months), where the cumulative effect is stronger than the lagged effect [11]. Accordingly, we focused on the effects of the 1-month SVPDI and SSMI and their compound events on grassland ecosystems in the TRHR. The responses of grasslands to drought also differ within different types of climates. For example, grasslands in arid regions have a strong tolerance to droughts [11]. In the future, we may explore the impacts of different combinations of cumulative and lagged effects of atmospheric and soil droughts on vegetation growth. The compound drought definition utilized in this study was determined mainly from a temporally compounding perspective at a given grid. There are other events observable from a temporally compounding perspective; for example, sequential occurrences of different types of drought (i.e., the drought propagation perspective) [52]. These include atmospheric droughts in a given month and soil droughts in the following month. The sequential concurrence of different types of droughts can be as damaging to the photosynthetic capacity of vegetation as the concurrent different types of drought events. The effects of different temporally compounding events on SIF may be explored in our next study.
Overall, SIF increased with precipitation (Supplementary Materials, Figure S5), temperature (Supplementary Materials, Figure S6), and SM (Supplementary Materials, Figure S7) in the TRHR, especially in July. He, et al. [53] pointed out that precipitation regimes mainly drive GPP variations across in the Tibetan Plateau, an influence that becomes more pronounced as climate change causes temperatures to warm. In mountain grassland regions, increased temperatures favor an earlier vegetation growth period and an increase in vegetation photosynthesis [54]. An increase in SM can enhance the maximum photosynthetic capacity of mountain ecosystems, thereby promoting vegetation growth [55]. Overall, the SIF showed a decreasing trend with an increasing VPD in the TRHR (Supplementary Materials, Figure S8). A high VPD can also limit vegetative photosynthesis due to high temperatures, and this negative effect of the VPD on the productivity of grassland ecosystems may be further enhanced in a warming world [9].
We analyzed the characteristics of SIF responses to different combinations of SVPDI and SSMI during the GS and July in the TRHR, respectively. In general, SIF trended upward with rising SM levels in July. This observation underscores the dominant role of SM in driving vegetation growth within the region, a finding that aligns with prior research [8,55]. Strong land–atmosphere interactions fortified the negative VPD–SM coupling in the TRHR during July, thus increasing the probability of compound droughts. Compound droughts can significantly reduce carbon uptake in terrestrial systems compared with individual drought events, which would be especially problematic in the eastern parts of the TRHR (i.e., the Yellow River source region), where vegetation naturally flourishes. As the severity of compound droughts intensifies, the influence of reduced vegetation photosynthesis will become more pronounced in the Yellow River source region.
A typical compound drought occurred in the Yellow River source region in July of 2017, driven by a precipitation deficit, high temperature, high VPD, and low SM (Supplementary Materials, Figure S9). This compound drought event resulted in a decrease of about 10% in the SIF throughout the region but was particularly pronounced in the south, which experienced a decrease of up to 20%. This substantial decline seriously threatened the carbon balance of the region’s ecosystem. The additional effect of the July 2017 compound drought, compared to the soil drought, was relatively smaller in contrast to atmospheric drought. This suggests that the efficacy of soil drought in restricting vegetation photosynthesis was more pronounced in this event than an atmospheric drought. A similar observation was made in a previous study [5], which highlighted that grasslands in China experience a slightly more substantial GPP decline under soil drought conditions compared to atmospheric drought conditions. Echoing these findings, another study found that SM was the dominant driver of dryness stress on ecosystem production via a decoupled approach in most of the world’s vegetated land areas [8]. Currently, the contributions of the VPD and SM to vegetation photosynthetic capacity under compound drought conditions is still unknown. In the future, we plan to address this knowledge gap. Most previous studies were based on remotely sensed information in assessing SIF characteristics during various historical periods [8,25,26,56], while the characteristics of SIF in the future under different emissions scenarios remain unexplored. The Coupled Model Intercomparison Project Phase 6 (CMIP6) and vegetation models may be useful for predicting future GPP and SIF characteristics, especially responses to drought stress.

5. Conclusions

The escalating repercussions of climate change have led to a surge in droughts and heat-related events, exerting adverse effects on the photosynthetic capacity of vegetation and altering carbon cycles across the globe. These phenomena are particularly pronounced in mountainous terrains, as ecosystems at higher altitudes can be especially fragile. In this study, we analyzed the effects of atmospheric drought, soil drought, and compound drought on vegetation photosynthesis using high-resolution meteorological, SM, and SIF datasets covering the TRHR during the 2001–2020. Our main conclusions can be summarized as follows.
(1)
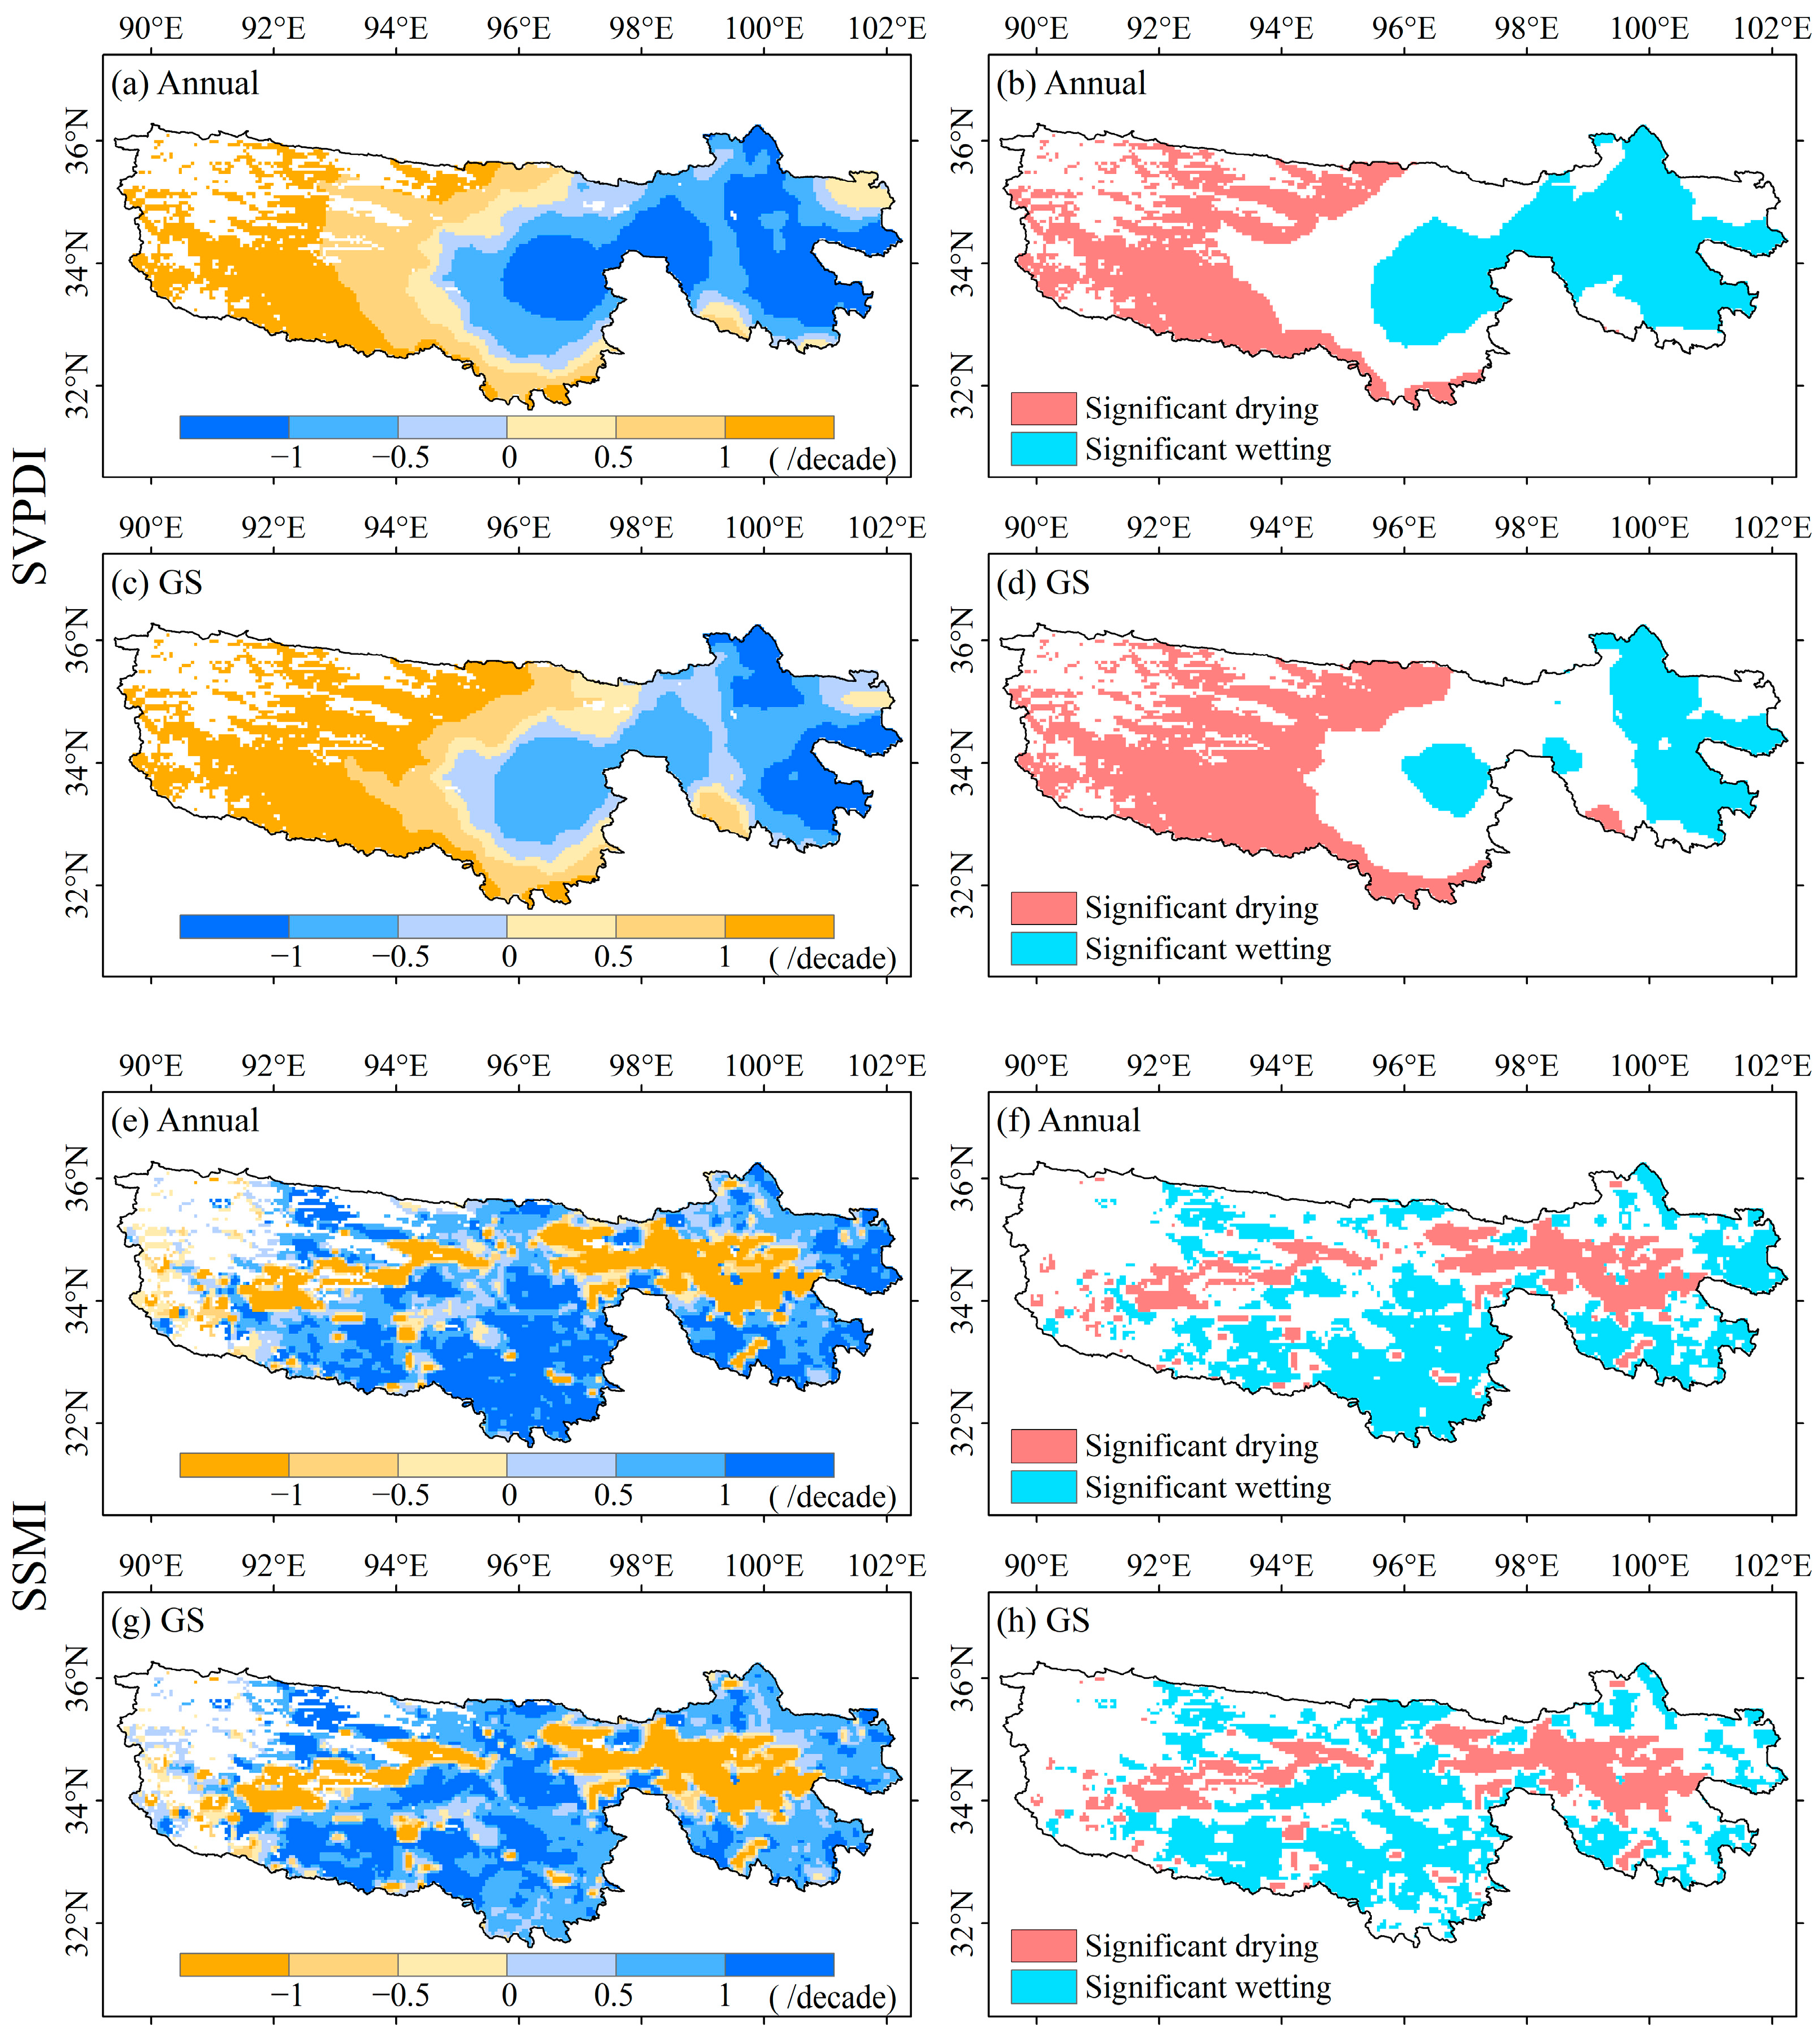
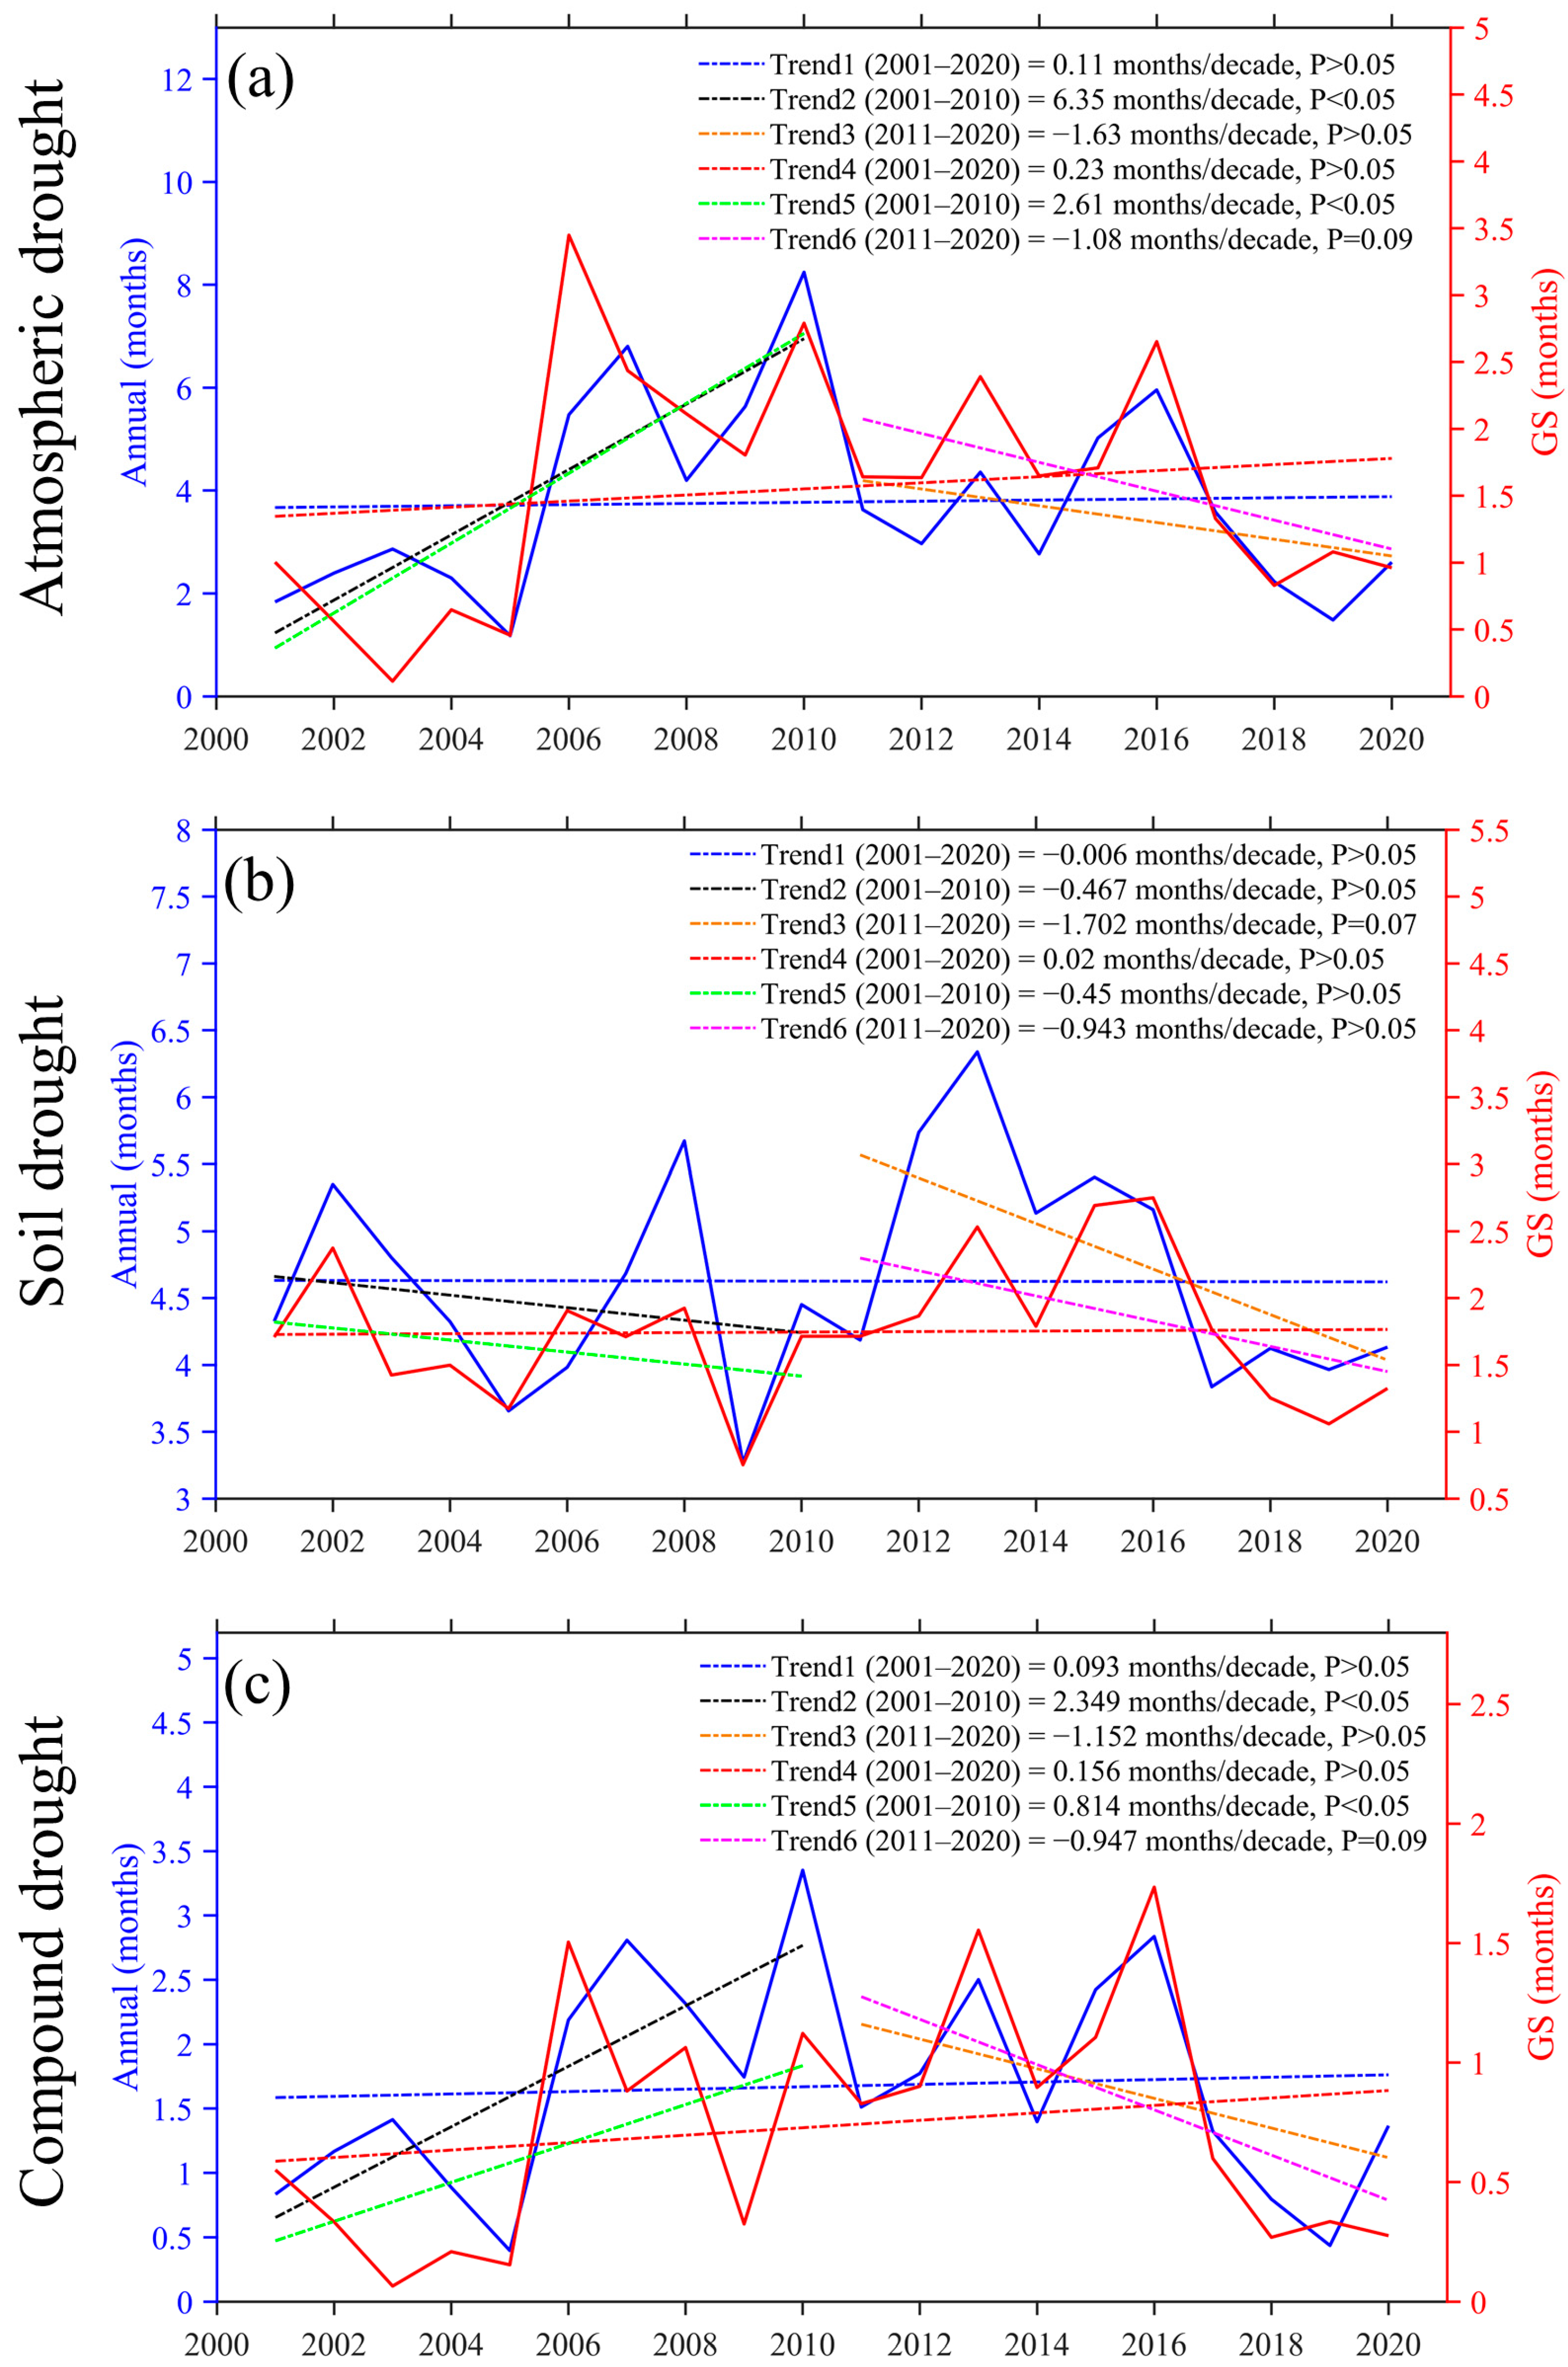
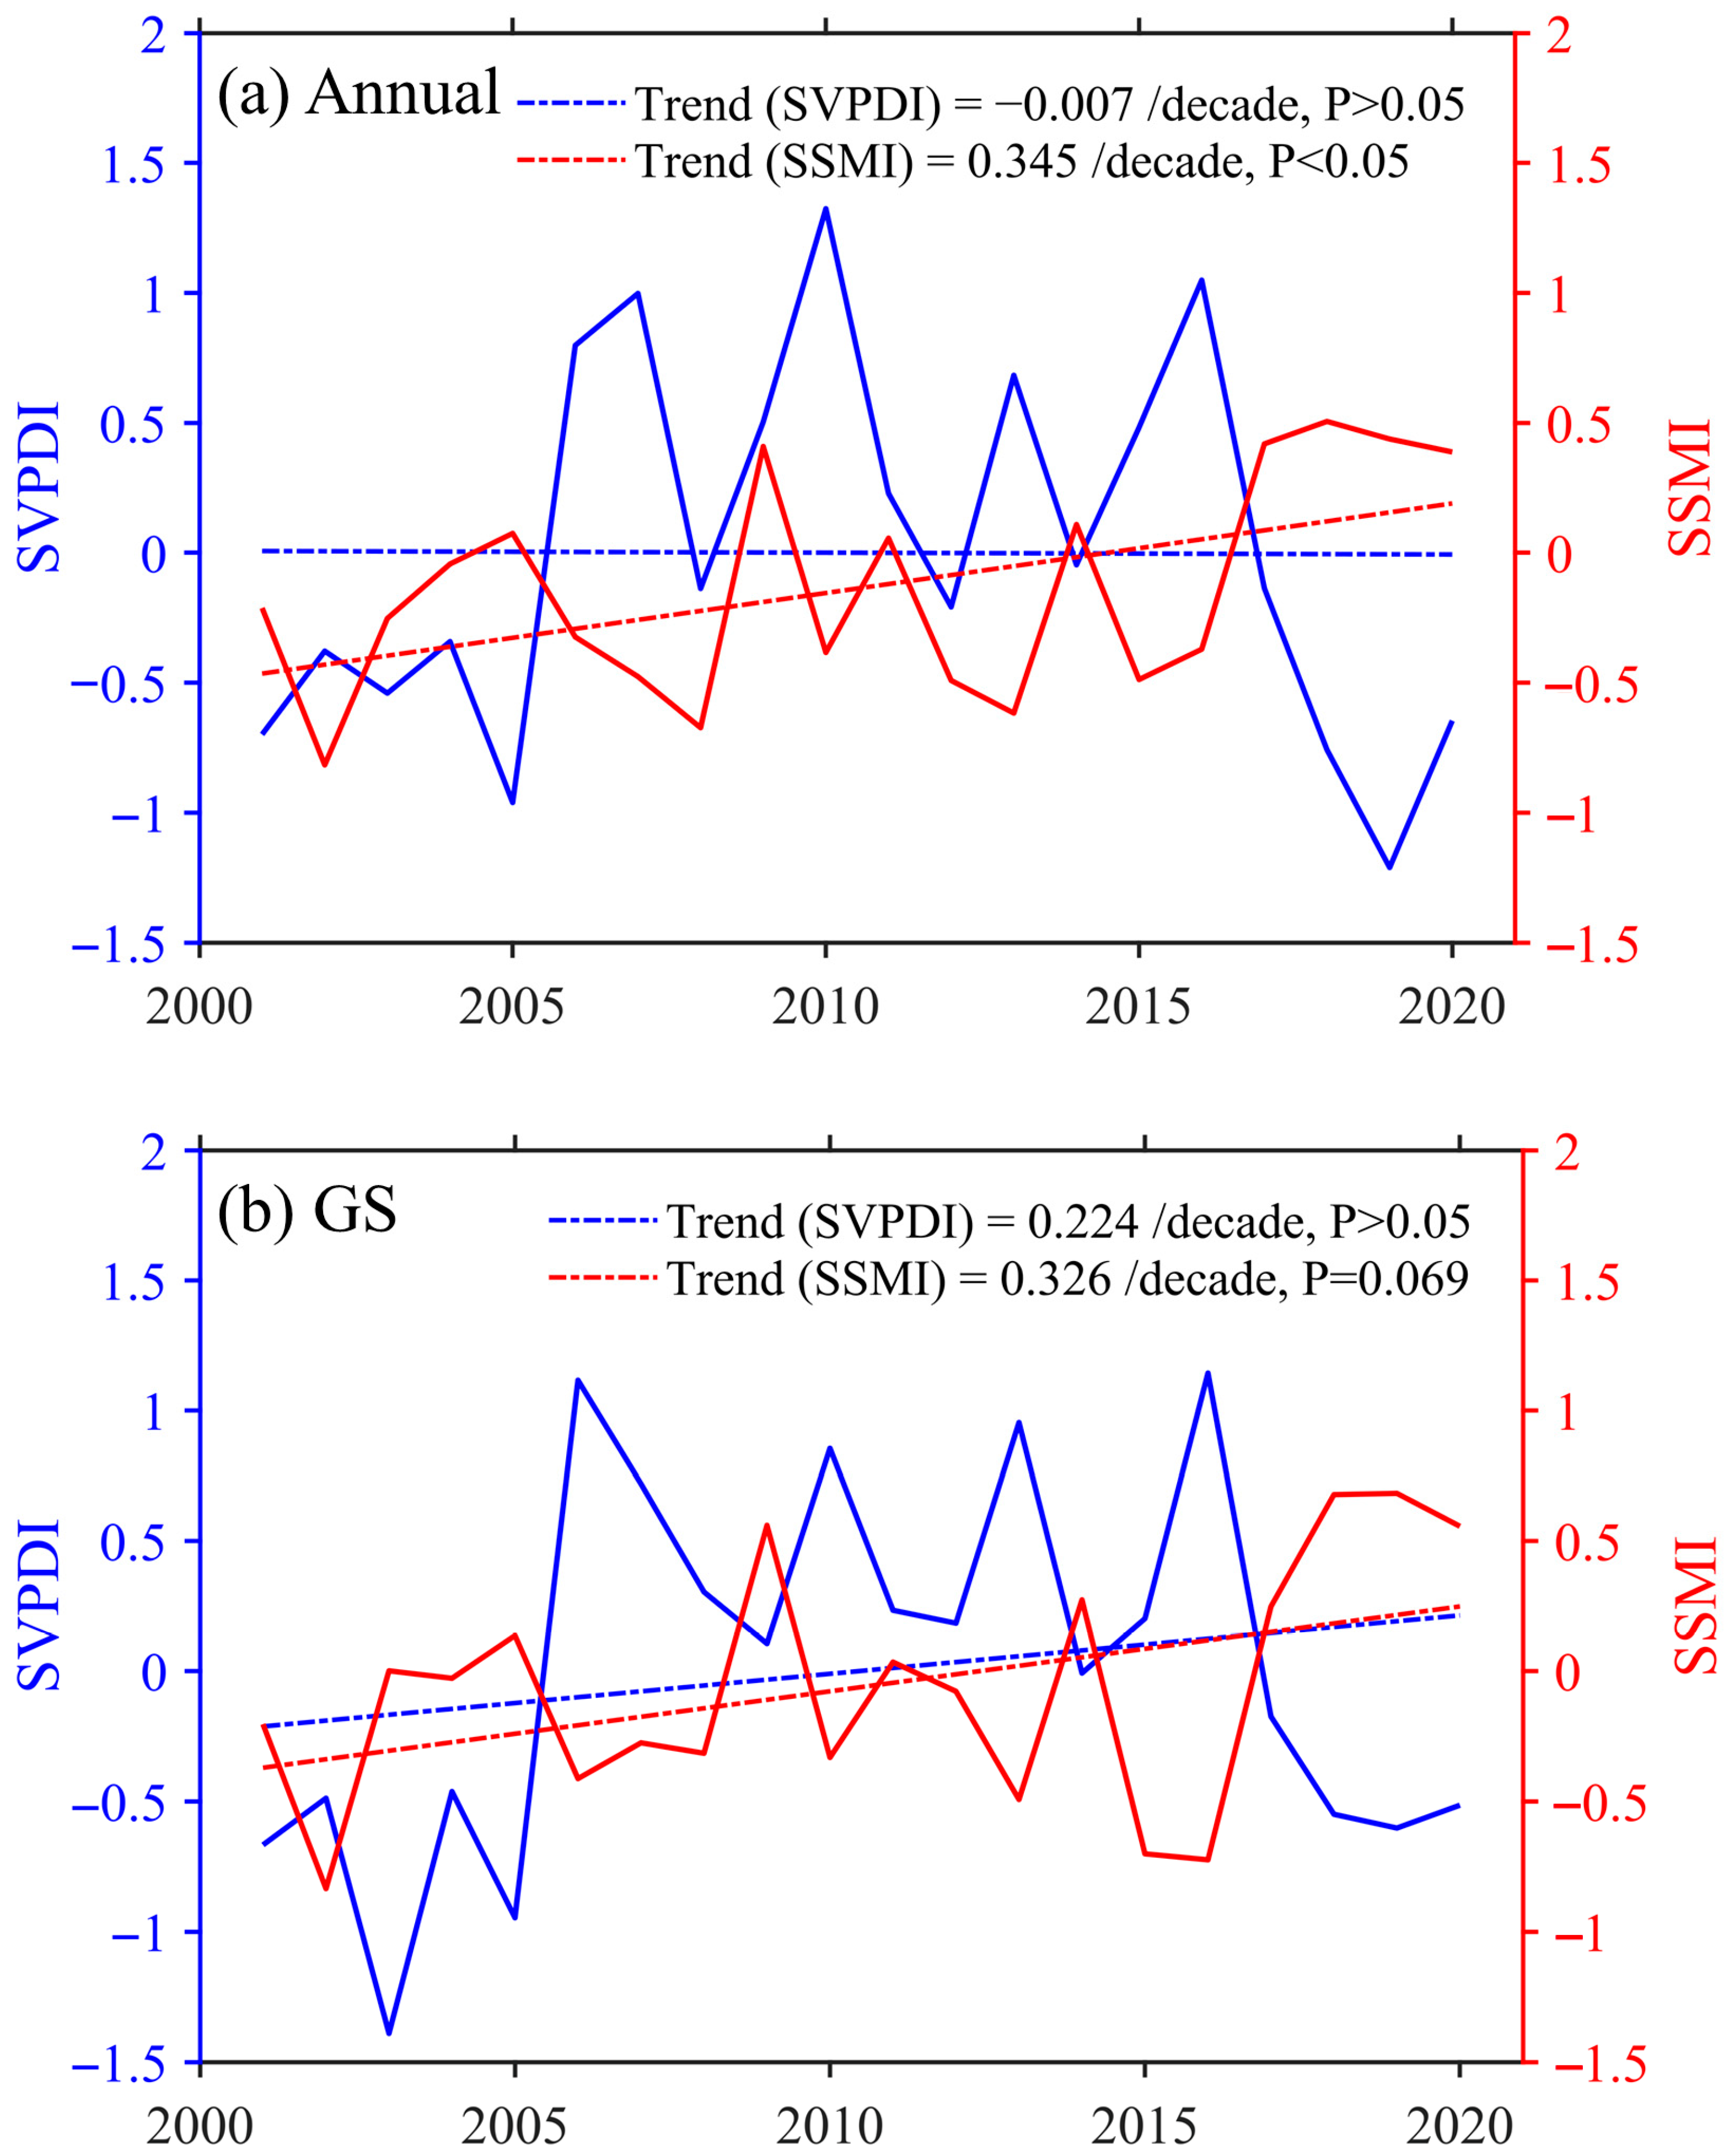
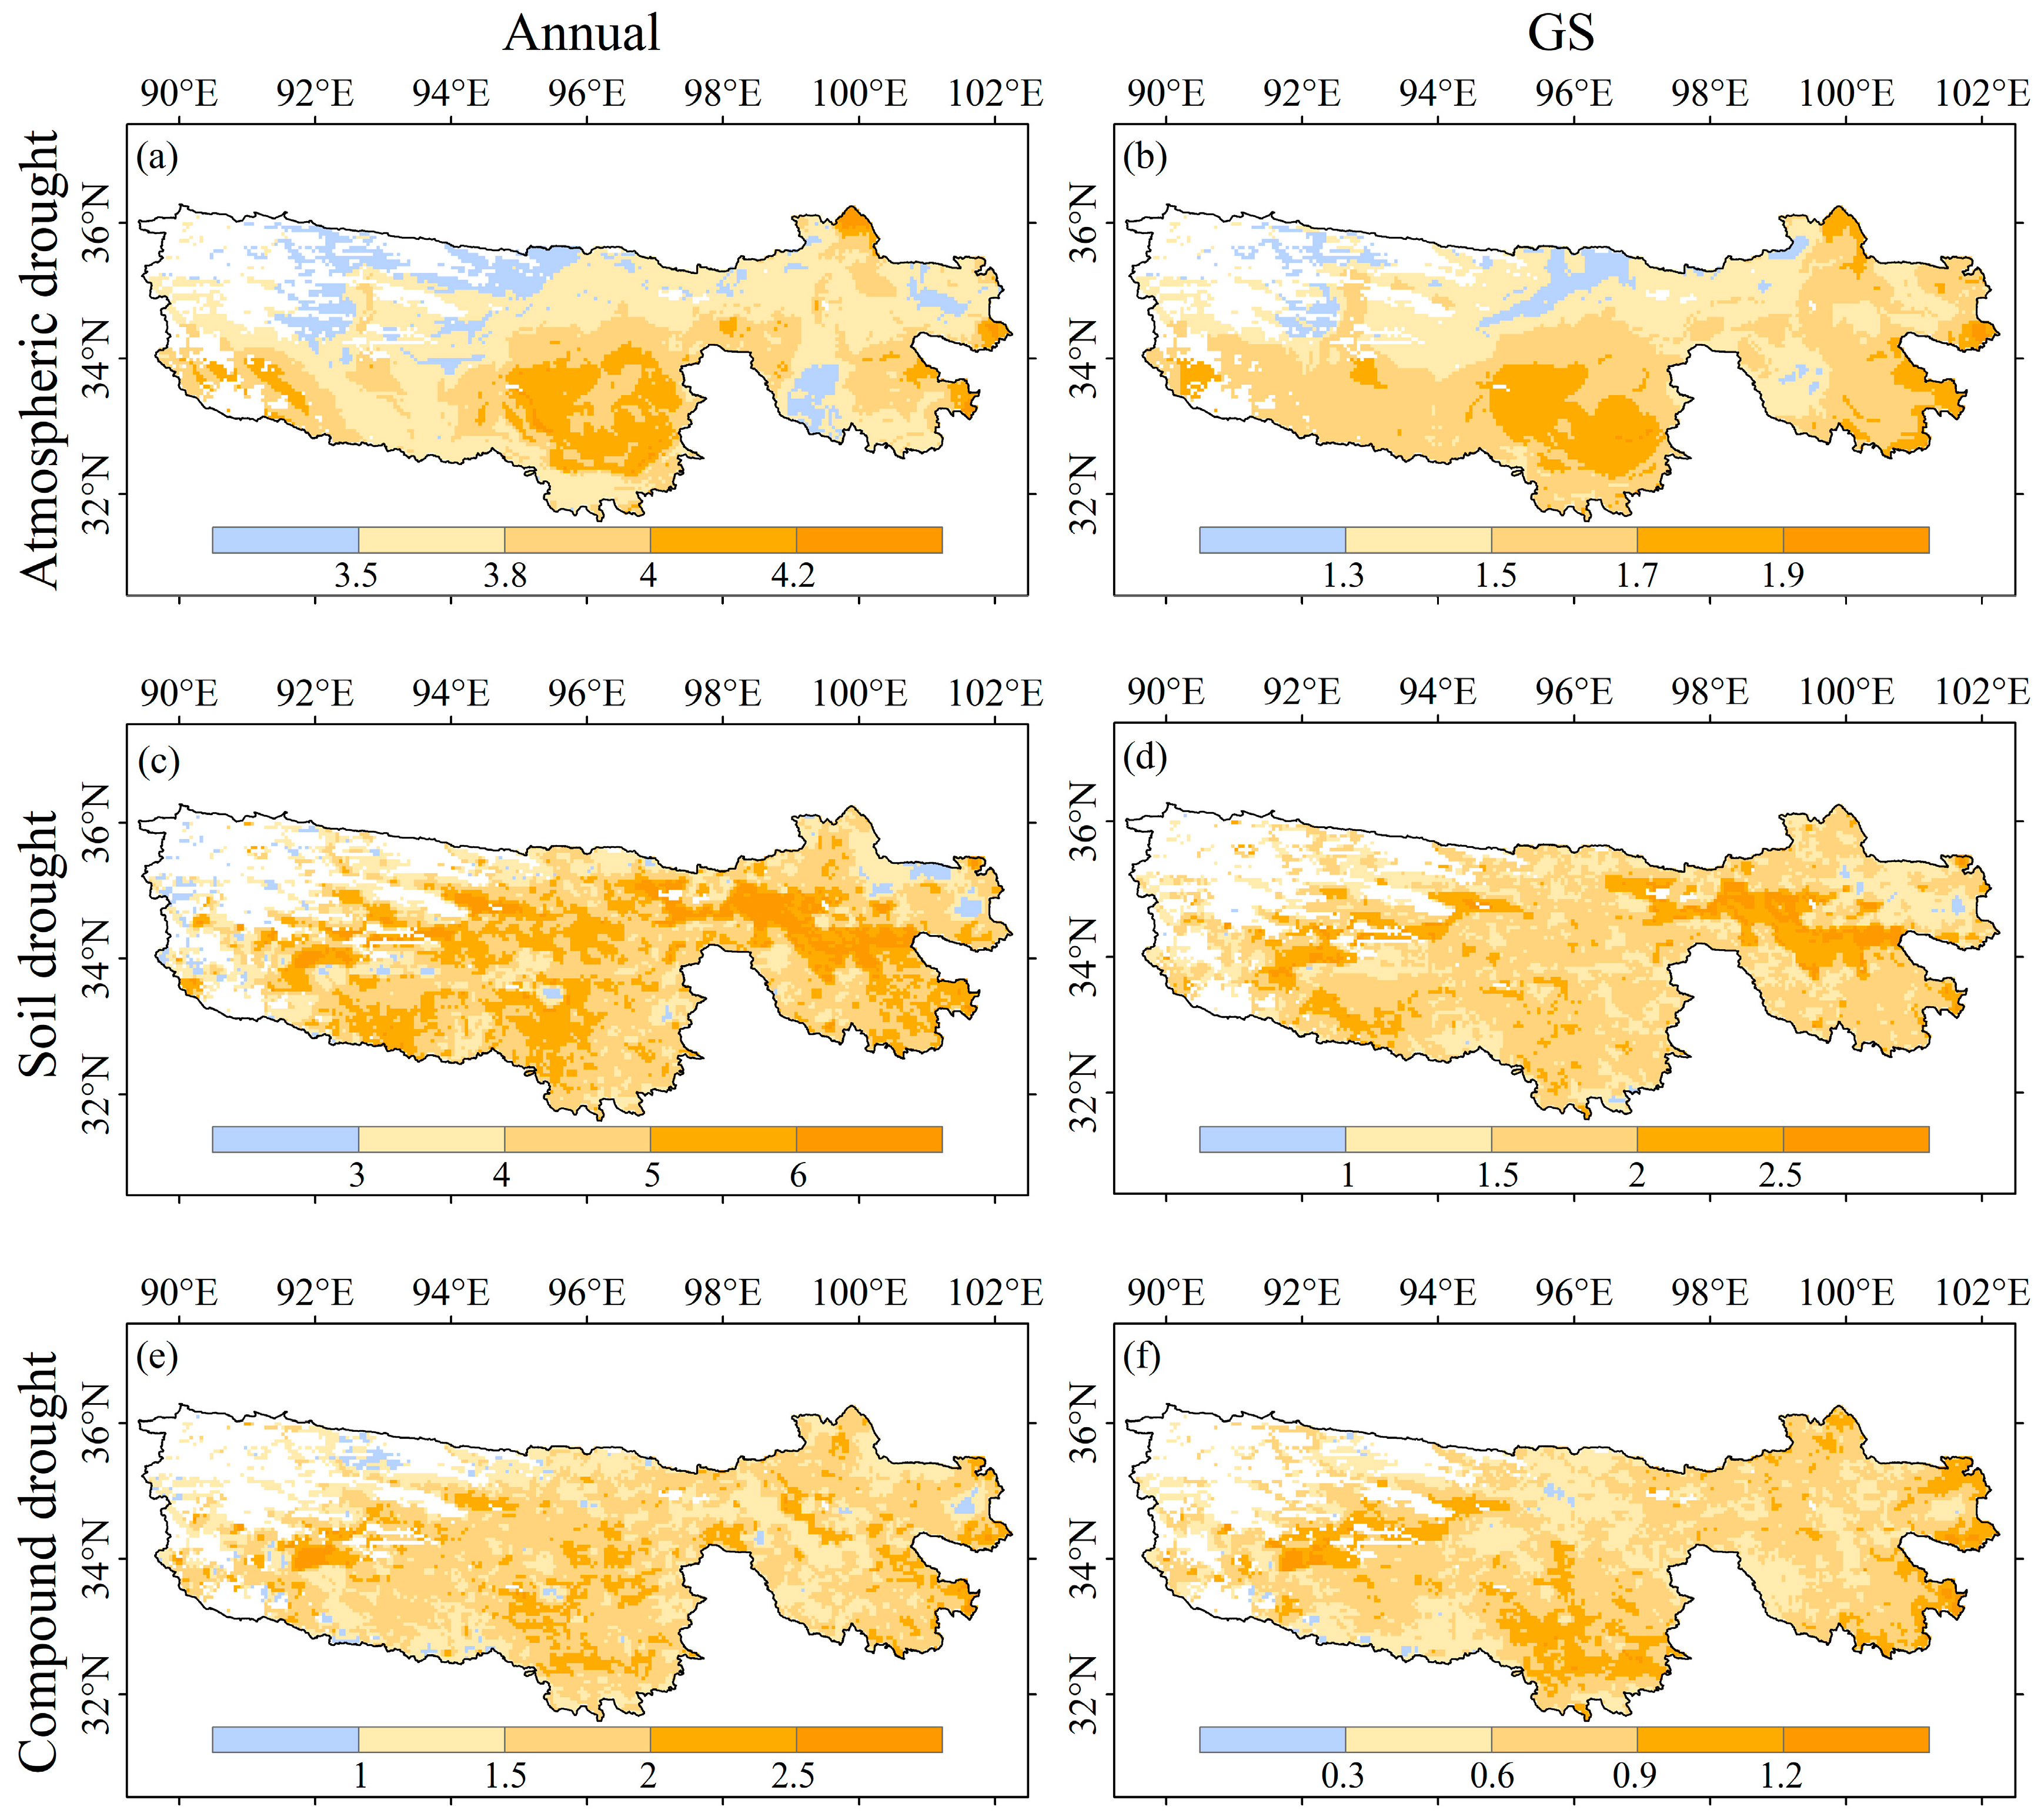
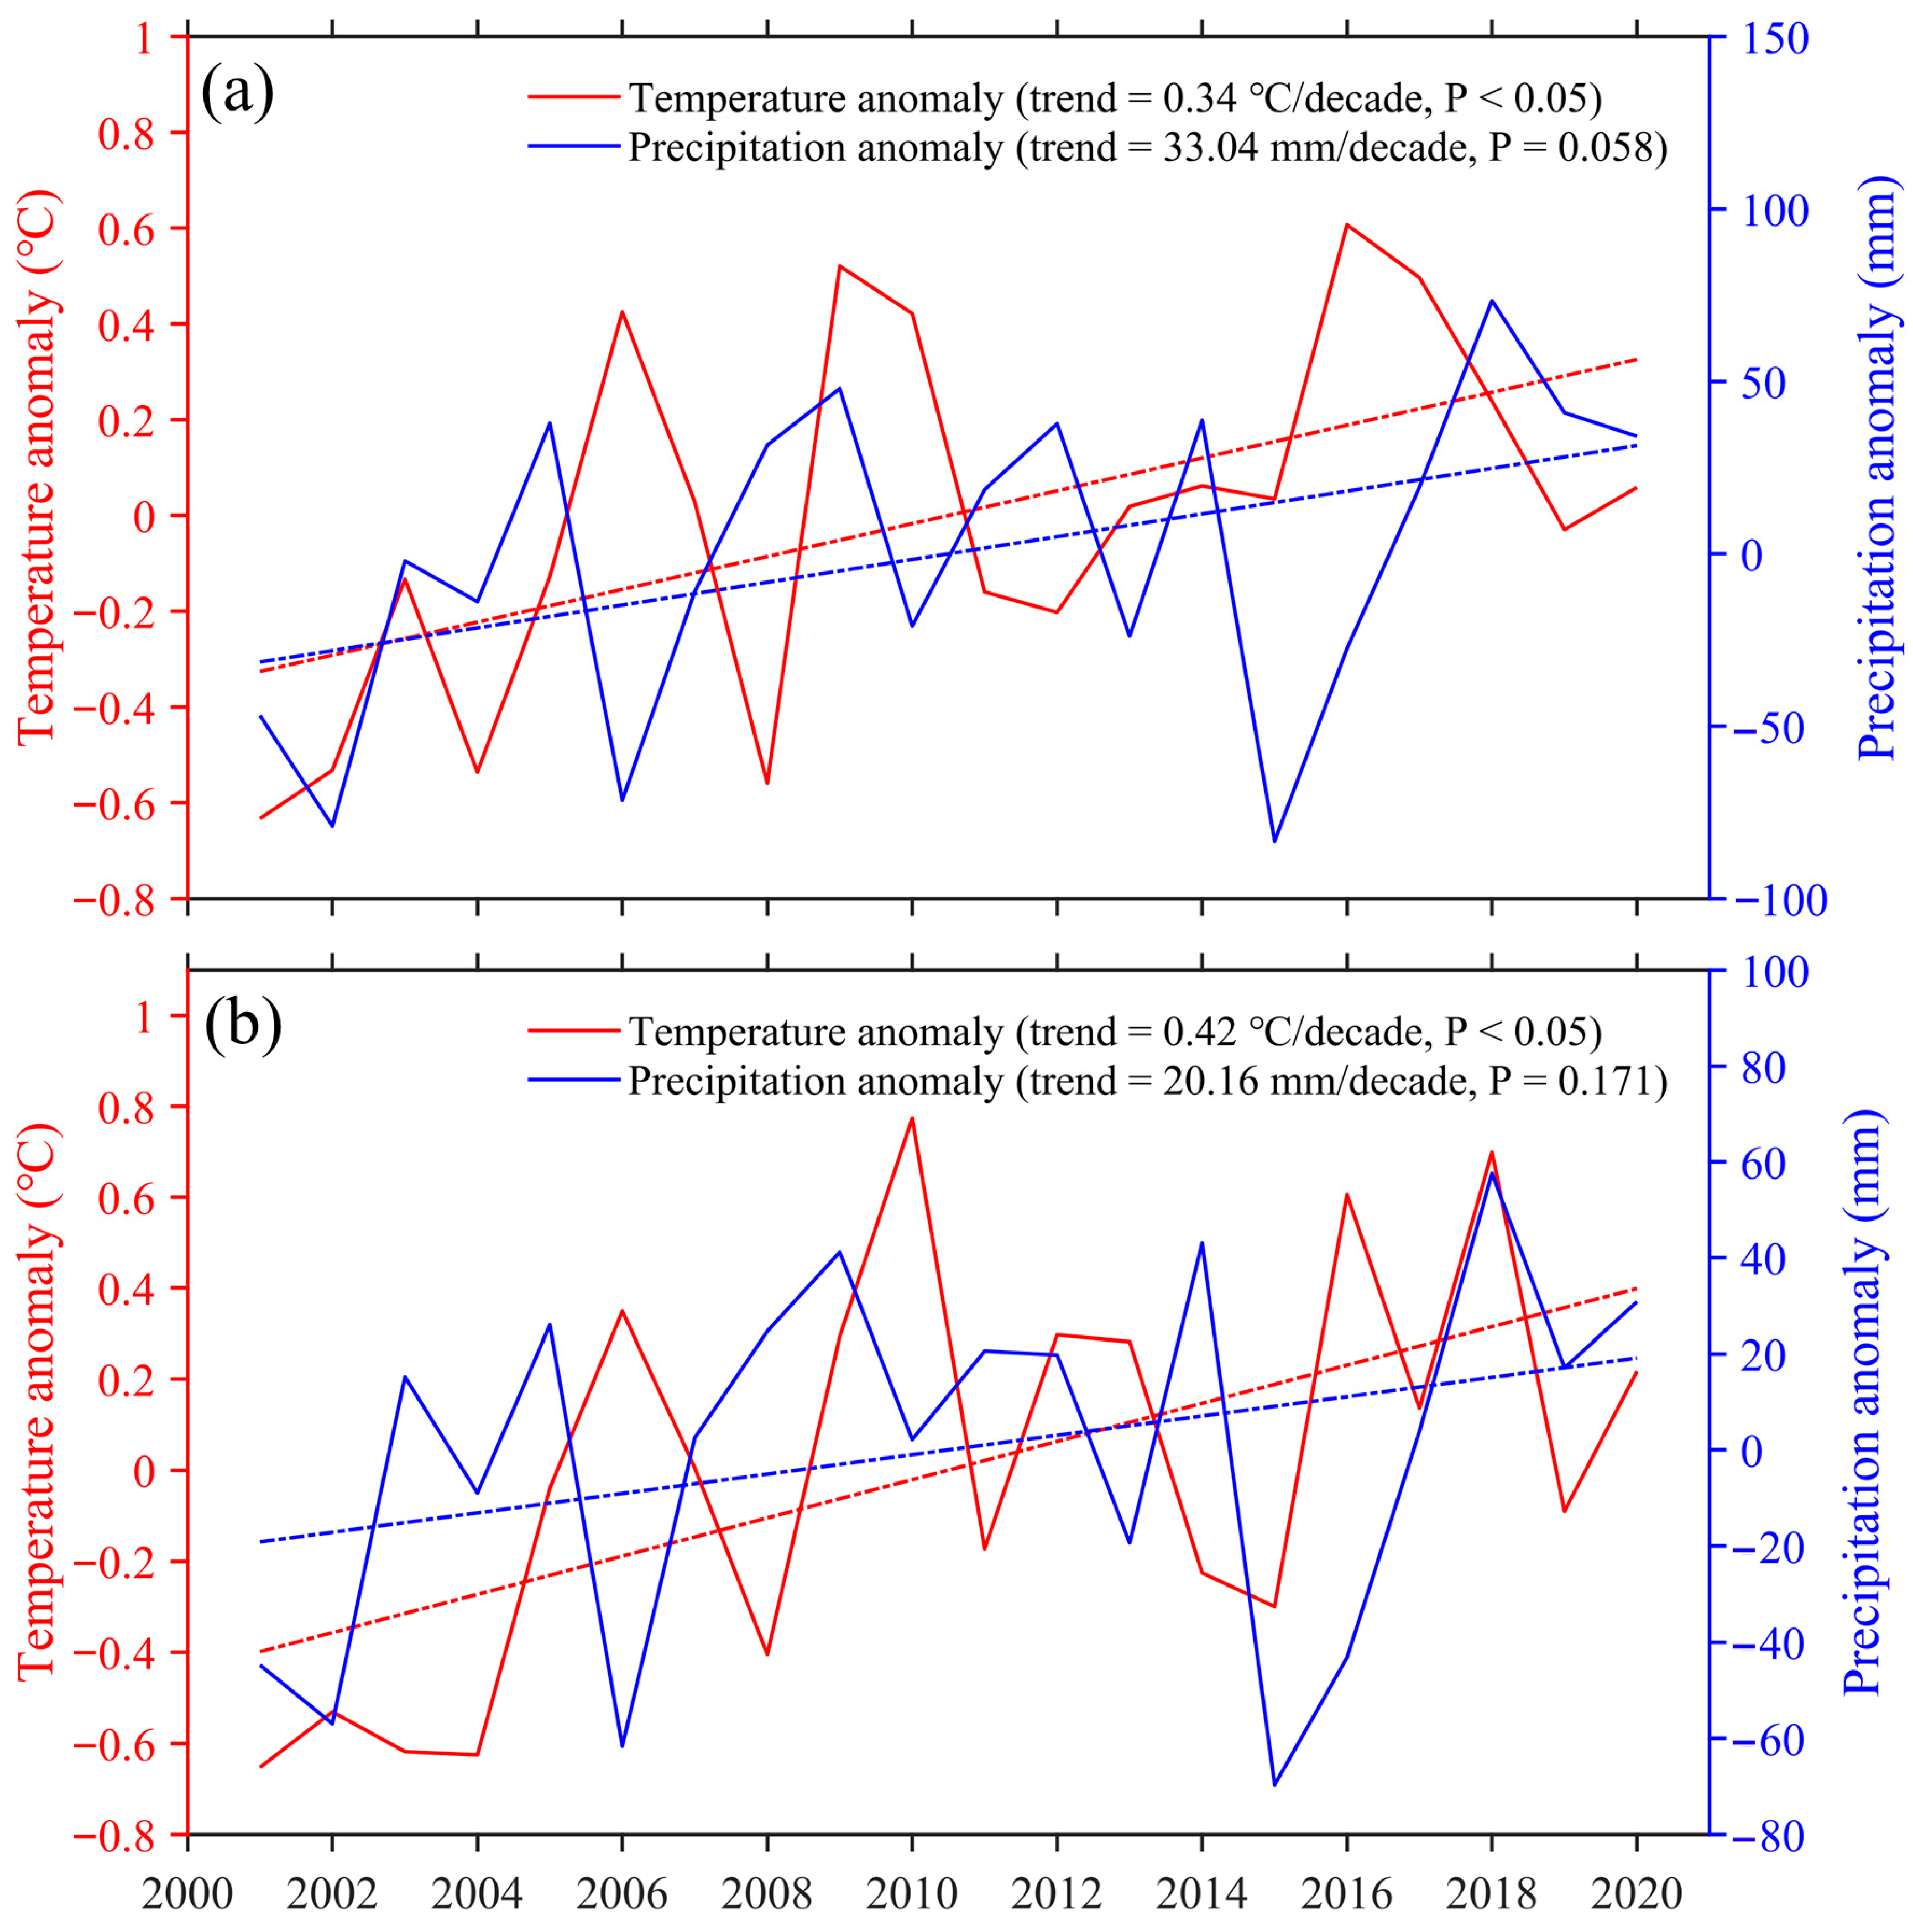
On the whole, both the SVPDI and SSMI showed increasing trends in the TRHR during the GS from 2001 to 2020. To this effect, the TRHR has been experiencing atmospheric desiccation and soil wetting due to climate warming and increased precipitation in recent decades. Atmospheric drought within the GS was predominantly distributed in the southern and eastern parts of the TRHR. Soil drought was mainly distributed in the eastern parts. The combination of atmospheric and soil droughts resulting in compound drought conditions was more common in the southern and eastern parts of the region. There was an upward trend in compound droughts in the TRHR during the GS from 2001 to 2020, which can be attributed to the disparity between intensifying rates during 2001–2011 and subsequent attenuation during 2011–2020.
(2)
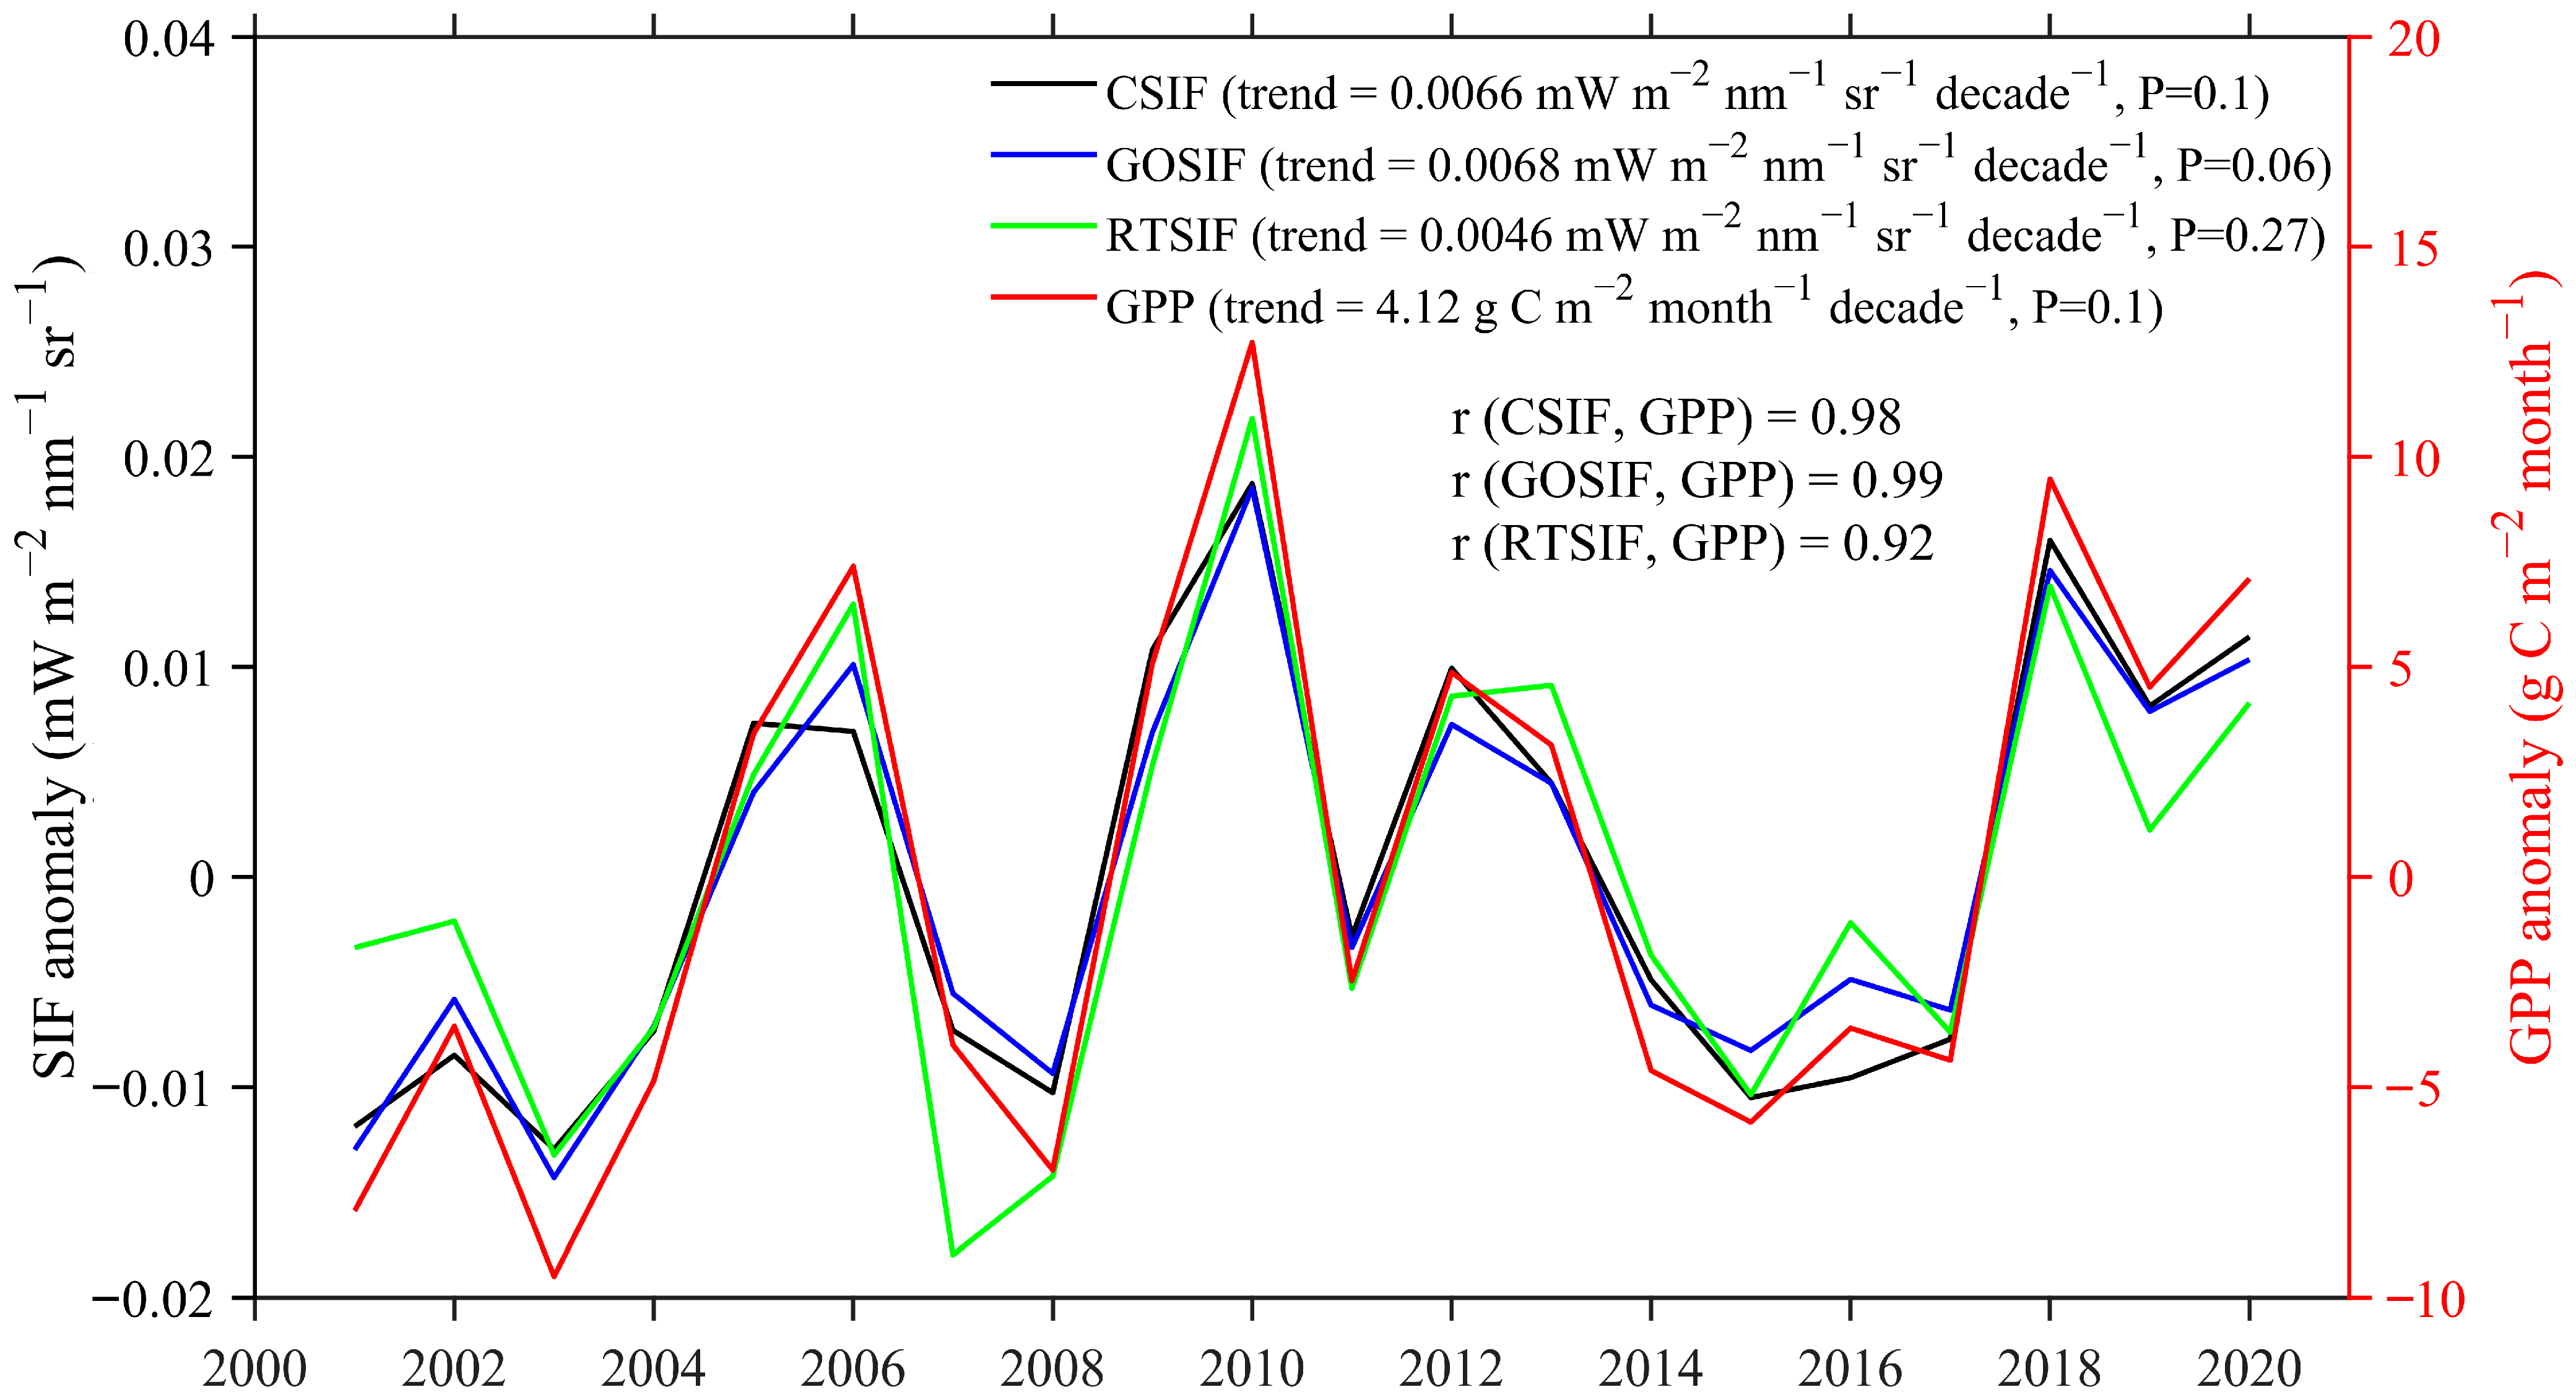
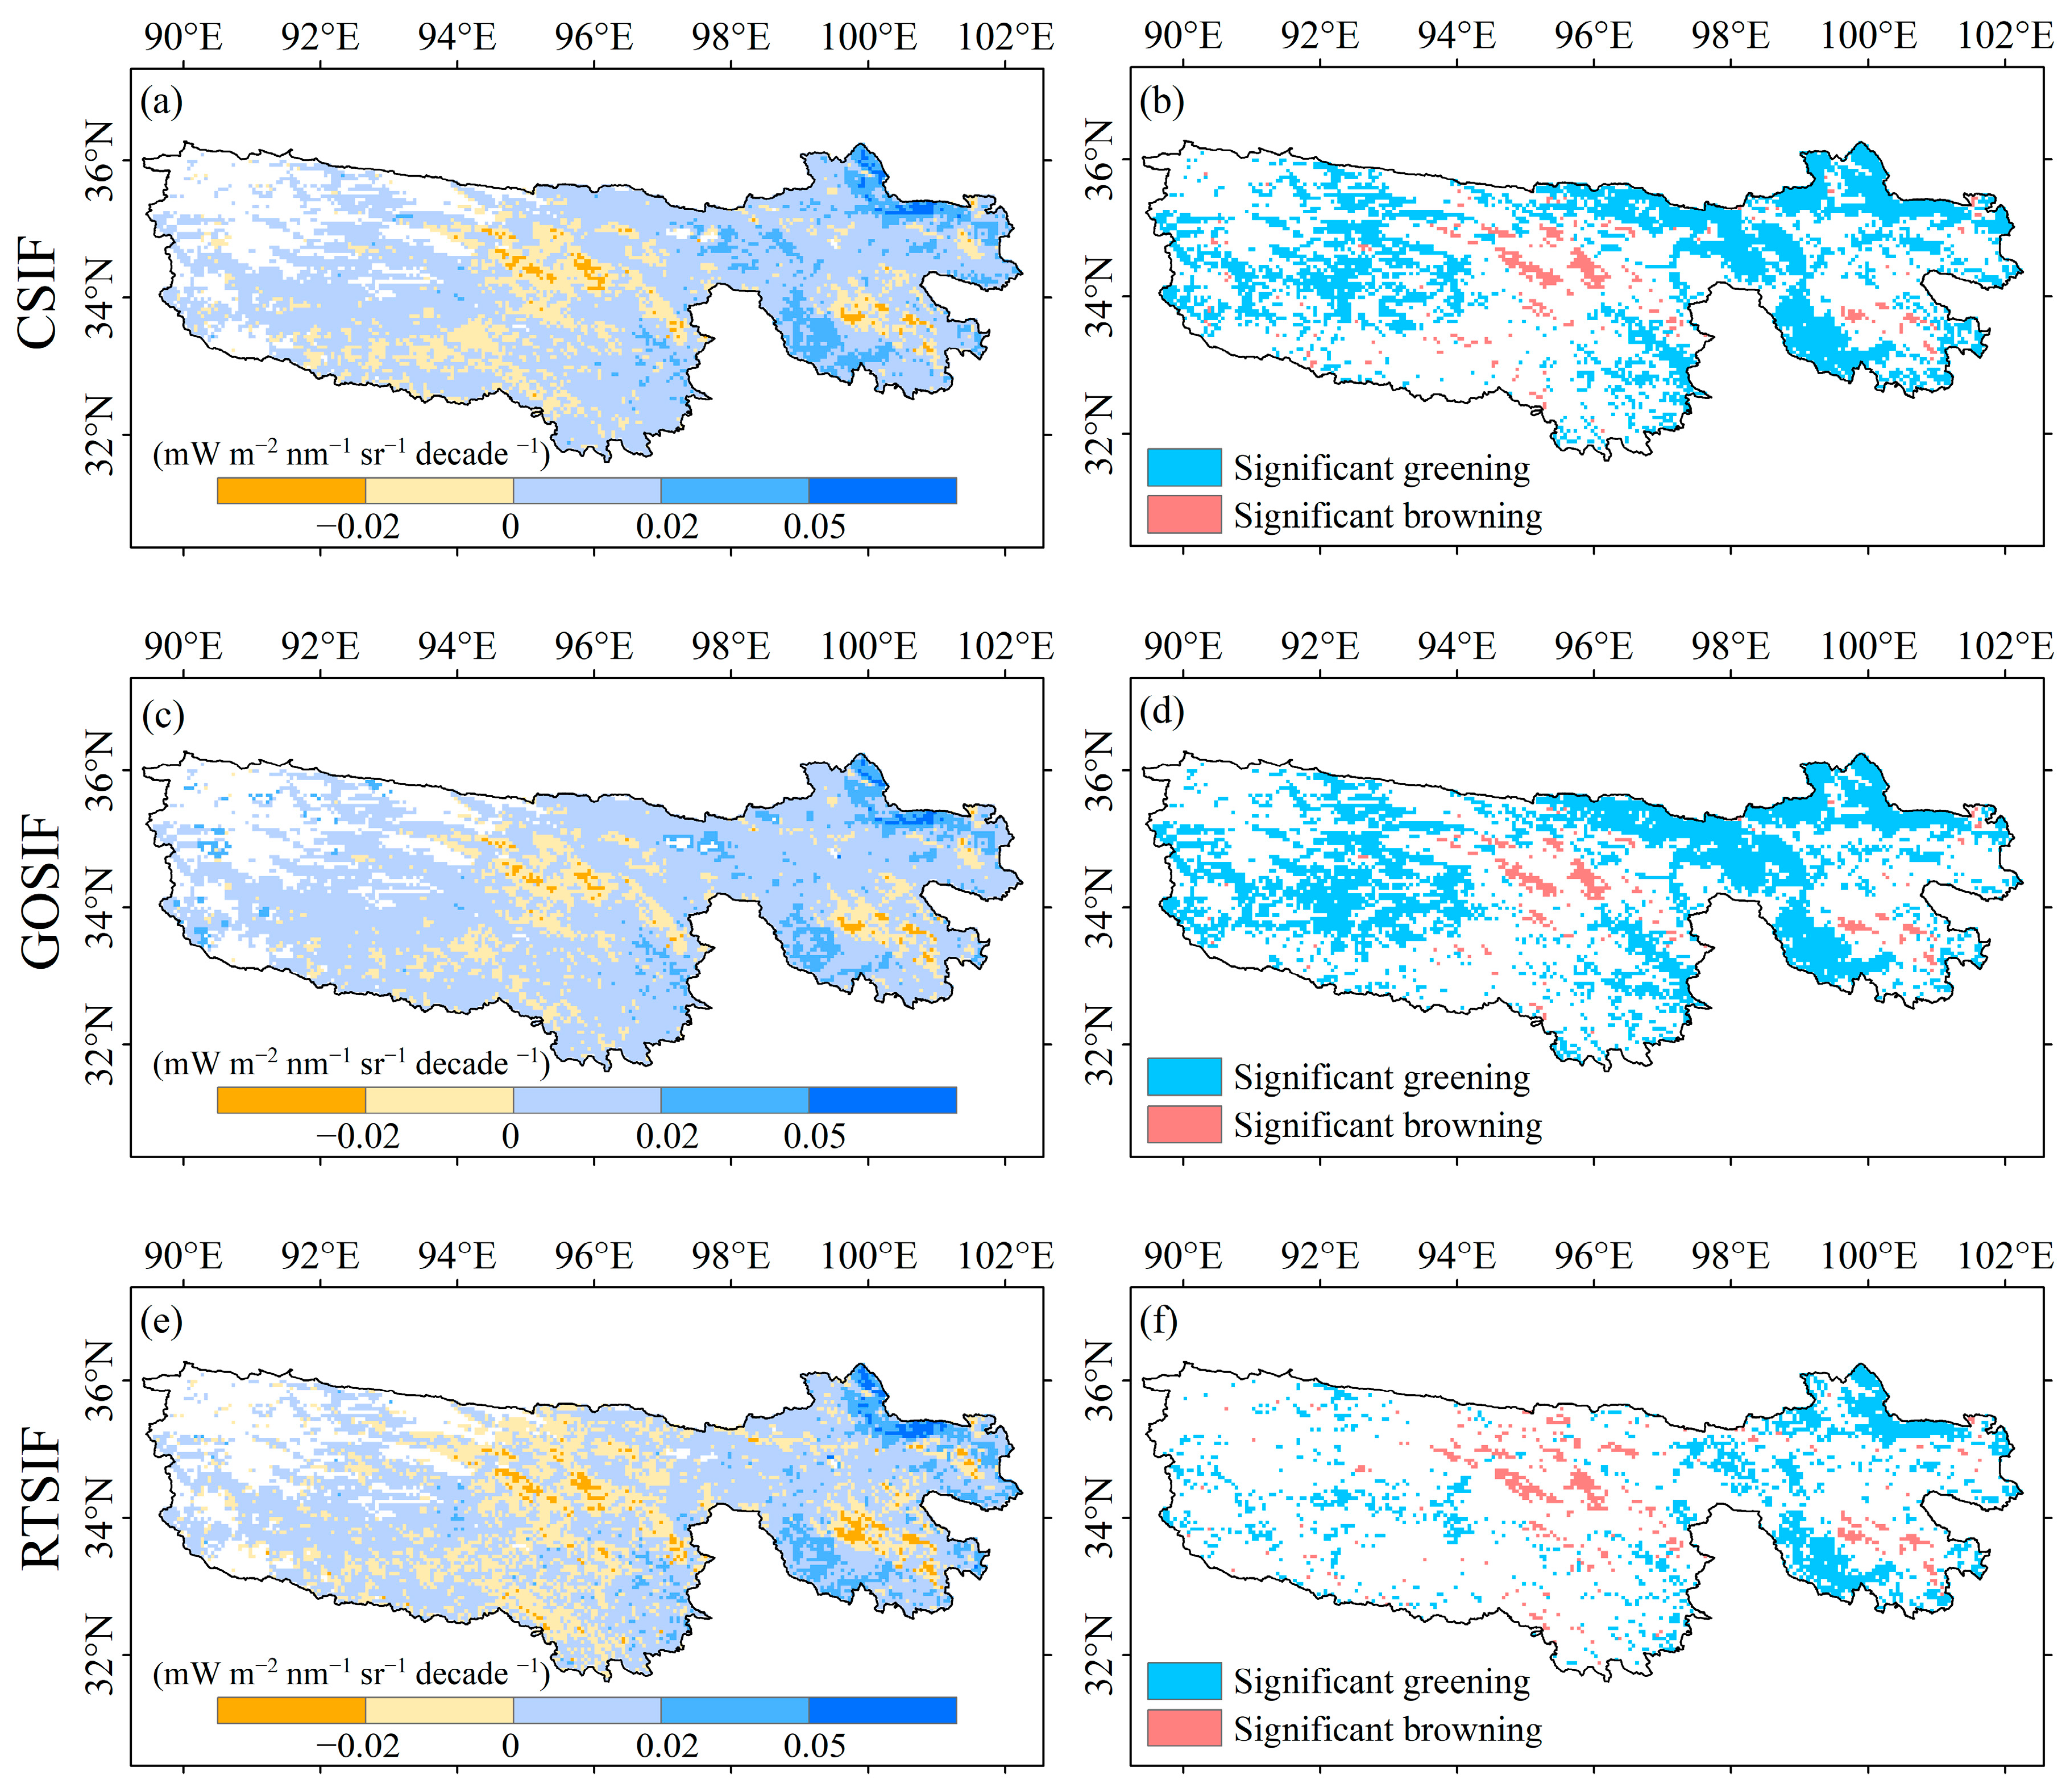
Across the various datasets we used, CSIF, GOSIF, and RTSIF showed relatively high values in the southern and eastern parts of the TRHR, indicating better vegetation growth in these areas. The correlation coefficients between SIF and GPP reached up to 0.9 in the region as well, which indicated that SIF and GPP have an extremely stable correlation in the TRHR and further that GPP/SIF can be estimated from the available SIF/GPP. SIF showed a significant upward trend from 2001 to 2020, indicating that the vegetation of the TRHR has become significantly greener in the last 20 years, which may be due to the warming and wetting dynamics of the region having contributed to a more verdant landscape.
(3)
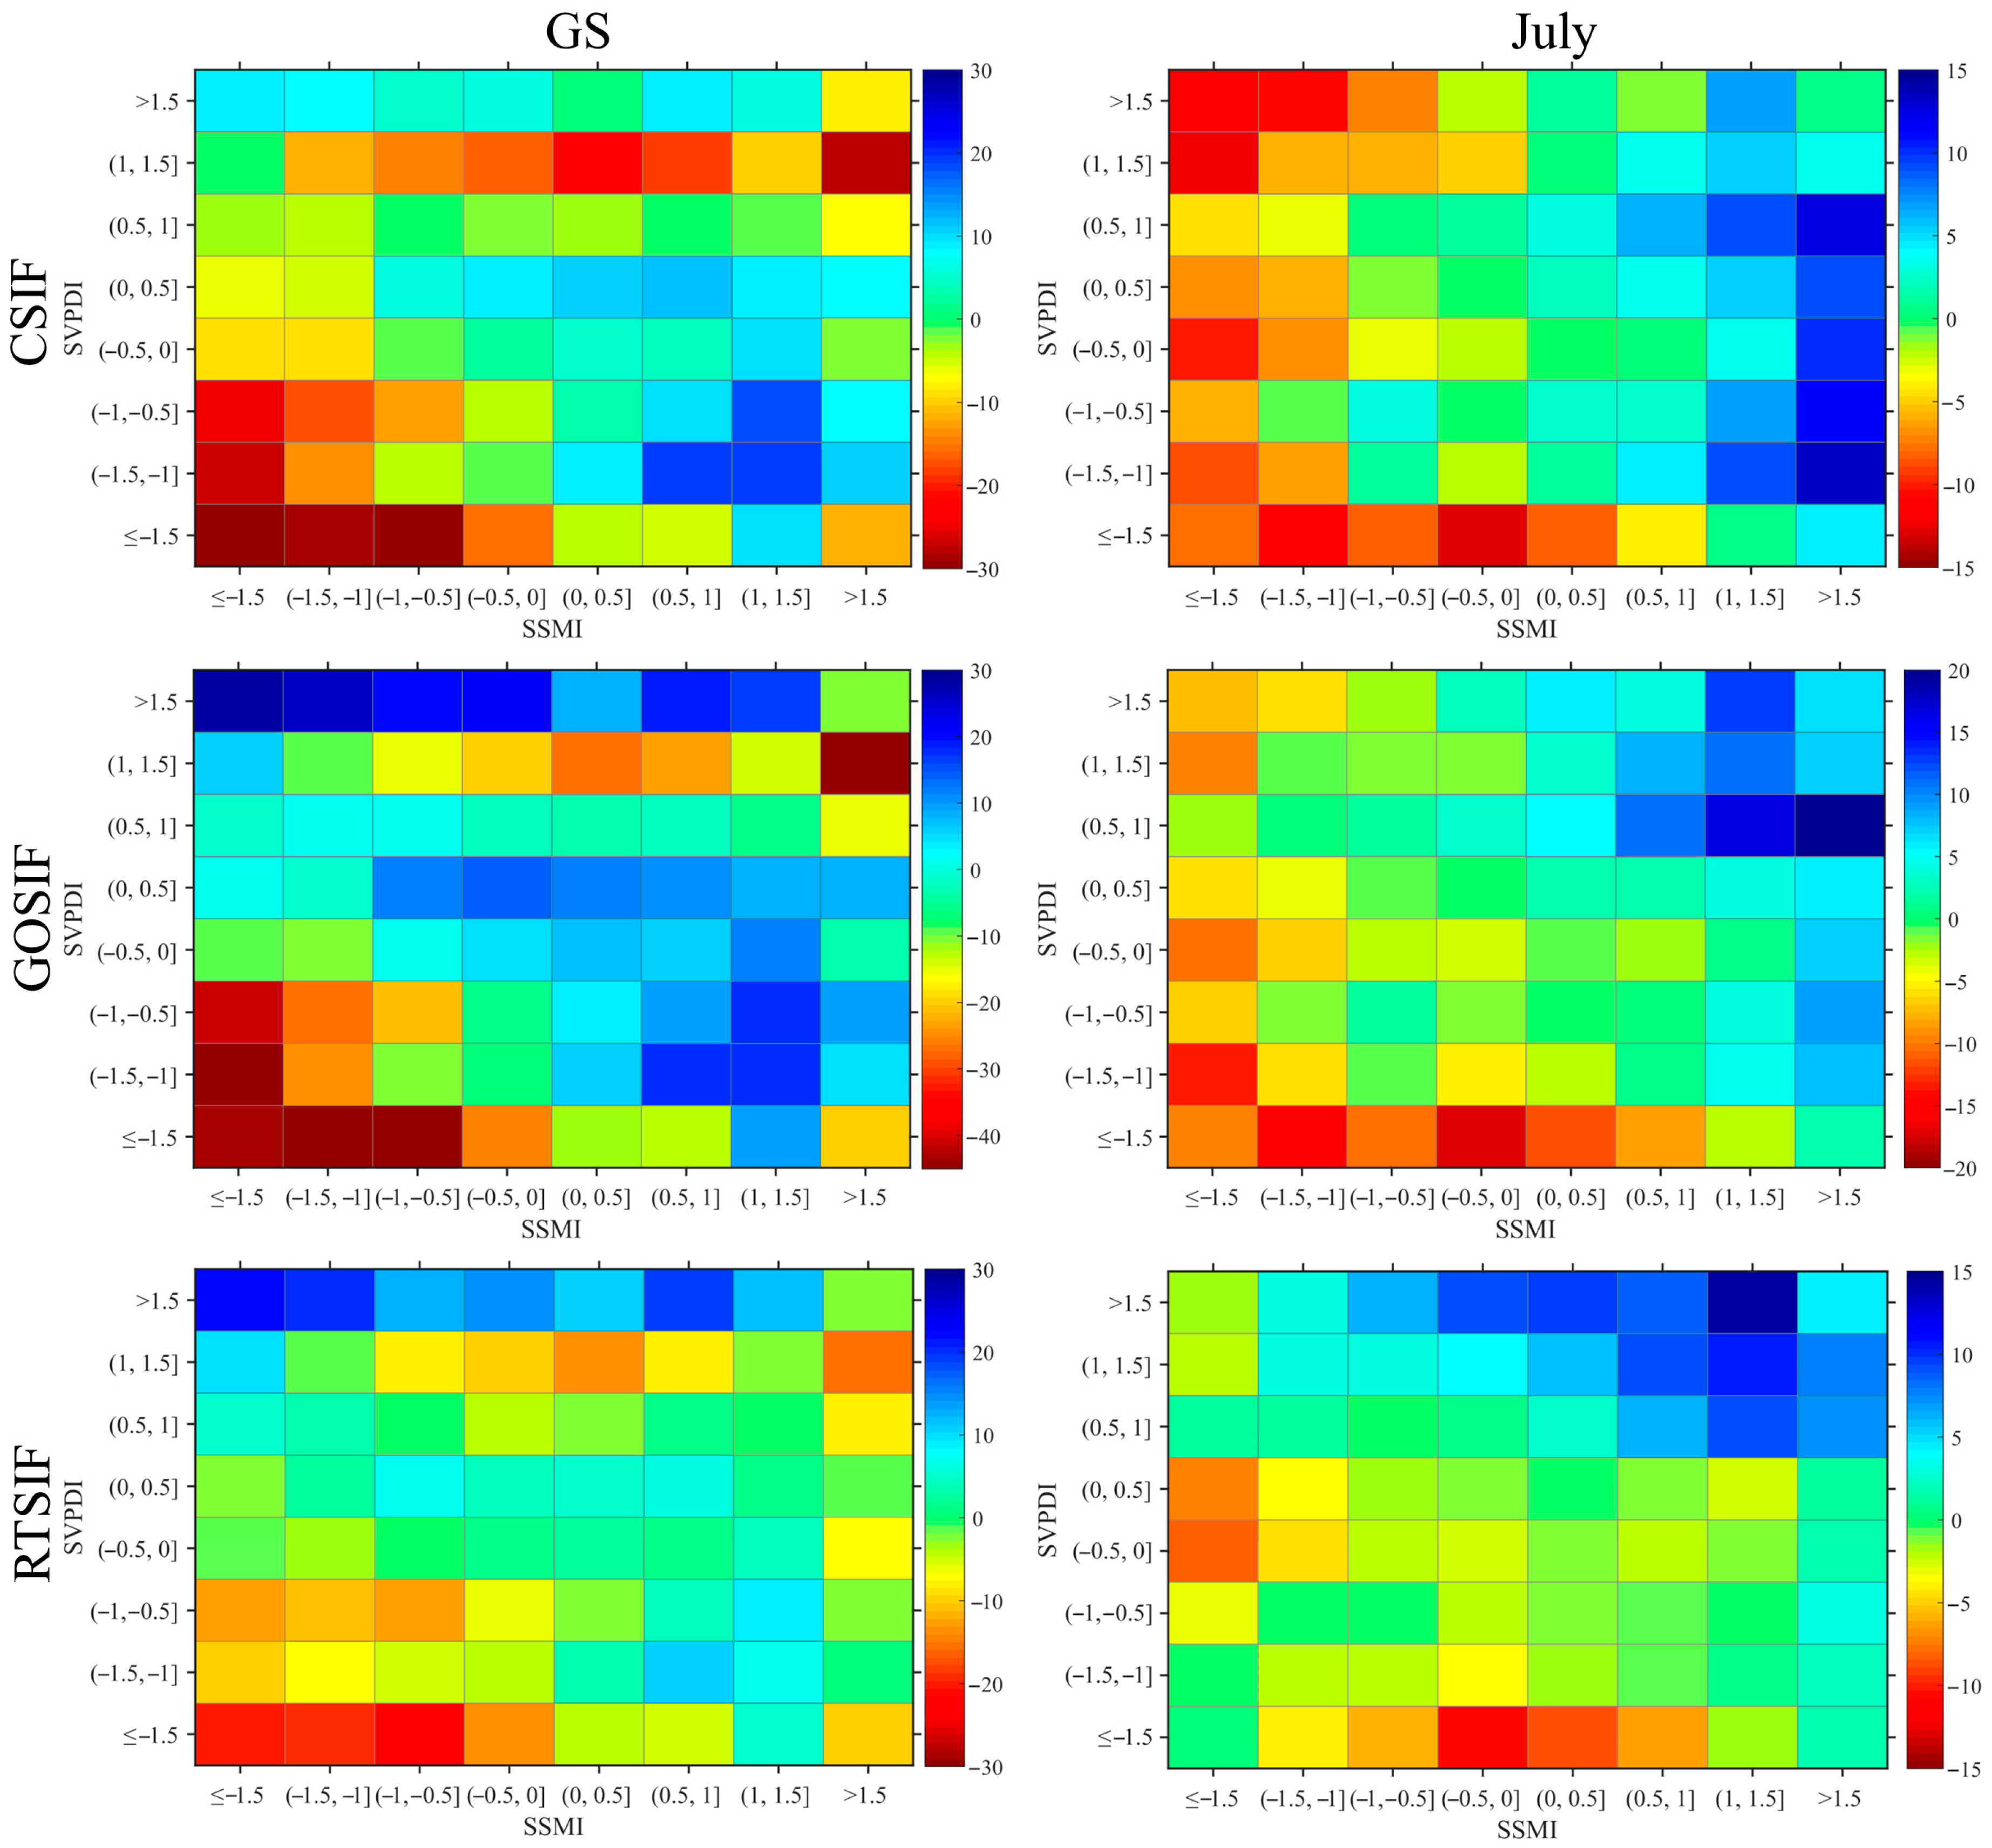
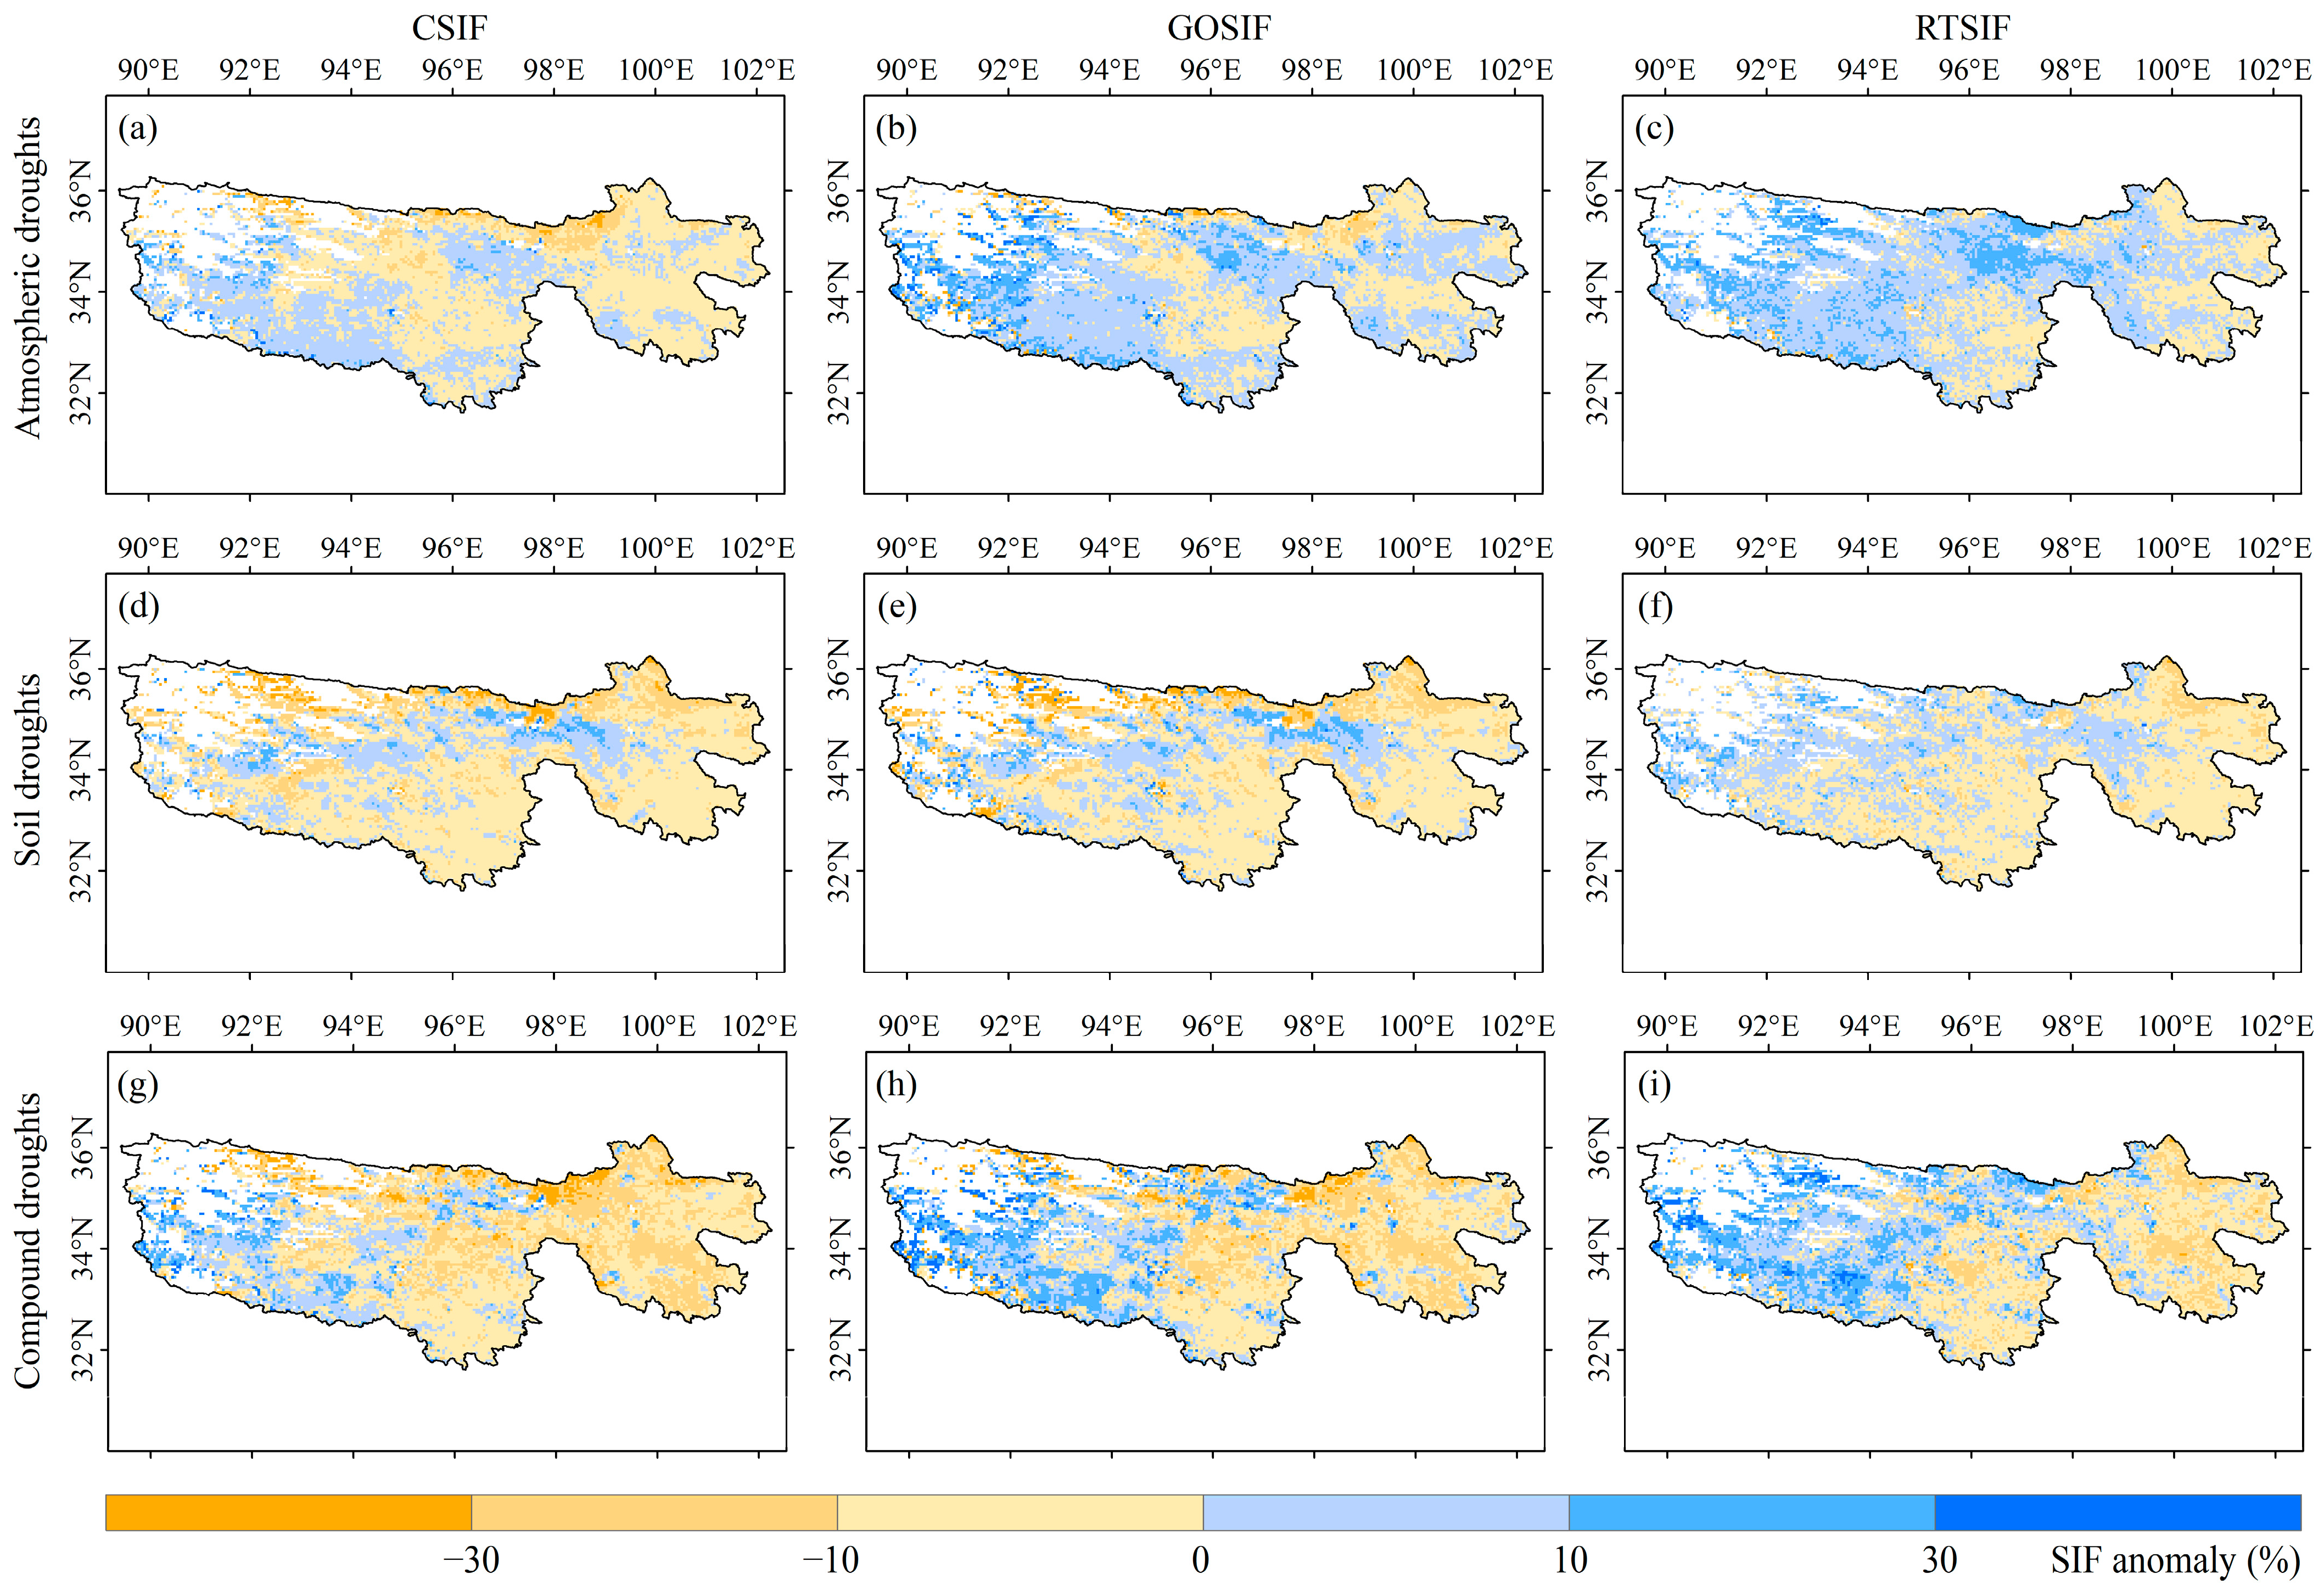
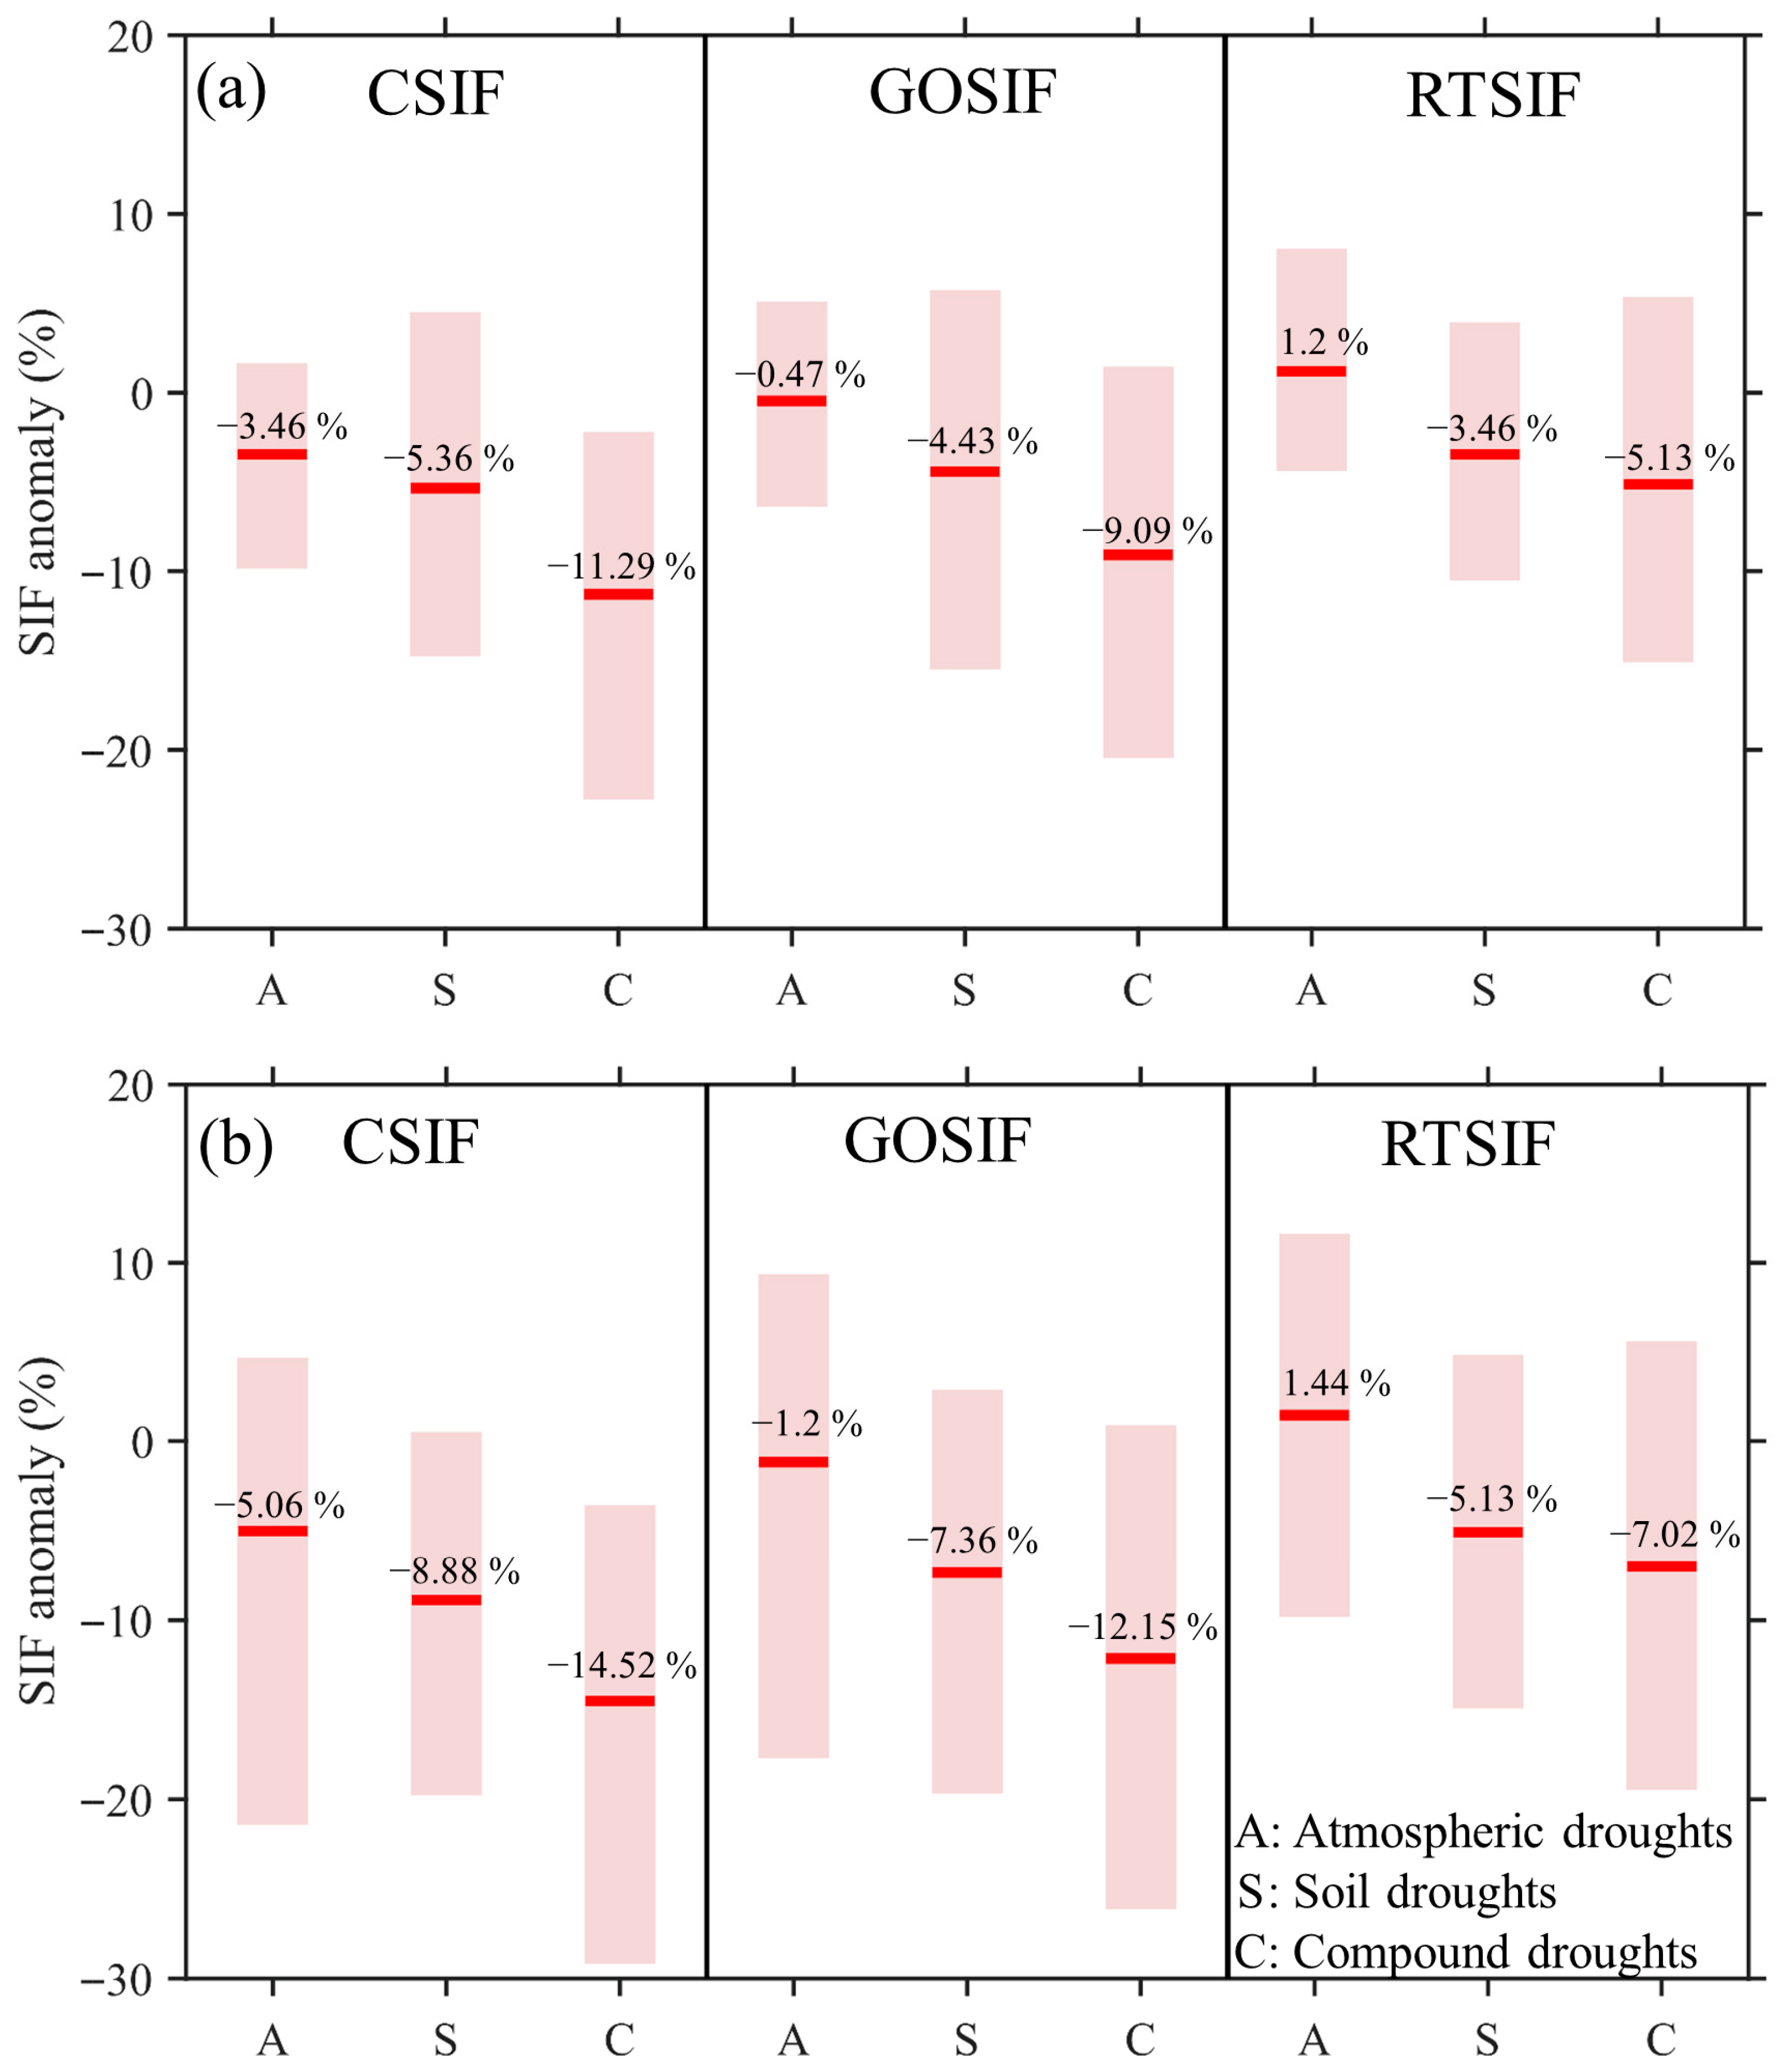
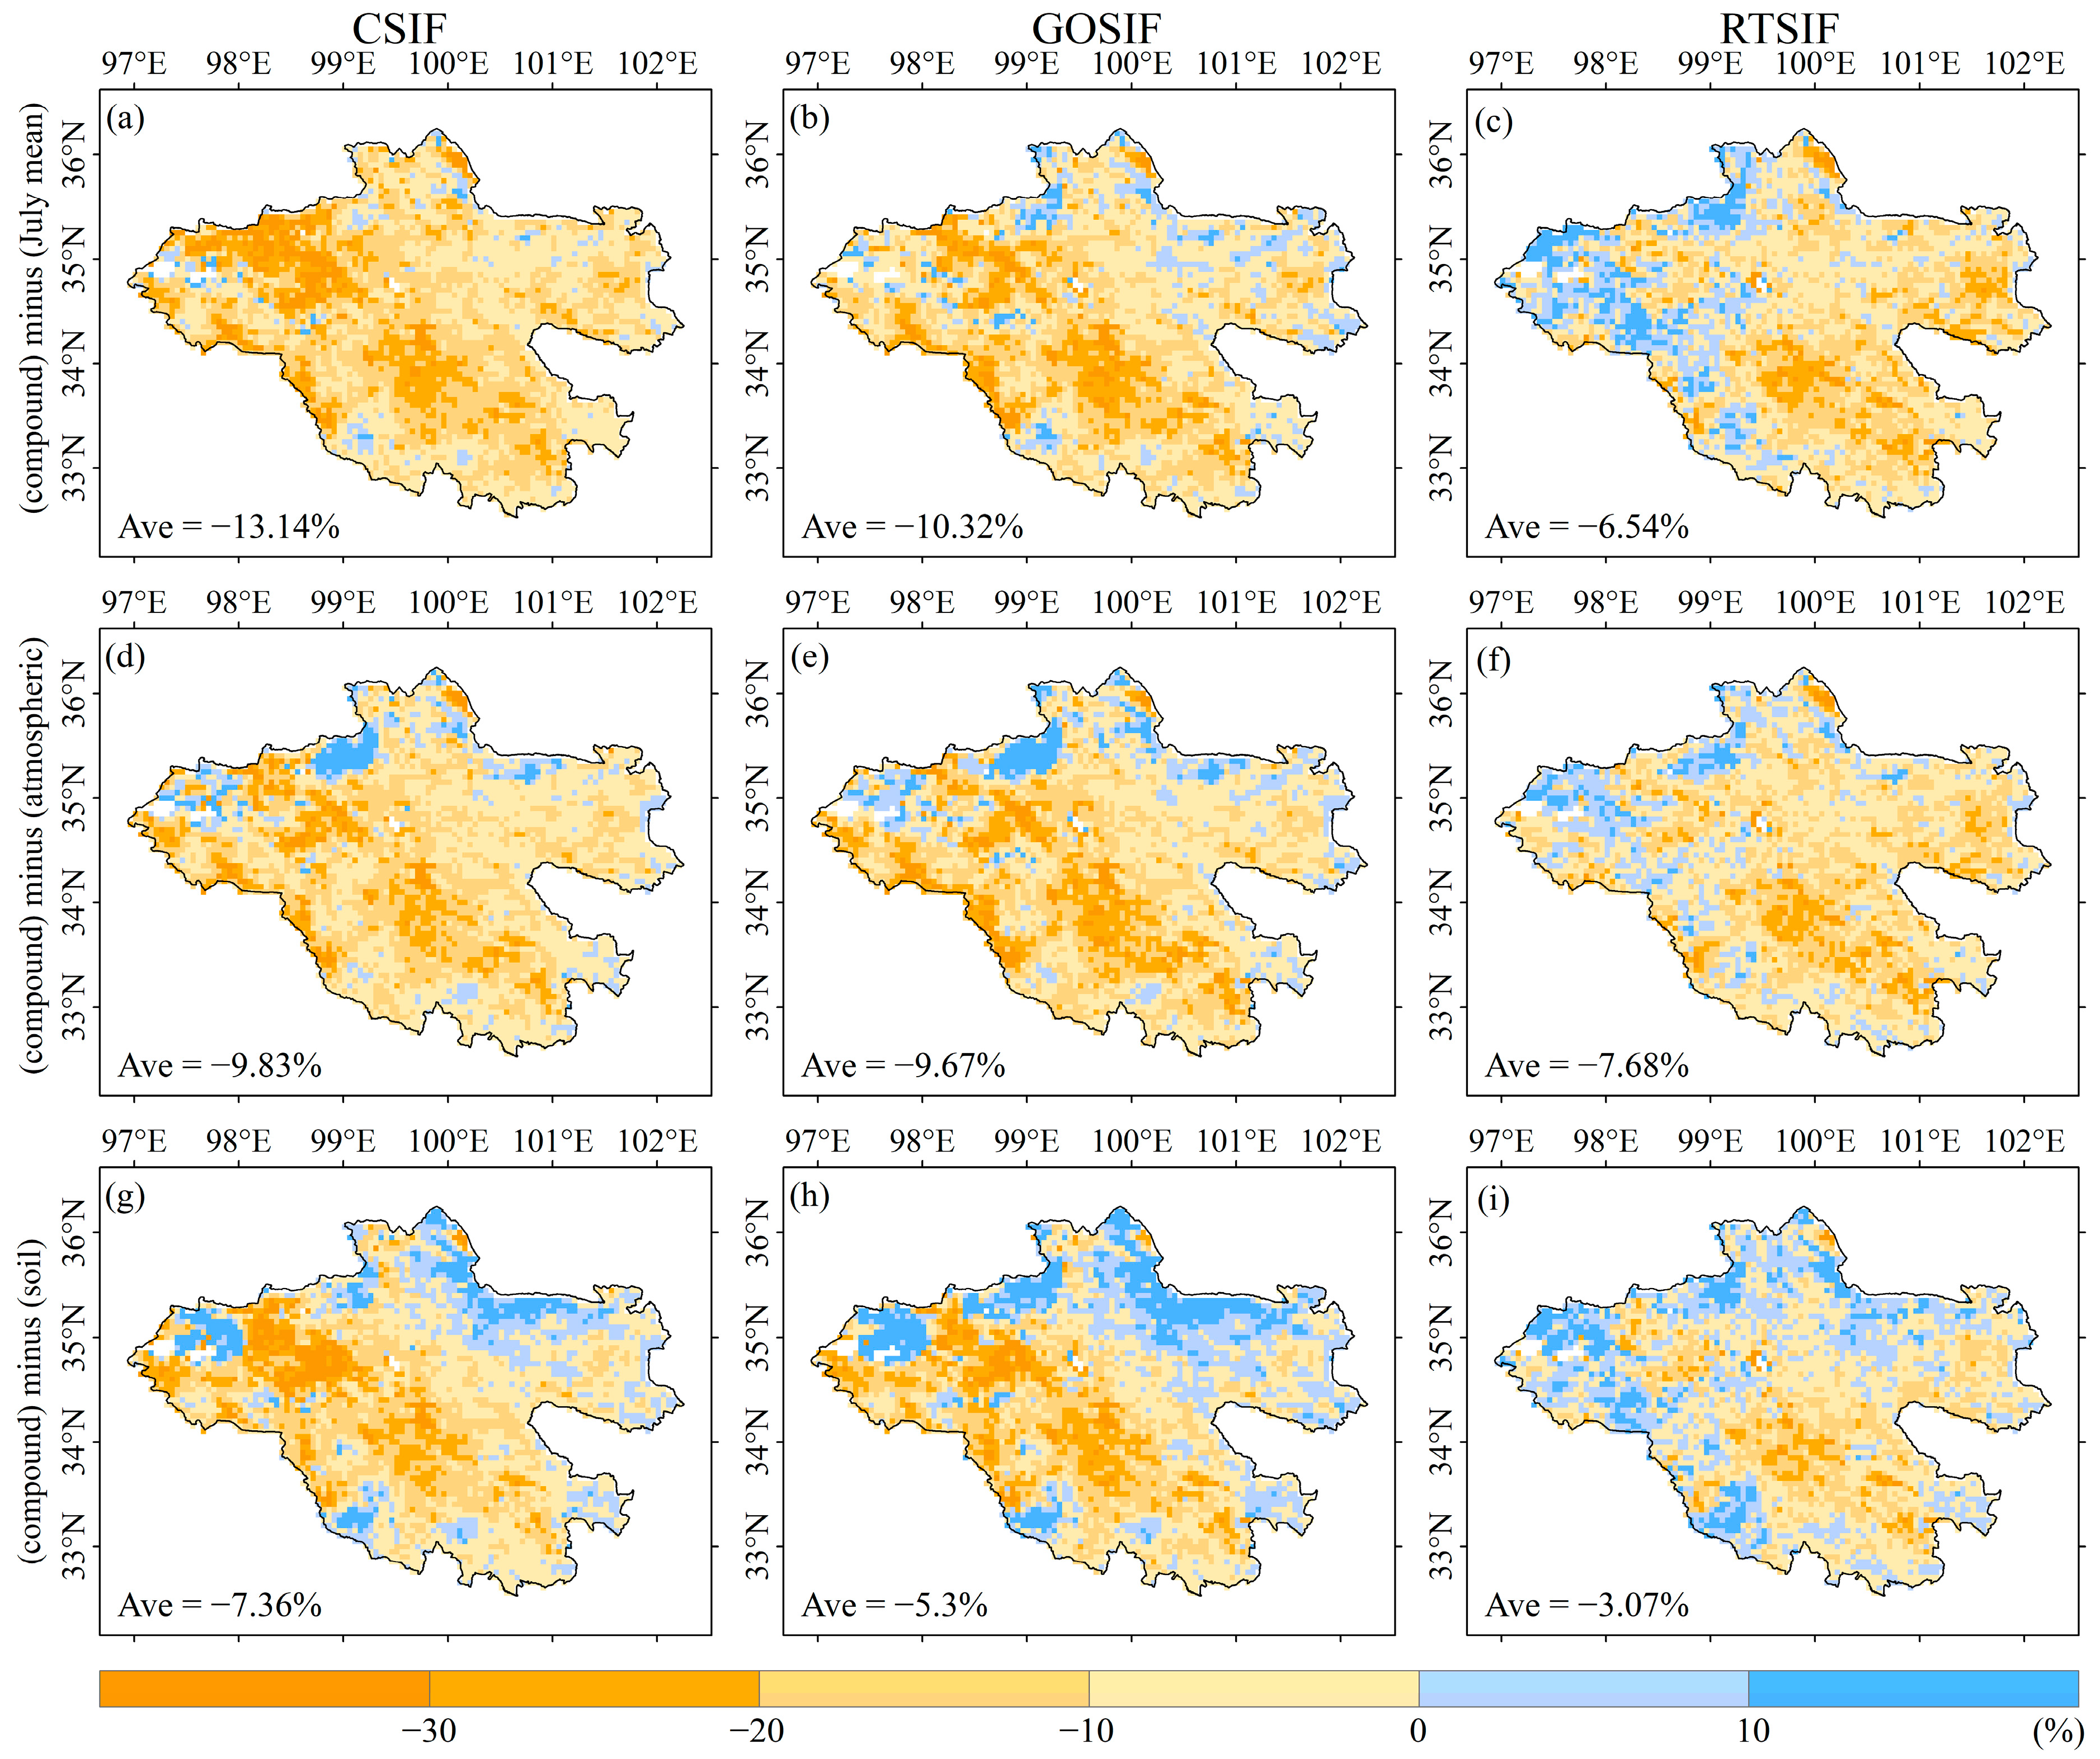
Overall, the high SVPDI and low SSMI in July substantially limited vegetation photosynthesis. According to the drought response characterization of SIF in the Yellow River source region (i.e., the eastern part of the TRHR, where there are better conditions for vegetation growth), compound droughts led to a larger decrease in SIF than individual events. The additional effect of SIF produced by compound droughts was stronger for atmospheric drought than soil drought, suggesting that SM may dominate vegetation growth in the TRHR.

Supplementary Materials

The following supporting information can be downloaded at https://www.mdpi.com/article/10.3390/rs15204943/s1: Figure S1: Monthly average (a) temperature and (b) precipitation during 2001–2020; Figure S2: Spatial characteristics of annual mean (a,b) temperature and (c,d) precipitation during 2001–2020; Figure S3: Correlation coefficients of 1-month SSMI and different cumulative time scales of SVPDI throughout GS. Note: “*”and “**” indicate coefficients passing 0.1 and 0.05 significance levels, respectively; Figure S4: Compound drought magnitude index (CDMI) for July during 2001–2020 in the Yellow River source region. CDMI is expressed as the absolute value of the difference between SVPDI and the atmospheric drought threshold (0.5) in July multiplied by the absolute value of the difference between SSMI and the soil drought threshold (−0.5); Figure S5: Average precipitation versus average SIF at each grid in the TRHR during 2001–2020. Left column represents the GS mean and the right column represents the July mean; Figure S6: The same as Figure S5, but for temperature; Figure S7: The same as Figure S5, but for SM; Figure S8: The same as Figure S5, but for VPD; Figure S9: Box-and-whisker plot of precipitation, temperature, VPD, and SM anomalies during July 2017 compound drought in the Yellow River source area. Top and bottom of the box indicate 75th and 25th percentiles. Red lines and dots indicate median and mean values, respectively.

Author Contributions

Conceptualization, J.M., R.A. and Y.Z.; methodology, J.M. and Y.Z.; software, F.X.; validation, J.M. and Y.Z.; formal analysis, J.M. and R.A; investigation, J.M. and Y.Z; data curation, J.M. and Y.Z.; writing—original draft preparation, J.M. and Y.Z.; writing—review and editing, J.M. and R.A.; visualization, Y.Z. and F.X.; supervision, R.A.; funding acquisition, R.A. All authors have read and agreed to the published version of the manuscript.

Funding

This research was funded by the National Natural Science Foundation of China (41871326).

Data Availability Statement

The data that support our research findings are available from the corresponding author on request.

Acknowledgments

We are very grateful to the anonymous reviewers for their constructive comments and thoughtful suggestions.

Conflicts of Interest

The authors declare no conflict of interest.

References

  1. IPCC. Summary for Policymakers. In Climate Change 2021: The Physical Science Basis. Contribution of Working Group I to the Sixth Assessment Report of the Intergovernmental Panel on Climate Change; Masson-Delmotte, V.P., Zhai, A., Pirani, S.L., Connors, C., Péan, S., Berger, N., Caud, Y., Chen, L., Goldfarb, M.I., Gomis, M., et al., Eds.; Cambridge University Press: Cambridge, UK, 2021. [Google Scholar]
  2. Ji, Y.; Fu, J.; Lu, Y.; Liu, B. Three-dimensional-based global drought projection under global warming tendency. Atmos. Res. 2023, 291, 106812. [Google Scholar] [CrossRef]
  3. Balting, D.F.; AghaKouchak, A.; Lohmann, G.; Ionita, M. Northern Hemisphere drought risk in a warming climate. Npj Clim. Atmos. Sci. 2021, 4, 61. [Google Scholar] [CrossRef]
  4. Piao, S.; Zhang, X.; Chen, A.; Liu, Q.; Lian, X.; Wang, X.; Peng, S.; Wu, X. The impacts of climate extremes on the terrestrial carbon cycle: A review. Sci. China Earth Sci. 2019, 62, 1551–1563. [Google Scholar] [CrossRef]
  5. He, P.; Ma, X.; Sun, Z.; Han, Z.; Ma, S.; Meng, X. Compound drought constrains gross primary productivity in Chinese grasslands. Environ. Res. Lett. 2022, 17, 104054. [Google Scholar] [CrossRef]
  6. Zhou, S.; Zhang, Y.; Williams, A.; Gentine, P. Projected increases in intensity, frequency, and terrestrial carbon costs of compound drought and aridity events. Sci. Adv. 2019, 5, eaau5740. [Google Scholar] [CrossRef]
  7. Williams, A.P.; Allen, C.D.; Millar, C.I.; Swetnam, T.W.; Michaelsen, J.; Still, C.J.; Leavitt, S.W. Forest responses to increasing aridity and warmth in the southwestern United States. Proc. Natl. Acad. Sci. USA 2010, 107, 21289–21294. [Google Scholar] [CrossRef]
  8. Liu, L.; Gudmundsson, L.; Hauser, M.; Qin, D.; Li, S.; Seneviratne, S.I. Soil moisture dominates dryness stress on ecosystem production globally. Nat. Commun. 2020, 11, 4892. [Google Scholar] [CrossRef]
  9. Ding, J.; Yang, T.; Zhao, Y.; Liu, D.; Wang, X.; Yao, Y.; Peng, S.; Piao, S. Increasingly Important Role of Atmospheric Aridity on Tibetan Alpine Grasslands. Geophys. Res. Lett. 2018, 45, 2852–2859. [Google Scholar] [CrossRef]
  10. Frank, A.B.; Dugas, W.A. Carbon dioxide fluxes over a northern, semiarid, mixed-grass prairie. Agric. For. Meteorol. 2001, 108, 317–326. [Google Scholar] [CrossRef]
  11. Wei, X.; He, W.; Zhou, Y.; Ju, W.; Xiao, J.; Li, X.; Liu, Y.; Xu, S.; Bi, W.; Zhang, X.; et al. Global assessment of lagged and cumulative effects of drought on grassland gross primary production. Ecol. Indic. 2022, 136, 108646. [Google Scholar] [CrossRef]
  12. Sippel, S.; Reichstein, M.; Ma, X.; Mahecha, M.D.; Lange, H.; Flach, M.; Frank, D. Drought, Heat, and the Carbon Cycle: A Review. Curr. Clim. Chang. Rep. 2018, 4, 266–286. [Google Scholar] [CrossRef]
  13. Zhang, Y.; Hong, S.; Liu, D.; Piao, S. Susceptibility of vegetation low-growth to climate extremes on Tibetan Plateau. Agric. For. Meteorol. 2023, 331, 109323. [Google Scholar] [CrossRef]
  14. Wang, Y.; Yuan, X. Anthropogenic Speeding Up of South China Flash Droughts as Exemplified by the 2019 Summer-Autumn Transition Season. Geophys. Res. Lett. 2021, 48, e2020GL091901. [Google Scholar] [CrossRef]
  15. Zscheischler, J.; Martius, O.; Westra, S.; Bevacqua, E.; Raymond, C.; Horton, R.M.; van den Hurk, B.; AghaKouchak, A.; Jézéquel, A.; Mahecha, M.D.; et al. A typology of compound weather and climate events. Nat. Rev. Earth Environ. 2020, 1, 333–347. [Google Scholar] [CrossRef]
  16. Chen, H.; Wang, S.; Zhu, J.; Zhang, B. Projected Changes in Abrupt Shifts Between Dry and Wet Extremes Over China Through an Ensemble of Regional Climate Model Simulations. J. Geophys. Res. Atmos. 2020, 125, e2020JD033894. [Google Scholar] [CrossRef]
  17. He, P.; Han, Z.; He, M.; Meng, X.; Ma, X.; Liu, H.; Dong, T.; Shi, M.; Sun, Z. Atmospheric dryness thresholds of grassland productivity decline in China. J. Environ. Manag. 2023, 338, 117780. [Google Scholar] [CrossRef] [PubMed]
  18. Chen, S.; Huang, Y.; Wang, G. Detecting drought-induced GPP spatiotemporal variabilities with sun-induced chlorophyll fluorescence during the 2009/2010 droughts in China. Ecol. Indic. 2021, 121, 107092. [Google Scholar] [CrossRef]
  19. Zhang, T.; Zhou, J.; Yu, P.; Li, J.; Kang, Y.; Zhang, B. Response of Ecosystem Gross Primary Productivity to Drought in Northern China Based on Multi-source Remote Sensing Data. J. Hydrol. 2023, 616, 128808. [Google Scholar] [CrossRef]
  20. Zhang, X.; Jin, X. Vegetation dynamics and responses to climate change and anthropogenic activities in the Three-River Headwaters Region, China. Ecol. Indic. 2021, 131, 108223. [Google Scholar] [CrossRef]
  21. Zhang, G.; He, Y.; Huang, J.; Fu, L.; Han, D.; Guan, X.; Zhang, B. Divergent sensitivity of vegetation to aridity between drylands and humid regions. Sci. Total Environ. 2023, 884, 163910. [Google Scholar] [CrossRef]
  22. Gitelson, A.; Viña, A.; Inoue, Y.; Arkebauer, T.; Schlemmer, M.; Schepers, J. Uncertainty in the evaluation of photosynthetic canopy traits using the green leaf area index. Agric. For. Meteorol. 2022, 320, 108955. [Google Scholar] [CrossRef]
  23. Deng, Y.; Wang, X.; Wang, K.; Ciais, P.; Tang, S.; Jin, L.; Li, L.; Piao, S. Responses of vegetation greenness and carbon cycle to extreme droughts in China. Agric. For. Meteorol. 2021, 298–299, 108307. [Google Scholar] [CrossRef]
  24. Mohammed, G.H.; Colombo, R.; Middleton, E.M.; Rascher, U.; van der Tol, C.; Nedbal, L.; Goulas, Y.; Pérez-Priego, O.; Damm, A.; Meroni, M.; et al. Remote sensing of solar-induced chlorophyll fluorescence (SIF) in vegetation: 50 years of progress. Remote Sens. Environ. 2019, 231, 111177. [Google Scholar] [CrossRef] [PubMed]
  25. Geng, G.; Yang, R.; Liu, L. Downscaled solar-induced chlorophyll fluorescence has great potential for monitoring the response of vegetation to drought in the Yellow River Basin, China: Insights from an extreme event. Ecol. Indic. 2022, 138, 108801. [Google Scholar] [CrossRef]
  26. Cheng, Y.; Liu, L.; Cheng, L.; Fa, K.; Liu, X.; Huo, Z.; Huang, G. A shift in the dominant role of atmospheric vapor pressure deficit and soil moisture on vegetation greening in China. J. Hydrol. 2023, 615, 128680. [Google Scholar] [CrossRef]
  27. Vicente-Serrano, S.M.; Beguería, S.; Lópezmoreno, J.I. A Multiscalar Drought Index Sensitive to Global Warming: The Standardized Precipitation Evapotranspiration Index. J. Clim. 2010, 23, 1696–1718. [Google Scholar] [CrossRef]
  28. Zhao, A.; Dongli, W.; Xiang, K.; Zhang, A. Vegetation photosynthesis changes and response to water constraints in the Yangtze River and Yellow River Basin, China. Ecol. Indic. 2022, 143, 109331. [Google Scholar] [CrossRef]
  29. Bai, Y.; Guo, C.; Degen, A.A.; Ahmad, A.A.; Wang, W.; Zhang, T.; Li, W.; Ma, L.; Huang, M.; Zeng, H.; et al. Climate warming benefits alpine vegetation growth in Three-River Headwater Region, China. Sci. Total Environ. 2020, 742, 140574. [Google Scholar] [CrossRef]
  30. Yang, J.; Huang, X. The 30 m annual land cover dataset and its dynamics in China from 1990 to 2019. Earth Syst. Sci. Data 2021, 13, 3907–3925. [Google Scholar] [CrossRef]
  31. Li, Q.; Shi, G.; Shangguan, W.; Nourani, V.; Li, J.; Li, L.; Huang, F.; Zhang, Y.; Wang, C.; Wang, D.; et al. A 1 km daily soil moisture dataset over China using in situ measurement and machine learning. Earth Syst. Sci. Data 2022, 14, 5267–5286. [Google Scholar] [CrossRef]
  32. Zhang, Y.; Joiner, J.; Alemohammad, S.H.; Zhou, S.; Gentine, P. A global spatially contiguous solar-induced fluorescence (CSIF) dataset using neural networks. Biogeosciences 2018, 15, 5779–5800. [Google Scholar] [CrossRef]
  33. Li, X.; Xiao, J. A Global, 0.05-Degree Product of Solar-Induced Chlorophyll Fluorescence Derived from OCO-2, MODIS, and Reanalysis Data. Remote Sens. 2019, 11, 517. [Google Scholar] [CrossRef]
  34. Chen, X.; Huang, Y.; Nie, C.; Zhang, S.; Wang, G.; Chen, S.; Chen, Z. A long-term reconstructed TROPOMI solar-induced fluorescence dataset using machine learning algorithms. Sci. Data 2022, 9, 427. [Google Scholar] [CrossRef] [PubMed]
  35. Allen, R.G.; Pereira, L.S.; Raes, D.; Smith, M. Crop evapotranspiration. Guidelines for computing crop water requirements. In Fao Irrigation & Drainage Paper; FAO: Rome, Italy, 1998; Volume 56. [Google Scholar]
  36. McKee, T.; Doesken, N.; Kleist, J. The relationship of drought frequency and duration to time scales. In Proceedings of the 8th Conference on Applied Climatology, Anaheim, CA, USA, 17–22 January 1993; pp. 179–184. [Google Scholar]
  37. Zhang, Y.; You, Q.; Lin, H.; Chen, C. Analysis of dry/wet conditions in the Gan River Basin, China, and their association with large-scale atmospheric circulation. Glob. Planet. Chang. 2015, 133, 309–317. [Google Scholar] [CrossRef]
  38. Liu, C.; Yang, C.; Yang, Q.; Wang, J. Spatiotemporal drought analysis by the standardized precipitation index (SPI) and standardized precipitation evapotranspiration index (SPEI) in Sichuan Province, China. Sci. Rep. 2021, 11, 1280. [Google Scholar] [CrossRef] [PubMed]
  39. Um, M.-J.; Kim, Y.; Jung, K.; Lee, M.; An, H.; Min, I.; Kwak, J.; Park, D. Evaluation of drought propagations with multiple indices in the Yangtze River basin. J. Environ. Manag. 2022, 317, 115494. [Google Scholar] [CrossRef]
  40. Drake, J.; Varhammar, A.; Kumarathunge, D.; Medlyn, B.; Pfautsch, S.; Reich, P.; Tissue, D.; Ghannoum, O.; Tjoelker, M. A common thermal niche among geographically diverse populations of the widely distributed tree species Eucalyptus tereticornis: No evidence for adaptation to climate-of-origin. Glob. Chang. Biol. 2017, 23, 5069–5082. [Google Scholar] [CrossRef]
  41. Novick, K.; Ficklin, D.; Stoy, P.; Williams, C.; Bohrer, G.; Oishi, A.; Papuga, S.; Blanken, P.; Noormets, A.; Sulman, B.; et al. The increasing importance of atmospheric demand for ecosystem water and carbon fluxes. Nat. Clim. Chang. 2016, 6, 1023–1027. [Google Scholar] [CrossRef]
  42. Li, Y.; Hou, Z.; Zhang, L.; Song, C.; Piao, S.; Lin, J.; Peng, S.; Fang, K.; Yang, J.; Qu, Y.; et al. Rapid expansion of wetlands on the Central Tibetan Plateau by global warming and El Niño. Sci. Bull. 2023, 68, 485–488. [Google Scholar] [CrossRef]
  43. Ma, Y.; Wang, B.; Chen, X.; Zhong, L.; Hu, Z.; Ma, W.; Han, C.; Li, M. Strengthening the three-dimensional comprehensive observation system of multi-layer interaction on the Tibetan Plateau to cope with the warming and wetting trend. Atmos. Ocean. Sci. Lett. 2022, 15, 100224. [Google Scholar] [CrossRef]
  44. Will, R.E.; Wilson, S.M.; Zou, C.B.; Hennessey, T.C. Increased vapor pressure deficit due to higher temperature leads to greater transpiration and faster mortality during drought for tree seedlings common to the forest–grassland ecotone. New Phytol. 2013, 200, 366–374. [Google Scholar] [CrossRef] [PubMed]
  45. Wu, D.; Hu, Z. Increasing compound drought and hot event over the Tibetan Plateau and its effects on soil water. Ecol. Indic. 2023, 153, 110413. [Google Scholar] [CrossRef]
  46. Mohammadi, K.; Jiang, Y.; Wang, G. Flash drought early warning based on the trajectory of solar-induced chlorophyll fluorescence. Proc. Natl. Acad. Sci. USA 2022, 119, e2202767119. [Google Scholar] [CrossRef] [PubMed]
  47. Song, Y.; Liang, T.; Zhang, L.; Hao, C.; Wang, H. Spatio-Temporal Changes and Contribution of Human and Meteorological Factors to Grassland Net Primary Productivity in the Three-Rivers Headwater Region from 2000 to 2019. Atmosphere 2023, 14, 278. [Google Scholar] [CrossRef]
  48. Wang, Z.; Niu, B.; He, Y.; Zhang, J.; Wu, J.; Wang, X.; Zhang, Y.; Zhang, X. Weakening summer westerly circulation actuates greening of the Tibetan Plateau. Glob. Planet. Chang. 2023, 221, 104027. [Google Scholar] [CrossRef]
  49. Karthikeyan, L.; Mishra, A.K. Multi-layer high-resolution soil moisture estimation using machine learning over the United States. Remote Sens. Environ. 2021, 266, 112706. [Google Scholar] [CrossRef]
  50. Gruber, A.; Su, C.H.; Zwieback, S.; Crow, W.; Dorigo, W.; Wagner, W. Recent advances in (soil moisture) triple collocation analysis. Int. J. Appl. Earth Obs. Geoinf. 2016, 45, 200–211. [Google Scholar] [CrossRef]
  51. Deng, Y.; Wu, D.; Wang, X.; Xie, Z. Responding time scales of vegetation production to extreme droughts over China. Ecol. Indic. 2022, 136, 108630. [Google Scholar] [CrossRef]
  52. Wu, J.; Yao, H.; Chen, X.; Wang, G.; Bai, X.; Zhang, D. A framework for assessing compound drought events from a drought propagation perspective. J. Hydrol. 2022, 604, 127228. [Google Scholar] [CrossRef]
  53. He, L.; Xie, Y.; Wang, J.; Zhang, J.; Si, M.; Guo, Z.; Ma, C.; Bie, Q.; Li, Z.-L.; Ye, J.-S. Precipitation regimes primarily drive the carbon uptake in the Tibetan Plateau. Ecol. Indic. 2023, 154, 110694. [Google Scholar] [CrossRef]
  54. Li, X.; Guo, W.; Chen, J.; Ni, X.; Wei, X. Responses of vegetation green-up date to temperature variation in alpine grassland on the Tibetan Plateau. Ecol. Indic. 2019, 104, 390–397. [Google Scholar] [CrossRef]
  55. Zhang, T.; Tang, Y.; Xu, M.; Zhao, G.; Cong, N.; Zheng, Z.; Zhu, J.; Niu, B.; Chen, Z.; Zhang, Y.; et al. Soil moisture dominates the interannual variability in alpine ecosystem productivity by regulating maximum photosynthetic capacity across the Qinghai-Tibetan Plateau. Glob. Planet. Chang. 2023, 228, 104191. [Google Scholar] [CrossRef]
  56. Yu, T.; Jiapaer, G.; Long, G.; Li, X.; Jing, J.; Liu, Y.; De Maeyer, P.; Van de Voorde, T. Interannual and seasonal relationships between photosynthesis and summer soil moisture in the Ili River basin, Xinjiang, 2000–2018. Sci. Total Environ. 2023, 856, 159191. [Google Scholar] [CrossRef] [PubMed]
Figure 1. (a) Location of TRHR, (b) 2001 land cover, (c) 2020 land cover.
Remotesensing 15 04943 g001
Figure 2. Flowchart illustrating the methodologies utilized in this study.
Remotesensing 15 04943 g002
Figure 3. (a) Annual and (b) GS changes in SVPDI and SSMI in the TRHR during 2001–2020. The blue and red solid lines indicate the changes in SVPDI and SSMI, respectively.
Remotesensing 15 04943 g003
Figure 4. Spatial distribution of (a,b) annual and (c,d) GS SVPDI trends in the TRHR during 2001–2020. Spatial distribution of (e,f) annual and (g,h) GS SSMI trends in the TRHR during 2001–2020. The statistical significance was identified at p < 0.05.
Remotesensing 15 04943 g004
Figure 5. Spatial duration (months/year) patterns of (a,b) atmospheric, (c,d) soil, and (e,f) compound droughts during 2001–2020. Left column indicates annual timescale and right column indicates GS timescale.
Remotesensing 15 04943 g005
Figure 6. Annual and GS duration (months/year) of (a) atmospheric, (b) soil, (c) compound droughts during 2001–2020. Solid blue and red lines indicate drought changes on the annual and GS timescales, respectively.
Remotesensing 15 04943 g006
Figure 7. Spatial distribution of mean (a) CSIF, (b) GOSIF, and (c) RTSIF during GS from 2001 to 2020. Relationships between GPP and (d) CSIF, (e) GOSIF, and (f) RTSIF at annual GS timescale.
Remotesensing 15 04943 g007
Figure 8. Annual GS changes in CSIF, GOSIF, RTSIF, and GOSIF GPP anomalies in the TRHR during 2001–2020.
Remotesensing 15 04943 g008
Figure 9. Spatial GS trends of (a,b) CSIF, (c,d) GOSIF, and (e,f) RTSIF in the TRHR during 2001–2020. Trend significance identified at p < 0.05.
Remotesensing 15 04943 g009
Figure 10. Anomalies of air mean temperature and precipitation, (a) annual and (b) GS, across TRHR grasslands during 2001–2020. Red dotted lines and blue dotted lines indicate temperature and precipitation trends, respectively.
Remotesensing 15 04943 g010
Figure 11. Mean SIF anomalies for each index bin of SVPDI and SSMI across TRHR grasslands during 2001–2020. Rows represent changes in SIFs (CSIF, GOSIF, and RTSIF); columns represent changes in study periods (GS and July).
Remotesensing 15 04943 g011
Figure 12. July SIF anomalies under atmospheric and soil droughts in the TRHR during 2001 to 2020. (a) CSIF, (b) GOSIF, and (c) RTSIF in response to atmospheric droughts. (d) CSIF, (e) GOSIF, and (f) RTSIF in response to soil droughts. (g) CSIF, (h) GOSIF, and (i) RTSIF in response to compound droughts.
Remotesensing 15 04943 g012
Figure 13. Anomalies of July SIF triggered by atmospheric and soil droughts in the Yellow River source region during 2001 to 2020. (a) Threshold criterion for atmospheric drought is SVPDI ≥ 0.5; for soil drought, it is SSMI ≤ −0.5; and for compound drought, it satisfies both SVPDI ≥ 0.5 and SSMI ≤ −0.5. (b) Threshold criterion for atmospheric drought is SVPDI ≥ 1; for soil drought, it is SSMI ≤ −1; and for compound drought, it satisfies both SVPDI ≥ 1 and SSMI ≤ −1. Light-red box indicates the 10th–90th range, and red line marks the mean SIF anomaly.
Remotesensing 15 04943 g013
Figure 14. (ac) SIF anomalies of the Yellow River source region in July 2017 caused by compound drought (SVPDI ≥ 0.5 and SSMI ≤ −0.5). (df) Additional effects of compound drought compared to atmospheric drought (SVPDI ≥ 0.5) causing a decrease in SIF. (gi) Additional effects of compound drought compared to soil drought (SSMI ≤ −0.5) causing decrease in SIF. The additional effect of compound drought was calculated as the difference in SIF anomalies between the July 2017 compound drought and the multi-year average (2001–2020) July atmospheric drought (or soil drought) alone.
Remotesensing 15 04943 g014
Table 1. Wet and dry (drought) categories according to SVADI/SSMI values.
SVPDI ValueSSMI ValueCategory
(−∞, −1.5][1.5, +∞)Severely wet
(−1.5, −1.0][1.0, 1.5)Moderately wet
(−1.0, −0.5][0.5, 1.0)Slightly wet
(−0.5, 0.5)(−0.5, 0.5)Normal
[0.5, 1.0)(−1.0, −0.5]Mild drought
[1.0, 1.5)(−1.5, −1.0]Moderate drought
[1.5, +∞)(−∞, −1.5]Severe drought
Disclaimer/Publisher’s Note: The statements, opinions and data contained in all publications are solely those of the individual author(s) and contributor(s) and not of MDPI and/or the editor(s). MDPI and/or the editor(s) disclaim responsibility for any injury to people or property resulting from any ideas, methods, instructions or products referred to in the content.

