Abstract
Coastal upwelling regions are one of the most dynamic areas of the world’s oceans. The California and Baja California Coasts are impacted by both coastal upwelling and the California Current, leading to frontal activity that is captured by gradients in both Sea Surface Temperature (SST) and Sea Surface Salinity (SSS). Satellite data are a great source of spatial data to study fronts. However, biases near coastal areas and coarse resolutions can impair its usefulness in upwelling areas. In this work gradients in SST from NASA Multi-Scale Ultra-High Resolution (MUR) and in two SSS products derived from the Soil Moisture Active Passive (SMAP) NASA mission are compared directly with gradients derived from the Saildrone uncrewed vehicles to validate the gradients as well as to assess their ability to detect known frontal features. The three remotely sensed data sets (MURSST/JPL, SMAP SSS/RSS, SMAP SSS) were co-located with the Saildrone data prior to the calculation of the gradients. Wavelet analysis is used to determine how well the satellite derived SST and SSS products are reproducing the Saildrone derived gradients. Overall results indicate the remote sensing products are reproducing features of known areas of coastal upwelling. Differences between the SST and SSS gradients are mainly associated with the limitations of the microwave derived SSS coverage near land and its reduced spatial resolution. The results are promising for using remote sensing data sets to monitor frontal structure along the California Coast and the application to long term changes in coastal upwelling and dynamics.
1. Introduction
The California coast is embedded in one of the world’s oceans major Eastern Boundary Currents [1], where multiple factors can impact the temperature and salinity signal along the California Coast. In addition to a cool and slightly salty equatorward current, coastal upwelling, driven by strong alongshore equatorward winds during spring and summer, brings cool, salty, and nutrient-rich deep water to the surface, fueling a productive marine ecosystem. This upwelled water is then transported offshore by plumes, eddies, and other mesoscale and sub-mesoscale activity. Huyer [2] determined that upwelling along the California coast was confined to 10 to 25 km from the coast. Based on the wind stress curl they determined maxima in the vertical velocity associated with upwelling occurred at 33°N and 39°N. Although confined to 25 km from the coast, Messié et al. [3] determined the influence of the upwelling could be much further, its associated features and influence could extend up to ~150 km from the coast, as the upwelling cell may move offshore with continuing winds. At the edges of these features, fronts are found-seen as strong gradients on ocean characteristics and convergence of surface flows, which result in high concentrations of primary biological productivity [4], and attracting marine life of all trophic levels [5]. Satellite sea surface temperature (SST) and chlorophyll concentration (Chlo) fronts have been widely studied given their importance to the marine ecosystem but also due to the availability and resolution of remote sensing data [6]. Studies have also compared in-situ data directly with fronts derived from remote sensing [7].
While less studied, fronts in sea surface salinity (SSS), along with SST, can lead to gradients (both vertical and horizontal) that impact vertical mixing, as they contribute to the density (vertical heat flux) and the buoyancy flux in the ocean. In the Central California Coast, Mauzole et al. [8] found that density gradients and frontal structures are associated with coastal upwelling, in an analysis based on satellite SST and surface height. In a further comparison with a numerical simulation from the high-resolution MIT General Ocean Circulation Model LLC4320 [9,10], Mauzole et al. [8] found that density gradients were also associated with stronger vertical velocities along the Central California coast. Thus, temperature and salinity gradients play a major factor in analyzing fronts and their contribution to vertical motions associated with upwelling.
The above studies highlight the importance of using satellite derived surface data to study surface fronts/gradients, and the importance of the application of both SST and SSS gradients for understanding coastal dynamics. Due to issues such as limited availability and low resolution, along with land contamination near the coast, SSS products are not widely used to study upwelling areas, but density gradients have the potential to remove some of these issues by removing biases. This is a major motivating factor for this work and assessing both the SST and SSS fronts. However, from a remote sensing perspective, both SST and SSS fronts need validation in Eastern Boundary Current areas for both improving their applications, but also to improve future products.
The overall goals of the work were to:
- (1)
- Compare gradients of SST and SSS derived from satellites with measurements from the Saildrone uncrewed vehicle. Derive standard statistics summarizing the differences. This will be a follow on to results found from [11] that also compared SST and SSS gradients from satellite derived products with those derived from the Saildrone uncrewed vehicle. This will be explained further in Section 2.3. Briefly the work here will take things a step further by using a wavelet analysis approach to identify the spatial scales of the gradients and the consistency with historical results that identify fronts along the California Coast.
- (2)
- Use wavelet analysis to identify possible frontal structures, including upwelling, associated with the gradients of both SST and SSS.
- (3)
- Determine whether the identified structures are consistent with known areas of coastal fronts off the California Coast.
The paper will be divided into the following sections: (2) Material and Methods will describe the data and methodology used, (3) Results will describe the primary results, focused on the wavelet analysis, (4) Discussion will give an overview of how the primary results relate to the known dynamics of the California Coast and the CCS, and (5) Conclusions and Summary will summarize the results and outline future work.
2. Material and Methods
2.1. Data
The work focused on the application of three data sets to the California Coast to examine the spatial signals associated with gradients and frontal dynamics. The period covered was June to November for 2018 and June to November for 2019. The three data sets used in the study were:
- (1)
- The Multi-Scale Ultra-High Resolution Sea Surface Temperature (MURSST) L4. The L4 data do not have any gaps.
- (2)
- The Remote Sensing Systems (RSS) 70 km Soil Moisture Active Passive (SMAP) derived Sea Surface Salinity (RSSSMAP) L3 product. The L3 product has gaps as there is no optimal interpolation to fill in gaps to create a L4 product.
- (3)
- The Jet Propulsion Laboratory (JPL) Soil Moisture Active Passive (JPLSMAP) derived Sea Surface Salinity (JPLSMAP) L3 product. Similarly, to RSS the L3 product has gaps. Data gaps in RSS and JPL SMAP products are limited as the 8-day repeat orbit covers the entire globe but may differ between RSSSMAP (RSSSSS) and JPLSMAP (JPLSSS) due to different quality control in the L2 to L3 processing.
References for the three products are given below with more detailed descriptions.
Before a more detailed description of the products is given, it is important to define the levels of processing used. For example, Level 4 products are defined as merged, multi-sensor and gridded where all data gaps have been filled. The merging methodologies can vary between optimal interpolation, compositing, and application of wavelets as a basis function (e.g., MUR). Level 2P (L2P) is defined as the product at the original swath resolution of the sensor along the satellite track. Level 3 products are regularly gridded, but still contain gaps. Level 3 products do not apply optimal interpolation to fill in data gaps.
The MURSST data are distributed as part of the Group for High Resolution Sea Surface Temperature (GHRSST) Level 4 SST analysis products. The product is available through the JPL Physical Oceanography Distributed Active Archive Center (PO.DAAC, http://podaac.jpl.nasa.gov) (accessed on 1 March 2020). The analysis uses wavelets as basis functions in an approach to gridding SST data at 0.01-degree spatial resolution and one day temporal resolution. Input parameters include GHRSST L2P skin (infrared sensors) and subskin SST observations (microwave sensors) from several instruments including the NASA Advanced Microwave Scanning Radiometer-EOS (AMSR-E), the JAXA Advanced Microwave Scanning Radiometer 2 (AMSR2) on GCOM-W1, the Moderate Resolution Imaging Spectroradiometers (MODIS) on the NASA Aqua and Terra platforms, the US Navy microwave WindSat radiometer, the Advanced Very High Resolution Radiometer (AVHRR) on several NOAA satellites, and in-situ SST observations from the NOAA (in-situ quality monitor) iQuam project, and is created by a team led by Dr. Toshio M. Chin from JPL. For the period of study in this work the AMSR2 was implemented. In-situ data were used to remove biases. It adheres to the GHRSST Data Processing Specification (GDS) version 2 format specifications (https://podaac-tools.jpl.nasa.gov/drive/files/OceanTemperature/ghrsst/docs/GDS20r5.pdf) (accessed on 1 March 2020) (GHRSST Science Team, 2012). More information on the data set may be found at [12]. More information on this product can also be found at: https://podaac.jpl.nasa.gov/dataset/MUR-JPL-L4-GLOB-v4.1?ids=&values=&search=MUR&provider=PODAAC (accessed on 1 March 2020).
The Remote Sensing System (RSSSSS) product may also be found at the PO. DAAC website. The version 4.0 SMAP-SSS L3, daily and 0.25 degree temporally and spatially gridded product is based on the fourth release of the validated standard mapped SSS data from the NASA Soil Moisture Active Passive (SMAP) observatory, produced operationally by Remote Sensing Systems (RSS). The product is produced by taking running 8-day means every day. SMAP provides global coverage within three days at the equator and two days at boreal latitudes. As the products are based on an 8-day repeat orbit and taking the mean, this will leave few data gaps. However, gaps can still exist due to rain and Radio Frequency Interference (RFI). Improvements in this product over previous versions include improvements in both the land mask and sea-ice masks. Two final Level 3 products are produced as part of the RSSSMAP data set. These include both a 40km resolution and 70 km resolution product. The results shown in the manuscript are based solely on the 70 km product. Although the feature resolution of the RSSSSS is 70 km, the final product is gridded on a 0.25° grid on daily time scales. The gridded product uses Level 2 data as inputs to create the gridded Level 3 product. More information on the RSSSSS product may be found in [13]. More information on the product may also be found at: https://podaac.jpl.nasa.gov/dataset/SMAP_RSS_L3_SSS_SMI_8DAY-RUNNINGMEAN_V4?ids=&values=&search=RSS%20SMAP&provider=PODAAC (accessed on 1 March 2020)
The JPL SMAP (JPLSSS) version 5.0 is produced by the Jet Propulsion Laboratory. The version 5.0 product also consists of an 8-day running mean and is based on the Combined Active-Passive (CAP) retrieval algorithm. The Level 3 gridded product has a 60 km feature resolution. The final product is gridded on the same 0.25° spatial resolution at daily time scales. Thus, it also uses an 8-day running mean, consistent with the 8-day SMAP repeat orbit. The data may also be downloaded directly from the PO. DAAC website. More information on the calibration, application of land mask, may be found at [14]. Additional information on accessing the data through the PO.DAAC and data description may be found at: https://podaac.jpl.nasa.gov/dataset/SMAP_JPL_L3_SSS_CAP_8DAY-RUNNINGMEAN_V5?ids=&values=&search=JPL%20SMAP%20product&provider=PODAAC (accessed on 1 March 2020)
All these data sets were collocated with the Saildrone uncrewed vehicle for both the SST (SAILSST) and SSS (SAILSSS) products. The Saildrone vehicle is an uncrewed vehicle that is solar powered, and wind driven. Detailed information on the vehicle itself and instruments may be found at [15]. The one-minute averaged sampling leads to sub-kilometer spatial sampling and thus provides a unique database for validation of gradients. Multiple instruments on board measure SST and SSS, including a Seabird Conductivity/Temperature/Depth (SBE/CTD). Measurements of SST and SSS are measured at 0.5 m depth. The data used in this manuscript were like that used by [16] but incorporates more data during the 2018 to 2019 timeframes. The approximate time coverage for 2018 and 2019 data used in this study was June through November of 2018 and 2019 and consisted of 13 deployments. This overlapped with the major upwelling season off the California Coast that occurs during spring and summer. More information on the Saildrone data may be found at: https://podaac.jpl.nasa.gov/dataset/SAILDRONE_BAJA_SURFACE?ids=&values=&search=Saildrone&provider=PODAAC (accessed on 1 March 2020) and http://www.saildrone.com (accessed on 1 March 2020). Not all the data used in this study are available through the PO. DAAC, but only those supported by the National Aeronautics and Space Administration (NASA). Additional information may be found at: http://www.saildrone.com (accessed on 1 March 2020). Although not used in this study, additional measurements supported by Saildrone include the Advanced Doppler Current Profiler (ACDP), wind vectors, and air temperature/humidity. The next sections will describe the collocation strategy, derivation of gradients, and the application of the statistics and wavelet analysis.
2.2. Methods
The first step in the data processing was to collocate the two SMAP SSS products and the MURSST with the Saildrone observations. In this case, 13 Saildrone deployments were used as part of the Westcoast survey spanning 2018 and 2019. For the L3 (gridded) data the first step is to collocate each Saildrone observation to its nearest neighbor in the satellite data, then all Saildrone observations that are collocated with the same L3 grid point and time are averaged together. The nearest neighbor approach uses all the available data for the MUR 1 km and SMAP 25 km products. The Saildrone values are then averaged within the satellite pixel for that particular day to form the collocated product. Thus, nearest neighbors for the collocation of the satellite pixel are selected to coincide with the day of the specific satellite derived SSS and SST product. It is important to note that the collocation was finalized on the grid resolution of the SMAP data (0.25°). This means that within the 25 km SMAP pixel all the MURSST values were averaged along with the Saildrone SST and SSS values. Thus, the number of collocations were the same for both the SSS and the SST data, but more MUR 1 km values were used than SMAP to create the final collocated product due to the 1 km MUR resolution. However, the feature resolution of the MURSST is 1 km and thus will potentially resolve spatial features better. This is simply because, although smoothed, the higher resolution of the MURSST still potentially identifies features/fronts not resolvable by SMAP. Differences between the resolvability of the SMAP SSS products and MURSST are also due to the methodology applied in the MUR gridding. It is based on the application of wavelet basis functions which preserves the location of fronts. The same collocation strategy was implemented and was used in [17]. In this case, Vazquez-Cuervo et al. [17] applied the data to the study of the Arctic off the Alaskan Coast. The data clearly showed that the satellite derived SSS and SST were resolving the discharge associated with the Yukon River.
In this study, we use gradients as our front-detection method, as a front can be defined according to Belkin [18] as “a relatively narrow zone of enhanced horizontal gradients of water properties”. Thus, an algorithm based on the identification of gradients is consistent with identifying fronts. Moreover, a considerable number of the front-detection methods reviewed by [18] were based on application of gradients. The gradients were derived using a centered finite difference along the Saildrone deployment track. As the Saildrone track is not exactly linear, the centered finite difference approximates the gradients based on the assumption of the linearity of the deployment. Overall, this assumption is accurate except for times when winds decrease significantly, as the Saildrone vehicle is wind driven. The strategy of calculating the gradients is as follows:
where V stands for MURSST, RSSSSS, JPLSSS, SAILSST, and SAILSSS, and Gx,i and Gy,j stand for the corresponding gradient in the longitudinal and latitudinal directions, based on the indices “i”, “j”, which denote the longitude and latitude position along the Saildrone deployment. Thus x,i and y,i refer to the indices corresponding to the gradients in the longitudinal and latitudinal directions. The location is based on the index i along the Saildrone track. and are the distances in the longitudinal and latitudinal directions in kilometers. The distances and changed depending on the distance between the Saildrone measurements. Based on the methodology, the final results for both SSS and SST were collocated at the same resolution along the Saildrone track. Additionally, and were not equivalent and depended on the path of the Saildrone track, whether it was a north-south or east-west trajectory. This reflects the original grid resolution of the MURSST and SMAP SSS data sets.
The magnitude of the gradients then is derived as:
where G represents the magnitude of the gradient for SAILSSTi, SAILSSSi, MURSSTi, JPLSSSi, and RSSSSSi at the location “i” along the Saildrone deployment track.
2.3. Validation of Gradients
As a first step in the analysis, statistics were derived based on the collocated data and the differences between the SST and SSS gradients. The statistics derived were the mean differences between the Saildrone derived SST and SSS and the three remote sensing products, JPLSSS, RSSSSS, and the MURSST. The methodology was like that applied in a previous manuscript. Vazquez-Cuervo et al. [11] compared SST and SSS gradients with those derived from the Saildrone uncrewed vehicle. A major conclusion from that paper was that even though correlations between SST and SSS collocated values with Saildrone are high, gradient correlations are significantly reduced. The methodology used in [16] was different from that used in this work. In this work gradients were derived directly from the collocated values along the Saildrone track. In [11] gradients were derived first from the SST and SSS maps and then collocated to the Saildrone track. Correlation between gradients (0.4 for SST and 0.1 for SSS) were considerably lower in [11] than those derived in this work. The results could be indicative that the collocation methodology is important for understanding the validation statistics. The methodology used in this analysis is inherently smoother than [16] which would contribute to the improved results. Another contributing factor to differences in gradients between the satellite derived products and Saildrone is the temporal sampling. SMAP derived SSS are based on 8-day composites. As fronts move on time scales less than 8-days this will contribute to possible differences in gradients. MUR, although it implements a gridding over multiple days, applies a wavelet basis function which preserves the location of gradients and fronts. A similar approach in comparing gradients and the statistical analysis used in [11] will be applied to this work.
2.4. Wavelet Analysis
Once the gradients were derived along the Saildrone deployment tracks, wavelet analysis was applied to the gradients to examine the spatial variability and possible frontal locations associated with the SAILSSTi, SAILSSSi, MURSSTi, JPLSSSi, and RSSSSSi parameters. The goal here is not to develop a new methodology for detecting fronts, but to use the wavelet approach to identify the possible location of SST and SSS fronts and how they compare to previously derived locations of fronts and upwelling along the California Coast. One example are the fronts associated with coastal upwelling derived using the Coastal Upwelling Transport Index (CUTI) [19].
The Interactive Display Language (IDL) wavelet toolbox was implemented to derive the wavelet spectra associated with the gradients along the Saildrone deployment. For this analysis we applied the Morlet wavelet. The Morlet transform is based on a combination of a complex exponential multiplied by a Gaussian function. Inputs to the wavelet toolbox required a regular function in space. The gradients were all linearly interpolated to a regular spatial series, of 1 km spacing, based on distance from land in the specified latitude bands. Since the wavelet analysis was applied in three different latitude bands with multiple Saildrone deployments the values were interpolated to the higher 1 km spacing based on distance from land. It is important to note that the assumption was made, for the sake of this study, that all values were at the same time. Thus, this essentially assumes a synoptic time scale. The synoptic scale is defined by the period of the Saildrone deployment. This is the same assumption that was used in [11] to derive frequency spectra. Fronts move on faster time scales, but as the study was focused on identifying the major fronts associated with the gradients on the seasonal time scales (e.g., upwelling), the synoptic time scale is valid. The areas for application of the wavelets were divided into three latitude bands (see below for details): 32°N to 33°N, 38°N to 40°N, and 42°N to 43°N. More information on the IDL wavelet toolbox and its applications may be found at the user’s guide (http://www.geo.mtu.edu/geoschem/docs/IDL_Manuals/wavelet.pdf) (accessed on 10 April 2022).
3. Results
3.1. Statistics
Table 1 summarizes the statistics for the entire region of study, based on the gradient comparisons with Saildrone SST and SSS for 30°N to 45°N (bias, root mean square difference (RMSD) and correlation) for each of the individual products MURSST, JPLSSS, and the RSSSSS. To eliminate possible points affected by land contamination in the SSS, statistics were derived based on gradients between 0 and 1 PSU/km. Land contamination would cause artificially large gradients. Additionally, this would eliminate points where the gradients could be impacted by the lack of mobility of the Saildrone vehicle due to lack of winds. MURSST shows the highest correlation of 0.85 with a bias close to zero and RMSD of 0.2° Kelvin/km. The RSSSSS product shows an overall correlation of 0.74 and the JPLSSS product 0.58. The total number of collocated points for the entire period of deployments was 1526. The coefficients indicated statistical confidence at the 95% level of confidence. Both correlations are lower than the MURSST. RMSD are 0.04 PSU/km for the JPLSSSS product and 0.03 PSU/km for the RSSSSS product. All the correlations were statistically based on these statistics, the next step was to determine how well the gradients were reproducing known spatial features off the California/Baja Coasts. To do this we applied the wavelet transform. The statistics indicated a statistically significant correlation existed for both the SST and SSS satellite derived gradients and Saildrone.

Table 1.
Summary statistics comparing the gradients of the three products with Saildrone. Statistics are derived over the entire spatial area, 30°N to 45°, and time period of the study.
3.2. Gradients
To determine the range of latitudes along the California Coast for the analysis, the average gradient was derived for the three-satellite derived co-located products. Figure 1a shows the mean gradient for June-September of 2018 for the MURSST product, clearly showing gradients of greater than 0.04° Kelvin/km along the California coast. Figure 1b shows the same gradients derived from the MUR data set, but for the mean for January of 2018, to compare to a different time of year and conditions. The magnitudes of the gradients are significantly reduced in the January period. This is due to the absence in upwelling at this time of year, but well mixed conditions due to winter storms and weather. This would be consistent with results from [19]. Figure 1c,d shows the derived SSS gradients from the JPLSSS and RSSSSS products for the June–September 2018 period of time. Both products indicate that between 30°N to 40°N much of the nearshore gradients are not resolved due to the land masking in the SMAP products. This is seen where the black values for missing data extend further from shore. This is an issue which will be discussed later with respect to the wavelet analysis.
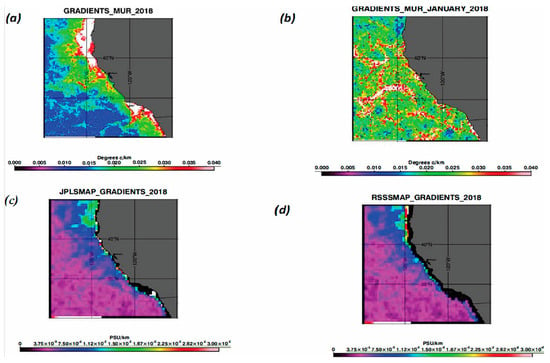
Figure 1.
(a–d): (a) MUR derived mean SST gradients between June 2018 through September 2018, (b) MUR derived mean SST gradients for January 2018, (c) JPL SMAP derived SSS gradients June 2018 through September 2018, and (d) RSS SMAP derived SSS gradients from June 2018 through September 2018.
Examining Figure 1a one can identify large gradients between 32°N to 33°N and North of 40°N. Based solely on the visual inspection of these plots and historical analysis, it was decided to focus on the three latitude ranges, 32°N to 33°N, 38°N to 40°N, and 42°N to 43°N, for the wavelet analysis.
Figure 2 shows the derived SST gradients from both the Saildrone SBE/CTD and MUR. Clearly visible from both the Saildrone and the MUR collocated data are larger gradients occurring between 32°N to 33°N.
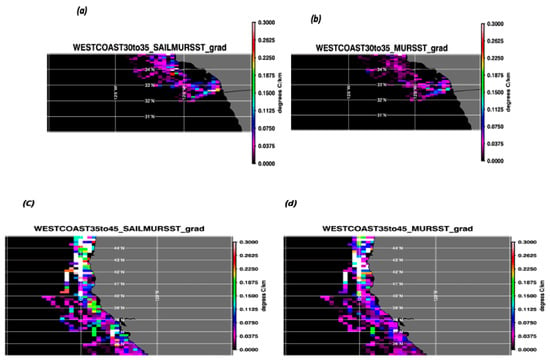
Figure 2.
(a–d): (a) SAILSST gradients along the Saildrone deployment from 30°N to 35°N derived using the SBE/CTD data, (b) MURSST gradients from the MUR co-located data from 30°N to 35°N, (c) SAILSST gradients along the Saildrone deployment from 35°N to 42°N derived using the SBE/CTD data, and (d) MURSST gradients from the MUR co-located data from 35°N to 45°N.
Figure 3 shows the salinity derived gradients based on the JPLSSS product compared to the Saildrone SBE/CTD. Between 30°N to 35°N consistently high gradients are clearly visible between 32°N to 33°N. However, JPLSSS appears to have a larger area covered by the high/strong gradients. This will be discussed further in the next section with respect to the wavelet analysis. Between 35°N to 42°N the largest gradients are seen between 38°N to 42°N. This is visible in both the JPLSSS and SAILSSS. The spatial extent of the high gradients appears greater in the JPLSSS product.
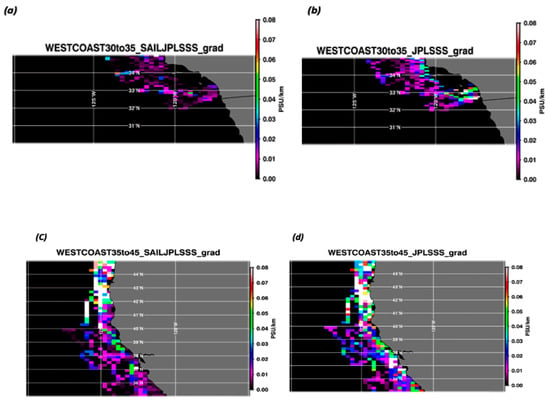
Figure 3.
(a–d): (a) SAILSSS between 30°N to 35°N from the SBE/CTD based on the collocated JPLSSS and Saildrone deployment, (b) JPLSSS between 30°N to 35°N for the collocated JPLSSS product, (c) SAILSSS between 35°N to 45°N from the SBE/CTD based on the collocated JPLSSS and Saildrone deployment, and (d) JPLSSS between 35°N to 42°N for the collocated JPLSSS product.
Figure 4 shows the same results as Figure 3, but for RSSSSS. Overall, the results are like those in Figure 3. One difference between Figure 3 and Figure 4 is the overall number of collocated points. This is due to the RSS algorithm which removes more pixels close to land [10,20].
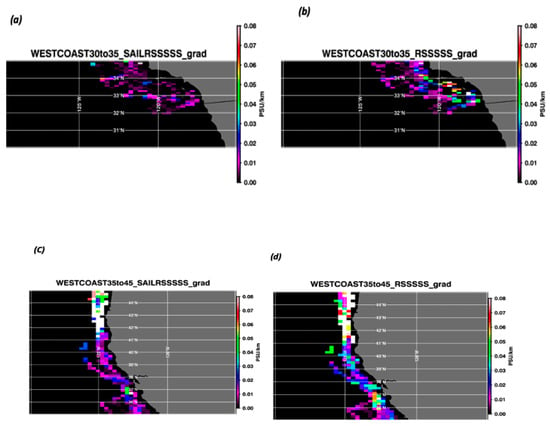
Figure 4.
(a–d): (a) SAILSSS between 30°N to 35°N from the SBE based on the collocated RSSSSS and Saildrone deployment, (b) RSSSSS between 30°N to 35°N for the collocated RSSSSS product, (c) SAILSSS between 35°N to 45°N from the SBE/CTD based on the collocated RSSSSS and Saildrone deployment, and (d) RSSSSS between 35°N to 42°N for the co-located RSS SMAP product.
Based on the gradients observed in Figure 1, as well as the collocated gradients along the Saildrone deployment in Figure 2, Figure 3 and Figure 4, the large magnitude gradient regions (32°N to 33°N, 38°N to 40°N, and 42°N to 43°N) were selected for the wavelet analysis for the different regions. The selection of these regions was not intended to be all inclusive, but merely to serve as examples of how the wavelet analysis could be used to detect fronts along the California/Baja Coast.
3.3. Wavelets
Figure 5, Figure 6 and Figure 7 show the wavelet spectra for the Saildrone derived SST gradients and the collocated MURSST gradients. Wavelets take normal spectral analysis a step further by deriving spectral density as a function of distance for wavenumber spectra and time for frequency spectra. In this application the derived spectral density is both a function of distance from land in kilometers (x-axis) and spatial scale of the wavelet in kilometers (y-axis). Table 2 indicates the 95% significance level of the wavelet spectra for the SST and SSS gradients for each of the latitude bands. Based on the values, maxima values observed in the spectra are significant at the 95% level of significance, except for the SSS in the most northern latitude band. Arrows pointing to the color bar indicate the color associated with the 95% level of confidence. The units for the SST spectral density were degrees/km while for the SSS spectra were PSU/km. Although gridded to the same location with Saildrone, the higher feature resolution of the MURSST is identifying the location and magnitude of the front. Statistically, this is also seen in the higher correlations from Table 1. This is an important distinction between gridding and feature resolution. In the latitude band between 32°N to 33°N the wavelet spectra for both SAILSST and MURSST show considerable energy near the coast at less than 50 km with scales ranging from 30 to 60 km. MURSST is resolving the features close to the coast with excellent agreement with SAILSST gradients. Overall, MURSST is resolving the spatial scales of gradients in the three different latitude ranges. Figure 6 (38°N to 40°N) indicates that the highest magnitude gradients are being seen at greater than 100 km from the coast ranging in scales from 10 km to over 200 km. Figure 7 (40°N to 42°N) indicates that large gradients are seen near the coast with scales of over 100 km.
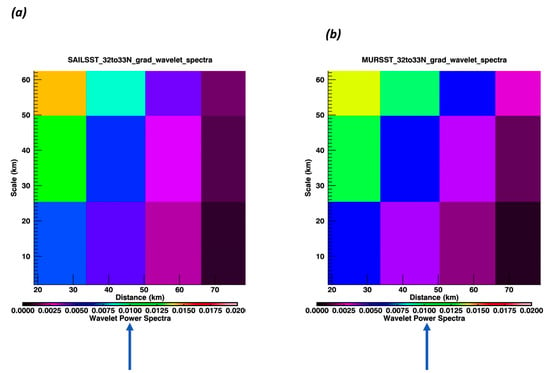
Figure 5.
(a,b): Wavelet spectra from 32°N to 33°N for (a) SAILSST and (b) MURSST. Arrows indicate the color associated with the 95% level of confidence.
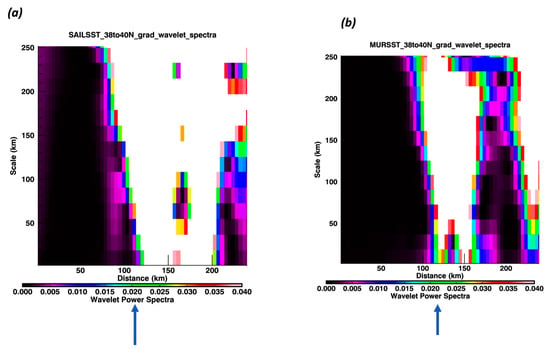
Figure 6.
(a,b): Wavelet spectra from 38°N to 40°N for (a) SAILSST and (b) MURSST. Arrows indicate the color associated with the 95%level of confidence.
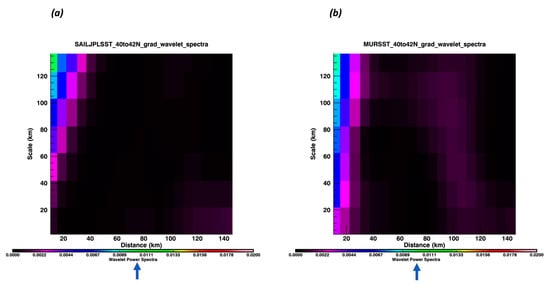
Figure 7.
(a,b): Wavelet spectra from 40°N to 42°N for (a) SAILSST and (b) MURSST. Arrows indicate the color associated with the 95% level of confidence.

Table 2.
Shows the 95% confidence value for the SST and SSS wavelet spectra for each latitude range.
Figure 8, Figure 9 and Figure 10 show the wavelet spectral analysis for SAILSSS and JPLSSS. They are equivalent to Figure 5, Figure 6 and Figure 7, but for salinity. Figure 8a associated with the Saildrone derived SAILSSS clearly shows the salinity signal near the coast between 32°N to 33°N. As in Figure 5 the scale of the signal is from 25 km to greater than 60 km. Figure 8b derived from JPLSSS does not show a clear maximum near the coast. The reason for these differences can be due to several factors including resolution of the JPLSSS (60 km) being too small to resolve the coastal signal.
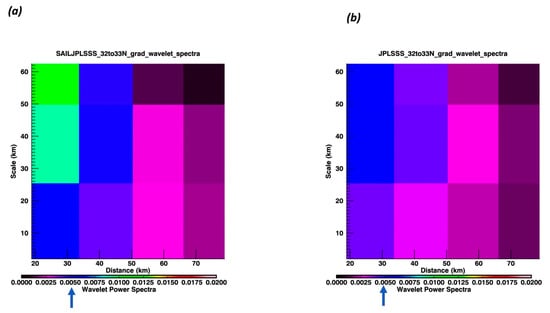
Figure 8.
(a,b): Wavelet spectra from 32°N to 33°N for (a) SAILSSS and (b) JPLSSS. Arrows indicate the color associated with the 95% level of confidence.
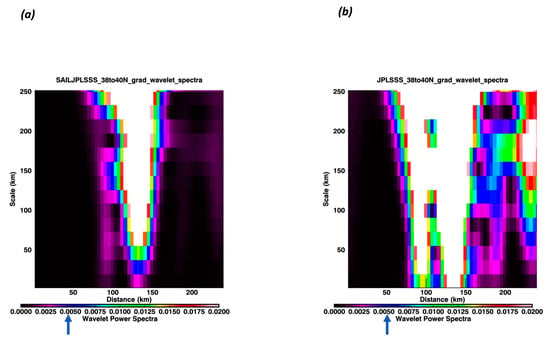
Figure 9.
(a,b): Wavelet spectra from 38°N to 40°N for (a) SAILSSS and (b) JPLSSS. Arrows indicate the color associated with the 95% level of confidence.

Figure 10.
(a,b): Wavelet spectra from 40°N to 42°N for (a) SAILSSS and (b) JPLSSS. Arrows indicate the color associated with the 95% level of confidence.
Figure 9 shows the wavelet spectra for SAILSSS and JPLSSS for 38°N to 40°N. Clearly visible in both are the maxima signals seen at 100 to 150 km from shore. The results indicate that from 38°N to 40°N large signals in gradients are being seen in both SST and SSS.
Figure 10 shows significant differences between the SAILSSS and JPLSSS wavelet spectra. The SAILSSS wavelet spectra show a slight maximum at 60 to 80 km offshore, while the JPLSSS shows a large maximum near the coast as well as 80 to 100 km offshore. It is clear though, based on the 95% level of confidence, that the results are not statistically significant. These results are significantly different from those derived for SST in Figure 7. One explanation is that the offshore SSS gradients are related to the California Undercurrent mesoscale eddies. SST gradients might not be seen because the offshore waters are warmer. Additionally, offshore waters are slightly salty, but eddies are saltier. However, this would need to be an area of future research and beyond the scope of this work.
Figure 11, Figure 12 and Figure 13 show the same wavelet spectra but for SAILSSS and the RSS SMAP co-located derived SSS. Figure 11 shows the wavelet spectra from 32°N to 33°N for SAILSSS and RSSSSS. The SAILSSS is consistent in identifying large gradients near the coast with scales 30 km and greater. The RSSSSS product does not show any maxima in the wavelet spectra. This is consistent with the JPLSSS product.
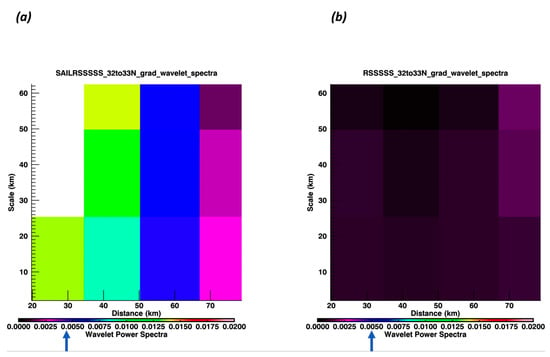
Figure 11.
(a,b): Wavelet spectra from 32°N to 33°N for (a) SAILSSS and (b) RSSSSS. Arrows indicate the color associated with the 95% level of confidence.
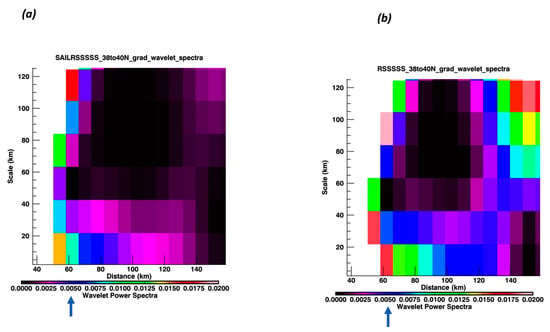
Figure 12.
(a,b): Wavelet spectra from 38°N to 40°N for (a) SAILSSS and (b) RSSSSS. Arrows indicate the color associated with the 95% level of confidence.
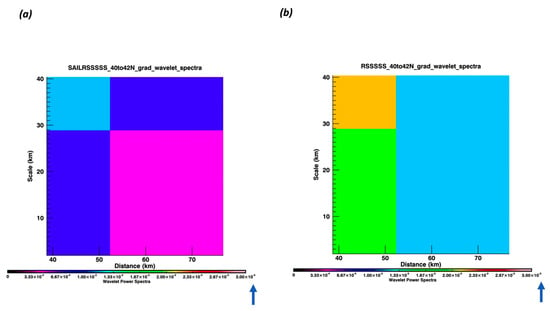
Figure 13.
(a,b): Wavelet spectra from 40°N to 42°N for (a) SAILSSS and (b) RSSSSS. Arrows indicate the color associated with the 95% level of confidence.
Figure 12 shows for 38°N to 40°N the Saildrone derived SSS wavelet spectra has large gradients at less than 40 km with scales ranging from 0 to 120 km. The wavelet spectra for the RSSSSS product have a similar structure near the coast but also has a maximum at greater than 140 km with a scale of 120 km. The difference is most likely due to issues of land contamination. Differences could also be due to possible stratification as the SMAP derived SSS measure a subskin salinity, while the CTD measures the salinity at 0.5 m. This is certainly an area for future work to better understand the differences. The wavelet spectra for the RSSSSS and SAILSSS are different from the JPLSSS product.
Figure 13 shows the wavelet spectra for the gradients between 40°N to 42°N for the SAILSSS and the RSSSSS products. The Saildrone derived SSS shows a maximum up to 50 km offshore, with scales greater than 30 km. For the RSSSSS derived gradients the maxima are also seen at less than 50 km but with slightly larger magnitudes.
Overall, the wavelet spectra for the RSSSSS and JPLSSS derived gradients show differences that need to be explained in terms of the products themselves. In the next section we will discuss these differences, as well as examine the bias, RMSD and correlations between the products.
4. Discussion
The major discussion point is whether the results, specifically related to the wavelet analysis, are indicative of known frontal regions off the California/Baja Coast. A major rationale for the manuscript is to present results that indicate that satellite derived SST and SSS can be used to monitor fronts in coastal regions. Additionally, they indicate where improvements can be made. The issue of known frontal regions was based on consistency with historical results that applied the CUTI index. The CUTI upwelling index itself was an improvement on the Bakun index [21,22] which was based on the Ekman transport generated by equatorward alongshore wind stress. It allowed for more accurate identification of upwelling events and their associated dynamics. The basic equation is: CUTI = UEk + UGeo. Thus, CUTI is the sum of both the Ekman and Geostrophic Transports. [17] developed a (CUTI) that incorporates a geostrophic component in addition to the Ekman transport. Figure 10 from [19] shows the CUTI index as a function of latitude. Maxima values occur around 38°N to 40°N. These results are consistent with the results in the wavelet analysis.
Overall, the correlation between CUTI and the Bakun index was 0.90 in the northerly latitudes at approximately 38°N but significantly decreased in the southerly latitudes. Part of this could be due to fronts in the northerly latitudes driven more by alongshore winds while in the southerly latitude they are driven more by the influence of the California Current System. All the data used in the wavelet analysis that included gradients versus distance from shore, for the three products between 30°N to 45°N, are shown in Figure 14a–c). Overall, all three products clearly indicate that large gradients are occurring at a distance <100 km from shore. This is consistent with known areas of coastal upwelling. However, there are also large gradients in the MURSST and JPLSSS at approximately 150 km from shore where the influence of the California Current could be a factor. Gradient magnitudes reach 1 degree Kelvin/km and 1 PSU/km (see Figure 14). However, a significant portion of the gradients are less than 0.4. As stated, there are also maxima in gradients that exist at distances >100 km from land. This is, of course, consistent with the wavelet analysis. This is especially noticeable in the MURSST product where peaks are seen at 150 km and 250 km. This is consistent with Figure 6 which shows the wavelet spectra between 38°N to 40°N. The next step was to interpret these results from the perspective of the wavelet analysis.
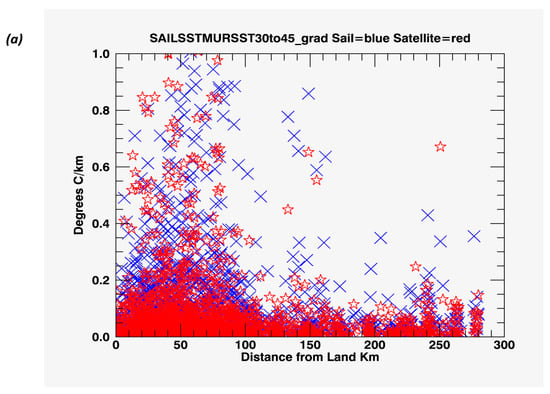
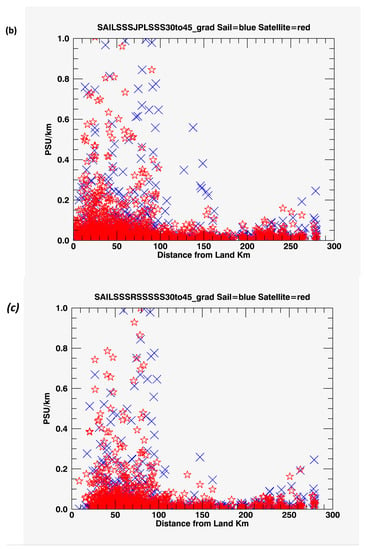
Figure 14.
(a–c): Gradient magnitudes for (a) MURSST, (b) JPLSSS, and (c) RSSSSS versus distance from land. Blue Xs indicate Saildrone and red stars indicate satellite (MURSST, JPLSSS, RSSSSS).
The application of the wavelet analysis indicates that fronts, identified based on gradients, are associated with known centers of upwelling. High correlations over the entire region of study between the MURSST gradients and Saildrone SSTs gradients validate their location and thus fronts in the region, indicating that they are resolving the features associated with coastal upwelling. Correlations of <0.20 for the JPLSSS and the RSSSSS are significantly lower for the region between 32°N to 33°N. This is consistent with the wavelet analysis in Figure 8 and Figure 11, showing significantly reduced wavelet spectra of the gradients near the coast. This is also the region which is closest to the coast (see Figure 3 and Figure 4) and where the SSS gradients associated with frontal features would not be resolved due to land contamination and flagged pixels as land. Thus, the issue of lower feature resolution in JPLSSS and RSSSSS than the MURSST, along with the land contamination, are reducing the resolvable SSS gradients near the coast.
Between 38°N to 40°N correlations between the MURSST and SAILSST gradients drop significantly to 0.63 with RMSD differences increasing to 0.4 K/km. These statistics were derived separately from the overall statistics shown in Table 1. The reduced correlation is likely because of the reduced signal to noise ratio in the region. From the wavelet spectra in Figure 6 it is clear that the large magnitude gradients are occurring greater than 100 km offshore and most likely are not associated with coastal upwelling, but most likely with variability associated with the California Current Systems. For this region the JPLSSS has a higher correlation of 0.87. This is reflective of the smoother product due to the lower feature resolution (60 km). As with the MURSST, the JPLSSS shows the largest gradients at greater than 100 km from the coast. Although gradients are not directly interpretable as fronts, many well-known frontal detection algorithms rely on gradient calculations [15].
Overall, the results are consistent with the known spatial characteristics of the data and the issue of land contamination, discussed in [20]. Although the MURSST, JPLSSS, and RSSSSS products were collocated to Saildrone based on the 25 km pixel size, the feature resolution of the MURSST is 1 km, while the feature resolutions of the JPLSSS and RSSSSS are estimated to be 60 km and 70 km, respectively. Of course, the smoothing of the MURSST data during the collocation process impacts and degrades the feature resolution. Additionally, periods of cloud cover will also degrade the feature resolution of the MURSST. The degrading of the MURSST feature resolution impacts the resolvability of spatial features, and this is clearly seen in the wavelet analysis. Overall the higher correlations associated with the MURSST gradients and Saildrone, as well as the wavelet analysis, indicate it is still capturing frontal features associated with higher resolution than the SMAPSSS.
Overall, the validation process in the application of the wavelet analysis identifies the dominant gradient features in SST and SSS reflected in the wavelet spectra and are consistent with known upwelling scales off the California coast. Large gradients in Figure 1 are seen in two dominant areas defined by the MURSST, between 38°N to 45°N and 32°N to 35°N. As mentioned, Figure 14 clearly shows the largest gradients exist at distances less than 100 km from land. These areas, shown in Figure 1, correspond very well to the spatial regions identified as the maxima in vertical velocity were found between 31°N to 47°N, based on the Coastal Upwelling Transport Index (CUTI), described in [19].
Maxima in the spectra are clearly identified in both the SAILSST and MURSST. Figure 9 also shows large gradients in the JPLSSS product at distances >100 km from shore. Between 40°N to 42°N results suggest that larger SSS gradients also exist closer to shore most likely associated with nearshore coastal upwelling. Figure 7 indicates that these gradients are <20 km from shore, thus making them resolvable by the MURSST, but not the salinity derived products. The same issue of resolvability is also seen in Figure 8 and Figure 11 which the wavelet spectra for the JPLSSS and RSSSSS between 32°N to 33°N. Clearly the SAILSSS is showing maxima near the coast which is not being resolved by the JPLSSS or RSSSSS products.
The results Indicate that both SST and SSS fronts are associated with the dynamics of the California coast. The wavelet spectra also are consistent with historical results [19] on the location of fronts associated with coastal upwelling along the California coast. The gradients close to the coast between 32°N to 33°N are consistent with the area of study found in [23], where they determined large gradients could be identified due to the influence of Tropical Eastern Pacific Water associated with El Niño/La Niña events. Thus, a primary driving force for the variability in water mass properties in the region was due to the advection by the California Current System (CCS) and the interannual variability. Upwelling in the region was found to have an interannual variability with increased upwelling during La Niña events and decreased upwelling during El Niño events. Other possibilities include the formation of cyclonic and anticyclonic eddies where cyclonic eddies lead to colder fresher water while anticyclonic eddies lead to warmer saltier waters. Differences in patterns between SST and SSS could additionally be due to the California Undercurrent and associated mass transport of SSS [24]. Further work, beyond the scope of this paper, is needed to identify the causes behind the frontal structures. The main goal of this paper was to show that current remote sensing is identifying the known structures associated with the coastal upwelling patterns off the California Coast. The evidence that the wavelet spectra is identifying the location of the gradient features associated with SST and SSS fronts indicates a positive result for the future application of satellite derived SST and SSS in coastal regions to monitor both SST and SSS fronts. The Saildrone uncrewed vehicle provides a unique drone technology for validating gradients derived from satellite derived products. Overall, the wavelet spectra applied to collocated data along the Saildrone track are indicating the location of fronts consistent with [19]. The results are extremely encouraging in indicating that both SST and SSS fronts are being resolved by the remote sensing data.
5. Conclusions and Summary
The results determined by the study are promising for the application of remote sensing SST and SSS in coastal regions to identify fronts associated with coastal upwelling and mesoscale/submesoscale variability. The validation of both the SST and SSS fronts is critical for application to density fronts and the relationship to upwelling and vertical velocities. The application of wavelets identifies frontal features associated with derived gradients that are related to documented [8,19] locations of centers of upwelling along the California Coast. Additionally [25,26] found that there was a summertime coupling between the wind stress and upwelling off the California Coast. Castelao and Barth [27] found equivalent results for Cape Frio, Brazil. High correlations between derived gradients from the MURSST and the SAILSST are indicative of the capability of the higher resolution MURSST to resolve features associated with the coastal upwelling and mesoscale/submesoscale variability, especially closer to land. Fronts were also derived from the lower resolution SMAP SSS data. It was clear that, especially closer to the coast, the SAILSSS resolved gradients are not seen in the SMAP SSS products. This precluded the resolution of some of the upwelling fronts between latitudes 32°N to 33°N. Overall, the JPLSSS derived gradients had the lowest correlation of 0.28 with the SAILSSS, while the MURSST derived gradients had the highest correlation of 0.85. However, the RMSD between the JPLSSS and the SAILSSS was 0.17 PSU/km compared to RSSSSS of 0.11 PSU/km. The differences between the two products could be due to differences in the algorithm used for land contamination. The feature resolutions of the two SMAP products is <100 km and indicates they can identify frontal structures associated with coastal upwelling for scales <100 km. However, issues of land contamination need to be considered in their application. Future improvements in the SSS products are expected to improve the usability closer to land. The differences seen in Figure 9 and Figure 12 are most likely due to differences in collocations between the two SMAP products as well as differences in land masking.
Overall, the work is encouraging for the application of wavelets to detect frontal structures in coastal regions. Future work would focus on expanding the application of wavelets on the annual to interannual time scales to identify long-period changes in coastal upwelling and fronts. This could be carried out in combination with empirical orthogonal functions. Additionally, new SMAP SSS products should also be used to identify improvements in detecting fronts close to land.
Author Contributions
J.V.-C. was involved in the conceptualization, methodology, and formal analysis of the work. Additionally, J.V.-C. wrote the initial draft. M.G.-R. and J.G.-V. were involved in the significant editing of the manuscript as well as the formal data analysis and preparation of the manuscript during the entire revision process. All authors have read and agreed to the published version of the manuscript.
Funding
This research was supported by the NASA Salinity Continuity Program, grant #80NSSC20K1003. JVCuervo was funded under contract with NASA at the Jet Propulsion Laboratory/California Institute of Technology. JGV was supported by CICESE and CONACYT, México. MGR was funded by the NASA grants #80NSSC20K1003 and #80NSSC20K0768.
Data Availability Statement
All remote sensing data used in this manuscript is available through NASA’s Physical Oceanography Distributed Active Archive Center (PO.DAAC). All the data is publicly available at no cost to the user community. The Saildrone data used in the manuscript maybe accessed through http://www.saildrone.com. It is also publicly available at no cost to the user.
Acknowledgments
The two SMAP products, along with the two Saildrone deployments were downloaded from NASA’s Physical Oceanography Distributed Active Archive Center (PO.DAAC). The JPLSSS product was downloaded from: https://podaac.jpl.nasa.gov/dataset/SMAP_JPL_L3_SSS_CAP_MONTHLY_V43?ids=&values=. The Remote Sensing System products may be downloaded from: https://podaac.jpl.nasa.gov/dataset/SMAP_JPL_L3_SSS_CAP_8DAY-RUNNINGMEAN_V43?ids=&values=. Saildrone data used in this study can also be downloaded through the PO.DAAC at: https://podaac.jpl.nasa.gov/dataset/SAILDRONE_ARCTIC?ids=&values=.
Conflicts of Interest
The authors declare no conflict of interest.
References
- Chavez, F.P.; Messié, M. A comparison of Eastern Boundary Upwelling Ecosystems. Prog. Oceanogr. 2009, 83, 80–96. [Google Scholar] [CrossRef]
- Huyer, A. Coastal upwelling in the California Current System. Prog. Oceanogr. 1983, 12, 259–284. [Google Scholar] [CrossRef]
- Messié, M.A.; Ledesma, J.; Kolber, D.D.; Michisaki, R.P.; Foley, D.G.; Chavez, F.P. Potential new production estimates in four eastern boundary upwelling ecosystems. Prog. Oceanogr. 2009, 83, 151–158. [Google Scholar] [CrossRef]
- Castelao, R.M.; Mavor, T.P.; Barth, J.A.; Breaker, L.C. Sea surface temperature fronts in the California Current System from geostationary satellite observations. J. Geophys. Res. 2006, 111, C09026. [Google Scholar] [CrossRef]
- Powell, J.R.; Ohman, M.D. Covariability of zooplankton gradients with glider-detected density fronts in the Southern California Current System. Deep Sea Res. Part II Top. Stud. Oceanogr. 2015, 112, 79–90. [Google Scholar] [CrossRef]
- Kahru, M.; Di Lorenzo, E.; Manzano-Sarabia, M.; Mitchell, B.G. Spatial and temporal statistics of sea surface temperature and chlorophyll fronts in the California Current. J. Plankton Res. 2012, 34, 749–760. [Google Scholar] [CrossRef]
- Olaya, F.C.; Durazo, R.; Oerder, V.; Pallàs-Sanz, E.; Bento, J.P. Ocean Front Detection with Glider and Satellite-Derived SST Data in the Southern California Current System. Remote Sens. 2021, 13, 5032. [Google Scholar] [CrossRef]
- Mauzole, Y.L.; Torres, H.S.; Fu, L.-L. Patterns and dynamics of SST fronts in the California Current System. J. Geophys. Res. Ocean. 2020, 125, e2019JC015499. [Google Scholar] [CrossRef]
- Adcroft, A.; Hill, C.; Campin, J.M.; Marshall, J.; Heimbach, P. Overview of the formulation and numerics of the MIT GCM. In Proceedings of the ECMWF Seminar Series on Numerical Methods, Recent Developments in Numerical Methods for Atmosphere and Ocean Modelling; University of Reading: Reading, UK, 2004; pp. 139–149. [Google Scholar]
- Forget, G.; Campin, J.M.; Heimbach, P.; Hill, C.N.; Ponte, R.M.; Wunsch, C. ECCO version 4: An integrated framework for non-linear inverse modeling and global ocean state estimation. Geosci. Model Dev. 2015, 8, 3071–3104. [Google Scholar] [CrossRef]
- Vazquez-Cuervo, J.; Gomez-Valdes, J.; Bouali, M. Comparison of Satellite-Derived Sea Surface Temperature and Sea Surface Salinity Gradients Using the Saildrone California/Baja and North Atlantic Gulf Stream Deployments. Remote Sens. 2020, 12, 1839. [Google Scholar] [CrossRef]
- GHRSST Science Team. The Recommended GHRSST Data Specification (GDS) 2.0. Document Revision 4; GHRSST International Project Office, University of Reading: Reading, UK, 2010; p. 123. [Google Scholar]
- Chin, T.M.; Vazquez-Cuervo, J.; Armstrong, E.M. A multi-scale high-resolution analysis of global sea surface temperature. Remote Sens. Environ. 2017, 200, 154–169. [Google Scholar] [CrossRef]
- Meissner, T.; Wentz, F.J.; Le Vine, D.M. The Salinity Retrieval Algorithms for the NASA Aquarius Version 5 and SMAP Version 3 Releases. Remote Sens. 2018, 10, 1121. [Google Scholar] [CrossRef]
- Fore, A.G.; Yueh, S.H.; Tang, W.; Stiles, B.W.; Hayashi, A.K. Combined Active/Passive Retrievals of Ocean Vector Wind and Sea Surface Salinity With SMAP. IEEE Trans. Geosci. Remote Sens. 2016, 54, 7396–7404. [Google Scholar] [CrossRef]
- Gentemann, C.L.; Scott, J.P.; Mazzini, P.L.F.; Pianca, C.; Akella, S.; Minnett, P.J.; Cornillon, P.; Fox-Kemper, B.; Cetinic, I.; Chin, T.M.; et al. Saildrone: Adaptively sampling the marine environment. Bull. Am. Meteorol. Soc. 2020, 101, 744–762. [Google Scholar] [CrossRef]
- Vazquez-Cuervo, J.; Castro, S.L.; Steele, M.; Gentemann, C.; Gomez-Valdes, J.; Tang, W. Comparison of GHRSST SST Analysis in the Arctic Ocean and Alaskan Coastal Waters Using Saildrones. Remote Sens. 2022, 14, 692. [Google Scholar] [CrossRef]
- Belkin, I.M. Remote Sensing of Ocean Fronts in Marine Ecology and Fisheries. Remote Sens. 2021, 13, 883. [Google Scholar] [CrossRef]
- Jacox, M.G.; Edwards, C.A.; Hazen, E.L.; Bograd, S.J. Coastal upwelling revisited: Ekman, Bakun, and improved upwelling indices for the U.S. West Coast. J. Geophys. Res. Ocean. 2018, 123, 7332–7350. [Google Scholar] [CrossRef]
- Tang, W.; Yueh, S.H.; Fore, A.G.; Vazquez-Cuervo, J.; Gentermann, G.; Hayashi, A.K.; Akins, A.; Garcia-Reyes, M. Using Saildrones to Assess the SMAP Sea Surface Salinity Retrieval in the Coastal Regions. IEEE J. Sel. Top. Appl. Earth Obs. Remote Sens. 2022, 15, 7042–7051. [Google Scholar] [CrossRef]
- Bakun, A. Daily and Weekly Upwelling Indices, West Coast of North America 1967–73; NOAA Tech. Rpt. 693; US Department of Commerce: Seattle, WA, USA, 1975; p. 16.
- Bakun, A. Coastal Upwelling Indices, West Coast of North America, 1946–1971; NOAA Tech. Rpt. 671; US Department of Commerce: Seattle, WA, USA, 1973.
- Bograd, S.J.; Schroeder, I.D.; Jacox, M.G. A Water Mass History of the Southern California Current System. Geophys. Res. Lett. 2019, 46, 6690–6698. [Google Scholar] [CrossRef]
- Garfield, N.; Collins, C.A.; Carter, E. Lagrangian exploration of the California undercurrent, 1992–85. J. Phys. Oceanogr. 1999, 29, 560–583. [Google Scholar] [CrossRef]
- Chelton, D.B.; Schlax, M.G.; Freilich, M.H.; Milliff, R.F. Satellite Measurements Reveal Persistent Small-Scale Features in Ocean Winds. Science 2004, 303, 978–983. [Google Scholar] [CrossRef] [PubMed]
- Chelton, D.B.; Schlax, M.G.; Samelson, R.M. Summertime Coupling between Sea Surface Temperature and Wind Stress in the California Current System. J. Phys. Oceanogr. 2007, 37, 495–517. [Google Scholar] [CrossRef]
- Castelao, R.M.; Barth, J.A. Upwelling around Cabo Frio, Brazil: The importance of wind stress curl. Geophys. Res. Lett. 2006, 33, 33. [Google Scholar] [CrossRef]
Disclaimer/Publisher’s Note: The statements, opinions and data contained in all publications are solely those of the individual author(s) and contributor(s) and not of MDPI and/or the editor(s). MDPI and/or the editor(s) disclaim responsibility for any injury to people or property resulting from any ideas, methods, instructions or products referred to in the content. |
© 2023 by the authors. Licensee MDPI, Basel, Switzerland. This article is an open access article distributed under the terms and conditions of the Creative Commons Attribution (CC BY) license (https://creativecommons.org/licenses/by/4.0/).