Abstract
Exploring multi-timescale tidal variability is fundamental and necessary for numerous practical purposes, such as flood protection, marine cultivation, and ocean transport. It is well known that tides show significant seasonal, inter-annual, and 18.61-year nodal variability. Less known and less discussed is the subseasonal tidal variability (i.e., ter-annual, quarter-annual, and penta-annual cycles) in the coastal ocean. In this study, we explore subseasonal tidal modulations in the Gulf of Tonkin via the combination of four tide gauges and 27-year multi-satellite altimeter observations. Both tide gauges and satellite altimeters indicate that tidal subseasonality is significant in the Gulf of Tokin, although the amplitudes of subseasonal variations are much smaller than those of seasonal variations. Compared to spatially limited tide gauges, satellite altimeters successfully derive the basin-scale tidal subseasonality in the Gulf of Tonkin. The largest amplitude of subseasonal tidal constituents originated from the subseasonality of main tidal constituents, and can reach as high as 31.8 mm. It is suggested that subseasonal variations in ocean environments (e.g., sea levels and ocean stratification) induce tidal subseasonality through changing tidal propagation and dissipation. Although powerful, satellite altimeters also have some defects. Due to tidal aliasing related to long-period sampling intervals, some subseasonal tidal constituents are indistinguishable in satellite altimeter records.
1. Introduction
As periodic water level fluctuations induced by the moon and the sun, ubiquitous ocean tides play a fundamental role in marine environments and human activities in the ocean [1,2]. Because of astronomical forces and non-astronomical perturbations (e.g., river flow, sea ice and human activities) [3,4], ocean tides are essentially non-stationary and tidal parameters (amplitudes and phases) often display significant multi-timescale variations [5,6].
Seasonal (i.e., annual and semi-annual) and 18.61-year nodal cycles are the most important tidal modulations in the global ocean [7,8,9]. Seasonal tidal variations are mainly driven by seasonally changing river flow, sea ice and ocean stratification [10,11,12]. Kang et al. (2002) [13] point out that seasonal ranges of M2 amplitudes in the Yellow Sea and the East China Sea can be as large as 40 cm. 18.61-year tidal modulations originate from the retrograde precession of the lunar ascending and descending nodes with a period of 18.61 years [14,15]. Peng et al. (2019) [16] indicate that high tidal levels can be changed by 30 cm in an 18.61-year nodal cycle in some sea areas like the Gulf of Tonkin. Except seasonal and nodal variations, tides also show noticeable inter-annual and multi-decadal variability in some sea areas. Devlin et al. (2014) [17] found that tides at Honiara are highly correlated with the El Niño-Southern Oscillation (ENSO), which has typical periods of 2–7 years. Pan and Lv (2021) [12] indicated that the amplitude of the quasi 60-year cycle in M2 amplitudes can reach 26.34 mm at Cuxhaven, which is slightly larger than that of the 18.61-year nodal cycle (24.98 mm).
Although there are numerous studies on temporal variations in tidal parameters, few studies have explored subseasonal tidal variability (i.e., ter-annual, quarter-annual, and penta-annual cycles). Rayson et al. (2021) [18] indicated that including subseasonal cycles can obviously improve the accuracy of internal tide amplitude prediction in the Australian North West Shelf and Timor Sea. Note that Rayson et al. (2021) [18] focused on internal tides, while we focus on surface tides in this research. Multi-timescale tidal variations are mainly observed by point-based tide gauges, which are severely restricted by space and number (Pan et al., 2022) [15]. It is obvious that temporal evolution of tides at point-based tide gauges cannot represent whole sea regions. Therefore, the purpose of this paper is to explore subseasonal tidal variations in the Gulf of Tonkin via the combination of four tide gauges and multi-satellite altimeter observations. The addition of satellite altimeter records can effectively solve the problem of scarce tide gauges in the Gulf of Tonkin and provide a basin-scale pattern of subseasonal tidal variability. This paper is structured as follows. Study domain and data are displayed in Section 2. Section 3 introduces the methodology for processing tide gauges and multi-satellite altimeters. Results, discussions and conclusions are given in Section 4, Section 5 and Section 6, respectively.
2. Study Area and Data
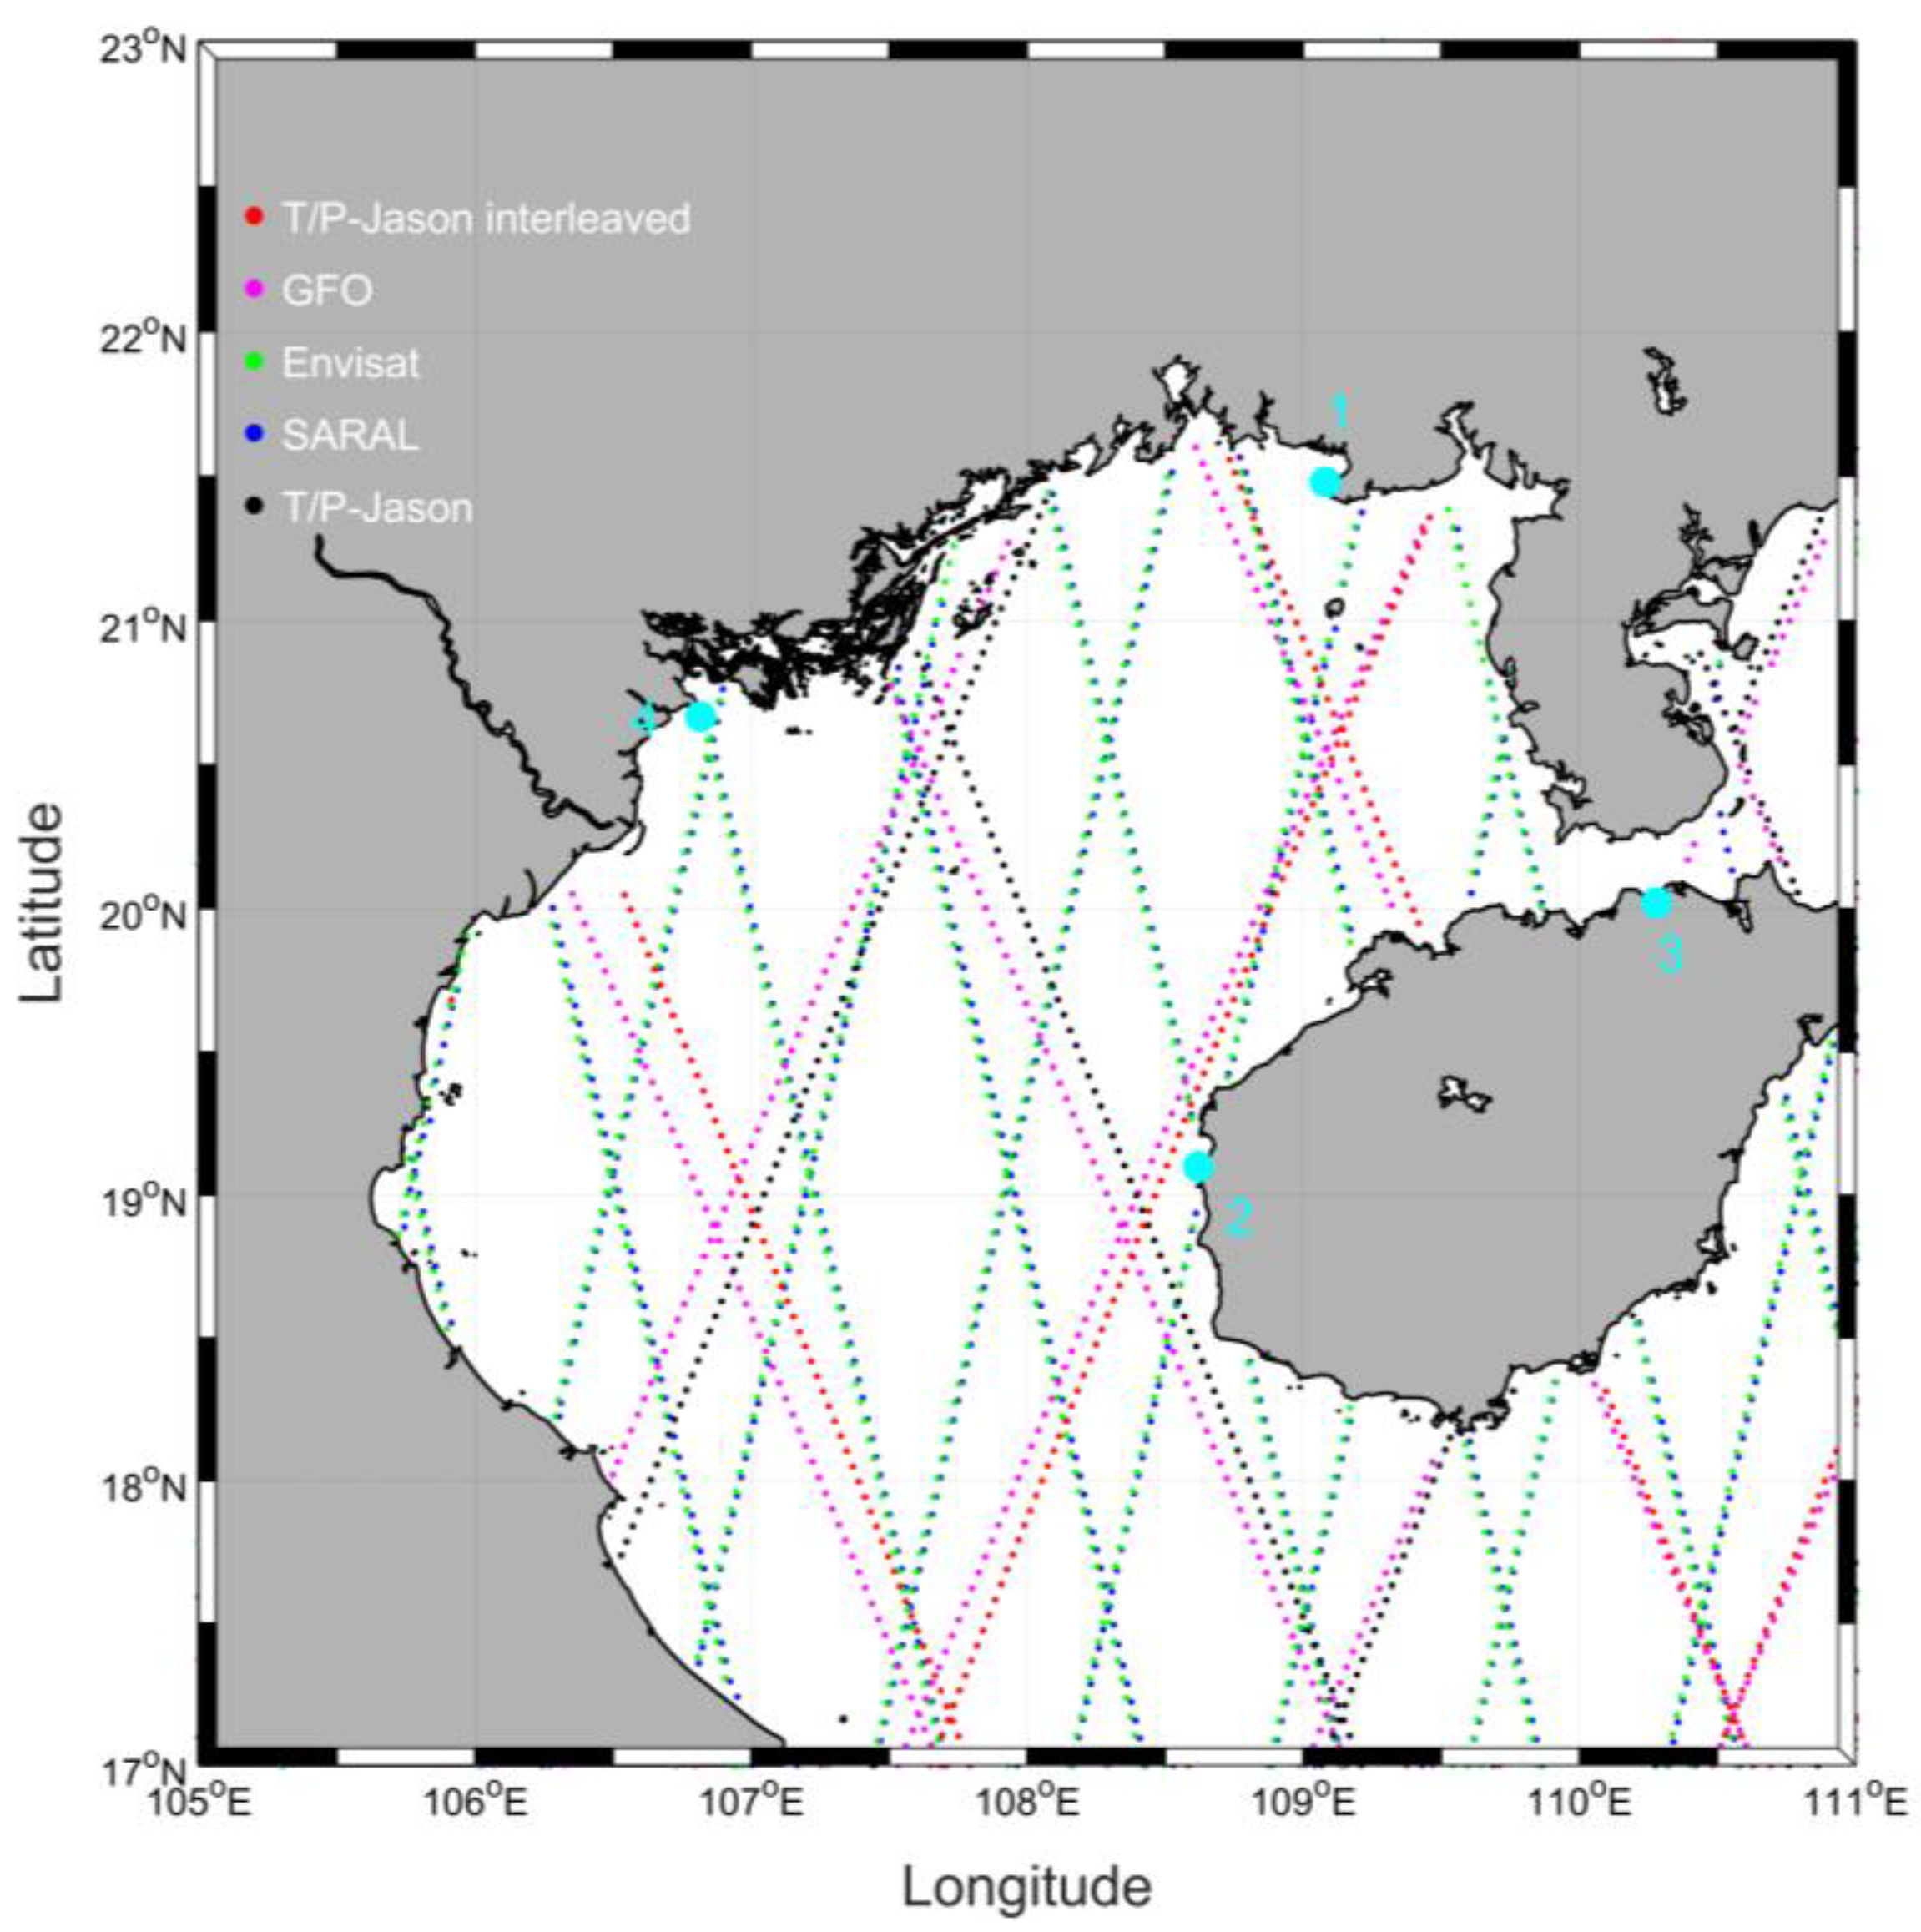
2.1. Study Area
The Gulf of Tonkin (Figure 1), also often called the Beibu Gulf, is a semi-enclosed gulf with an average water depth of ~42 m [15]. It plays an important role in fishery, navigation and aquaculture for China and Vietnam. At most sea areas in the Gulf of Tonkin, tidal form factors are larger than 3 (Figure 2a), which means that tides are diurnal. The tidal form factor is defined as the ratio of the sum of K1 and O1 amplitudes to the sum of M2 and S2 amplitudes [5,16]. Only at minor sea areas in the southern part of the Gulf of Tonkin, tidal form factors range from 1.5 to 3. This indicates that tides can be classified as the mixed, mainly diurnal form. Tidal ranges in the Gulf of Tonkin can reach ~5 m in the northern part (Figure 2b) due to abnormally large diurnal tides, caused by diurnal resonance with the resonant peak period of ~29 h [19]. Due to seasonally reversing monsoons, ocean environment and tides in the Gulf of Tonkin show significant seasonal variability [20].
Figure 1.
Topography of the Gulf of Tonkin, based on ETOPO1 dataset [21].
Figure 2.
(a) Tidal form factors (b) Tidal ranges (unit: m) in the Gulf of Tonkin. Tidal constants are derived from EOT20 model (Hart-Davis et al., 2021) [22].
2.2. Data
The University of Hawaii Sea Level Center (UHSLC) provides four hourly tide gauges in the Gulf of Tonkin (Table 1). All available tide gauge records were observed before 1998. At Hondau, water levels were recorded in 1960. Three Chinese tide gauges are longer than 18.61 years, while Hondau only provides one-year data. At all tide gauges, data completeness exceeds than 99.80%.
Table 1.
Details for four hourly tide gauges in the Gulf of Tonkin.
In consideration of the scarcity of tide gauges in the study domain, additional 27-year multi-satellite altimeter records are analyzed, including Topex/Poseidon (T/P), Jason-1, Jason-2, Jason-3, Saral/Altika, Envisat, Geosat Follow-On (GFO), and the interleaved T/P-Jason series (Figure 3). The details of the analyzed satellite altimeters are listed in Table 2. These satellite observations are all processed by X-TRACK software to improve their accuracy in the shallow sea areas [23]. Previous studies [24] have indicated that X-TRACK products can detect tidal evolution at the order of centimeters in coastal zones. The length of records (LORs) for all missions, except the T/P-Jason series, are shorter than 10 years. Also, the sampling period of T/P-Jason series is the shortest among these missions, which means that main tidal constituents can be well resolved. For other missions, due to the limitations of short LORs and long sampling periods (Table 2), some main tidal constituents cannot be resolved. For example, the sampling period for Envisat is 35 days, exactly 70 times as long as the period of S2 tide (12 h), which means that S2 tides cannot be resolved by Envisat records. The aliasing periods of K1 and P1 tides are very close to Sa tide in Envisat (Table 3), which makes K1, P1, and Sa tides indistinguishable. Therefore, it is obvious that the T/P-Jason series are the backbone of this research.
Figure 3.
The ground tracks of multi-satellite altimeters and the locations of four long-term tide gauges (lightcyan dots) in the Gulf of Tonkin. 1, 2, 3, 4 represent Beihai, Dongfang, Haikou, and Hondau, respectively.
Table 2.
Details for analyzed satellites in this research.
Table 3.
Main tidal constituents and their nodal satellite constituents resolved by multi-satellite altimeter data. The first Doodson number means tidal species (4 represents quarter-diurnal tide, 2 represents semi-diurnal tide, 1 represents diurnal tide, 0 represents long-period tide) [15]. Alias periods are calculated using s_alias function in S_TIDE toolbox [2,15].
3. Methods
3.1. Harmonic Analysis for Tide Gauges
We divide tide gauge observations into monthly sections which are subjected to classical harmonic analysis at weekly time steps via S_TIDE [2]. As a newly proposed tidal harmonic analysis toolbox based on T_TIDE [25], S_TIDE has been widely used in exploring multi-timescale tidal variations [3,8]. According to the Rayleigh criterion, S_TIDE can resolve 29 tidal constituents from one month of data. Theoretical nodal factors and nodal angles are applied to correct 18.61-year nodal cycles in tidal amplitudes. Note that resolving P1 from K1 needs at least half a year of data. As such, we infer P1 from K1 in the course of harmonic analysis based on the equilibrium tide theory (see Figure A1 in the Appendix A for details). Such an inference is reasonable because the relationship between P1 and K1 tides is highly consistent with theory in the Gulf of Tonkin [15]. After obtaining weekly tidal amplitudes, Equation (1) is applied to extract subseasonal tidal variability.
where Hj(t) is the weekly tidal amplitude for tidal constituent j at time t. C0 is a constant and C1 is the long-term trend. C2,i and C3,i are the amplitudes of the cosine and sine terms of the cycle with the period of Ti, respectively. The cycles in Equation (1) include 1, 1/2, 1/3, 1/4, 1/5 years. Considering the deviation between actual and theoretical nodal modulations in the Gulf of Tonkin [12,14], Equation (1) additionally includes the 18.61-year cycle to remove residual nodal cycles in tidal amplitudes at Beihai, Dongfang and Haikou. We only focus on the subseasonality of three largest tidal constituents, namely, M2, K1 and O1 in this study. For comparison, the results of tidal seasonality are also displayed. If the signal-to-noise ratio (SNR) of the cycle exceeds two, this cycle is significant [25].
3.2. Harmonic Analysis for Satellite Altimeters
Different from that for tide gauges, the process for satellite altimeters is more complex due to tidal aliasing having originated from long sampling periods. As shown in Table 3, M2 tides (~0.5175 days) are folded into low-frequency water level fluctuations with periods of 62.076 days and 94.487 days in T/P-Jason and Envisat records, respectively. Like Piccioni et al. (2021) [26], we divide multi-satellite altimeter records into overlapping circular blocks. The circular block has a radius of 0.3° and water level observations in each block are independently subjected to weighted harmonic analysis. The Gaussian weights are calculated based on the distances to the analyzed point [15,22]. The main tidal constituents and their nodal satellite constituents, shown in Table 3, are resolved by multi-satellite altimeter records. A total of 23 seasonal and subseasonal tidal constituents shown in Table 4 are also resolved. O1−5Sa and O1+5Sa tides have the frequencies of wO1 − 5wSa and wO1 + 5wSa, where wO1 and wSa represent the frequencies of O1 and Sa constituents. The sum of O1−5Sa and O1+5Sa tides is the penta-annual cycle of O1 tides.
Table 4.
Seasonal and subseasonal tidal constituents resolved by multi-satellite altimeter data. Alias periods are calculated using s_alias function in S_TIDE toolbox [2,15].
Other subseasonal and seasonal tides are named in similar ways. Some subseasonal constituents (i.e., K1+5Sa, K1+4Sa, K1+3Sa, M2−3Sa, M2−4Sa, M2−5Sa) cannot be resolved because their aliasing periods are too close. For example, the aliasing periods of K1+5Sa and M2−3Sa tides are 126.275 days and 126.648 days in T/P-Jason records, respectively. Based on the Rayleigh criterion, at least 117.47-year records are needed to fully resolve K1+5Sa and M2−3Sa tides. Also, it should be noted that K1−2Sa tide is P1 tide. To clear up artifacts induced by background noises, such as mesoscale ocean variability and observation errors, two criteria should be met: (1) Missing values should be fewer than 20% and at least 7 T/P-Jason observation points should be located in the circular block. This criterion can ensure that water level records are sufficient enough to resolve tidal constituents listed in Table 3 and Table 4 and reduce the potential errors of tidal amplitudes. (2) For satellite altimeter records, due to the existence of tidal aliasing, SNR should be no less than four.
4. Results
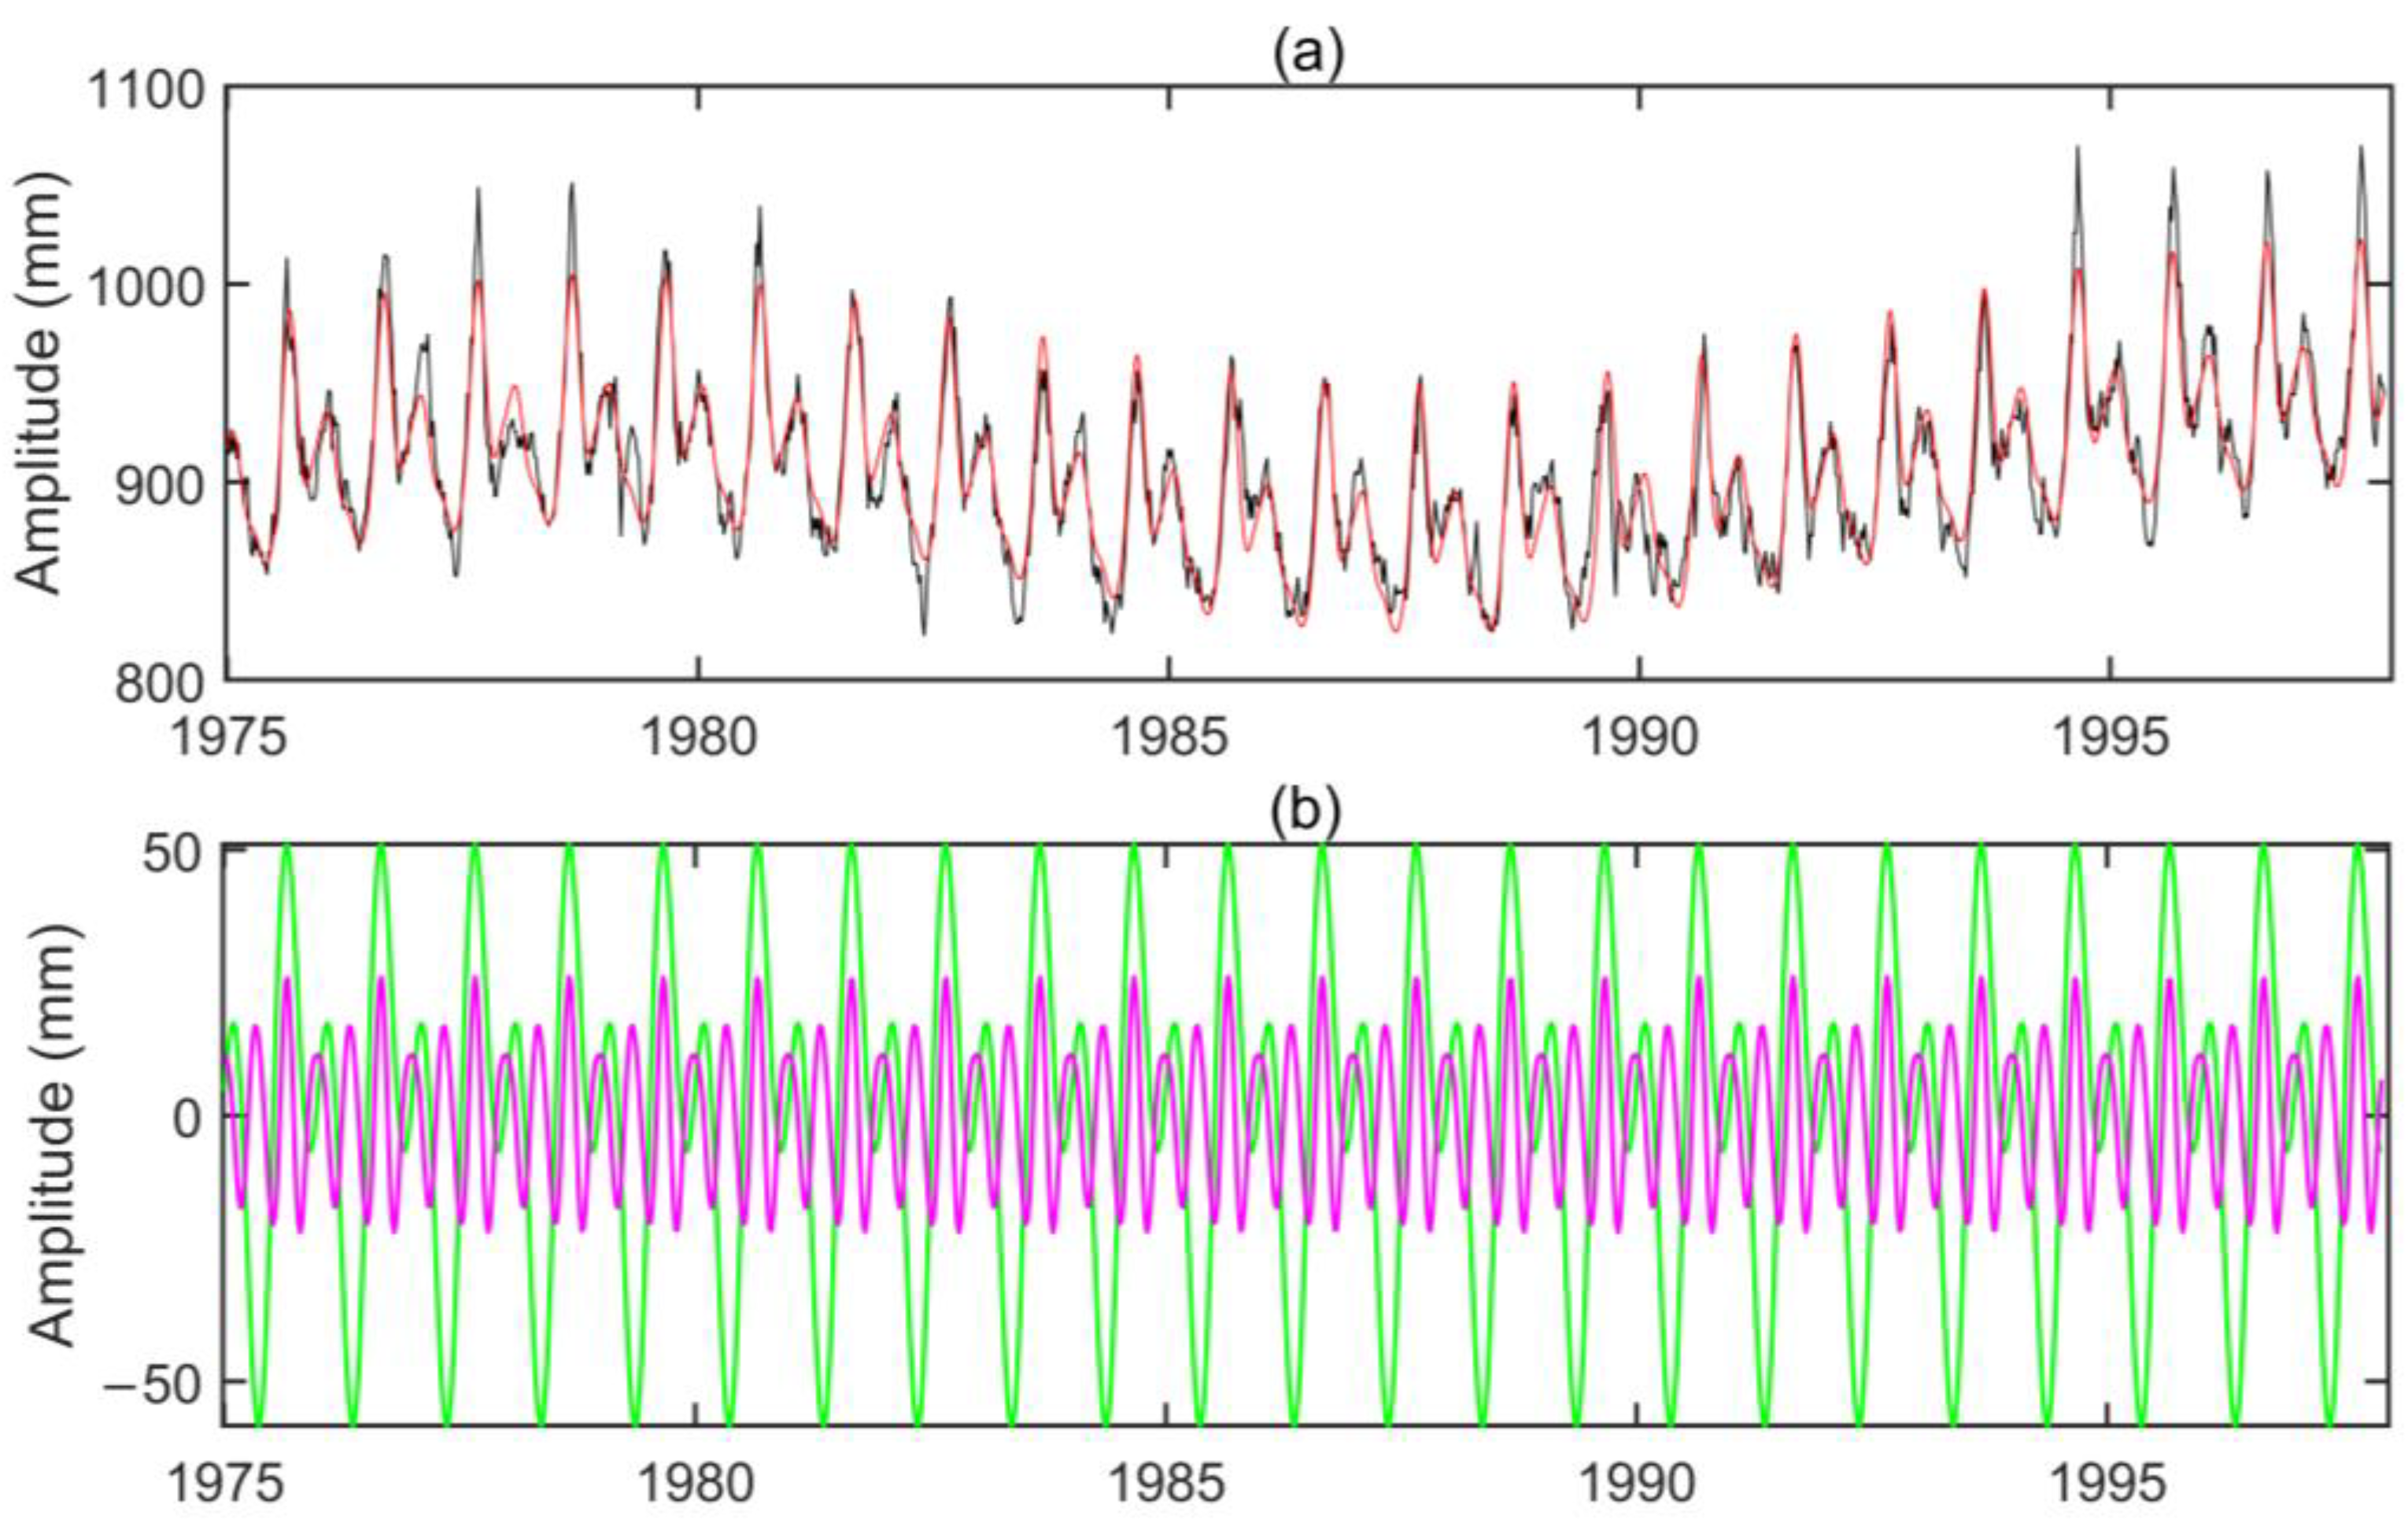
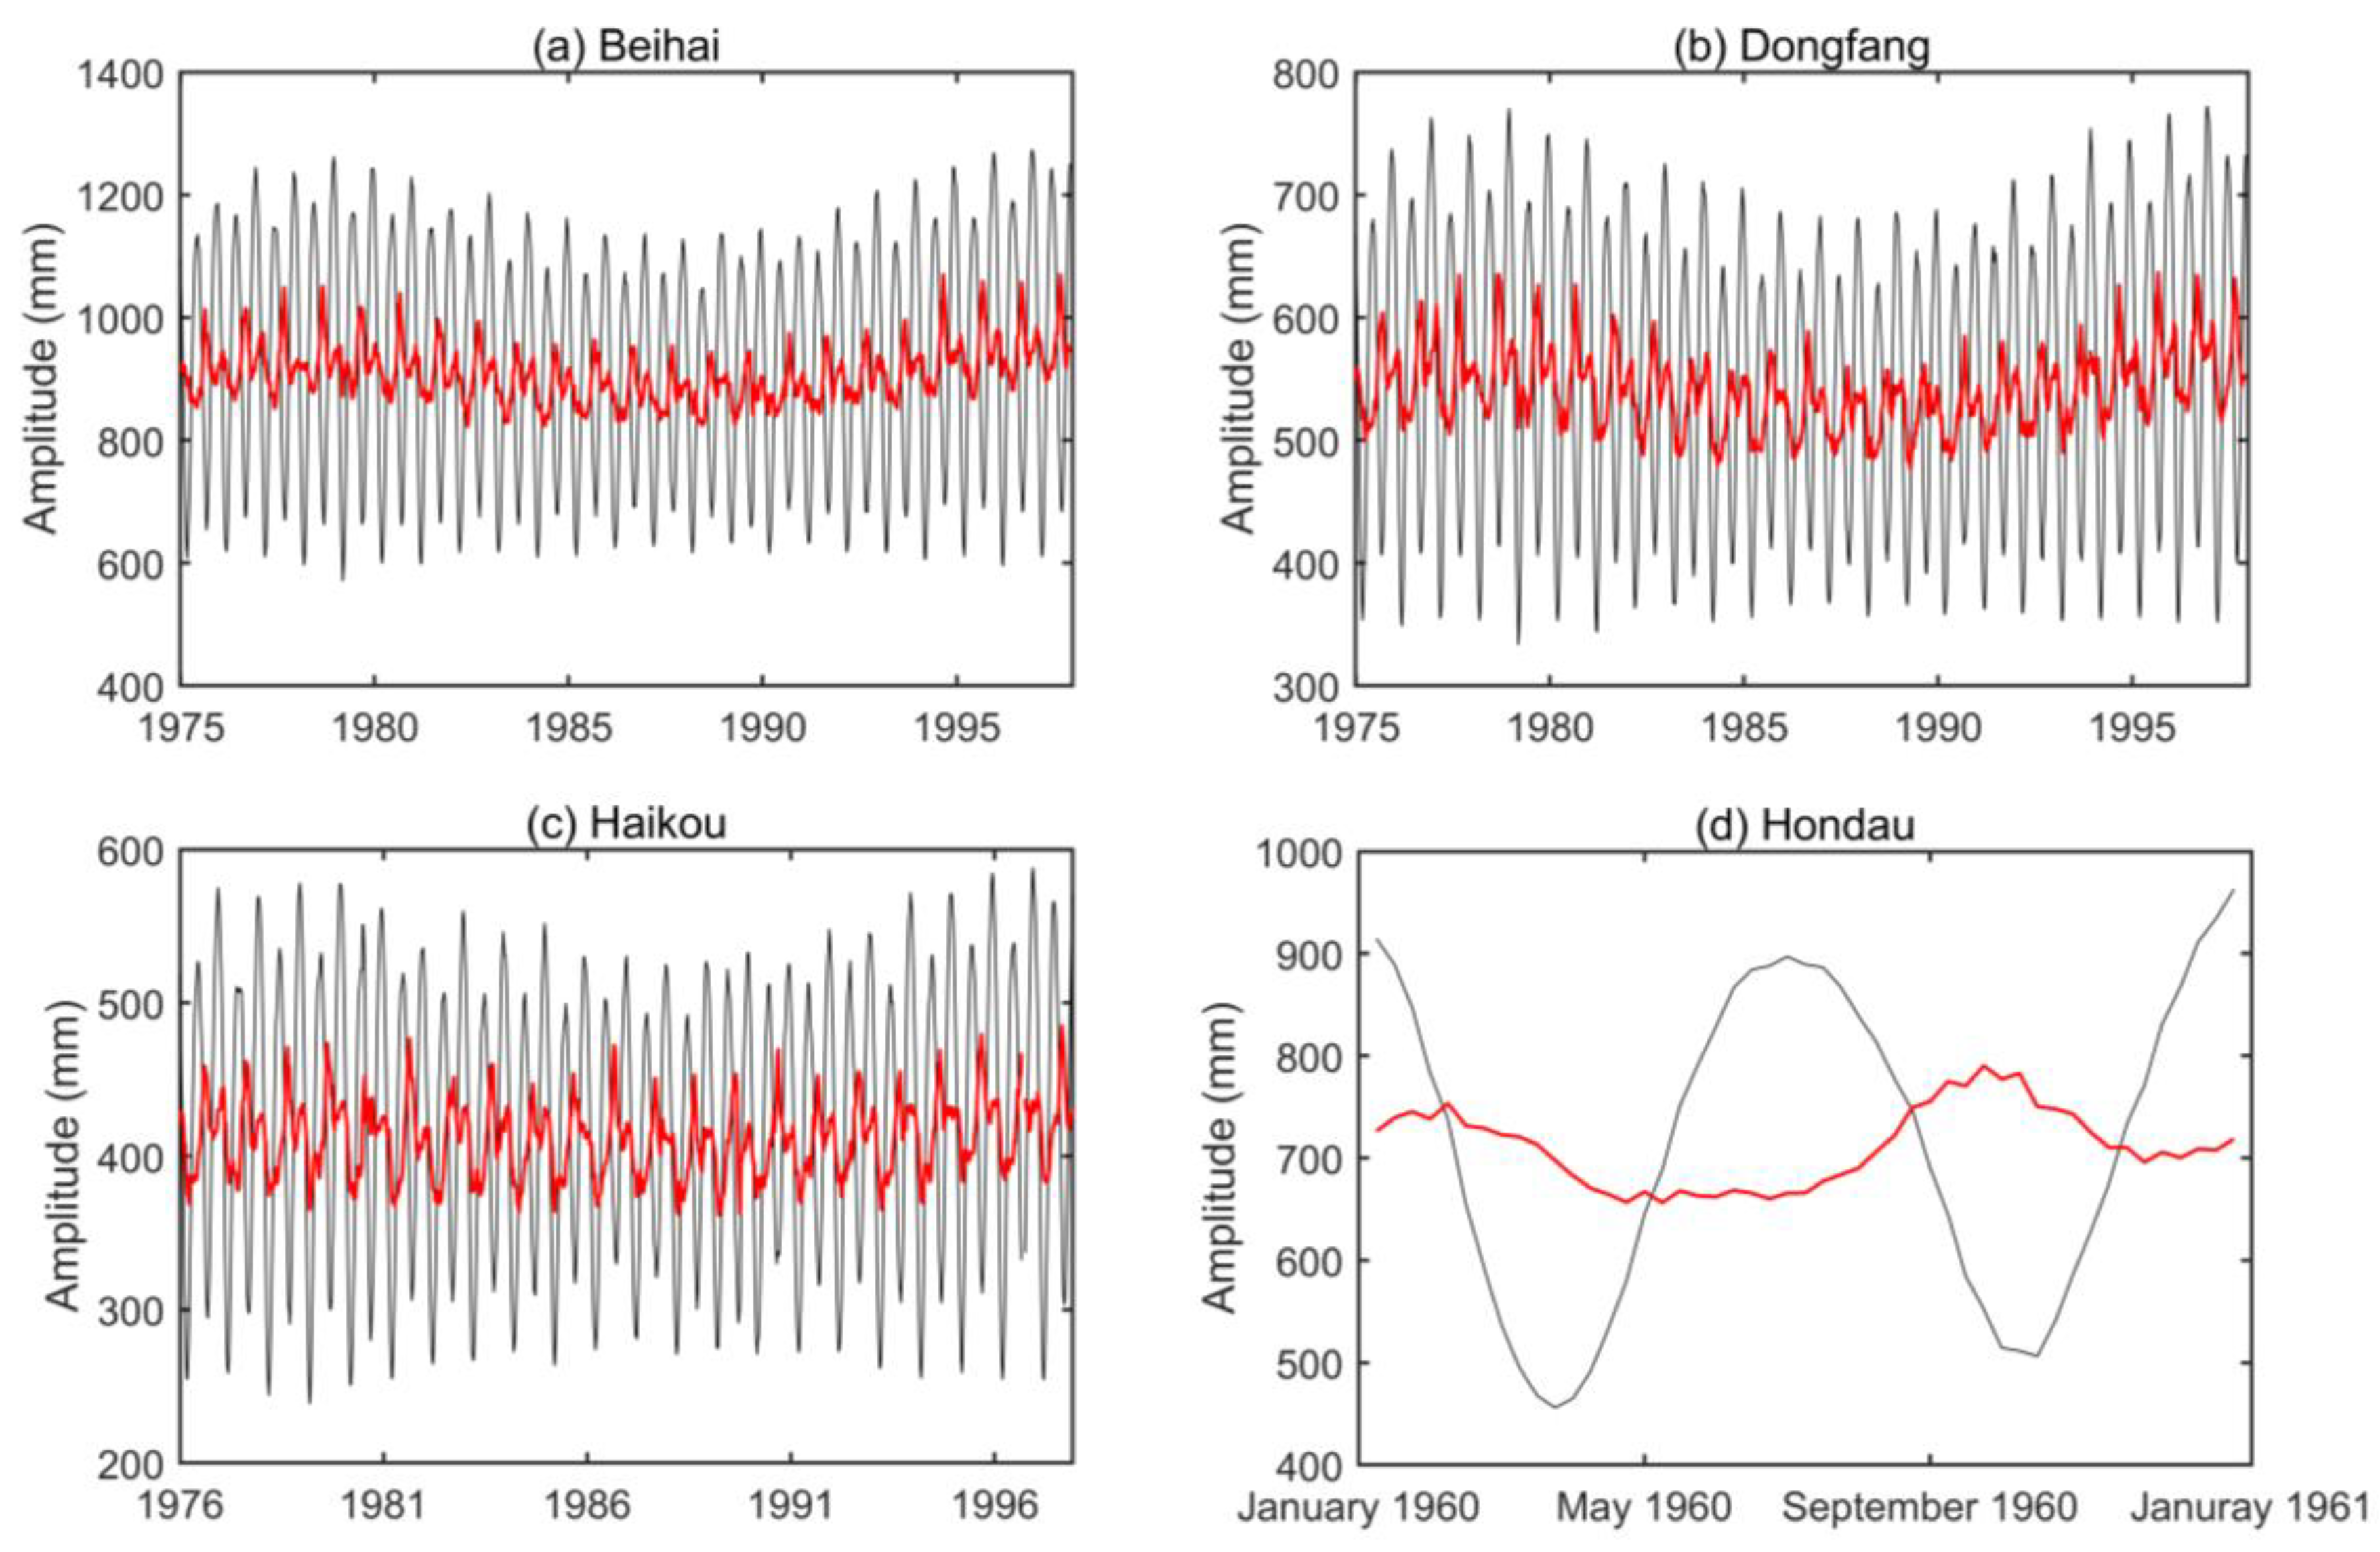
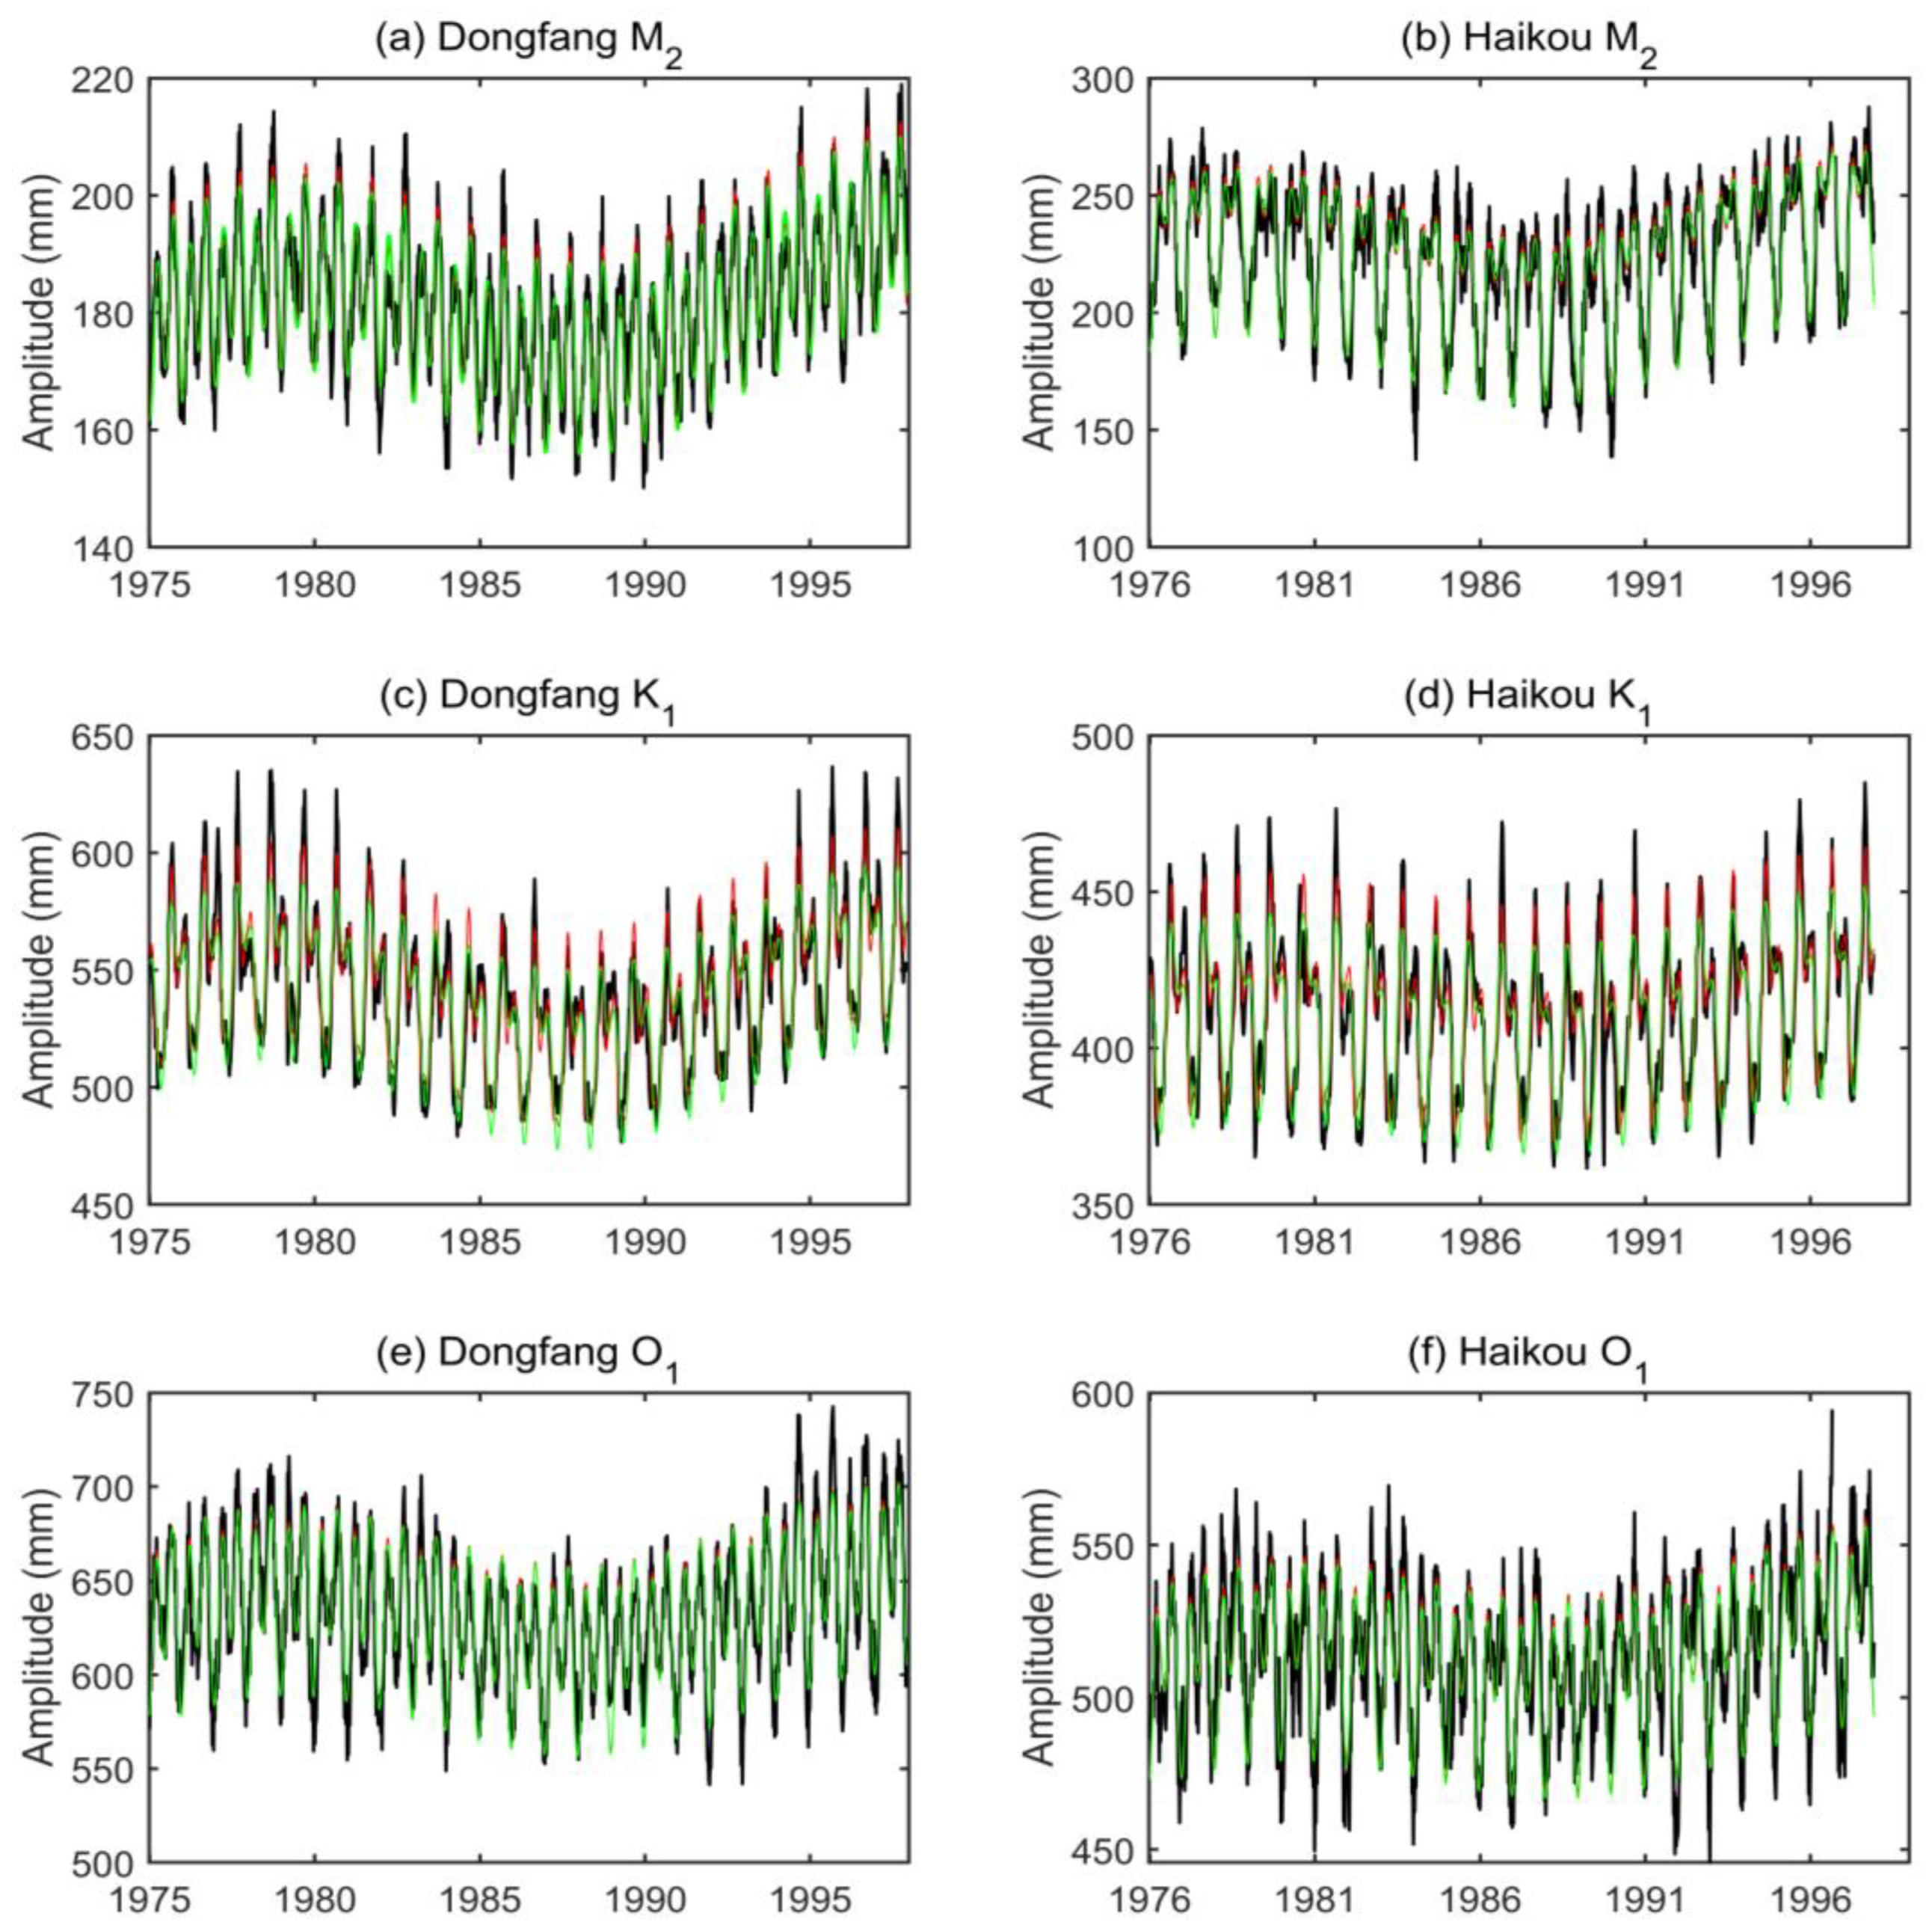
4.1. Subseasonal Tidal Variability from Tide Gauges
The amplitudes of the subseasonal cycles in M2, K1 and O1 amplitudes are displayed in Table 5. Although the amplitudes of the subseasonal cycles are noticeably smaller than those of seasonal cycles, subseasonal variations are significant at all tide gauges. The maximum amplitude of the semi-annual cycle can reach 66.1 mm at Hondau, while the maximum amplitude of the ter-annual cycle can reach 18.1 mm at Beihai (Table 5). In general, the amplitudes of the ter-annual cycle are larger than those of the quarter-annual and penta-annual cycles, especially for K1 tide. Due to short LOR (one year), the amplitude errors at Hondau are significantly larger than those at Beihai, Dongfang, and Haikou.
Table 5.
The amplitudes and errors (unit: mm) of the seasonal and subseasonal cycles in tidal amplitudes at Hondau, Beihai, Dongfang and Haikou. Amplitude errors are obtained based on 95% confidence intervals [15]. Statistically insignificant results are labeled by underlining.
Figure 4a shows the observed and fitted weekly K1 amplitudes at Beihai, while results at Dongfang and Haikou are shown in the Figure A2 in the Appendix A. The fitted K1 amplitudes used in Equation (1) can explain more than 85% of the signal variance, indicating the reliability and effectiveness of Equation (1). Seasonal modulations can change K1 amplitudes by 50 mm, while subseasonal modulations can change K1 amplitudes by 20 mm (Figure 4b). As displayed in Figure 5, without consideration of subseasonal variations, the fitted K1 and M2 amplitudes at Hondau noticeably deviate from the observed amplitudes. In a word, the results of four tide gauges indicate that subseasonal tidal modulations play a non-negligible role in total tidal variability. In Section 4.3, we will show the spatial pattern of subseasonal tidal variability based on satellite altimeters.
Figure 4.
(a) The observed (black line) and fitted (red line) weekly K1 amplitudes at Beihai. (b) Seasonal (green line) and subseasonal (pink line) variations in K1 amplitudes at Beihai.
Figure 5.
(a) The observed (black line) and fitted (red line) weekly M2 amplitudes at Hondau. Green line represents the fitted results without subseasonal cycles. (b) Same as (a), but for K1 tide.
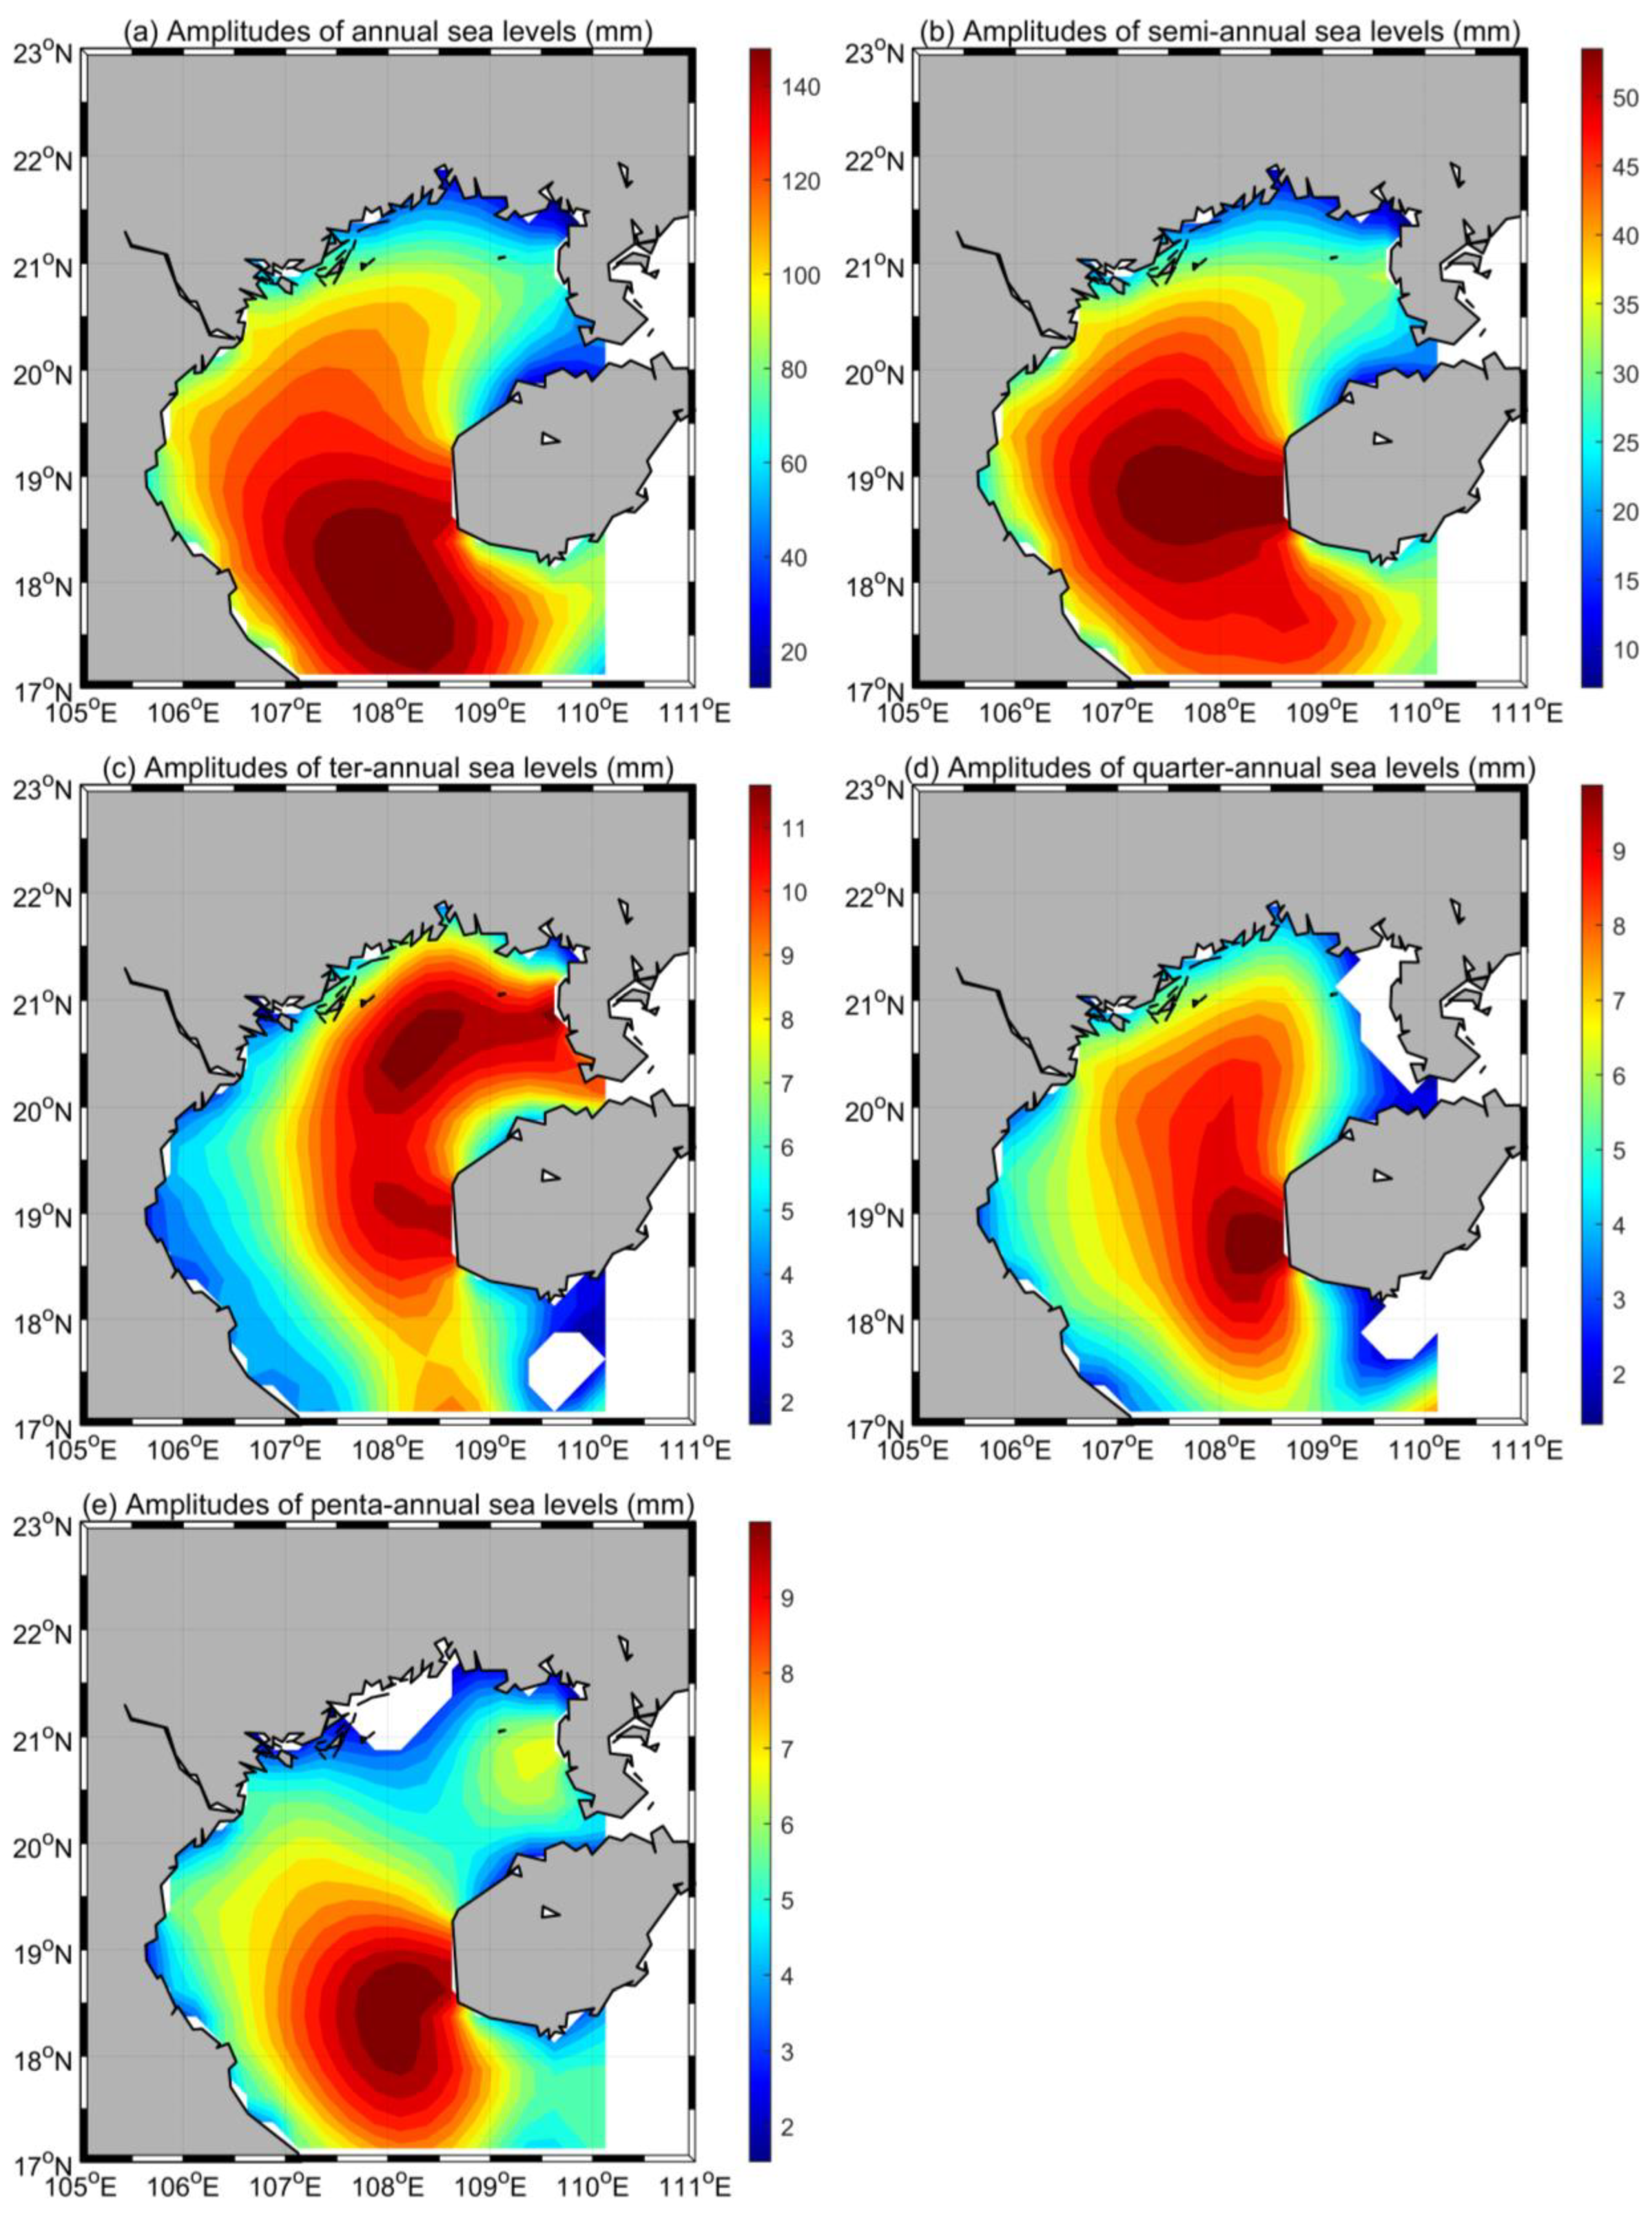
4.2. Seasonal Tidal Variability from Satellite Altimeters
Figure 6 describes the spatial patterns of M2, S2, K1 and O1 amplitudes in the Gulf of Tonkin based on multi-satellite altimeter records, which is highly consistent with previous studies [15,19]. Semi-diurnal tides are much smaller than diurnal tides in the Gulf of Tonkin. The largest M2 amplitude would be about 40 cm, while the maximum O1 and K1 amplitudes can exceed 90 cm and 80 cm, respectively. The spatial pattern of O1 amplitudes is highly consistent with that of K1 amplitudes. O1 amplitudes are slightly larger than K1 amplitudes due to local resonance. Note that valid amplitudes which meet the proposed criteria are generally close to T/P-Jason ground tracks.
Figure 6.
Estimated tidal amplitudes (unit: cm) in the Gulf of Tonkin from multi-satellite altimeter observations (a) M2 (b) S2 (c) O1 (d) K1.
The semi-annual cycles of O1 tides are much stronger than the annual cycles, which is strongly consistent with tide gauges (Figure 7 and Table 5). The maximum amplitude of O1+2Sa tide can reach 58.8 mm in the east of the Gulf of Tonkin (Figure 7b). By contrast, the maximum amplitudes of O1−Sa and O1+Sa tides are no larger than 23.0 mm (Figure 7c,d). The seasonal variations in M2 tides are weaker than those of O1 tides, especially for the semi-annual cycles. The maximum amplitude of M2+2Sa tide is 28.0 mm in the north of the Gulf of Tonkin (Figure 8b). The annual cycles of K1 tides are noticeably larger than those of the O1 tides in the Gulf of Tonkin (figure not shown). The amplitudes of K1−Sa tide can reach 41.7 mm at most in the Gulf of Tonkin.
Figure 7.
Estimated tidal amplitudes (unit: mm) in the Gulf of Tonkin from multi-satellite altimeter observations (a) O1−2Sa (b) O1+2Sa (c) O1−Sa (d) O1+Sa.
Figure 8.
Estimated tidal amplitudes (unit: mm) in the Gulf of Tonkin from multi-satellite altimeter observations (a) M2−2Sa (b) M2+2Sa (c) M2−Sa (d) M2+Sa.
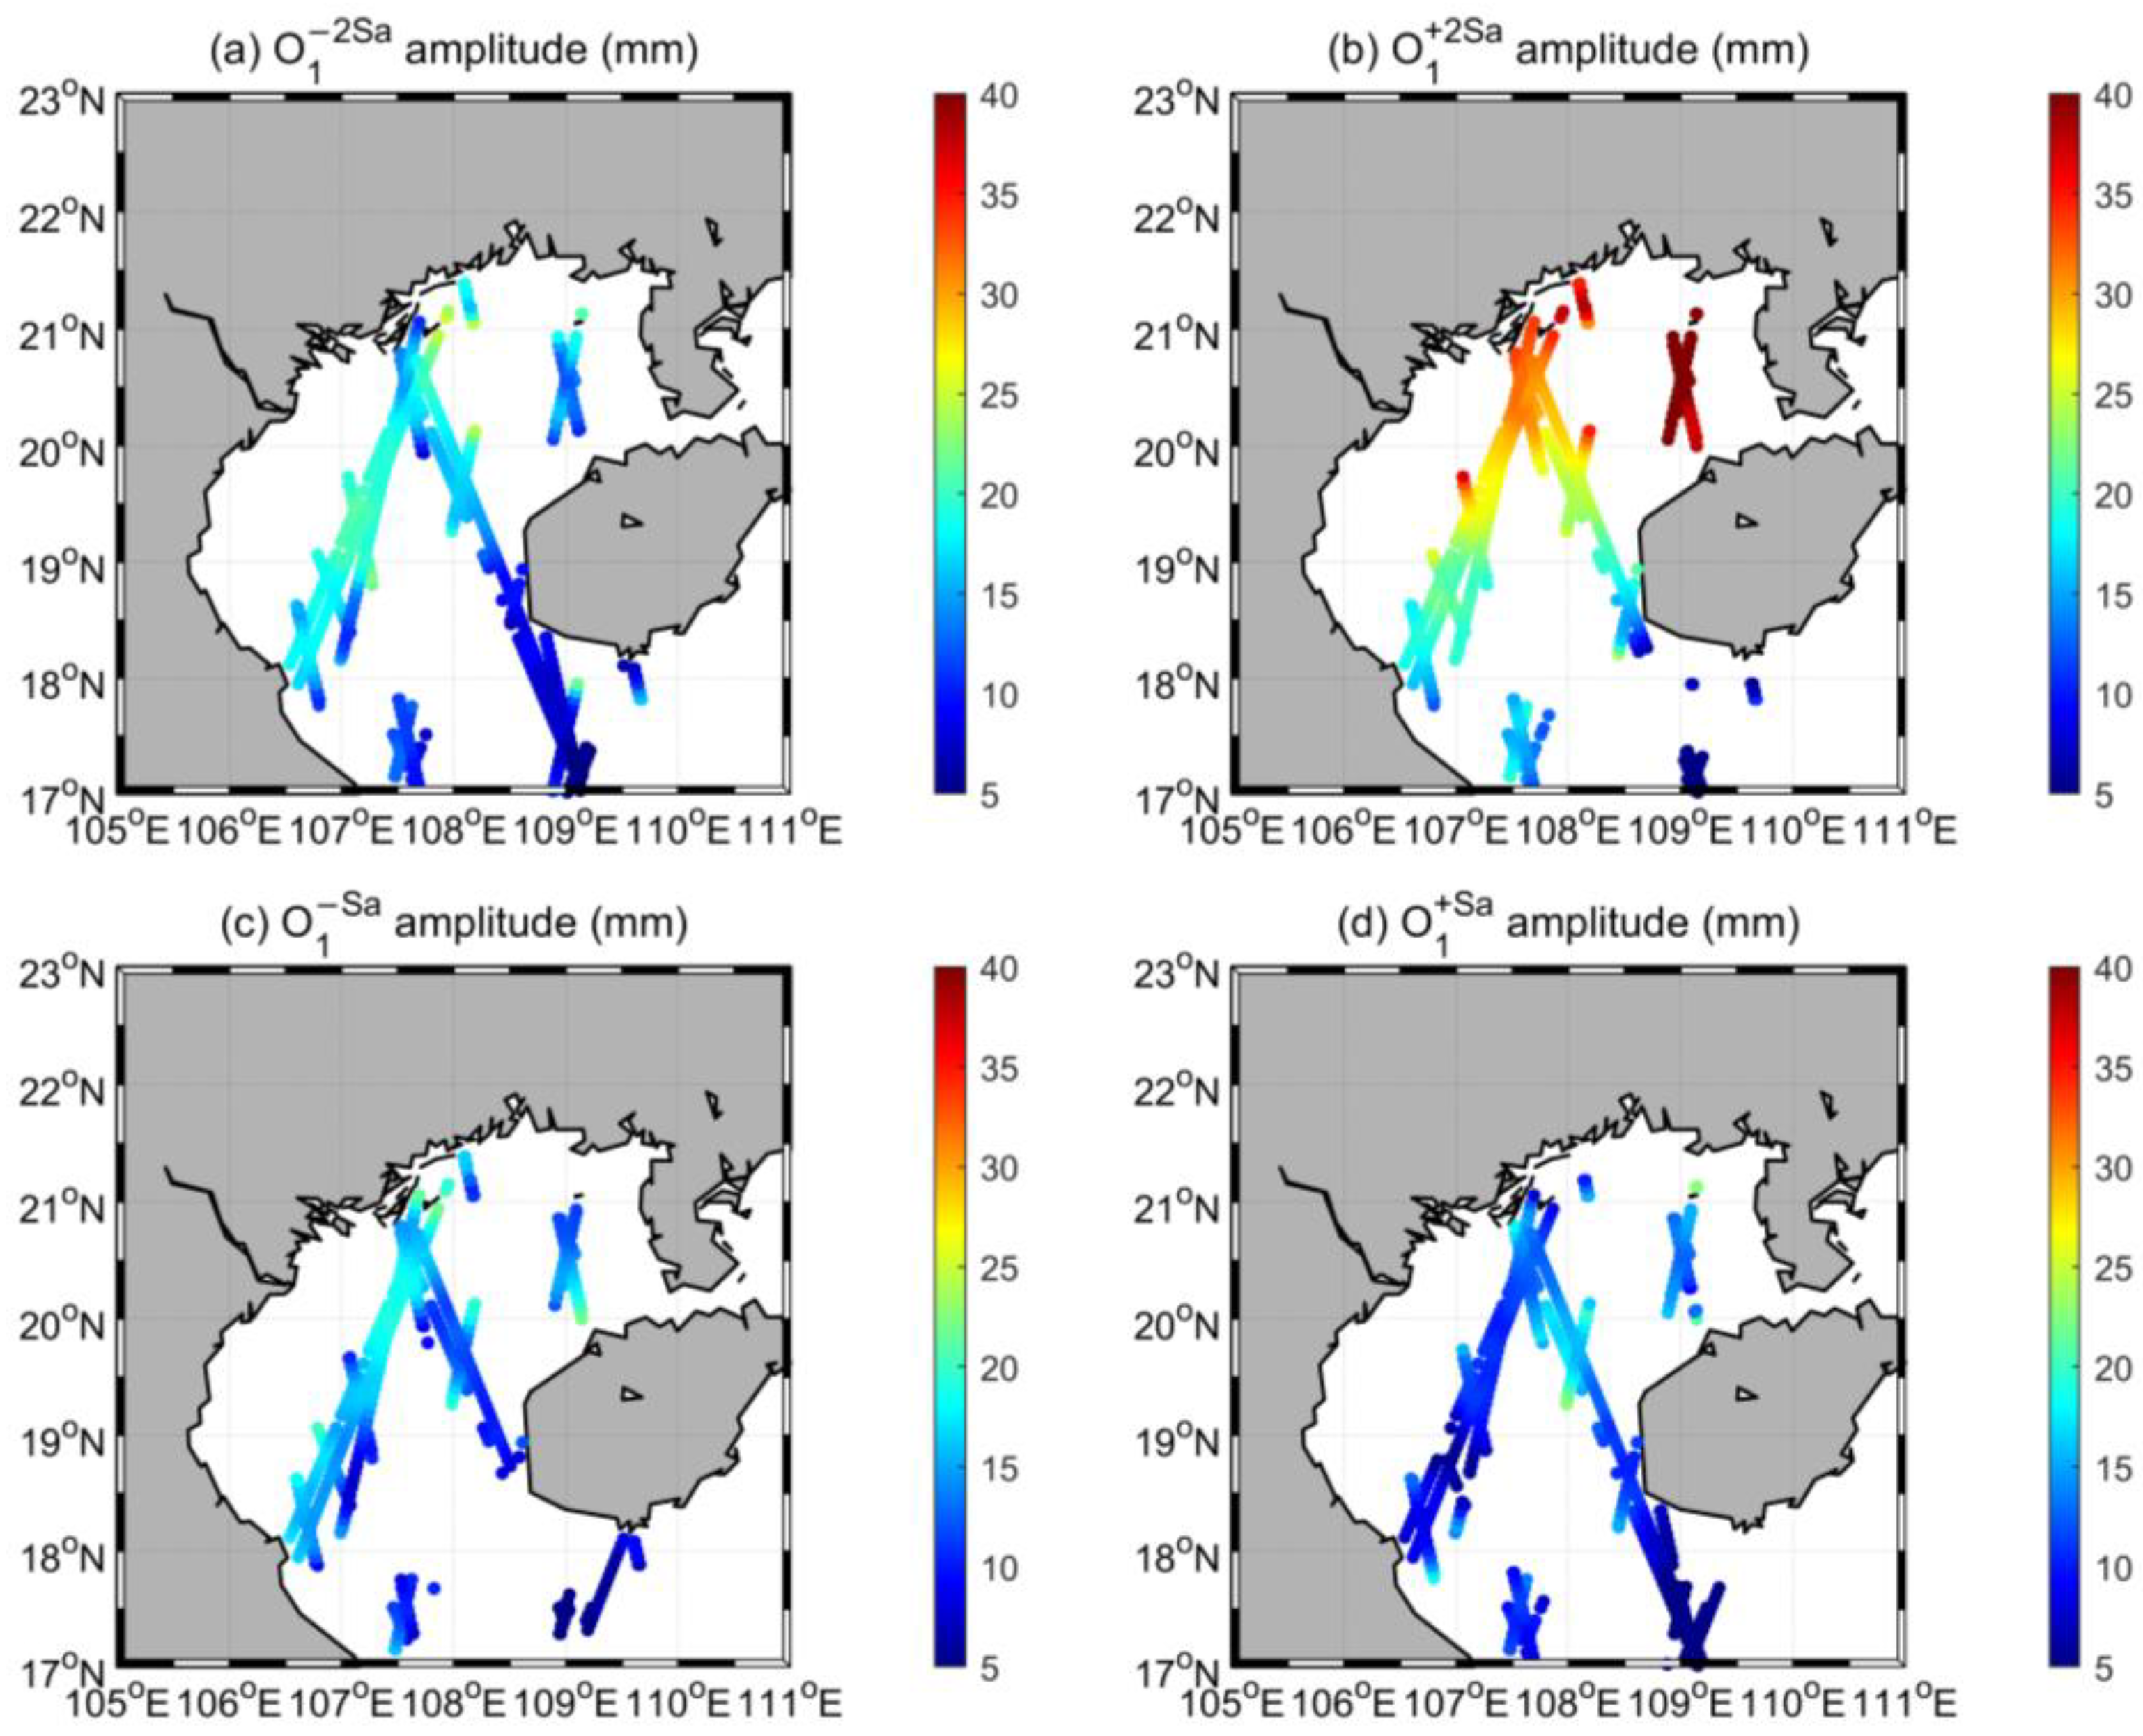
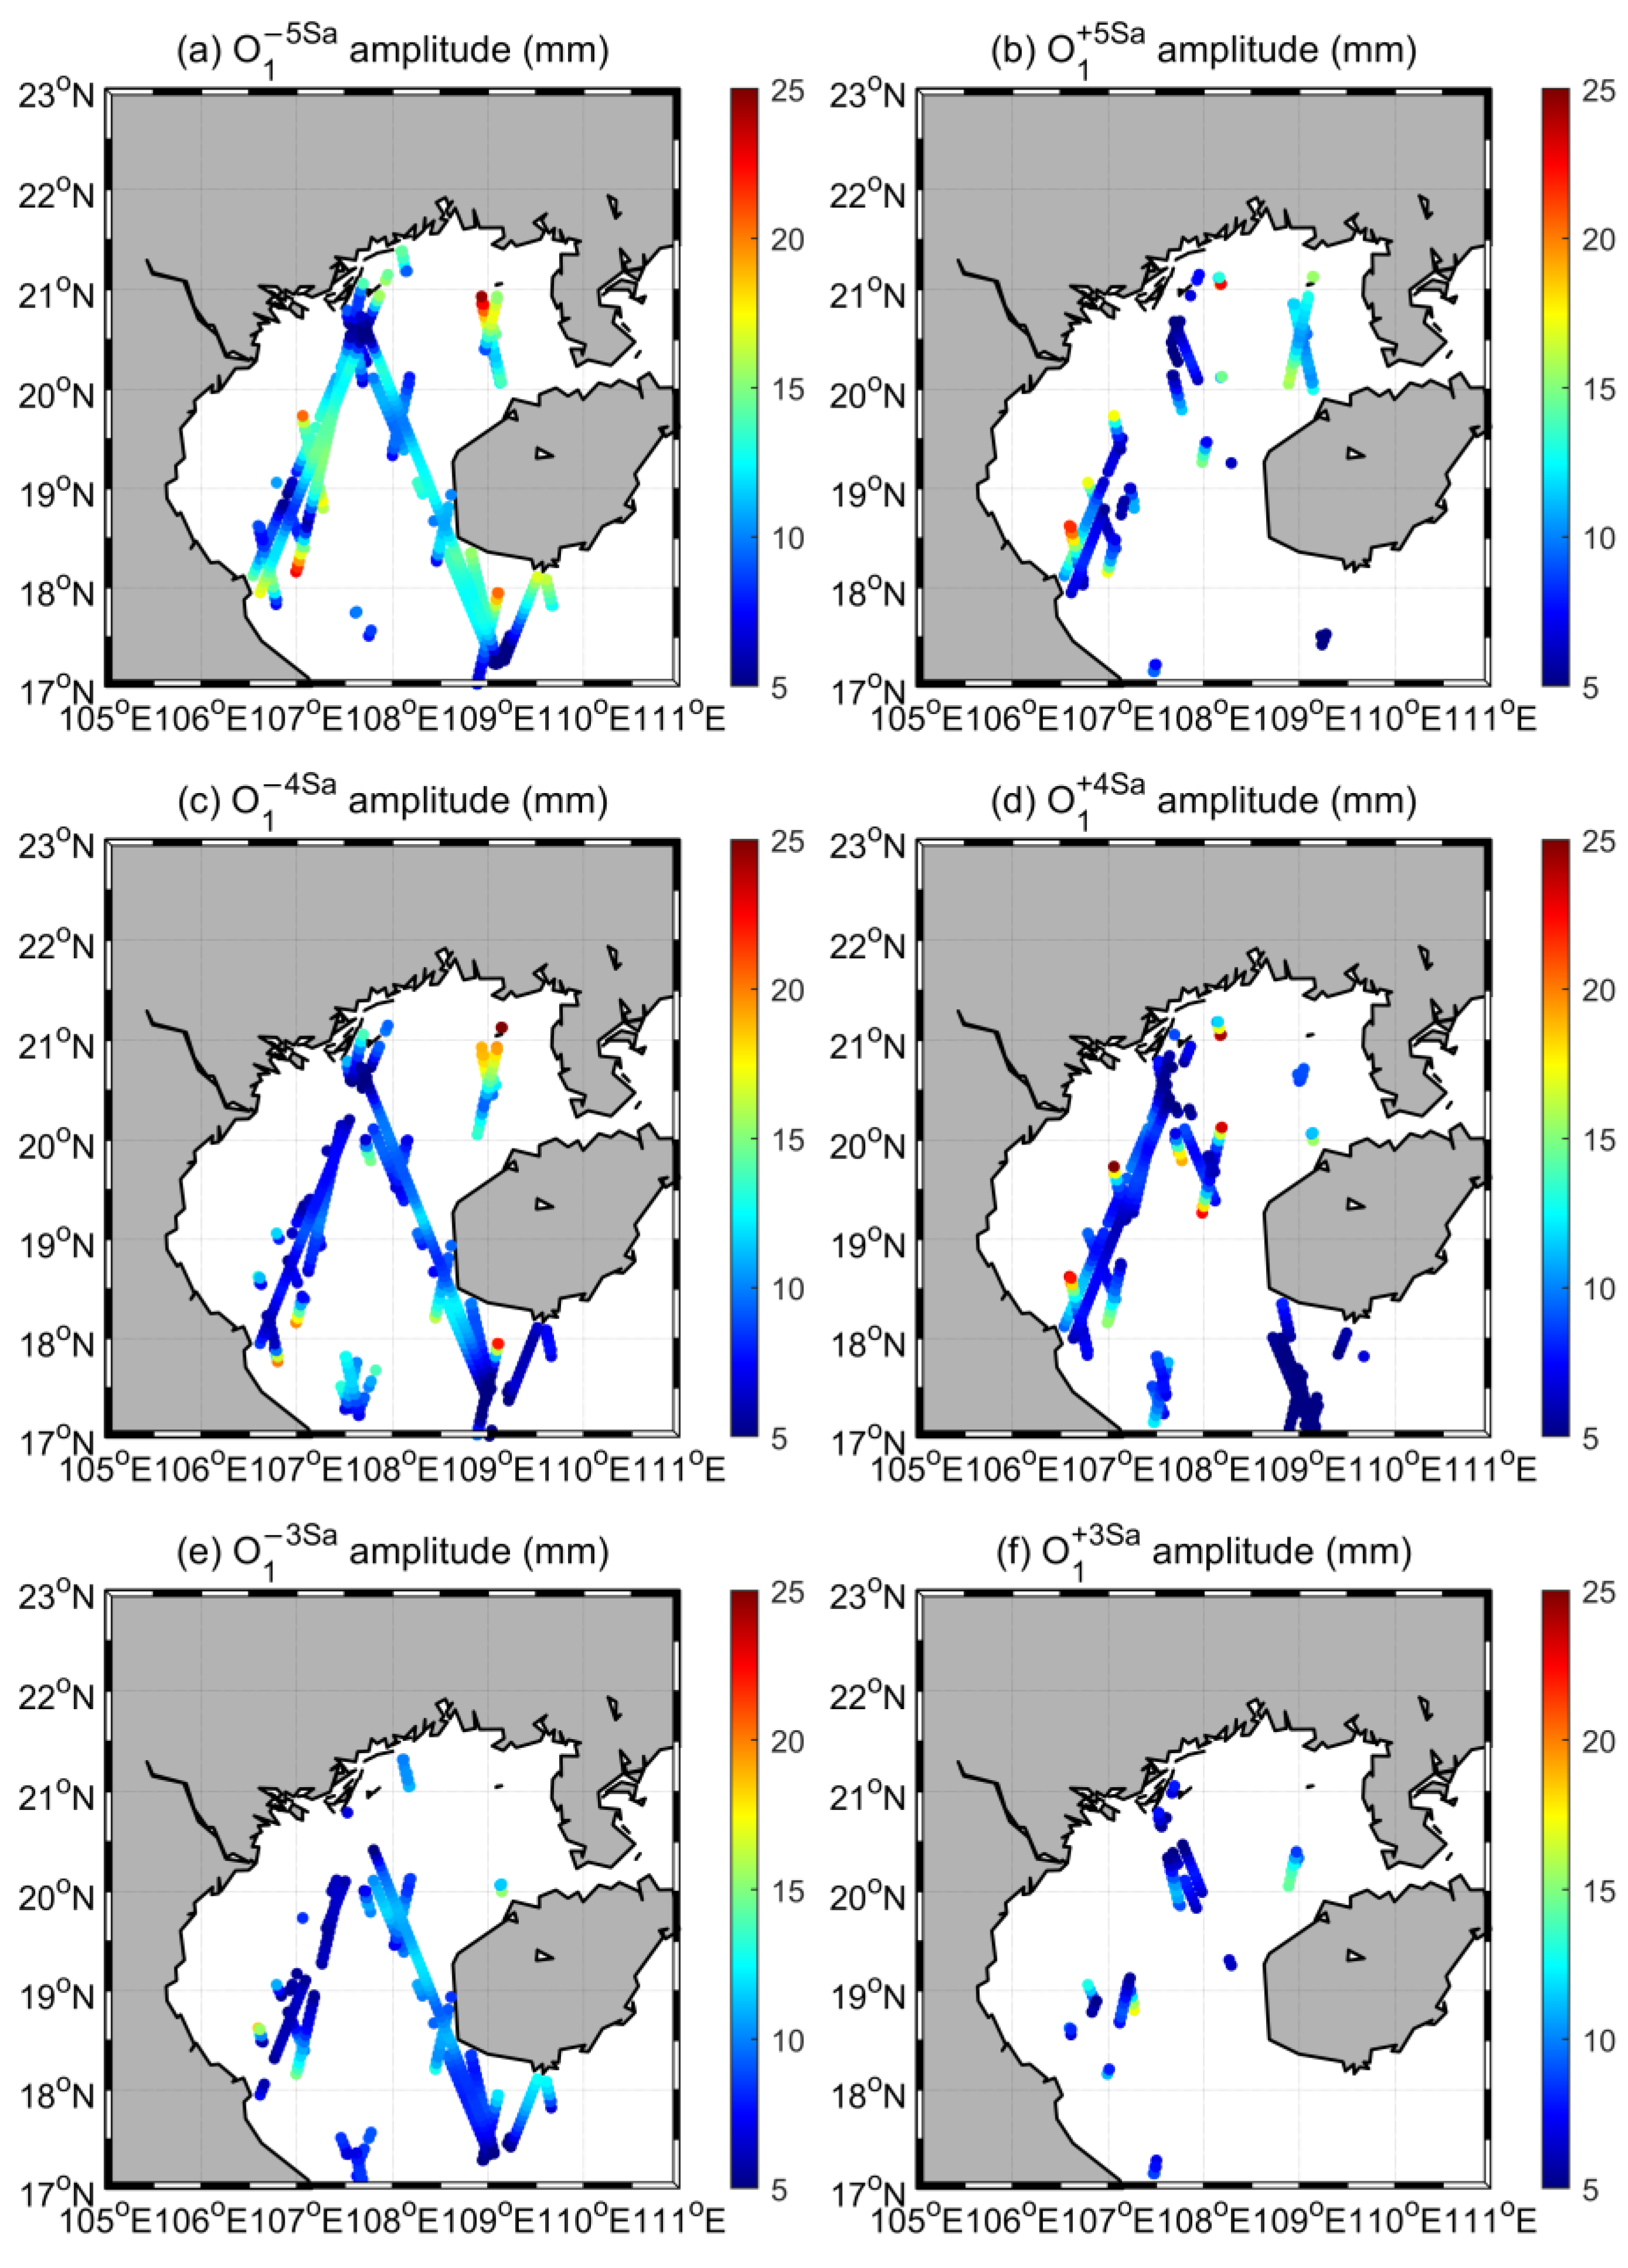
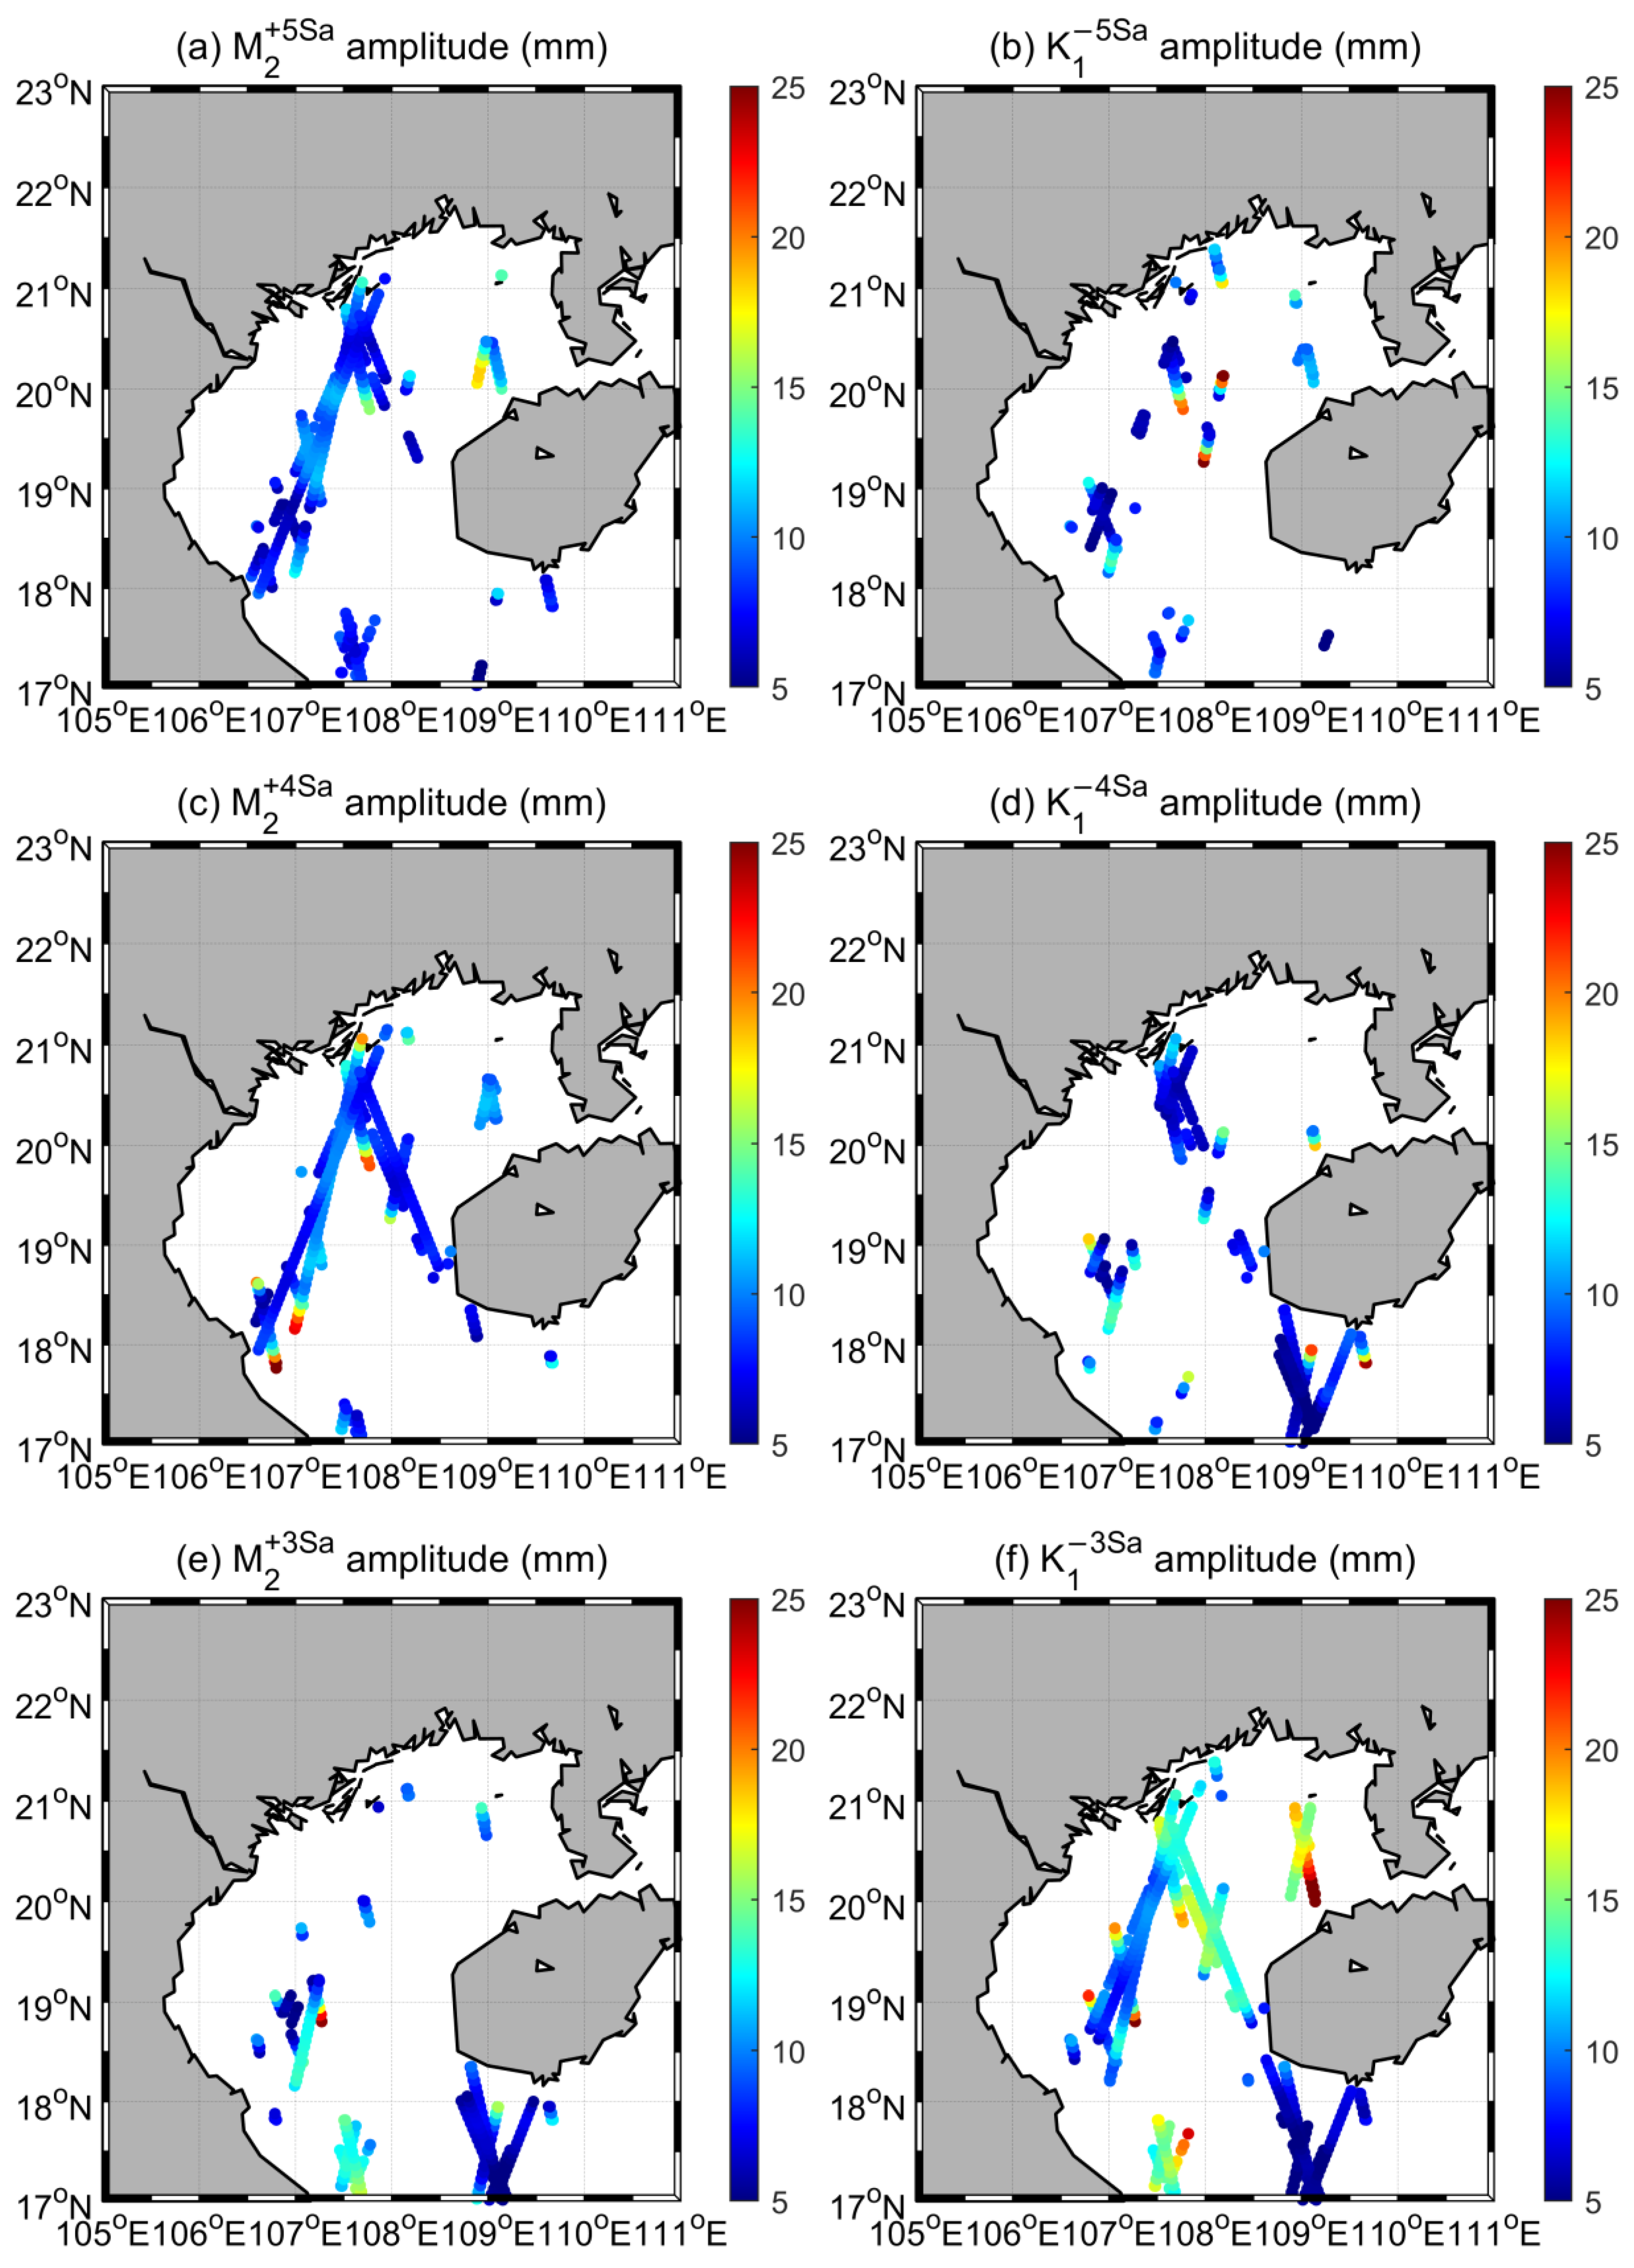
4.3. Subseasonal Tidal Variability from Satellite Altimeters
The spatial patterns of the amplitudes of subseasonal constituents are displayed in Figure 9 and Figure 10. Both tide gauges and satellite altimeter data indicate that subseasonal modulations are significant, but much weaker than seasonal modulations. The spatially averaged amplitudes of O1−5Sa, O1+5Sa, O1−4Sa, O1+4Sa, O1−3Sa, and O1+3Sa in the Gulf of Tonkin, extracted from multi-satellite altimeter data, are 11.6 mm, 10.0 mm, 9.2 mm, 8.0 mm, 8.6 mm, 8.4 mm, respectively. Generally, for O1 tides, penta-annual modulations are stronger than ter-annual and quarter-annual modulations. The O1−5Sa tide has the maximum number (582) of observation points which have valid amplitudes, while the O1+3Sa tide has the minimum number (97). It should be noted that the amplitudes of O1−5Sa, O1−4Sa, O1−3Sa are slightly larger than those of their counterparts (i.e., O1+5Sa, O1+4Sa, O1+3Sa). The largest amplitudes of these subseasonal constituents originate from O1 subseasonality and can reach 30.8 mm in the north of the Gulf of Tonkin (Figure 9c).
Figure 9.
Estimated tidal amplitudes (unit: mm) in the Gulf of Tonkin from multi-satellite altimeter observations (a) O1−5Sa (b) O1+5Sa (c) O1−4Sa (d) O1+4Sa (e) O1−3Sa (f) O1+3Sa.
Figure 10.
Estimated tidal amplitudes (unit: mm) in the Gulf of Tonkin from multi-satellite altimeter observations (a) M2+5Sa (b) K1−5Sa (c) M2+4Sa (d) K1−4Sa (e) M2+3Sa (f) K1−3Sa.
The spatially averaged amplitudes of M2+5Sa, M2+4Sa, M2+3Sa, K1−5Sa, K1−4Sa, and K1−3Sa in the Gulf of Tonkin are 8.8 mm, 9.5 mm, 9.2 mm, 9.5 mm, 7.8 mm, 11.3 mm, respectively. Compared to M2+5Sa and M2+3Sa, M2+4Sa has the largest mean amplitude and the maximum number (411) of observation points which have valid amplitudes. The largest M2+4Sa amplitude can reach 31.8 mm in the south of the Gulf of Tonkin (Figure 10c). Compared to K1−5Sa and K1−4Sa, K1−3Sa has the largest mean amplitude and the maximum number (603) of observation points which have valid amplitudes. The largest K1−3Sa amplitude can reach 31.3 mm in the east of the Gulf of Tonkin (Figure 10f). In summary, the features of subseasonal variations in M2, K1, and O1 tides in the Gulf of Tonkin are distinct. The strongest subseasonal cycles in M2, K1, and O1 tides are the quarter-annual, ter-annual, and penta-annual cycles, respectively.
5. Discussions
5.1. Causes of Subseasonal Tidal Variability
Previous studies have indicated that seasonal variations in ocean environments (e.g., sea levels, river flow, ocean stratification, sea ice) can induce noticeable seasonality in tides by influencing tidal propagation, reflection and dissipation [10,11]. Similarly, subseasonal changes in an ocean environment can produce subseasonality in tides. It is true that each tidal constituent has a different response to changes in the ocean environment due to distinct tidal frequencies and tidal wave lengths. Also, note that the Gulf of Tonkin is highly resonant [15], which means that local tides are very sensitive to changes in ocean environment.
In general, seasonal variations in ocean environment are absolutely stronger than subseasonal signals. Thus, tidal seasonality is also definitely stronger than tidal subseasonality. The amplitudes of the annual and semi-annual cycles, in gridded daily multi-satellite sea levels with a resolution of 0.25° [27,28], can reach 147.0 mm and 53.0 mm, respectively (Figure 11a,b). Meanwhile, the largest amplitude of subseasonal variations in gridded daily multi-satellite sea levels can only reach ~11.5 mm (Figure 11c). The maximum amplitude of the annual cycle in monthly mean water levels (MMWLs) at four tide gauges can reach 94.7 mm, while that of the quarter-annual cycle in MMWLs can only reach 31.5 mm (Table 6). The abnormally large amplitudes of subseasonal variations in MMWLs at Hondau may be related to river flow. For Beihai, Dongfang and Haikou, ter-annual variations in MMWLs are strongest, followed by quarter-annual and penta-annual variations.
Figure 11.
Estimated amplitudes (unit: mm) of the annual (a), semi-annual (b), ter-annual (c), quarter-annual (d), and penta-annual cycles (e) in gridded daily multi-satellite sea levels in the Gulf of Tonkin.
Table 6.
The amplitudes and errors (unit: mm) of the seasonal and subseasonal cycles in monthly mean water levels (MMWLs) at Hondau, Beihai, Dongfang and Haikou. Amplitude errors are obtained based on 95% confidence intervals [15]. Statistically insignificant results are labeled by italic text.
It is notable that the ter-annual, quarter-annual, and penta-annual cycles in K1 amplitudes may be amplified by the seasonal variability of astronomical P1 tides. The frequency of the P1 tide is equal to that of the K1, minus the frequency of the semi-annual cycle. The annual and semi-annual cycles of astronomical P1 tides can exaggerate the ter-annual and quarter-annual cycles in K1 tides, respectively. This may be the major reason why both tide gauges and satellite altimeters indicate that the ter-annual cycles in K1 tides are stronger than other sub-seasonal cycles.
5.2. Benefits and Defects of Present Study
Subseasonal tidal variations are usually ignored when exploring the temporal evolution of tides. At the moment, widely used tidal harmonic analysis tools such as T_TIDE [25] can only resolve constituents which represent the annual and semi-annual cycles of M2, S2 and K1 tides, while the annual and semi-annual cycles of O1 tide are not included. Our study clearly indicates the significance of tidal subseasonality, an element which should be considered when conducting harmonic analysis and tidal predictions. In this paper, we also systematically name these subseasonal and seasonal constituents using superscript. It should be noted that some seasonal constituents have been named. The constituents which represent the annual cycle of the M2 tide (0.080511 h−1) have been named as MA2 (0.080397 h−1) and MB2 (0.080626 h−1), while the constituents representing the annual cycle of the O1 tide (0.038731 h−1) have been named as OA1 (0.038617 h−1) and OB1 (0.038845 h−1), respectively. Using our naming rule, MA2 and MB2 tides can be renamed as M2−Sa and M2+Sa tides, respectively. Similarly, OA1 and OB1 tides can also be renamed as O1−Sa and O1+Sa tides, respectively. It is obvious that our names are more intuitive than traditional naming in terms of tidal frequencies.
The present study also has some limitations which can be further improved in the future research. Although satellite altimeter observations cover the whole gulf, the valid amplitudes are spatially limited to the ground tracks of T/P-Jason series. The long sampling interval and LOR also makes some subseasonal tidal constituents indistinguishable. In Equation (1), the amplitudes and phases of the seasonal and subseasonal cycles are assumed to be constants, meaning that all cycles are perfectly stationary. This assumption is unrealistic, especially for tide gauges located in the river estuary. It is well known that seasonal and subseasonal variations in river flow, ocean stratification and sea levels are typically modulated [29]. Therefore, the results of Equation (1) only represent the mean seasonal and subseasonal cycles in tidal signals. Table 7 displays the temporal evolution of K1 tidal subseasonality and seasonality at Beihai, Dongfang, and Haikou. Take Dongfang as example. During 1975–1986, the amplitudes of the annual, semi-annual, and ter-annual cycles in K1 tides at Dongfang are 29.1, 21.6, 11.5 mm, respectively. In the next ten years, the amplitudes of the annual, semi-annual, and ter-annual cycles in K1 tides reduce to 24.7, 17.7, 9.4 mm, respectively.
Table 7.
Temporal variations in amplitudes (unit: mm) of the seasonal and subseasonal cycles in K1 tides at Beihai, Dongfang and Haikou. Amplitude errors are calculated based on 95% confidence intervals [15].
6. Conclusions
The semi-annual, annual, inter-annual, nodal, as well as long-term tidal changes have been widely investigated by lots of studies [3,5]. However, subseasonal tidal changes (ter-annual, quarter-annual, and penta-annual cycles) still receive limited attention. In this paper, based on the combination of four tide gauges and 27-year multi-satellite altimeter observations, we indicate the significance of the subseasonal cycles in main tidal constituents in the Gulf of Tonkin and draw the spatial pattern of tidal subseasonality. The largest amplitude of subseasonal tides can reach as high as 31.8 mm in the Gulf of Tonkin, which is comparable to the magnitude of S2 amplitudes (Figure 6b). Through including these subseasonal tidal constituents, the accuracy of tidal prediction can be further improved, which is beneficial for human activities in the ocean. The methods applied in the Gulf of Tonkin can also be transferred to other sea areas with significant subseasonal modulations.
In the future, we will try to consider more satellite altimeters such as Sentinel series (Sentinel-3A, Sentinel-3B, Sentinel-6A), Haiyang series (Haiyang-2A, Haiyang-2B, Haiyang-2C), and ERS series (ERS-1, ERS-2), and Cryosat-2 to further improve the coverage and number of water level observations. The upcoming SWOT mission will also help to further close the spatial gap between tide gauges and satellite altimeters and promote our knowledge of multi-timescale tidal variability.
Author Contributions
Conceptualization, H.P. and Z.W.; methodology, H.P.; software, H.P.; validation, H.P.; formal analysis, H.P.; investigation, H.P.; data curation, H.P.; writing—original draft preparation, H.P.; writing—review and editing, H.P., B.L., T.X., Z.W.; visualization, H.P.; supervision, Z.W.; project administration, Z.W.; funding acquisition, Z.W. and H.P. All authors have read and agreed to the published version of the manuscript.
Funding
This study is jointly supported by the Laoshan Laboratory (No. LSKJ202202700), the National Natural Science Foundation of China (NSFC) Projects (42206022, 42076024, 41821004), the Global Change and Air-Sea Interaction II (Contact No.GASI-01-ATP-STwin), the China Postdoctoral Science Foundation (2022M713677) and the Qingdao postdoctoral application research project (QDBSH202108).
Data Availability Statement
Multi-satellite altimeter records are obtained from AVISO (https://www.aviso.altimetry.fr/en/data/products/auxiliary-products/coastal-tide-xtrack.html accessed on 3 December 2022). Tide data were provided by the University of Hawaii Sea Level Center (https://uhslc.soest.hawaii.edu/ accessed on 3 December 2022). Gridded daily multi-satellite sea levels are downloaded from CMEMS web portal (http://marine.copernicus.eu/services-portfolio/access-to-products/ accessed on 3 December 2022).
Code Availability Statement
Weighted harmonic analysis is conducted via s_tide_m55 function in S_TIDE toolbox which can be obtained from https://www.researchgate.net/project/A-non-stationary-tidal-analysis-toolbox-S-TIDE (accessed on 3 December 2022).
Conflicts of Interest
The authors declare no conflict of interest.
Appendix A
Previous studies [15] have indicated that the spatially averaged ratio of P1 amplitudes to K1 amplitudes in the Gulf of Tonkin is 0.3237 based on multi-satellite altimeter records, which is nearly same to the equilibrium value (0.3309). Figure A1 clearly indicates that anomalously large semi-annual cycles in K1 amplitudes caused by unresolved P1 tides are successfully removed via tidal inference using the equilibrium value. Seasonal and subseasonal cycles at Dongfang and Haikou are displayed in the Figure A2.
Figure A1.
Estimated K1 amplitudes (unit: mm) with (red lines) and without inference using the equilibrium value (black lines) in the Gulf of Tonkin. (a) Beihai (b) Dongfang (c) Haikou (d) Hondau.
Figure A2.
(a) The observed (black line) and fitted (red line) weekly M2 amplitudes at Dongfang. (b) The observed (black line) and fitted (red line) weekly M2 amplitudes at Haikou. (c) The observed (black line) and fitted (red line) weekly K1 amplitudes at Dongfang. (d) The observed (black line) and fitted (red line) weekly K1 amplitudes at Haikou. (e) The observed (black line) and fitted (red line) weekly O1 amplitudes at Dongfang. (f) The observed (black line) and fitted (red line) weekly O1 amplitudes at Haikou. Green lines represent the fitted results without subseasonal cycles.
References
- Gan, M.; Pan, H.; Chen, Y.; Pan, S. Application of the Variational Mode Decomposition (VMD) Method to River Tides. Estuar. Coast. Shelf Sci. 2021, 261, 107570. [Google Scholar] [CrossRef]
- Pan, H.; Lv, X.; Wang, Y.; Matte, P.; Chen, H.; Jin, G. Exploration of Tidal-Fluvial Interaction in the Columbia River Estuary Using S_TIDE. J. Geophys. Res. Ocean. 2018, 123, 6598–6619. [Google Scholar] [CrossRef]
- Yu, Q.; Pan, H.; Gao, Y.; Lv, X. The Impact of the Mesoscale Ocean Variability on the Estimation of Tidal Harmonic Constants Based on Satellite Altimeter Data in the South China Sea. Remote Sens. 2021, 13, 2736. [Google Scholar] [CrossRef]
- Pan, H.; Guo, Z.; Lv, X. Inversion of Tidal Open Boundary Conditions of the M2 Constituent in the Bohai and Yellow Seas. J. Atmos. Ocean. Technol. 2017, 34, 1661–1672. [Google Scholar] [CrossRef]
- Wei, Z.; Pan, H.; Xu, T.; Wang, Y.; Wang, J. DevelopmentHistory of the Numerical Simulation of Tides in the East Asian Marginal Seas: An Overview. J. Mar. Sci. Eng. 2022, 10, 984. [Google Scholar] [CrossRef]
- Jay, D.A. Evolution of tidal amplitudes in the eastern Pacific Ocean. Geophys. Res. Lett. 2009, 36, L04603. [Google Scholar] [CrossRef]
- Ray, R.D. Secular changes in the solar semidiurnal tide of the western North Atlantic Ocean. Geophys. Res. Lett. 2009, 36, L19601. [Google Scholar] [CrossRef]
- Pan, H.; Zheng, Q.; Lv, X. Temporal changes in the response of the nodal modulation of the M2 tide in the Gulf of Maine. Cont. Shelf Res. 2019, 186, 13–20. [Google Scholar] [CrossRef]
- Müller, M. Rapid Change in Semi-Diurnal Tides in the North Atlantic since 1980. Geophys. Res. Lett. 2011, 38, 11. [Google Scholar] [CrossRef]
- Wang, D.; Pan, H.; Jin, G.; Lv, X. Seasonal Variation of the Principal Tidal Constituents in the Bohai Sea. Ocean Sci. 2020, 16, 1–14. [Google Scholar] [CrossRef]
- Devlin, A.T.; Zaron, E.D.; Jay, D.A.; Talke, S.A.; Pan, J. Seasonality of Tides in Southeast Asian Waters. J. Phys. Oceanogr. 2018, 48, 1169–1190. [Google Scholar] [CrossRef]
- Pan, H.; Lv, X. Is There a Quasi 60-Year Oscillation in Global Tides? Cont. Shelf Res. 2021, 222, 104433. [Google Scholar] [CrossRef]
- Kang, S.; Foreman, M.; Lie, H.; Lee, J.; Cherniawsky, J.; Yum, K. Two-layer tidal modeling of the Yellow and East China Seas with application to seasonal variability of the M2 tide. J. Geophys. Res. 2002, 107, 3020. [Google Scholar] [CrossRef]
- Feng, X.; Tsimplis, M.; Woodworth, P. Nodal variations and long-term changes in the main tides on the coasts of China. J. Geophys. Res. Oceans. 2015, 120, 1215–1232. [Google Scholar] [CrossRef]
- Pan, H.; Devlin, A.T.; Xu, T.; Lv, X.; Wei, Z. Anomalous 18.61-Year Nodal Cycles in the Gulf of Tonkin Revealed by Tide Gauges and Satellite Altimeter Records. Remote Sens. 2022, 14, 3672. [Google Scholar] [CrossRef]
- Peng, D.; Hill, E.; Meltzner, A.; Switzer, A. Tide gauge records show that the 18.61-year nodal tidal cycle can change high water levels by up to 30 cm. J. Geophys. Res. Ocean. 2019, 124, 736–749. [Google Scholar] [CrossRef]
- Devlin, A.; Jay, D.; Talke, S.; Zaron, E. Can tidal perturbations associated with sea level variations in the western Pacific Ocean be used to understand future effects of tidal evolution? Ocean Dyn. 2014, 64, 1093–1120. [Google Scholar] [CrossRef]
- Rayson, M.D.; Jones, N.L.; Ivey, G.N.; Gong, Y. A seasonal harmonic model for internal tide amplitude prediction. J. Geophys. Res. Oceans. 2021, 126, e2021JC017570. [Google Scholar] [CrossRef]
- Nguyen, N.M.; Marchesiello, P.; Lyard, F.; Ouillon, S.; Cambon, G.; Allain, D.; Dinh, U.V. Tidal characteristics of the Gulf of Tonkin. Cont. Shelf Res. 2014, 91, 37–56. [Google Scholar]
- Zavala-Garay, J.; Rogowski, P.; Wilkin, J.; Terrill, E.; Shearman, R.K.; Tran, L.H. An integral view of the Gulf of Tonkin seasonal dynamics. J. Geophys. Res. Oceans. 2022, 127, e2021JC018125. [Google Scholar] [CrossRef]
- Amante, C.; Eakins, W. ETOPO1 1 arc-minute global relief model: Procedures, data sources and analysis. In NOAA Technical Memorandum NESDIS NGDC-24; National Geophysical Data Center: Boulder, CO, USA, 2009; p. 19. [Google Scholar]
- Hart-Davis, M.; Piccioni, G.; Dettmering, D.; Schwatke, C.; Passaro, M.; Seitz, F. EOT20: A global ocean tide model from multi-mission satellite altimetry. Earth Syst. Sci. Data 2021, 13, 3869–3884. [Google Scholar] [CrossRef]
- Birol, F.; Fuller, N.; Lyard, F.; Cancet, M.; Niño, F.; Delebecque, C.; Fleury, S.; Toublanc, F.; Melet, A.; Saraceno, M.; et al. Coastal Applications from Nadir Altimetry: Example of the X-TRACK Regional Products. Adv. Space Res. 2017, 59, 936–953. [Google Scholar] [CrossRef]
- Pan, H.; Jiao, S.; Xu, T.; Lv, X.; Wei, Z. Investigation of tidal evolution in the Bohai Sea using the combination of satellite altimeter records and numerical models. Estuar. Coast. Shelf Sci. 2022, 279, 108140. [Google Scholar] [CrossRef]
- Pawlowicz, R.; Beardsley, B.; Lentz, S. Classical Tidal Harmonic Analysis with Error Analysis in MATLAB Using T_TIDE. Comput. Geosci. 2002, 28, 929–937. [Google Scholar] [CrossRef]
- Piccioni, G.; Dettmering, D.; Schwatke, C.; Passaro, M.; Seitz, F. Design and regional assessment of an empirical tidal model based on FES2014 and coastal altimetry. Adv. Space Res. 2021, 68, 1013–1022. [Google Scholar] [CrossRef]
- Taburet, G.; Sanchez-Roman, A.; Ballarotta, M.; Pujol, M.-I.; Legeais, J.-F.; Fournier, F.; Faugere, Y.; Dibarboure, G. DUACS DT2018: 25 years of reprocessed sea level altimetry products. Ocean Sci. 2019, 15, 1207–1224. [Google Scholar] [CrossRef]
- Zaron, E.; Ray, R. Aliased Tidal Variability in Mesoscale Sea Level Anomaly Maps. J. Atmos. Ocean. Technol. 2018, 35, 2421–2434. [Google Scholar] [CrossRef]
- Zhang, Y.; Pan, H.; Li, S.; Lv, X. Extracting Modulated Annual Cycle in Climate and Ocean Time Series Using an Enhanced Harmonic Analysis. Math. Probl. Eng. 2021, 2021, 9625795. [Google Scholar] [CrossRef]
Disclaimer/Publisher’s Note: The statements, opinions and data contained in all publications are solely those of the individual author(s) and contributor(s) and not of MDPI and/or the editor(s). MDPI and/or the editor(s) disclaim responsibility for any injury to people or property resulting from any ideas, methods, instructions or products referred to in the content. |
© 2023 by the authors. Licensee MDPI, Basel, Switzerland. This article is an open access article distributed under the terms and conditions of the Creative Commons Attribution (CC BY) license (https://creativecommons.org/licenses/by/4.0/).