Abstract
Droughts caused by meteorological factors such as a long-term lack of precipitation can propagate into several types of drought through the hydrological cycle. Among them, a phenomenon in which drought has a significant impact on the ecosystem can be defined as an ecological drought. In this study, the Ecological Drought Condition Index-Vegetation (EDCI-veg) was newly proposed to quantitatively evaluate and monitor the effects of meteorological drought on vegetation. A copula-based bivariate joint probability distribution between vegetation information and drought information was constructed, and EDCI-veg was derived from the joint probability model. Through the proposed EDCI-veg, it was possible to quantitatively estimate how much the vegetation condition was affected by the drought, and to identify the timing of the occurrence of the vegetation drought and the severity of the vegetation drought. In addition, as a result of examining the applicability of the proposed EDCI-veg by comparing past meteorological drought events with the corresponding vegetation conditions, it was found that EDCI-veg can reasonably monitor vegetation drought. It has been shown that the newly proposed EDCI-veg in this study can provide useful information on the ecological drought condition that changes with time. On the other hand, the ecological drought analysis based on the type of land cover showed that the response of vegetation to meteorological drought was different depending on the land cover. In particular, it was revealed that the vegetation inhabiting the forest has a relatively high resistance to meteorological drought.
1. Introduction
Meteorological drought arises from changes in meteorological variables, such as a lack of precipitation, and can be propagated to agricultural, hydrological, and socioeconomic droughts [1,2,3,4,5]. In particular, meteorological drought has a direct impact on ecosystem health such as agricultural production and growth, which can ultimately lead to ecological drought resulting in the loss of biodiversity and ecosystem and increase in forest vulnerability [6,7,8,9]. Since vegetation, a key component of terrestrial ecosystems, is a major link between the atmosphere, water, and soil, it is greatly affected by insufficient precipitation, high temperature, and high evapotranspiration [10,11,12,13]. As such, the effect of meteorological drought on vegetation can be defined as the ecological drought of vegetation. Monitoring the ecological drought of vegetation is an important tool that can provide useful information for the evaluation of drought risk in terms of ecosystems [14,15,16], which is essential for the sustainability of terrestrial ecosystems.
In the past few decades, vegetation monitoring has gradually evolved from in situ monitoring to spatial monitoring as remote sensing and Earth observation technologies have advanced [17,18]. Remote sensing data can be effectively used to identify spatial characteristics and detect drought in a wide area and has high utility in that periodic observation is possible even in areas where observation is limited. In other words, remote sensing data can observe and monitor meteorological or hydrologic-related variables over higher spatial scales than previously possible [19], and thus the use of satellite remote sensing data is increasing [20,21,22,23,24]. Since data remotely sensed by satellites provide significant advantages for monitoring the temporal and spatial evolution of vegetation [25,26], vegetation indices such as the Normalized Difference Vegetation Index (NDVI) have been widely used to evaluate the effects of drought on terrestrial vegetation [27,28,29,30]. Furthermore, drought indices using vegetation information have been developed to determine the stress of water scarcity on the ecosystem (e.g., Normalized Difference Water Index [31]; Vegetation Health Index [32]; Vegetation Temperature Condition Index [26]; Normalized Multi-band Drought Index [33]). However, drought monitoring using the vegetation-related drought index has a limitation in that it is difficult to distinguish drought-related vegetation stress from vegetation changes caused by other factors without information on other variables. Effective integration of various drought-related variables can be key to increasing the accuracy of drought monitoring [34]. Accordingly, integrated drought monitoring using vegetation index and additional data was proposed. Brown et al. [35] introduced the Vegetation Drought Response Index (VegDRI) using climate data and biophysical information together to overcome the limitations of drought analysis using a single vegetation index based on satellite. Rhee et al. [36] proposed a Scaled Drought Condition Index (SDCI) that combines LST, NDVI, and rainfall (satellite data). SDCI is calculated by weighting LST, NDVI, and precipitation, and the weights can be optimized to properly reflect the correlation to improve drought monitoring in a specific area. Zhou et al. [37] proposed a new integrated drought monitoring index, the Integrated Surface Drought Index (ISDI), based on the concept of VegDRI. ISDI improved the existing model, VegDRI, by adding remotely sensed temperature information to the input data. Cunha et al. [38] analyzed the applicability of the Vegetation Supply Water Index (VSWI), a near-real-time drought monitoring method that combines NDVI and land surface temperature (LST) data and suggested that the combination of vegetation and temperature conditions is a good indicator of soil moisture content. Zhang et al. [39] proposed a Drought Severity Index (DSI) using actual evapotranspiration (ET), potential evapotranspiration (PET), and NDVI to utilize surface ET while simultaneously considering vegetation response.
However, these indices by themselves are limited in monitoring the ecological drought condition of vegetation. In this study, the ecological drought state of vegetation is defined as the state in which vegetation is affected by meteorological drought, because the indices for monitoring the vegetation condition alone cannot directly link the occurrence of meteorological drought and the resulting vegetation condition. As in the above studies, an index that integrates vegetation information and climate information has been proposed, but it may be difficult to adequately quantify meteorological drought and its effects into a single index [40]. In addition, in practice, the health state of vegetation can be related not only to drought, but also to various types of vegetation stress (such as pest infestation, pathogens, viruses and changes in land use and land cover). Therefore, in order to investigate the response of vegetation to meteorological drought, it is necessary to analyze the correlation between meteorological variables or meteorological drought index and vegetation-related variables.
Recently, a copula-based joint probability model that combines vegetation information and various climate information has been proposed to consider the mutual influence between vegetation and climate [41,42,43,44,45]. The copula function has proven to be a useful tool to reflect the correlation between various hydrometeorological variables [46,47,48,49,50,51]. Approaches based on joint probability dependence can be useful in analyzing the feedback between vegetation and climate during drought and the effects of meteorological drought on vegetation. As such, in previous studies, to evaluate the response of vegetation to meteorological drought, a joint probability distribution between vegetation and climate was constructed to evaluate and quantify the vulnerability of vegetation [52]. On the other hand, the meteorological conditions change with time, and the response of the vegetation may also change accordingly. Information provided as a fixed value, such as risk, cannot support monitoring of ecological drought conditions that change over time. Accordingly, this study aims to monitor the ecological drought condition of vegetation caused by meteorological drought by developing from the evaluation of the vulnerability of vegetation to meteorological drought.
In this study, we propose an innovative method for monitoring changing ecological drought conditions. This methodology develops the Ecological Drought Condition Index—Vegetation (EDCI-veg) based on the probabilistic relationship between meteorological drought and vegetation response and monitors the ecological drought of vegetation using it.
2. Data and Method
The flow chart in Figure 1 shows the overall process of this study. First, the Standardized Precipitation Index (SPI) [53], which expresses meteorological drought, and the Vegetation Health Index (VHI) [32], which monitors vegetation conditions, are estimated using remote sensing data. Then, a copula-based bivariate joint probability model between SPI and VHI was constructed for each pixel, and EDCI-veg was derived from the joint probability distribution. Finally, ecological drought was analyzed using the proposed EDCI-veg, and whether the proposed EDCI-veg could be used as an index to monitor the ecological drought was evaluated.
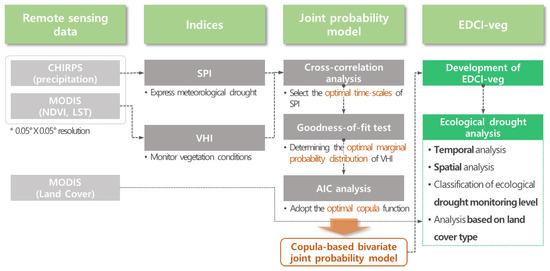
Figure 1.
Flow chart; Asterisk (*) indicates the spatial resolution of the data.
2.1. Data and Study Area
The study area is the domain centered on the Korean Peninsula (Figure 2). The domain ranges from 45.05°N to 32.55°N and from 120.75°E to 133.25°E.
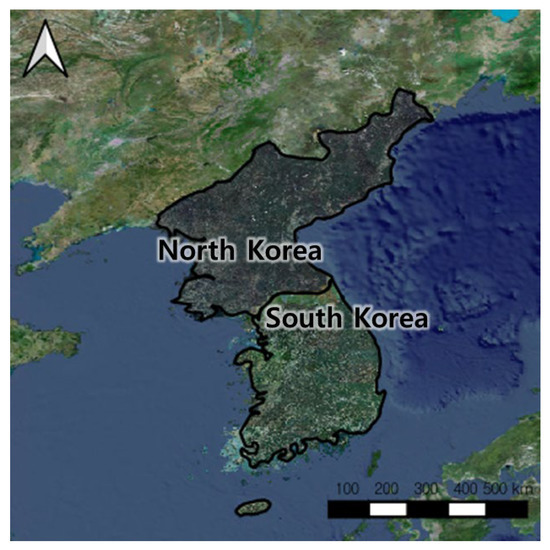
Figure 2.
Location of study area.
NDVI, LST, and precipitation remotely observed from satellites were used to monitor meteorological drought and vegetation conditions. For NDVI, the MOD13C2 product collected from the Terra satellite was used among various outputs produced by the Moderate-resolution Imaging Spectro-radiometer (MODIS). The LST used the MOD11C3 product observed from the MODIS Terra satellite. The spatial resolution of these data is 0.05°, and the temporal resolution is monthly. The period of data used is from 2001 to 2021.
For precipitation data, Climate Hazards Infrared Precipitation with Stations (CHIRPS) dataset provided by United States Geological Survey (USGS) was used. CHIRPS is currently being used for drought monitoring in the US Agency for International Development’s Drought Early Warning System Network. CHIRPS has been produced from 1981 to the present by mixing satellite rainfall estimates and observations from meteorological stations [54]. CHIRPS has recently proven to be a useful tool for estimating precipitation and monitoring meteorological drought in various regions, not just the Korean Peninsula [55,56,57,58]. In this study, monthly CHIRPS precipitation data with a spatial resolution of 0.05° from 2000 to 2021 were used. Statistical characteristics such as monthly mean and coefficient of variation of precipitation in the study area are presented as spatial distributions in Figures S1 and S2. Because MODIS and CHIRPS data have the same spatial resolution, no processing was performed to match the resolution.
2.2. Drought Indices
Meteorological drought affecting vegetation was expressed as a drought caused by a lack of precipitation, which is the aspect of atmospheric moisture supply. For this purpose, SPI, a representative drought index based on precipitation, was used. SPI has been used as a simple yet useful tool for drought identification [59]. The SPI is calculated using the moving average monthly precipitation for various timescales. After estimating the monthly probability distribution suitable for 12 time series composed of each month, the time series is converted into a cumulative probability value using the probability distribution of each time series. The Z value of the standard normal distribution for the transformed cumulative probability value is calculated, where the Z value means the SPI. In this study, the 2-parameter Gamma distribution was used for SPI calculation. SPI is calculated by applying various timescales from 1 month to 12 months from 2001 to 2021. According to the SPI classification defined by McKee et al. [53], when the calculated SPI is less than −1, it is classified as moderate drought, when it is less than −1.5, it is classified as severe drought, and when it is less than −2, it is classified as extreme drought.
VHI was used in this study to monitor the effects of vegetation during meteorological drought. VHI is a widely used index to investigate the effects of moisture and temperature on vegetation [60]. Until recently, it has been used as an index representing vegetation to analyze the response between drought and vegetation from various studies [61,62]. VHI consists of a linear combination of the Vegetation Condition Index (VCI), which integrates information on the visible and near-infrared parts of the electromagnetic spectrum, and the Thermal Condition Index (TCI) by thermal infrared. Among them, VCI explains the stress of vegetation on water, and is estimated as follows using NDVI [32].
where is the VCI estimated at pixel , is the NDVI value observed at pixel , and and are the minimum and maximum values of NDVI observed from 2001 to 2021 in pixel i among the data for the month in which is being calculated. TCI is used to evaluate the temperature stress of vegetation based on LST and is calculated as follows.
where is the calculated TCI for pixel , is the LST value observed in pixel , and and are the minimum and maximum values of LST observed in pixel from 2001 to 2021 among the data for the month for which is being calculated.
VHI is calculated as follows using VCI and TCI.
where is generally 0.5, and VHI was calculated by applying 0.5 in this study [32]. When VHI is below 40, it indicates drought of vegetation, and when it is close to 0, it means that the health of vegetation deteriorates [63].
2.3. Copula-Based Probabilistic Model
In this study, a copula-based bivariate joint probability distribution was modeled to explain the correlation between SPI and VHI. At this time, the bivariate joint probability distribution is constructed for each season (spring: March–May, summer: June–August, autumn: September–November, winter: December–February). The joint cumulative probability distribution of SPI and VHI is expressed as the following equation [64].
where and are the marginal cumulative probability distributions of VHI and SPI, respectively, and are expressed as and , and is a copula function. Clayton, Frank, Gumbel, Gaussian, and Student-t functions widely used in hydrometeorological fields were applied to the copula function. The parameters of the copula function are estimated using the maximum likelihood method, and the optimal copula function that best captures the dependency structure between VHI and SPI among the five copula functions was adopted using Akaike Information Criterion (AIC) [65]. AIC has been used in various studies to select an optimal copula function [66,67], and is expressed as the following equation.
where is the number of parameters of the copula function, is the log-likelihood function, and it is as follows.
where is the observed (or empirical) joint distribution, that is, in Equation (4), and is the joint distribution corresponding to calculated by the copula function. The copula function with the smallest AIC is determined as the optimal copula function.
Before constructing a bivariate joint probability model of VHI and SPI using the optimal copula function, it is necessary to determine the optimal timescale for SPI, which has various timescales from 1 month to 12 months. To this end, cross-correlation analysis between SPI and VHI was performed, and the timescale of the drought index with the highest cross-correlation coefficient with VHI was adopted as the optimal timescale. After determining the optimal timescale for SPI, the marginal probability distribution of VHI and SPI in the optimal timescale was determined. At this time, since SPI is calculated as an inverse function of the standard normal distribution during the calculation process, the optimal marginal probability distribution of SPI was adopted as the standard normal distribution. To determine the optimal marginal probability distribution of VHI, six commonly used theoretical probability distributions (Normal distribution, Log-Normal distribution, Gamma distribution, Weibull distribution, Log-Logistic distribution, and GEV distribution) were applied. The parameters of each distribution are estimated by the maximum likelihood method, and the optimal marginal probability distribution of VHI was determined based on the K-S goodness-of-fit test.
After determining the optimal marginal probability distribution and optimal copula function of SPI and VHI, a bivariate joint probability distribution of VHI-SPI can be constructed. When the joint probability distribution is constructed, the conditional probability distribution of VHI can be derived under the given climate condition. From the bivariate joint probability distribution in Equation (4), when is given, the conditional probability of is expressed as the following equation.
2.4. Ecological Drought Condition Index of Vegetation
In this study, based on the bivariate joint probability distribution of SPI-VHI, EDCI-veg was proposed, which quantitatively represents the effects of meteorological drought on vegetation. EDCI-veg is defined as the ratio of the non-exceedance probability of the present vegetation condition in the present meteorological condition to the non-exceedance probability of the present vegetation condition under normal meteorological condition based on Equation (7) and is expressed by the following equation.
where is the value of EDCI-veg at a specific time , and are the values of VHI and SPI at time , and is the value of SPI in normal meteorological condition. In this study, normal meteorological condition was defined as when the SPI was 0. EDCI-veg, calculated through Equation (8), can quantitatively suggest how much the present vegetation condition has been affected by the present meteorological condition compared to normal.
Figure 3 is a diagram explaining the probabilistic method for estimating EDCI-veg. The blue line shown in the figure is the conditional probability distribution of vegetation under normal condition (i.e., SPI = 0), and the orange line is the conditional probability distribution of vegetation under present meteorological condition. Each conditional probability distribution is derived through the copula-based joint probability model of SPI-VHI. The area colored in blue represents the non-exceedance probability of the present vegetation state under normal meteorological condition, and the area colored in orange represents the non-exceedance probability of the present vegetation condition under the present meteorological condition. At this time, if the orange area is larger than the blue area, it means that the present meteorological condition has affected the vegetation. Theoretically, if the EDCI-veg value exceeds 1, it means that the vegetation is affected by drought, and if the value is large, it means that the present meteorological condition has a large effect on the vegetation.
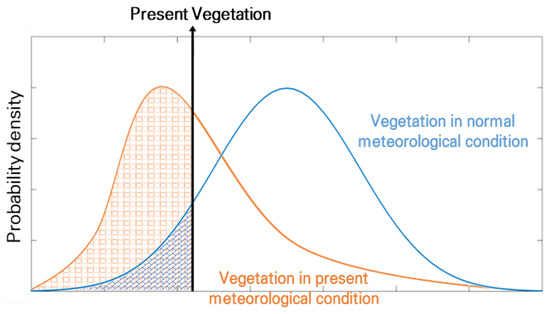
Figure 3.
Probabilistic analysis of ecological drought condition of vegetation during meteorological drought.
3. Results
3.1. Timescale for Meteorological Drought Index
The period of a lack of precipitation affecting vegetation varies from season to season and from region to region. Therefore, it is necessary to investigate how long accumulated precipitation has the greatest effect on vegetation. For this purpose, the correlation between SPI for various timescales from 1 month to 12 months and VHI was analyzed. Through correlation analysis, the timescale of SPI with the highest cross-correlation coefficient with VHI was adopted as the optimal timescale for each pixel and each season. Figure 4 shows the histogram of the optimal timescale adopted for each pixel and season in the study area.
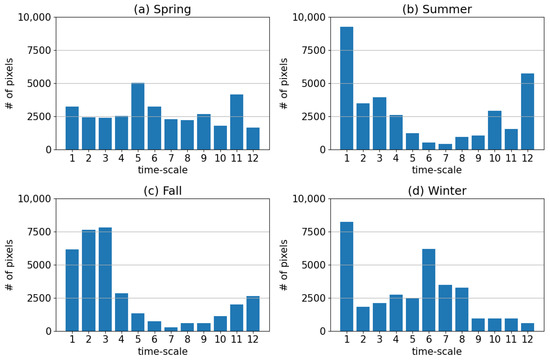
Figure 4.
Histogram of optimal timescale of SPI for (a) spring, (b) summer, (c) fall and (d) winter.
In Figure 4, it can be seen that the optimal timescale for each season is different. In spring, a very diverse timescale for each pixel appeared, and in summer, the 1-month timescale was adopted the most. In fall, the short-term timescale from 1 month to 3 months was adopted as the optimal timescale in most pixels, and in winter, the timescales of 1 month and 6 months were most adopted. This means that most vegetation in the Korean Peninsula is greatly affected by short-term precipitation shortages in summer and autumn and responds more sensitively to short-term precipitation shortages than long-term precipitation shortages in winter as well. The fact that the optimal timescale for each pixel and each season was adopted differently means that the correlation between SPI and VHI varies from region to region and is affected by the seasons. Therefore, it is important to investigate the relationship between each meteorological drought and vegetation separately for each pixel and season.
3.2. Copula-Based Joint Probability Model
When the optimal timescale of SPI is determined for each pixel, the bivariate joint probability distribution between SPI and VHI can be modeled. In this process, the marginal probability distribution of VHI for each season and each pixel was determined, and the optimal copula function was adopted using AIC. When the bivariate joint probability distribution is modeled, the conditional probability distribution of VHI can be obtained in a given meteorological condition. One pixel was chosen to show an example of this procedure. Figure 5 shows the AIC results for selecting the optimal copula function of SPI and VHI at this pixel, the Q-Q plot of the optimal copula function, and the conditional probability distribution of VHI under the condition that a specific SPI value is given.
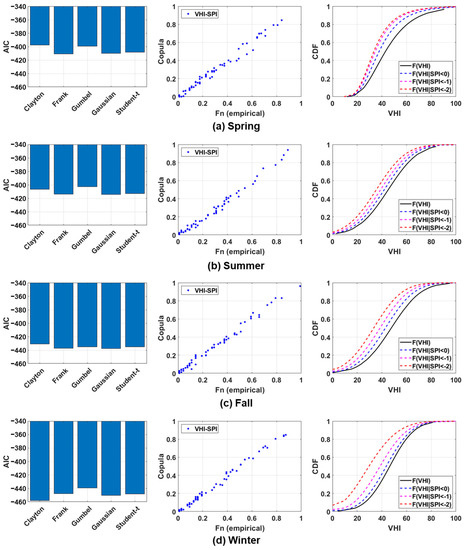
Figure 5.
AIC values of five copulas for VHI and SPI (Left), Q-Q plot using best-fitted copula (Center), and conditional CDF of VHI under SPI < 0, SPI < −1 and SPI < −2 (Right) for (a) spring, (b) summer, (c) fall and (d) winter.
From Figure 5, it can be seen that the optimal copula function was adopted differently for each season. The optimal copula function for constructing the bivariate joint probability distribution of SPI and VHI is the Frank function in spring, the Gaussian function in summer and autumn, and the Clayton function in winter. Since the interaction between SPI and VHI varies from season to season, it is important to determine the optimal copula function suitable for each season. Similarly, since the interaction between climate and vegetation is different depending on the region, it is necessary to adopt the optimal copula function for each pixel through individual AIC analysis for each pixel. VHI conditional distributions were derived for various SPI conditions. Under the SPI condition, the shift of the cumulative distribution function (CDF) of VHI to the upper left means that the non-exceedance probability for a specific VHI condition increases. In Figure 5, it can be seen that as the SPI has a lower value, the CDF of VHI moves more to the upper left. This means that vegetation is more affected as severe meteorological drought occurs. For example, under the condition of SPI of −2 or less, the conditional probability distribution of VHI (red dotted line) has a higher non-exceedance probability for the same vegetation state than the CDF of VHI with SPI of 0 (solid black line). This means that when a meteorological drought occurs, there is a higher probability that the health of the vegetation will deteriorate than under normal meteorological conditions, which means the ecological drought condition of the vegetation. When a severe meteorological drought occurred (i.e., SPI < −2), the cumulative probability of vegetation being in poor health (i.e., VHI < 40) was about 0.68 in spring, and in summer, autumn and winter were 0.60, 0.64 and 0.71, respectively. In this pixel, if a meteorological drought occurs in spring, the growing season of vegetation, it is judged that the probability of vegetation deterioration is relatively high compared to summer and autumn, and the probability is highest in winter. Interestingly, the CDF of VHI is very different depending on meteorological drought severity in spring and winter. In spring, the probability that the VHI is below 40 is 0.55 under normal meteorological conditions (i.e., SPI < 0) and 0.65 under moderate drought conditions (SPI < −1). In winter, the probability of vegetation deterioration due to meteorological drought is 0.40 under the condition of SPI < 0 and 0.53 under the condition of SPI < −1. Compared to winter, the differences in the effects of normal meteorological conditions, moderate drought and extreme drought on vegetation are relatively small in spring. On the other hand, if an extreme drought occurs in winter, the probability of poor vegetation health is significantly higher than in normal meteorological conditions. This means that the ecological drought of vegetation in this pixel can be severe in winter compared to other seasons.
3.3. Evaluation of the Ecological Drought Monitoring Capability of EDCI-Veg
3.3.1. Time Series Analysis
EDCI-veg for monitoring the ecological drought condition of vegetation was calculated from the bivariate joint probability distribution of SPI-VHI composed of each pixel. Figure 6 shows the VHI, SPI, and EDCI-veg time series from January 2001 to December 2021 for a random pixel. At this time, since the SPI was shown as a drought index with an optimal timescale for each season, SPIs of different timescales were used for each season. The optimal timescale of SPI for the pixel is 5 months (spring), 11 months (summer), 3 months (fall), and 5 months (winter), respectively. In each figure, the gray colored part is a period of meteorological drought (when SPI is –1 or less) and EDCI-veg is 1 or more, indicating the ecological drought condition of vegetation. Ecological droughts of vegetation in this pixel occurred in 2001–2002, 2005–2010, 2011, 2014–2015, 2017, and 2021. EDCI-veg was particularly able to adequately monitor the long-term ecological droughts of vegetation from 2001 to 2002, 2006 to 2007, and 2008 to 2010. In addition, short-term ecological droughts in 2011, 2014, 2017, and 2021 could be detected. Figure 6 shows that the proposed EDCI-veg identifies and appropriately monitors the period of ecological drought.
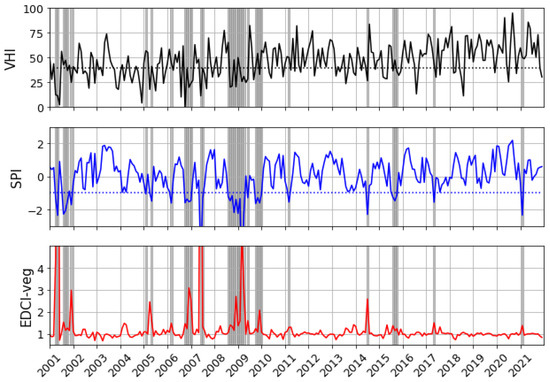
Figure 6.
VHI, SPI, and EDCI-veg time series.
3.3.2. Mapping of Ecological Drought
How EDCI-veg can detect ecological drought of vegetation through meteorological drought and vegetation status information can be confirmed in more detail using spatial pictures. Four representative periods were selected and the vegetation condition (i.e., VHI), meteorological drought condition (i.e., SPI), and ecological drought condition of vegetation (i.e., EDCI-veg) were mapped (Figure 7). EDCI-veg monitors when vegetation conditions are affected by meteorological drought as ecological drought condition of vegetation. This can be confirmed in Figure 7a. In November 2006, meteorological drought occurred in the western part of the Korean Peninsula, and vegetation health deteriorated throughout the South Korea. At this time, the region where the extreme vegetation drought was monitored was the mid-western region of the Korean Peninsula, where meteorological droughts were mainly occurring. In other words, the midwest region of the Korean Peninsula can be seen as affected by the meteorological drought that occurred during this period, and the deterioration of vegetation in other regions cannot be attributed to the lack of precipitation alone, so the extreme vegetation ecological drought was not monitored. In the case of January 2009, a severe meteorological drought occurred in the southern part of the Korean Peninsula, but it can be seen that the area where the lack of precipitation affected vegetation was some pixels within a range smaller than the range affected by the meteorological drought (Figure 7b). Similarly, drought occurred in the southern part of the Korean Peninsula in August 2017 due to a lack of precipitation, but vegetation was not significantly affected in most pixels in the area where weather drought occurred (Figure 7c). In other words, EDCI-veg was able to distinguish areas where vegetation was not affected despite the occurrence of meteorological drought. Similarly, through EDCI-veg, it was possible to distinguish only the areas where vegetation was affected by insufficient precipitation while the vegetation health deteriorated throughout the Korean Peninsula (Figure 7d). Although there was no severe meteorological drought in August 2018, the health of vegetation throughout the Korean Peninsula was in a state of decline. Using EDCI-veg, we were able to monitor only the areas where vegetation was affected by insufficient precipitation in a situation where the vegetation condition was poor throughout the Korean Peninsula.
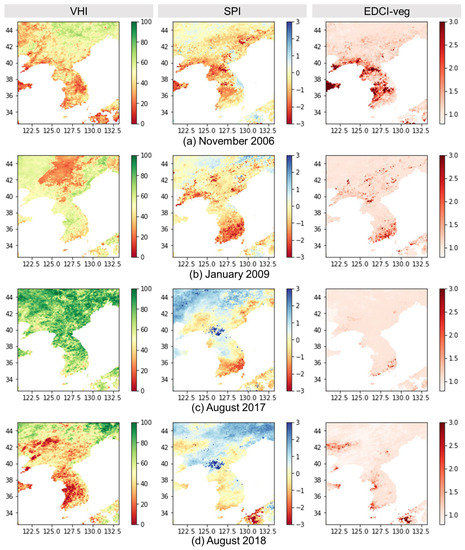
Figure 7.
Drought severity map of VHI, SPI and EDCI-veg for (a) spring, (b) summer, (c) fall and (d) winter.
3.4. Classification of Ecological Drought Monitoring Level Based on EDCI-Veg
Since the ecological drought of vegetation is a condition resulting from the occurrence of meteorological drought, when the proposed EDCI-veg value is 1 or more, the ecological drought of vegetation can be monitored. At this time, in order to more clearly express the ecological drought condition of vegetation using EDCI-veg, it is necessary to distinguish the drought stages. Accordingly, in this section, the ecological drought stage of vegetation is divided into four stages: ‘attention’, ‘caution’, ‘alert’, and ‘severe’, and a method for deriving the reference value of EDCI-veg for each stage is suggested. First, the EDCI-veg value of the month in which the ecological drought of vegetation appeared was extracted for all pixels in the study area. At this time, the occurrence of the ecological drought of vegetation was defined as when meteorological drought occurred (i.e., SPI ≤ −1) and EDCI-veg was greater than 1. Afterwards, all extracted EDCI-veg values were sorted in descending order, and the Q4 (fourth quantile), Q3 (third quantile), Q2 (second quantile), and Q1 (firth quantile) values were set as ‘attention’, ‘caution’, ‘alert’, and ‘severe’, respectively. This is to monitor ecological drought in the study area relatively. If the study area is changed, the reference value may also change because the EDCI-veg value extracted according to the area is different. That is, in order to monitor ecological drought using EDCI-veg in a new area, a new reference value suitable for the area must be derived. Table 1 shows the reference values of the ecological drought stage derived only for this study area.

Table 1.
Ecological drought stage classification of vegetation by EDCI-veg.
As a result of monitoring the ecological drought by applying the reference value of the drought stage to the time series shown in Figure 6, it was confirmed that the ecological drought condition could be expressed more clearly (Figure S3). Since the EDCI-veg value itself can provide a value of 1 or more in a situation where the ecological drought of vegetation has not occurred, it was possible to more clearly monitor the ecological drought condition of the vegetation by applying the reference value of the ecological drought stage. For example, in April 2005, EDCI-veg showed a value of 2 or higher even though meteorological drought did not occur, so that ecological drought of vegetation could be monitored as a serious state, however this misinformation could be eliminated by applying the reference value of drought stage (see Figure S3). By displaying the results of monitoring for each drought stage as a map, it is possible to examine how the ecological drought of vegetation is spatially deepened and alleviated. Figure 8 shows the ecological drought monitoring map of vegetation from August to November 2021. It can be seen that the ecological drought of vegetation that occurred in the mid-western region in August 2021 moved to the eastern region in September. Then, in October, the ecological drought stage was weakened in this area, while the ecological drought stage was monitored as ‘attention’ in the southern coastal area. In November, most of the areas previously affected by ecological drought recovered to the ‘normal’ level, while the southern part of the Korean Peninsula was upgraded from the ‘attention’ level to ‘caution’ level. By preparing the drought expression in stages like this, it was possible to more clearly express the ecological drought of vegetation and to judge the extent of it.
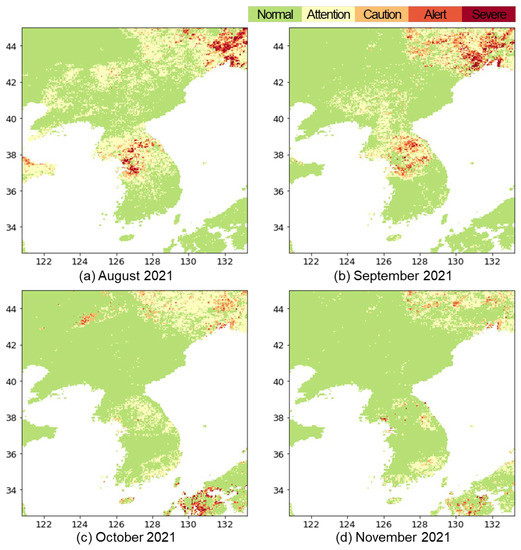
Figure 8.
Ecological drought monitoring map by EDCI-veg for (a) August 2021, (b) September 2021, (c) October 2021 and (d) November 2021.
3.5. Ecological Drought Analysis Based on Land Cover Type
We tried to analyze the difference in the degree of influence of meteorological drought on vegetation by land cover type using EDCI-veg. At this time, land cover types were divided into agricultural land, forest, and grass where vegetation acts as a major ecosystem form. For each pixel corresponding to each land cover type, the EDCI-veg value of the period of ecological drought (i.e., when SPI ≤ −1 and EDCI-veg ≥ 1) was extracted and the range was compared by plotting the box-plot (Figure 9). The sensitivity of vegetation to meteorological drought was greatest in grass and was also greater in agricultural land than in forest. This means that vegetation in agricultural land and grass is highly vulnerable to meteorological drought. In the case of the Korean Peninsula, the areas most directly or indirectly affected by an ecological drought of vegetation are agricultural lands where crops are produced, such as paddy, field, and orchard. This suggests that when an ecological drought of vegetation occurs, it is likely to have a significant impact on agriculture-related activities. When a meteorological drought occurred in the forest, the ecological drought of the vegetation was weaker than that of other land cover types, which shows that the resistance of the vegetation living in the forest to the meteorological drought is high.
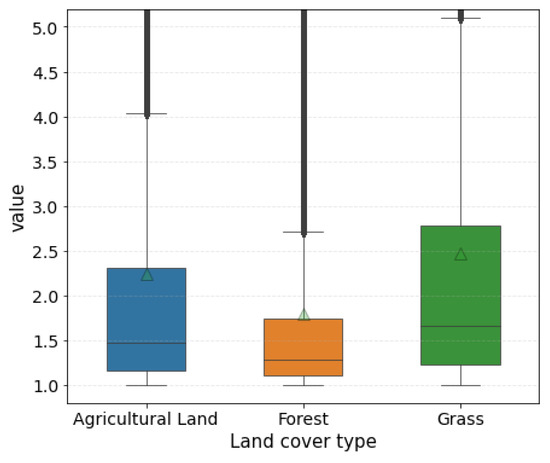
Figure 9.
Comparison of ranges of EDCI-veg values by land cover.
We compared the proportion of meteorological and ecological drought stages by land cover type. Figure 10 shows the proportion of meteorological drought stages and ecological drought stages for each land cover type. In May 2003, most pixels in the grass experienced meteorological and ecological drought (Figure 10a). The proportions of meteorological drought in the agricultural area and forest were similar, but ecological drought occurred the weakest in the forest. October 2004 was the period when forests experienced the most meteorological drought among land cover types (Figure 10b). Although extreme meteorological droughts occurred most often in the forest, severe ecological droughts were monitored most often in the grass. Interestingly, in the case of grass, extreme meteorological droughts occurred in very few areas, but severe ecological droughts occurred in a larger area. This means that the vegetation in the grass has a very high vulnerability to meteorological drought, which is also shown in Figure 10c. In June 2007, more than half of the forest and grass experienced meteorological drought. Severe meteorological droughts occurred most often in forest, but ecological droughts occurred the least. On the other hand, grass experienced weak meteorological drought compared to other land cover types, but ecological drought occurred most severely. Agricultural areas also experienced less meteorological drought than forests but more severe ecological drought. Similarly, in Figure 10d, the proportions of extreme meteorological drought in forest and grass were similar, but the proportion of severe ecological drought were higher in grass. The results in Figure 10 show that if a meteorological drought due to insufficient precipitation occurs in the Korean Peninsula, the vulnerability of vegetation in grass can be relatively large, and vegetation in forest has higher resistance.
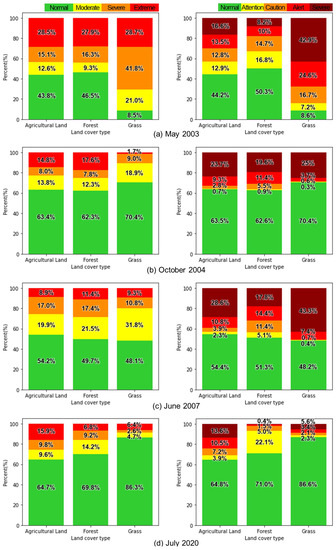
Figure 10.
Percentage of meteorological drought (Left) and ecological drought (Right) levels experienced by each land cover type for (a) May 2003, (b) October 2004, (c) June 2007 and (d) July 2020.
Meanwhile, the effects of meteorological drought on vegetation may differ depending on anthropogenic activities. For example, if a meteorological drought occurs in the agricultural area, the ecological drought can be alleviated through responses such as water supply. South Korea is actively promoting efficient drought response by preparing a system and countermeasures for water supply. On the other hand, in North Korea, it is difficult to prepare for a drought or actively respond to damage mitigation due to difficulties in supplying agricultural water. North and South Korea have relatively similar natural environments but very different social systems, and by comparing and contrasting the two regions, the anthropogenic impact on ecological drought can be investigated. Figure S4 shows that ecological drought occurred more seriously in agricultural areas in North Korea where water supply was relatively insufficient than in South Korea. Similar to Figure 10, Figure 11 shows the proportions of actual meteorological drought and ecological drought stages in agricultural areas in North and South Korea. In Figure 11a, extreme meteorological drought occurred more in South Korea, but severe ecological drought occurred more in North Korea. In March 2011, an extreme meteorological drought that occurred in agricultural areas in North Korea caused an ecological drought at the ‘Severe’ level, but the extreme meteorological drought that occurred in South Korea resulted in an ecological drought at the ‘Alert’ stage in about 3.3% of the area (Figure 11b). In June 2017, about 60% of agricultural areas in South Korea experienced extreme meteorological drought, but only about 21% experienced severe ecological drought (Figure 11c). On the other hand, despite a relatively weaker meteorological drought in North Korea than in South Korea, the ecological drought occurred more severely, which is also shown in Figure 11d. This result shows that the vulnerability to ecological drought is higher in agricultural areas in North Korea, where water supply capacity is low, than in South Korea, and emphasizes the effect of artificial water supply on ecological drought.
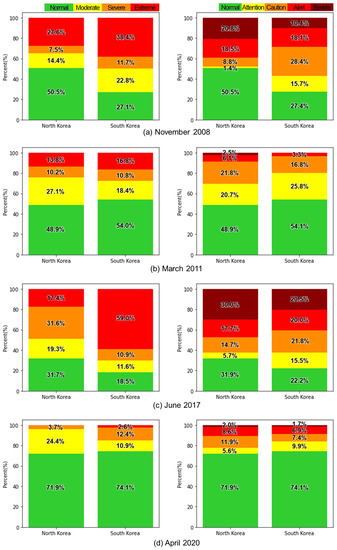
Figure 11.
Percentage of meteorological drought (Left) and ecological drought (Right) levels experienced by agricultural regions in North and South Korea for (a) November 2008, (b) March 2011, (c) June 2017 and (d) April 2020.
4. Discussion
From an ecological point of view, the risk of meteorological drought has already been identified through various recent studies [68,69,70]. Drought inhibits vegetation growth, causes wildfires, reduces agricultural production and affects ecosystem health [71,72]. Therefore, monitoring the effects of drought on vegetation health is particularly important [72,73].
However, as in our study, it was difficult to find an index that monitors the effects of meteorological drought on vegetation based on the joint probability dependence. Various indices for monitoring vegetation health in relation to drought have been developed, but a univariate analysis using only single drought index cannot show the interdependent relationship between climate and vegetation. This is because the relationship between meteorological drought and vegetation is very complex. In fact, even if a meteorological drought occurs, vegetation is not always affected, and even if a meteorological drought does not occur, the health of vegetation may deteriorate. From this point of view, we defined the condition in which meteorological drought affects vegetation as ecological drought of vegetation. When dealing with the ecological drought of vegetation, it is necessary to consider both aspects: whether the present vegetation condition is out of the normal state at the present time, and whether the cause of the deviation of the vegetation from the normal state is due to the meteorological drought. Since the ecological drought of vegetation is a very complex phenomenon, it is necessary to approach it based on the probabilistic relationship between meteorological information and vegetation information.
We propose EDCI-veg from the bivariate joint probability distribution between SPI and VHI. The proposed EDCI-veg has an innovative point to monitor that the vegetation condition at the time of meteorological drought caused by a lack of precipitation was affected by the drought. Through EDCI-veg, it was possible to investigate whether the vegetation condition was affected when a meteorological drought occurred, to indicate the time of occurrence of the ecological drought, and to quantify the degree of influence of the meteorological drought (Figure 6). On the other hand, although the meteorological drought did not occur, the deterioration of the vegetation health may cause confusion in monitoring the ecological drought condition of the vegetation. Since this is a condition in which vegetation health is deteriorated by factors other than meteorological drought, it is necessary to distinguish only the condition in which vegetation is affected due to a lack of precipitation. The EDCI-veg proposed in this study shows that it can distinguish the deterioration of the vegetation health that is caused by factors other than the lack of moisture supply in the atmosphere (Figure 7d). In other words, EDCI-veg did not simply judge the condition of poor vegetation health as ecological drought but quantified the effect according to the vegetation condition when meteorological drought occurred. In order to increase the utility of EDCI-veg for monitoring ecological drought, we classified four stages of ecological drought and presented the reference value of EDCI-veg for each stage. As a result of monitoring and mapping the ecological drought in stages based on EDCI-veg, it was possible to express the ecological drought condition more clearly and to identify the ecological drought level by region.
On the other hand, in order to better monitor and understand the ecological drought risk of vegetation, it is particularly important to examine at the relationship between the effects of drought on vegetation and the land cover on which the vegetation inhabits. Because resistance and vulnerability to drought are different depending on the vegetation characteristics, it is necessary to recognize the difference in the stress of vegetation due to climate based on the type of land cover. In general, the effects of climate on vegetation are complicated by differences in climate and ecological conditions in different regions [74]. In fact, it has been reported that in the Korean Peninsula, the response of vegetation to meteorological drought is spatially very different because the vegetation inhabiting each region is different [56]. We found that vegetation I forest has a relatively high resistance to precipitation deficit. This is similar to the results reported in some studies that forests have strong ecological stability and drought resistance [75,76,77]. Our results show that grassland vegetation has relatively high ecological drought vulnerability and forest vegetation has high ecological drought resistance in the Korean Peninsula. Since the resistance of vegetation varies according to land cover type, it is necessary to identify land types vulnerable to meteorological drought and establish management strategies for responding to ecological drought based on land cover types.
In addition, we found that the interaction between vegetation and meteorological drought can vary greatly depending on the season (Figure 5). When a meteorological drought of the same severity occurs, the effect on vegetation is very different for each season, which means that it is particularly important to consider the season when investigating the effect of meteorological drought on vegetation. As our results show, the relationship between vegetation and climate is highly dependent not only on land cover type but also on seasonal variability, so it is important to investigate the seasonal dependence of climate variables and vegetation [13,44,45].
Our results suggest that it is difficult to detect the ecological drought of vegetation resulting from meteorological drought with only the existing index related to vegetation. This suggests that it is essential to analyze the interaction between meteorological drought information and vegetation information in order to monitor the ecological drought condition, which is a complex phenomenon. The proposed EDCI-veg has utility in all areas remotely observed from satellites. In this study, VHI was used to represent the vegetation condition, but various vegetation indices that best express the health of vegetation by region can be applied. In addition, in the process of estimating EDCI-veg, we only considered meteorological drought due to a lack of precipitation, which is an aspect of atmospheric moisture supply, but there is no limit to applying drought indices of various aspects other than SPI. In other words, the concept of EDCI-veg can be applied to drought in all fields that can affect vegetation. Therefore, research combining various hydrometeorological drought information and vegetation information will be needed in the future. In fact, vegetation can be stressed not only by insufficient precipitation but also by factors such as excessive increase in evapotranspiration or insufficient available water in the soil layer [45,78].
5. Conclusions
A new index, EDCI-veg, was proposed to monitor the effect of meteorological drought on vegetation, that is, the ecological drought of vegetation. Based on the literature review, this study is the first to propose an index to monitor the effects of meteorological drought on vegetation from a probabilistic point of view. EDCI-veg was derived from the bivariate joint probability distribution of SPI and VHI, and it was possible to quantitatively suggest the ecological drought condition of vegetation by reflecting the meteorological and vegetation condition at a specific time. Through the proposed EDCI-veg, the timing and severity of ecological drought of vegetation could be identified. To express ecological drought more explicitly using EDCI-veg, the stages of ecological drought were divided, and the ecological drought monitoring map applied with stages could identify the areas where the ecological drought occurred and provide information on particularly severe areas. In addition, it was found that the effect of meteorological drought on vegetation can be different depending on the type of land cover, and it was found that the vegetation in the forest has a greater resistance to the lack of precipitation. This suggests the need to investigate the effects of meteorological drought on vegetation by land cover type. The analysis of ecological drought considering land cover type can provide useful information on vulnerable areas for ecological drought management. This study highlights the need for a probabilistic approach to monitor the effects of meteorological drought on vegetation and demonstrates the ability of the newly proposed EDCI-veg to provide useful information on the ecological drought of vegetation.
However, in this study, due to the limitations of the NDVI and LST data period, the study was conducted for a short period from 2001 to 2021. Since EDCI-veg was calculated from data of a short period, the reliability of the results may be lowered. A short data period can increase the uncertainty of the research results, so it will act as a limitation of this study. The use of accumulated long-term data will more comprehensively and accurately describe the relationship between meteorological drought and vegetation and further improve the applicability of EDCI-veg.
Supplementary Materials
The following supporting information can be downloaded at: https://www.mdpi.com/article/10.3390/rs15020337/s1, Figure S1: Spatial distribution of average monthly precipitation based on CHIRPS from 2000 to 2021 in the study area, Figure S2: Spatial distribution of monthly precipitation coefficients of variation based on CHIRPS from 2000 to 2021 in the study area, Figure S3: Time series of ecological drought monitoring by applying the ecological drought stage classification, Figure S4: Comparison of ranges of EDCI-veg values in agricultural regions of North and South Korea.
Author Contributions
Conceptualization, J.W. and S.K.; methodology, J.W. and S.K.; formal analysis, J.W. and S.K.; investigation, J.W.; resources, J.W.; data curation, J.W.; writing—original draft preparation, J.W.; writing—review and editing, S.K.; visualization, J.W.; supervision, S.K.; project administration, S.K.; funding acquisition, S.K. All authors have read and agreed to the published version of the manuscript.
Funding
This research was funded by the National Research Foundation of Korea (NRF), grant number NRF-2022R1A2B5B01001750.
Data Availability Statement
Data available on request.
Acknowledgments
This work was supported by the National Research Foundation of Korea (NRF) grant funded by the Korean government (MSIT) (No. NRF-2022R1A2B5B01001750).
Conflicts of Interest
The authors declare no conflict of interest.
References
- Kim, H.; Park, J.; Yoon, J.; Kim, S. Application of SAD curves in assessing climate-change impacts on spatio-temporal characteristics of extreme drought events. KSCE J. CEER 2010, 30, 561–569. [Google Scholar]
- Bevacqua, A.G.; Chaffe, P.L.; Chagas, V.B.; AghaKouchak, A. Spatial and temporal patterns of propagation from meteorological to hydrological droughts in Brazil. J. Hydrol. 2021, 603, 126902. [Google Scholar] [CrossRef]
- Xu, Y.; Zhang, X.; Hao, Z.; Singh, V.P.; Hao, F. Characterization of agricultural drought propagation over China based on bivariate probabilistic quantification. J. Hydrol. 2021, 598, 126194. [Google Scholar] [CrossRef]
- Zhou, Z.; Shi, H.; Fu, Q.; Ding, Y.; Li, T.; Wang, Y.; Liu, S. Characteristics of propagation from meteorological drought to hydrological drought in the Pearl River Basin. J. Geophys. Res. Atmos. 2021, 126, e2020JD033959. [Google Scholar] [CrossRef]
- Zhang, T.; Su, X.; Zhang, G.; Wu, H.; Wang, G.; Chu, J. Evaluation of the impacts of human activities on propagation from meteorological drought to hydrological drought in the Weihe River Basin, China. Sci. Total Environ. 2022, 819, 153030. [Google Scholar] [CrossRef] [PubMed]
- Djebou, D.C.S.; Singh, V.P.; Frauenfeld, O.W. Vegetation response to precipitation across the aridity gradient of the southwestern United states. J. Arid Environ. 2015, 115, 35–43. [Google Scholar] [CrossRef]
- Brandt, M.; Tappan, G.; Diouf, A.A.; Beye, G.; Mbow, C.; Fensholt, R. Woody vegetation die off and regeneration in response to rainfall variability in the West African Sahel. Remote Sens. 2017, 9, 39. [Google Scholar] [CrossRef]
- Crausbay, S.D.; Ramirez, A.R.; Carter, S.L.; Cross, M.S.; Hall, K.R.; Bathke, D.J.; Betancourt, J.L.; Colt, S.; Cravens, A.E.; Dalton, M.S.; et al. Defining ecological drought for the twenty-first century. Bull. Am. Meteorol. 2017, 98, 2543–2550. [Google Scholar] [CrossRef]
- Boori, M.S.; Choudhary, K.; Kupriyanov, A. Detecting vegetation drought dynamics in European Russia. Geocarto Int. 2022, 37, 2490–2505. [Google Scholar] [CrossRef]
- Kim, E.; Choi, H.I.; Park, M.J.; Cho, S.J.; Kim, S. The effect of climate change on Korean drought occurrences using a stochastic soil water balance model. Sci. Res. Essays 2011, 6, 2771–2783. [Google Scholar]
- de Jong, R.; Schaepman, M.E.; Furrer, R.; De Bruin, S.; Verburg, P.H. Spatial relationship between climatologies and changes in global vegetation activity. Glob. Change Biol. 2013, 19, 1953–1964. [Google Scholar] [CrossRef]
- Wilhite, D.A.; Sivakumar, M.V.; Pulwarty, R. Managing drought risk in a changing climate: The role of national drought policy. Weather Clim. Extrem. 2014, 3, 4–13. [Google Scholar] [CrossRef]
- Kong, D.; Zhang, Q.; Singh, V.P.; Shi, P. Seasonal Vegetation Response to Climate Change in the Northern Hemisphere (1982–2013). Glob. Planet. Chang. 2016, 148, 1–8. [Google Scholar] [CrossRef]
- Bachmair, S.; Svensson, C.; Hannaford, J.; Barker, L.J.; Stahl, K. A quantitative analysis to objectively appraise drought indicators and model drought impacts. Hydrol. Earth Syst. Sci. 2016, 20, 2589–2609. [Google Scholar] [CrossRef]
- Zhang, R.; Chen, Z.Y.; Xu, L.J.; Ou, C.Q. Meteorological drought forecasting based on a statistical model with machine learning techniques in Shaanxi province, China. Sci. Total Environ. 2019, 665, 338–346. [Google Scholar] [CrossRef]
- Zeng, J.; Zhang, R.; Qu, Y.; Bento, V.A.; Zhou, T.; Lin, Y.; Wu, X.; Qi, J.; Shui, W.; Wang, Q. Improving the drought monitoring capability of VHI at the global scale via ensemble indices for various vegetation types from 2001 to 2018. Weather Clim. Extrem. 2022, 35, 100412. [Google Scholar] [CrossRef]
- West, H.; Quinn, N.; Horswell, M. Remote sensing for drought monitoring & impact assessment: Progress, past challenges and future opportunities. Remote Sens. Environ. 2019, 232, 111291. [Google Scholar]
- Li, Y.; Strapasson, A.; Rojas, O. Assessment of El Niño and La Niña impacts on China: Enhancing the early warning system on food and agriculture. Weather Clim. Extrem. 2020, 27, 100208. [Google Scholar] [CrossRef]
- Sur, C.; Hur, J.; Kim, K.; Choi, W.; Choi, M. An evaluation of satellite-based drought indices on a regional scale. Int. J. Remote Sens. 2015, 36, 5593–5612. [Google Scholar] [CrossRef]
- Behrangi, A.; Khakbaz, B.; Jaw, T.C.; AghaKouchak, A.; Hsu, K.; Sorooshian, S. Hydrologic evaluation of satellite precipitation products over a mid-size basin. J. Hydrol. 2011, 397, 225–237. [Google Scholar] [CrossRef]
- Khan, S.I.; Hong, Y.; Vergara, H.J.; Gourley, J.J.; Brakenridge, G.R.; De Groeve, T.; Flaming, Z.L.; Policelli, F.; Yong, B. Microwave satellite data for hydrologic modeling in ungauged basins. IEEE Geosci. Remote Sens. Lett. 2012, 9, 663–667. [Google Scholar] [CrossRef]
- Yang, G.; Liu, J.; Zhao, C.; Li, Z.; Huang, Y.; Yu, H.; Xu, B.; Yang, X.; Zhu, D.; Zhang, X.; et al. Unmanned aerial vehicle remote sensing for field-based crop phenotyping: Current status and perspectives. Front. Plant Sci. 2017, 8, 1111. [Google Scholar] [CrossRef] [PubMed]
- Huang, Q.; Qin, G.; Zhang, Y.; Tang, Q.; Liu, C.; Xia, J.; Chiew, F.H.S.; Post, D. Using remote sensing data-based hydrological model calibrations for predicting runoff in ungauged or poorly gauged catchments. Water Resour. Res. 2020, 56, e2020WR028205. [Google Scholar] [CrossRef]
- Khaki, M.; Hendricks Franssen, H.J.; Han, S.C. Multi-mission satellite remote sensing data for improving land hydrological models via data assimilation. Sci. Rep. 2020, 10, 18791. [Google Scholar] [CrossRef] [PubMed]
- Guillevic, P.; Koster, R.D.; Suarez, M.J.; Bounoua, L.; Collatz, G.J.; Los, S.O.; Mahanama, S.P.P. Influence of the interannual variability of vegetation on the surface energy balance—A global sensitivity study. J. Hydrometeorol. 2002, 3, 617–629. [Google Scholar] [CrossRef]
- Wan, Z.; Wang, P.; Li, X. Using MODIS Land Surface Temperature and Normalized Difference Vegetation Index products for Monitoring Drought in the Southern Great Plains, USA. Int. J. Remote Sens. 2004, 25, 61–72. [Google Scholar] [CrossRef]
- Bajgiran, P.R.; Darvishsefat, A.A.; Khalili, A.; Makhdoum, M.F. Using AVHRR-based vegetation indices for drought monitoring in the Northwest of Iran. J. Arid. Environ. 2008, 72, 1086–1096. [Google Scholar] [CrossRef]
- Jain, S.K.; Keshri, R.; Goswami, A.; Sarkar, A.; Chaudhry, A. Identification of drought-vulnerable areas using NOAA AVHRR data. Int. J. Remote Sens. 2009, 30, 2653–2668. [Google Scholar] [CrossRef]
- Gouveia, C.; Trigo, R.; Beguería, S.; Vicente-Serrano, S. Drought Impacts on Vegetation Activity in the Mediterranean Region: An Assessment Using Remote Sensing Data and Multi-Scale Drought Indicators. Glob. Planet. Chang. 2016, 151, 15–27. [Google Scholar] [CrossRef]
- Huang, S.; Zheng, X.; Ma, L.; Wang, H.; Huang, Q.; Leng, G.; Meng, E.; Guo, Y. Quantitative Contribution of Climate Change and Human Activities to Vegetation cover Variations Based on GA-SVM Model. J. Hydrol. 2020, 584, 124687. [Google Scholar] [CrossRef]
- Gao, B.C. NDWI—A normalized difference water index for remote sensing of vegetation liquid water from space. Remote Sens. Environ. 1996, 58, 257–266. [Google Scholar] [CrossRef]
- Kogan, F.N. Global Drought Watch from Space. Bull. Am. Meteorol. Soc. 1997, 78, 621–636. [Google Scholar] [CrossRef]
- Wang, L.; Qu, J.J. NMDI: A normalized multi-band drought index for monitoring soil and vegetation moisture with satellite remote sensing. Geophys. Res. Lett. 2007, 34, L20405. [Google Scholar] [CrossRef]
- Sun, P.; Ma, Z.; Zhang, Q.; Singh, V.P.; Xu, C.Y. Modified drought severity index: Model improvement and its application in drought monitoring in China. J. Hydrol. 2022, 612, 128097. [Google Scholar] [CrossRef]
- Brown, J.F.; Wardlow, B.D.; Tadesse, T.; Hayes, M.J.; Reed, B.C. The Vegetation Drought Response Index (VegDRI): A new integrated approach for monitoring drought stress in vegetation. GIScience Remote Sens. 2008, 45, 16–46. [Google Scholar] [CrossRef]
- Rhee, J.; Im, J.; Carbone, G.J. Monitoring agricultural drought for arid and humid regions using multi-sensor remote sensing data. Remote Sens. Environ. 2010, 114, 2875–2887. [Google Scholar] [CrossRef]
- Zhou, L.; Wu, J.; Zhang, J.; Leng, S.; Liu, M.; Zhang, J.; Zhao, L.; Zhang, F.; Shi, Y. The integrated surface drought index (ISDI) as an indicator for agricultural drought monitoring: Theory, validation, and application in Mid-Eastern China. IEEE J. Sel. Top. Appl. Earth Obs. Remote Sens. 2013, 6, 1254–1262. [Google Scholar] [CrossRef]
- Cunha, A.P.M.; Alvalá, R.C.; Nobre, C.A.; Carvalho, M.A. Monitoring vegetative drought dynamics in the Brazilian semiarid region. Agric. For. Meteorol. 2015, 214, 494–505. [Google Scholar] [CrossRef]
- Zhang, J.; Mu, Q.; Huang, J. Assessing the remotely sensed Drought Severity Index for agricultural drought monitoring and impact analysis in North China. Ecol. Indic. 2016, 63, 296–309. [Google Scholar] [CrossRef]
- van Hateren, T.C.; Chini, M.; Matgen, P.; Teuling, A.J. Ambiguous agricultural drought: Characterising soil moisture and vegetation droughts in europe from earth observation. Remote Sens. 2021, 13, 1990. [Google Scholar] [CrossRef]
- Fang, W.; Huang, S.; Huang, Q.; Huang, G.; Wang, H.; Leng, G.; Wang, L.; Guo, Y. Probabilistic Assessment of Remote Sensing-Based Terrestrial Vegetation Vulnerability to Drought Stress of the Loess Plateau in China. Remote Sens. Environ. 2019, 232, 111290. [Google Scholar] [CrossRef]
- Nabaei, S.; Sharafati, A.; Yaseen, Z.M.; Shahid, S. Copula Based Assessment of Meteorological Drought Characteristics: Regional Investigation of Iran. Agric. For. Meteorol. 2019, 276–277, 107611. [Google Scholar] [CrossRef]
- Jha, S.; Das, J.; Sharma, A.; Hazra, B.; Goyal, M.K. Probabilistic Evaluation of Vegetation Drought Likelihood and Its Implications to Resilience across India. Glob. Planet. Chang. 2019, 176, 23–35. [Google Scholar] [CrossRef]
- Wang, L.; Huang, S.; Huang, Q.; Leng, G.; Han, Z.; Zhao, J.; Guo, Y. Vegetation vulnerability and resistance to hydrometeorological stresses in water- and energy-limited watersheds based on a Bayesian framework. Catena 2021, 196, 104879. [Google Scholar] [CrossRef]
- Won, J.; Seo, J.; Kim, S. A copula model integrating atmospheric moisture demand and supply for vegetation vulnerability mapping. Sci. Total Environ. 2022, 812, 151464. [Google Scholar] [CrossRef]
- Ryu, J.S.; Ahn, J.; Kim, S. An Application of Drought Severity-Area-Duration Curves Using Copulas-Based Joint Drought Index. J. Korea Water Resour. Assoc. 2012, 45, 1043–1050. [Google Scholar] [CrossRef][Green Version]
- Dehghani, M.; Saghafian, B.; Zargar, M. Probabilistic Hydrological Drought Index Forecasting Based on Meteorological Drought Index Using Archimedean Copulas. Hydrol. Res. 2019, 50, 1230–1250. [Google Scholar] [CrossRef]
- Won, J.; Kim, S. Future Drought Analysis Using SPI and EDDI to Consider Climate Change in South Korea. Water Supply 2020, 20, 3266–3280. [Google Scholar] [CrossRef]
- Won, J.; Choi, J.; Lee, O.; Kim, S. Copula-Based JOINT Drought INDEX Using SPI and EDDI and Its Application to Climate Change. Sci. Total Environ. 2020, 744, 140701. [Google Scholar] [CrossRef]
- Dixit, S.; Jayakumar, K.V. Spatio-temporal analysis of copula-based probabilistic multivariate drought index using CMIP6 model. Int. J. Climatol. 2022, 42, 4333–4350. [Google Scholar] [CrossRef]
- Seo, J.; Won, J.; Choi, J.; Lee, J.; Kim, S. A copula model to identify the risk of river water temperature stress for meteorological drought. J. Environ. Manage. 2022, 311, 114861. [Google Scholar] [CrossRef]
- Liu, Z.; Li, C.; Zhou, P.; Chen, X. A Probabilistic Assessment of the Likelihood of Vegetation Drought under Varying Climate Conditions across China. Sci. Rep. 2016, 6, 35105. [Google Scholar] [CrossRef]
- McKee, T.B.; Doesken, N.J.; Kleist, J. The Relationship of Drought Frequency and Duration to Time Scales. In Proceedings of the 8th Conference on Applied Climatology, Anaheim, CA, USA, 17–22 January 1993; Volume 17, pp. 179–183. [Google Scholar]
- Shukla, S.; McNally, A.; Husak, G.; Funk, C. A seasonal agricultural drought forecast system for food-insecure regions of East Africa. Hydrol. Earth Syst. Sci. 2014, 18, 3907–3921. [Google Scholar] [CrossRef]
- Shahzaman, M.; Zhu, W.; Ullah, I.; Mustafa, F.; Bilal, M.; Ishfaq, S.; Nisar, S.; Arshad, M.; Iqbal, R.; Aslam, R.W. Comparison of multi-year reanalysis, models, and satellite remote sensing products for agricultural drought monitoring over south asian countries. Remote Sens. 2021, 13, 3294. [Google Scholar] [CrossRef]
- Won, J.; Seo, J.; Lee, J.; Lee, O.; Kim, S. Vegetation Drought Vulnerability Mapping Using a Copula Model of Vegetation Index and Meteorological Drought Index. Remote Sens. 2021, 13, 5103. [Google Scholar] [CrossRef]
- Won, J.; Son, Y.S.; Lee, S.; Kang, L.; Kim, S. Evaluation of Utilization of Satellite Remote Sensing Data for Drought Monitoring. Korean J. Remote Sens. 2021, 37, 1803–1818. [Google Scholar] [CrossRef]
- Kazemzadeh, M.; Noori, Z.; Alipour, H.; Jamali, S.; Akbari, J.; Ghorbanian, A.; Duan, Z. Detecting drought events over Iran during 1983–2017 using satellite and ground-based precipitation observations. Atmos. Res. 2022, 269, 106052. [Google Scholar] [CrossRef]
- Aksoy, H.; Cetin, M.; Eris, E.; Burgan, H.I.; Cavus, Y.; Yildirim, I.; Sivapalan, M. Critical drought intensity-duration-frequency curves based on total probability theorem-coupled frequency analysis. Hydrol. Sci. J. 2021, 66, 1337–1358. [Google Scholar] [CrossRef]
- Wang, H.; Lin, H.; Liu, D. Remotely Sensed Drought Index and Its Responses to Meteorological Drought in Southwest China. Remote Sens. Lett. 2014, 5, 413–422. [Google Scholar] [CrossRef]
- Chere, Z.; Abegaz, A.; Tamene, L.; Abera, W. Modeling and mapping the spatiotemporal variation in agricultural drought based on a satellite-derived vegetation health index across the highlands of Ethiopia. Model. Earth Syst. Environ. 2022, 8, 4539–4552. [Google Scholar] [CrossRef]
- Masroor, M.; Sajjad, H.; Rehman, S.; Singh, R.; Rahaman, M.H.; Sahana, M.; Ahmed, R.; Avtar, R. Analysing the relationship between drought and soil erosion using vegetation health index and RUSLE models in Godavari middle sub-basin, India. Geosci. Front. 2022, 13, 101312. [Google Scholar] [CrossRef]
- Bhuiyan, C.; Saha, A.K.; Bandyopadhyay, N.; Kogan, F.N. Analyzing the impact of thermal stress on vegetation health and agricultural drought—A case study from Gujarat, India. GISci. Remote Sens. 2017, 54, 678–699. [Google Scholar] [CrossRef]
- Sklar, M. Fonctions de repartition an dimensions et leurs marges. Publ. Inst. Statist. Univ. Paris 1959, 8, 229–231. [Google Scholar]
- Sadegh, M.; Ragno, E.; AghaKouchak, A. Multivariate Copula Analysis Toolbox (MvCAT): Describing Dependence and Underlying Uncertainty Using a Bayesian Framework. Water Resour. Res. 2017, 53, 5166–5183. [Google Scholar] [CrossRef]
- Zhao, J.; Huang, S.; Huang, Q.; Wang, H.; Leng, G.; Peng, J.; Dong, H. Copula-based abrupt variations detection in the relationship of seasonal vegetation-climate in the Jing River Basin, China. Remote Sens. 2019, 11, 1628. [Google Scholar] [CrossRef]
- Qin, F.; Ao, T.; Chen, T. Bivariate Frequency of Meteorological Drought in the Upper Minjiang River Based on Copula Function. Water 2021, 13, 2056. [Google Scholar] [CrossRef]
- Avetisyan, D.; Borisova, D.; Velizarova, E. Integrated Evaluation of Vegetation Drought Stress through Satellite Remote Sensing. Forests 2021, 12, 974. [Google Scholar] [CrossRef]
- Cao, S.; He, Y.; Zhang, L.; Chen, Y.; Yang, W.; Yao, S.; Sun, Q. Spatiotemporal characteristics of drought and its impact on vegetation in the vegetation region of Northwest China. Ecol. Indic. 2021, 133, 108420. [Google Scholar] [CrossRef]
- Miller, D.L.; Alonzo, M.; Meerdink, S.K.; Allen, M.A.; Tague, C.L.; Roberts, D.A.; McFadden, J.P. Seasonal and interannual drought responses of vegetation in a California urbanized area measured using complementary remote sensing indices. ISPRS J. Photogramm. Remote Sens. 2022, 183, 178–195. [Google Scholar] [CrossRef]
- Anderegg, W.R.; Kane, J.M.; Anderegg, L.D. Consequences of widespread tree mortality triggered by drought and temperature stress. Nat. Clim. Change 2013, 3, 30–36. [Google Scholar] [CrossRef]
- Xu, H.J.; Wang, X.P.; Zhao, C.Y.; Yang, X.M. Assessing the response of vegetation photosynthesis to meteorological drought across northern China. Land Degrad. Dev. 2021, 32, 20–34. [Google Scholar] [CrossRef]
- Van Quang, N.; Long, D.T.; Anh, N.D.; Hai, T.N. Administrative capacity of local government in responding to natural disasters in developing countries. J. Hum. Earth Future 2021, 2, 114–124. [Google Scholar] [CrossRef]
- Hou, W.; Gao, J.; Wu, S.; Dai, E. Interannual variations in growing-season NDVI and its correlation with climate variables in the southwestern karst region of China. Remote Sens. 2015, 7, 11105–11124. [Google Scholar] [CrossRef]
- Xu, H.J.; Wang, X.P.; Zhao, C.Y.; Yang, X.M. Diverse responses of vegetation growth to meteorological drought across climate zones and land biomes in northern China from 1981 to 2014. Agric. For. Meteorol. 2018, 262, 1–13. [Google Scholar] [CrossRef]
- Ding, Y.; Xu, J.; Wang, X.; Peng, X.; Cai, H. Spatial and Temporal Effects of Drought on Chinese Vegetation under Different Coverage Levels. Sci. Total Environ. 2020, 716, 137166. [Google Scholar] [CrossRef]
- Ding, Y.; Wang, F.; Mu, Q.; Sun, Y.; Cai, H.; Zhou, Z.; Xu, J.; Shi, H. Estimating land use/land cover change impacts on vegetation response to drought under ‘Grain for Green’ in the Loess Plateau. Land Degrad. Dev. 2021, 32, 5083–5098. [Google Scholar] [CrossRef]
- Kim, S.; Han, S.; Kim, E. Stochastic modeling of soil water and plant water stress using cumulant expansion theory. Ecohydrology 2011, 4, 94–105. [Google Scholar] [CrossRef]


Disclaimer/Publisher’s Note: The statements, opinions and data contained in all publications are solely those of the individual author(s) and contributor(s) and not of MDPI and/or the editor(s). MDPI and/or the editor(s) disclaim responsibility for any injury to people or property resulting from any ideas, methods, instructions or products referred to in the content. |
© 2023 by the authors. Licensee MDPI, Basel, Switzerland. This article is an open access article distributed under the terms and conditions of the Creative Commons Attribution (CC BY) license (https://creativecommons.org/licenses/by/4.0/).