Abstract
Atmospheric gravity waves (GWs) in the mesosphere-lower thermosphere (MLT) are crucial for the understanding of general circulation. However, their dynamical characteristics are hardly retrieved due to the difficulty in the high-resolution observation of wind. Therefore, this paper uses eight years (2013–2020) of meteor radar measurements in the MLT region at Mohe station (53.5°N, 122.3°E), China, to retrieve high-temporal-resolution mesospheric wind data and further evaluate the temporal variation of GW kinetic energy. As the detected meteor trails exceed 6, the wind velocity is recalculated using the least square algorithm method, significantly increasing the temporal resolution of wind from 1 h up to 5 min. This resolution is sufficiently high for the investigation of GW kinetic energy, which exhibits a high spatial-temporal variability. For instance, it is enhanced in the winter season during the period of 0200–1400 UT and in the spring season during the period of 0800–1300 UT. The similarity between the climatological characteristics of GWs in MLT and the seasonal variation of GW total energy in the troposphere, determined from high-resolution radiosondes near to Mohe station, suggests that the meteorology in the lower atmosphere could be an important source of GWs in the MLT region.
1. Introduction
Gravity waves (GWs) play a remarkable role in defining the large-scale circulation and thermal structure of the mesosphere-lower thermosphere (MLT) region, and their spatial-temporal variabilities are largely determined by global-scale or synoptic-scale meteorology in the troposphere and stratosphere [1]. Although the instantaneous motion fields at MLT heights are dominated by planetary waves and atmospheric tides for their large horizontal and vertical amplitudes, the largest systemic effects on the MLT region mainly result from small-scale GWs that can transport energy and momentum from the sources in the lower atmosphere to the MLT region [2,3,4].
A variety of techniques have examined the characteristics of GWs in the MLT over a wide range of locations, including ground-based instruments, such as meteor radar [5,6,7], medium-frequency radar [8,9], lidar and airglow imager [10,11,12,13,14,15,16], and instruments on board satellites, such as Thermosphere, Ionosphere, Mesosphere Energetics Dynamics/Sounding of the Atmosphere using Broadband Emission Radiometry (TIMED/SABER) [17,18,19]. However, their working principles and temporal–spatial detection capabilities are somewhat different. By detecting the disturbance in the intensity of OH airglow at nighttime, the airglow imager can identify high-frequency GWs with periods shorter than 1 h in the imaging range [12]. Lidar can measure neutral temperature and wind vertical profiles to further obtain the GWs, but it lacks information in the horizontal direction [10]. TIMED/SABER is capable of providing a global picture of the entire height region from the stratosphere to the MLT region [19], but the detection of specific regions is inefficient. The ability of meteor radar to measure GW momentum fluxes has been investigated [6]. Importantly, meteor radar is an economic instrument that can provide continuous observation of wind fields in the MLT.
The meteor radar has made considerable progress in understanding the large-scale dynamic processes of the MLT region. The meteor radar was first designed in the 1950s [20]. It has been extensively used in investigating neutral winds and wave motions in the height range of 80–100 km [21]. Based on a developed SkiYMET radar system, Hocking and Thayaparan [22] first utilized the least square fitting algorithm to obtain the horizontal hourly winds. Then, numerous research on long period oscillations with a period range from a few hours to a few days has been carried out with hourly meteor winds over the last decades, including atmospheric tides, planetary waves, and the nonlinear interactions between waves [23,24,25]. Hocking [26] showed that the meteor radar observations can obtain the GW momentum fluxes and wind variances with a time scale of 2–3 h by proposing a new method. The winds derived from the radar observations show the seasonal and geographical distributions of GW momentum fluxes and variances [6,27,28].
Investigating the characteristics of GWs is difficult for the meteor radar due to the limitation of the temporal resolution of the meteor winds. Some previous studies optimized the temporary resolution of meteor winds. To investigate the horizontal propagation characteristics of GWs and their specific propagating parameters, Yamamoto et al. [29] averaged the radial drift velocity of meteor echo over 10 min and converted it into horizontal wind velocity. Using a similar method, Suzuki et al. [30] used meteor winds with a 20 min resolution to observe the horizontal wind perturbations caused by GWs. Kumar et al. [31] developed an algorithm to obtain the 15 min resolution meteor wind, which agreed with the hourly wind. The high-resolution winds mentioned above were all estimated during the particular periods with high meteor counts, such as during the meteor shower periods of 0000–0400 UT and 1800–2300 UT.
The meteor radar operated at Mohe, China, has a good measurement capability in detecting meteor echoes [32,33]. Nearly 25,000 meteor counts can be detected per day over Mohe, and the hourly meteor counts of the annual average range from 500 to 1200. The meteor counts are sufficient for continuously estimating the wind with a higher temporal resolution. In this paper, the Mohe meteor radar data are utilized to obtain a 5 min high-resolution wind in the MLT region and then to calculate the GW kinetic energy (. The similarity between the climatological characteristics of GWs in MLT and the variability of GW total energy in the troposphere, which is determined from high-resolution radiosondes close to Mohe station, is discussed. The relationship between GW activity and medium-scale traveling ionospheric disturbances (MSTID) is also discussed based on the statistical results from the Ek distribution obtained from the eight-year meteor data from 2013 to 2020.
2. Data and Methodology
2.1. Meteor Data Description
The Institute of Geology and Geophysics of the Chinese Academy of Sciences (IGGCAS) established a meteor radar chain to record the continuous wind in the MLT region [32,33]. The IGGCAS meteor radar chain, consisting of Mohe, Beijing (BJ, 40.3, 116.2), Wuhan (WH, 30.5, 114.6), and Sanya (SY, 18.3, 109.6), was situated at the 120 meridian from north to south [34]. The radar located at Mohe was manufactured by the Atmospheric Radar Systems of Australia, and it has a peak power of 7.5 kW and a duty cycle of 10% at a frequency of 38.9 MHz. The antenna array consists of six crossed dipoles. A two-element Yagi antenna serves as the transmitter, and the five Yagi antennas serve as the receivers. This system, utilizing the interferometric technique to determine the arrival angles and range of the meteor echoes, is almost identical to the Buckland Park meteor radar operating in Australia and the SKiYMET radar operating in Canada [5,35]. The Mohe meteor radar is able to operate for both daytime and nighttime, continuously, and is generally undisrupted by severe weather conditions.
In addition, the radiosonde measurements (50 m vertical resolution) during the years from 2016 to 2020 at Hailar station (49.25°N; 119.70°E; 650.0 m), near to the meteor radar station, were applied to investigate the variation in GW total energy in the troposphere. The measurements include air temperature, pressure, relative humidity using specially designed hygristors, and wind speed and direction by tracking the position of a drifting balloon using an L-band radar [36,37].
The results in Figure 1 serve as a suitable basis for selecting meteor data. First, the meteor echo candidates considered as being under dense ones in the following analysis are selected. The detailed rejection criteria are shown in Holdsworth et al. [5]. Figure 1a shows that the daily meteor counts are mostly over 20,000, and the maxima exceed 30,000. Day 266 of 2013 is one of the days with a large number of meteor echoes. The meteor peak height () represents the mean height of the echoes detected in a day. Figure 1b shows the variation of daily over the whole year. The red fitting curve reveals that the variation of daily follows a semi-annual variation, and two peaks of the appear in April and September. The results generally agree with the previous research [33]. Figure 1c schematically illustrates the vertical distribution of meteor echoes on day 266 of 2013. The height distribution peaks at above 90 km and extends from 70 km to 110 km. The red curve presents the fitting of the meteor altitude distribution with a normal distribution, which verifies the assumption that the height distribution of the meteor echoes follows a Gaussian distribution [21]. The fitting is centered at 89.73 ± 0.15 km and has a full width at half maximum of 6.82 km. Figure 1d shows that the echo number per hour on the particular day is clearly above the annual average, and a diurnal variation of daily meteor counts is visible [35,38].
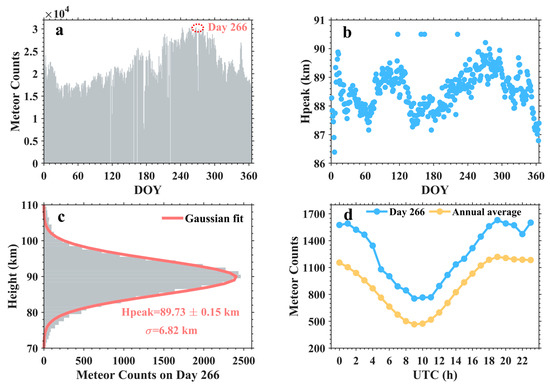
Figure 1.
(a) Daily total meteor trails detected by Mohe radar in 2013, in which the red circle identifies day 266 in 2013 and the corresponding meteor counts. (b) Distribution of daily meteor peak heights. (c) Distribution of meteor counts with height in a bin of 1 km on day 266 in 2013, in which the red curve presents a Gaussian fit. Light blue and yellow dotted lines in (d) display the hourly meteor count on day 266 in 2013 and the averaged value during the whole study period, respectively.
2.2. Least Square Algorithm Method
After grouping a sufficient amount of meteor echo information, including echo radial drift velocities () and angle of arrival (AOA) direction cosines (,,), into a specific height/time bin, a least square algorithm can be utilized to estimate the wind velocity (, , ). The equation is described as follows:
The details of this method were illustrated by Hocking and Thayaparan [22] and Holdsworth and Reid [38]. The present work fully considers the limitations and implicit assumptions of the previous studies on the algorithm to secure against suspect wind estimates. Specifically, it requires a minimum of six echoes in each height/time bin, considers the assumption that , and rejects meteor echoes whose absolute difference between the actual and projected radial wind velocities exceeds 30 .
This paper primarily focuses on meteor winds with a 3 km height resolution. The dailyis the center height of the specific height region.
2.3. Error for Estimating the Meteor Wind
The error for estimating the meteor wind is estimated by the following equations:
where C and A represent the matrices of meteor echo radial drift velocities () and AOA direction cosines (,), respectively. B represents the matrix of wind velocity (, ). N is the number of echoes in each height/time bin and represents the number of equations in the window. t is the degree of freedom of the equations.
2.4. GW Kinetic Energy in the MLT Region
The wind deviations from a background state of the atmosphere can be utilized to analyze wave structures in the meteor winds [39,40]. The mean values of zonal and meridional wind are estimated using the polynomial fit method [41,42,43,44]. The polynomial fits contain a superposition of various gravity and tidal waves because averaging over a full cycle of the diurnal tide is not included in the estimated background state. Therefore, the method mentioned above is not suitable to separate the GWs and the tides.
Suppressing the unwanted wave structures is essential to separate the GWs from the tides and planetary waves. Cai et al. [10] employed the full diurnal cycle data (temperature, wind) in a short period (38 h), and used harmonic fitting to fit the 6, 8, 12, and 24 h tide to obtain a background. Baumgarten et al. [40] and Kopp et al. [45] applied a harmonic fitting with a superposition of diurnal, semidiurnal, and terdiurnal tidal components to the retrieved sounding deviations from the background. The resulting deviations were assumed due to tides because of their stable phases, and the GWs were generated with random phases. Then, removing these fitted deviations induced by the tides (retrieved from a monthly average) from the total deviations, the residuals should only contain the GW information when assuming constant tidal amplitudes during the month. However, the particular tidal modes were not constant over the averaged time period. Hence, this approach is not suitable to separate the GWs from tides because the 1 month averaging results in a complete loss of the tides with short-term variability.
In this paper, the GW extraction method proposed by Kopp et al. [45] and Baumgarten et al. [40] is employed. A Butterworth filter of fifth order as a high pass in the temporal domain is used. The filter properties are selected such that for temporal filtering, waves with a period larger than 8 h are removed. According to the study of Baumgarten et al. [40] and Kopp et al. [45], a cutoff period of 8 h is sufficient to suppress tides because the amplitudes of the tidal waves are relatively smaller than the GWs. The Coriolis frequency over Mohe is rad/s (0.4212 rad/h, is the latitude in radians, and is the rotation rate of the Earth, Ω = 7.2921 × rad/s).
The averaged GW kinetic energy per unit mass ( is approximated as follows [36,41,42,43]:
where , are the GW perturbation components of the zonal and meridional wind velocity, respectively.
2.5. GW Total Energy in the Troposphere
As described in our recent studies in Zhang et al. [36], the GW total energy in the troposphere is extracted based on the broad spectral method, which will be introduced in greater detail below. The total perturbations of wind field and temperature () are derived by removing the background states (, , and ) that are estimated by a second-order polynomial fit [41] from the total measurements. The total perturbations could consist of measurement noises, tidal waves, planetary waves, and GWs. By applying a band-pass filter with vertical wavelengths of 0.3–6.9 km, the perturbation induced by GWs can be filtered. Thereby, the average GW total energy per unit mass (energy density) can be expressed as:
where is the gravitational constant, the normalized perturbation temperature, and the overbar indicates an averaging over all study heights. The study height interval is selected as 2–8.9 km, following Wang and Geller [41].
3. Results
Figure 2 displays an example of the zonal winds estimated by the least squares with different temporal resolutions on 23 September 2013. The red line represents the meteor wind, and the black bar represents the error of the wind velocity. The detailed calculation of the error is shown in Section 2.3. The wind with 60 min resolution shown in Figure 2a is used to analyze the large-scale atmospheric oscillations in the MLT region, such as tidal or planetary waves. The winds maintain a similar variation trend with the increase in the time resolution. The error increases, which indicates that the high temporal resolution winds become more variable. The 5 min wind in Figure 2d reveals some wave fluctuation information. In the previous research, Yamamoto et al. [29] and Suzuki et al. [30] extracted GWs from high-resolution winds. As for the amplitude of neutral wind perturbations, they are possibly related to the estimation error of the neutral wind velocity. Figure 3 shows the variation of error of the zonal winds retrieved by the least square fit with meteor counts’ height/time bin under different temporal resolutions on 23 September 2013. The slashed black line is a regression line of the wind error as a function of the meteor counts. From the slashed black lines in Figure 3, the error of the wind velocity becomes smaller (or larger) as the meteor counts increase (or decrease).
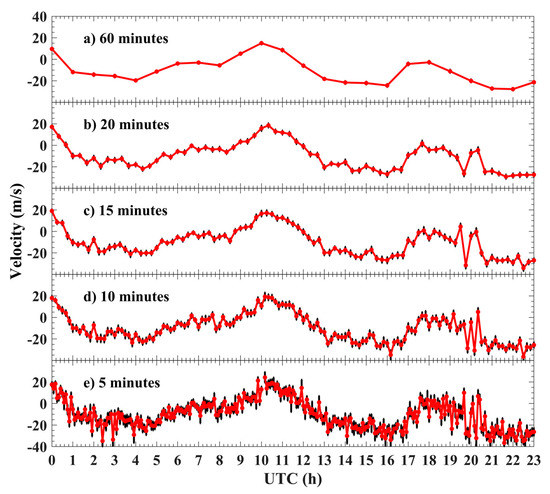
Figure 2.
A typical example of zonal winds (red dot lines) retrieved by the least square fit under different temporal resolutions on 23 September 2013. The vertical black line in Figure 2a−e denotes error, which is estimated from Equation (4).
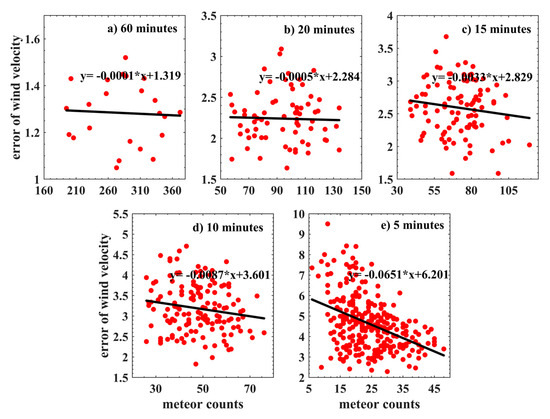
Figure 3.
Variation of error (red dots) of zonal winds retrieved by the least square fit with meteor counts in each height/time bin under different temporal resolutions on 23 September 2013. The slashed black line in Figure 3a−e denotes a regression model of the wind error as a function of the meteor counts obtained by the least square method, and the fitting Equations are remarked on the right of the black lines.
Then, the meteor data observed in 2013 are selected to retrieve the zonal winds under different resolutions, and the results are displayed in Figure 4. As for the high-resolution meteor winds, Figure 4b−e preserves the primary wind structure shown in Figure 4a, and the structure is more definite. Taking Figure 4a as an example, Figure 4a shows that the wind field reveals the tidal variation. The seasonal variation of the tidal signature shows the maximum value during the fall months and winter months. The tidal signature is relatively weaker in the summer months and not obvious in the spring months. Additionally, the strength of the tidal signature is strong at 0300 UT and 1500 UT during the winter months, and 00 UT and 12 UT during the fall months, respectively. The variations of the tidal signature described here are similar to the previous results of Yu et al. [34]. Similarity in the seasonal variation is also found in the nearby sites, as studied by Jacobi [46]. The meteor wind with 5 min temporal resolution also shows the tidal variation mentioned above.
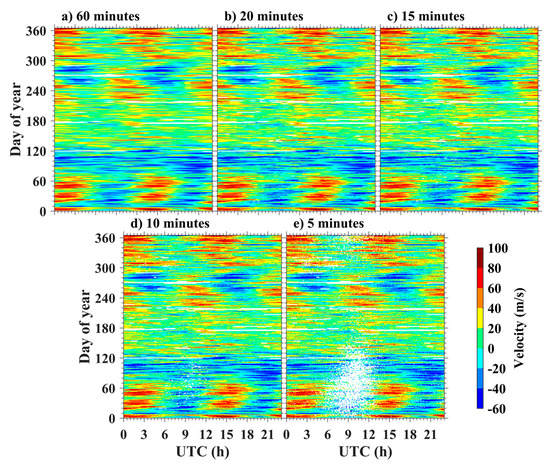
Figure 4.
Hour−day cross sections of zonal winds retrieved under different temporal resolutions in 2013. The blank spaces are due to a lack of meteor counts.
Figure 5 shows an example of 5 min zonal wind and 5 min meridional wind on day 266 of 2013. The solid lines are the retrieved winds, and the dotted lines are the polynomial fits that represent the background mean values. Section 2.4 shows the details. The dU (dV) is the difference between the retrieved zonal (meridional) wind and the mean values. Wave-like perturbations can be seen in dU and dV (Figure 5). The maximum amplitude of dU occurs at 1000 and 1930 UT, and has a value of. During the period from 1700 UT to 2400 UT, the dU shows atmospheric oscillations with an hourly period. The maximum amplitude of dV also occurs at 1000 and 1930 UT, and has a value of. The long-period changes suggest that the meteor radar records the tidal waves in the MLT region, which can be expected.
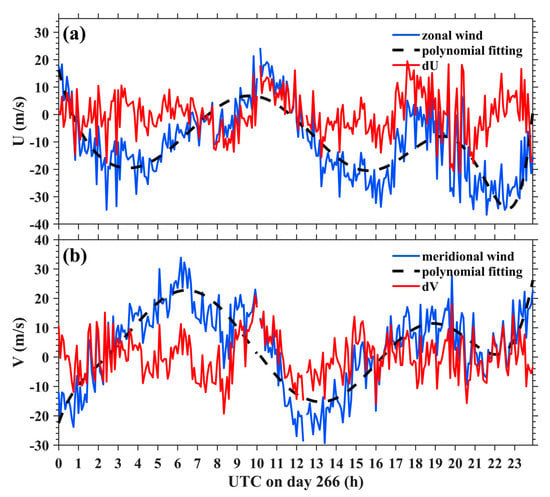
Figure 5.
(a) Total zonal wind variations (blue line), polynomial fitted wind (black dotted line), and the wind perturbation (red line) on day 266 in 2013. Similarly, (b) indicates the result for meridional wind.
To extract the wave perturbations related to GWs, a high-pass filter with a cut-off frequency at 8 h is applied to remove the long-period signal, which is described in Section 2.4. Figure 6a,b shows the zonal (meridional) velocity perturbation caused by GWs on day 266 in 2013. Mostly, the value zonal component of GW perturbation varies steadily from −10 m/s to 10 m/s, while at 2000–2100 UT, the value zonal component of GW perturbation changes strongly, reaching 25 m/s. The variation above can also be observed in Figure 2e at 2000–2100 UT, when the wind velocity become more variable. The variation of the meridional component of GW perturbation (Figure 6b) shows two maxima at 0200 UT and 2000–2100 UT. The value of the meridional component of GW perturbation is smaller than that in Figure 6a.
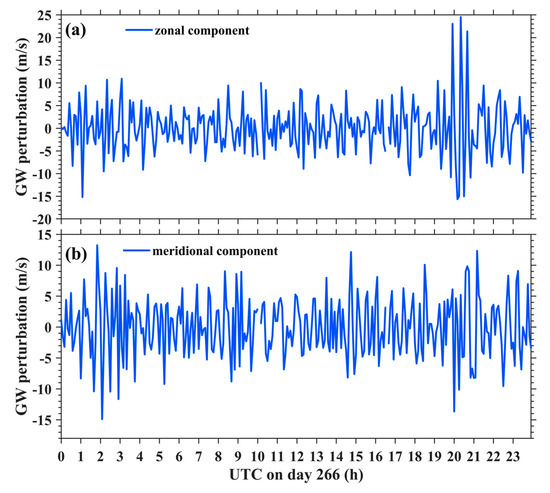
Figure 6.
(a) Zonal wind velocity perturbation caused by GW (blue line) on day 266 in 2013. Similarly, (b) indicates the result for the meridional component.
Figure 7 displays the comparison between the error wind velocity (red dots) and absolute value of GW perturbation of 5 min natural wind (black dots) on day 266 in 2013. In general, both the error wind velocity and GW perturbation become smaller (or larger) as the meteor counts increase (or decrease). The value distribution of the absolute value of the GW perturbation (from 0 m/s to 25 m/s) is much wider than the error wind velocity (from 2 m/s to 10 m/s).
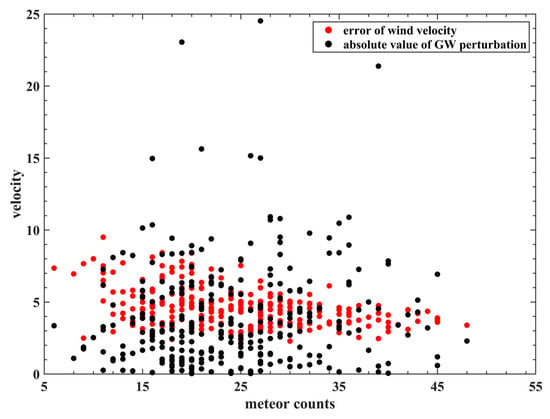
Figure 7.
Comparison between error wind velocity (red dots) and absolute value of GW perturbation of 5 min wind (black dots) on day 266 in 2013.
The GW is calculated using Equation (5) in Section 2.4. Figure 8 shows the variations of the strength as functions of universal time and season in the monthly and hourly bins. The Ek here is calculated using the eight-year meteor data from 2013 to 2020. Cai et al. [11] suggests that the value of GW potential energy, Ep, at ~90 km in the MLT region is about 50 J/kg. Based on the linear theory of GWs, the ratio ( stands for the GW potential energy) is a constant ranging from 5/3 to 2.0 [47]. This suggests the ~90 km in the MLT region is about 80–100 J/kg. Therefore, the value of GW kinetic energy in Figure 8 is close to the result above. The results in Figure 8 suggest that the strength of GW has clear dependences on season and universal time. The strong GW activity appears in spring (March, April, and May) and winter (December, January, and February). Specifically, the maximum value of Ek occurs during 0200–1400 UT in winter and 0800–1300 UT in spring. The observational results in Jia et al. [48] suggest that the GW variances at ~90 km over Mohe are generally positively strong in the summer months. The variation of zonal GW variances shows a maximum reaching 180 in May, and the meridional GW variances show a maximum reaching 180 in July, respectively.
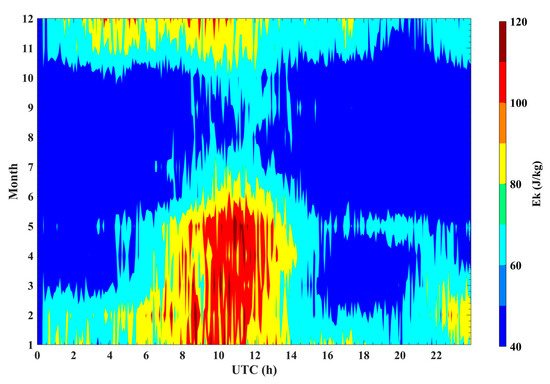
Figure 8.
Hour-mouth cross section of GW kinetic energy calculated by 5 min Mohe meteor radar. The estimated energy is averaged over the whole study period.
The hourly (seasonal) variation of GW kinetic energy calculated using the eight-year meteor data from 2013 to 2020 in the MLT region shows a maximum at 1100 UT (spring) (Figure 9). Figure 10a displays the GW kinetic energy at ~90 km in the MLT region at 1200 UT. In each year of 2016–2020, The monthly variation of here shows semiannual variation with two maxima in Dec−Jan and May. The variability of GW total energy, Et, in the troposphere estimated by the radiosonde measurements close to the Mohe meteor radar station clearly shows the strong GW activities in the spring months, especially in May (Figure 10b). The similarity between the mesospheric GW kinetic energy and GW total energy in troposphere is that both of these GW energies are enhanced in May.
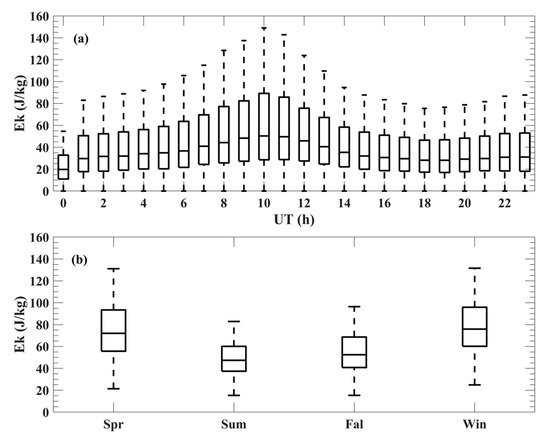
Figure 9.
(a) Hourly and (b) seasonal whisker boxes for the GW kinetic energy .
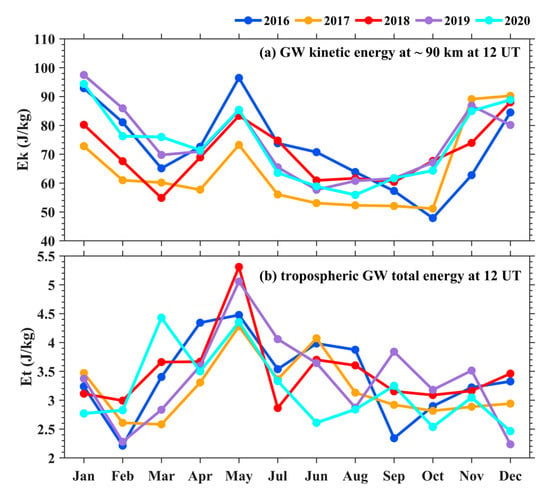
Figure 10.
(a) GW kinetic energy at ~90 km at 12 UT. (b) Tropospheric GW total energy at 12 UT.
The local Kelvin-Helmholtz instability could be the major generation source for GWs in the troposphere [36]. In addition, the jet stream in the upper troposphere could be a secondary source.
4. Discussion and Conclusions
Atmospheric GWs propagating from the surface into the MLT region are important due to their efficient vertical transport of energy and momentum from sources at lower altitudes into the stratosphere and the MLT [49]. However, the wave structures, especially the dynamical characteristics in the MLT region and its link with the lower atmosphere, still warrant further observational investigation. This paper analyzes the eight-year meteor data over Mohe from 2013 to 2020 to investigate the high-temporal-resolution mesospheric wind and the GW activity in the MLT region. In addition, the variability of GW activities in the troposphere near to the radar station is simultaneously analyzed.
Using least square fitting, the high-temporal-resolution mesospheric winds are calculated over Mohe station. The wind field with the temporal resolution ranging from 60 min to 5 min reveals the tidal signature and seasonal variation in the MLT region. The seasonal variation of the tidal signature shows the maximum value during the fall months and the winter months. Additionally, the strength of the tidal signature is strong at 0300 UT and 1500 UT during the winter months, and 0000 UT and 1200 UT during the fall months. The variations of the tidal signature are consistent with the previous results. The meteor wind with 5 min temporal resolution also shows the tidal variation mentioned above.
The GW kinetic energy, in the MLT region contains clear seasonal and local time dependences. The seasonal variation of shows a maximum in May (reaching 120 J/kg), and a second maximum in Dec−Jan. The hourly variation of shows a maximum at 1100 UT. The maximum values of averaged Ek, composed by the eight-year data from 2013 to 2020, occur in winter during 0200–1400 UT and in spring during 0800–1300 UT.
The variability of GW total energy, Et, in the troposphere estimated by the radiosonde measurements close to the Mohe meteor radar station clearly shows the strong GW activities in the spring months, especially in May. Simultaneously, the variation of GW kinetic energy at ~90 km also shows a maximum in the spring months, especially in May. The similarity between the GW kinetic energy in the MLT region and the GW total energy in the troposphere is that both GW energies are enhanced in May. The similarity between the climatological characteristics of GWs in MLT and the variability of the GW total energy in the troposphere suggest that the meteorology in the lower atmosphere could be an important source of GWs in the MLT region. The local Kelvin-Helmholtz instability could be the major generation source for GWs in the troposphere [36].
Moreover, the upward propagation GWs in the MLT could be closely associated with the occurrence rates of middle-scale traveling ionospheric disturbance (MSTID) in the ionosphere. MSTIDs are considered the manifestation of atmospheric GWs of lower atmospheric origins in the ionosphere [50,51,52,53]. As is known, the upward propagating GWs can largely increase the amplitude to maintain kinetic energy, which is due to the decrease in the neutral density in the thermosphere [52]. Eventually, the upward propagating GWs break up and generate secondary GWs to accelerate Perkins instability, causing the generation of MSTIDs [52,53]. In addition, the coupling effects between the sporadic E layer (Es) and Perkins instability can be responsible for generating the MSTIDs, especially in the nighttime ionosphere. However, Cheng et al. [53] reported that the AGWs may have a significant contribution to MSTIDs in both daytime and nighttime in summer. The results in Cheng et al. [53] show a high occurrence rate of the southward (equatorward) MSTIDs during 0000–1300 UT in winter in Taiwan (14.5 geomagnetic latitude; 32.5 inclination). Southward MSTIDs mainly occur around 1300–1900 UT during summer. Otsuka et al. [52] suggest that the MSTID occurrence rate reached a peak at 1300–1400 UT in nighttime during summer in Japan (133.0−137.0, 33.0−37.0). In nighttime during the winter, the MSTID occurrence rate peaks at 1400 and ~1000 UT under low and high solar activity conditions, respectively. Huang et al. [54] suggest that the MSTIDs had a high occurrence rate during 1100–1900 UT at night in May at midlatitudes over central China. Daytime MSTID frequently occurred during 0000–0900 UT in winter. In the current paper, strong GW activity in the MLT region occurs during 0200–1400 UT in winter and 0800–1300 UT in spring. The temporal and monthly distributions of the strength of the GW kinetic energy agree with the occurrence rates of MSTID, while the similarity between the climatological characteristics of GWs in MLT and MSTID still needs further investigation.
The neutral wind estimated from the meteor data using the traditional least square algorithm is efficient, and the mathematical process can still be improved. The new algorithm in deriving the high-resolution meteor wind and its application in the GW observation will be investigated in the future.
Author Contributions
Conceptualization, C.L. methodology, C.L., Y.-Y.S., and J.Z.; validation, C.L., H.Y., and J.Z.; resources, T.Y.; data curation, J.Z. and H.Y.; writing—original draft preparation and revision, C.L., J.Z., C.X., N.Y., J.W., X.Y., Y.L., and H.Y.; figure revision, J.W., Y.-Y.S., and J.Z.; supervision, H.Y. All authors have read and agreed to the published version of the manuscript.
Funding
This research was funded by the National Natural Science Foundation of China under grants 42230207, 41874185, 42174211, 42104165, and 42205074; the Specialized Research Fund for State Key Laboratories; and the Fundamental Research Funds for the Central Universities, China University of Geosciences (Wuhan).
Data Availability Statement
We would like to acknowledge the use of data from the Chinese Meridian Project (https://data.meridianproject.ac.cn/ (accessed on 1 January 2021)).
Acknowledgments
We are very grateful to the reviewers who significantly contributed to the improvement of this paper.
Conflicts of Interest
The authors declare no conflict of interest.
References
- Smith, A.K.; Pedatella, N.M.; Marsh, D.R.; Matsuo, T. On the dynamical control of the mesosphere–lower thermosphere by the lower and middle atmosphere. J. Atmos. Sci. 2017, 74, 933–947. [Google Scholar] [CrossRef]
- Fritts, D.C.; Alexander, M.J. Gravity wave dynamics and effects in the middle atmosphere. Rev. Geophys. 2003, 41, 1003. [Google Scholar] [CrossRef]
- Dong, W.; Hickey, M.P.; Zhang, S. A numerical study of gravity waves propagation characteristics in the mesospheric Doppler duct. J. Geophys. Res. Atmos. 2021, 126, e2021JD034680. [Google Scholar] [CrossRef]
- Dong, W.; Fritts, D.C.; Hickey, M.P.; Liu, A.Z.; Lund, T.S.; Zhang, S.; Yan, Y.; Yang, F. Modeling studies of gravity wave dynamics in highly structured environments: Reflection, trapping, instability, momentum transport, secondary gravity waves, and induced flow responses. J. Geophys. Res. Atmos. 2022, 127, e2021JD035894. [Google Scholar] [CrossRef]
- Holdsworth, D.A.; Reid, I.M.; Cervera, M.A. Buckland Park all-sky interferometric meteor radar. Radio Sci. 2004, 39, RS5009. [Google Scholar] [CrossRef]
- Fritts, D.C.; Janches, D.; Hocking, W.K. Southern Argentina agile meteor radar: Initial assessment of gravity wave momentum fluxes. J. Geophys. Res. 2010, 115, D19123. [Google Scholar] [CrossRef]
- Gu, S.; Hou, X.; Li, N.; Yi, W.; Ding, Z.; Chen, J.; Hu, G.; Dou, X. First Comparative Analysis of the Simultaneous Horizontal Wind Observations by Collocated Meteor Radar and FPI at Low Latitude through 892.0-nm Airglow Emission. Remote Sens. 2021, 13, 4337. [Google Scholar] [CrossRef]
- Gavrilov, N.M.; Riggin, D.M.; Fritts, D.C. Medium-frequency radar studies of gravity-wave seasonal variations over Hawaii (22 N, 160 W). J. Geophys. Res. 2003, 108, 4655. [Google Scholar] [CrossRef]
- Manson, A.H.; Meek, C.; Koshyk, J.; Franke, S.; Fritts, D.; Riggin, D.; Hall, C.; Hocking, W.; MacDougall, J.; Igarashi, K.; et al. Gravity wave activity and dynamical effects in the middle atmosphere (60–90 km): Observations from an MF/MLT radar network, and results from the Canadian Middle Atmosphere Model (CMAM). J. Atmos. Sol. Terr. Phys. 2002, 64, 65–90. [Google Scholar] [CrossRef]
- Cai, X.; Yuan, T.; Zhao, Y.; Pautet, P.-D.; Taylor, M.J.; Pendleton, W.R., Jr. A coordinated investigation of the gravity wave breaking and the associated dynamical instability by a Na lidar and an advanced mesosphere temperature mapper over Logan, UT (41.7° N, 111.8° W). J. Geophys. Res. Space Phys. 2014, 119, 6852–6864. [Google Scholar] [CrossRef]
- Cai, X.; Yuan, T.; Liu, H.-L. Large-scale gravity wave perturbations in the mesopause region above Northern Hemisphere midlatitudes during autumnal equinox: A joint study by the USU Na lidar and Whole Atmosphere Community Climate Model. Ann. Geophys. 2017, 35, 181–188. [Google Scholar] [CrossRef]
- Jia, M.; Yuan, J.; Wang, C.; Xia, H.; Wu, Y.; Zhao, L.; Wei, T.; Wu, J.; Wang, L.; Gu, S.-Y.; et al. Long-lived high-frequency gravity waves in the atmospheric boundary layer: Observations and simulations. Atmos. Chem. Phys. 2019, 19, 15431–15446. [Google Scholar] [CrossRef]
- Baumgarten, K.; Gerding, M.; Baumgarten, G.; Lübken, F.-J. Temporal variability of tidal and gravity waves during a record long 10-day continuous lidar sounding. Atmos. Chem. Phys. 2018, 18, 371–384. [Google Scholar] [CrossRef]
- Li, F.; Liu, A.Z.; Swenson, G.R.; Hecht, J.H.; Robinson, W.A. Observations of gravity wave breakdown into ripples associated with dynamical instabilities. J. Geophys. Res. 2005, 110, D09S11. [Google Scholar] [CrossRef]
- Yang, F.; Liu, A.Z. Stability characteristics of the mesopause region above the Andes. J. Geophys. Res. Space Phys. 2022, 127, e2022JA030315. [Google Scholar] [CrossRef]
- Reichert, R.; Kaifler, B.; Kaifler, N.; Rapp, M.; Pautet, P.-D.; Taylor, M.J.; Kivi, R. Retrieval of intrinsic mesospheric gravity wave parameters using lidar and airglow temperature and meteor radar wind data. Atmos. Meas. Tech. 2019, 12, 5997–6015. [Google Scholar] [CrossRef]
- Yamashita, C.; England, S.L.; Immel, T.J.; Chang, L.C. Gravity wave variations during elevated stratopause events using SABER observations. J. Geophys. Res. Atmos. 2013, 118, 5287–5303. [Google Scholar] [CrossRef]
- Thurairajah, B.; Cullens, C.Y. On the downward progression of stratospheric temperature anomalies using long-term SABER observations. J. Geophys. Res. Atmos. 2022, 127, e2022JD036487. [Google Scholar] [CrossRef]
- John, S.R.; Kumar, K.K. TIMED/SABER observations of global gravity wave climatology and their interannual variability from stratosphere to mesosphere lower thermosphere. Clim. Dyn. 2012, 39, 1489–1505. [Google Scholar] [CrossRef]
- Elford, W.G.; Robertson, D.S. Measurements of winds in the upper atmosphere by means of drifting meteor trails II. J. Atmos. Terr. Phys. 1953, 4, 271–284. [Google Scholar] [CrossRef]
- Hocking, W.K.; Thayaparan, T.; Jones, J. Meteor decay times and their use in determining a diagnostic mesospheric temperature-pressure parameter: Methodology and one year of data. Geophys. Res. Lett. 1997, 24, 2977–2980. [Google Scholar] [CrossRef]
- Hocking, W.K.; Thayaparan, T. Simultaneous and colocated observation of winds and tides by MF and meteor radars over London, Canada (43°N, 81°W), during 1994–1996. Radio Sci. 1997, 32, 833–865. [Google Scholar] [CrossRef]
- Miyahara, S.; Forbes, J. Interaction between gravity waves and the diurnal tide in the mesosphere and lower thermosphere. J. Meteorol. Soc. Jpn. 1991, 69, 523–531. [Google Scholar] [CrossRef]
- Fritts, D.C.; Iimura, H.; Janches, D.; Lieberman, R.S.; Riggin, D.M.; Mitchell, N.J.; Vincent, R.A.; Reid, I.M.; Murphy, D.J.; Tsutsumi, M.; et al. Structure, variability, and mean-flow interactions of the January 2015 quasi-2-day wave at middle and high southern latitudes. J. Geophys. Res. Atmos. 2019, 124, 5981–6008. [Google Scholar] [CrossRef]
- Gong, Y.; Xue, J.; Ma, Z.; Zhang, S.; Zhou, Q.; Huang, C.; Huang, K.; Yu, Y.; Li, G. Strong quarterdiurnal tides in the mesosphere and lower thermosphere during the 2019 Arctic sudden stratospheric warming over Mohe, China. J. Geophys. Res. Space Phys. 2021, 126, e2020JA029066. [Google Scholar] [CrossRef]
- Hocking, W.K. A new approach to momentum flux determinations using SKiYMET meteor radars. Ann. Geophys. 2005, 23, 2433–2439. [Google Scholar] [CrossRef]
- de Wit, R.J.; Janches, D.; Fritts, D.C.; Stockwell, R.G.; Coy, L. Unexpected climatological behavior of MLT gravity wave momentum flux in the lee of the Southern Andes hot spot. Geophys. Res. Lett. 2017, 44, 1182–1191. [Google Scholar] [CrossRef]
- Wilhelm, S.; Stober, G.; Brown, P. Climatologies and long-term changes in mesospheric wind and wave measurements based on radar observations at high and mid latitudes. Ann. Geophys. 2019, 37, 851–875. [Google Scholar] [CrossRef]
- Yamamoto, M.; Tsuda, T.; Kato, S. Gravity waves observed by the Kyoto meteor radar in 1983-1985. J. Atmos. Sol.-Terr. Phys. 1986, 48, 597–603. [Google Scholar] [CrossRef]
- Suzuki, S.; Nakamura, T.; Ejiri, M.K.; Tsutsumi, M.; Shiokawa, K.; Kawahara, T.D. Simultaneous airglow, lidar, and radar measurements of mesospheric gravity waves over Japan. J. Geophys. Res. 2010, 115, D24113. [Google Scholar] [CrossRef]
- Kumar, K.K.; Antonita, T.M.; Shelbi, S.T. Initial results from SKiYMET meteor radar at Thumba (8.5°N, 77°E): 2. Gravity wave observations in the MLT region. Radio Sci. 2007, 42, RS6009. [Google Scholar] [CrossRef]
- Liu, L.; Liu, H.; Chen, Y.; Le, H.; Sun, Y.-Y.; Ning, B.; Hu, L.; Wan, W. Variations of the meteor echo heights at Beijing and Mohe, China. J. Geophys. Res. Space Phys. 2016, 122, 1117–1127. [Google Scholar] [CrossRef]
- Liu, L.; Liu, H.; Le, H.; Chen, Y.; Sun, Y.-Y.; Ning, B.; Hu, L.; Wan, W.; Li, N.; Xiong, J. Mesospheric temperatures estimated from the meteor radar observations at Mohe, China. J. Geophys. Res. Space Phys. 2017, 122, 2249–2259. [Google Scholar] [CrossRef]
- Yu, Y.; Wan, W.; Ren, Z.; Xiong, B.; Zhang, Y.; Hu, L.; Ning, B.; Liu, L. Seasonal variations of MLT tides revealed by a meteor radar chain based on Hough mode decomposition. J. Geophys. Res. Space Phys. 2015, 120, 7030–7048. [Google Scholar] [CrossRef]
- Hocking, W.K.; Fuller, B.; Vandepeer, B. Real-time determination of meteor-related parameters utilizing modern digital technology. J. Atmos. Sol.-Terr. Phys. 2001, 63, 155–169. [Google Scholar] [CrossRef]
- Zhang, J.; Guo, J.; Xue, H.; Zhang, S.; Huang, K.; Dong, W.; Shao, J.; Yi, M.; Zhang, Y. Tropospheric gravity waves as observed by the high-resolution China radiosonde network and their potential sources. J. Geophys. Res. Atmos. 2022, 127, e2022JD037174. [Google Scholar] [CrossRef]
- Zhang, J.; Guo, J.; Li, J.; Zhang, S.; Tong, B.; Shao, J.; Li, H.; Zhang, Y.; Cao, L.; Zhai, P.; et al. A climatology of merged daytime planetary boundary layer height over China from radiosonde measurements. J. Geophys. Res. Atmos. 2022, 127, e2021JD036367. [Google Scholar] [CrossRef]
- Holdsworth, D.A.; Reid, I.M. The Buckland Park MF radar: Routine observation scheme and velocity comparisons. Ann. Geophys. 2004, 22, 3815–3828. [Google Scholar] [CrossRef]
- Ehard, B.; Kaifler, B.; Kaifler, N.; Rapp, M. Evaluation of methods for gravity wave extraction from middle-atmospheric lidar temperature measurements. Atmos. Meas. Tech. 2015, 8, 4645–4655. [Google Scholar] [CrossRef]
- Baumgarten, K.; Gerding, M.; Lübken, F.J. Seasonal variation of gravity wave parameters using different filter methods with daylight lidar measurements at midlatitudes. J. Geophys. Res. 2017, 122, 2683–2695. [Google Scholar] [CrossRef]
- Wang, L.; Geller, M.A. Morphology of gravity-wave energy as observed from 4 years (1998–2001) of high vertical resolution U.S. radiosonde data. J. Geophys. Res. 2003, 108, 4489. [Google Scholar] [CrossRef]
- Wang, L.; Geller, M.A.; Alexander, M.J. Spatial and temporal variations of gravity wave parameters, Part I: Intrinsic frequency, wavelength, and vertical propagation direction. J. Atmos. Sci. 2005, 62, 125–142. [Google Scholar] [CrossRef]
- Zhang, S.D.; Yi, F. Latitudinal and seasonal variations of inertial gravity wave activity in the lower atmosphere over central China. J. Geophys. Res. 2007, 112, D05109. [Google Scholar] [CrossRef]
- Alexander, S.P.; Klekociuk, A.R.; Murphy, D.J. Rayleigh lidar observations of gravity wave activity in the winter upper stratosphere and lower mesosphere above Davis, Antarctica (69°S, 78°E). J. Geophys. Res. Atmos. 2011, 116, 1–12. [Google Scholar] [CrossRef]
- Kopp, M.; Gerding, M.; Höffner, J.; Lübken, F.-J. Tidal signatures in temperatures derived from daylight lidar sound- ings above Kühlungsborn (54°N, 12°E). J. Atmos. Sol.-Terr. Phys. 2015, 127, 37–50. [Google Scholar] [CrossRef]
- Jacobi, C. 6 year mean prevailing winds and tides measured by VHF meteor radar over Collm (51.3°N, 13.0°E). J. Atmos. Sol. -Terr. Phys. 2012, 78, 8–18. [Google Scholar] [CrossRef]
- VanZandt, T.E. A model for gravity wave spectra observed by Doppler sounding systems. Radio Sci. 1985, 20, 1323–1330. [Google Scholar] [CrossRef]
- Jia, M.; Xue, X.; Gu, S.; Chen, T.; Ning, B.; Wu, J.; Zeng, X.; Dou, X.; Mingjiao, J.; Xianghui, X.; et al. Multiyear observations of gravity wave momentum fluxes in the midlatitude mesosphere and lower thermosphere region by meteor radar. J. Geophys. Res. Space Phys. 2018, 123, 5684–5703. [Google Scholar] [CrossRef]
- Fritts, D.C.; Wang, L.; Taylor, M.J.; Pautet, P.-D.; Criddle, N.R.; Kaifler, B.; Eckermann, S.D.; Liley, B. Large-amplitude mountain waves in the mesosphere observed on 21 June 2014 during DEEPWAVE: 2. Nonlinear dynamics, wave breaking, and instabilities. J. Geophys. Res. Atmos. 2019, 124, 10006–10032. [Google Scholar] [CrossRef]
- Hunsucker, R.D. Atmospheric gravity waves generated in the high-latitude ionosphere: A review. Rev. Geophys. 1982, 20, 293–315. [Google Scholar] [CrossRef]
- Hines, C.O. Internal atmospheric gravity waves at ionospheric height. Can. J. Phys. 1960, 38, 1441–1481. [Google Scholar] [CrossRef]
- Otsuka, Y.; Shinbori, A.; Tsugawa, T.; Nishioka, M. Solar activity dependence of medium-scale traveling ionospheric disturbances using GPS receivers in Japan. Earth Planets Space 2021, 73, 22. [Google Scholar] [CrossRef]
- Cheng, P.H.; Lin, C.; Otsuka, Y.; Liu, H.; Rajesh, P.K.; Chen, C.-H.; Lin, J.-T.; Chang, M.T. Statistical study of medium-scale traveling ionospheric disturbances in low-latitude ionos-phere using an automatic algorithm. Earth Planets Space 2021, 73, 105. [Google Scholar] [CrossRef]
- Huang, F.; Lei, J.; Otsuka, Y.; Luan, X.; Liu, Y.; Zhong, J.; Dou, X. Characteristics of medium-scale traveling ionospheric disturbances and ionospheric irregularities at mid-latitudes revealed by the total electron content associated with the Beidou geostationary satellite. IEEE Trans. Geosci. Remote Sens. 2020, 59, 6424–6430. [Google Scholar] [CrossRef]
Disclaimer/Publisher’s Note: The statements, opinions and data contained in all publications are solely those of the individual author(s) and contributor(s) and not of MDPI and/or the editor(s). MDPI and/or the editor(s) disclaim responsibility for any injury to people or property resulting from any ideas, methods, instructions or products referred to in the content. |
© 2023 by the authors. Licensee MDPI, Basel, Switzerland. This article is an open access article distributed under the terms and conditions of the Creative Commons Attribution (CC BY) license (https://creativecommons.org/licenses/by/4.0/).