1. Introduction
Mesosphere–stratosphere–troposphere (MST) radar uses a large-scale phased antenna array to observe the three-dimensional wind fields in the high mesosphere, low stratosphere, and troposphere [
1,
2,
3,
4,
5]. The radar works in the very high frequency (VHF) frequency band and mainly depends on turbulent scattering, Fresnel reflection, and heat scattering to receive the echoes. Its greatest advantage is to conduct unattended continuous observations under any weather conditions and to obtain data with high spatial and temporal resolution. Its ability to detect the tropopause is irreplaceable and impressive.
The tropopause is a highly coupled region between the upper troposphere and the lower stratosphere. The matter and energy exchange between the stratosphere and troposphere will pass through the tropopause. The tropopause was discovered at the end of the 19th century [
6]. The observations of radiosonde, reanalysis data, radio Global Positioning System (GPS) occultation inversion, and so on are often applied to study the tropopause [
7,
8,
9,
10]. The radiosonde data available in the ESRL radiosonde database provide abundant information including pressure, temperature, humidity, etc., but the time resolution is as long as 12 h. An MST radar can continuously measure the atmospheric three-dimensional wind field in any weather conditions with a sampling rate less than 30 min [
2,
11]. An MST radar occupies a very large area, requires a very high budget, and needs relatively high electronic technology; thus, few countries have the ability to construct an MST radar. On the other hand, radiosonde, reanalysis, and satellite data datasets are widely used to study the long-term (annual or longer) changes of tropopause height [
12,
13]. However, it is difficult with these data to investigate the short-term (diurnal or shorter) variations and disturbances in the tropopause. The MST radar operated in the VHF band offers the possibility to study the short-period variations of the tropopause height. Yamamoto et al. (2003) introduced the ability of the equatorial atmosphere radar (ERA) to observe the tropical tropopause with a high time resolution [
14]. The observations of the Gadanki MST radar have confirmed the significance of VHF radar measurements of the tropical tropopause [
15,
16]. Mehta et al. (2010) used the MST radar to study the variation of tropopause height in the Indian monsoon region. In short, MST radars can be effectively applied to investigate the height variations of the tropopause [
17].
Heavy rain is one of the major meteorological disasters in the world. Prolonged rainstorms can lead to flooding in low-lying areas and produce floods. Continuous rainstorms as well as heavy and extremely heavy rainstorms in a certain area often lead to flash floods, dam collapses of reservoirs, overflowing rivers, collapsed houses, submerged farmland, and the interruption of transportation and telecommunications, which will bring harm to the national economy and people’s lives and property. The formation process of heavy rain is quite complicated. Generally speaking, from macroscopic physical conditions, the main physical conditions for generating heavy rain include sufficient and continuous water vapor, strong and persistent airflow upward movement, as well as the instability of the atmosphere structure. The favorable combination of large, medium, and small weather systems and underlying surfaces, especially topography, can induce larger rainstorms. The weather systems that cause large-scale heavy rain in China mainly include fronts, cyclones, shear lines, low vortices, troughs, typhoons, easterly waves, and tropical convergence zones. Heavy rain is a short-term weather process that occurs in the troposphere. Previous research on heavy rain has mostly focused on the tropospheric weather system and mesoscale simulation, and less attention has focused on the coupling between the tropopause and stratosphere. It was observed that tropopause descent is mainly due to the increased deep convective activity [
18]. Based on the NCEP/NCAR final analysis dataset and the gridded rainfall data provided by the Indian Meteorological Department, the potential vortex, tropopause fluctuations in northern India and adjacent areas, and ozone mixing ratio changes were investigated, and the western disturbance was considered to contribute to the winter precipitation in northern India from 2009 to 2018 [
19]. The analysis results of the weather conditions and kinematic processes indicated that the tropopause folds are closely related to the occurrence of heavy rain.
During the heavy rain on 1–2 June 2015 over central China, the Wuhan MST radar was used to investigate the atmospheric responses to the rare heavy rain. The tropopause descent over the radar station was clearly recorded. The measurements of the radiosonde in Wuhan as well as ERA5 reanalysis data also confirmed the observations of the radar. Based on the observations of the Wuhan MST radar and the reanalysis data, we attempted to find the physical connection between the tropopause descent and the heavy rain.
2. Experiment Overview
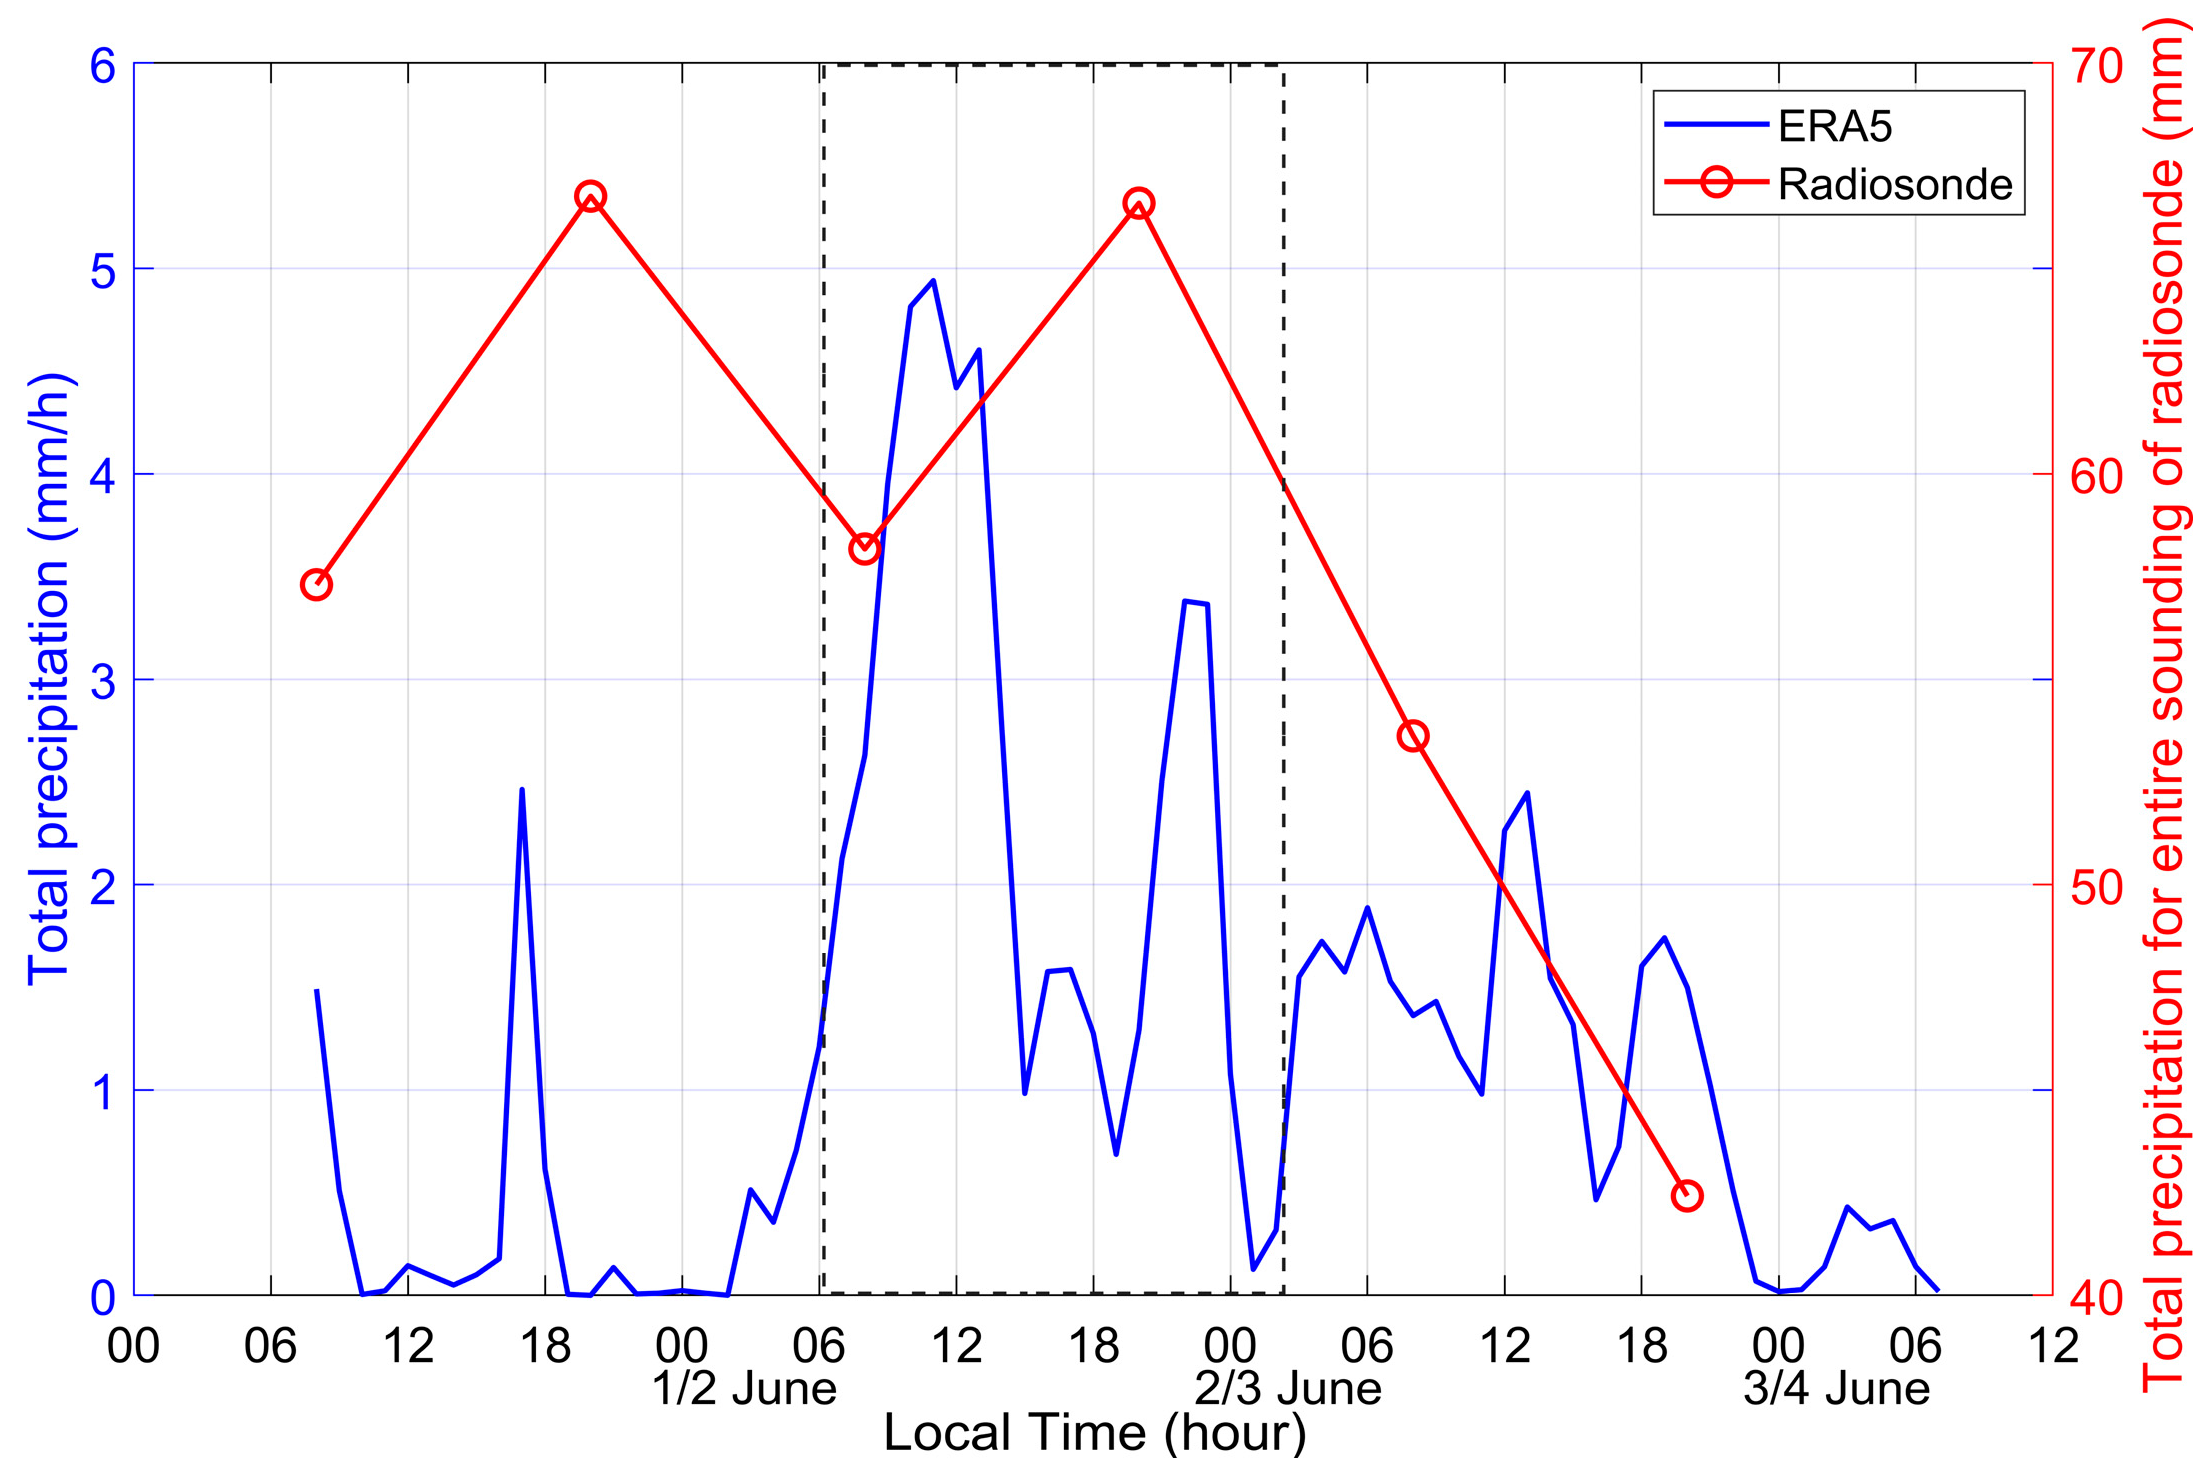
Rainfall of 50 mm or more in 24 h is defined as “heavy rain”. According to the data from the China Meteorological Administration, the Chongyang area, Xianning City, Hubei Province, China, where the Wuhan MST radar is located (29.51°N, 114.13°E), experienced heavy rain in early June 2015. From 1 to 2 June, 58 counties and cities in Hubei Province were hit by the torrential rainfall, and the affected population reached more than 400,000 people. Among them, Xianning City, with a population of 134,248 people and an area of 9903 hectares of crops, was the most severely affected. The blue curve in
Figure 1 displays the variation of the total precipitation of the rainfall per hour in Chongyang from 8:00 LT on 1 June to 7:00 LT on 4 June 2015. This rainfall data as well as relative humidity, temperature, potential vorticity, and ozone mass mixing ratio came from ERA5 reanalysis datasets, which comprise the latest climate reanalysis produced by ECMWF, providing hourly data on many atmospheric, land-surface, and sea-state parameters together with estimates of uncertainty. The total precipitation of the rainfall increased quickly at 6:00 LT on 2 June and reached its peak of 4.94 mm at 12:00 LT. After the second peak of 3.36 mm at 0:00 LT on 3 June, the rainfall became less intense. The black dotted box in
Figure 1 indicates that the rainstorm mainly occurred on 2 June. The total precipitation for the entire sounding of the Wuhan radiosonde is also presented as a red curve in
Figure 1. The variation of the actual measured precipitation by the Wuhan radiosonde was in line with the blue curve available from ERA5.
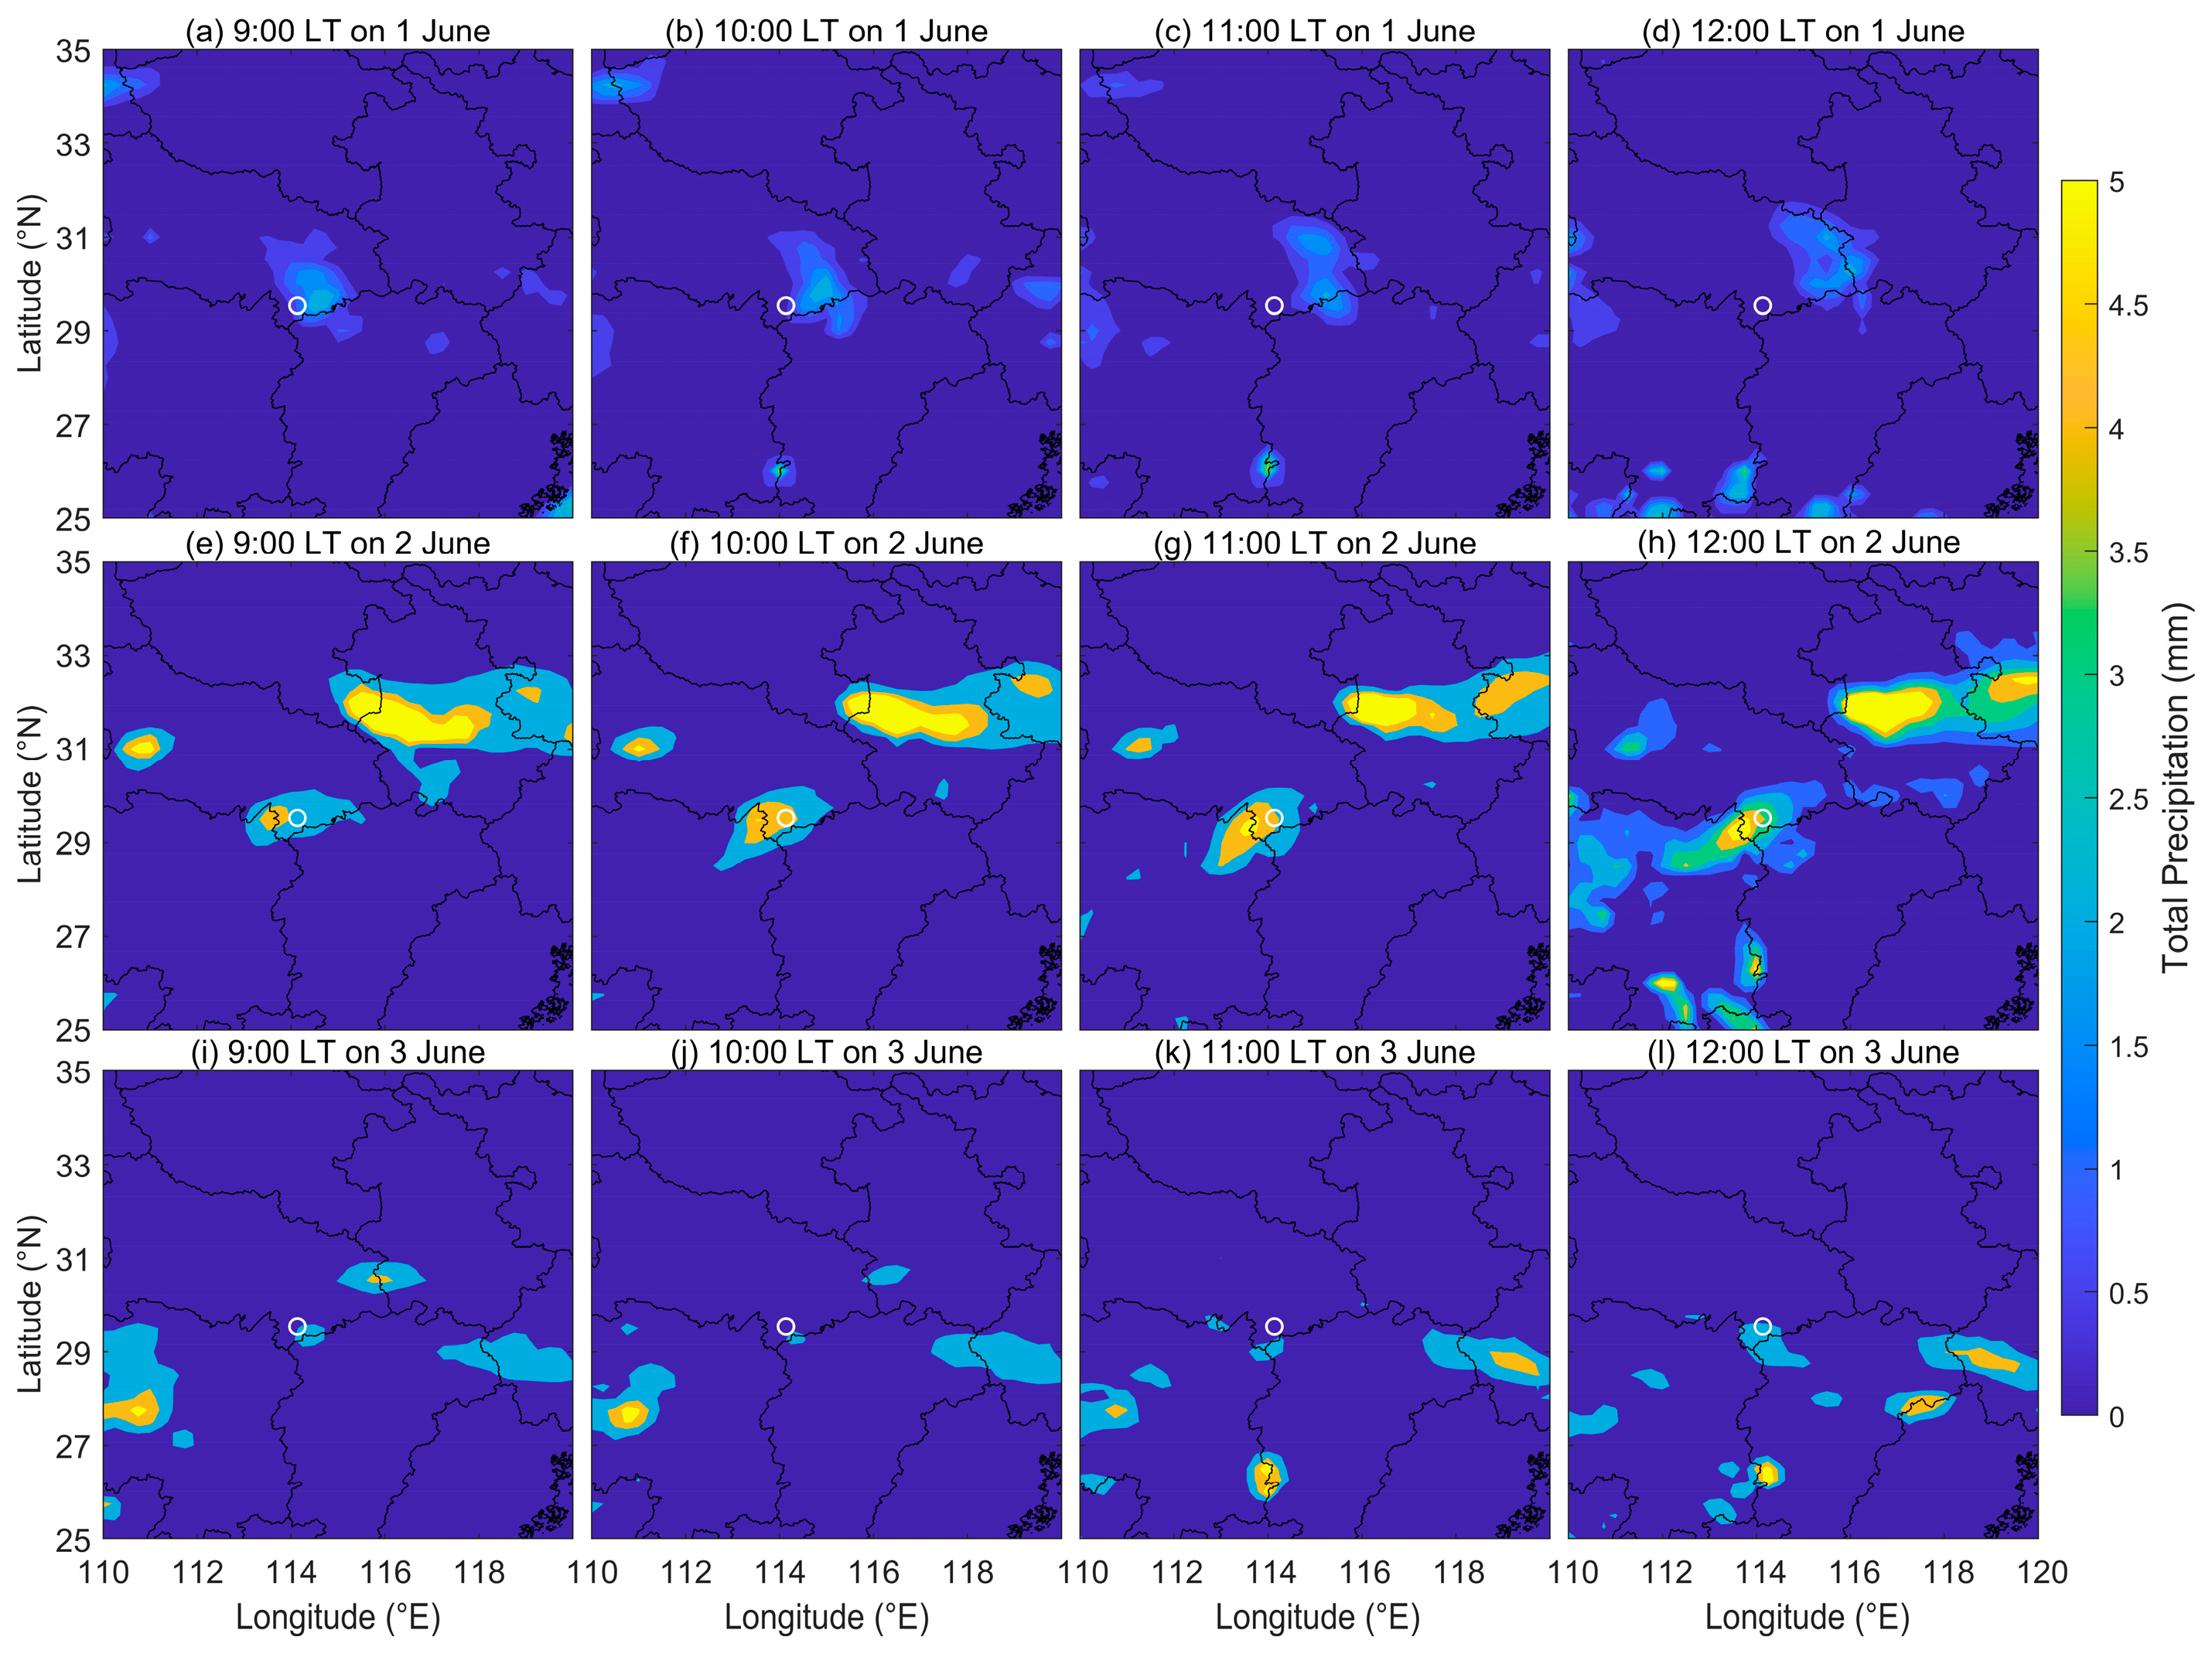
Figure 2 shows the regional distribution map of the rainfall at 9:00–12:00 LT on 1–3 June 2015 over central China. The white circle is used to indicate the location of the Wuhan MST radar. Compared with the top and bottom rows of 1 and 3 June, the maps in the middle row show much more rainfall occurring on 2 June over central China than that on the day before and after. The yellow region on the southwest of the radar station in
Figure 2g,h indicates that the amount of rain reached 22 mm, and the rainfall over the radar station also reached its highest on that day.
The Wuhan MST radar is located in Chongyang, Hubei province, China (29.51°N, 114.13°E), and it is one of the important ground-based radio systems of the Chinese Meridian Project [
20,
21,
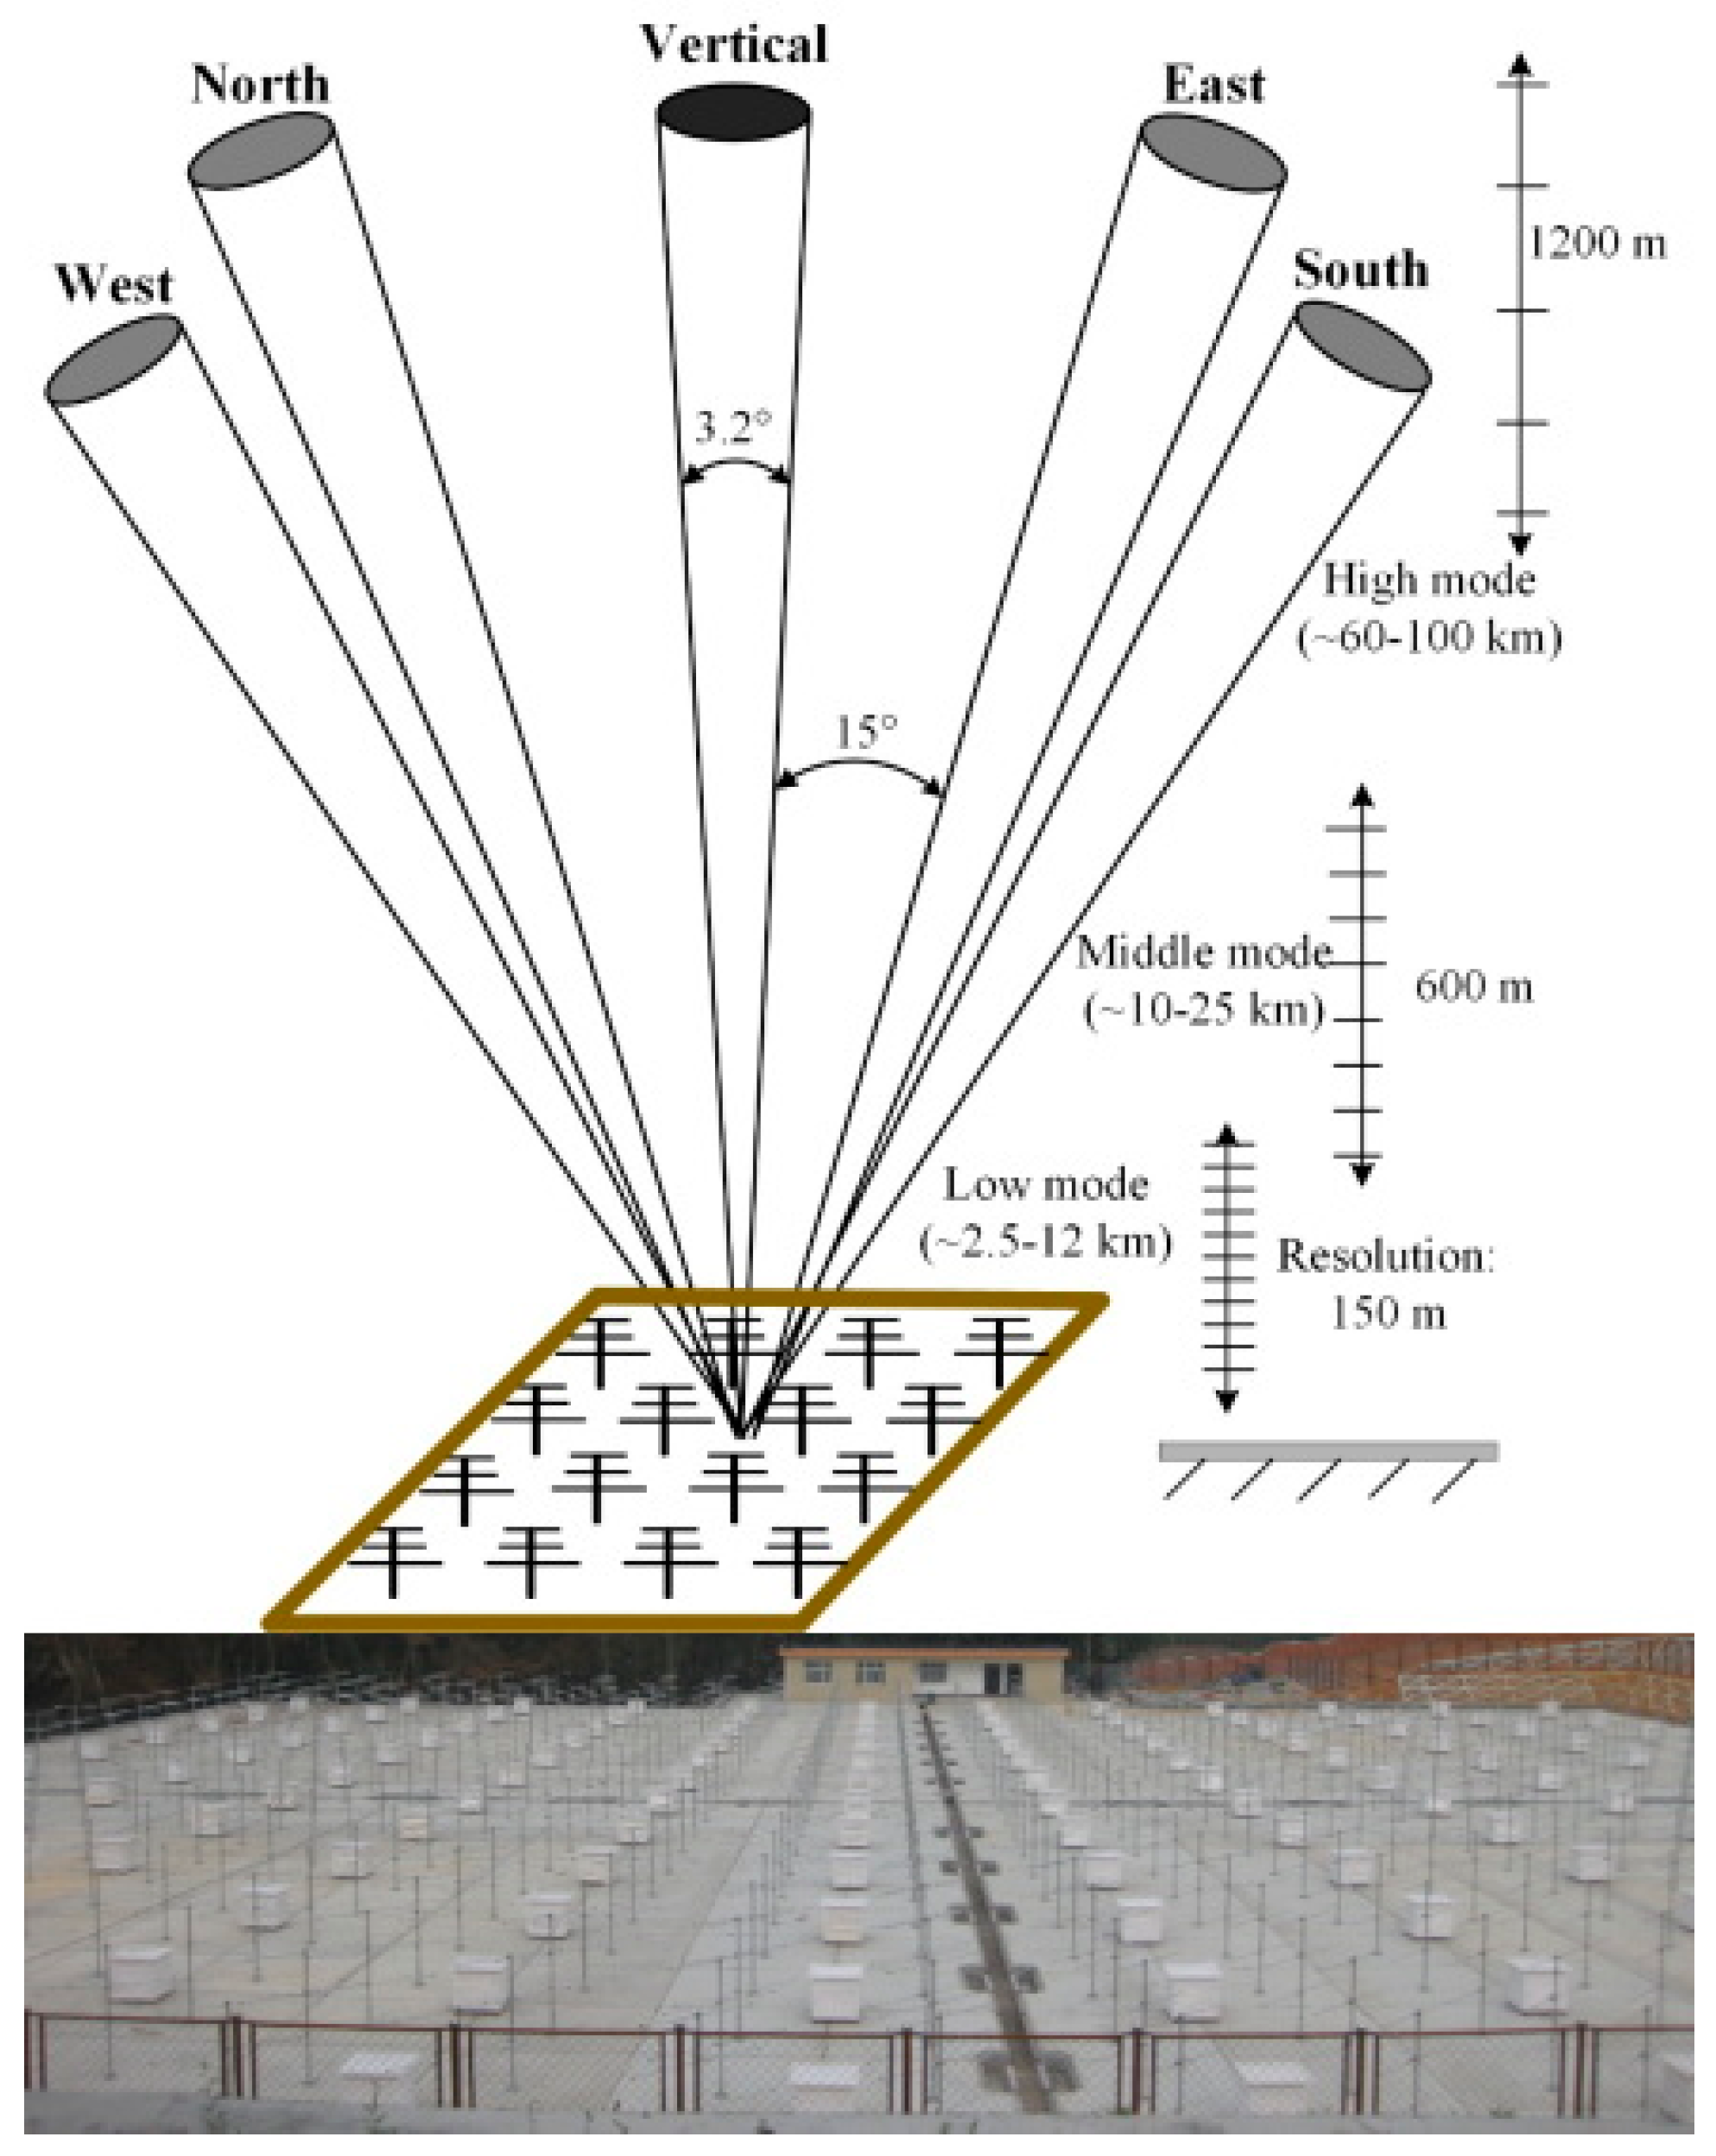
22]. The radar was designed and constructed to improve our understanding of the extratropical troposphere, lower stratosphere, and mesosphere. The antenna array of the Wuhan MST radar and its operating mode are displayed in
Figure 3. The Wuhan MST radar is a high-power coherent pulse Doppler radar operated at a frequency of 53.8 MHz [
4,
23]. There are 576 three-element Yagi antennas composing the antenna array. The peak power of the array reaches 172 kw, and the half-power width of the formed beam is 3.2°. As shown in the upper plot of
Figure 3, five beams are formed to detect the atmosphere, including one vertically pointed beam and four 15° off-zenith beams tilted to the north, east, south, and west. The radar is designed to operate routinely in three separate modes (low mode, middle mode, and high mode) to cover the height ranges of 3–10, 10–20, and 60–90 km with the range resolution of 150, 600, and 1200 m, respectively. Every half hour, the Wuhan MST radar completes the observations of the three modes in sequence. According to the radial velocities recorded by the five beams, the velocities of three-dimensional wind fields can be estimated. As a result of partial specular reflection from the atmospheric stable layer, the tropopause can be simply and directly detected by very-high-frequency (VHF) radar by the vertical beam [
24,
25]. During the heavy rain on 2 June 2015, the Wuhan MST radar was used to investigate the atmospheric responses at troposphere and low-stratosphere heights.
Furthermore, EAR5 reanalysis data and the radiosonde data were also applied. ERA5 provides hourly estimates of a large number of atmospheric, land, and oceanic climate variables. The atmospheric data are available in the Climate Data Store (
https://climate.copernicus.eu/climate-reanalysis, accessed on 4 June 2022) on the regular latitude–longitude grids of 0.25° × 0.25° resolution with 37 pressure levels. Therein, the amount of precipitation is utilized to identify the time period of the rainstorm occurrence. The radiosonde data from Wuhan station (station number: 57,494; location: 20.61°N, 114.13°E) are also applied to indicate the height of the tropopause by the vertical temperature profile, and the radiosonde flies every twelve hours. The observation height range of the radiosonde on 1–4 June 2015 began at 23 m height and ended at heights that exceeded 21 km.
3. Observations
Due to the large potential temperature gradient in the transition region of the top troposphere, the backscattered echo power received by the vertical beam of a VHF radar will increase rapidly. Based on this feature, an MST radar can effectively determine the radar tropopause height [
26]. In this paper, the radar tropopause is defined as the height at which the maximum vertical gradient of the echo power above 500 hPa is located [
27,
28].
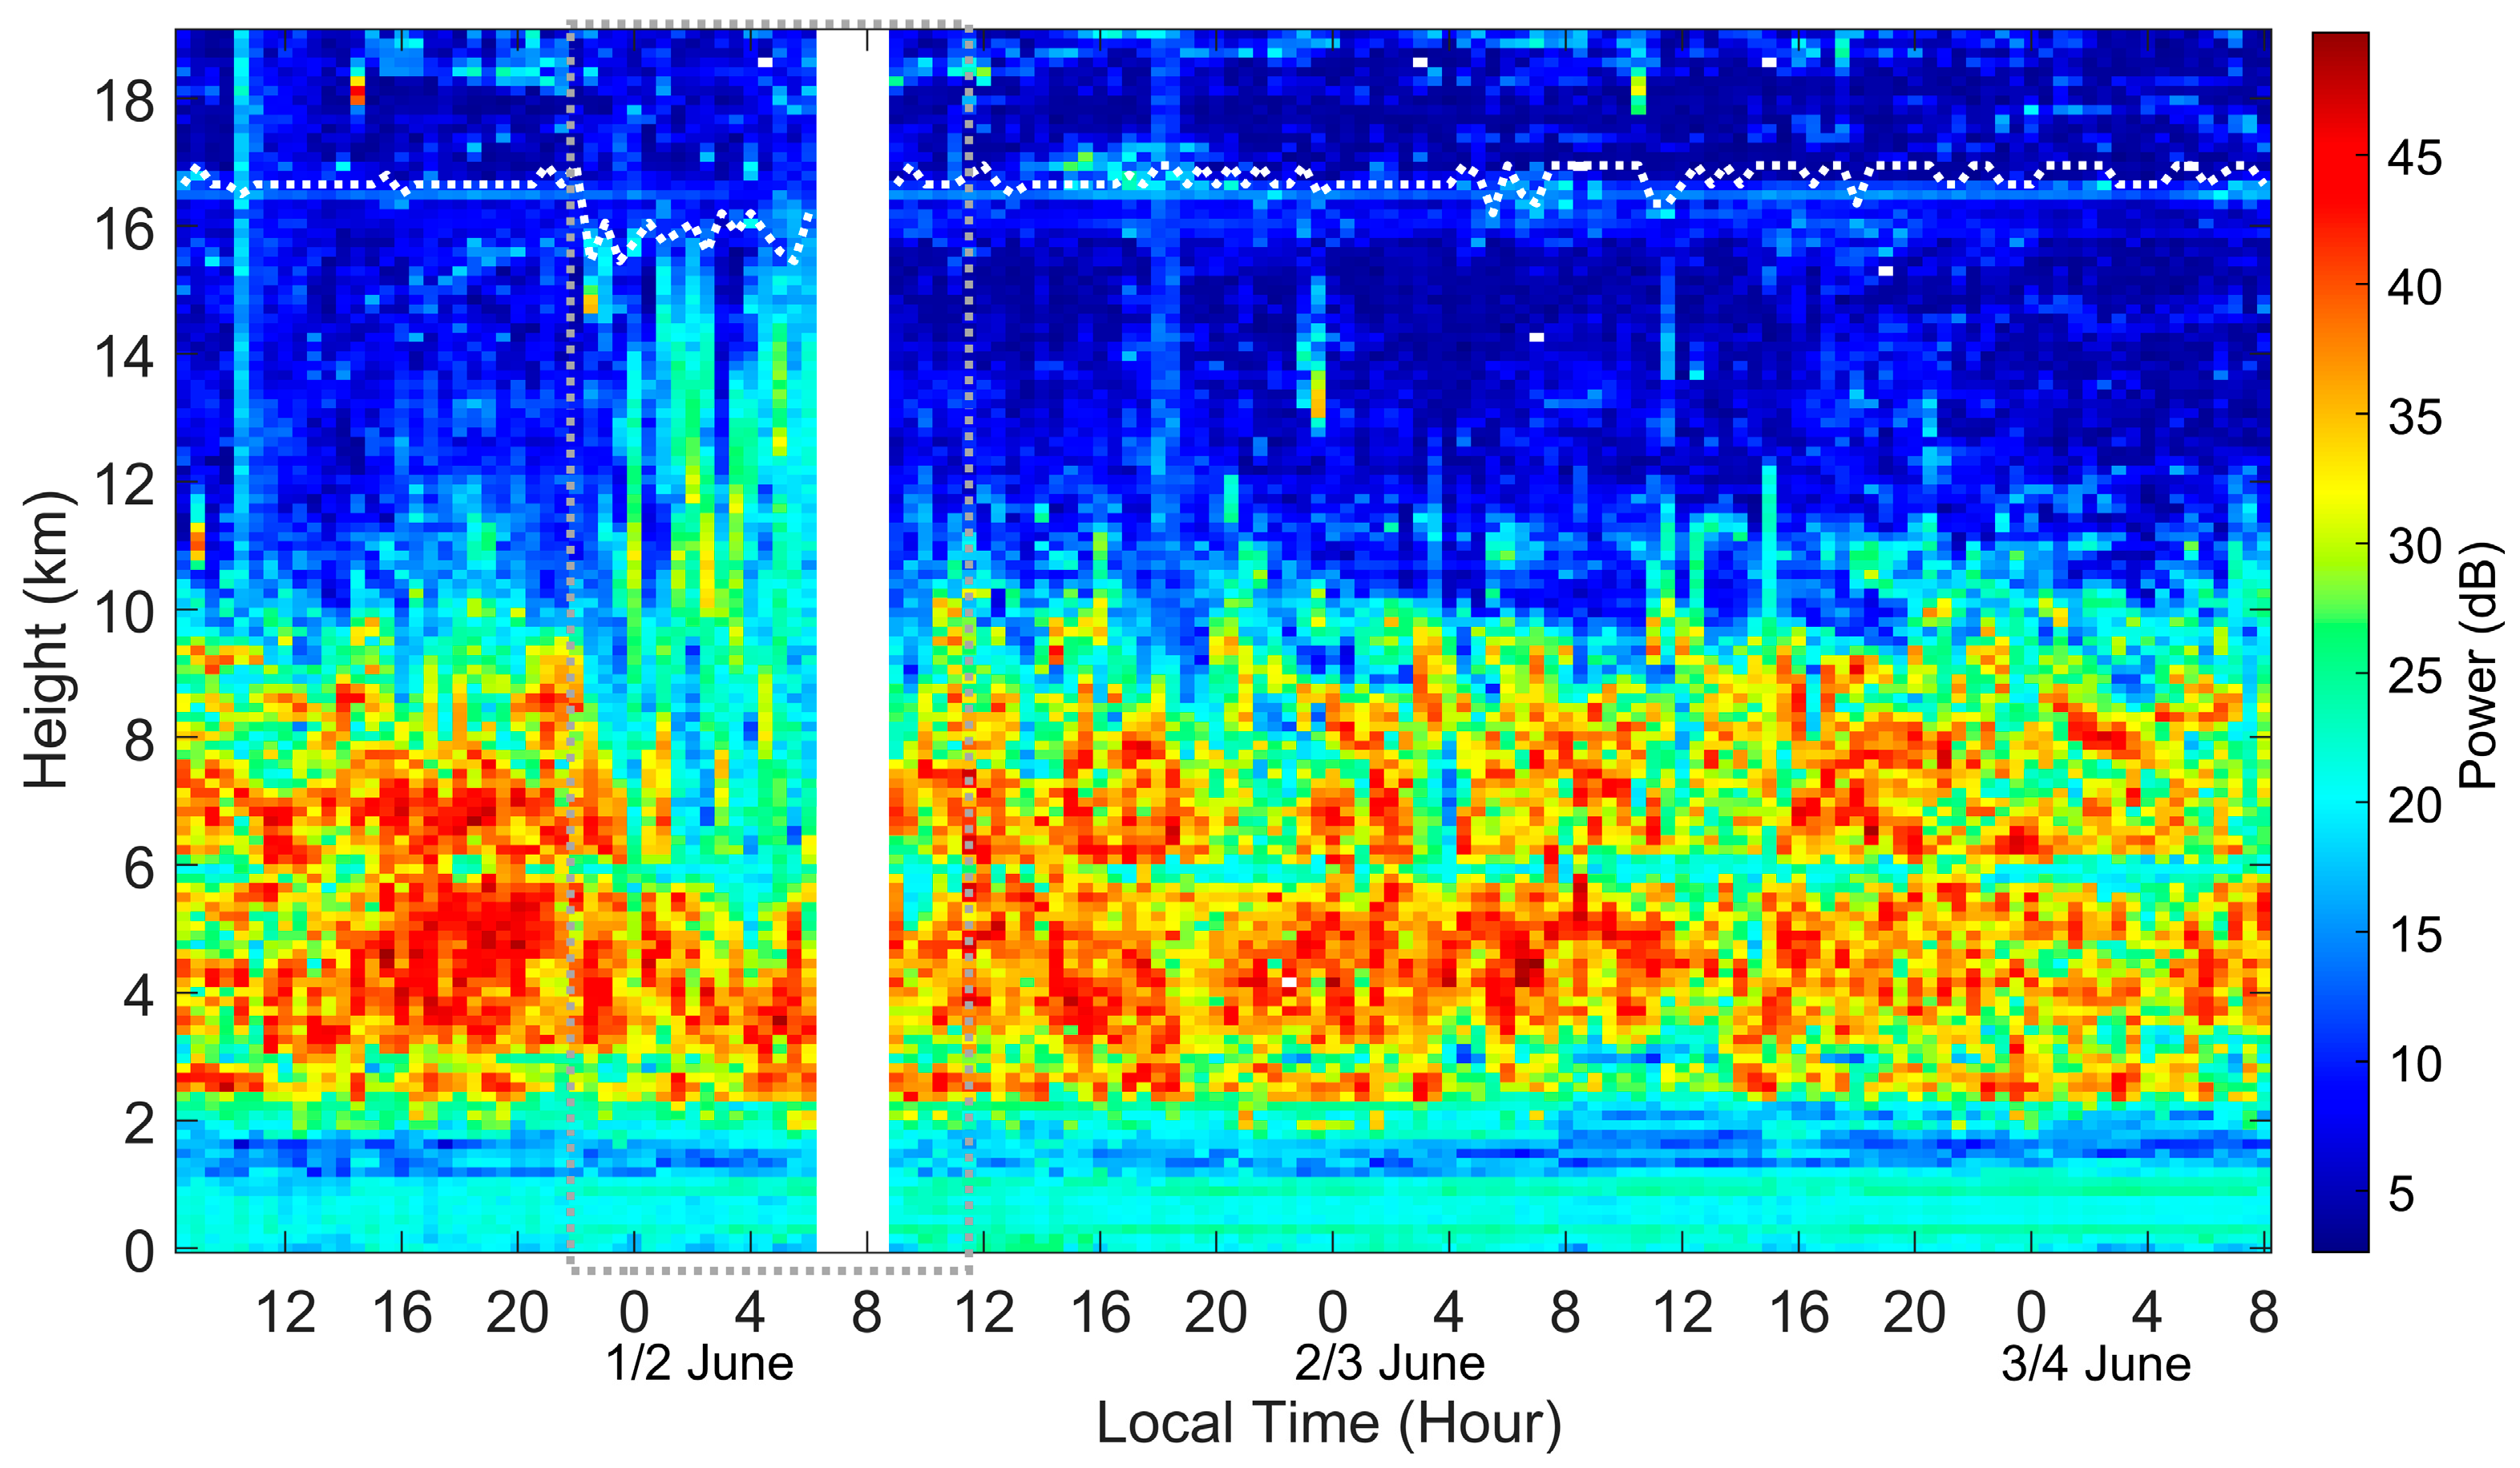
Figure 4 shows the echo power recorded by the vertical beam of the Wuhan MST radar from 8:00 LT on 1 June to 8:00 LT on 4 June 2015. According to the definition above, the radar tropopause height variation is indicated by the white dotted line in
Figure 4. As indicated by the gray box, there was a long-period tropopause descent of ~1 km occurring between 22:00 LT on 1 June and 6:00 LT on the next day. At the same time, the echo power between 10 and 17 km heights increased suddenly to more than 15 dB, and at the same time, the echo power between 5 and 10 km heights fell ~10 dB. Based on previous observations, the echo power of radar echoes at the height above 10 km is usually low due to the thinner air and less turbulence; thus, the enhanced echo power of the HCOPAR at these heights is unusual. This phenomenon occurred before the rainstorm shown in
Figure 1 and may be related to the formation of the rainstorm.
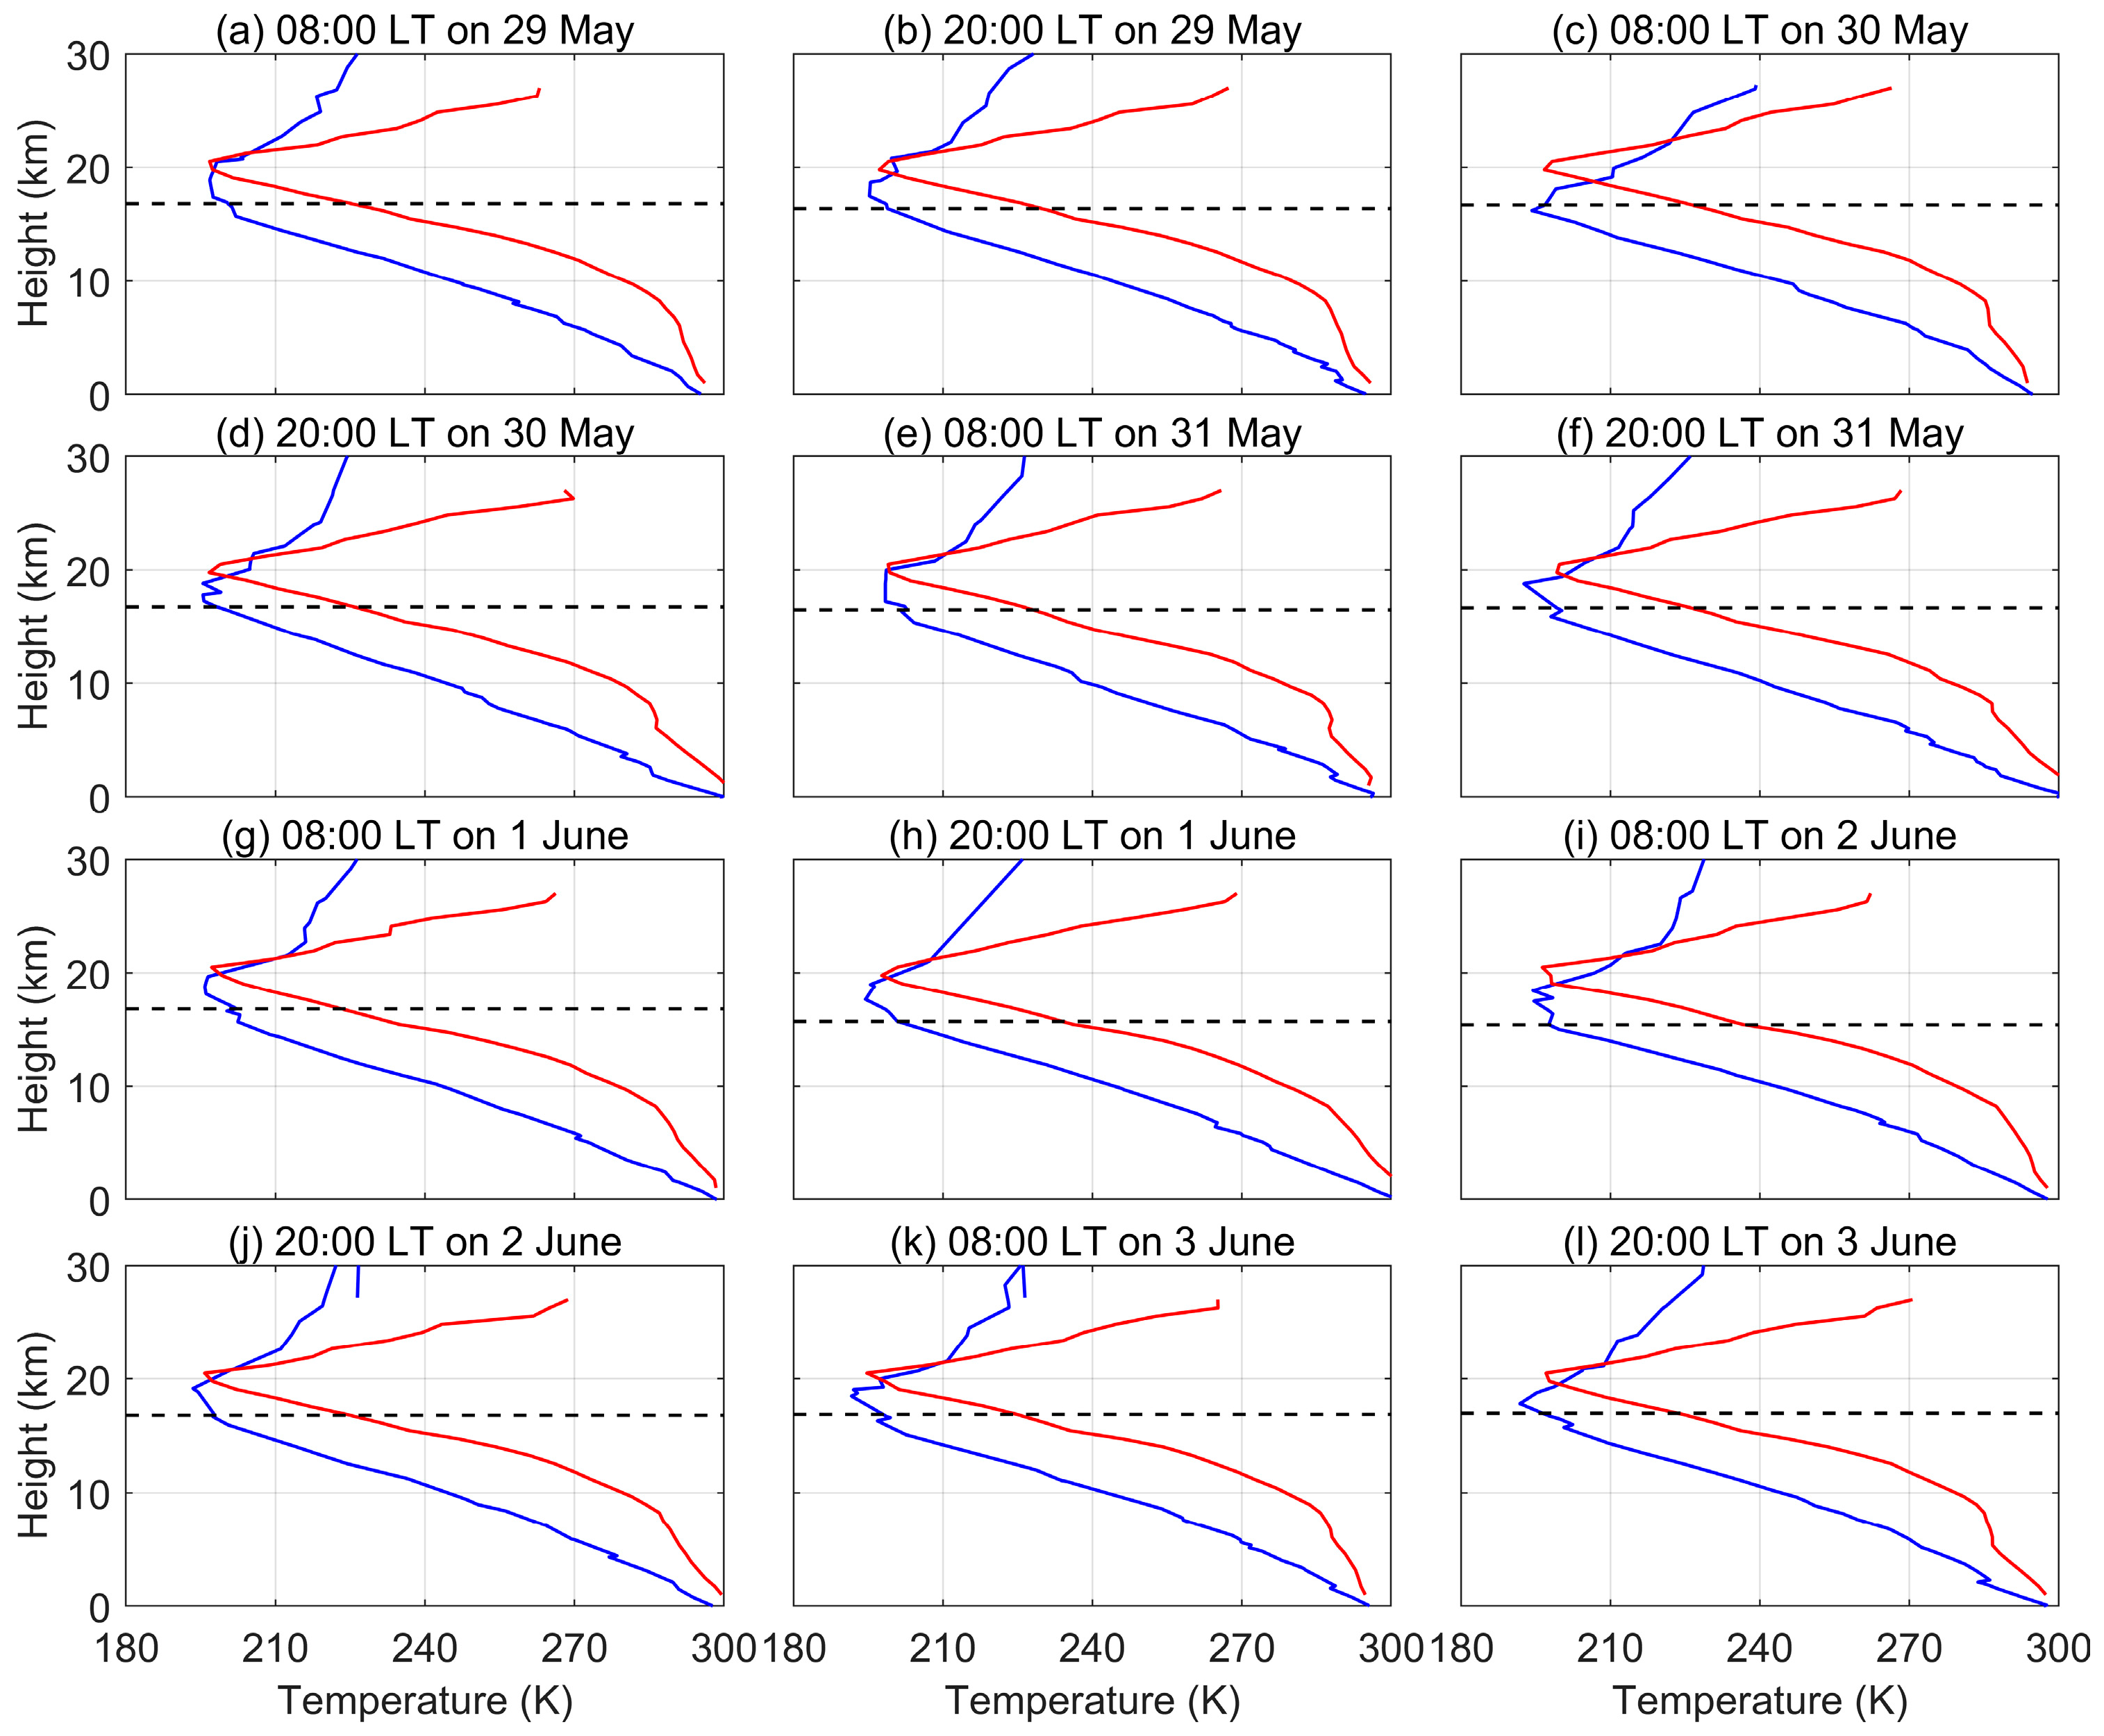
The radiosonde of the Wuhan station flies at 0:00 and 12:00 UT (8:00 and 20:00 LT, LT = UT + 8 h) every day. The temperature profiles over Wuhan provided by the radiosonde and by ERA5 are displayed as blue and red curves in
Figure 5. The profiles of the radiosonde and ERA5 are similar, but the temperature of ERA5 is lower than that of the radiosonde in general. According to the measured vertical temperature profile, the tropopause determined by the temperature variation can be obtained. The first tropopause is defined as the lowest level at which the lapse rate decreases to 2° K per kilometer or less, providing also that the average lapse rate between this level and all higher levels within 2 km does not exceed 2° K. The horizontal dashed line in each plot of
Figure 5 shows the height of the tropopause estimated by the blue temperature profiles.
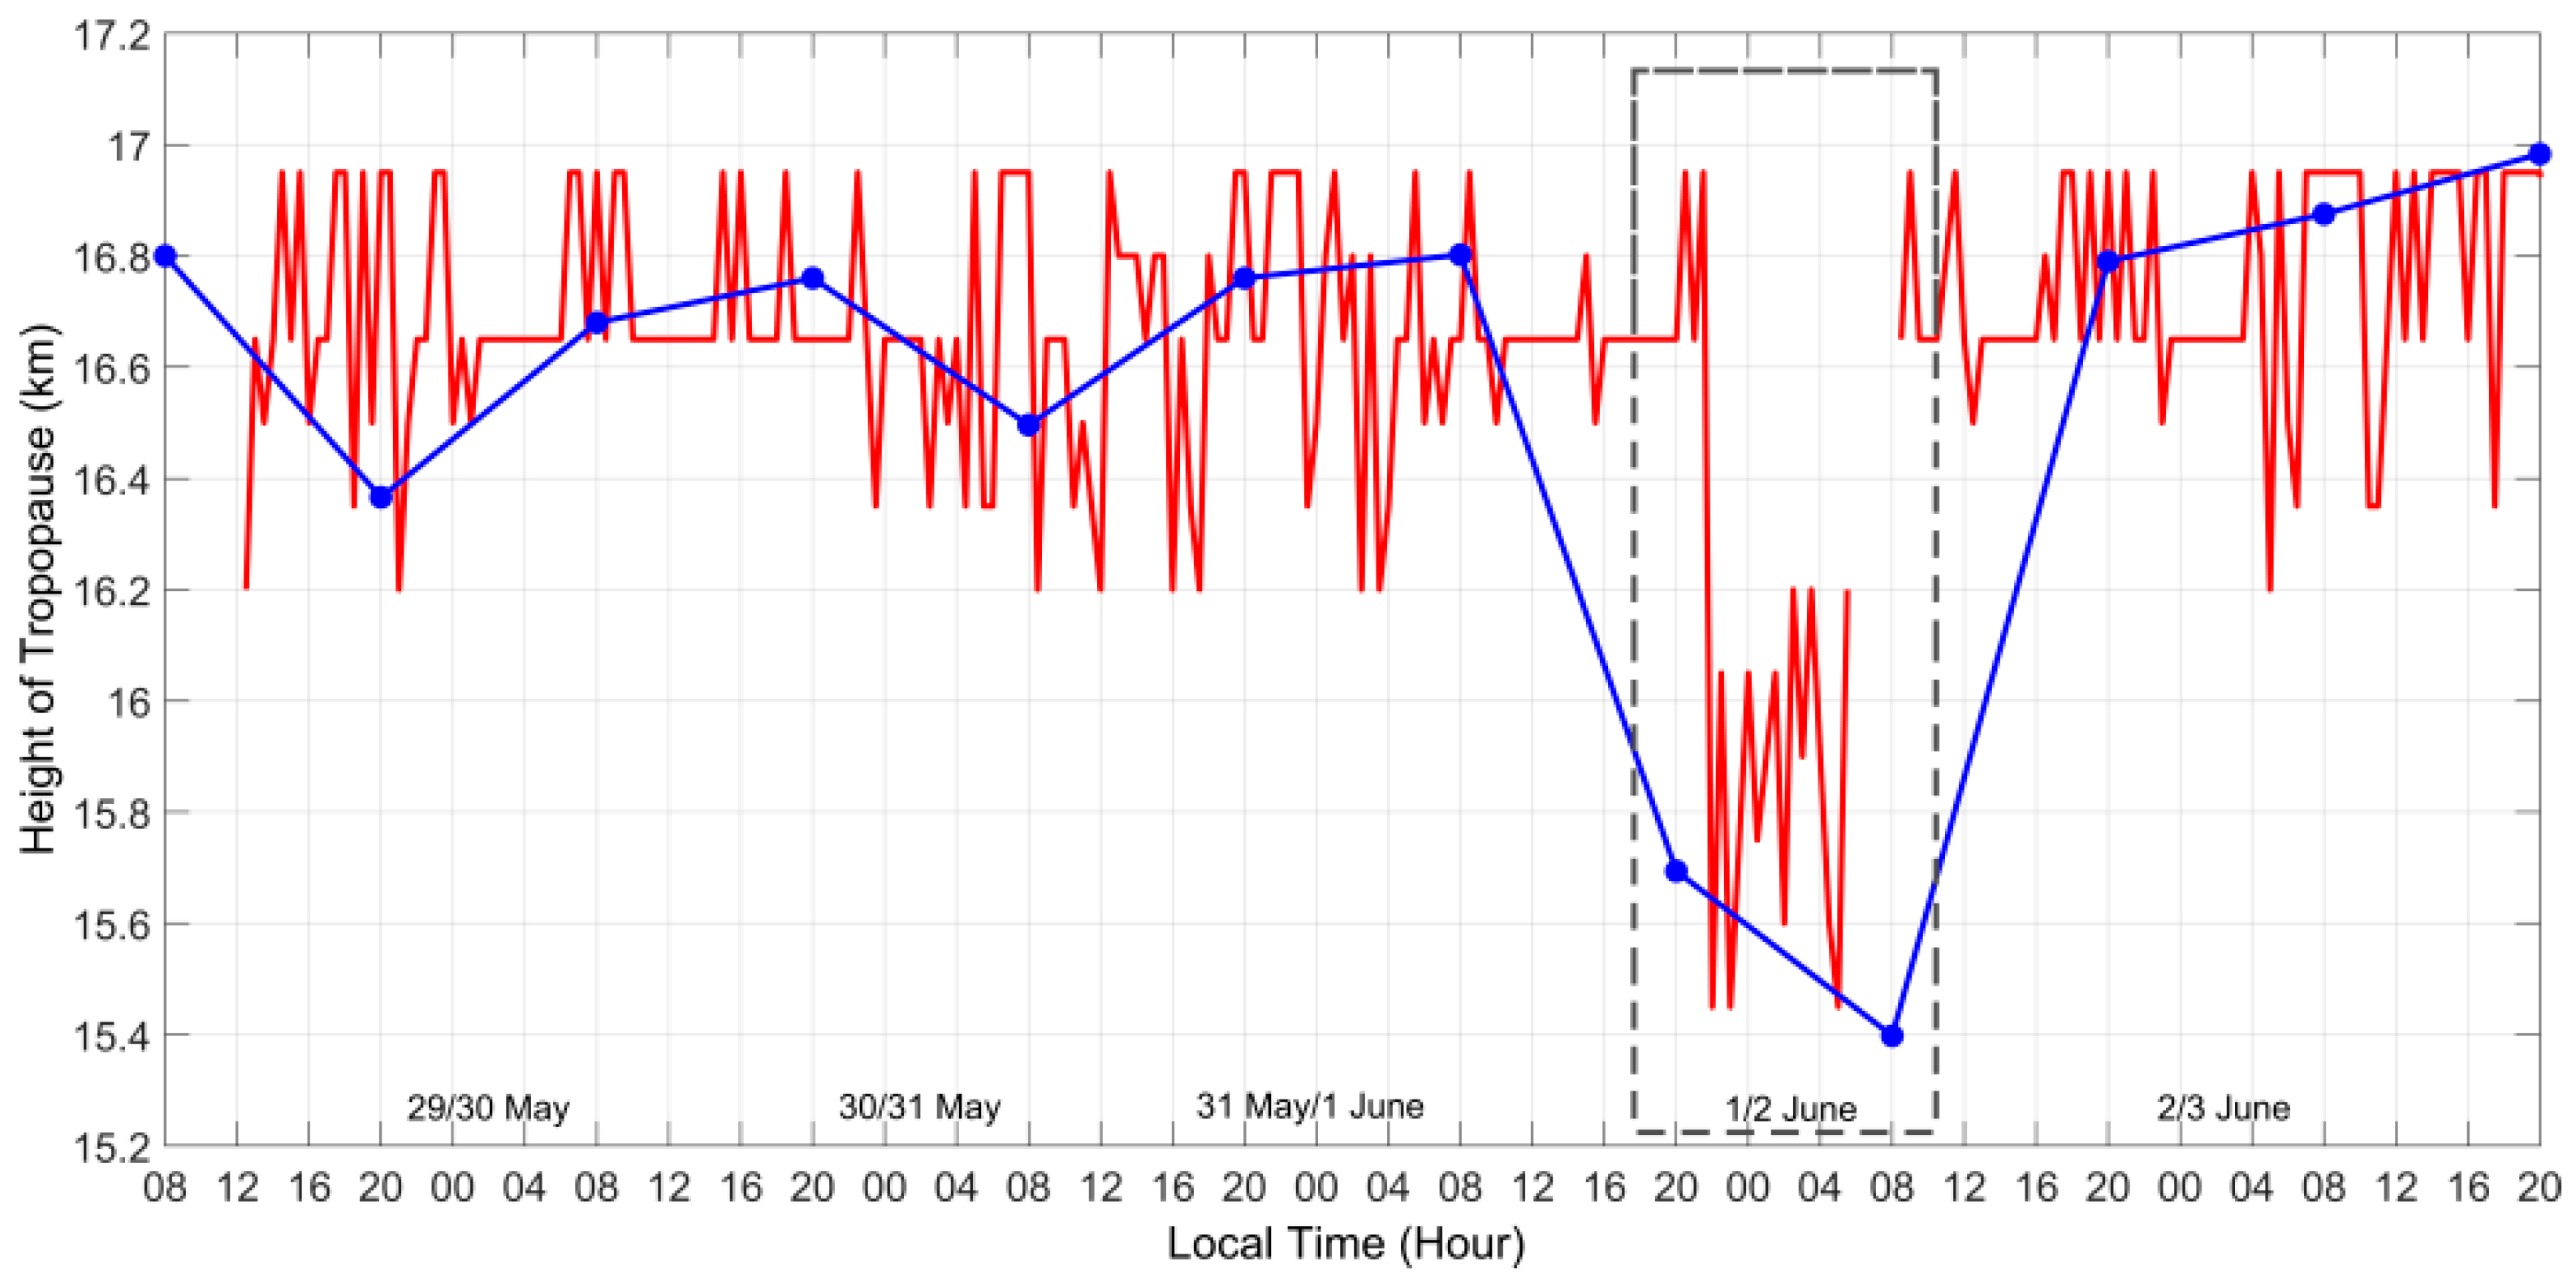
Figure 6 displays the comparison of the tropopause height variations measured by the Wuhan radiosonde as the blue curve and the Wuhan MST radar as the red curve from 8:00 LT on 29 May to 20:00 LT on 3 June 2014. Usually, the radar tropopause varies between 16.62 and 16.78 km heights, but it dropped to 16.04 km at 21:30 LT on 1 June and recovered to typical heights after 8:00 LT on 2 June. The temperature tropopause measured by the Wuhan radiosonde exhibited good consistency with the radar tropopause; it varied between 16.4 and 17 km height and decreased to 15.7 and 15.4 km at 20:00 LT on 1 June and 8:00 LT on 2 June. The gray box shows the tropopause descent recorded by the two instruments at the same time.
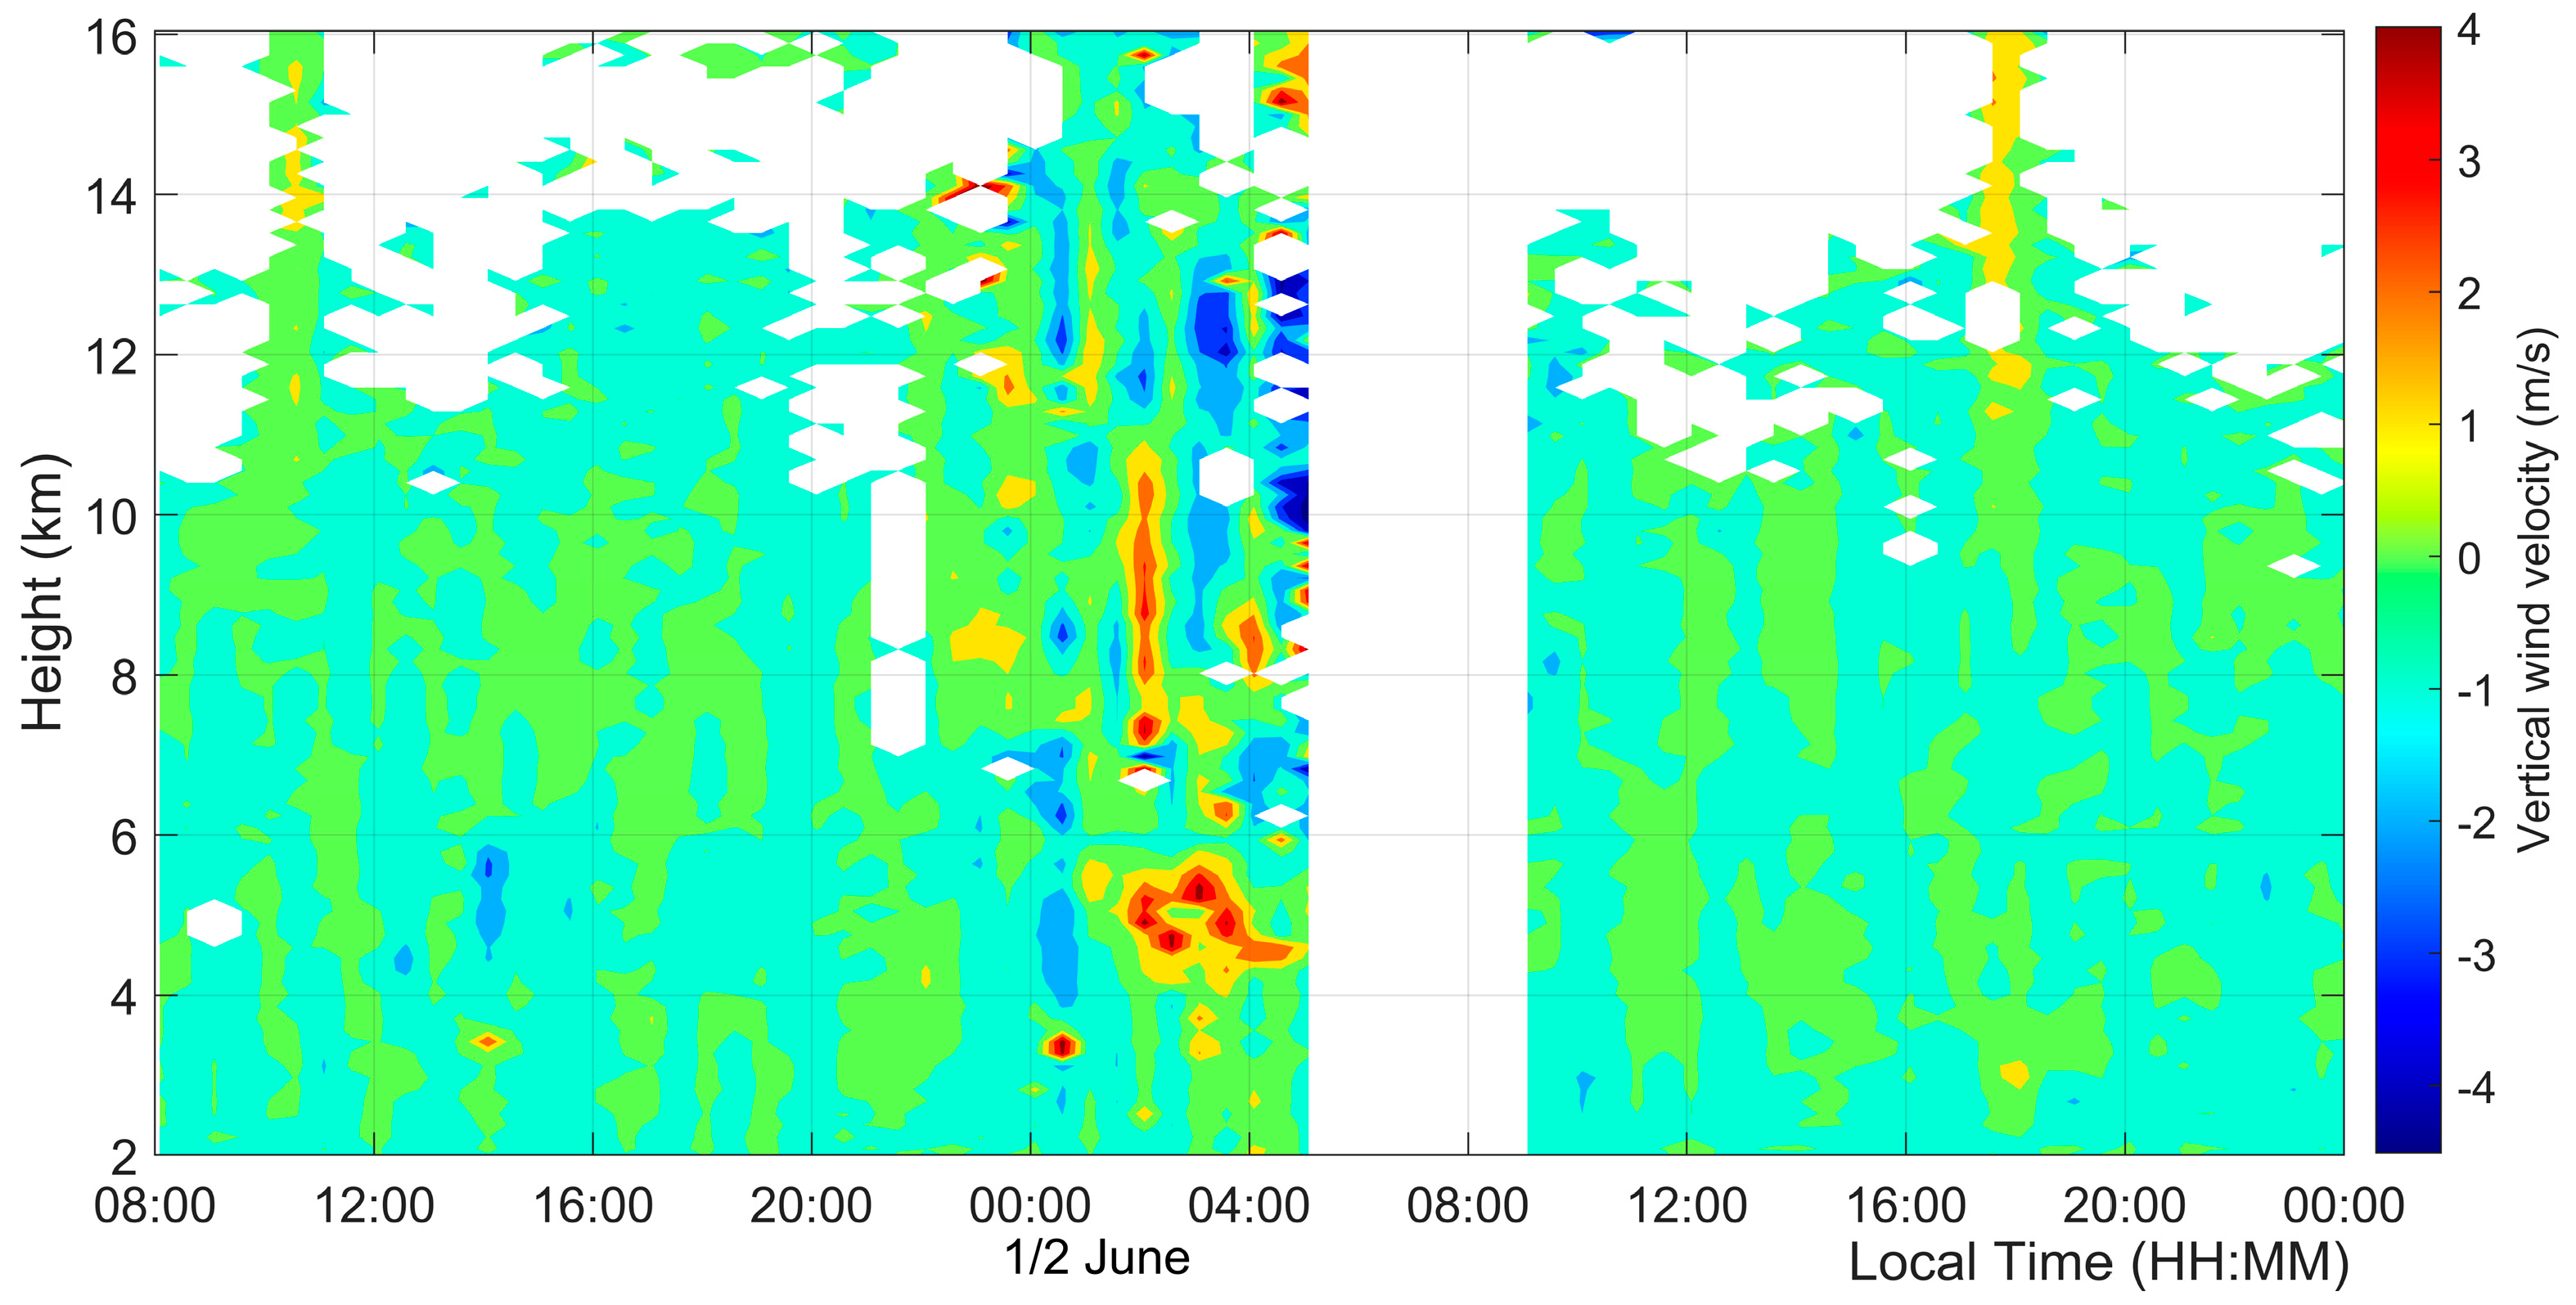
MST radar has the ability to measure the three-dimensional wind velocities in a neutral atmosphere, including the vertical wind velocity [
29]. The vertical wind velocity is the radial velocity measured by the vertical beam of the Wuhan MST radar after eliminating the influence of the ground waves [
30].
Figure 7 displays the vertical winds between 2 and 16 km heights measured by the Wuhan MST radar. Most of the time, the vertical winds remain at low speeds around ±0.4 m/s. While the echo enhancement emerged in the high troposphere, as shown in the gray box in
Figure 4, the disturbance of the vertical wind velocities can also be found in
Figure 7 between 22:00 LT on 1 June and 5:00 LT of the next day. The large wind speeds exceeding 1 m/s upward/downward were recorded as the red/blue values, and the largest upward wind speed reached 4.61 m/s.
4. Analysis and Discussion
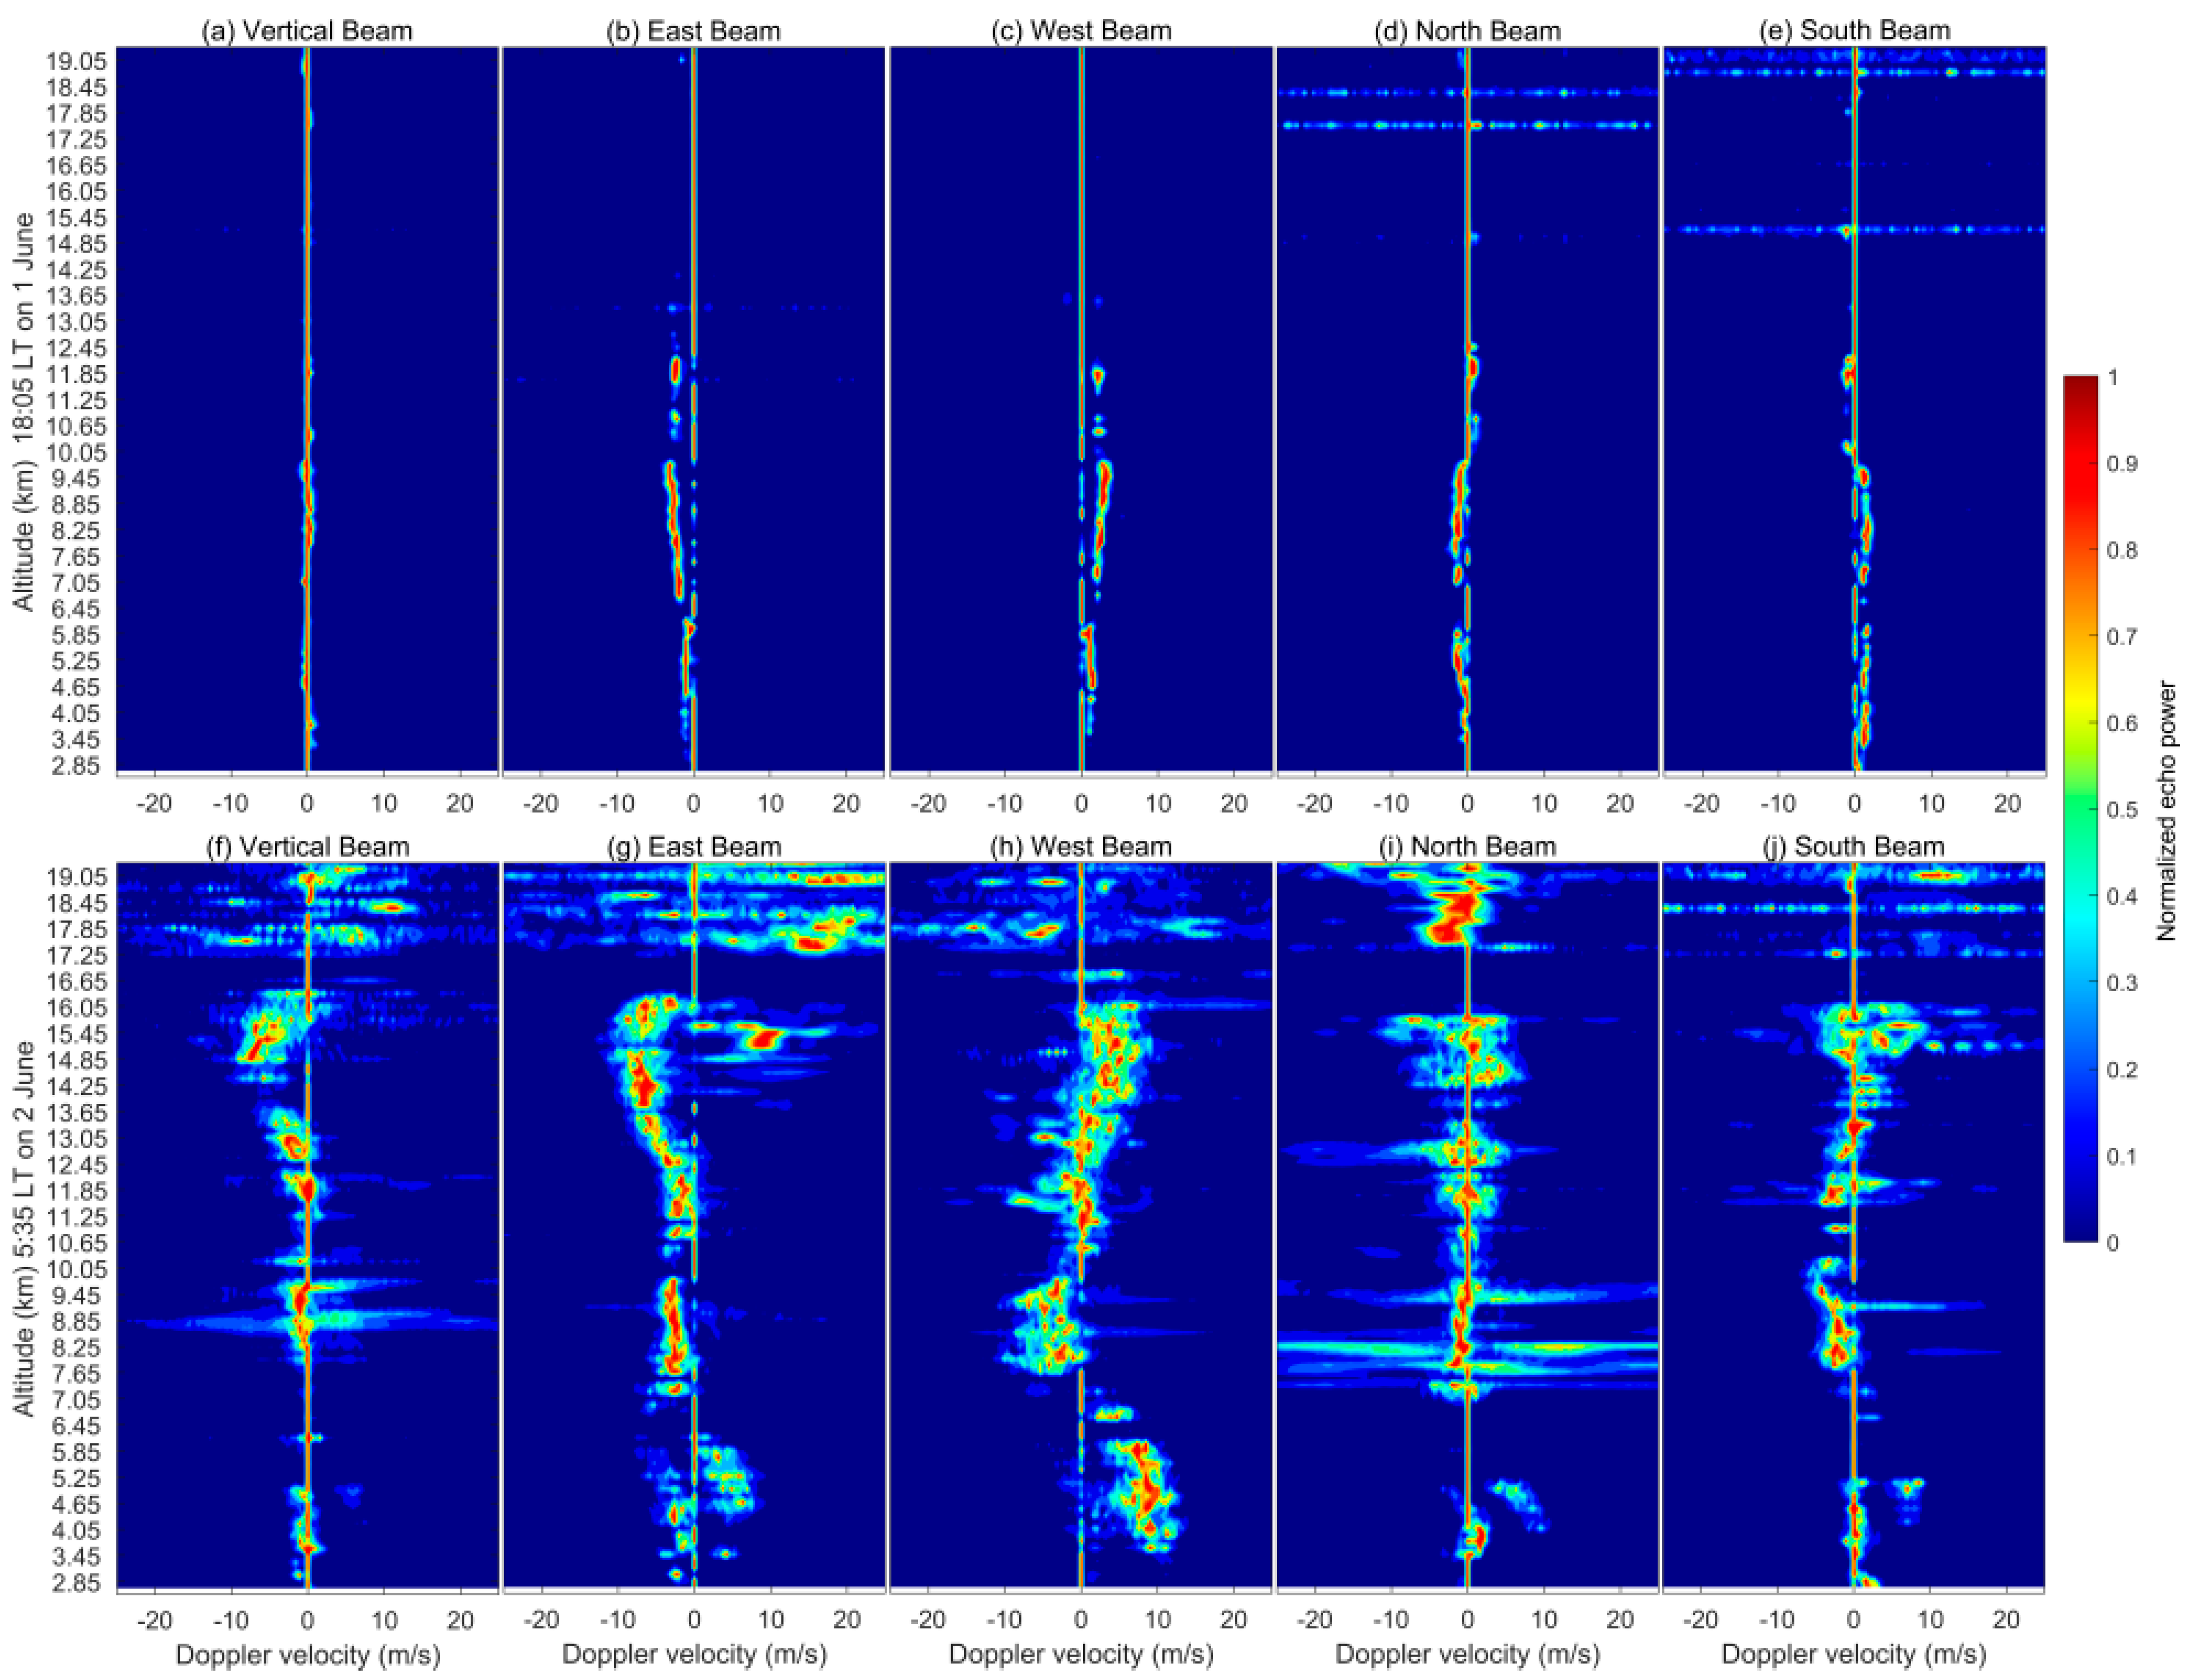
During the tropopause descent, the echo power and radial velocities of the vertical beam changed significantly; thus, we compared the echo spectra recorded in the disturbance and quiet time, as seen in the bottom and top rows of
Figure 8, respectively. The echo data of the top and bottom rows were recorded at 18:05 LT on 1 June and 5:35 LT on 2 June 2015, respectively. It can be seen that under clear sky conditions, the radar echo spectral widths of all the beams in the top row are narrow and the echo Doppler shift values of the vertical beam are close to zero. At 5:35 LT on 2 June 2015 and ~1 h before the heavy rain, the echo spectral widths in the bottom row recorded by all five beams increased significantly, and the wide echo spectra occurred in all observation heights, including the heights below and above the cloud. The vertical Doppler velocities in
Figure 8f present negative values between 8 and 16 km, indicating that the upward atmospheric motion happened over the Wuhan MST radar. Usually, an echo region with power larger than 25 dB will not exceed 12 km in height, as shown in
Figure 4, but a few hours before the heavy rain, the strong echo region rose to tropopause heights. The bottom plots of
Figure 8 display the echoes of much greater intensity, and some of them emerged in heights above 16 km.
MST radar detects atmospheric motion by the echoes returned from atmospheric fluctuations [
2,
31]. These echoes mainly originate from the temperature fluctuation in the stratosphere and troposphere. As the observations of VHF radar with ~6m wavelengths, the echo strength enhancement during convective activity is mainly attributed to the enhanced turbulence levels or the enhanced humidity gradients [
32]. The presence of gaseous water vapor can increase the reflectivity fluctuation, and thus within the intermittent rainbands where strong convective motions exist, the echoes of the middle and upper atmosphere (MU) radar were recorded to reach 12 km in height [
33].
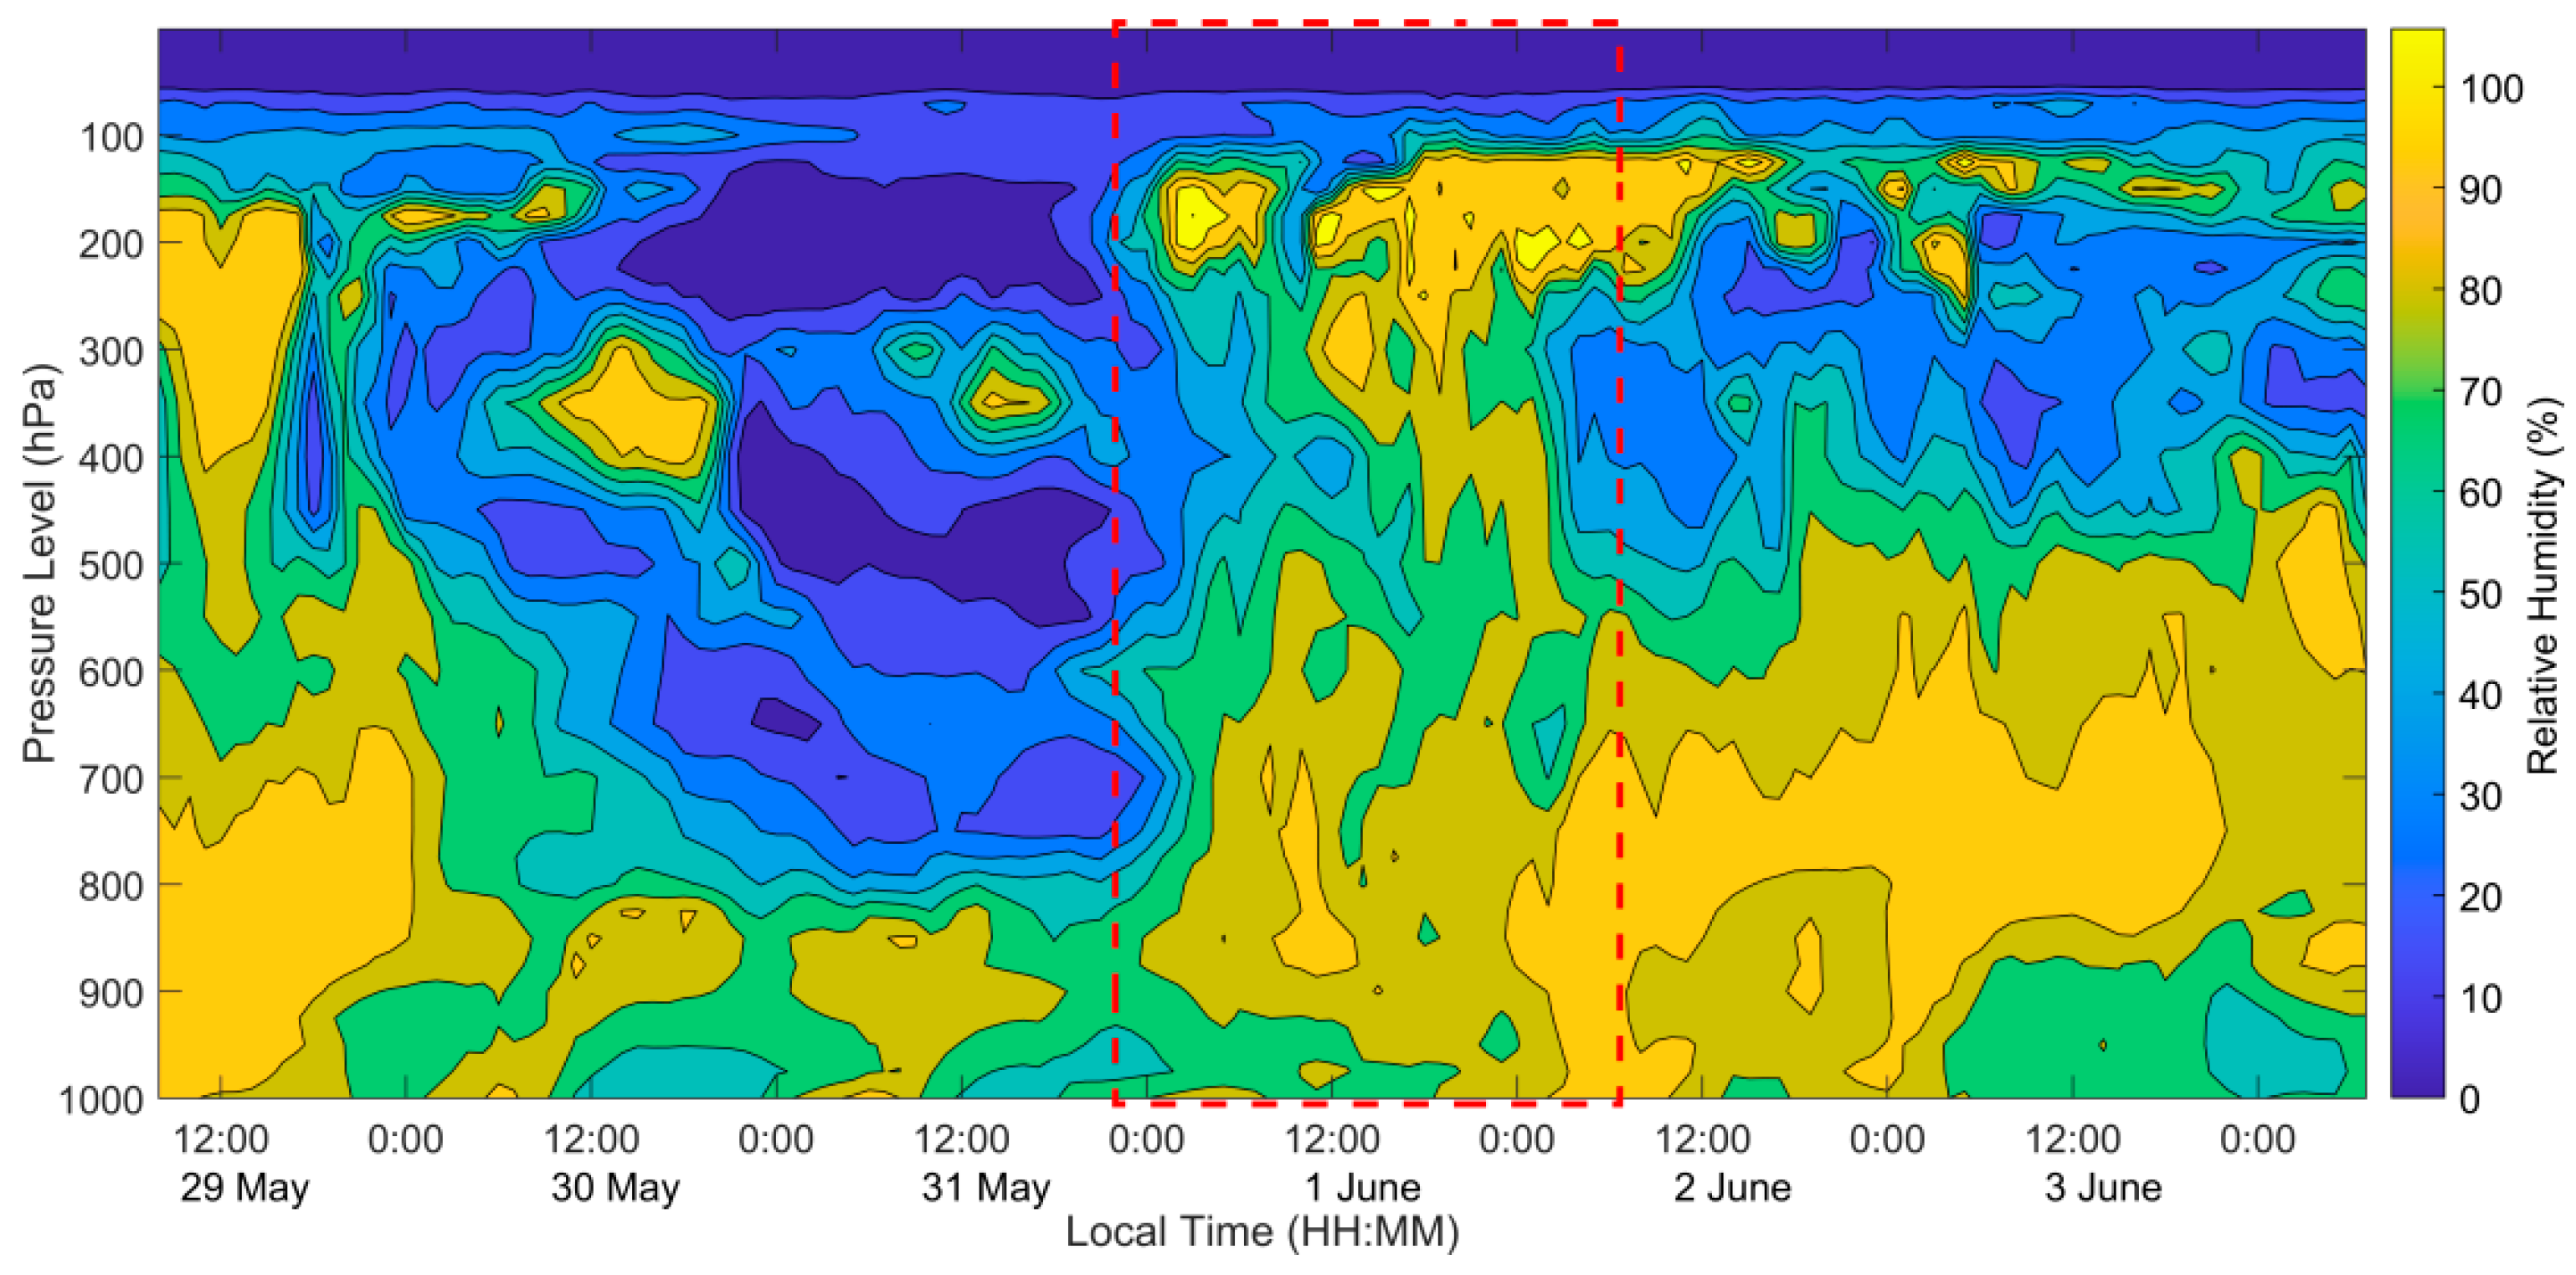
Figure 9 shows the relative humidity distribution at the entire height from the troposphere to the tropopause over the Wuhan MST radar, and these data were obtained from ERA5 reanalysis data. The horizontal and vertical axes represents the time from 29 May to 3 June and the height from 1000 to 0 hPa. The red box in
Figure 9 indicates the humidity enhancement occurring between 500 and 100 hPa on 1–2 June. It is clear that before and during the heavy rain, the vapor in the middle troposphere was transported to higher altitudes and even to the tropopause. Typically, there is no rainfall at heights above 10 km. The large vertical wind velocities in
Figure 7 indicate the occurrence of severe convection, which is likely to carry the air mass with higher humidity from the middle troposphere to the upper layer, and even to the vicinity of the tropopause. Therefore, the reflectivity fluctuation in the upper troposphere was increased by the water vapor to induce the strong echoes of the Wuhan MST radar. The wide echo spectra appearing in all the echo heights as shown in the bottom raw of
Figure 8 indicate that the reflections above and below the clouds were affected in the same way. The severe convection activities and the enhanced humidity gradients had the ability to produce the disturbance to broaden the echo spectra. Thus, the wide echo spectra from the upper troposphere also implied that the vapor had been transported upward to the vicinity of the tropopause.
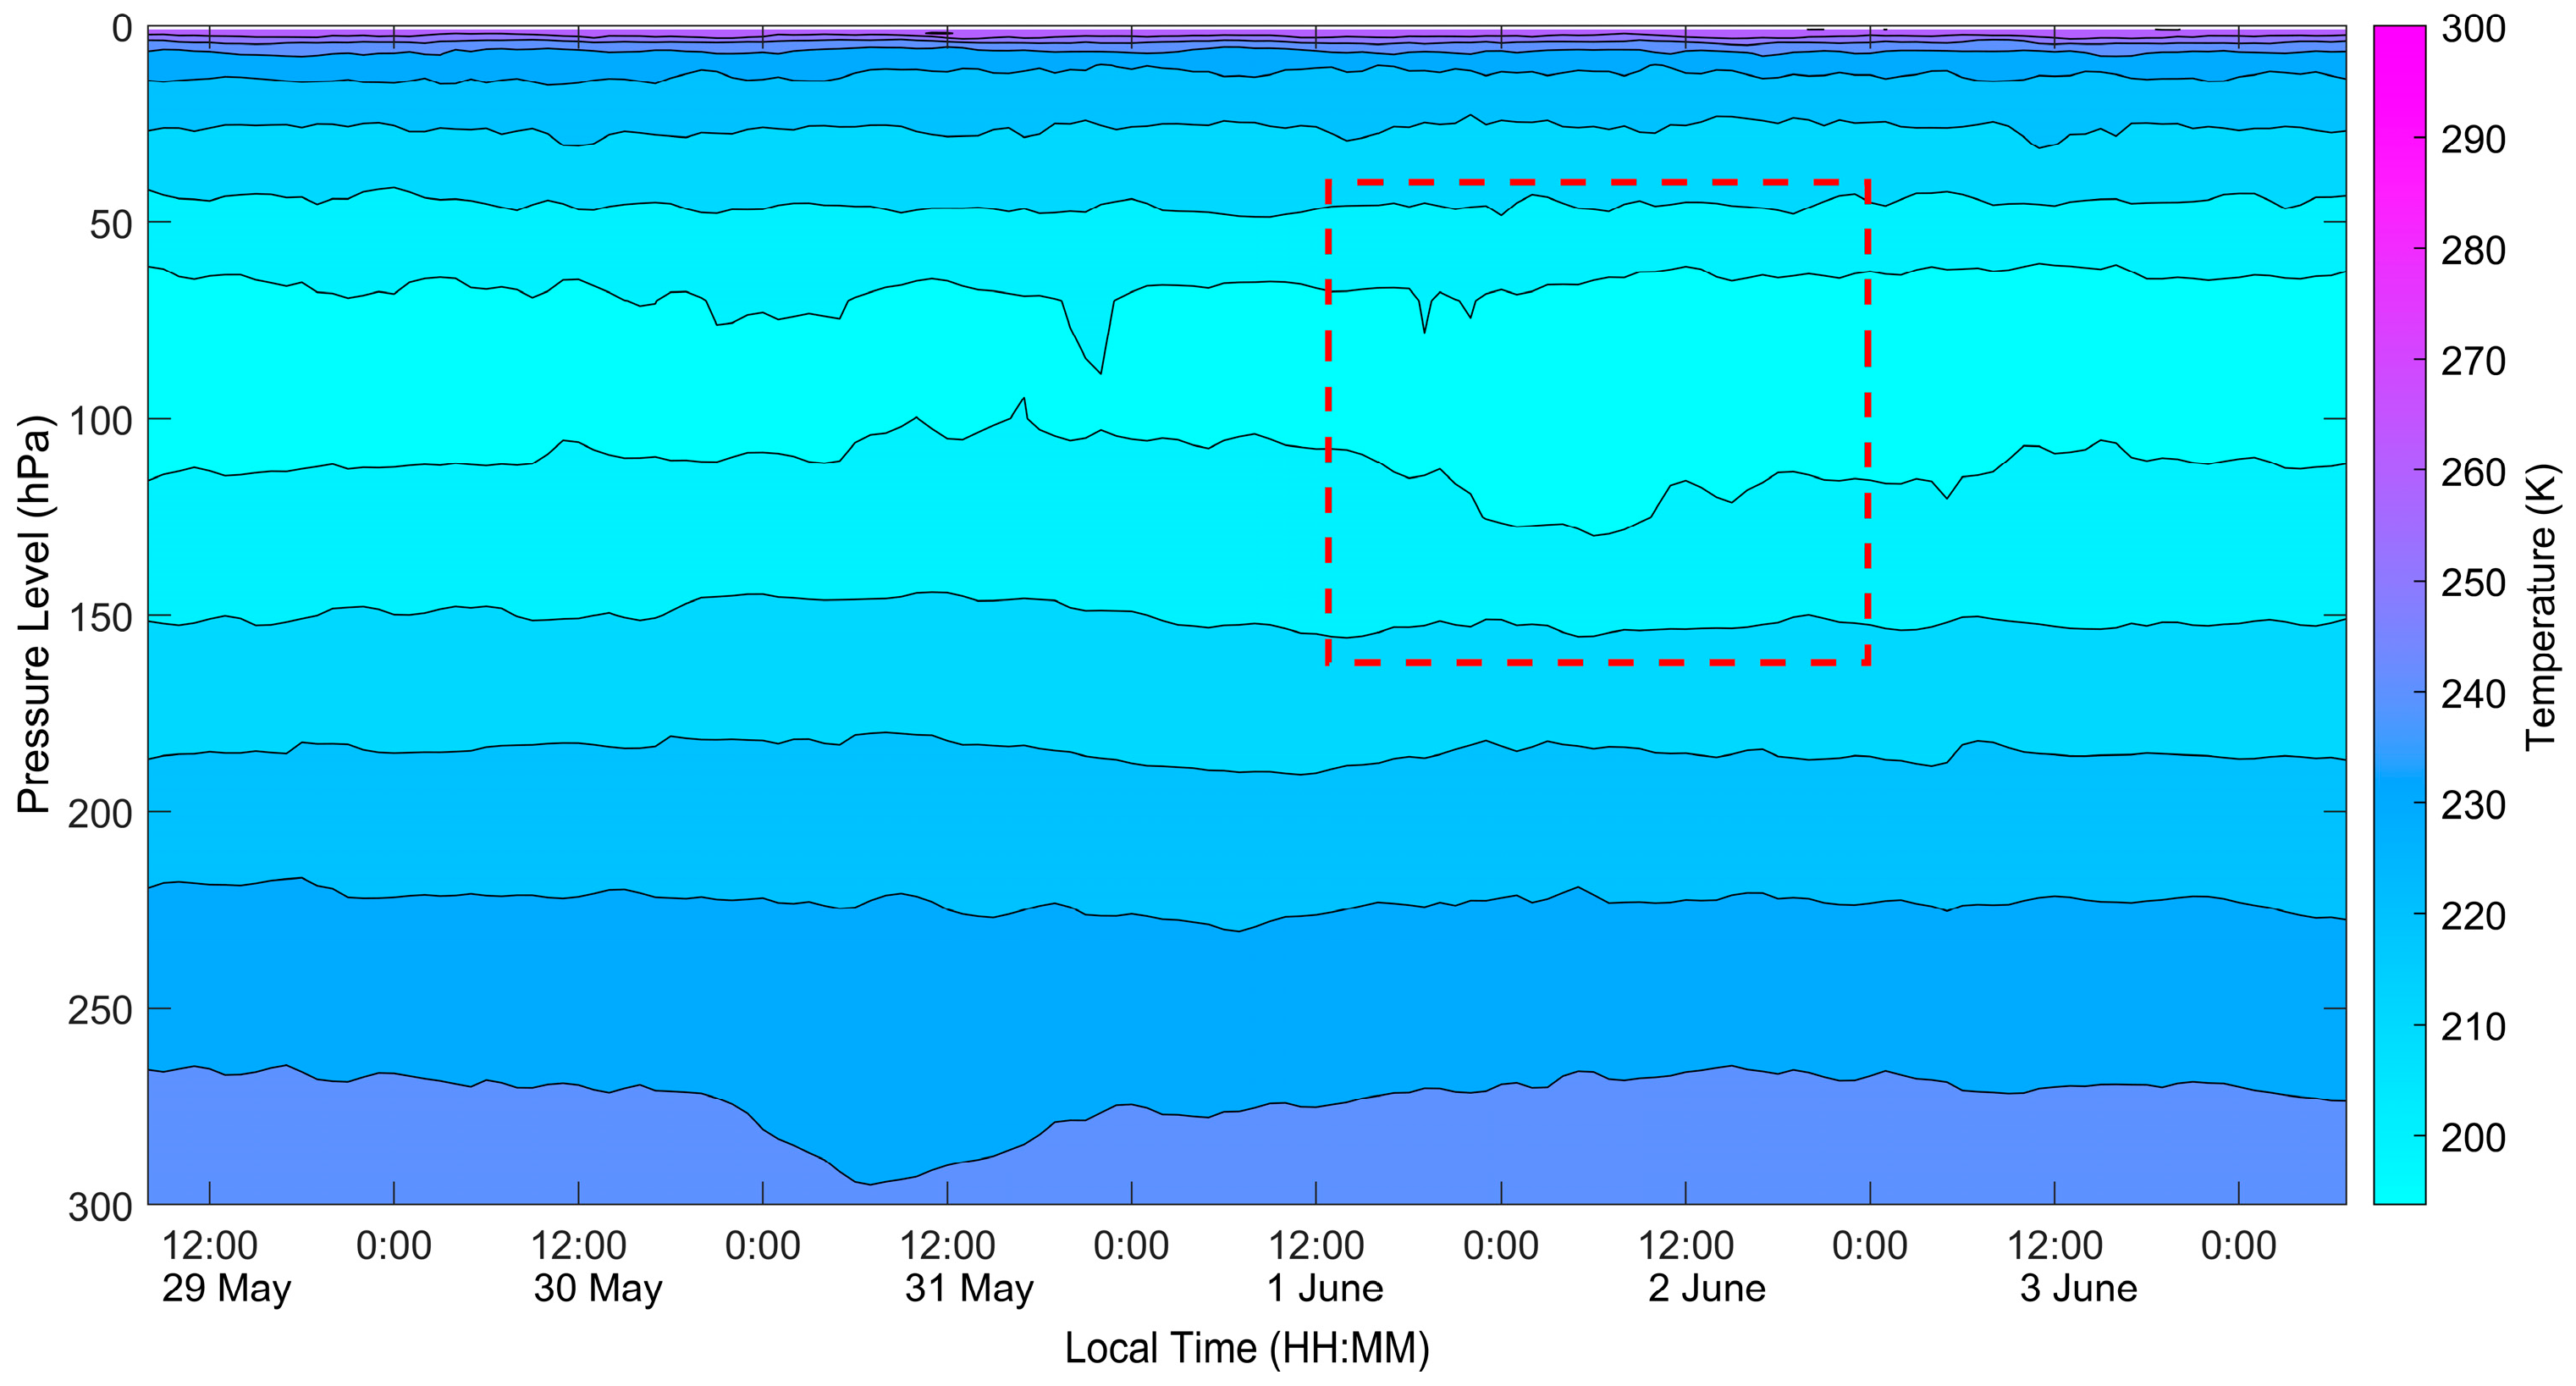
Figure 10 shows the temperature distribution in the upper troposphere and low stratosphere over the Wuhan MST radar from 29 May to 3 June from ERA5 reanalysis data. There is no obvious disturbance in the temperature at around the tropopause (~100 hPa) before 1 June. The red box in
Figure 10 highlights the dropping of the temperature contour at the heights just below the tropopause between 18:00 LT on 1 June and 12:00 LT on 2 June. The increased humidity around the tropopause also appeared in
Figure 9 during the same period. It is very likely that the upward transported vapor cooled the atmosphere below the tropopause and thus induced the fall of the tropopause.
To further understand the influence of the heavy rain on the tropopause, we also analyzed the variations of the potential vorticity (PV) and ozone content from ERA5 reanalysis data before, during, and after the heavy rain. The meridional direction of the PV on the isentropic surface has a positive gradient in the northern hemisphere, a negative gradient in the southern hemisphere, and a zero gradient at the equator [
34]. Baroclinic instability needs the presence of a PV gradient along which the waves are amplified during cyclogenesis [
35].
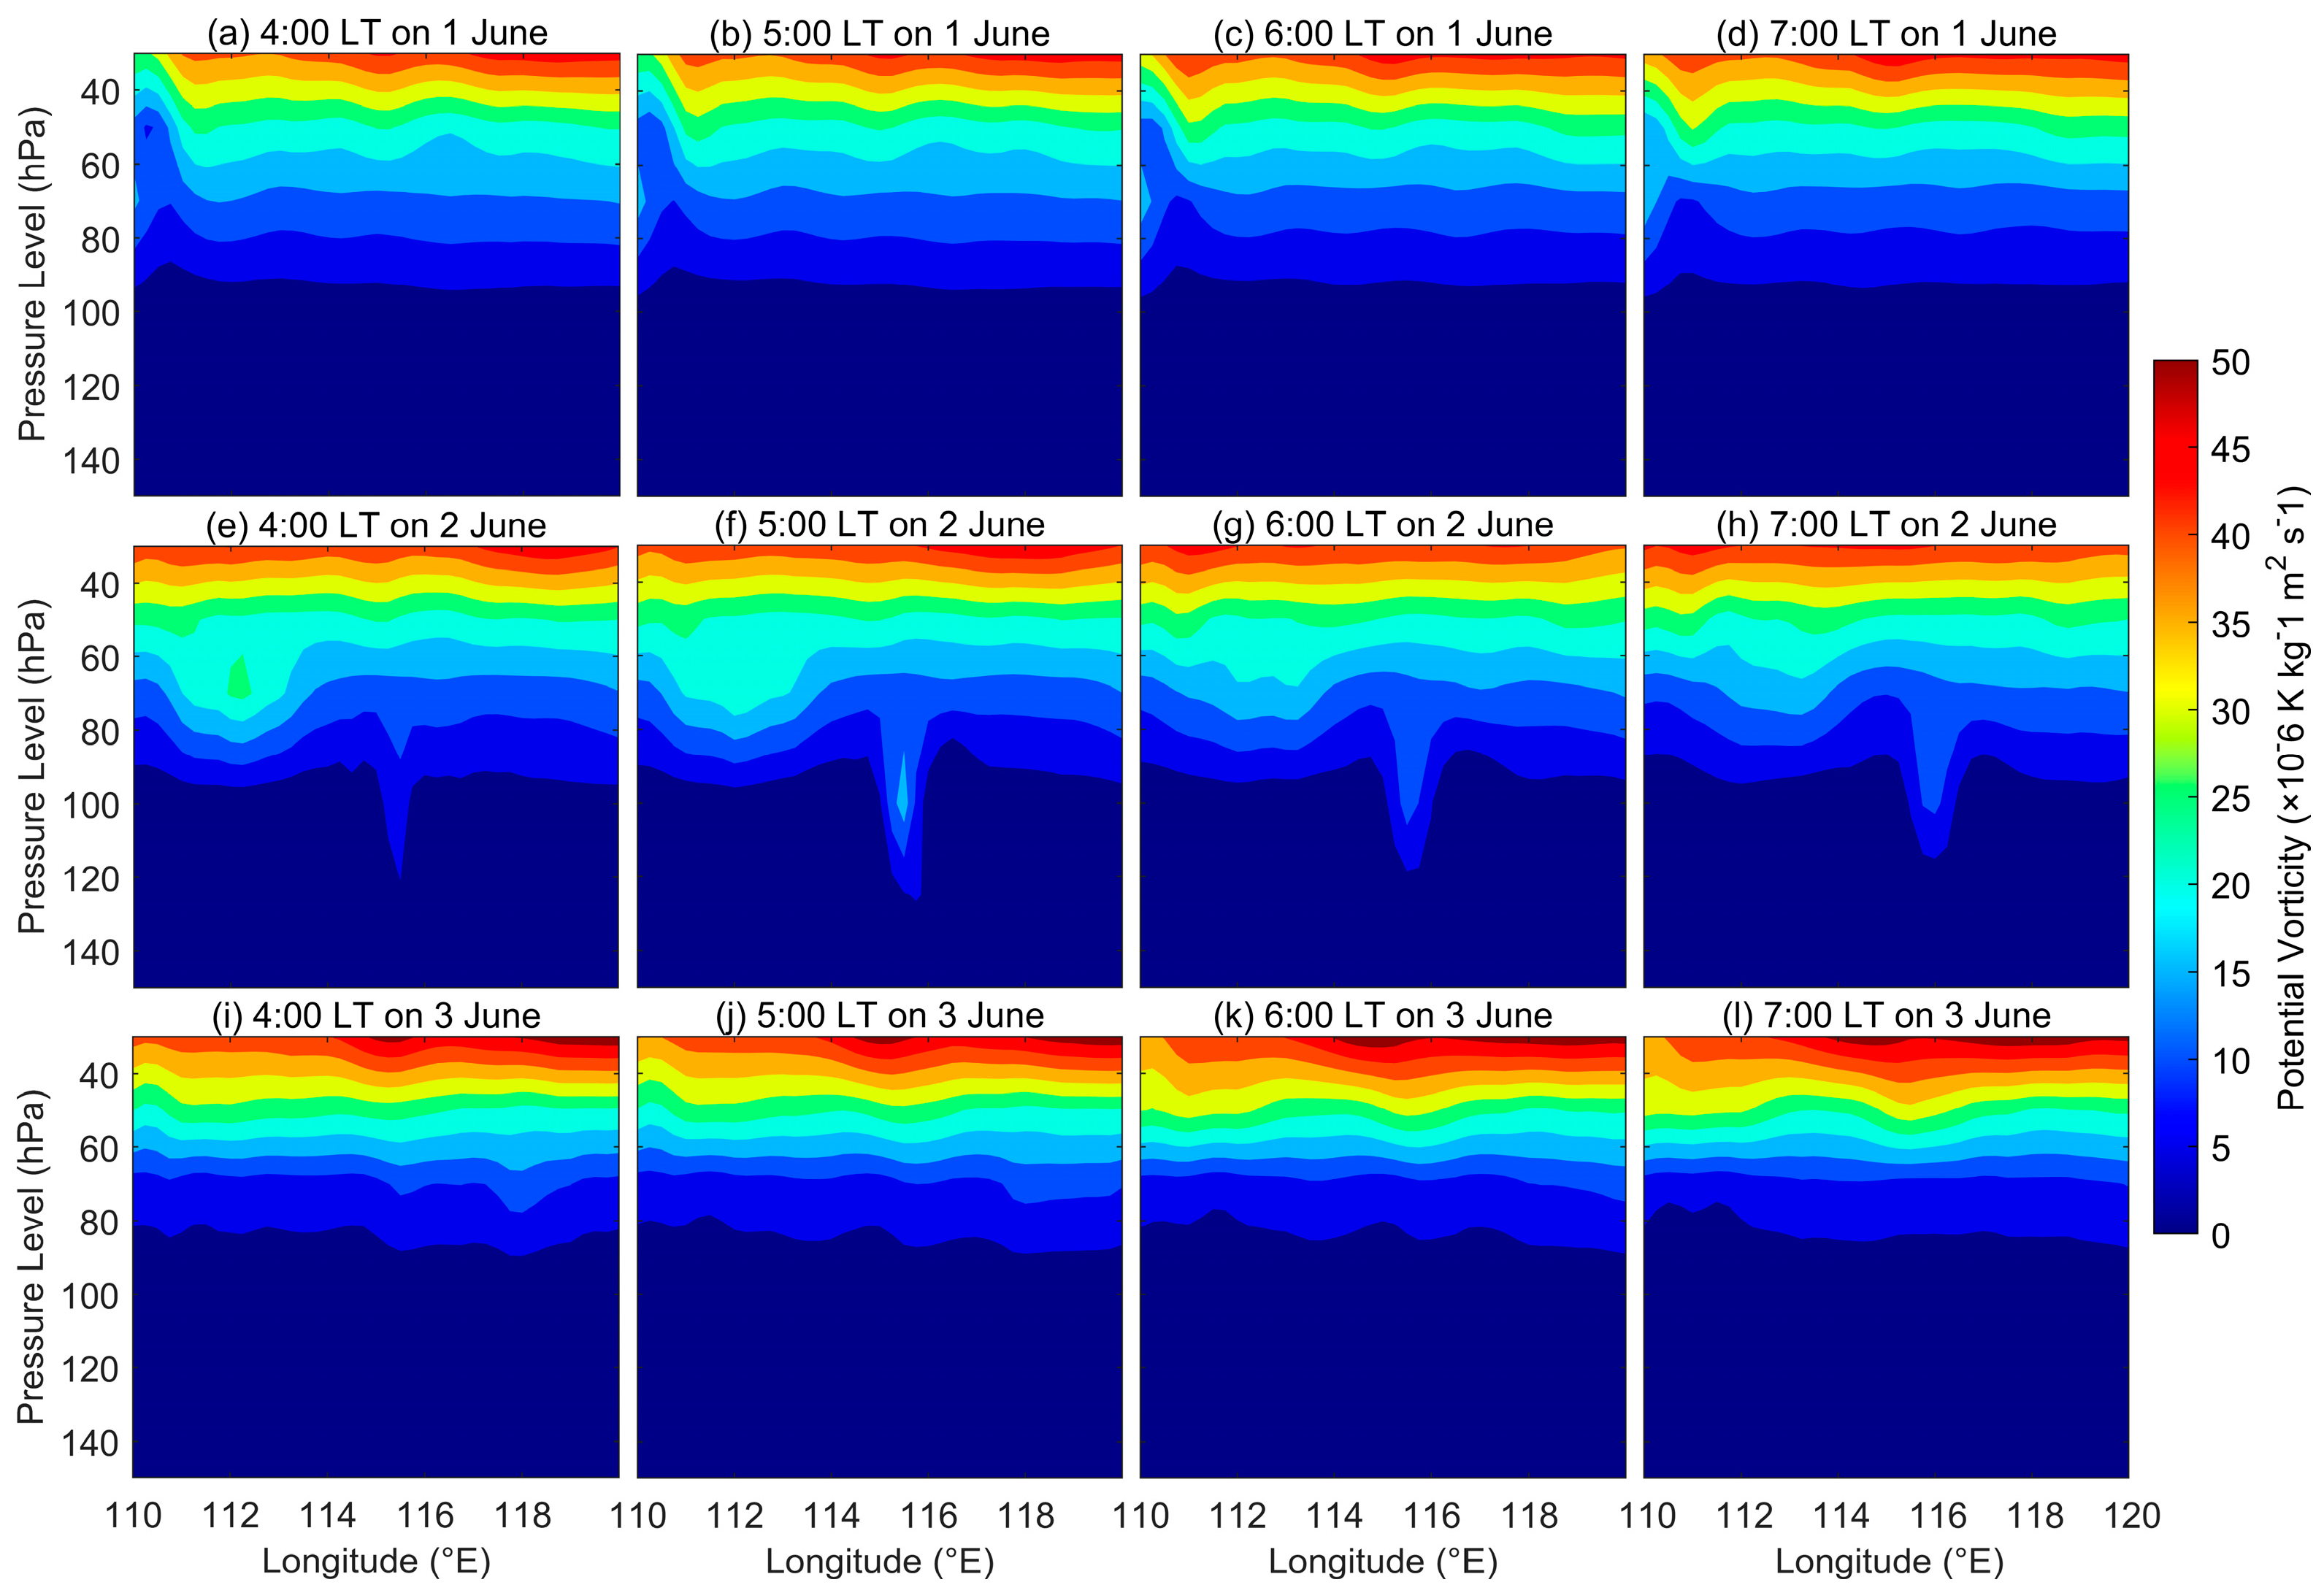
Figure 11 displays the PV values at different times on different days for comparison. The horizontal axis of each PV plot represents the range of Earth’s longitude from 110 to 120°E at the latitude of the Wuhan MST radar, and the vertical axis represents the heights from 150 to 25 hPa. The PV values on 1–3 June are listed from the top to bottom rows. In all the four plots in the middle row of
Figure 11, the PV contours at ~100 hPa height on 2 June dropped to ~120 hPa at the longitude of 115.5°E, indicating a PV anomaly occurring over the radar station during the heavy rain day. A PV anomaly is usually considered to be produced by the intrusion of stratospheric air into the upper troposphere [
19].
Deep intrusions of the tropospheric air into the lower stratosphere above the subtropical region are characterized by low O3 concentrations and low static stability [
36]. A large number of studies suggest that the transport of stratospheric air with large O3 content to the troposphere could be induced by tropopause folds or cyclonic cutting associated with extratropical cyclones [
37,
38,
39]. As O3 is produced and stored in the stratosphere, any increase of the O3 concentration in the upper troposphere could be attributed to the mixing of the stratospheric air. The pressure at the tropopause over central China is about 100 hPa [
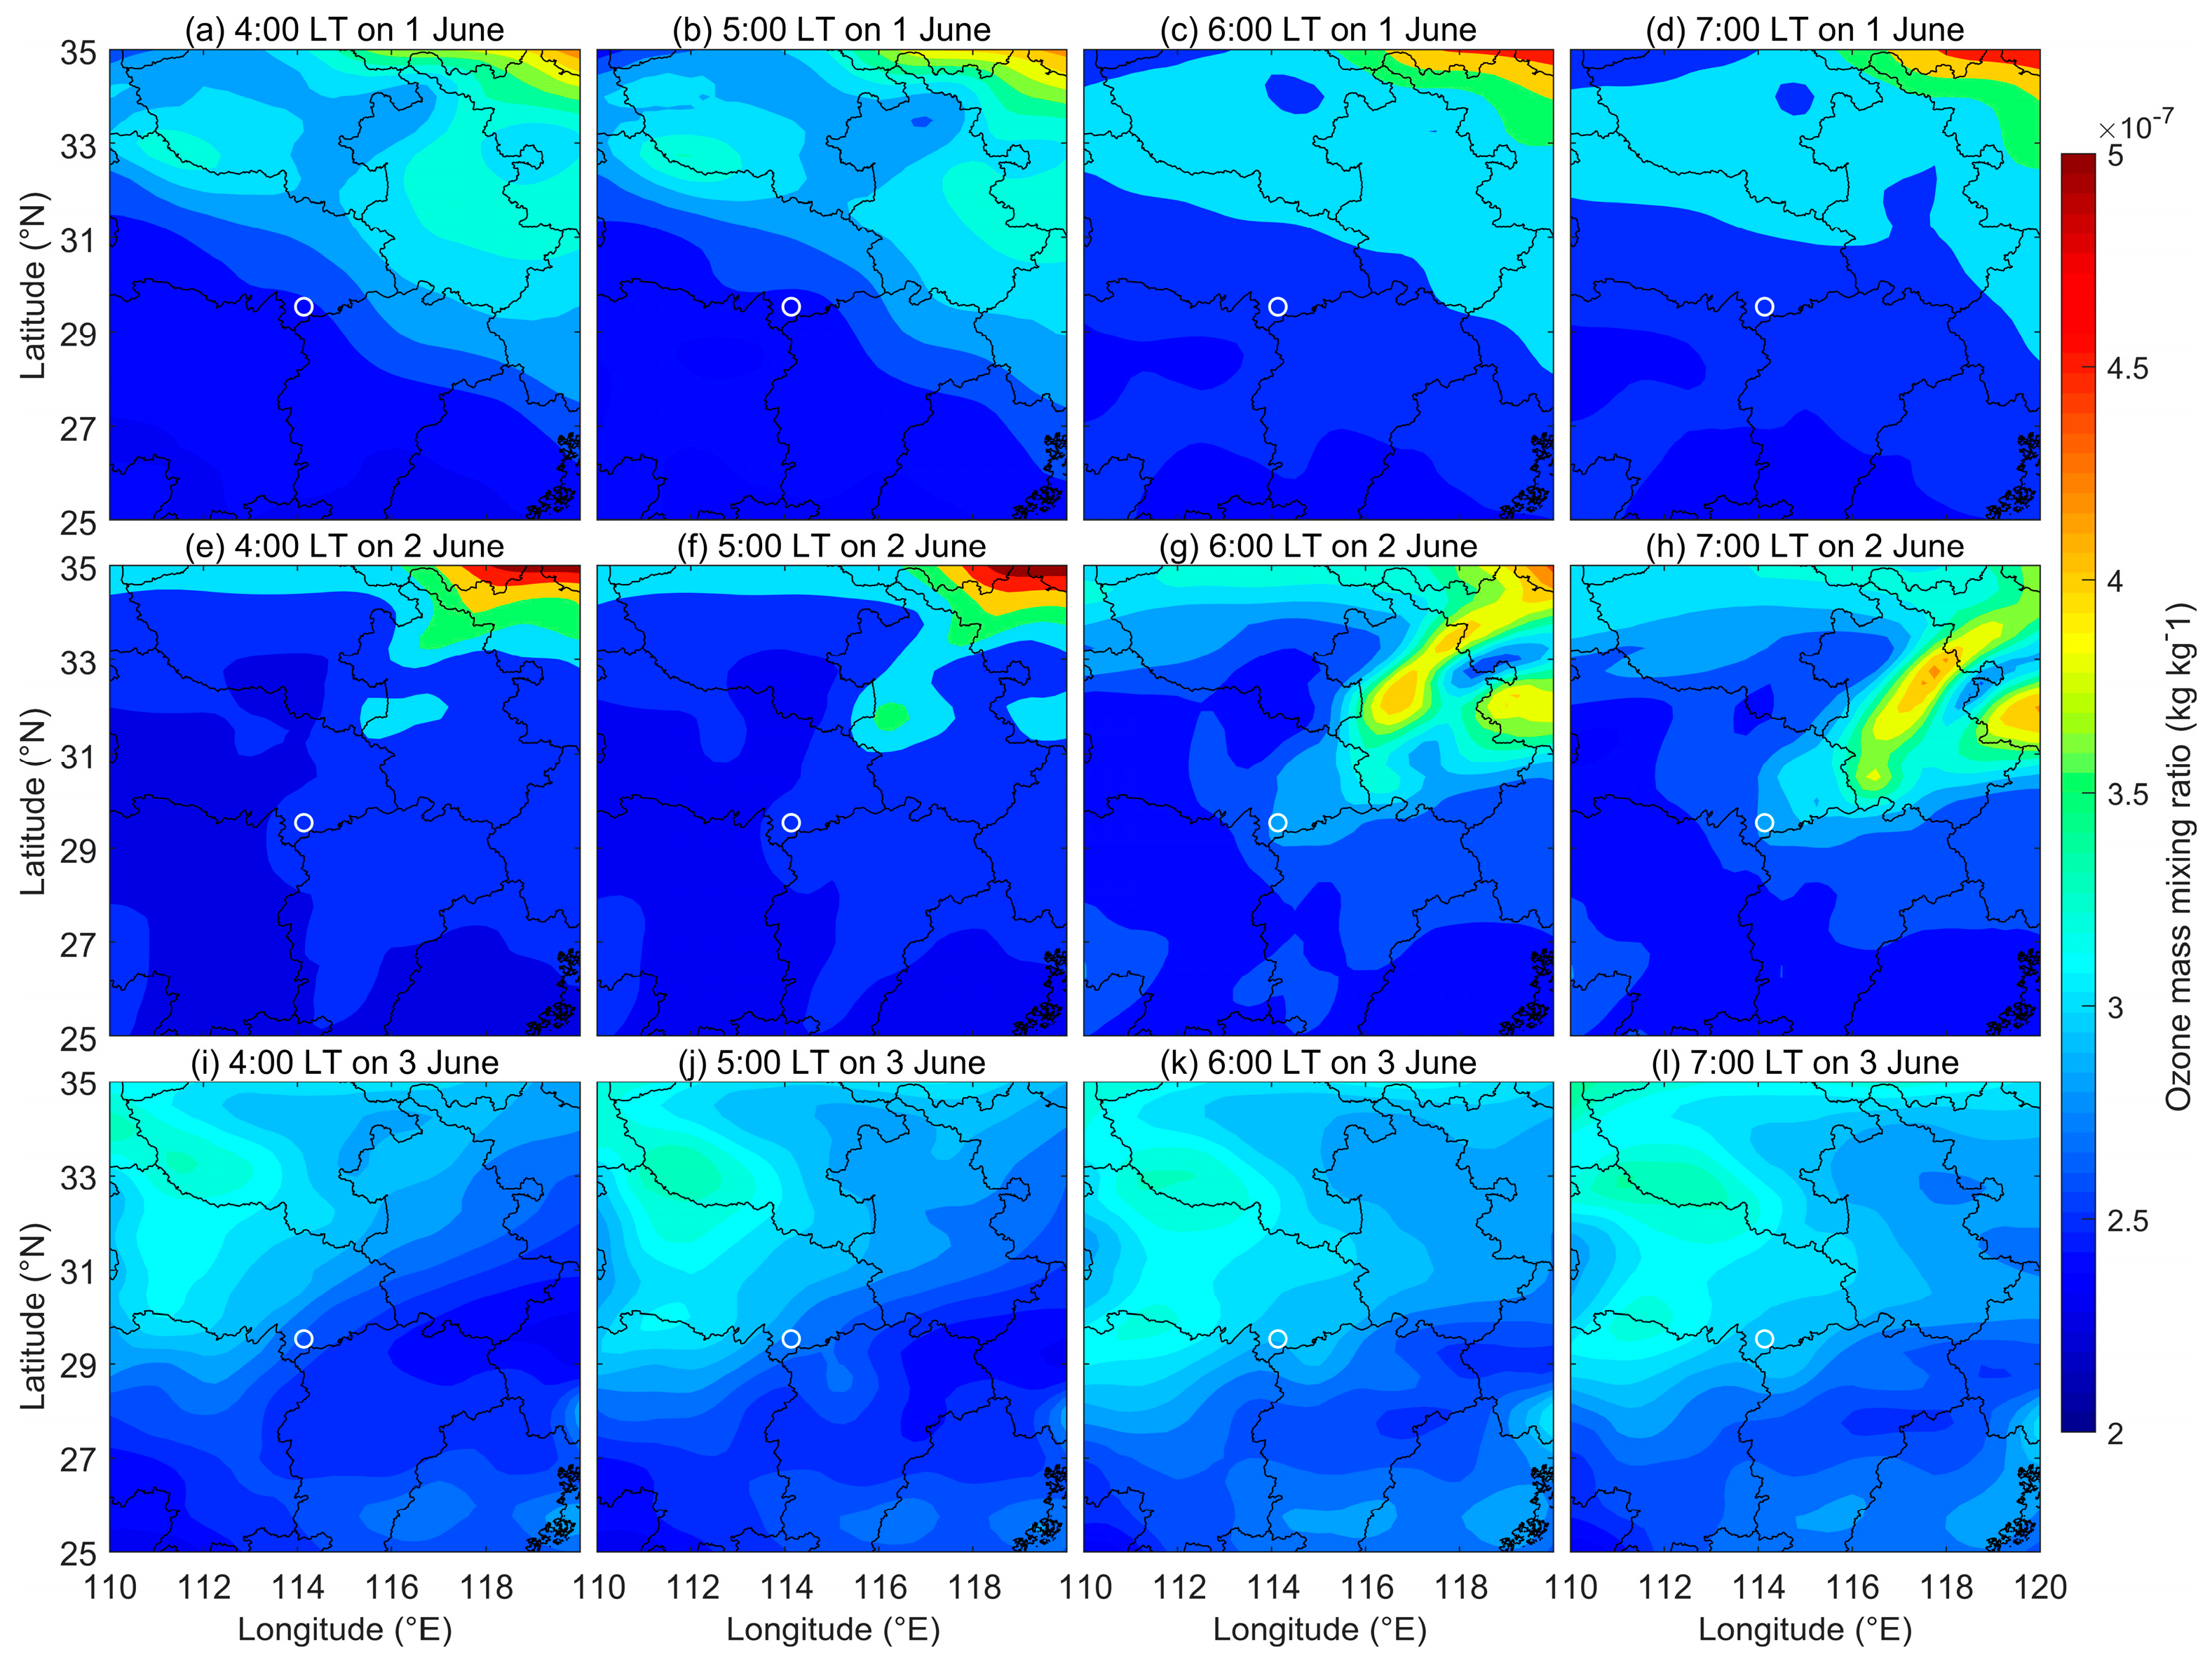
25]. Thus, we studied the O3 mixing ratio at the 100 hPa level over central China to identify variations of the O3 concentration during the heavy rain. The O3 mixing ratio maps at 4:00–7:00 LT on 1–3 June 2015 are displayed in
Figure 12, and the white circle implies the location of the Wuhan MST radar. In the plots of the top and bottom rows, there is no obvious regional enhancement of the ozone mass mixing ratio over the radar station on 1 and 3 June. The light red enhanced mixing ratio region appeared in the northeast of the radar station in
Figure 12g at 6:00 LT on 2 June, and the mix radio over the Wuhan MST radar also increased. Its occurrence time matches with that of the tropopause descent observed by the radar and the radiosonde in
Figure 6. The fall of the tropopause can also explain the reason for system enhancement, because the stratospheric air falling to the relatively unstable troposphere will lead to the reduction of air mass stability. Thus, the increase of O3 concentrations in the upper troposphere indicates that the O3-rich stratospheric air mass dropped to a lower level. Therefore, the increase of the O3 concentration at the 100 hPa level, as shown in
Figure 12, could corroborate the observed tropopause descent [
19].


 ,
, 


