Abstract
One of the most important tasks when studying volcanic activity is to monitor their thermal radiation. To fix and assess the evolution of thermal anomalies in areas of volcanoes, specialized hardware-thermal imagers are usually used, as well as specialized instruments of modern satellite systems. The data obtained with their help contain information that makes it relatively easy to track changes in temperature and the size of a thermal anomaly. At the same time, due to the high cost of such complexes and other limitations, thermal imagers sometimes cannot be used to solve scientific problems related to the study of volcanoes. In the current paper, day/night video cameras with an infrared-cut filter are considered as an alternative to specialized tools for monitoring volcanoes’ thermal activity. In the daytime, a camera operated in the visible range, and at night the filter was removed, increasing the camera’s light sensitivity by allowing near-infrared light to hit the sensor. In that mode, a visible thermal anomaly could be registered on images, as well as other bright glows, flares, and other artifacts. The purpose of this study is to detect thermal anomalies on night images, separate them from other bright areas, and find their characteristics, which could be used for volcano activity monitoring. Using the image archive of the Sheveluch volcano as an example, this article presents the results of developing a computer algorithm that makes it possible to find and classify thermal anomalies on video frames with an accuracy of 98%. The test results are presented, along with their validation based on thermal activity data obtained from satellite systems.
1. Introduction
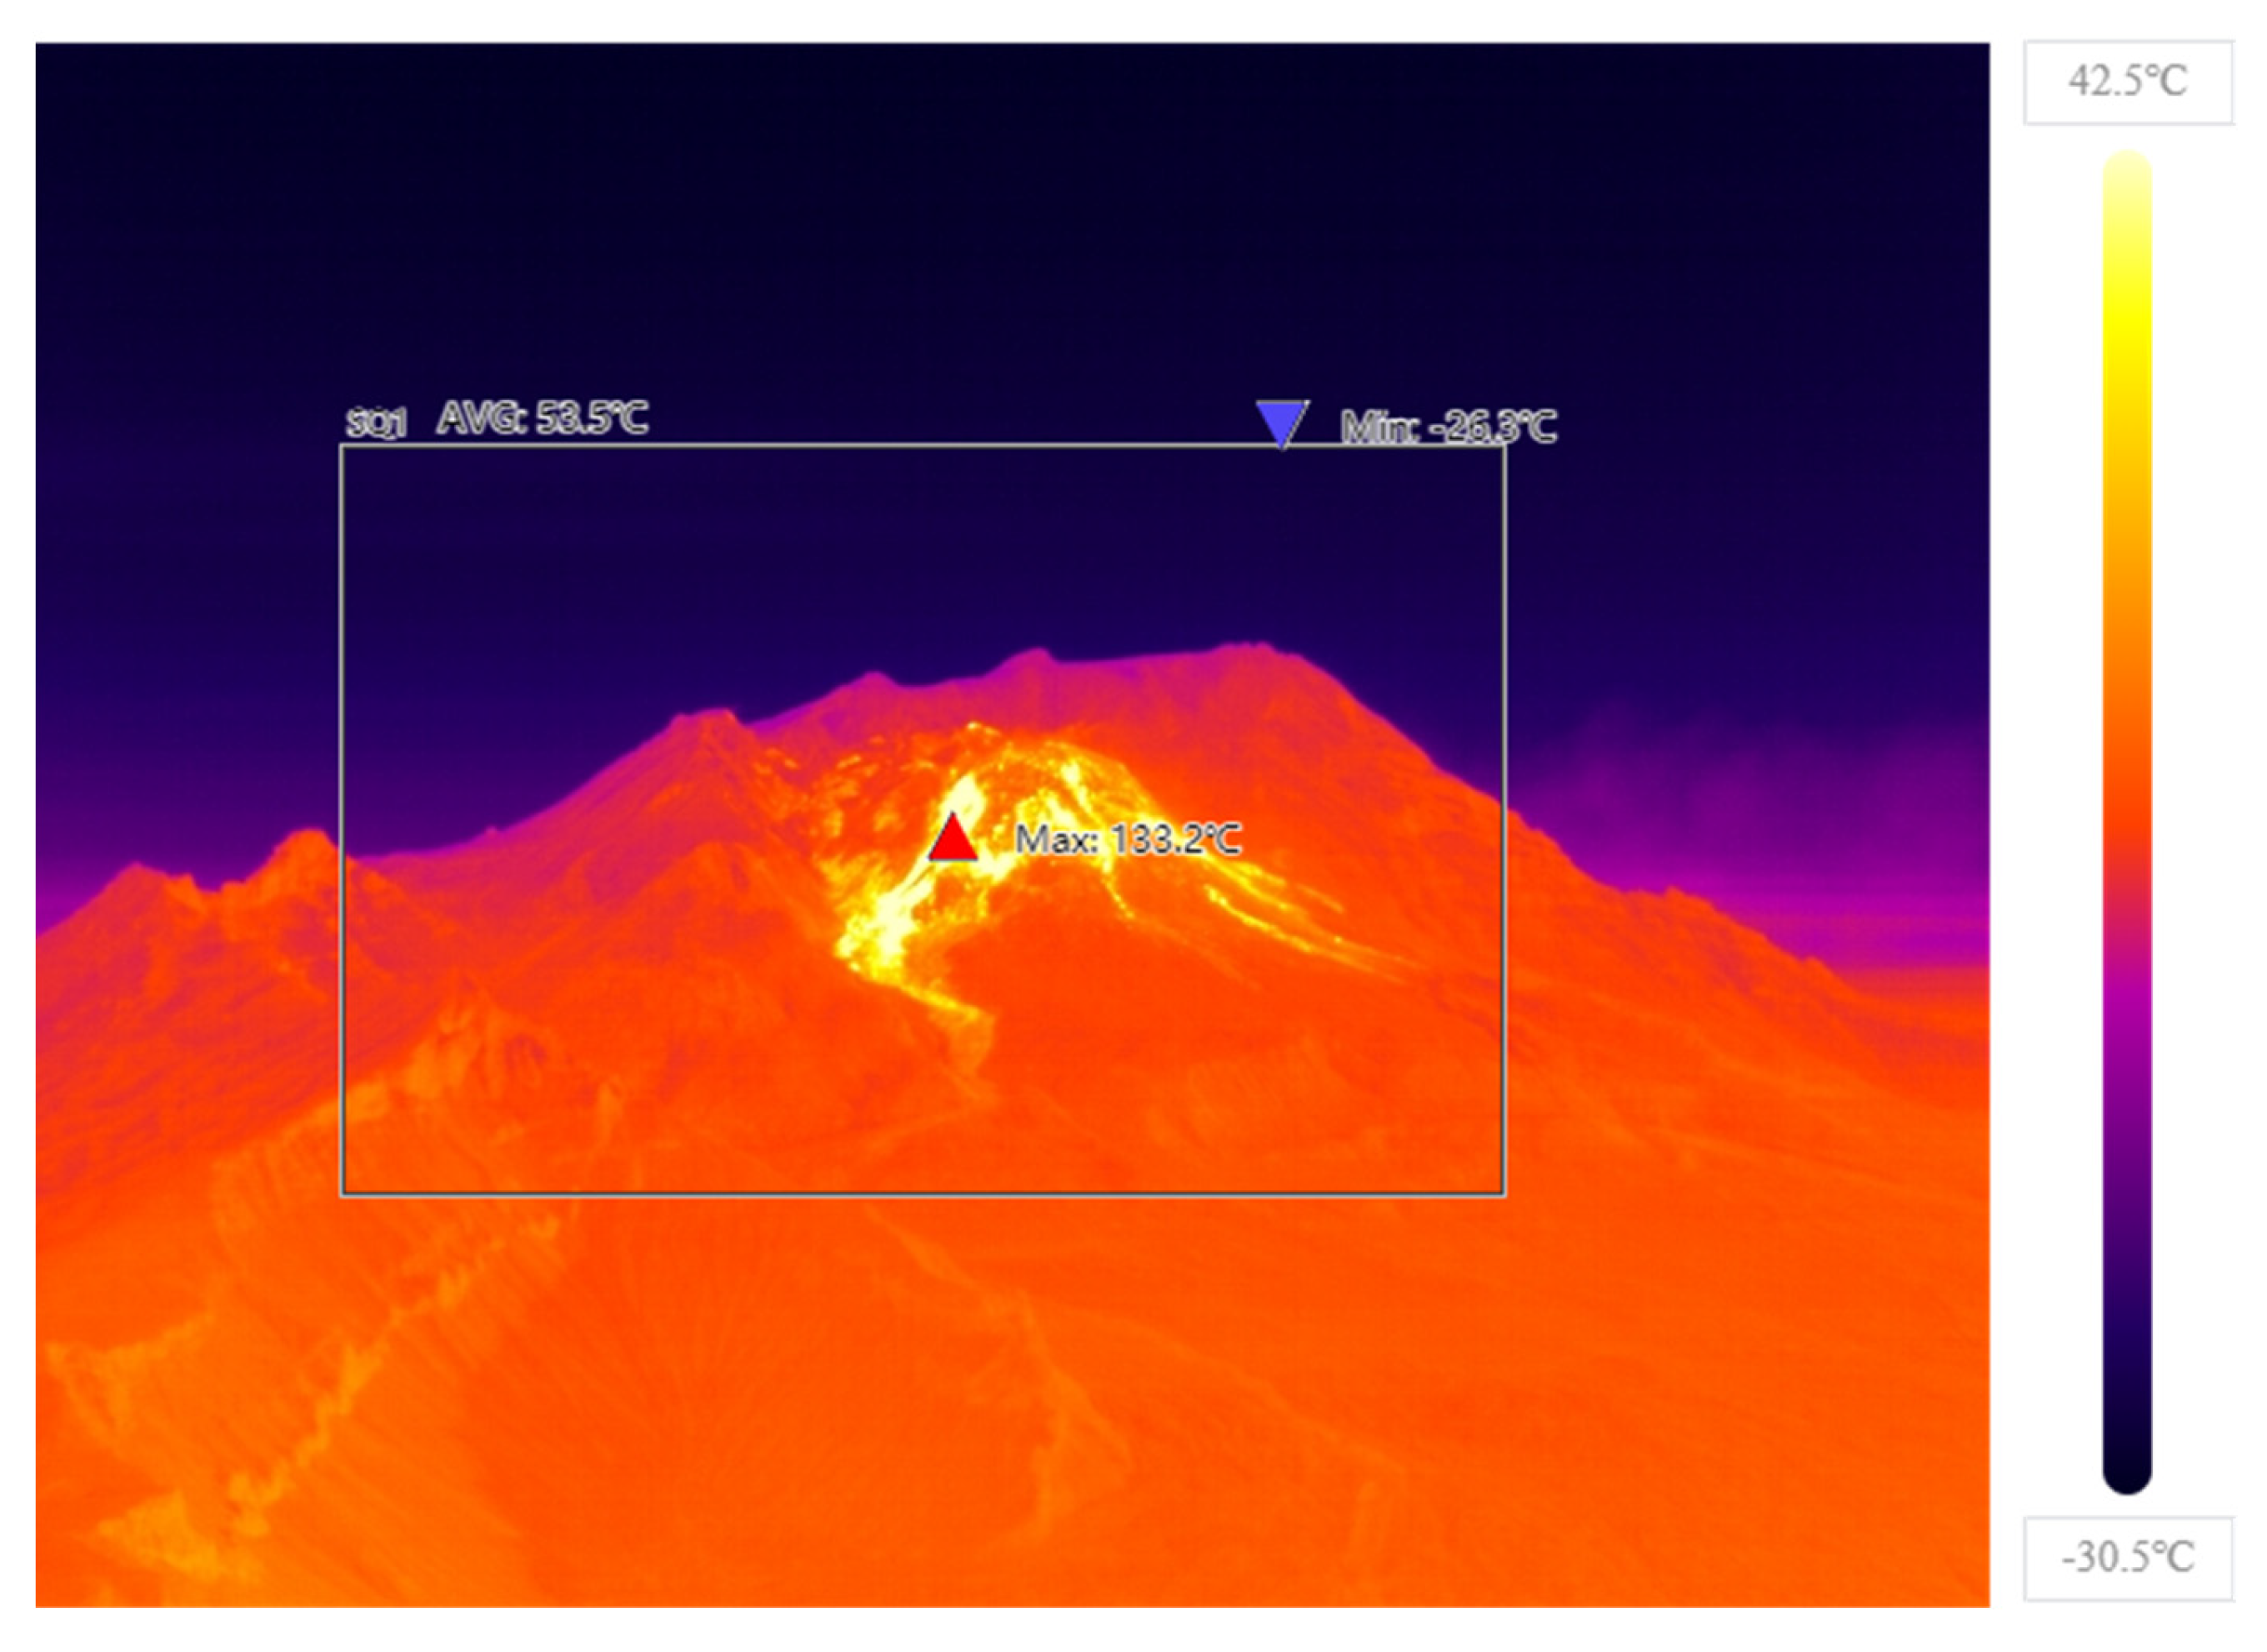
One of the most important tasks when monitoring volcanic activity is to control the thermal radiation of the object under study. The detection of the thermal anomaly and the growth of its area may indicate the intensification of volcano activity and/or the possible beginning of its eruption. As one of the main methods of operational monitoring in volcanoes, systems created with video cameras are widely used [1,2,3,4,5,6,7,8,9]. Unlike most modern satellite observation systems, they allow us to monitor the state of dangerous natural objects in real-time with a higher frequency and resolution. To detect thermal anomalies, imagers with a special InfraRed (IR) sensor are usually used. They detect differences in the heat emitted from objects to create an image. The data obtained from them, as in the case of specialized devices from satellite systems [10], make it possible to find the brightness temperature in each pixel of the image (Figure 1).
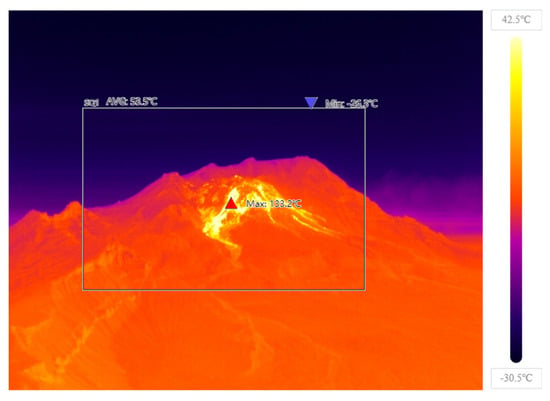
Figure 1.
An example of a thermal image of Sheveluch volcano, 17 October 2022 (taken by Nuzhdaev I.A. with Zenmuse H20T camera, manufactured by DJI, Shenzhen, China).
Algorithms that analyze such data are based on threshold methods with a centroid calculation, e.g., [4], deep learning [5], thermo-graphic analysis [8], and computer vision methods [9]. The main benefit of thermal infrared cameras is that they are passive, i.e., they can create images in complete darkness. Since they record thermal radiation, they are resistant to various forms of visible light. Along with these obvious advantages, thermal cameras are expensive to buy and have special requirements for the installation site: they cannot see through glass, and the distance to the observed object also has limitations.
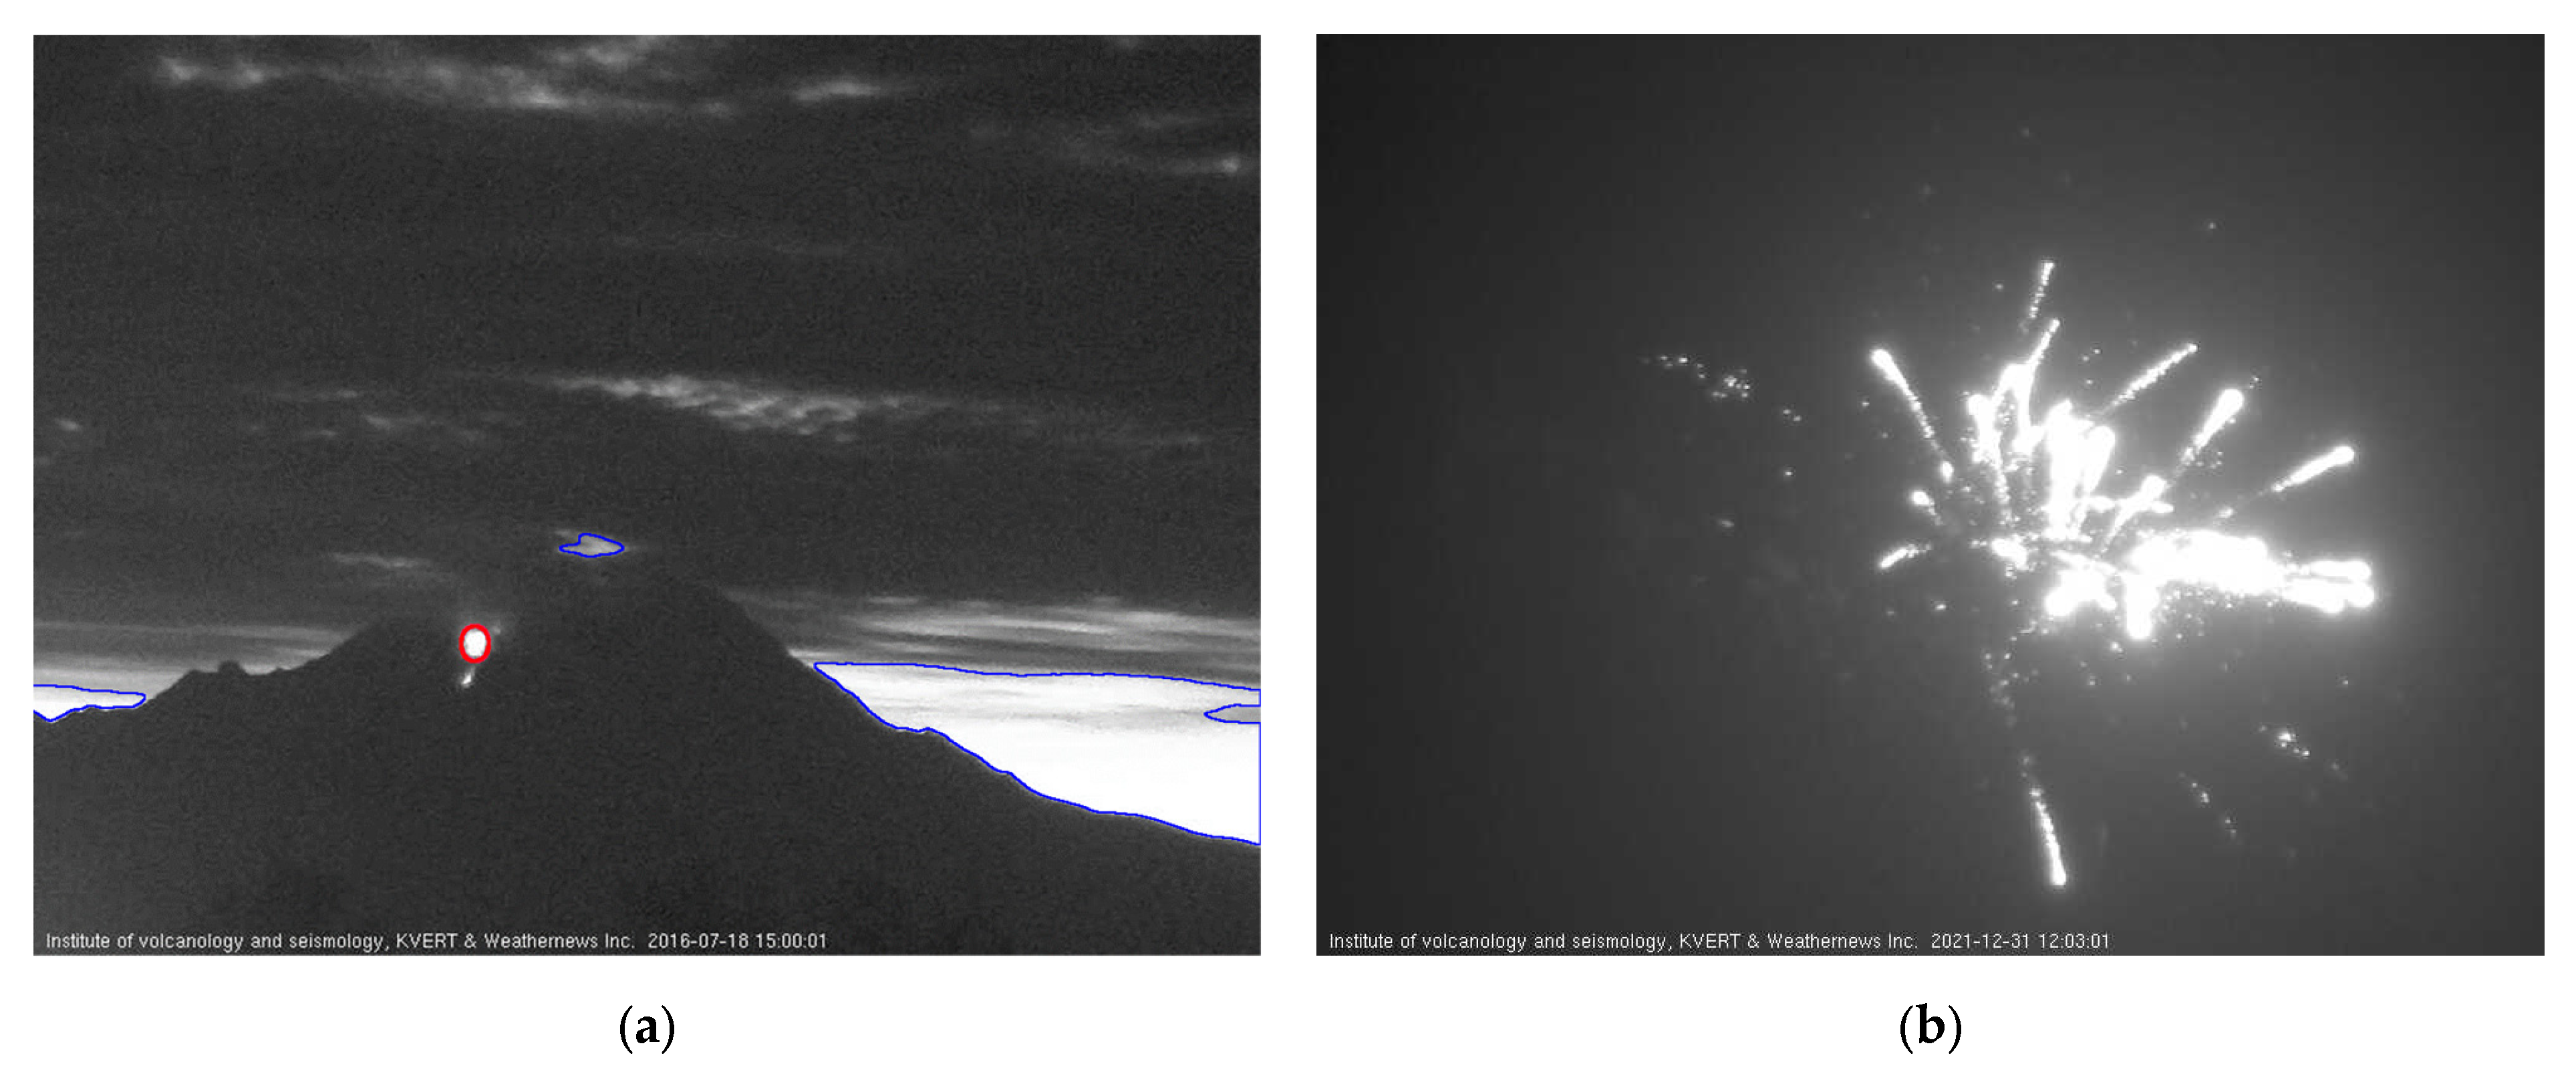
A simple day/night video camera equipped with an automatically removable IR-cut filter may be a possible alternative for volcano thermal activity monitoring. It is cheaper and can operate in harsh conditions in protective outdoor housing. In day mode, the camera uses visible light and delivers a color video. The filter prevents any naturally occurring IR light from reaching the camera’s sensor in order not to distort the colors of the video. As the light diminishes below a certain level of intensity, the camera automatically switches to night mode: the filter is removed, increasing the camera’s light sensitivity by allowing near-infrared light to hit the sensor. Since the IR light leaks through all three color filter types (RGB) on the sensor, color information is lost, and the camera delivers a greyscale image. Thermal radiation cannot be registered with this approach, but the light produced by a thermal anomaly is registered instead. If these bright areas are segmented in the image, then their size and brightness can be assessed, giving the indirect signs of volcano thermal activity. The main problem is that bright areas found on night images can correspond not only to target high-temperature zones but also to the extraneous illumination caused by natural, anthropogenic, or technogenic factors (Figure 2). This problem is especially important for cameras installed in settlements a long distance from volcanoes.
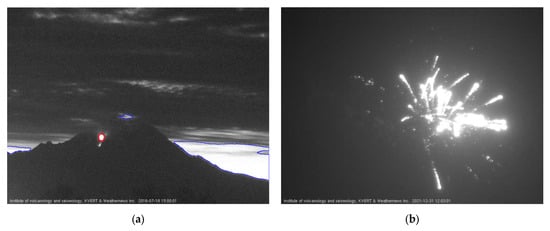
Figure 2.
Examples of extraneous illumination on night images of the Sheveluch volcano: (a) Thermal anomaly (outlined in red) and flares from dawn (outlined in blue) (image on 18 July 2016 15:00 UTC); (b) Brightness anomalies caused by fireworks (taken on 31 December 2021 12:03 UTC).
There are no papers describing successful solutions for the proper detection of bright areas that correspond with volcano thermal anomalies on night images. The use of the abovementioned threshold methods to detect thermal anomalies in night images may lead to many false positives on extraneous illumination, which has an intensity close to thermal anomalies in the image. In paper [11], we proposed a universal approach, which included the analysis of features by which thermal anomalies could be separated from other areas with high brightness in the image. These features included: the geometric shape of the anomaly, its elongation along the vertical axis, a uniform decrease in brightness from the center of the anomaly to its edges, and the standard deviation for the pixel intensity of the anomaly area. Based on these features, it is possible to classify bright areas, highlighting those that indicate a thermal anomaly. This problem can also be solved with the help of neural networks [5], which make it possible to automatically determine the characteristic features of such an area, though their training requires a large amount of properly labeled data. Creating such a dataset by manually labelling thermal anomalies on images is an extremely laborious task. There are other effective machine-learning methods that allow us to classify objects after training on small samples, for example, SVM [12]. Paper [11] aimed to demonstrate the possibility of using this method to classify thermal anomalies in night images and showed good preliminary results.
This article presents research that improves the previously proposed algorithm. All modifications are described in detail, and the quality of classification undertaken by a newly trained model is assessed. As a validation procedure, we used a classifier to detect thermal anomalies on images of the Sheveluch volcano for 2022. Dynamics of change in the size and intensity of the anomaly were further compared to the Sheveluch volcano thermal activity obtained by satellite data processing. An assessment of the effectiveness of the proposed solutions is given.
2. Hardware and Data
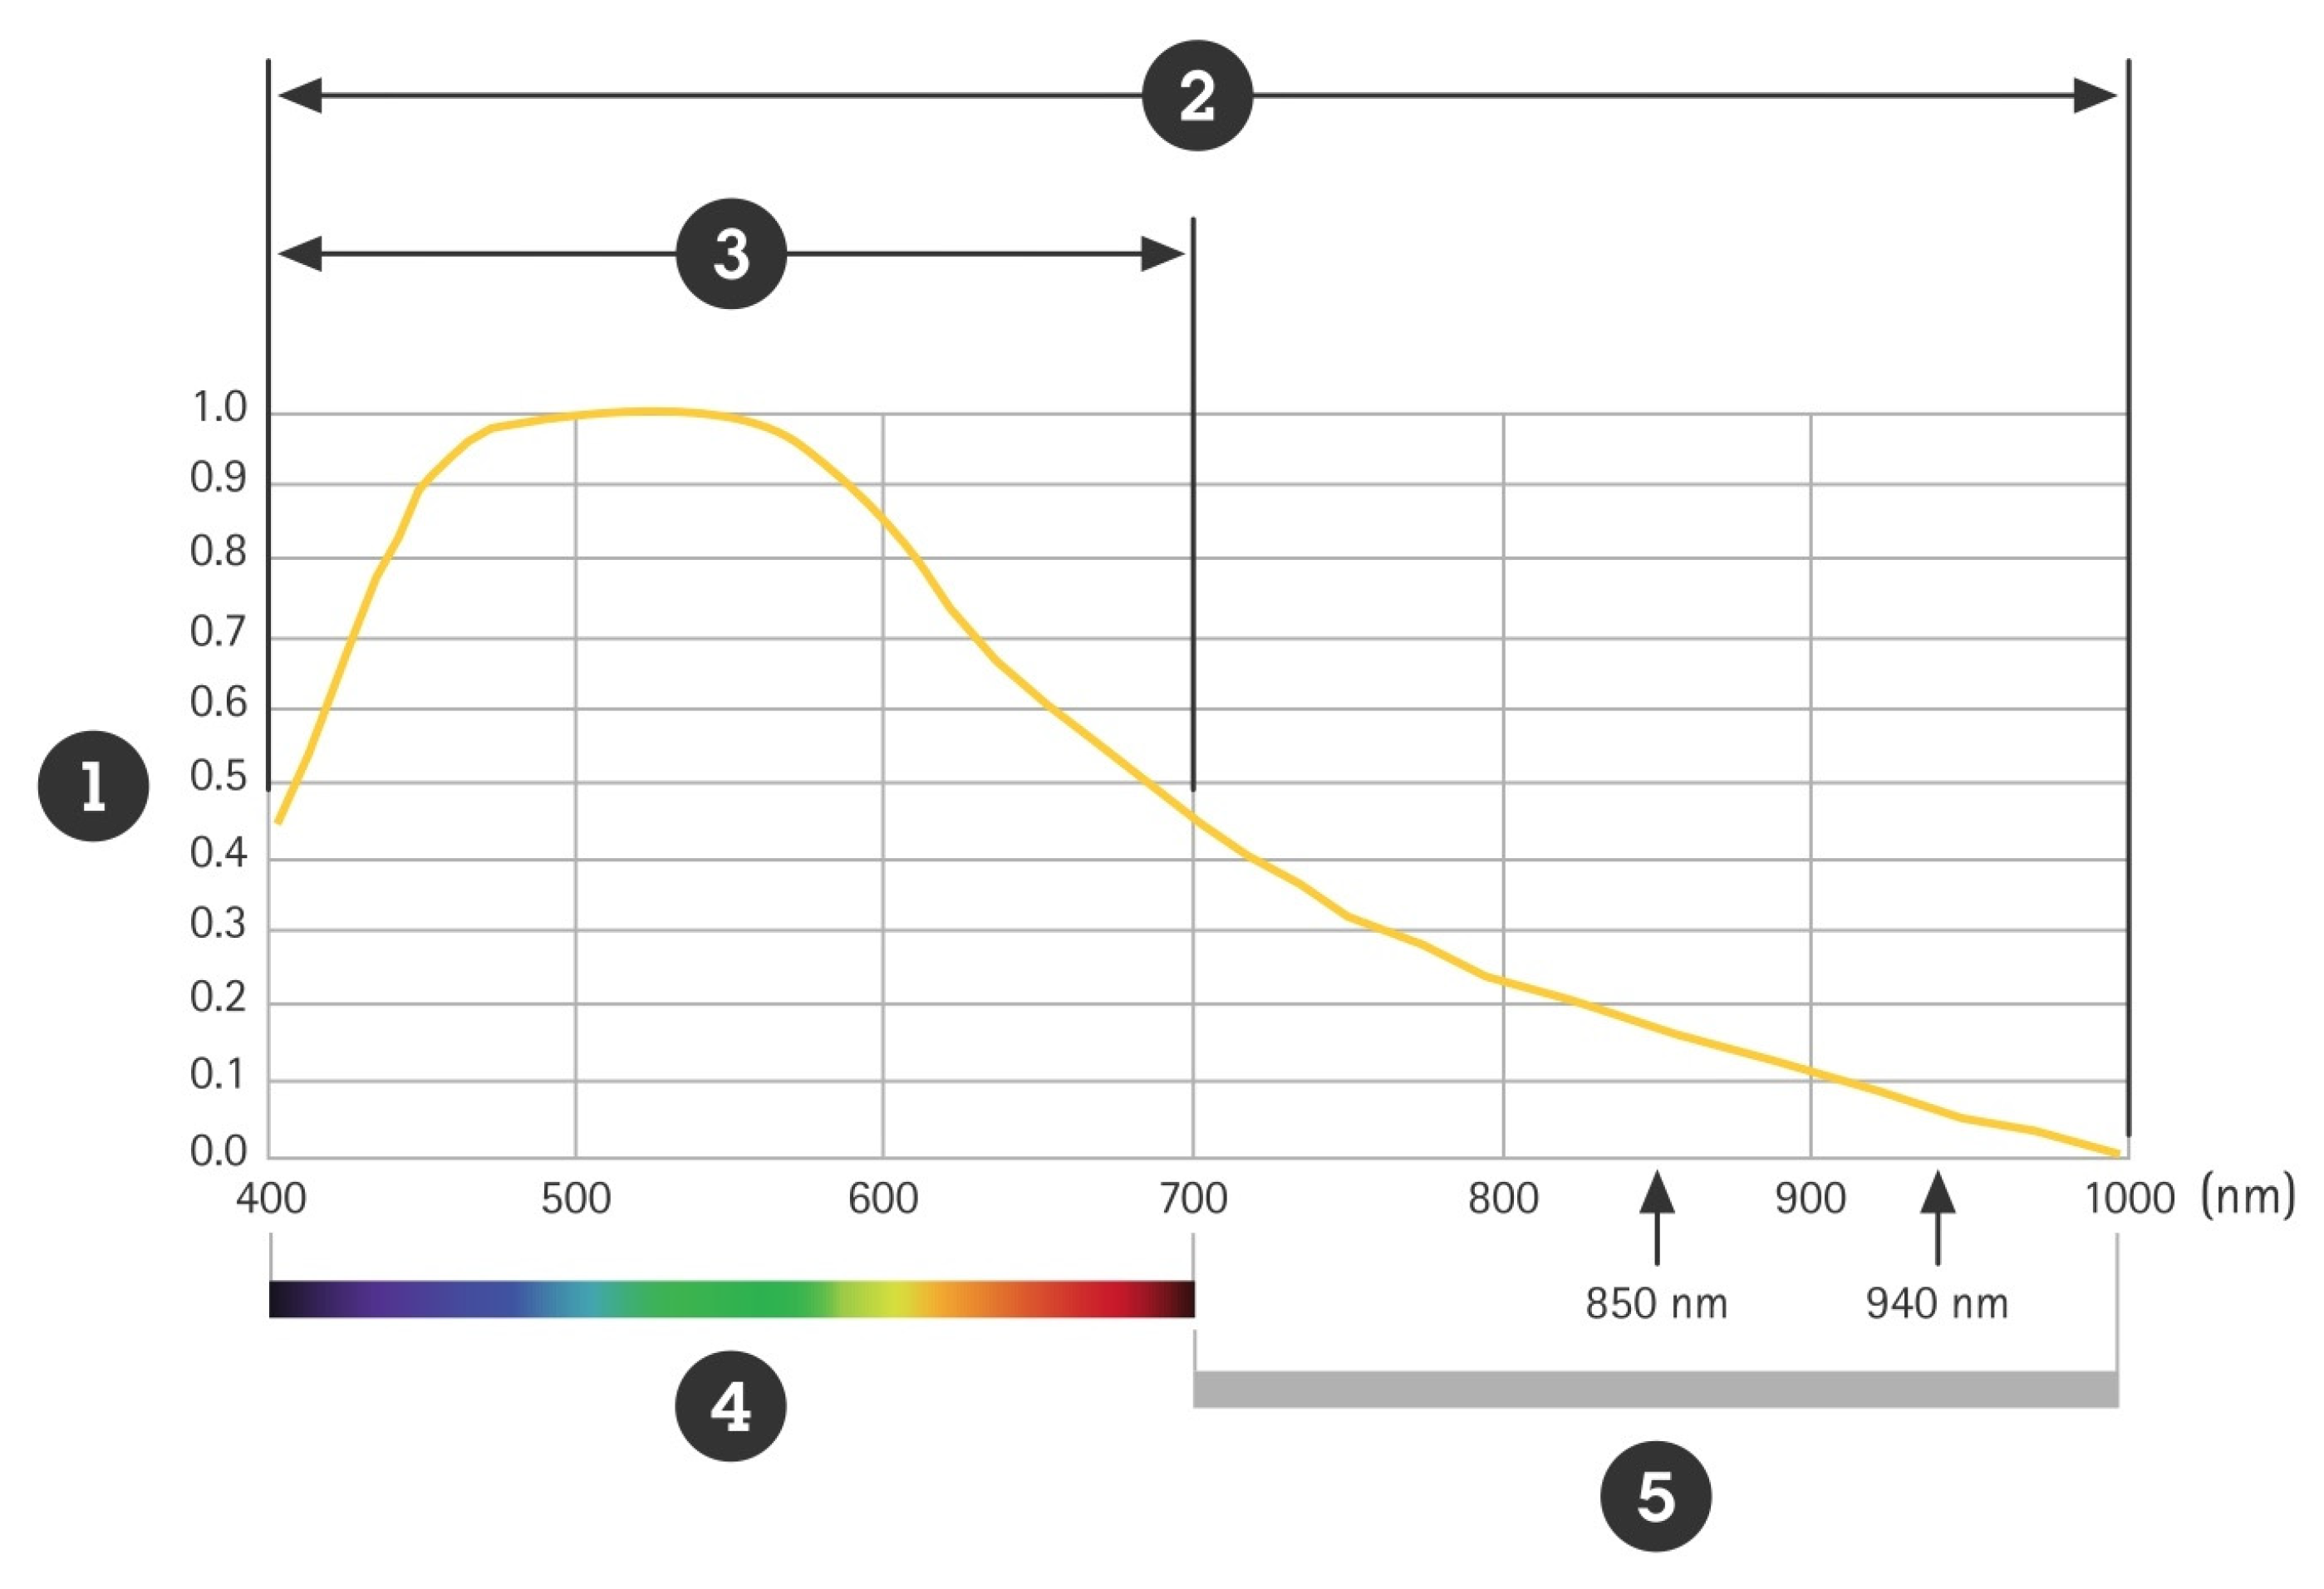
The data used in the current research were generated using the Axis P1343 video camera operating in the Kamchatka volcano video surveillance system [13]. It has a ¼” CMOS sensor with a focal length of 3–8 mm and an IR-cut filter. Figure 3 shows the sensor response to the light wavelength.
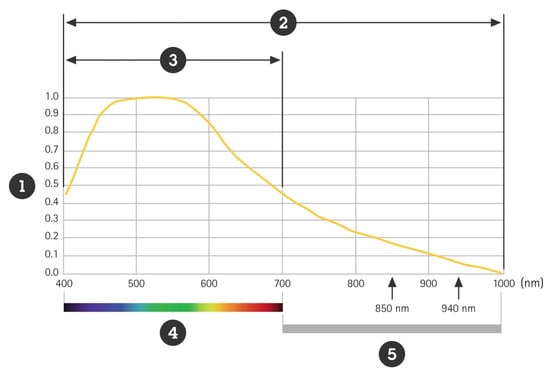
Figure 3.
The camera sensor response to visible and NIR light: 1—relative sensor sensitivity; 2—wavelength used in night mode; 3—wavelengths used in day mode; 4—visible light; 5—near-infrared light [14].
The video camera was installed at the Kamchatka Volcanological Station, named after F.Yu. Levinson-Lessing (a part of IVS FEB RAS) in the Klyuchi village conducted continuous monitoring of the Sheveluch volcano from a distance of 50 km. It was managed by the information system, which provided the following capabilities:
- Continuous daily monitoring the whole year round.
- An image fetching interval varying from 1 to 20 min, depending on the aviation color code for volcano hazard as defined by VONA (Volcano Observatory Notice for Aviation) and data released by KVERT (Kamchatkan Volcanic Eruption Response Team) (http://www.kscnet.ru/ivs/kvert/ accessed on 1 October 2023).
In our work, development, testing, and validation were carried out using the archive of JPG images from the Sheveluch volcano with a resolution of 800 × 600 collected during the observation period 2021–2022. Since the archive contained a mixture of color (day) images and greyscale (night) images, the greyscale ones needed to be filtered. This was accomplished by comparing the intensity values in RGB image channels: they were the same for the greyscale mode.
3. Thermal Anomaly Detection Algorithm
The algorithm proposed in [11] was used as the basis for the solution to detect thermal anomalies. It consists of several successive stages.
- Determining the centers of brightness anomalies by finding local maxima on the multiscale Difference of Gaussians pyramid (DoG), as well as calculating the area occupied by anomalies in the image using the breadth-first search method.
- Feature vector calculation, followed by the normalization of vector component’s values.
- Classification of feature vectors by the support vector machine (SVM), dividing the previously found anomalies into two classes: “thermal” and “non-thermal”.
During the further testing of the algorithm, the following shortcomings and limitations were identified:
- Areas related to anomalies were often identified incorrectly, which led to their incorrect classification.
- Some extraneous glows and bright flares were erroneously classified as volcano-related thermal anomalies.
- When training the SVM model, the search for optimal values was performed for the incomplete hyperparameters set (for example, the use of polynomial functions instead of radial basis functions was not tested). In addition, 2-fold cross-correlation was used to check the model’s quality, and a metric was used, which did not perform well for unbalanced samples.
3.1. Correct Segmentation of the Anomaly
When the centers of possible anomalies are found at the DoG layer , –the number of layers, these centers are used as an input for the procedure of identifying the regions occupied by the anomalies on the layer. The resultant regions are defined by map , which has the same dimension as the source image, and its pixels contain the anomaly index or 0 if the pixel does not belong to any anomaly. At the first stage, the map is zero-filled, then the pixel queue is initialized for each center , , according to the following steps.
- If the current pixel in the queue satisfies the condition , then the pixel neighborhood with a radius 1 is considered (step 2); otherwise, the pixel is just skipped in segmentation.
- If pixel of the neighborhood satisfies the condition , then index is recorded for the corresponding pixel of map , and is added to the queue.
- Steps 1–2 are repeated until the queue is empty.
In a previous version of this algorithm, we used the following empirically defined parameters: Extensive testing showed that the anomaly area sometimes detected partially (Figure 4a). Increasing the number of DoG layers could lead to a situation when the segmentation includes pixels belonging both to the anomaly and dark background (Figure 4b). This makes it difficult to classify the anomaly properly and to calculate its size.

Figure 4.
Different versions of anomaly segmentation (shown with red outline): (a) Incomplete segmentation using origin algorithm; (b) Anomaly area over segmented by origin algorithm; (c) Correct segmentation with new empirical coefficients.
During further analysis, it was found that anomaly pixels did not always satisfy the inequality for This could potentially lead to the incomplete segmentation of anomaly pixels, as shown in Figure 4a. At the same time, since large anomalies (with size of 2000 pixels or more) are detected at big scales, the strong smoothing and condition , for leads to the segmentation of many dark pixels that do not belong to the anomaly (Figure 4b). After the experiments, new values of empirical coefficients are chosen as follows:
- –to decrease the possible difference between the intensity of the anomaly center and pixel .
- –to exclude neighbor pixels , which have a big difference in intensity with (most likely, such pixels do not belong to the anomaly).
Figure 4c shows the results of anomaly segmentation with the updated procedure.
At this stage, the training and test datasets were prepared. Using the improved approach described above, bright areas on the night images were preliminary detected and then manually labeled into two classes: “thermal anomaly” and “non-thermal anomaly”. The training set contains 78-night images of the Sheveluch volcano at different times of the year, including 822 “non-thermal” and 43 “thermal” anomalies. The test dataset contains 252 images of the Sheveluch volcano from 10 to 20 images for each month of 2021, including 321 “thermal” anomalies and 1745 “non-thermal” anomalies.
3.2. Filtering Extraneous Glows
After detecting all anomalies, it is necessary to determine which of them are potentially thermal and which are caused by extraneous illumination from glows of a different nature. To achieve this, the classification of feature vectors calculated for each individual anomaly is performed. In the original algorithm, feature vectors include the following seven components.
1. The value of the DoG function in the center.
2. The elongation of the anomaly–how different the rate of decrease in the function around the center in different directions is.
3. Brightness value in the center.
4. Perimeter coefficient–the ratio of the perimeter to the minimum possible perimeter.
5. The coefficient of asymmetry of values at the edges–this shows how evenly the brightness of the anomaly decreases from the center to its border.
6. Peak coefficient–shows how much greater the brightness at the center of the anomaly is than the average brightness of the borders.
7. The number of the DoG scale layer on which this anomaly was found.
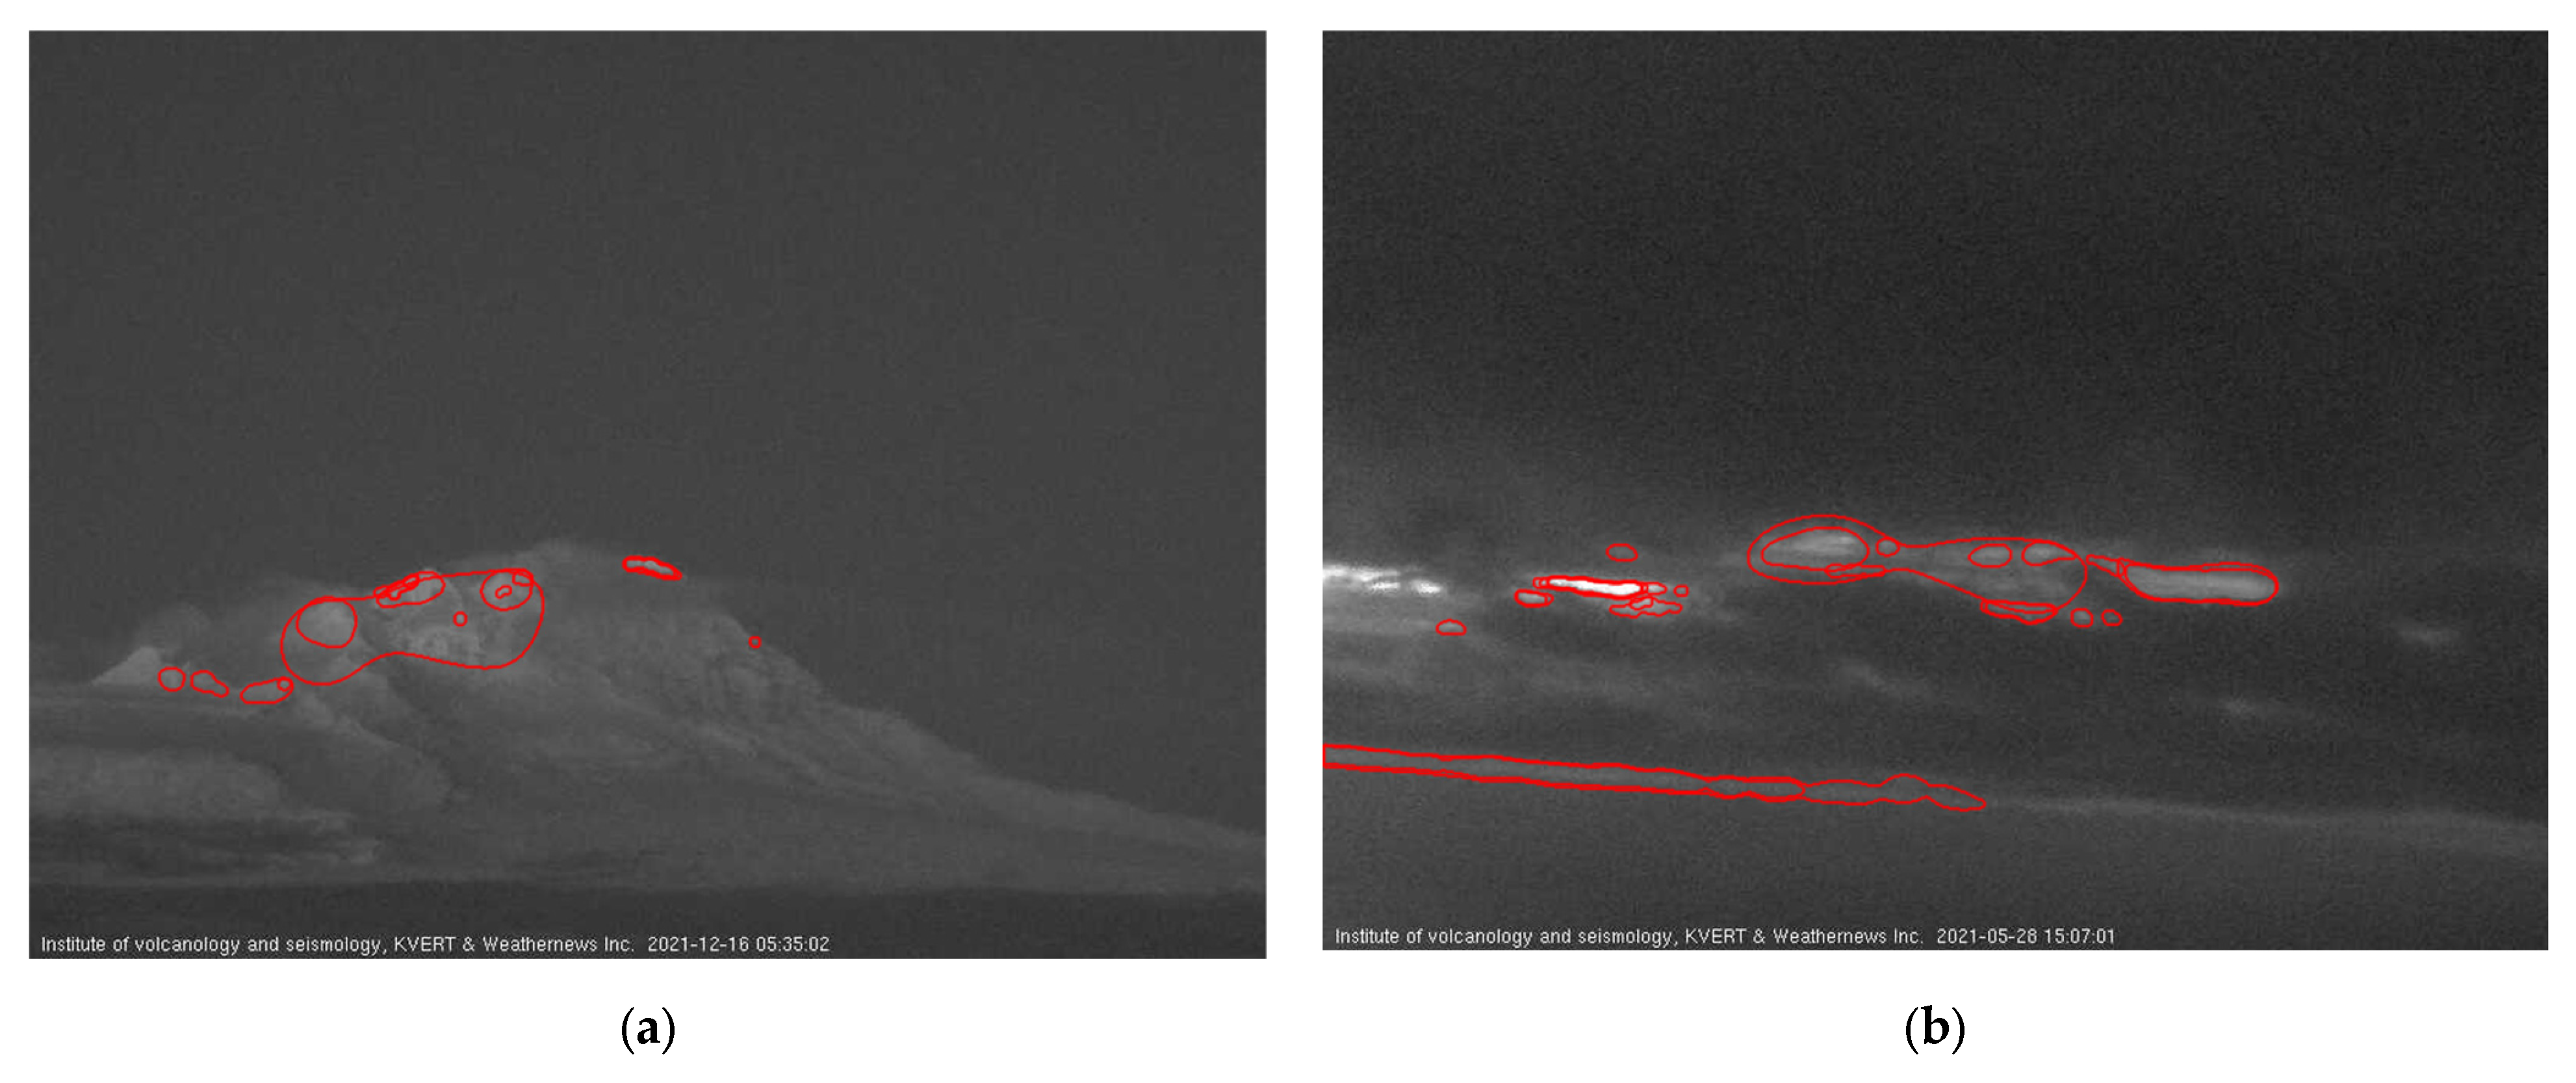
During the study and testing, it was revealed that the listed features were not enough for a successful classification of areas formed on the slopes of the volcano (Figure 5a) and for bright areas formed between clouds against the background of extraneous illumination (Figure 5b).
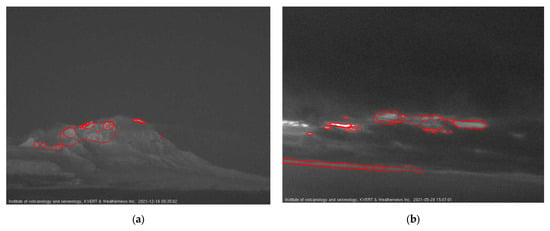
Figure 5.
Examples of bright areas (shown with red outline) erroneously identified as thermal anomalies: (a) Snow-covered areas on the slopes of the Sheveluch volcano (image at 16 December 2021/ 05:35 UTC); (b) Bright areas formed at the intersection of background light and clouds (image at 28 May 2021 15:07 UTC).
The glow on the surface of the volcano in terms of brightness intersected only with weak (in the range of values 100–151) thermal anomalies. At the same time, Figure 5a demonstrates that such zones include dark pixels. This suggests that the standard deviation from the area average for such glows may be higher than thermal anomalies. In the case of extraneous illumination, which appeared at the intersection of clouds and background illumination (Figure 5b), it can be noted that their shape was often elongated along the horizon, in contrast to thermal anomalies, which can also be elongated vertically. Considering these points, five additional parameters were proposed to classify images with anomalies of that nature correctly.
- The average brightness value in the anomaly area.
- Standard deviation from the average brightness value in the anomaly area.
- The height of the minimum rectangle, which includes the area of the k-th anomaly. This is determined as the difference between the maximum and minimum y coordinates.
- The width of the minimum rectangle, which includes the area of the k-th anomaly. This is determined as the difference between the maximum and minimum x coordinates.
- The height-to-width ratio of the minimum rectangle, including the k-th anomaly area, .
3.3. Optimization of the Classifier Model
The feature vectors extracted for each found anomaly are classified as “thermal” and “non-thermal” using the SVM model. At the same time, the feature selection, pre-processing of input data, as well as model parameter optimization affect the accuracy of this classification [15]. We used a grid search method to determine optimal hyperparameters: this set of desired parameters is sorted over a given grid, and k-block cross-validation is performed at each step. Unlike the original paper [11], a 5-block cross-validation was used instead of a 2-block one. In addition, the quality of the classification can be assessed using a weighted F1-score, which provides a reliable estimate of the results of the binary classification of the unbalanced dataset used in our study [16].
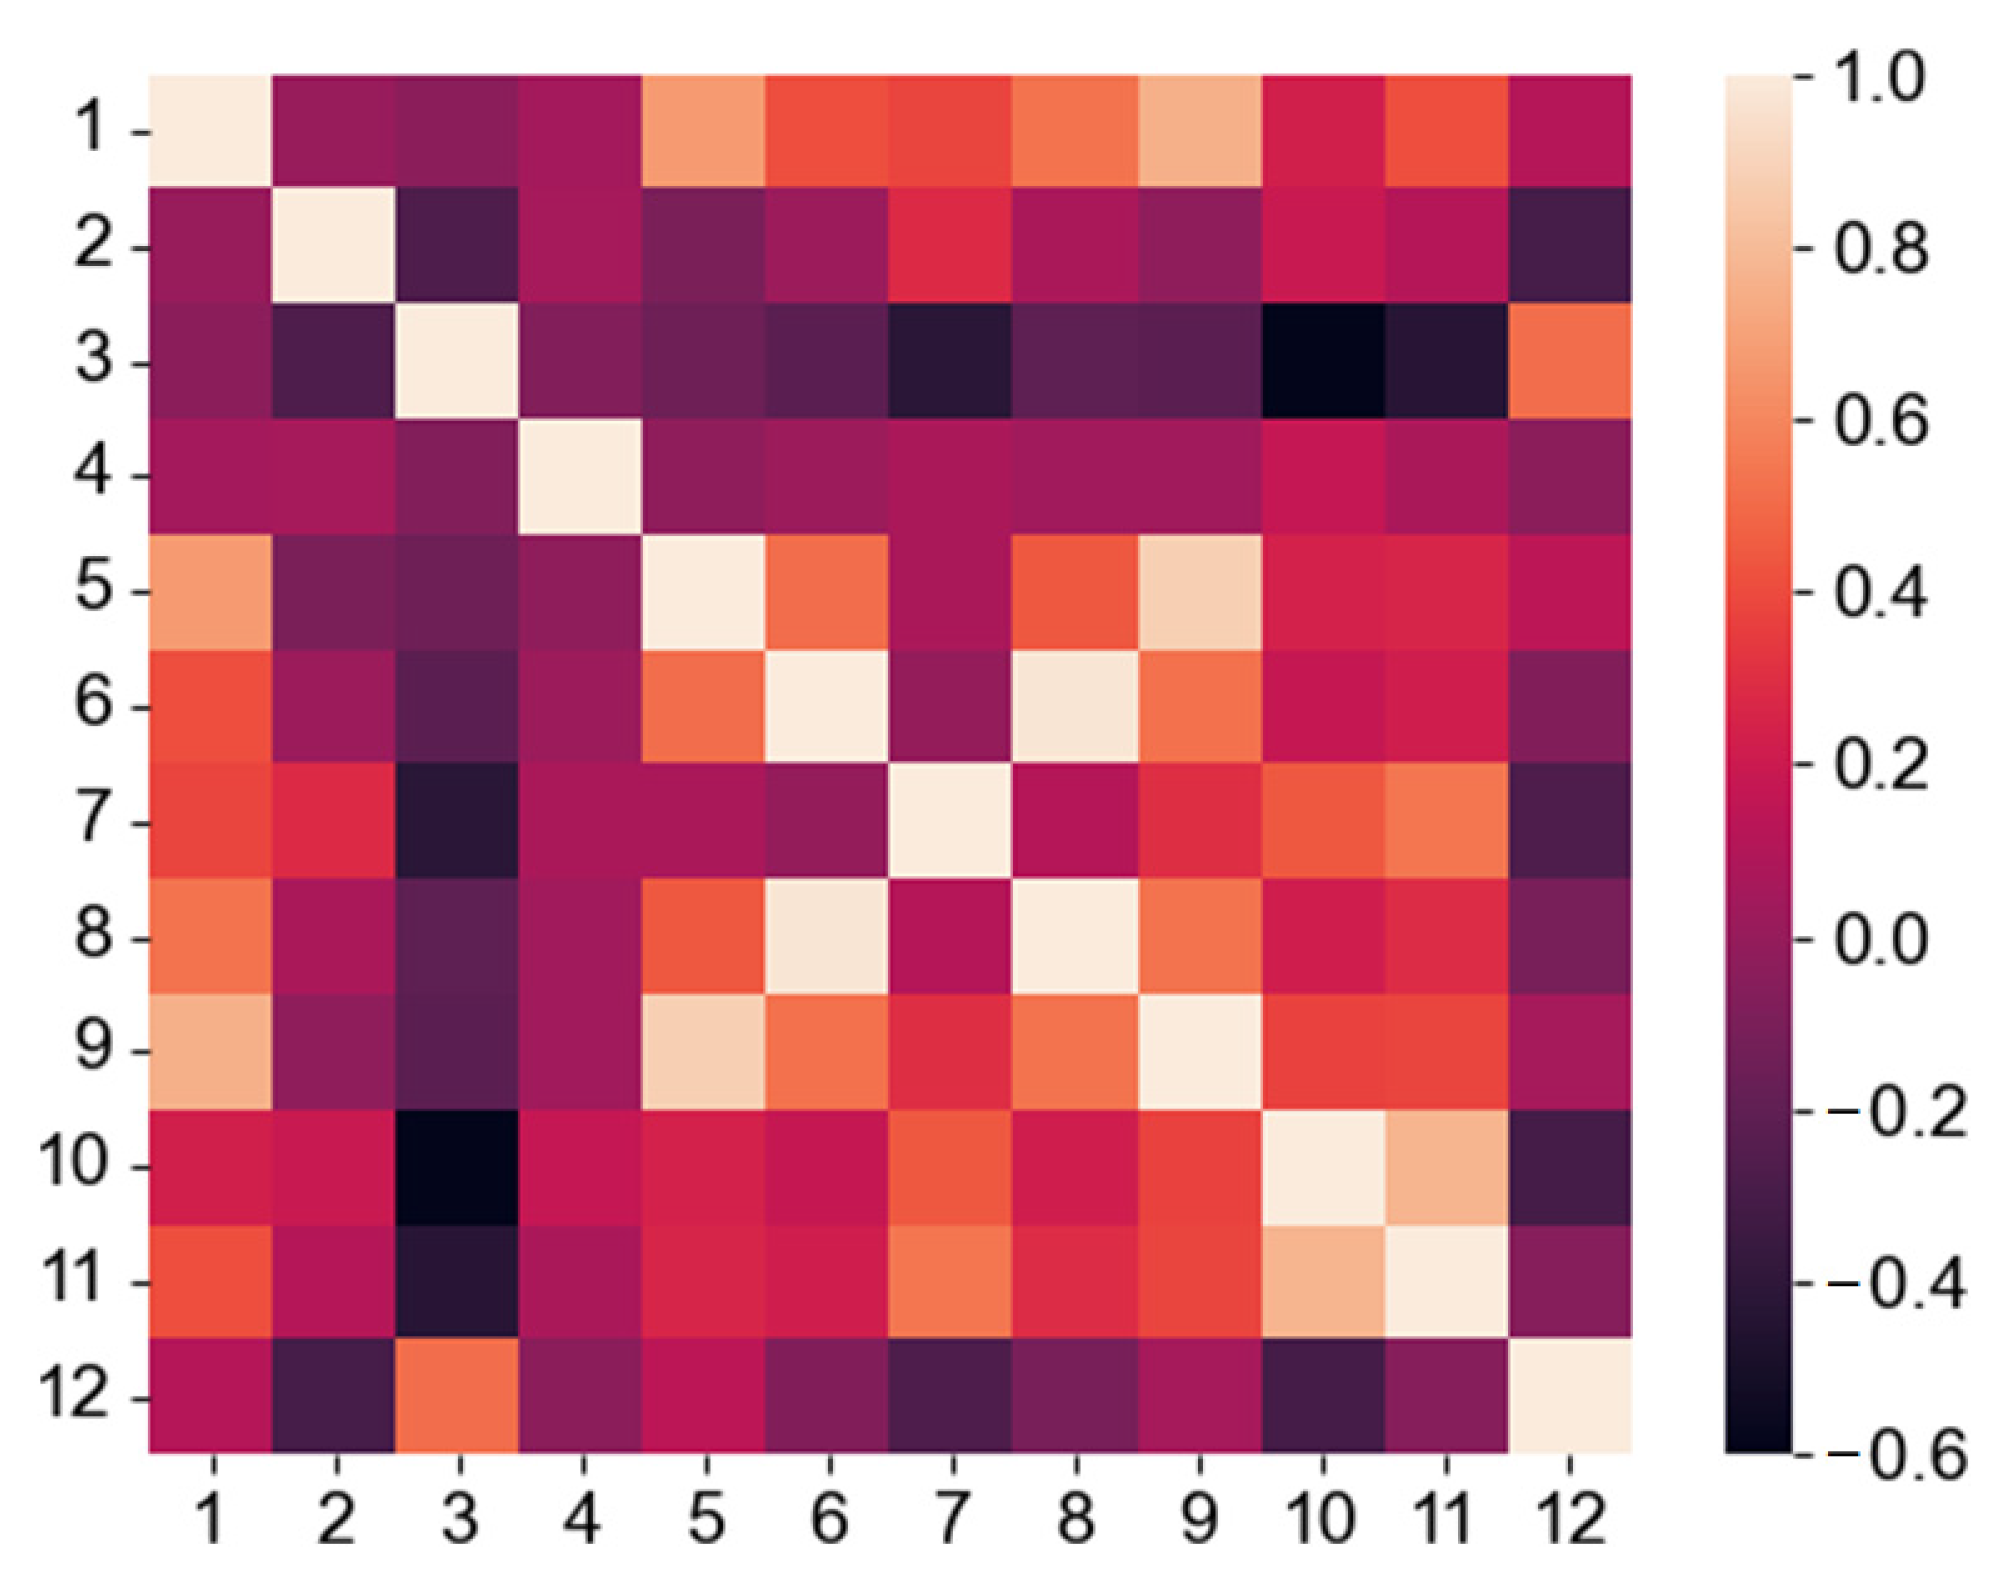
For feature selection, a matrix of Spearman’s rank correlation coefficients was previously calculated (Figure 6).
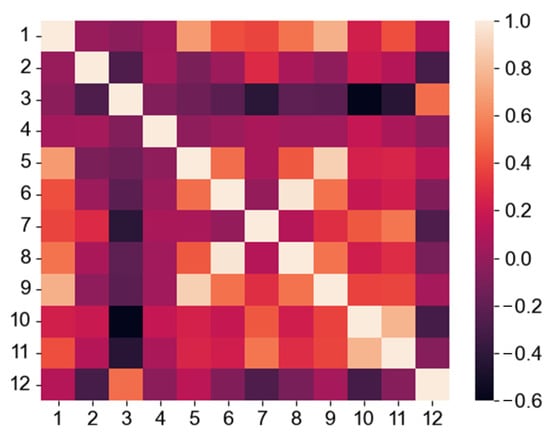
Figure 6.
Spearman’s rank correlation coefficient matrix for 12 components of the feature vector.
This matrix shows a correlation between the 12 calculated features (7 original + 5 new). We used the Chi-square method, ANOVA F-test, and the greedy algorithm for feature selection during a grid search to find which one gives the best classification quality. To minimize the impact of spikes and possible data errors on the classification quality, the feature space was normalized and transformed into a smaller subspace using the principal component analysis (PCA). The final set of tested hyperparameters is presented in Table 1.

Table 1.
The grid of settings to search optimal hyperparameters for model training.
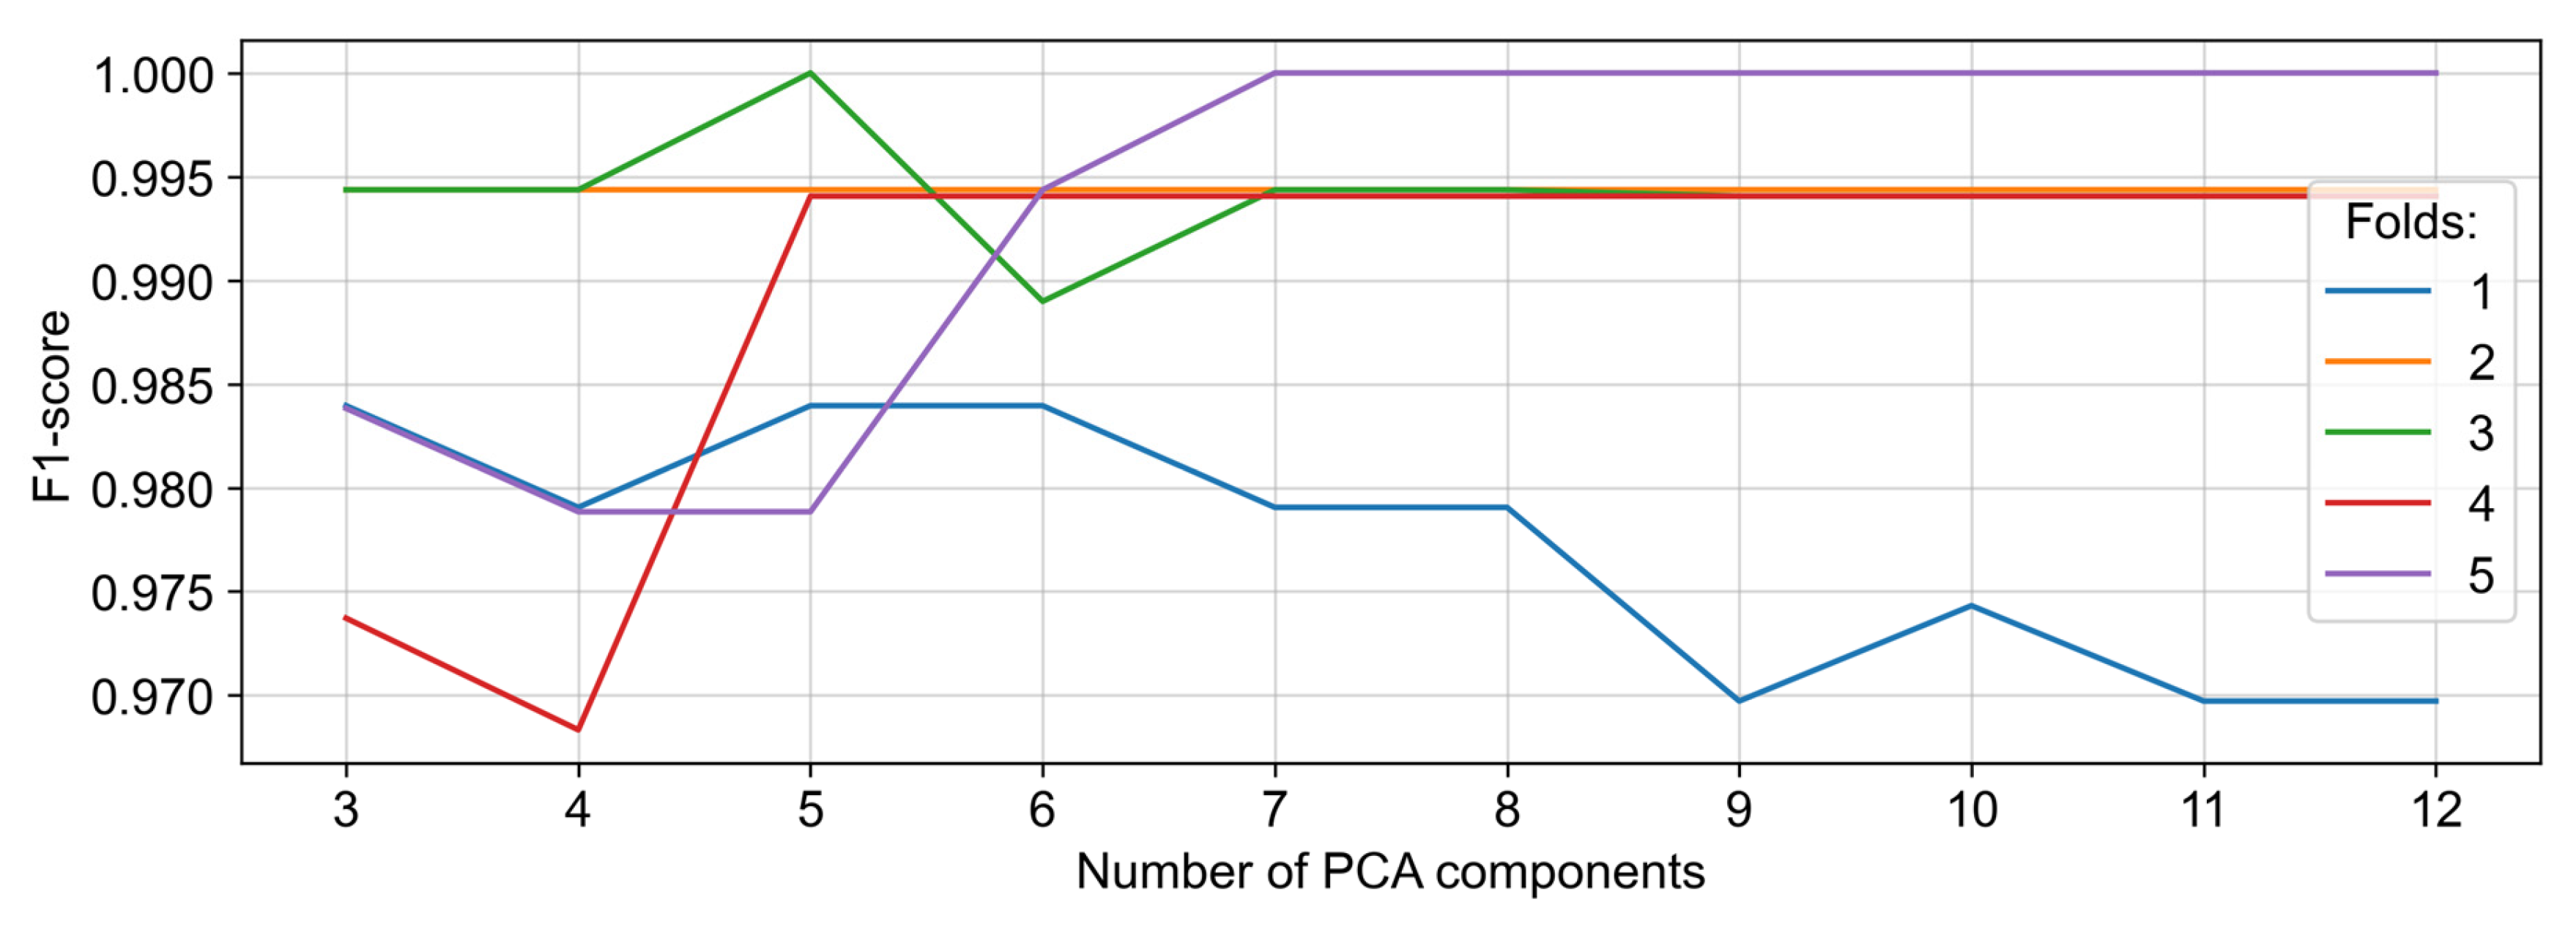
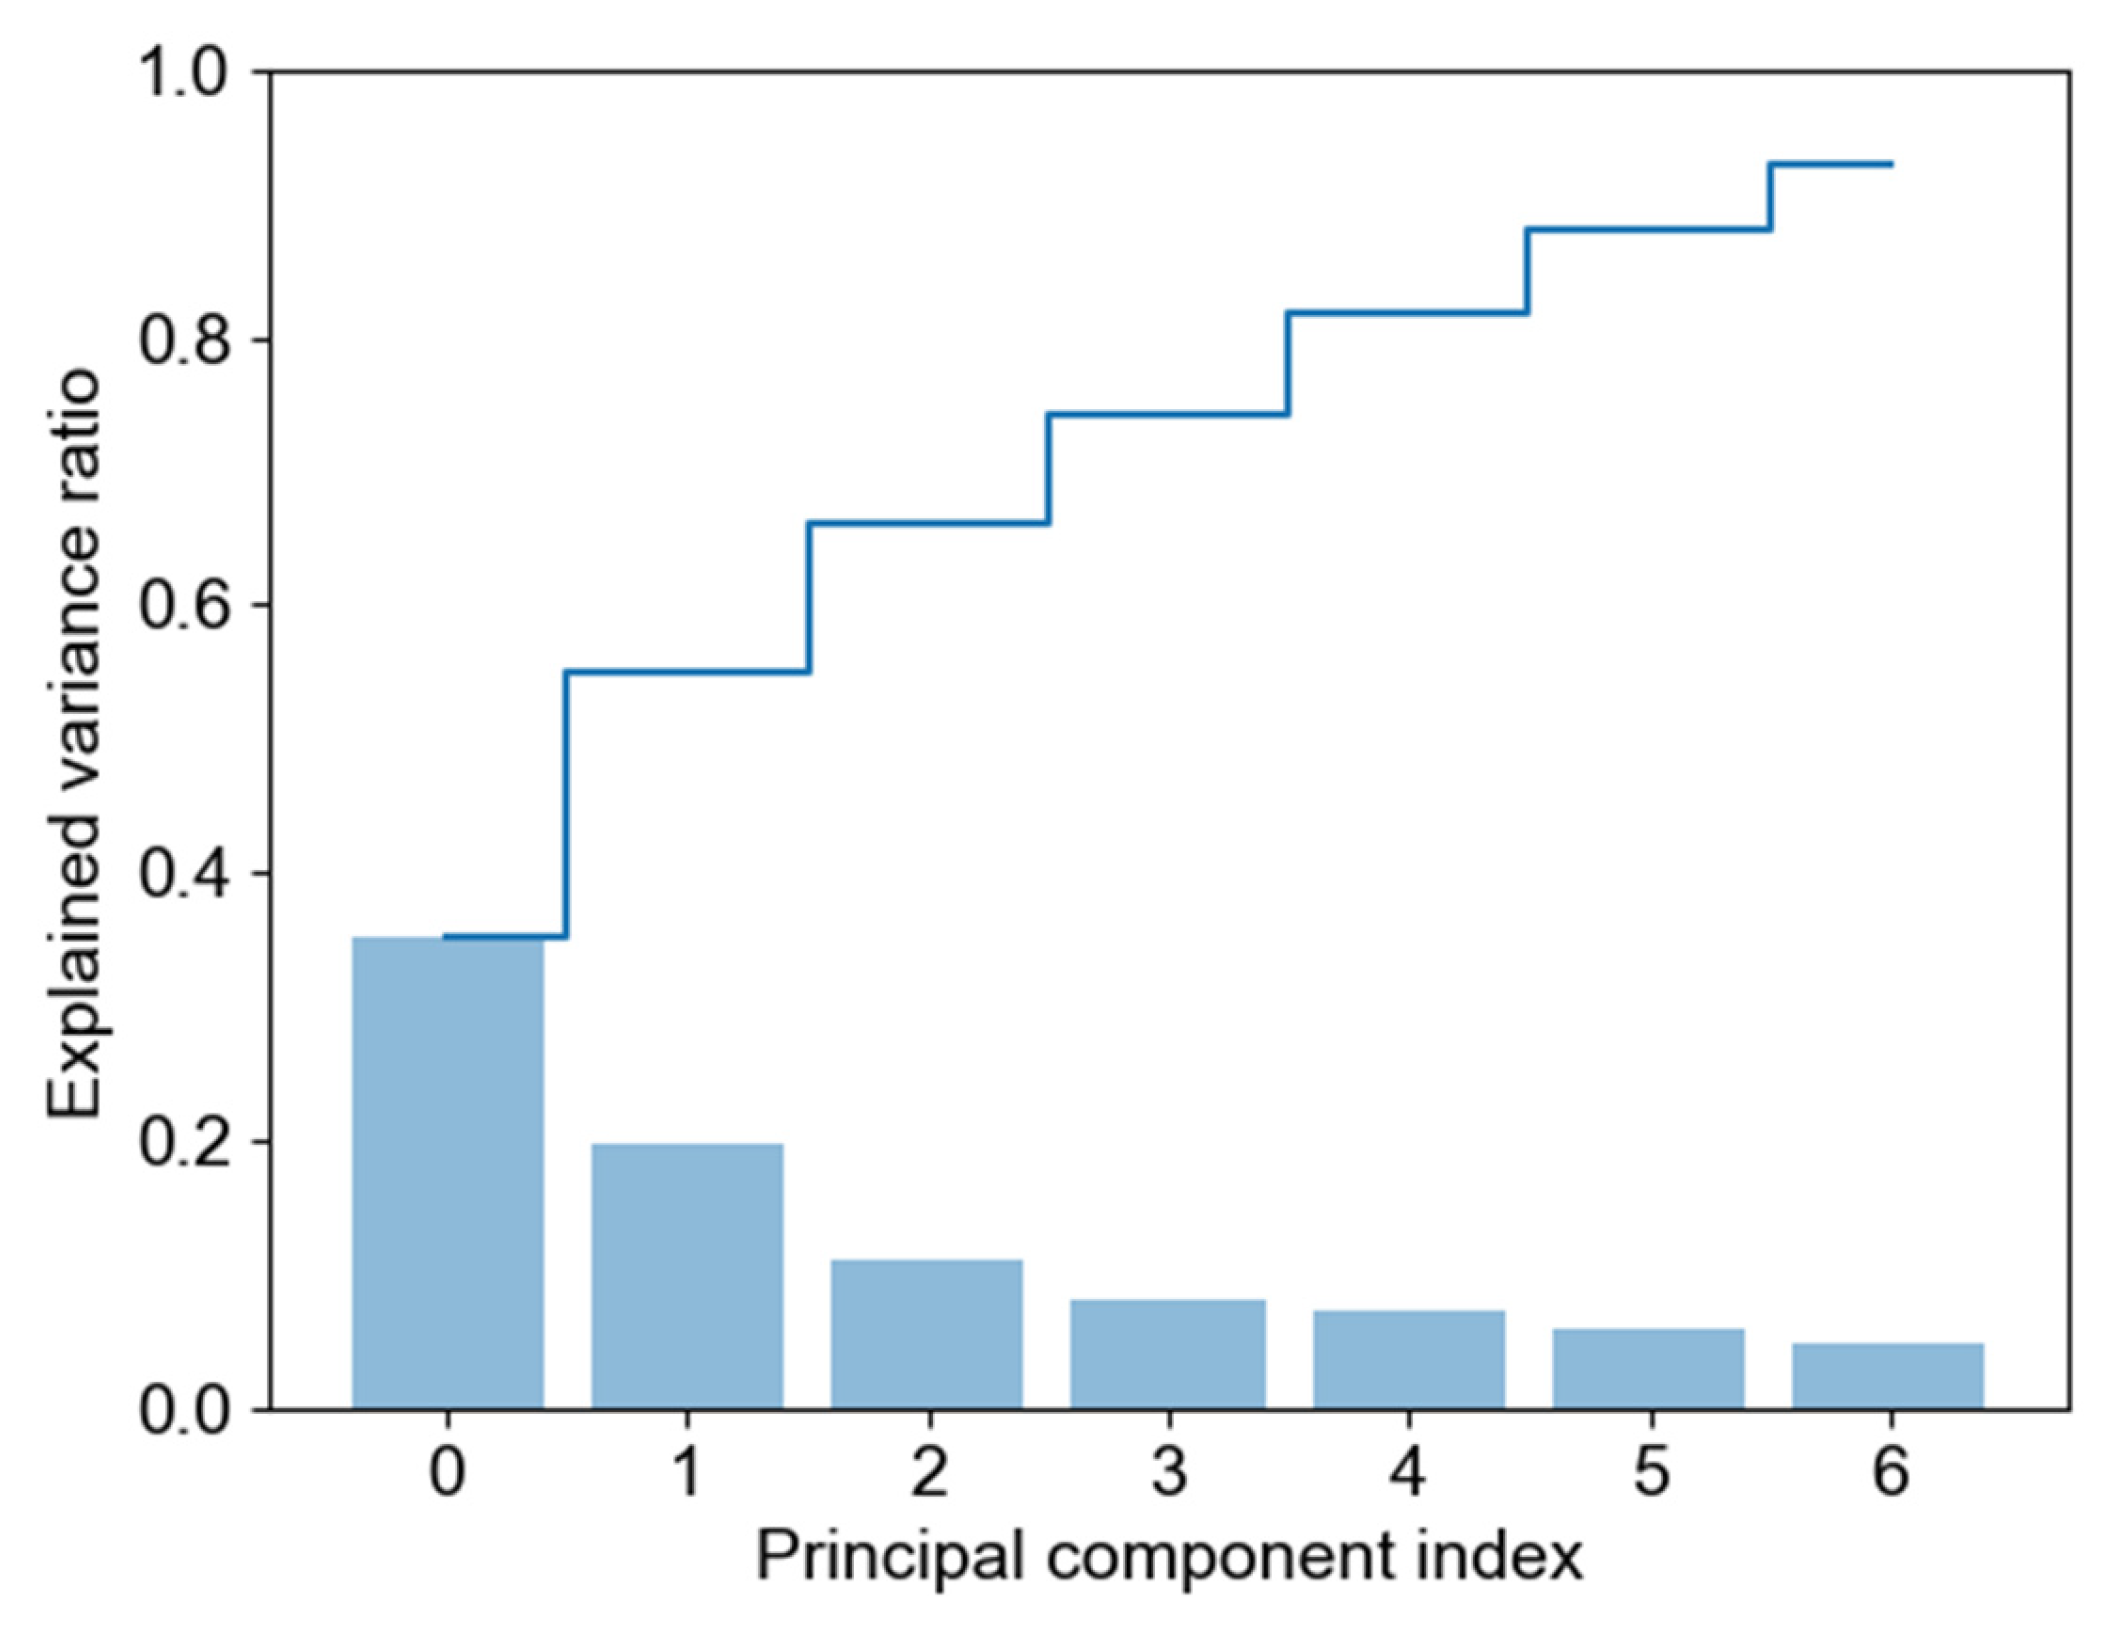
For example, the graph in Figure 7 shows how the F1-score change depends on the number of components for the PCA method at different folds of cross-validation. The best results were achieved for seven components. Figure 8 shows how much variation in a dataset could be attributed to each of these seven components.
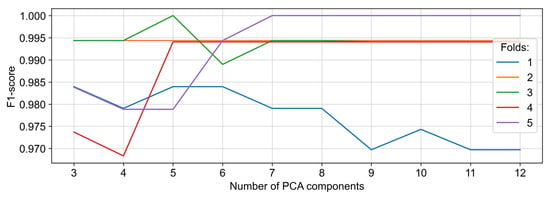
Figure 7.
The dependence of the F1-score on the number of components for the PCA method at different folds of cross-correlation.
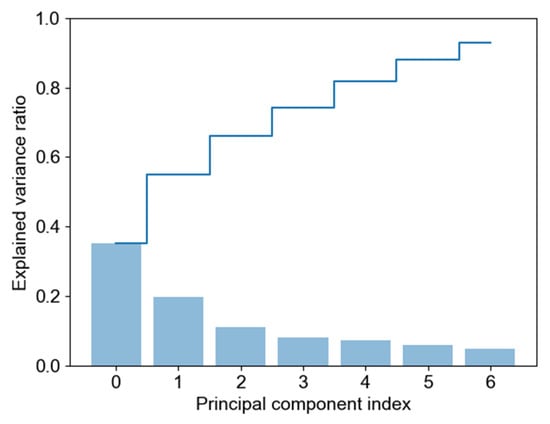
Figure 8.
Explained variance graph: individual explained variances for each eigenvector (bar chart) and the variance explained by different principal components as a function of the ratio of related eigenvalue and the sum of eigenvalues of all eigenvectors (step plot).
Table 2 contains the set of optimal hyperparameters calculated using the grid search method.

Table 2.
Optimal hyperparameters calculated using the grid search method.
Using these hyperparameters and the corresponding dataset, the SVM model training was carried out.
3.4. Model Testing
The improvements described above resulted in a modified algorithm for searching and classification of thermal anomalies, which had the following stages (in their updated form).
- Search for bright anomalies in the image.
- Calculate a vector of 12 features for each anomaly.
- Feature normalization.
- Reduce the feature space using PCA.
- The vector obtained by PCA is classified using the trained SVM model, whether the brightness anomaly corresponding to this vector is “thermal” or “non-thermal”.
Classification quality was assessed on the test dataset the using F1-score, and the corresponding statistics are presented in Table 3.

Table 3.
The results of classification using the improved algorithm.
It was checked if a new approach of classifying thermal anomalies using an extended feature set and PCA performs better than the original method [11]. For this model, a grid search was carried out on the new training set to find the optimal SVM parameters, and the following values were obtained: C = 1, gamma = ‘scale’, kernel type–polynomial function, kernel degree–2. After training the old model, the test dataset was classified, and the statistics of the results are presented in Table 4.

Table 4.
The results of classification using the origin algorithm.
4. Discussion
An improved anomaly segmentation algorithm and an optimized model, including an extended set of features and their pre-processing using PCA, reduced the number of classification errors. Graphs in Figure 9 show the number of classification errors in test the image dataset for the new and old classification models.

Figure 9.
Distribution of erroneously classified anomalies in 2021 using the optimized model and an old model from [11].
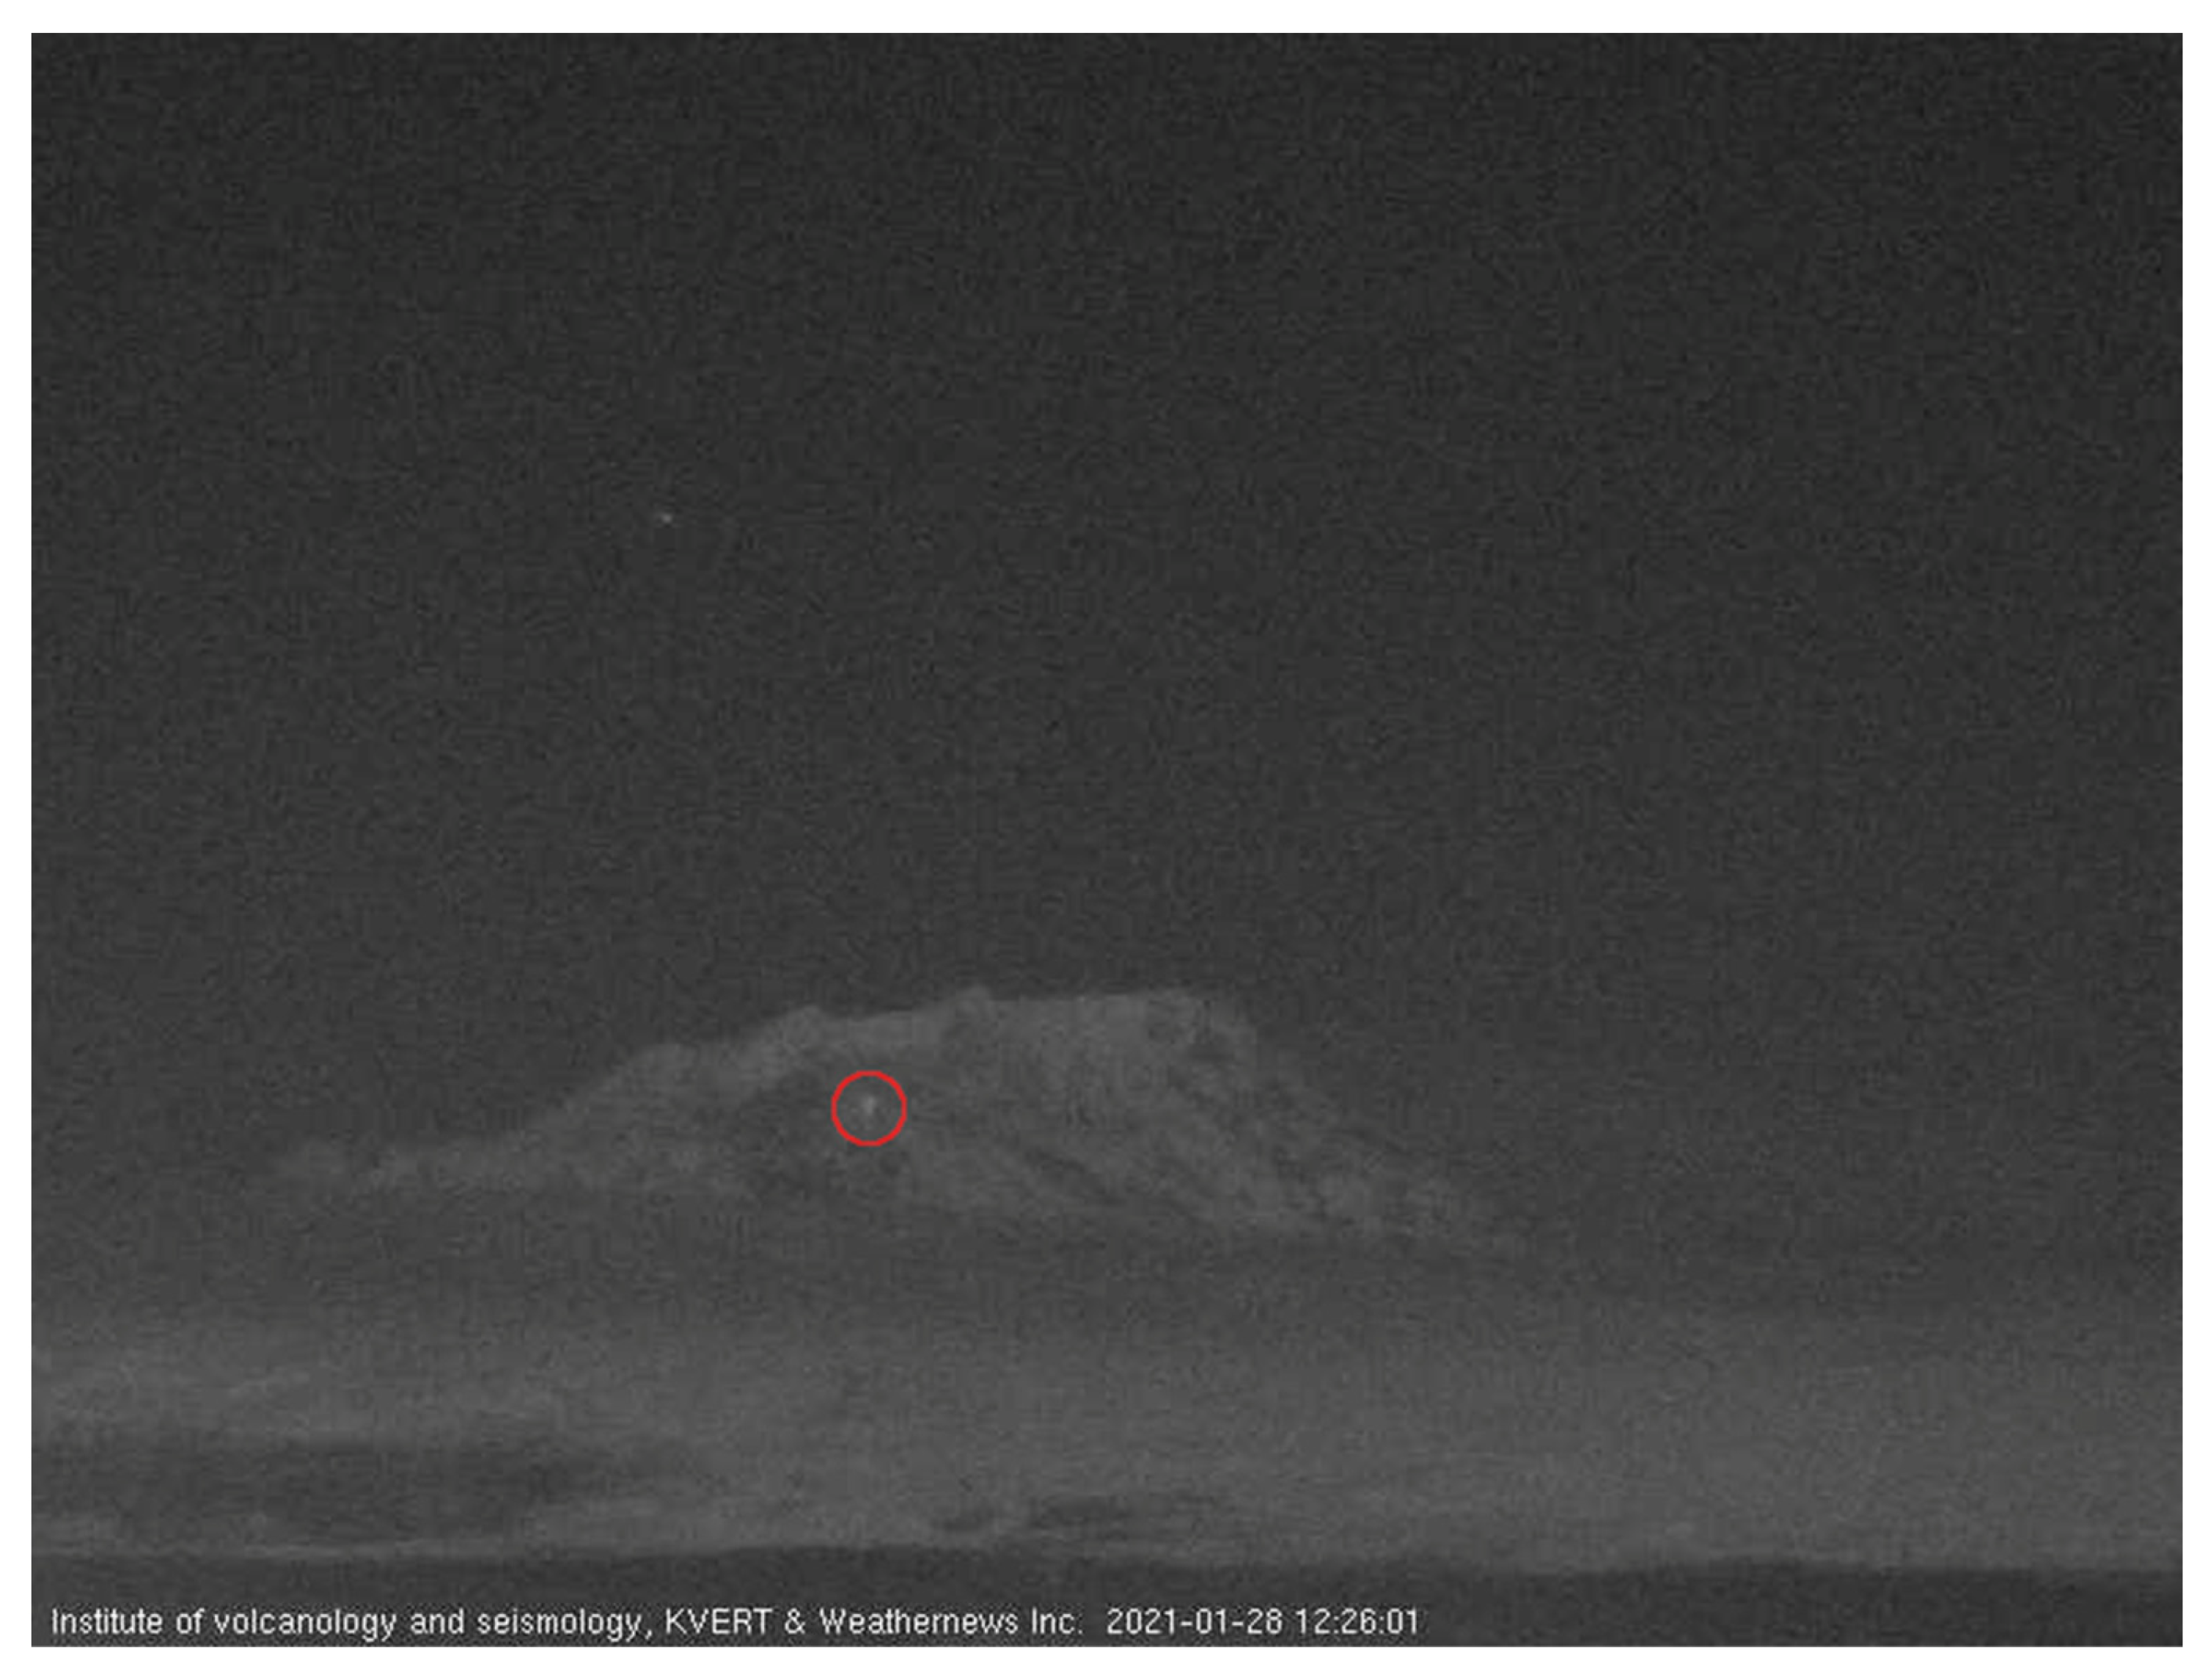
Errors prevailed in the winter–spring period, due to the light snow-covered slopes of the volcano, in our opinion. In the summertime, errors were sporadic. Compared to the original version of the algorithm, the number of thermal anomalies found increased significantly. At the same time, some small areas of low brightness in the region of the lava dome were sometimes classified incorrectly by the model. For example, in Figure 10, there is an anomaly associated with the growth of the lava dome, while the model does not classify it as thermal. To correctly identify an anomaly of that kind, it is necessary to analyze several frames, which can allow the dynamics of the anomaly’s size and brightness to be tracked.
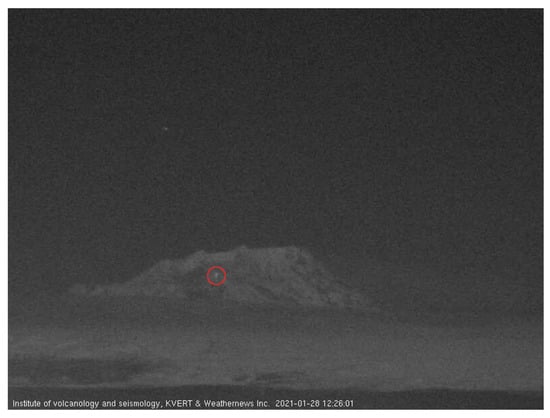
Figure 10.
An area of increased brightness (circled in red) erroneously classified as “non-thermal” (image of the Sheveluch volcano at 28 January 2021 12:26 UTC).
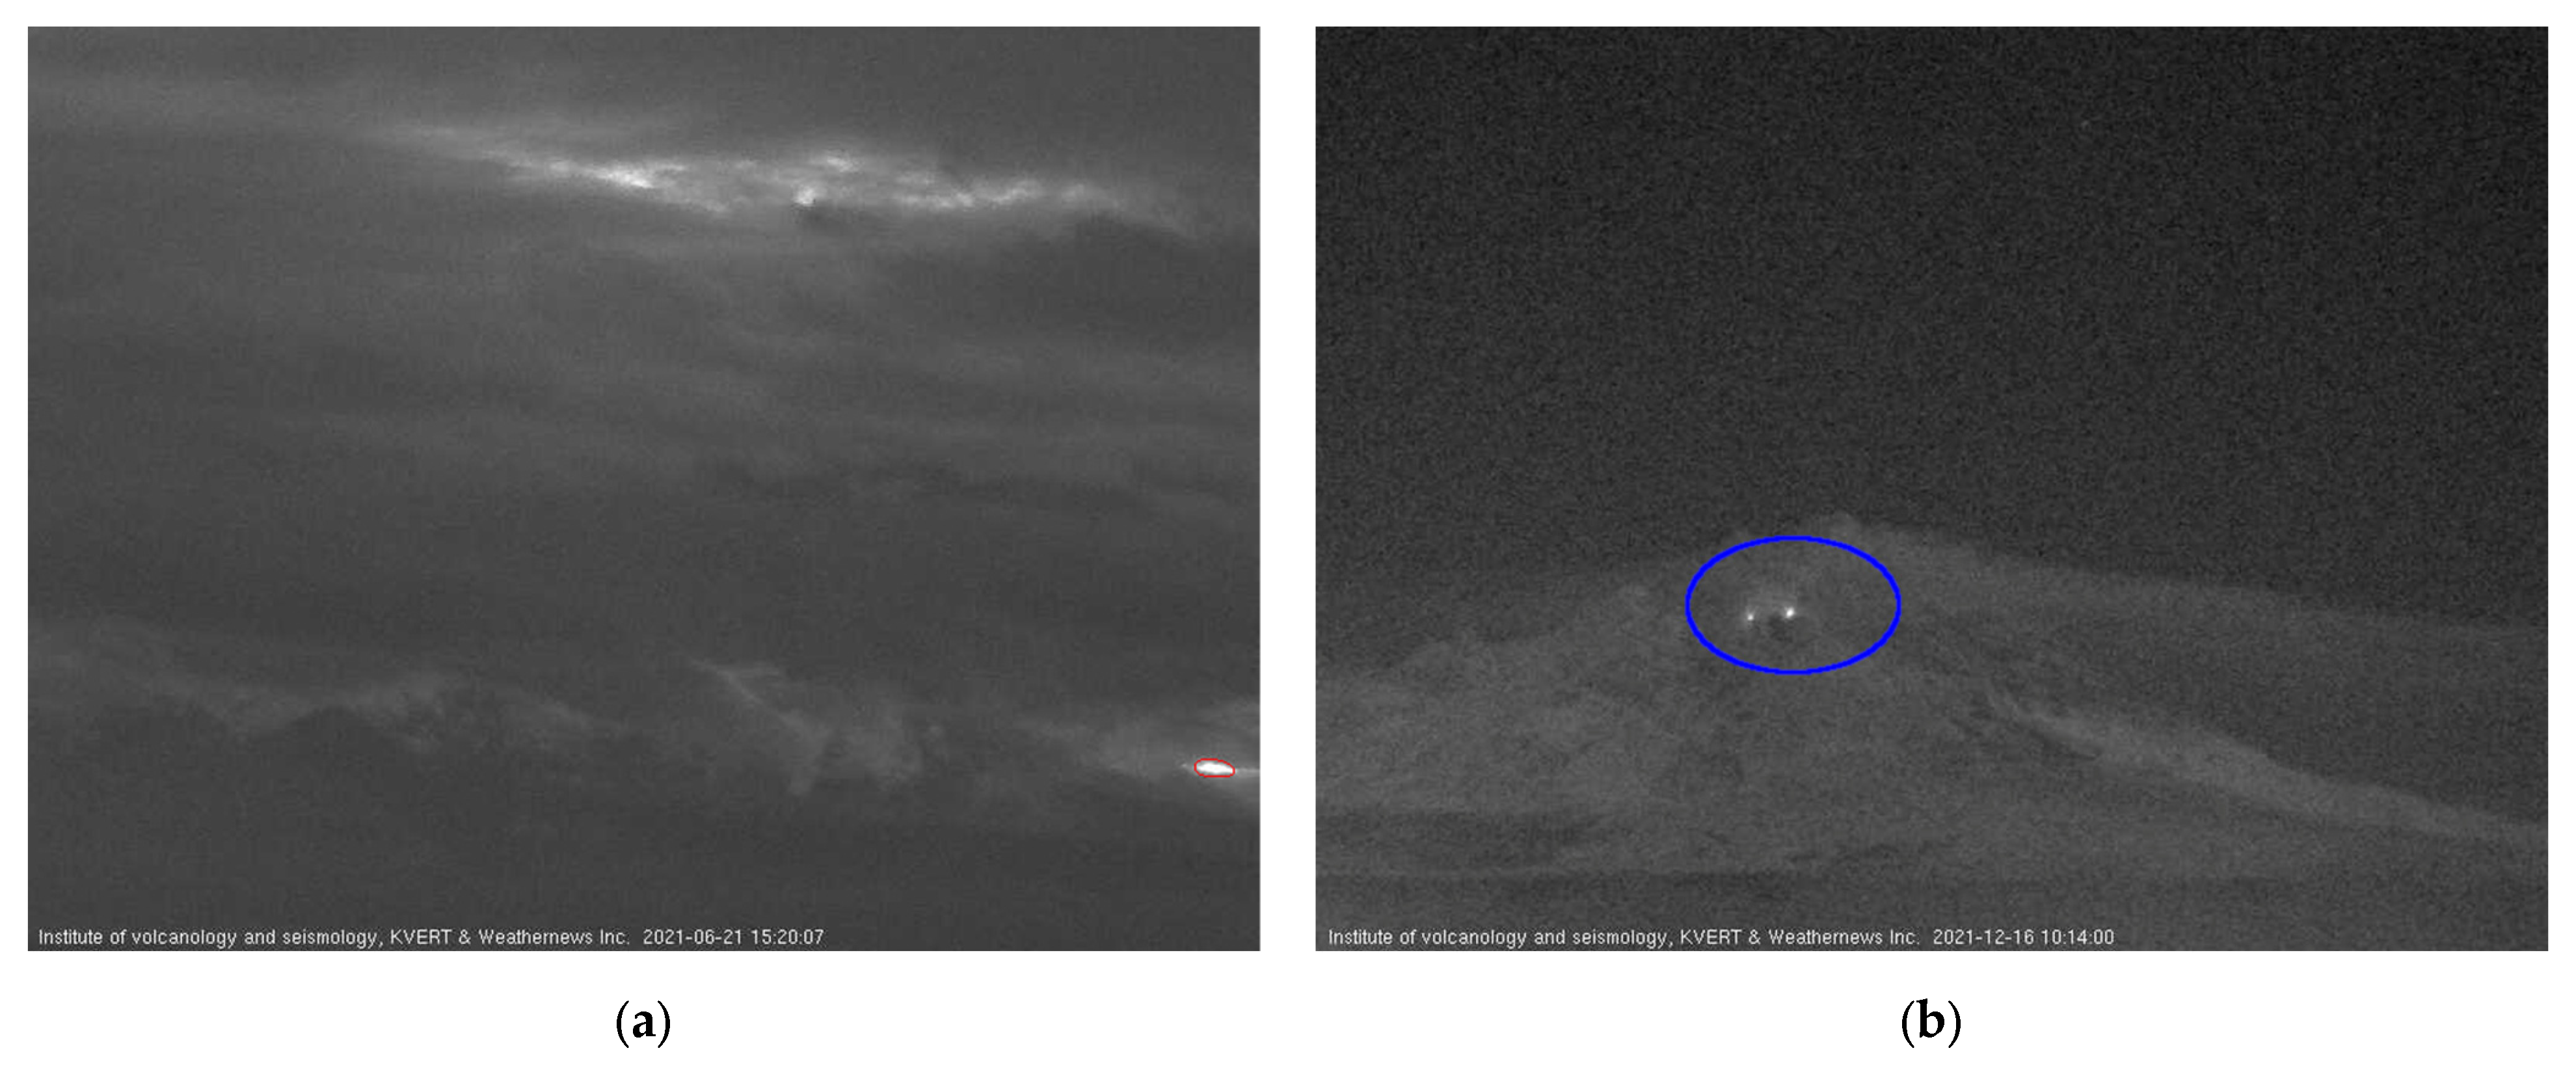
At the same time, it was also not possible to completely exclude cases when areas of increased brightness formed against the background of morning/evening illumination and were erroneously classified as thermal anomalies, for example, in Figure 11a. The solution in these cases may be to create an image mask corresponding to the area of interest (Figure 11b) and to exclude all anomalies that do not fall within its boundaries.
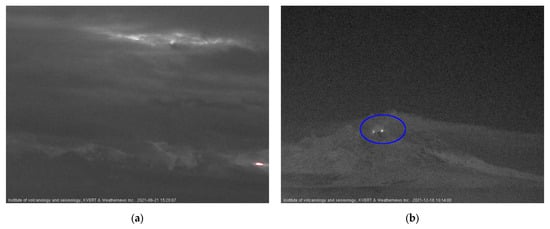
Figure 11.
Possible use of a zone of interest for the Sheveluch volcano: (a) Erroneously detected thermal anomaly; (b) An example of the contours of the mask (blue oval), which determines the location of the possible occurrence of a thermal anomaly.
In this work, we did not use a mask for the following reasons:
- The construction of a mask for the Sheveluch volcano is difficult because its lava dome is constantly active and growing. Explosions, as well as extrusions of new lava blocks, can occur anywhere in the dome.
- If the shape of the mask boundaries is simple (circle, oval, rectangle, etc.), then it either captures a part of the background or is completely within the visible boundaries of the volcano. As a result, the possible thermal anomaly area may exceed its boundaries.
- If the shape of the mask borders is complex (for example, repeating part of the visible contours of a volcano), then it can be difficult to update it in case of a change in scale or direction of the camera view.
The trained model may show a lower classification accuracy if used to classify images from other cameras. This is due to a different level of noise in the image and different scale settings, which can lead to the incorrect interpretation of features calculated for bright areas and segmented using the Gaussian pyramid.
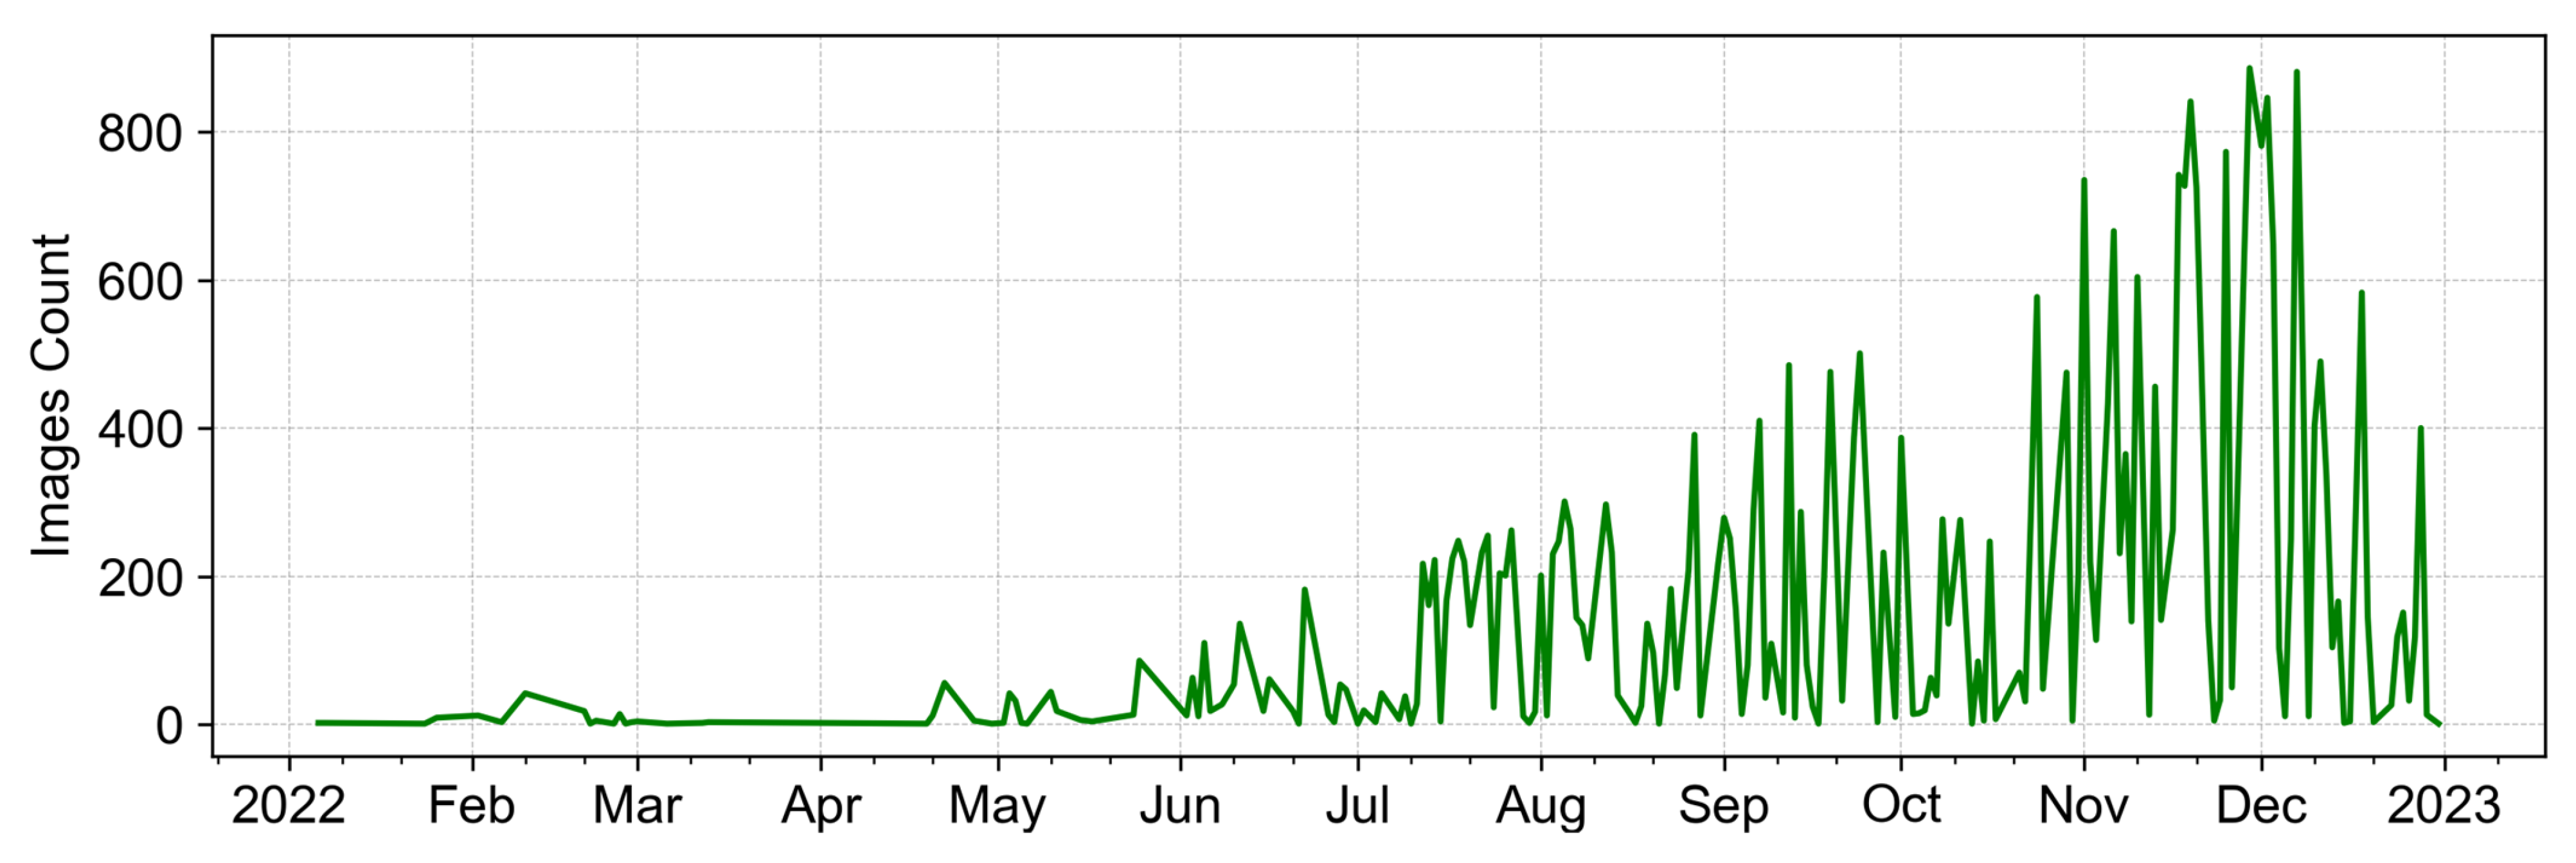
The final goal of anomaly segmentation and classification is to monitor volcano thermal activity by analyzing anomaly size and brightness time series. We applied the classifier to locate the thermal anomaly on images of the Sheveluch volcano in 2022. Out of 219,765 images in 2022, 32,555 images recorded a thermal anomaly. Their distribution during 2022 is presented in Figure 12.
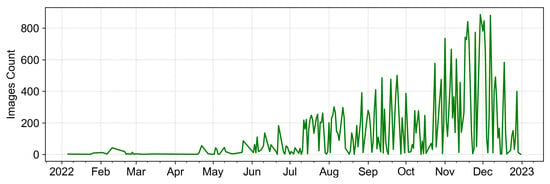
Figure 12.
The number of images during 2022 which recorded the thermal anomaly of the Sheveluch volcano.
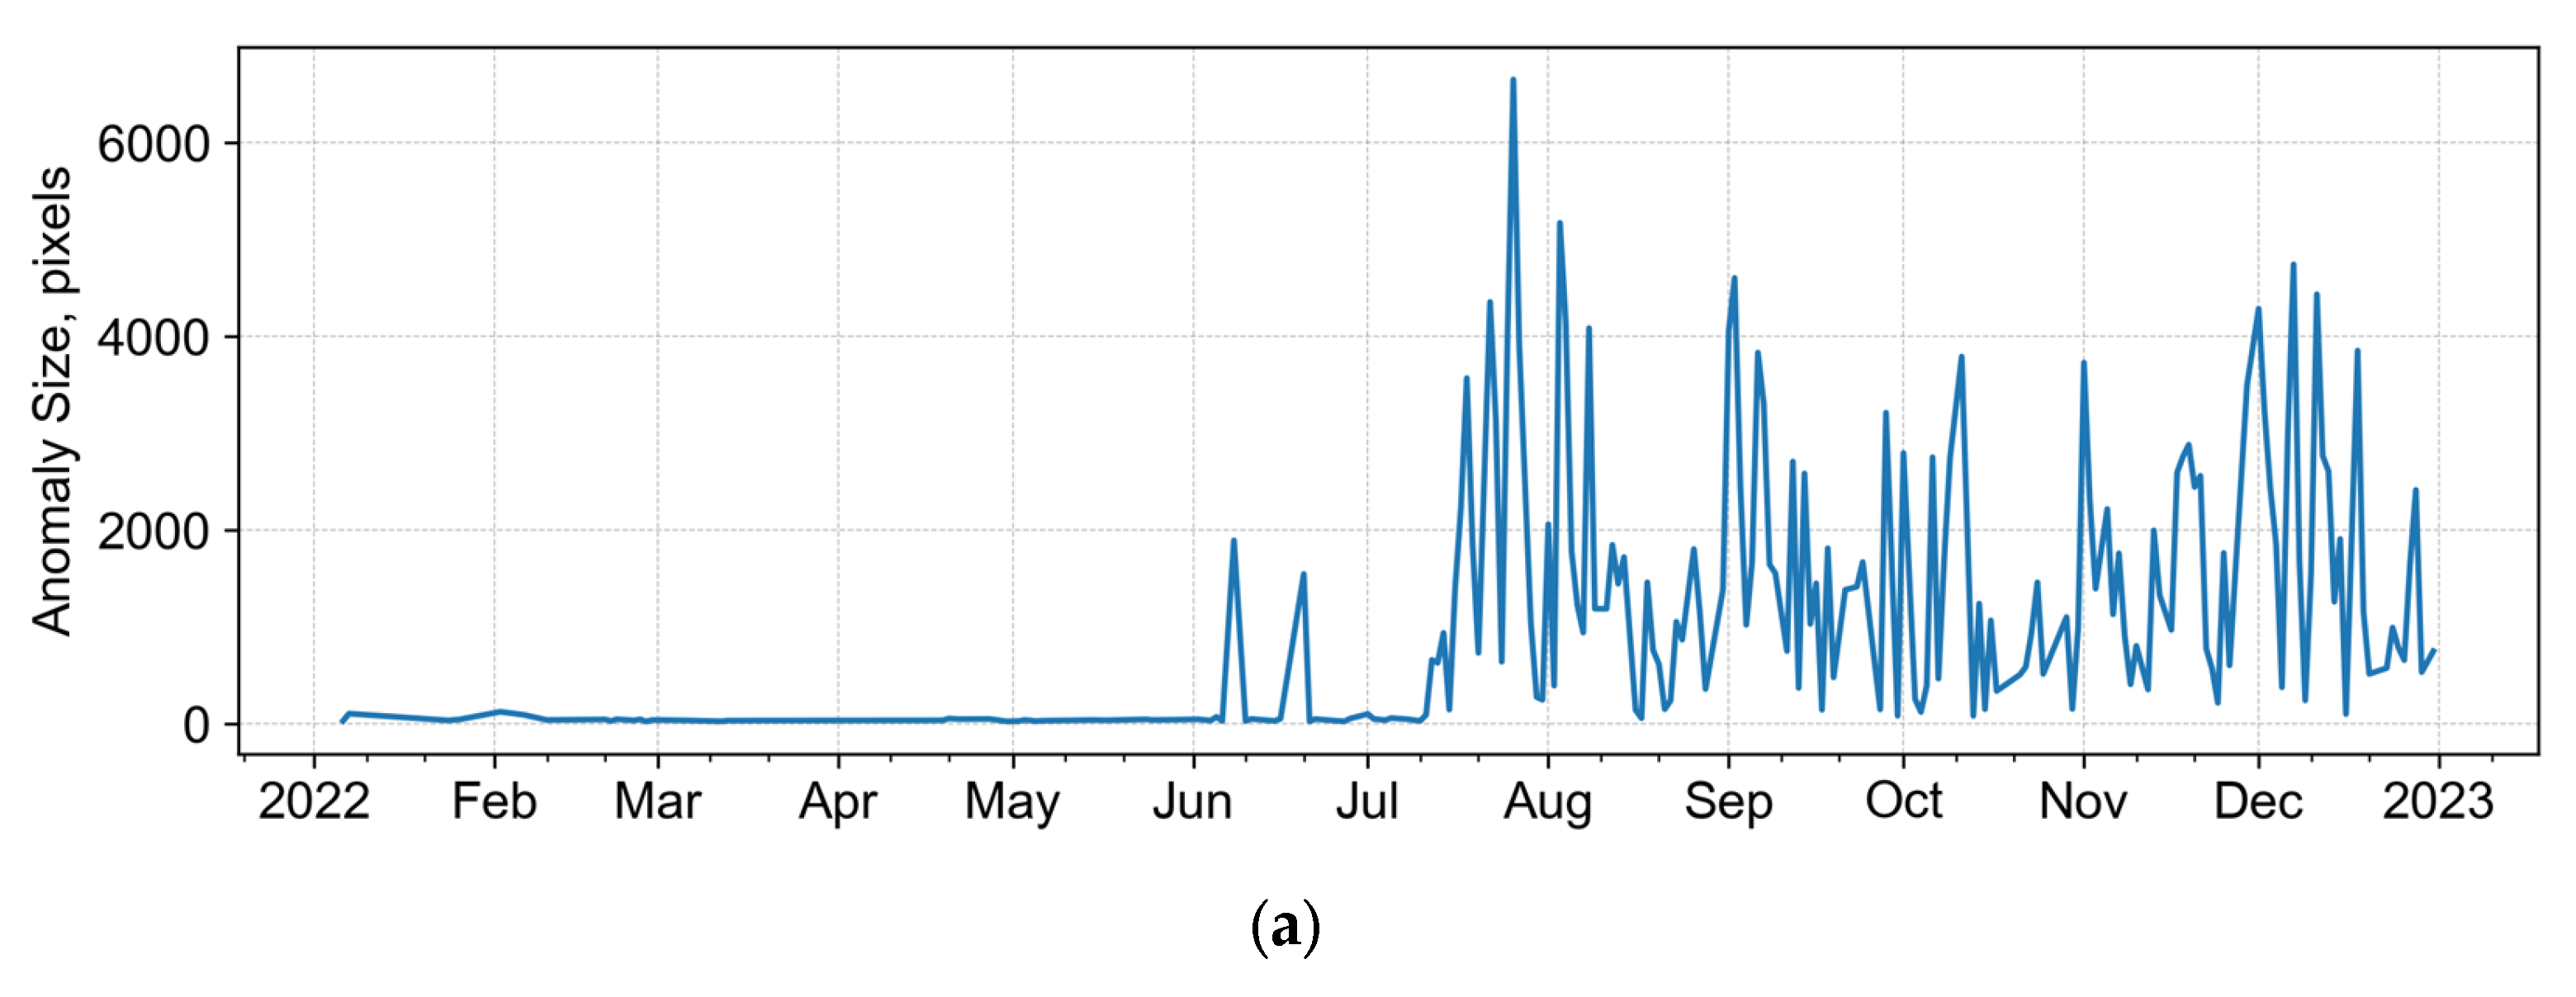
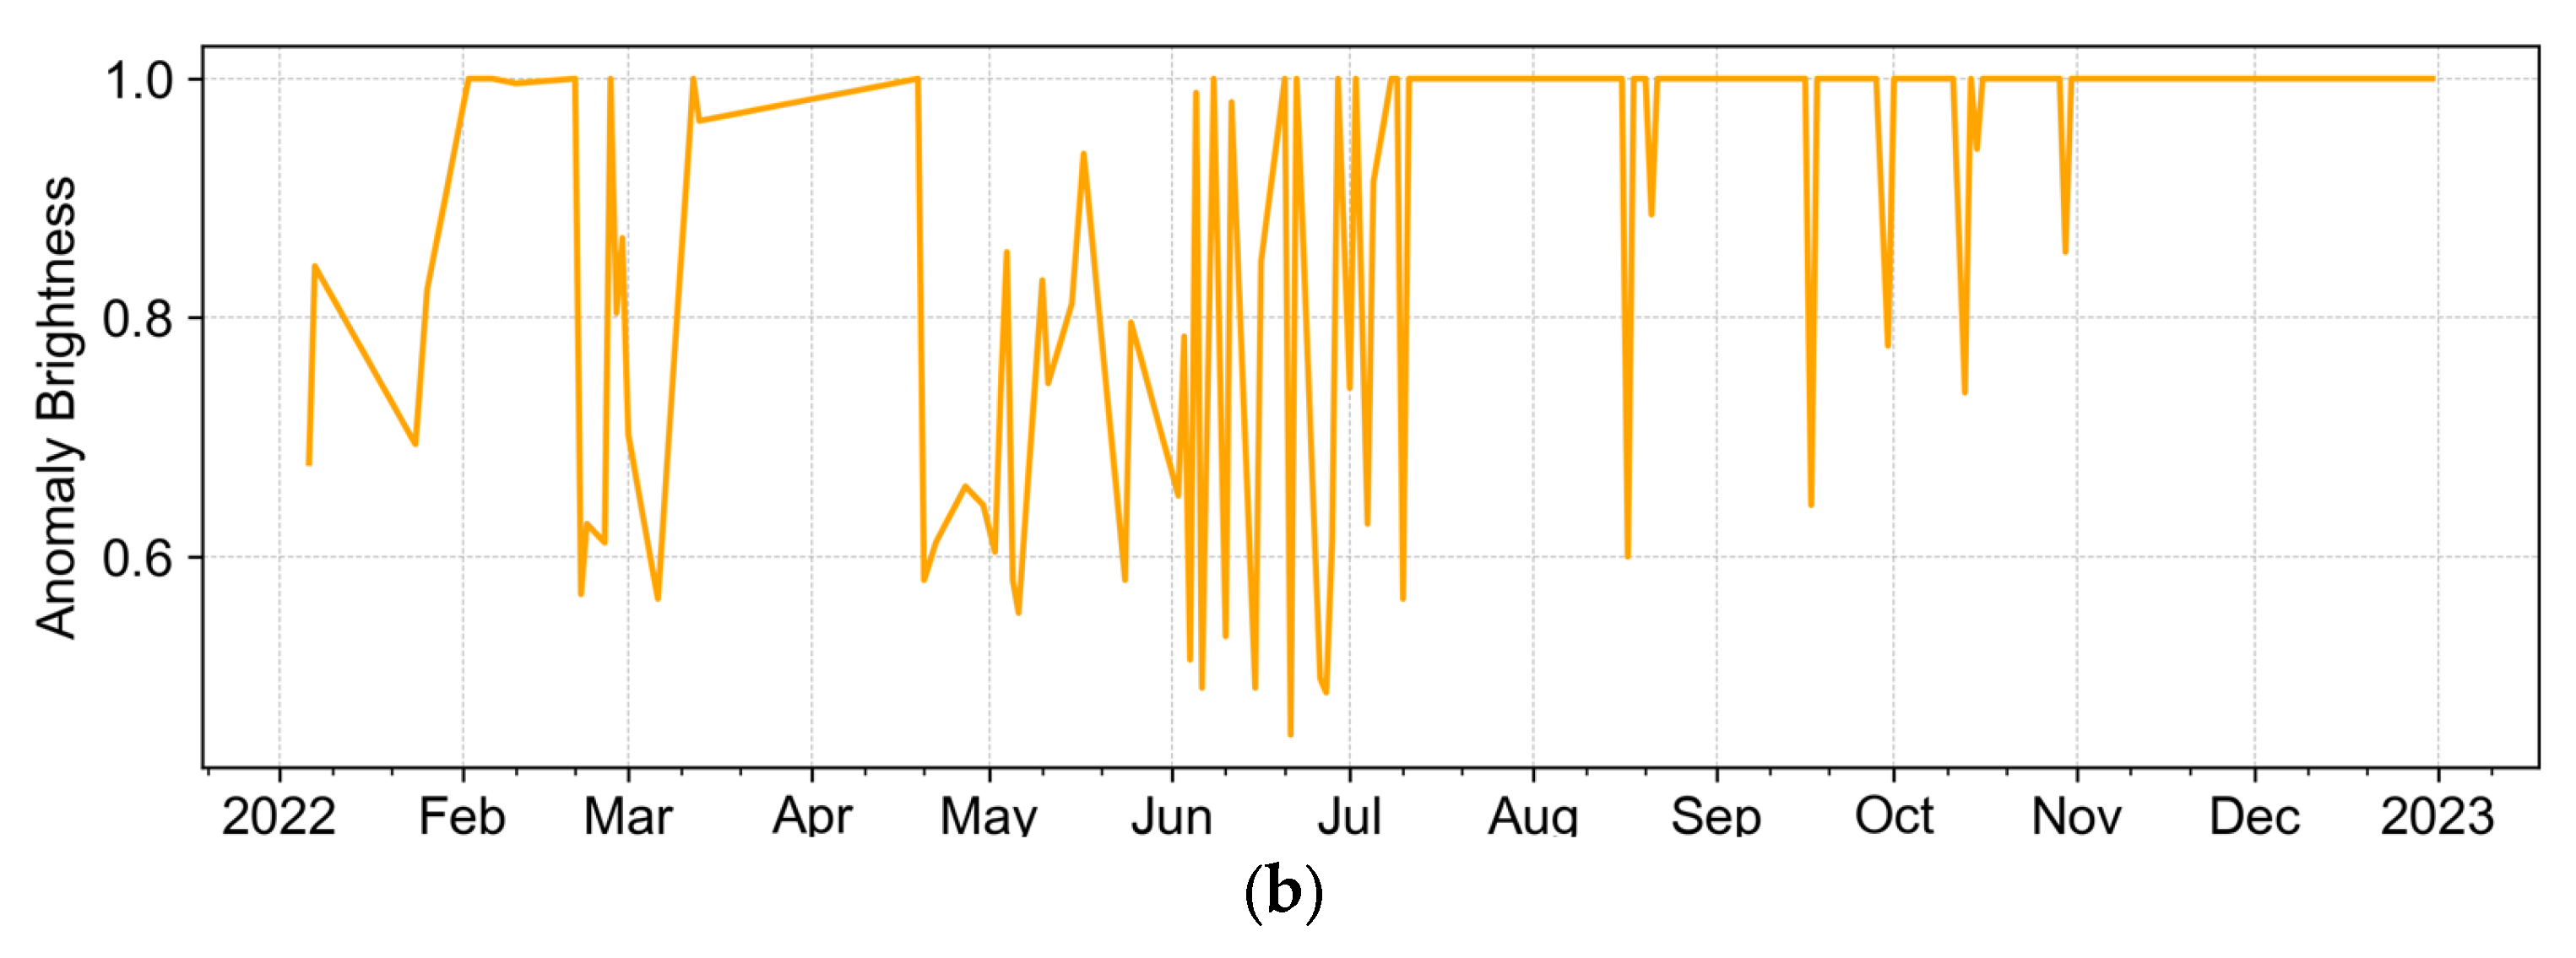
For each anomaly found in the images, its size in pixels and the maximum pixel intensity in the range [0,1] were calculated. Figure 13 shows values of the maximum size and maximum intensity of the thermal anomaly in 2022, aggregated by day.
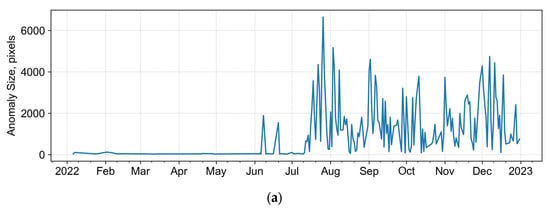
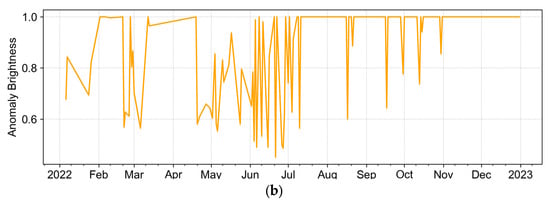
Figure 13.
Changes in the characteristics of the thermal anomaly of the Sheveluch volcano in 2022 according to video data: (a) Maximum daily size; (b) Maximum daily brightness (grayscale intensity).
In 2022, the volcano was generally quiet from January to June, and a sporadic small anomaly of 20–50 pixels in size was detected during the growth of the lava dome (Figure 14). It is practically not visible on the graph (Figure 13a) because of scaling (maximum size value during the year is above 6000 pixels). At the same time, the intensity of that small anomaly was high (Figure 13b). There were relatively few anomalies of this size from January to June, so the brightness graph looks “broken” for this period. Another reason for this was an almost constant cloudiness during this period, completely covering the area of the anomaly.
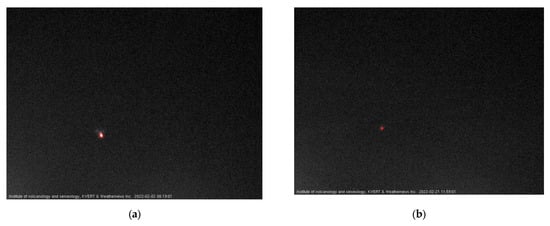
Figure 14.
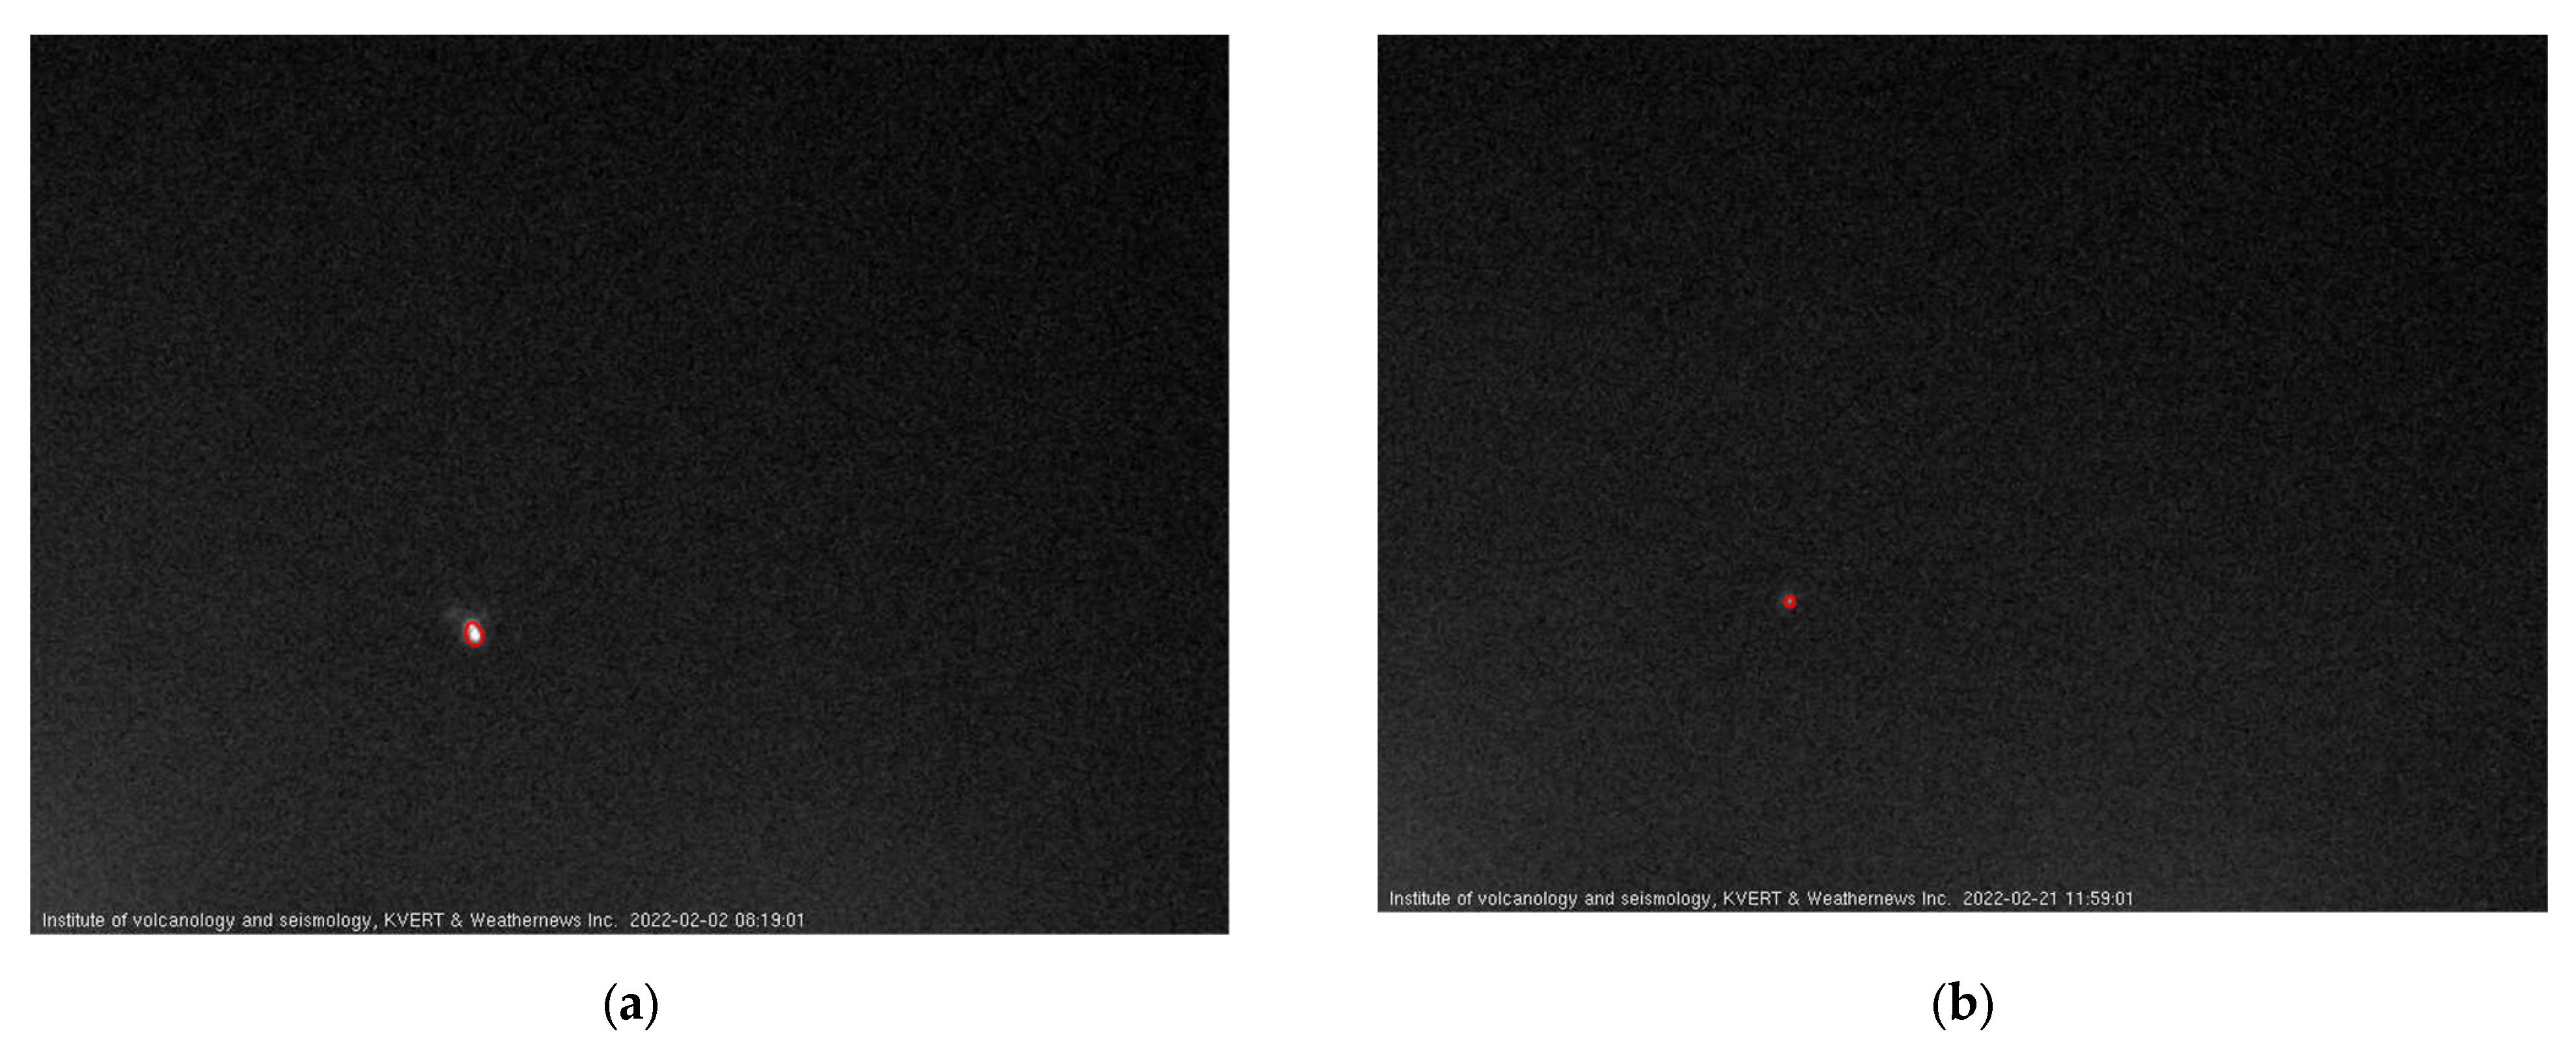
Small thermal anomaly with different levels of brightness in the area of the lava dome of the Sheveluch volcano in 2022: (a) On 2 February, size—111 pixels, brightness—1.0; (b) On 21 February, size—27 pixels, brightness—0.57.
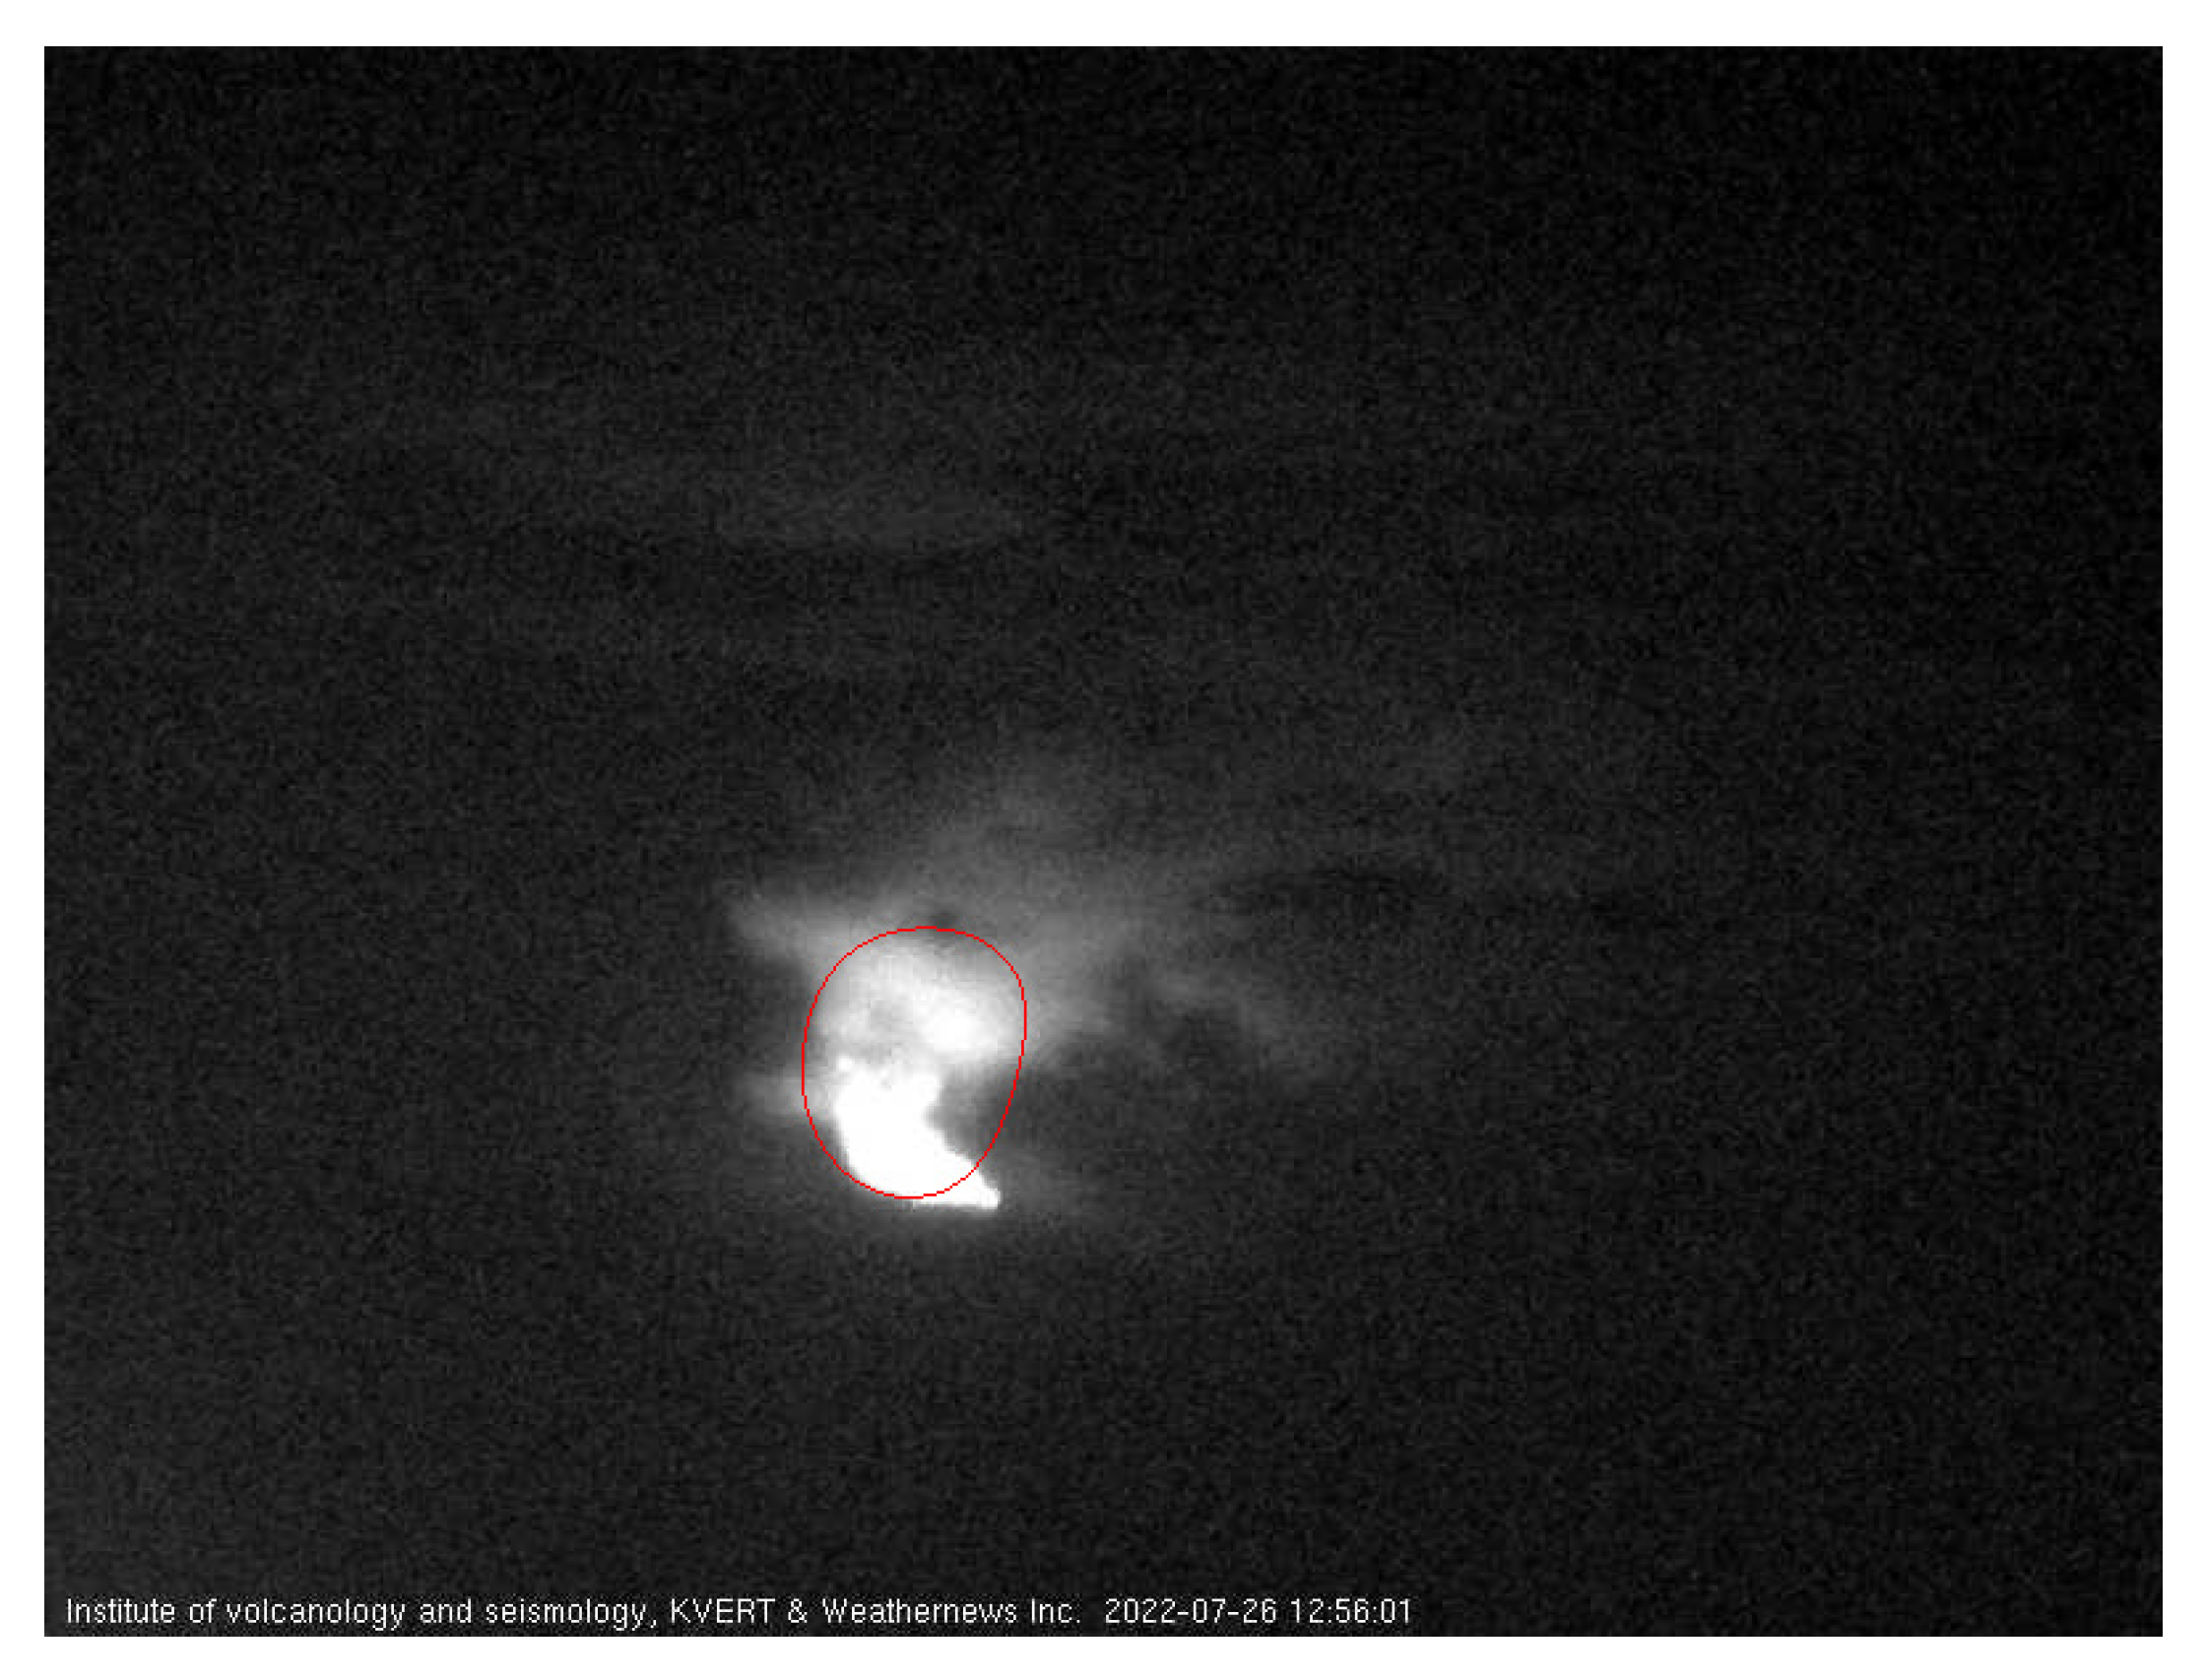
In mid–June, a huge explosion occurred, with ash removal up to 7 km a.s.l. (VONA 2022–52 [17]). The active growth of the lava blocks on the dome resumed with renewed vigour, accompanied by almost continuous hot avalanches. The number of night images with an anomaly detected increased, along with the maximum size and brightness of these detected anomalies. Figure 15 shows the night image on 26 July with the biggest anomaly detected in 2022—6654 pixels in size (Figure 15), which was the evidence of the explosive event of the volcano.
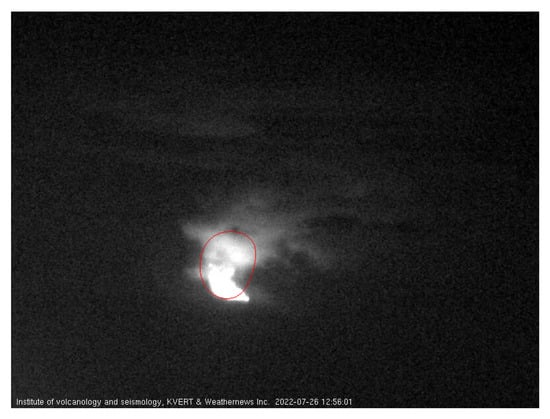
Figure 15.
The biggest thermal anomaly (6554 pixels, outlined with red) of the Sheveluch volcano in 2022, detected on night image on 26 July 2022.
In October–November, there was an active extrusion of viscous lava flows onto the slopes of the dome while hot avalanches occurred more often (according to VONA 2022–146 [18], VONA 2022–184 [19]). This also resulted in an increase in size (Figure 13a) and brightness (Figure 13b) for the thermal anomaly.
As a validation procedure, we compared the dynamics of the characteristics of the thermal anomaly detected in nighttime imagery with remote sensing data. The following satellite data were used: AVHRR (NOAA-N-Prime), MODIS (Terra and Aqua), VIIRS−Visible Infrared Imaging Radiometer Suite (JPSS-1 (Joint Polar Satellite System)−and Suomi NPP (National Polar-orbiting Partnership), MSU-MR−Multispectral scanner low-resolution (Meteor M-2), available in the VolSatView information system. This data were manually processed by scientists from KVERT with tools provided by VolSatView: they determined the Value of Temperature Difference between the thermal Anomaly and the Background (the VTDAB) [20], as well as anomaly size in pixels. These values were used as references for Sheveluch thermal activity during 2022.
Figure 16 shows the anomaly size time series, determined from night images in comparison with the anomaly size change obtained using KVERT. These data series show similar trends. The incomplete match is probably explained by the following:

Figure 16.
The change in the size of the anomaly detected on night images (blue line) in comparison with the size of a thermal anomaly determined using KVERT from AVHRR, MODIS, VIIRS and MSU-MR night data (green line).
- Different data intervals–1 min for ground data and 0.5–2 h for the satellite.
- Different weather conditions–low clouds affected the image data, while high, dense clouds interfered with satellite observations.
- Different view angles–on a satellite image, the most likely anomaly appears earlier than that in the night image (if visibility is good).
- Different observation scales-the pixel of the satellite image covers a much larger area than the pixel of the camera image.
Figure 17 shows the change in anomaly size, determined from night images in comparison with the VTDAB, determined by KVERT [20]. These data series have a better agreement since the growth of the hot area and temperature rises are related processes.

Figure 17.
Comparison of the dynamics of the anomaly size detected on night images (blue line) and of the Value of Temperature Difference between the thermal anomaly and the background determined using KVERT from AVHRR, MODIS, VIIRS and MSU-MR night data (red line).
To monitor the volcano through night images, as considered in this paper, both indicators are important: the brightness of the thermal anomaly and its size. The higher the activity of the volcano (explosions, hot avalanches, etc.), the larger the size of the anomaly. At the same time, the anomaly brightness almost always has maximum values if weather conditions are good, but the presence of fog or cloudiness reduces the intensity of the anomaly brightness down to “undetectability”. However, if a large thermal anomaly of any brightness is registered on the image, this means that a powerful eruptive event is occurring. Our research has shown that to monitor volcanoes and analyze the dynamics of their activity over time using video data, the best indicator is the size of the thermal anomaly.
5. Conclusions
This study proposes an improved algorithm to search for thermal anomalies in night images generated by cameras using an IR-cut filter. The software created with computer vision and machine learning methods includes a classifier model trained on data from the archive of the Kamchatka volcano video surveillance system. The final classification accuracy was 98%, which allowed most thermal anomalies to be detected on night images.
Testing the created method on the Sheveluch images showed that the characteristics of the thermal anomaly obtained from night frames sufficiently reflect the dynamics of volcano activity and are also consistent with the data obtained using remote sensing.
The new data source that night images provide could complement other monitoring approaches in cases when the application of specialized hardware is difficult or impossible. These created algorithms and methods can be adapted for images of volcanoes obtained from other cameras using the IR-cut filter. In this case, while the general approach is still the same, the training and tuning parameters of the algorithm separately for each camera obtain the most accurate results.
Author Contributions
Conceptualization, I.U. and A.S.; methodology, I.U. and S.K.; software, I.U.; data curation, O.G. and S.K.; validation, S.K. and O.G.; manuscript writing, S.K., A.S., O.G. and I.U.; All authors discussed the results and contributed to the final manuscript. All authors have read and agreed to the published version of the manuscript.
Funding
This research received no external funding.
Institutional Review Board Statement
Not applicable.
Informed Consent Statement
Not applicable.
Data Availability Statement
Data sharing is not applicable.
Acknowledgments
Studies were carried out using the resources of the Center for Shared Use of Scientific Equipment “Center for Processing and Storage of Scientific Data of the Far Eastern Branch of the Russian Academy of Sciences” [21], funded by the Russian Federation and represented by the Ministry of Science and Higher Education of the Russian Federation under project No. 075-15-2021-663. Special thanks to Ivan Nuzhdaev (IVS FEB RAS) for the thermal image of Sheveluch volcano, and to KVERT scientists for completing the satellite database on Sheveluch thermal activity in 2022.
Conflicts of Interest
The authors declare no conflict of interest.
Abbreviations
| IR | InfraRed |
| KVERT | Kamchatkan Volcanic Eruption Response Team |
| NIR | Near-InfraRed |
| VONA | Volcano Observatory Notice for Aviation |
| RGB | Red, Green, Blue |
| SVM | support vector machine |
| DoG | Difference of Gaussian |
| a.s.l. | Above Sea Level |
| VTDAB | the Value of Temperature Difference between the thermal anomaly and the background |
References
- Harris, A.J.L.; Ripepe, M.; Hughes, E.A. Detailed analysis of particle launch velocities, size distributions and gas densities during normal explosions at Stromboli. J. Volcanol. Geotherm. Res. 2012, 231–232, 109–131. [Google Scholar] [CrossRef]
- Walter, T.R.; Legrand, D.; Delgado, G.H.; Reyes, G.; Arámbula, R. Volcanic eruption monitoring by thermal image correlation: Pixel offsets show episodic dome growth of the Colima volcano. JGR Solid Earth 2013, 118, 1408–1419. [Google Scholar] [CrossRef]
- Vásconez, F.; Moussallam, Y.; Harris, A.J.L.; Latchimy, T.; Kelfoun, K.; Bontemps, M.; Macías, C.; Hidalgo, S.; Córdova, J.; Battaglia, J.; et al. VIGIA: A Thermal and Visible Imagery System to Track Volcanic Explosions. Remote Sens. 2022, 14, 3355. [Google Scholar] [CrossRef]
- Calvari, S.; Nunnari, G. Comparison between Automated and Manual Detection of Lava Fountains from Fixed Monitoring Thermal Cameras at Etna Volcano, Italy. Remote Sens. 2022, 14, 2392. [Google Scholar] [CrossRef]
- Dye, B.C.; Morra, G. Machine learning as a detection method of Strombolian eruptions in infrared images from Mount Erebus, Antarctica. Phys. Earth Planet. Inter. 2020, 305, 106508. [Google Scholar] [CrossRef]
- Witsil, A.J.; Johnson, J.B. Volcano video data characterized and classified using computer vision and machine learning algorithms. Geosci. Front. 2020, 11, 1789–1803. [Google Scholar] [CrossRef]
- Sansivero, F.; Vilardo, G. Processing Thermal Infrared Imagery Time-Series from Volcano Permanent Ground-Based Monitoring Network. Latest Methodological Improvements to Characterize Surface Temperatures Behavior of Thermal Anomaly Areas. Remote Sens. 2019, 11, 553. [Google Scholar] [CrossRef]
- Ando, B.; Pecora, E. An advanced video-based system for monitoring active volcanoes. Comput. Geosci. 2006, 32, 85–91. [Google Scholar] [CrossRef]
- Bombrun, M.; Jessop, D.; Harris, A.; Barra, V. An algorithm for the detection and characterisation of volcanic plumes using thermal camera imagery. J. Volcanol. Geotherm. Res. 2018, 352, 26–37. [Google Scholar] [CrossRef]
- Coppola, D.; Laiolo, M.; Campus, A.; Massimetti, F. Thermal unrest of a fumarolic field tracked using VIIRS imaging bands: The case of La fossa crater (Vulcano Island, Italy). Front. Earth Sci. 2022, 10, 964372. [Google Scholar] [CrossRef]
- Kamaev, A.N.; Korolev, S.P.; Sorokin, A.A.; Urmanov, I.P. Detection of Thermal Anomalies in the Images of Volcanoes Taken at Night. J. Comput. Syst. Sci. Int. 2020, 59, 95–104. [Google Scholar] [CrossRef]
- Pantazi, X.E.; Moshou, D.; Bochtis, D. Artificial intelligence in agriculture. In Intelligent Data Mining and Fusion Systems in Agriculture; Academic Press: Cambridge, MA, USA, 2020; pp. 17–101. [Google Scholar] [CrossRef]
- Sorokin, A.; Korolev, S.; Romanova, I.; Girina, O.; Urmanov, I. The Kamchatka Volcano Video Monitoring System. In Proceedings of the 2016 6th International Workshop on Computer Science and Engineering, Tokyo, Japan, 17–19 June 2016; Science and Engineering Institute: Los Angeles, CA, USA, 2016; pp. 734–737. [Google Scholar]
- Axis Communications: IR in Surveillance. Day-and-Night Cameras and Optimized IR. Available online: https://www.axis.com/dam/public/a0/56/91/ir-in-surveillance-en-US-398429.pdf (accessed on 27 August 2023).
- Iliou, T.; Christos-Nikolaos, A.; Nerantzaki, M.; Anastassopoulos, G. A Novel Machine Learning Data Preprocessing Method for Enhancing Classification Algorithms Performance. In Proceedings of the 16th International Conference on Engineering Applications of Neural Networks, Rhodes Island, Greece, 25–28 September 2015; Association for Computing Machinery: New York, NY, USA, 2015; pp. 1–5. [Google Scholar] [CrossRef]
- Orrù, P.F.; Zoccheddu, A.; Sassu, L.; Mattia, C.; Cozza, R.; Arena, S. Machine Learning Approach Using MLP and SVM Algorithms for the Fault Prediction of a Centrifugal Pump in the Oil and Gas Industry. Sustainability 2020, 12, 4776. [Google Scholar] [CrossRef]
- VONA/KVERT Information Release, June 19, 2022. KVERT, Institute of Volcanology and Seismology FEB RAS. Available online: http://www.kscnet.ru/ivs/kvert/van/?n=2022-52 (accessed on 15 May 2023).
- VONA/KVERT Information Release, October 25, 2022. KVERT, Institute of Volcanology and Seismology FEB RAS. Available online: http://www.kscnet.ru/ivs/kvert/van/?n=2022-146 (accessed on 15 May 2023).
- VONA/KVERT Information Release, November 29, 2022. KVERT, Institute of Volcanology and Seismology FEB RAS. Available online: http://www.kscnet.ru/ivs/kvert/van/?n=2022-184 (accessed on 15 May 2023).
- Girina, O.; Manevich, A.; Loupian, E.; Uvarov, I.; Korolev, S.; Sorokin, A.; Romanova, I.; Kramareva, L.; Burtsev, M. Monitoring the Thermal Activity of Kamchatkan Volcanoes during 2015–2022 Using Remote Sensing. Remote Sens. 2023, 15, 4775. [Google Scholar] [CrossRef]
- Sorokin, A.A.; Makogonov, S.V.; Korolev, S. The Information Infrastructure for Collective Scientific Work in the Far East of Russia. Sci. Tech. Inf. Process. 2017, 44, 302–304. [Google Scholar] [CrossRef]
Disclaimer/Publisher’s Note: The statements, opinions and data contained in all publications are solely those of the individual author(s) and contributor(s) and not of MDPI and/or the editor(s). MDPI and/or the editor(s) disclaim responsibility for any injury to people or property resulting from any ideas, methods, instructions or products referred to in the content. |
© 2023 by the authors. Licensee MDPI, Basel, Switzerland. This article is an open access article distributed under the terms and conditions of the Creative Commons Attribution (CC BY) license (https://creativecommons.org/licenses/by/4.0/).

