Article

Spatiotemporal Variation and Stability of Rice Planting Using Landsat–MODIS Fusion Images from 1990 to 2020

1
Institute of Geographic Sciences and Natural Resources Research, Chinese Academy of Sciences, Beijing 100101, China
2
College of Resources and Environment, University of Chinese Academy of Sciences, Beijing 100049, China
*
Author to whom correspondence should be addressed.
Remote Sens. 2023, 15(19), 4814; https://doi.org/10.3390/rs15194814
Submission received: 24 July 2023 / Revised: 26 September 2023 / Accepted: 1 October 2023 / Published: 3 October 2023
(This article belongs to the Special Issue Application of Remote Sensing in Agroforestry II)

Abstract

:
Dongting Lake Plain is a historic foundation for China’s commodity grain production. We used Landsat images to interpret the rice planting pattern from 1990 to 2020 based on the vegetation index curve and crop time window differences. The research aims included the spatiotemporal change in the rice planting area and the multiple cropping index, the transformation properties between single-crop and double-crop, and influence factors of rice cultivation. The findings indicated that the rice planting area has increased by 23.64% over the past 30 years. However, the multiple cropping index decreased by 17.39%. The area of single-crop rice increased by 2.6 times, while the area of double-crop rice decreased by 23.19%, which indicated that the planting intensity of rice has decreased. The area where rice has been steadily planted for 30 years is approximately 5600 km2, accounting for 87% of all rice planting land in this study area. The transformation from double-crop rice to single-crop rice was the most obvious characteristic of internal changes. The marginal benefits of current agricultural policies have decreased. This research may provide a theoretical basis for the refined management of rice and improve agricultural policies. More clouds in the remote sensing image limited the time resolution. Future research may further explore the comprehensive influencing factors.

1. Introduction

Grain security is a crucial component of ensuring social stability and sustainable development, and it has long been a concern of the world community [1,2]. Grain security is built on and primarily begins with the preservation of cultivated land [3,4]. China has a considerable amount of arable land, but the amount per person is rather tiny. Rapid urbanization and industrialization have exacerbated China’s already precarious cultivated land resource status since reform and opening [5,6,7]. Overall, China’s cultivated land quantity maintained a dynamic equilibrium, but the quality of that land has drastically declined in some local regions [8,9]. Regional human–land conflicts are becoming common, which has drawn significant attention from academics and the government [10]. China has enacted a variety of measures over the past 30 years to conserve cultivated land, including the land transfer policy and the policy of balancing the appropriation and compensation of cultivated land. It can increase the effectiveness of using available land resources and prevent the extent of farmed land from shrinking [11]. The reserve resources that may have been used for farming, however, have been depleted as a result of China’s long-standing encouragement of the reclamation of wasteland. It is challenging to ensure both the amount and quality of farmed land since the phenomena of making up the best by the second is frequent [12,13].
In 2022, rice production can make up around 31% of all grain production in China, which will account for roughly 25% of the country’s total grain area being planted to the grain crop [14]. The cultivation of double-crop rice has played a significant role in preserving China’s grain security and is also an efficient way to increase production in the context of more people and less land [15,16]. From the perspective of improving land intensity, compared to single-crop rice, the utilization intensity and yield per unit area of cultivated land planted with double-crop rice are higher. However, there is a limited amount of farmed land worldwide that is appropriate for planting double-crop rice due to soil and climatic restrictions [17,18]. This makes the resources that can be used to produce double-crop rice particularly valuable. The phenomenon of seasonal abandonment, in which double-crop rice was replaced by single-crop rice in a large area, did occur in Southern China in recent years, under the influence of rapid urbanization and industrialization development [19,20]. The change in the amount of rice planted suggests that the high-quality farmed land resources in Southern China are not being completely used, which indirectly causes the transfer of the country’s grain production center northward [21].
Single crop refers to a crop farming system where only one season of crop is planted each year. Multiple crop refers to the average number of times crops were planted on the cultivated land area for one year, which is numerically equal to the ratio of the total planting area to the cultivated land area during one year. The majority of the research on the impact of rice multiple cropping variations on grain production is now conducted and is based on statistical and remote sensing data [22,23,24,25,26]. The statistical information can show the net change in rice crops (single-crop and double-crop) [27]. The impact of changing rice cropping patterns on grain production may be better reflected and examined using remote sensing data [28,29,30,31]. However, there are few studies on the comprehensive evaluation of regional rice multiple crop index and planting stability based on higher resolution remote sensing data, despite the fact that researchers have created detailed remote sensing maps of regional rice planting system distribution at different spatial scales using a variety of data. The large-scale development of newly cultivated land in order to ensure the dynamic balance of the cultivated land area is undoubtedly a waste of financial resources and extremely unfavorable to ecological protection. We may achieve a win–win situation of grain security and ecological security if we fully utilize the productive potential of high-quality cultivated land resources and increase the multiple crop index to replace newly developed low-quality cultivated land. This may not only effectively prevent the waste of cultivated land but will also benefit the environmental protection of ecologically fragile regions.
Remote sensing technology has advantages in fast, macroscopic, and high-precision identification and monitoring of crops such as rice, winter wheat, and rapeseed [32,33]. For the study of China, interpretation methods can be divided into recognition methods for single temporal and multi-source long-term remote sensing data. The identification of crops using single temporal remote sensing data is mainly based on the spectral characteristics and statistical characteristics of crops. Artificial visual interpretation methods based on brightness, hue, texture, and time, as well as supervised and unsupervised classification methods, are commonly used for crop recognition [34,35]. In order to improve the extraction accuracy, many studies combine random forest, object-oriented classification, convolutional neural network, and mixed pixel decomposition to identify winter wheat and rice [36,37,38,39]. This type of method uses fewer data and has strong operability but is susceptible to the influence of “same substance but different spectra” and “foreign substance with the same spectrum”. The identification accuracy of rice and winter wheat can be improved by using multi-source and multi-temporal remote sensing satellite data and combining it with crop biological phenology laws. This method is usually based on feature indices such as the Normalized Difference Vegetation Index (NDVI) and Enhanced Vegetation Index (EVI) and uses long-term remote sensing data to identify crops [40,41,42,43]. However, long-term remote sensing data often face many problems such as obtaining a large amount of remote sensing data, processing remote sensing data, and the impact of cloud pollution, which directly affect the accuracy and operability of crop recognition.
Based on the above summary, it is necessary to explore the stability and variability of rice planting in the Dongting Lake Plain. The stability of rice cultivation refers to whether rice has been continuously cultivated for 30 years, while variability has the opposite meaning. The main reasons are as follows: Firstly, Dongting Lake Plain is the most complex and representative region of China’s planting system; Secondly, although the research on crop classification in China has been very rich, there is still a lack of studies on complex planting systems, and the research span of 30 years is very small; Thirdly, after 2015, new changes have taken place in rice planting in the Dongting Lake Plain, which means that China’s agricultural production is facing new challenges. There is currently no research on the new changes. Fourthly, rice is one of the three major staple grains in China, which is widely planted in the Dongting Lake Plain and plays a key role in the stability of China’s grain production. Therefore, our research objectives and content include three main aspects: variation, stability, and driving factors analysis. Firstly, the interpretations of remote sensing data have been used to show changes in the spatiotemporal distribution of the rice planting area and the multiple cropping index around Dongting Lake Plain. Secondly, we have described the differences between single-crop and double-crop rice in terms of transformation characteristics. Thirdly, the features of planting variability for single-crop and double-crop rice have been examined. Then, we have exposed the stability features of rice farming throughout the previous 30 years. Finally, we have investigated the socioeconomic and policy factors influencing changes in rice planting.

2. Materials and Methods
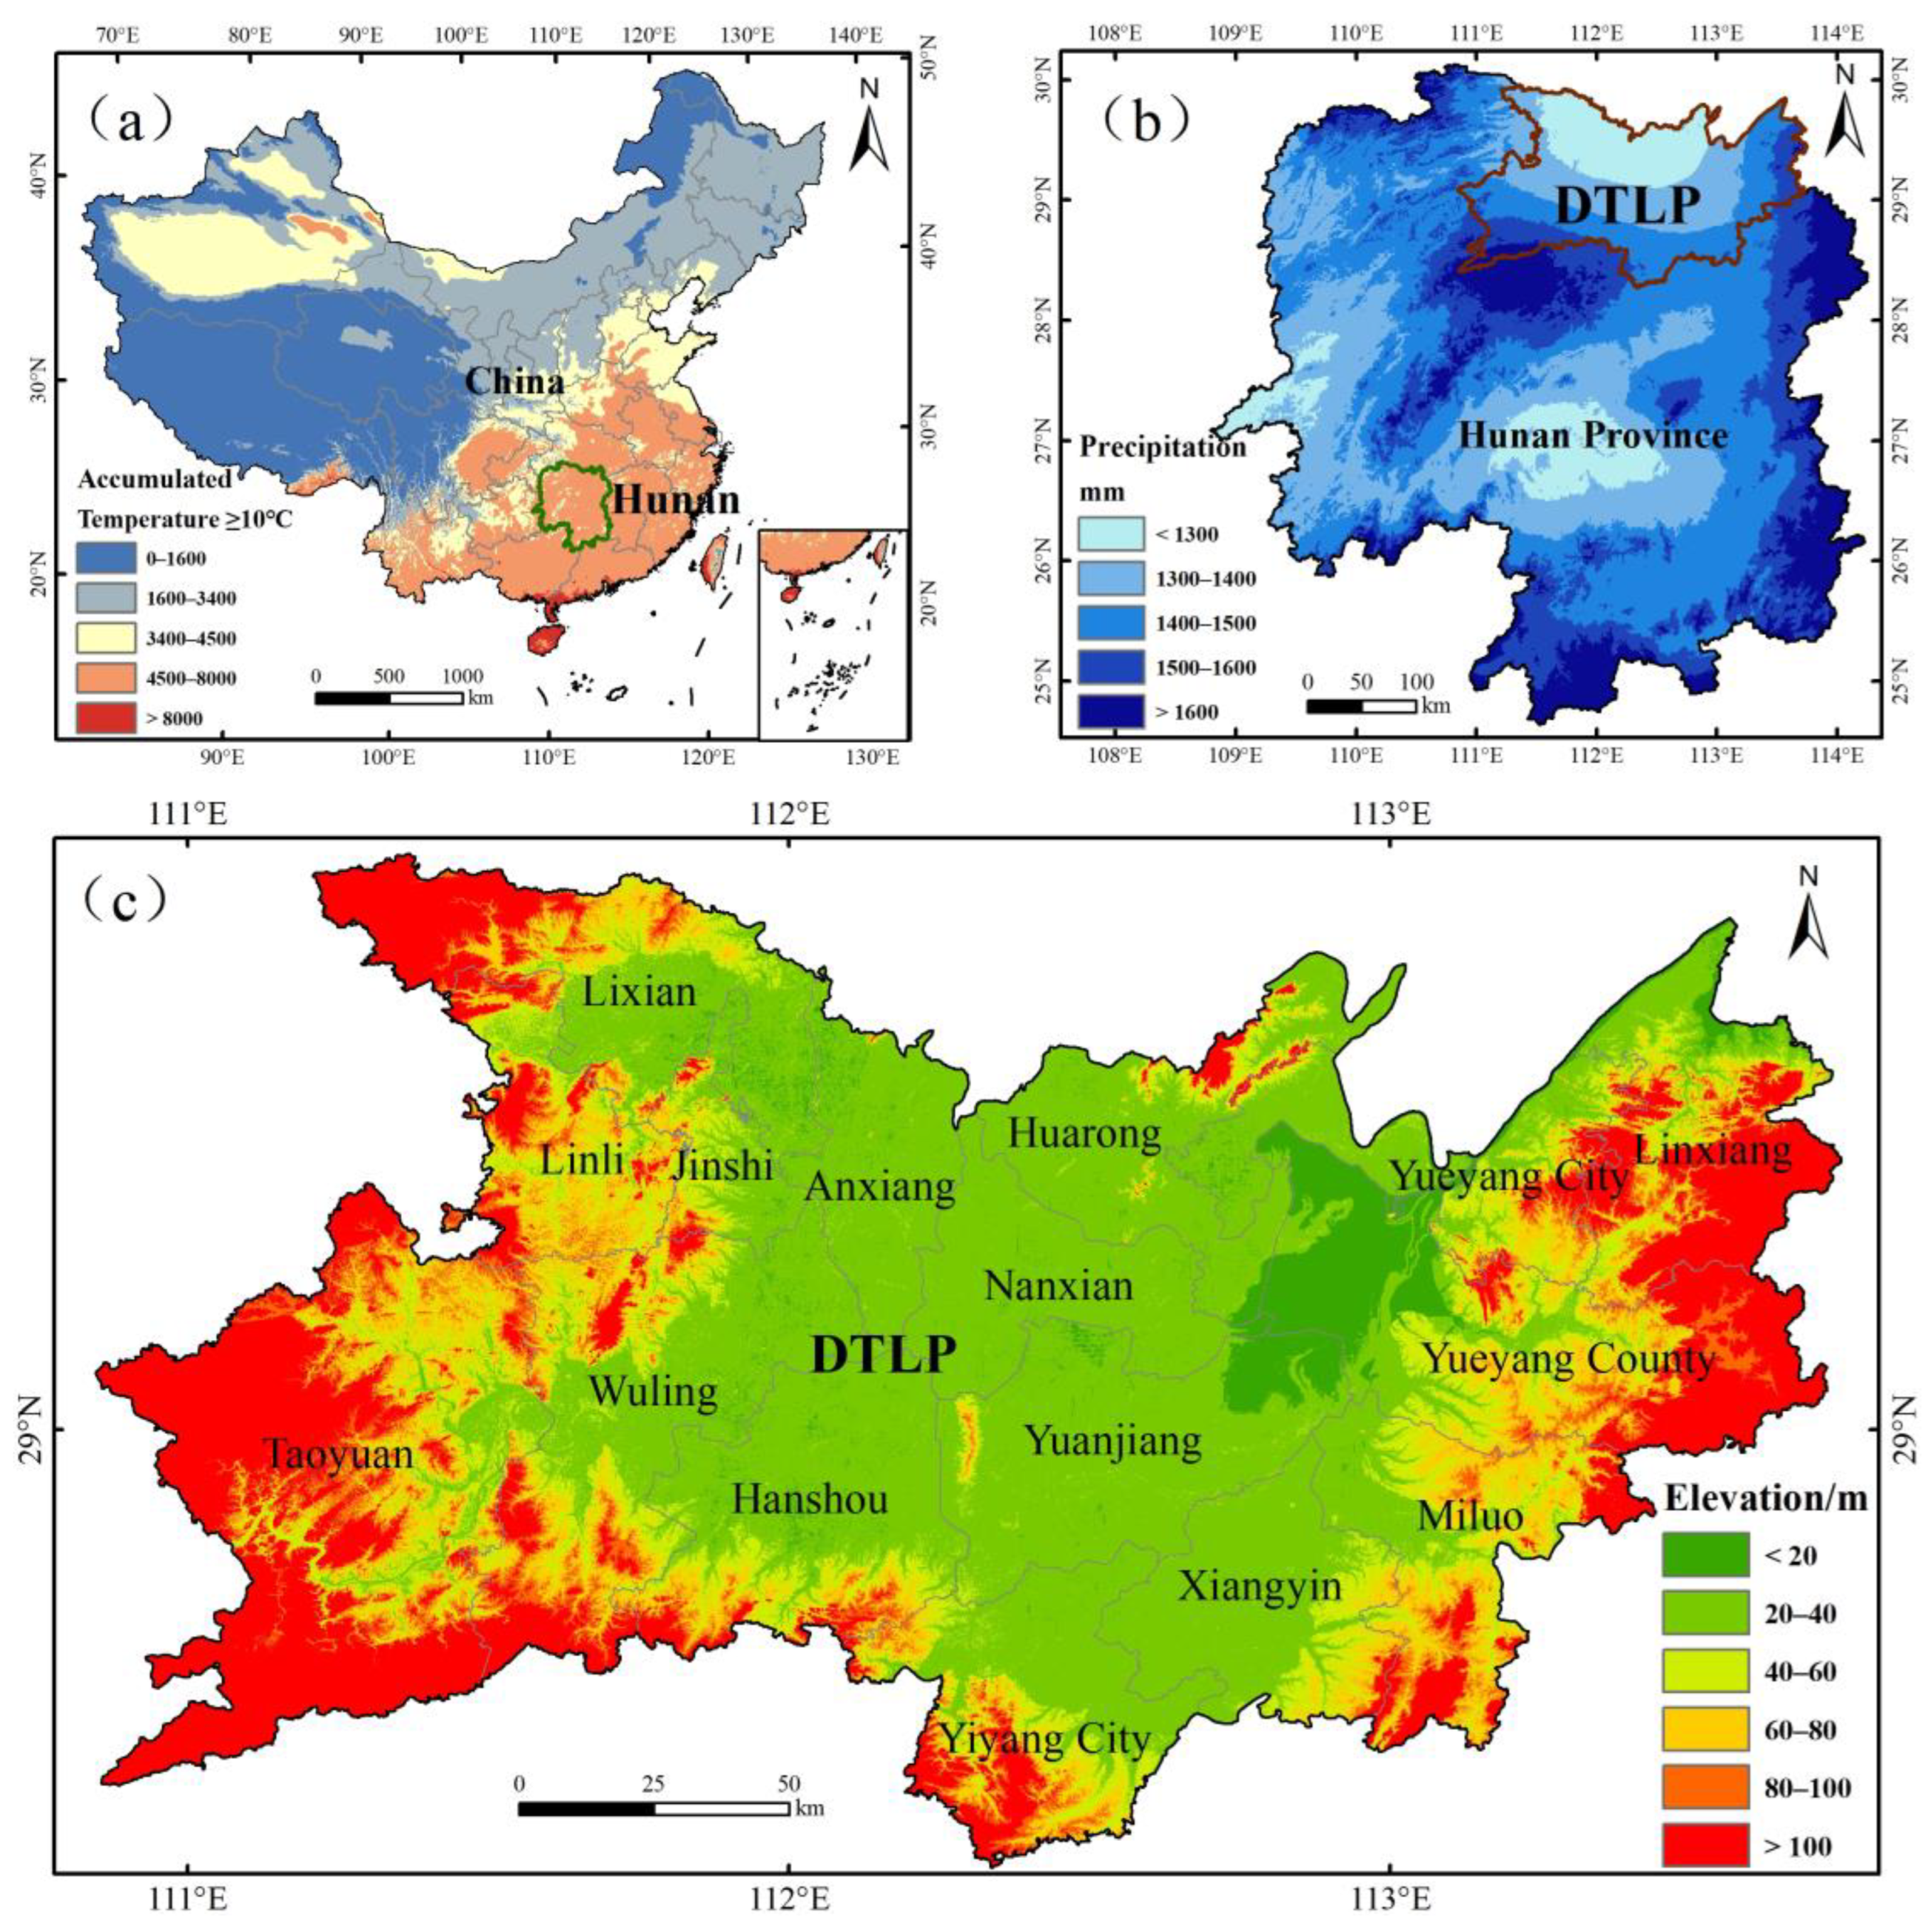
2.1. Study Area

Dongting Lake Plain (DTLP) is situated in the center of China (Figure 1) and located between 28°30′N–30°20′N and 108°90′E–114°10′E. The total land area of this study region is 3.02 × 10⁴ km2. The plain has low internal terrain, and the area above 50 m makes up 56.37% of the total land area. Dongting Lake Plain is mainly characterized by a subtropical monsoon climate, with high temperatures, rainy summers, and cold and dry winters, with four distinct seasons. The climate of Dongting Lake Plain is mild and humid, with an annual rainfall of about 1200 mm, and accumulated temperature above 4500 °C. The soil type in the Dongting Lake Plain is mainly paddy soil with high fertility and there is red soil between them. Due to the existence of such climatic conditions, the crop planting cycle is relatively stable, and agricultural production is relatively reliable [44,45]. Dongting Lake Plain includes Yueyang City (Yueyanglou District, Junshan District, Yunxi District), Yueyang County, Huarong County, Xiangyin County, Miluo City, Linxiang City, Yiyang City (Ziyang District, Heshan District), Yuanjiang City, Nanxian County, Changde City (Wuling District), Anxiang County, Hanshou County, Li County, Linli County, Taoyuan County, and Jinshi City.

2.2. Materials

Landsat TM/OLI (Thematic Mapper/Operational Land Imager) remote sensing image data used in this research can be obtained from the United States Geological Survey (USGS) (https://earthexplorer.usgs.gov/, accessed on 21 March 2021). The spatial resolution is 30 m, and the temporal resolution is 16 days. These data are a Level 1 T standard terrain correction product. The MOD13Q1 composite product can be found on the NASA MODIS Data Distribution Center website (https://modis.gsfc.nasa.gov/, accessed on 19 March 2021), with a spatial resolution of 250 m and a temporal resolution of 16 days. This data product is a Level 2 land standard data product that uses sine curve projection. The detailed information of the data used in this study can be found in Tables S1 and S2 of the Supplementary Materials. Based on such images, the visual interpretation of the spatiotemporal changes in rice planting in 1990, 1995, 2000, 2005, 2010, 2015, and 2020 was made. DEM (Digital Elevation Model), ≥10 °C accumulated temperature, precipitation, and administrative division data are sourced from the Resource and Environmental Science and Data Center of the Chinese Academy of Sciences (https://www.resdc.cn/, accessed on 21 March 2021). The socioeconomic information was derived from the China County Statistical Yearbook and Hunan Statistical Yearbook.

2.3. Methods

2.3.1. Image Preprocessing

The remote sensing image preprocessing included three steps. Firstly, the radiometric calibration and atmospheric correction of Landsat TM/OLI image data were carried out by using the Radiometric Calibration and FLAASH Atmospheric Correction tools of ENVI 5.3 to obtain the real surface reflectance data. Secondly, MODIS Reprojection Tool and ArcGIS 10.2 software were used to perform projection conversion, resampling, dataset extraction, and clip-on MOD13Q1 data. Finally, the processed Landsat and MOD13Q1 data were imported into the ESTARFM model, generating Landsat MODIS fusion data at the predicted time.
Normalized Difference Vegetation Index (NDVI) was one of the important parameters reflecting crop growth, which can separate vegetation from water and soil and objectively reflect changes in vegetation cover. Enhanced Vegetation Index (EVI) was that it can reduce background noise and atmospheric interference on the land surface, while also better reflecting the growth status of vegetation. Compared with NDVI, EVI can better reflect high-density vegetation. Modified Normalized Difference Water Index (MNDWI) was used to extract water information from remote sensing images. We used the ENVI 5.3 Band Math tool to calculate the NDVI, EVI, and MNDWI for images. The calculation formula for each index was as follows:
N D V I = ( ρ N I R ρ R e d ) / ( ρ N I R + ρ R e d )
E V I = 2.5 × ρ N I R ρ R e d ρ N I R + 6 × ρ R e d 7.5 × ρ B l u e + 1
M N D W I = ( ρ G r e e n ρ S w i r ) / ( ρ G r e e n + ρ S w i r )
In Equations (1)–(3), ρBlue, ρGreen, ρRed, ρNIR, ρSwir represented the reflectance of Landsat TM/OLI images in the blue, green, red, near-infrared, and mid-infrared bands.

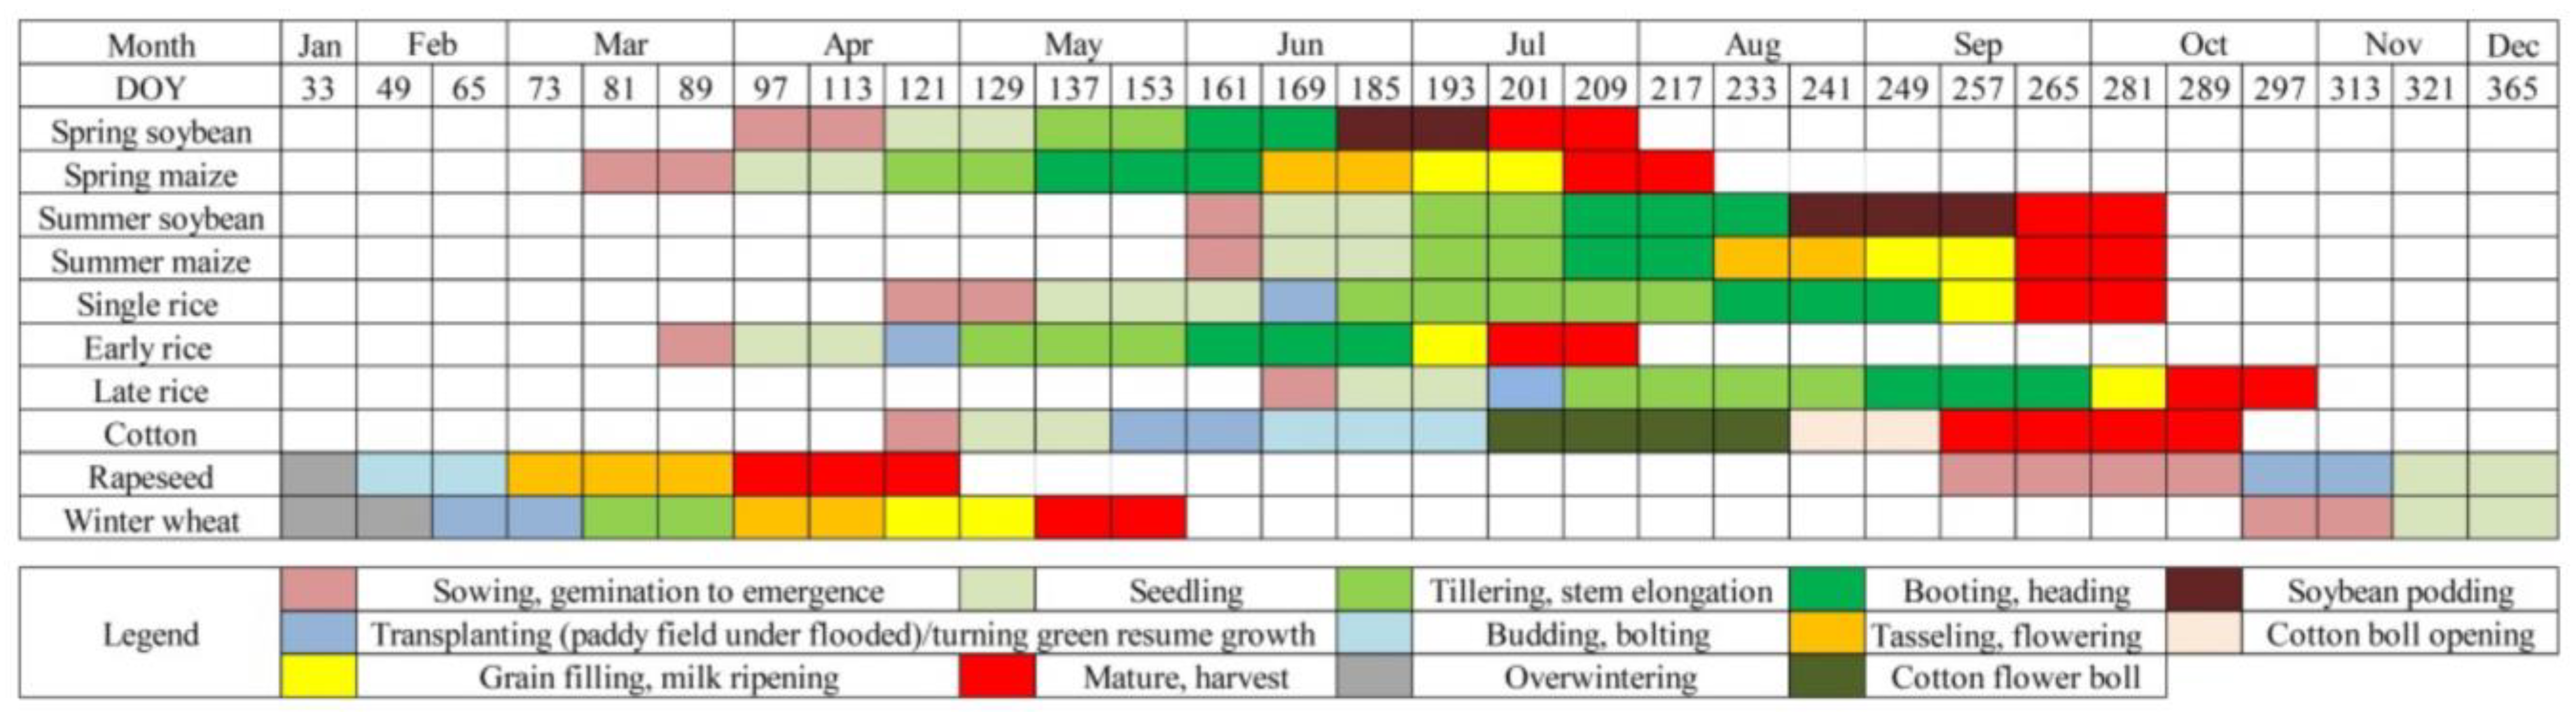
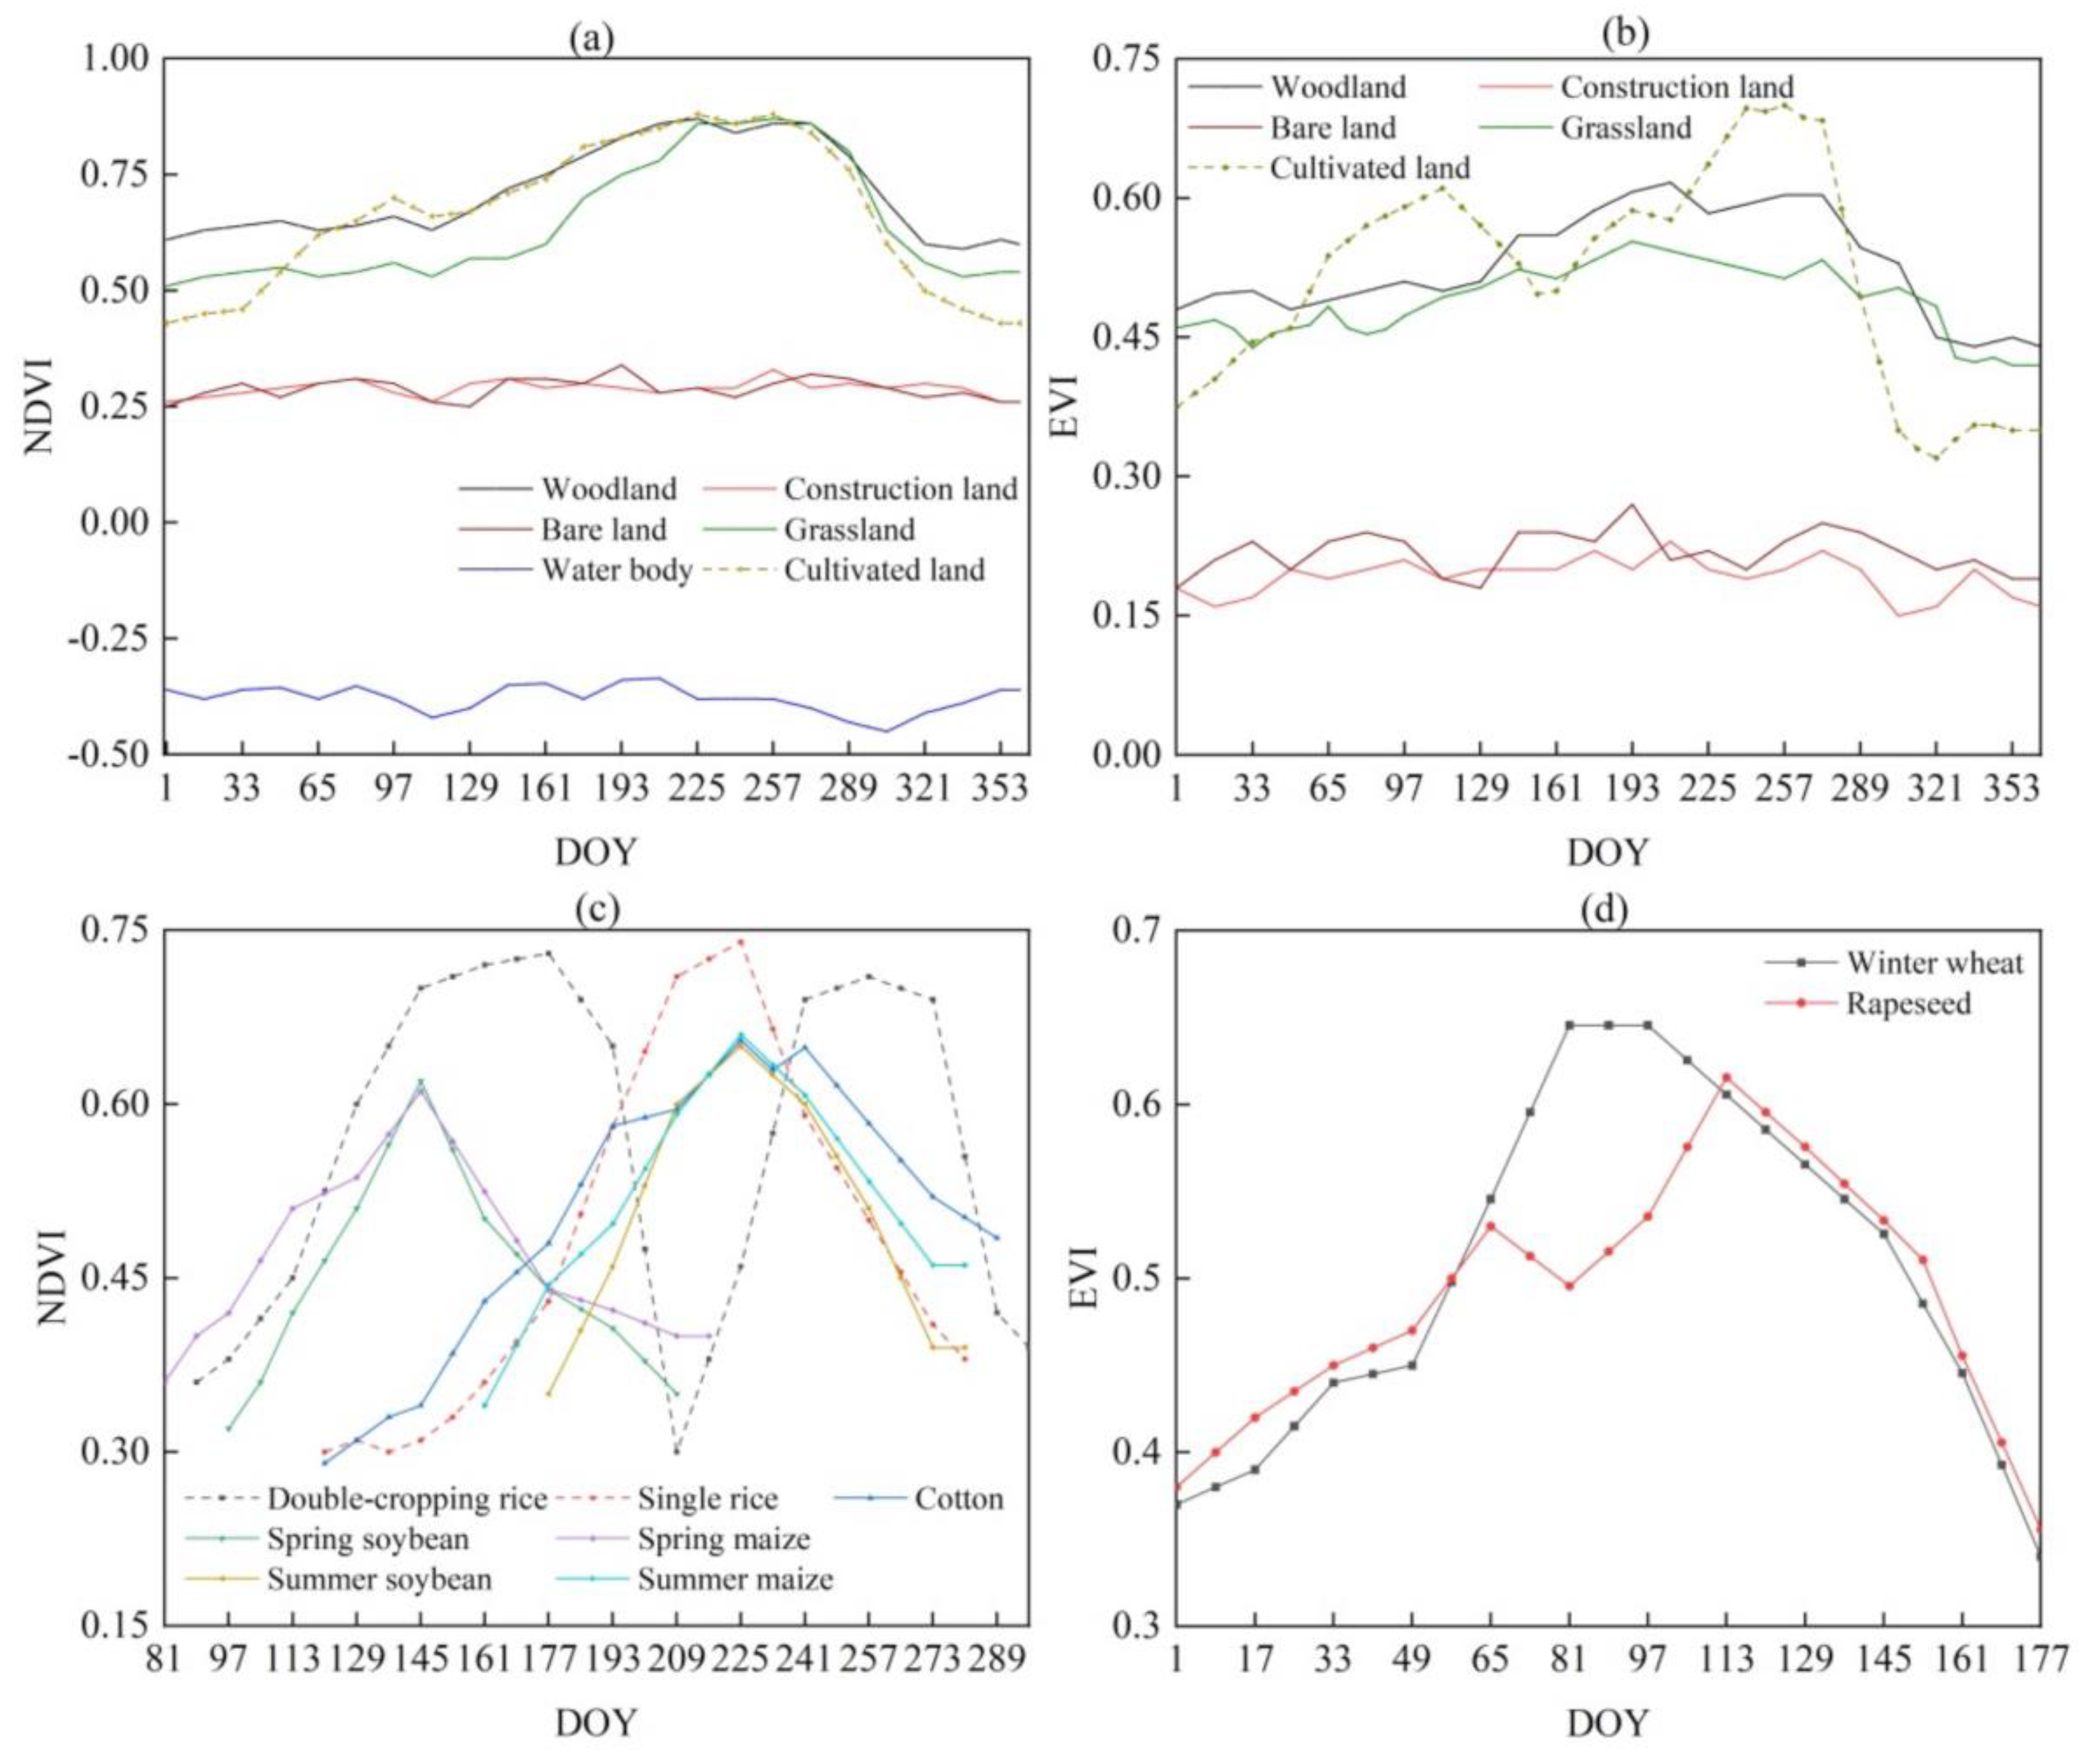
2.3.2. Mapping of Single-Cropping and Double-Cropping Rice

The commonly used remote sensing monitoring of rice was mostly based on single or multiple period images, using supervised or unsupervised classification methods to obtain spatial distribution information of rice [34,35]. However, the classification accuracy of this method was greatly limited by the impact of image quality and the “same object but different spectrum” and “same spectral foreign objects” in single scene image classification [40,41]. In recent years, methods based on time series remote sensing have been increasingly applied in rice planting mapping [22,23,24]. In regions with complex crop rotation patterns, crop classification still faced problems of low classification accuracy and short time series due to high-quality requirements for remote sensing data, difficulties in classifying land cover information, and a lack of accurate classification processes. We proposed a crop classification process for regions with complex crop rotation patterns based on multi-source data fusion technology and pixel-based crop remote sensing extraction technology.
(1) Data fusion. We used the ESTARFM model for data fusion between Landsat and MODIS. The principle of ESTARFM model was to comprehensively consider the spatial distance, spectral change, and temporal change in target pixels and adjacent pixels and use spectral similarity between different sensor data to simulate target pixels. This model not only minimized system bias between different images but also greatly improved fusion accuracy in areas with strong heterogeneity in surface coverage. We selected two Landsat images, two MODIS images, and one type of MODIS data as reference images that are similar to the simulation time and used the ESTARFM model in the ENVI-IDL to input the data to generate fusion data corresponding to the simulation time. For example, the Landsat–MODIS fusion image with path/row number 124/39 on 21 March 2020 was selected as an illustration. Landsat images on 31 January 2020 and 26 August 2020 and MODIS images on 2 February 2020 and 28 August 2020 were used as input images, and the Landsat–MODIS fusion image with spatial resolution of 30 m was reconstructed according to the prediction of the MODIS image of 21 March 2020. We processed 327 Landsat TM/OLI images and 207 MOD13Q1 images, with cloud cover of all data less than 50%, and produced about 90 Landsat–MODIS fusion images.
(2) Crop phenology. We sorted out the phenology of major crops in the Dongting Lake Plain. The phenological periods of various crops can be referred to in Figure 2. The growth period of single-cropping rice (mid-season rice) in the Dongting Lake Plain was 130 to 150 days. It was sown in late April and early May, transplanted in mid-June, and harvested in mid-to-late September. The growth period of double-season early rice was 105 to 115 days. It was sown in late March, transplanted before 30 April, and harvested in late July. The growth period of double-season late rice was 115–120 days. It was sown from 15–25 June, transplanted in mid-July, and harvested in mid-October.
(3) Based on Landsat TM/OLI images, combined with Landsat–MODIS fusion data, we constructed vegetation index time series curves for different crops (Figure 3). There were significant differences in vegetation indices between crops during different phenological periods, which provided a theoretical basis for extracting the spatial distribution of major crops.
(4) Extraction of single- and double-cropping rice. The optimal time window for recognition of single- and double-cropping rice was determined. We used NDVI curve differences to extract single- and double-cropping rice. From early May to mid-August, the NDVI curve of single-season rice showed a single peak pattern, while the NDVI curve of double-season rice showed a double peak pattern. We have provided the detailed interpretation process in the workflow diagram (Figure S1). Figure 4 shows the distribution of single- and double-cropping rice in the Dongting Lake Plain in 1990, 2000, 2010, and 2020. Data in 1995, 2005, and 2015 were presented in Supplementary Materials (Figure S2).

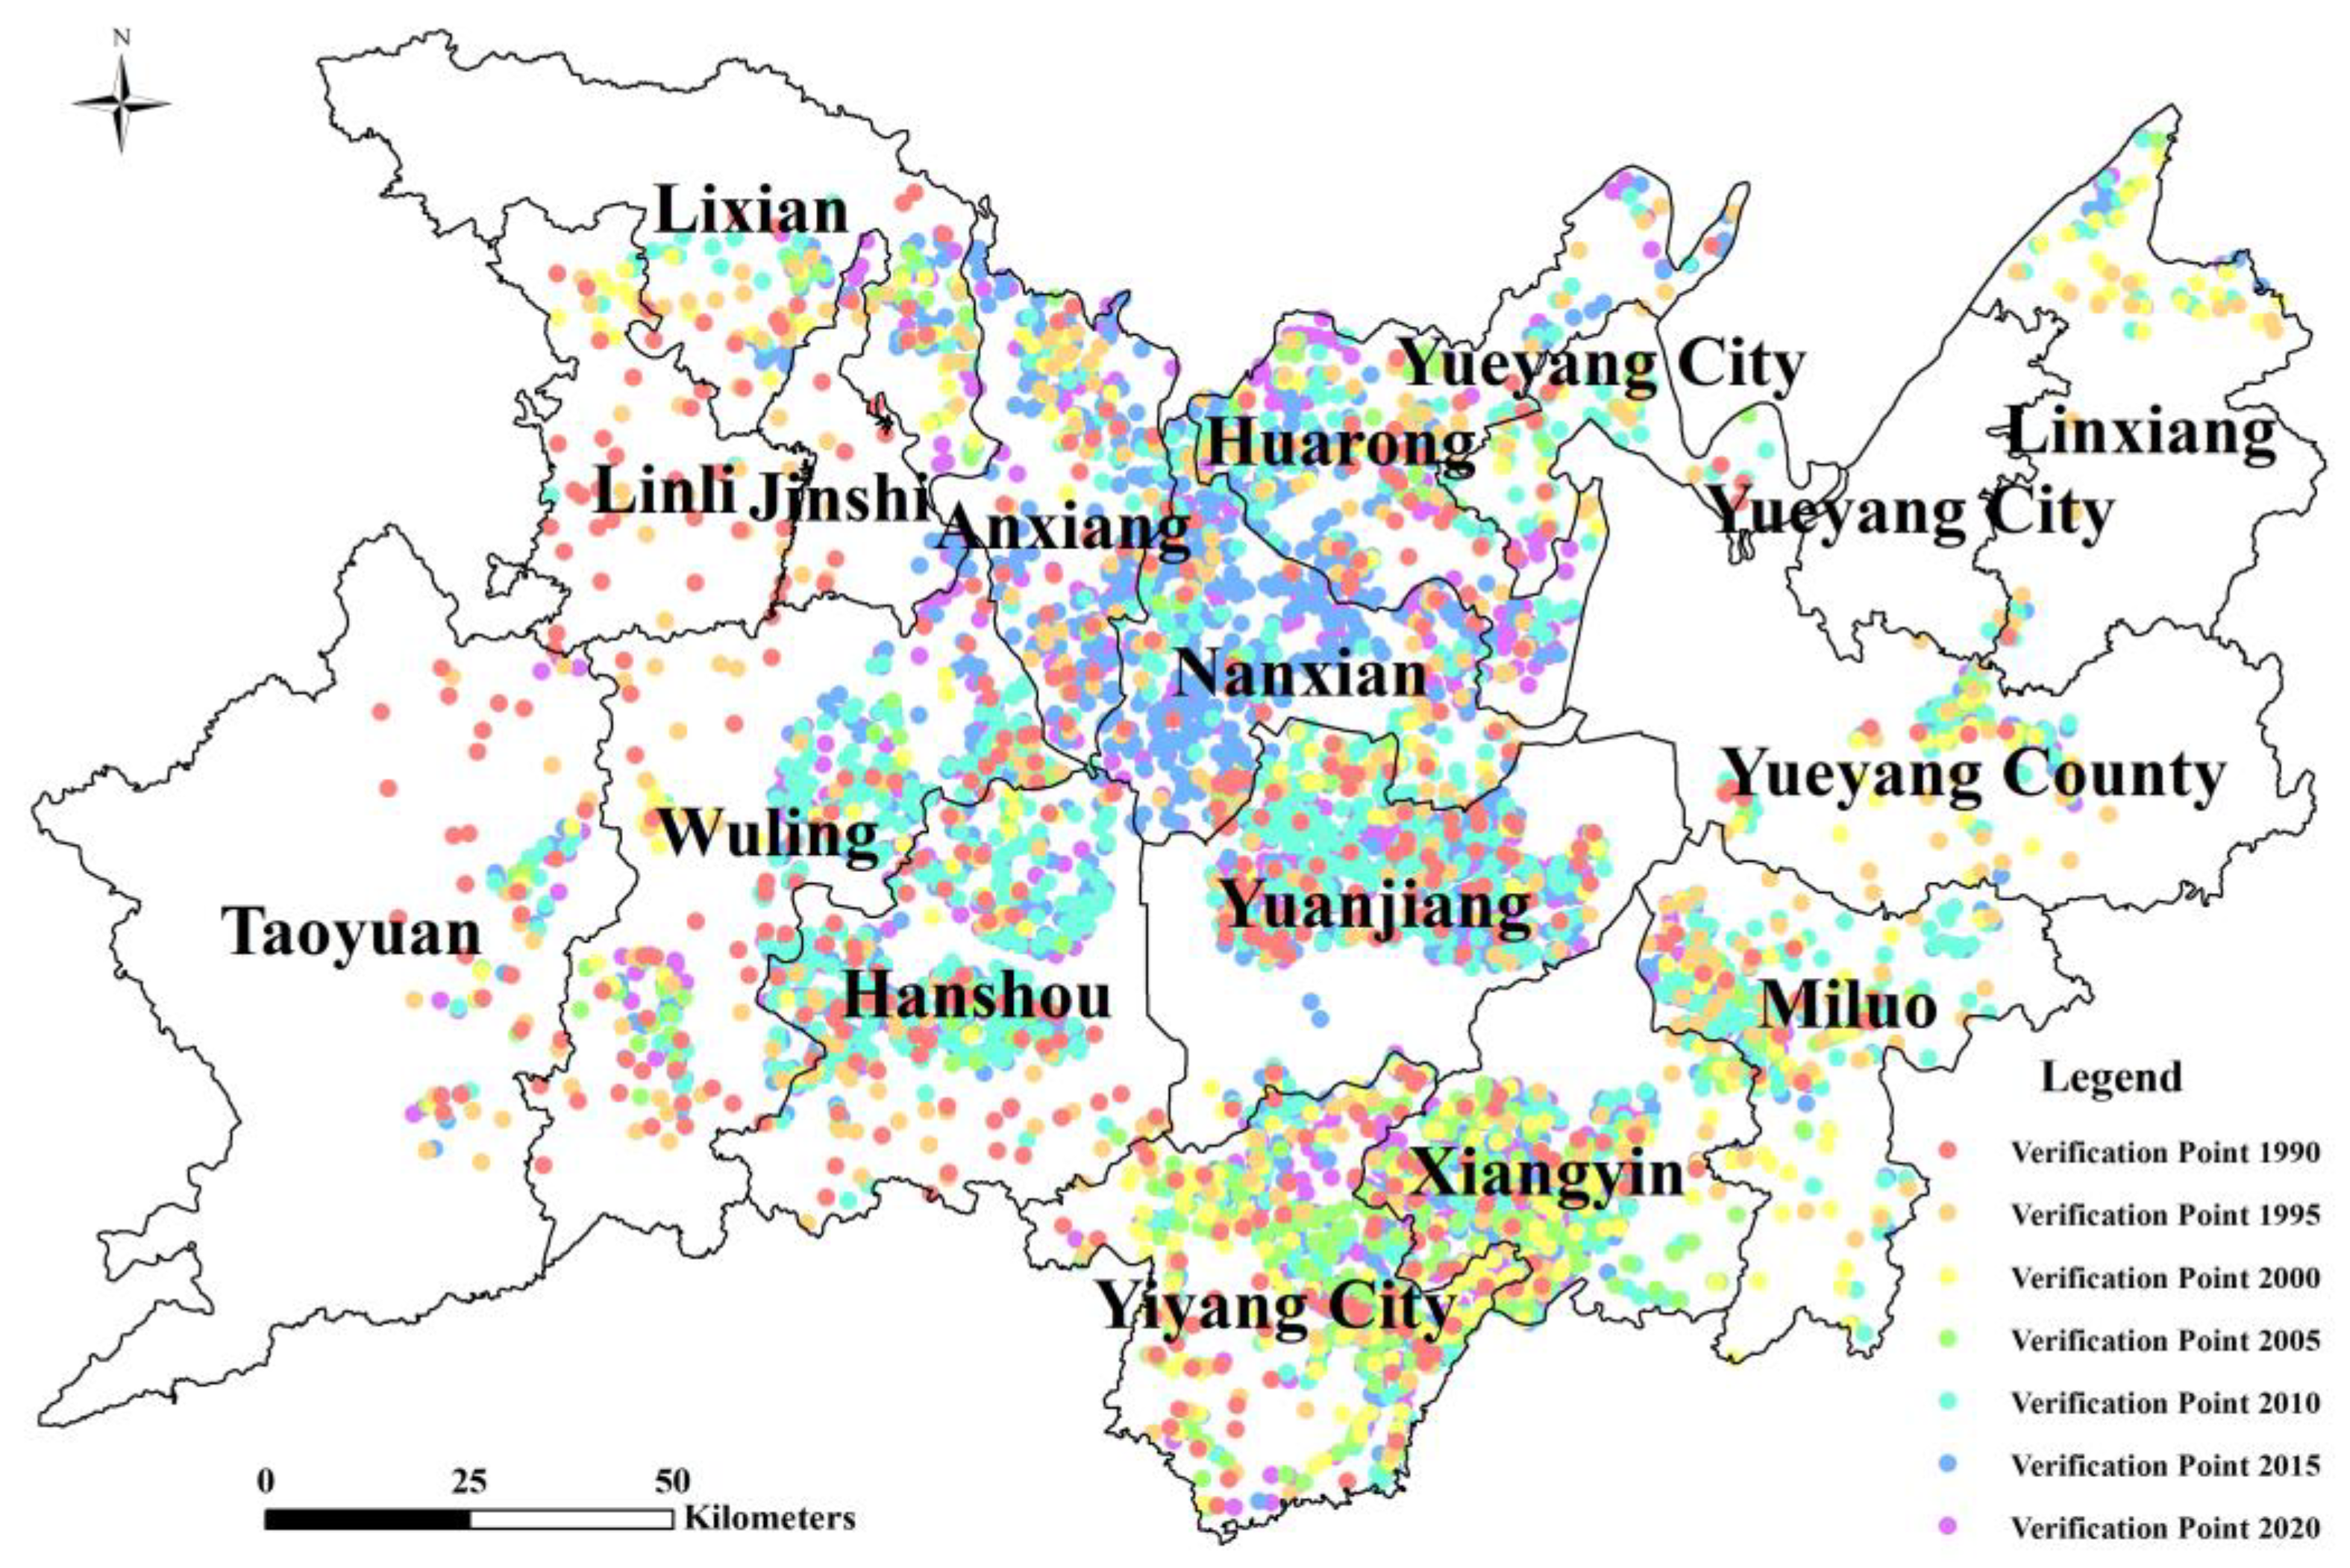
2.3.3. Accuracy Verification

We used sample data and county agricultural statistical data to evaluate the accuracy of remote sensing mapping of single- and double-cropping rice in the Dongting Lake Plain from 1990 to 2020. When using sample points for accuracy evaluation, overall accuracy, Kappa coefficient, user accuracy, and producer accuracy were currently the most commonly used accuracy evaluation indicators for crop classification (Figure 5). Relative error (RE) was a commonly used accuracy evaluation indicator when using county agricultural statistical data for accuracy evaluation. The statistical data of various crops in the Dongting Lake Plain were sorted out and compared with the remote sensing identification results to calculate the relative errors (Table S3). The relative errors between the remote sensing extraction data and statistical data of main crops in the Dongting Lake Plain from 1990 to 2020 were all less than 20%. The accuracy evaluation of using validation samples to validate the classification results is shown in Table 1. Quantitative analysis was conducted on the classification results of single- and double-cropping cultivation from 1990 to 2020 through the confusion matrix of classification. The overall classification accuracy was greater than 89%, and the Kappa coefficient was greater than 0.8. In summary, the extracted results can reflect the spatial pattern of single- and double-cropping in the DTLP over the past 30 years.

2.3.4. Variation and Stability

We established the spatiotemporal dynamic index (STDI) and stability index (SI) to analyze the variation and stability features in the DTLP in order to directly reflect the multiple crop index and planting stability of rice [46]. The following was the calculating formula.
S T D I = ( A r e a i n A r e a o u t ) ( A r e a i n + A r e a o u t ) × 100
where STDI was a ratio, which represented spatiotemporal dynamic index of rice planting; Areaout represented the area of rice cultivated land converted to other land types; Areain represented the area of other land types converted to rice cultivated land. If the STDI was greater than 0, it meant that the Areain was greater than Areaout. Otherwise, the Areaout was higher than the Areain.
S I = A r e a s t a b l e ( A r e a i n + A r e a o u t ) × 100
where SI was a ratio, which represented stability index of rice planting. Areastable represented the area of stable rice cultivated land. If the SI was greater than 1, it meant that the stable planting area was greater than the changing area. Otherwise, the stable planting area was lower than the changing area.

3. Results

3.1. Variation of Rice Planting

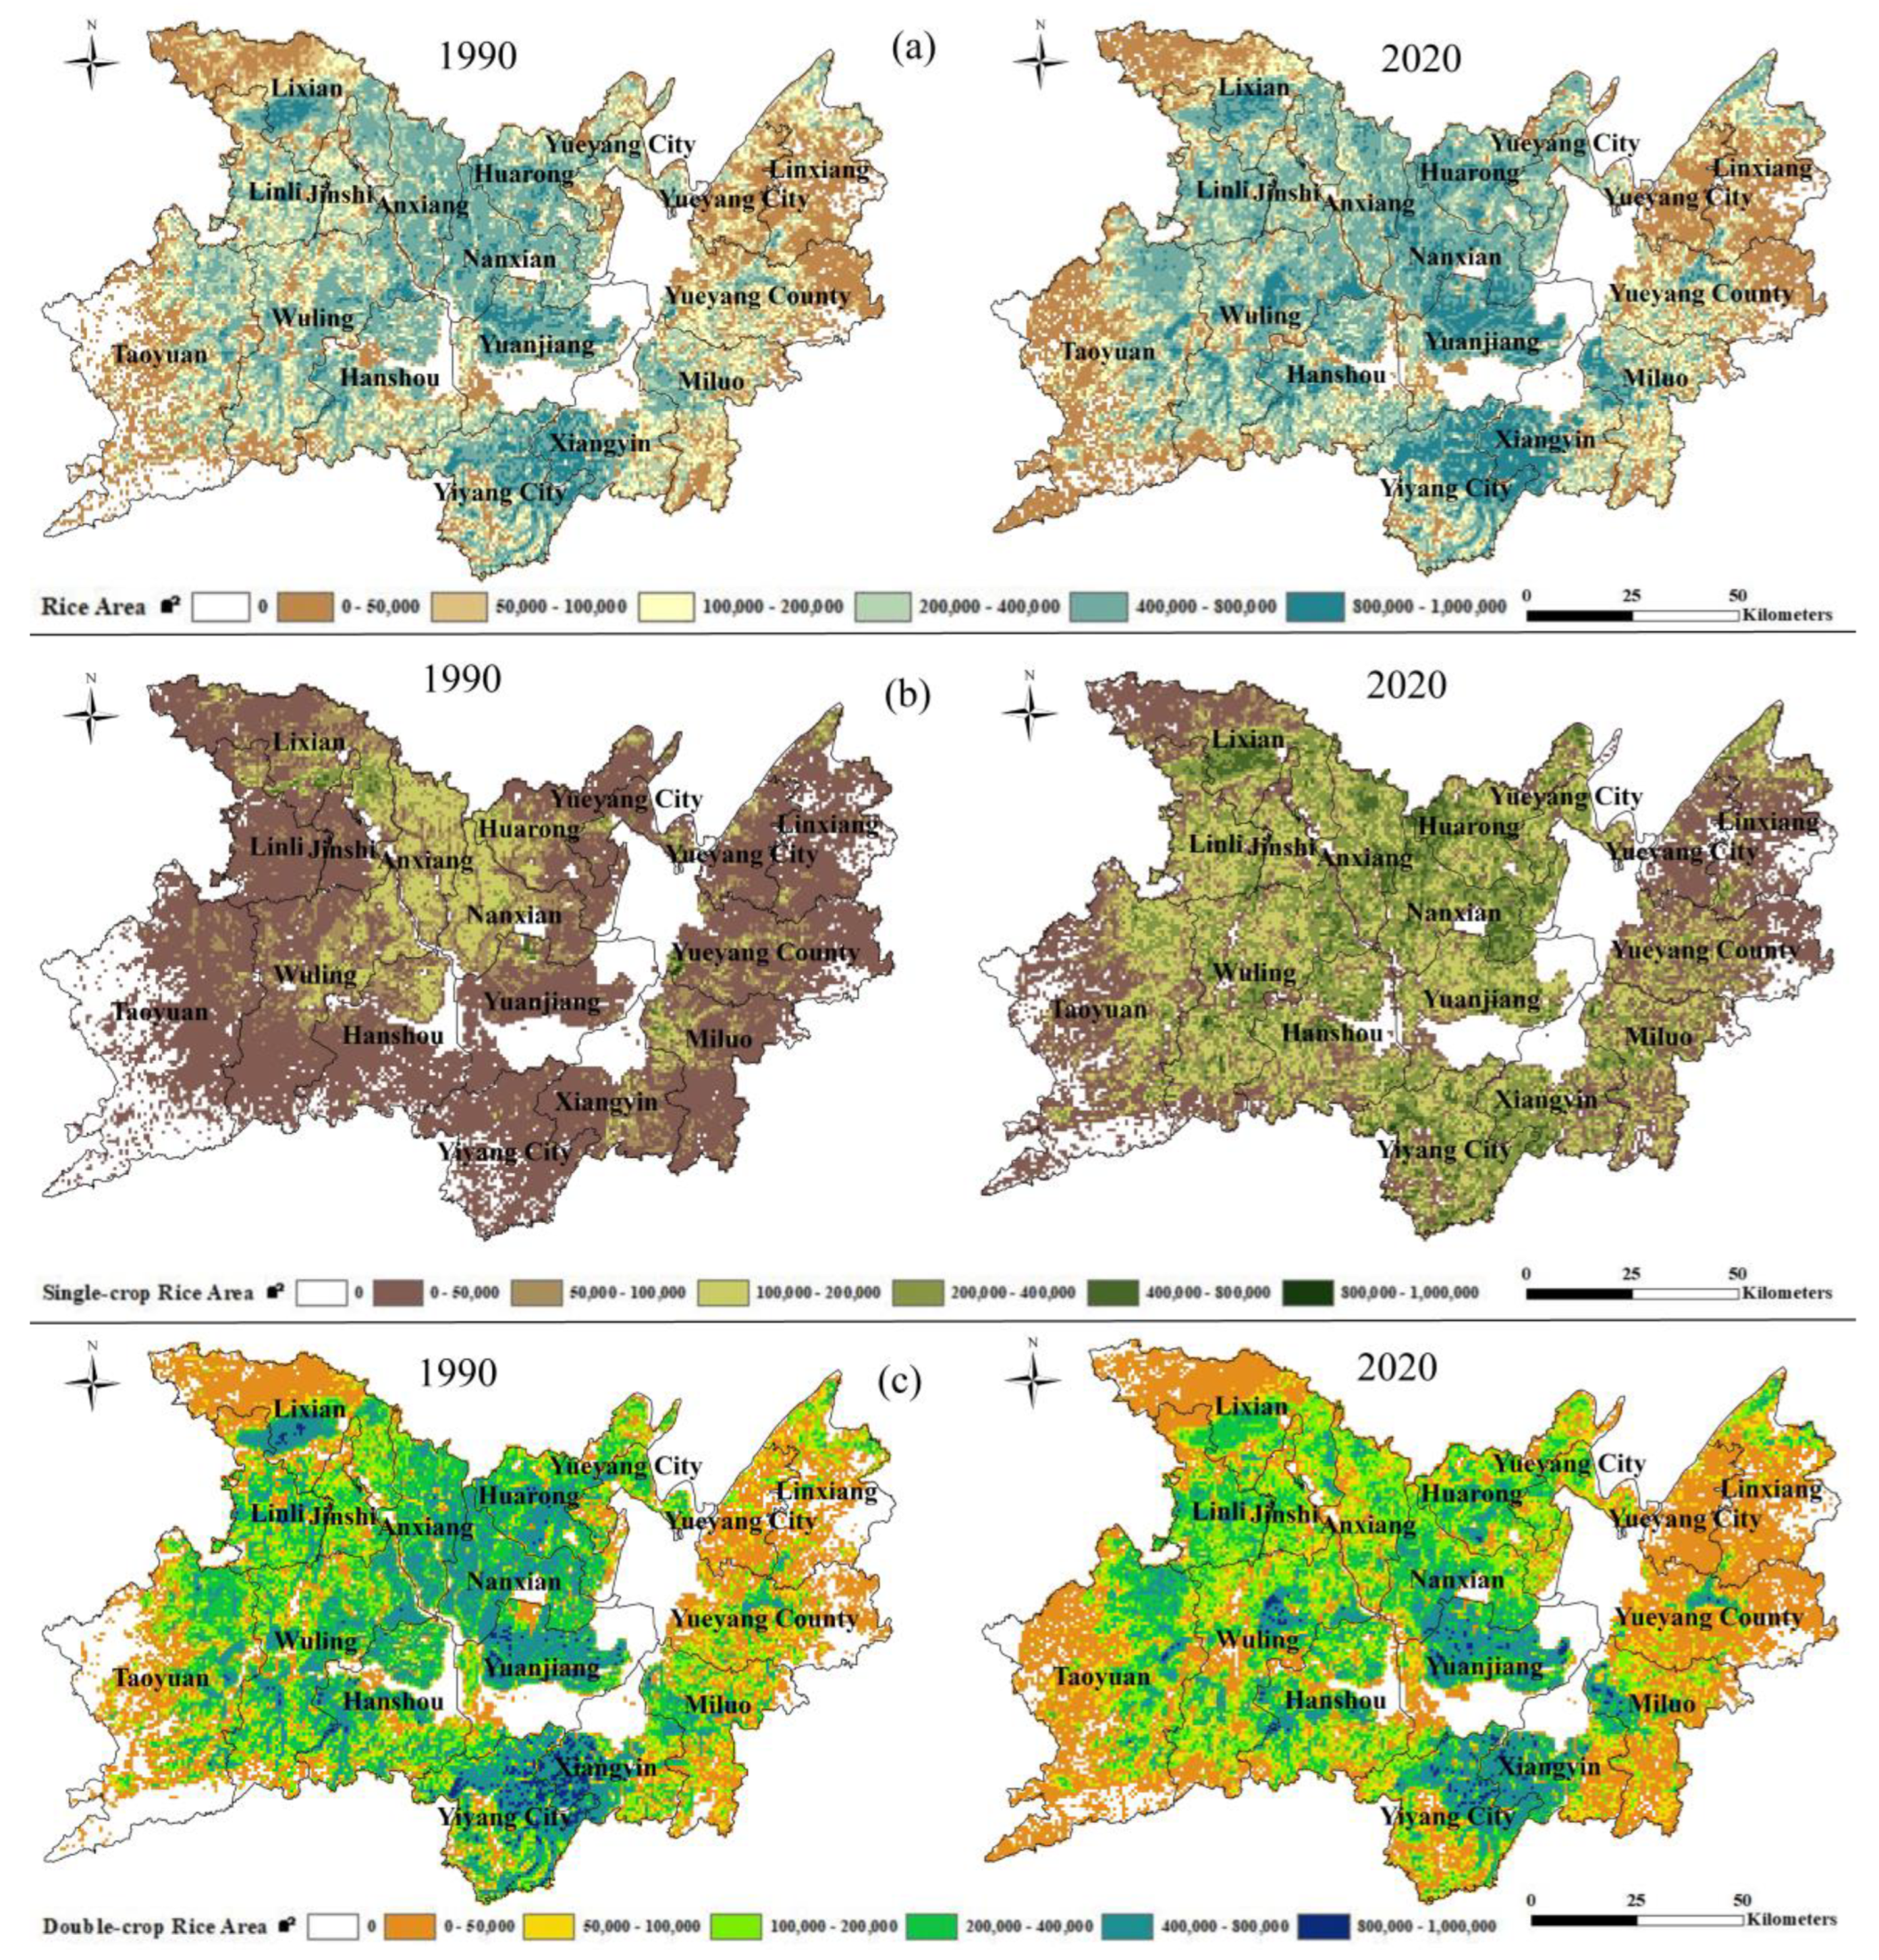
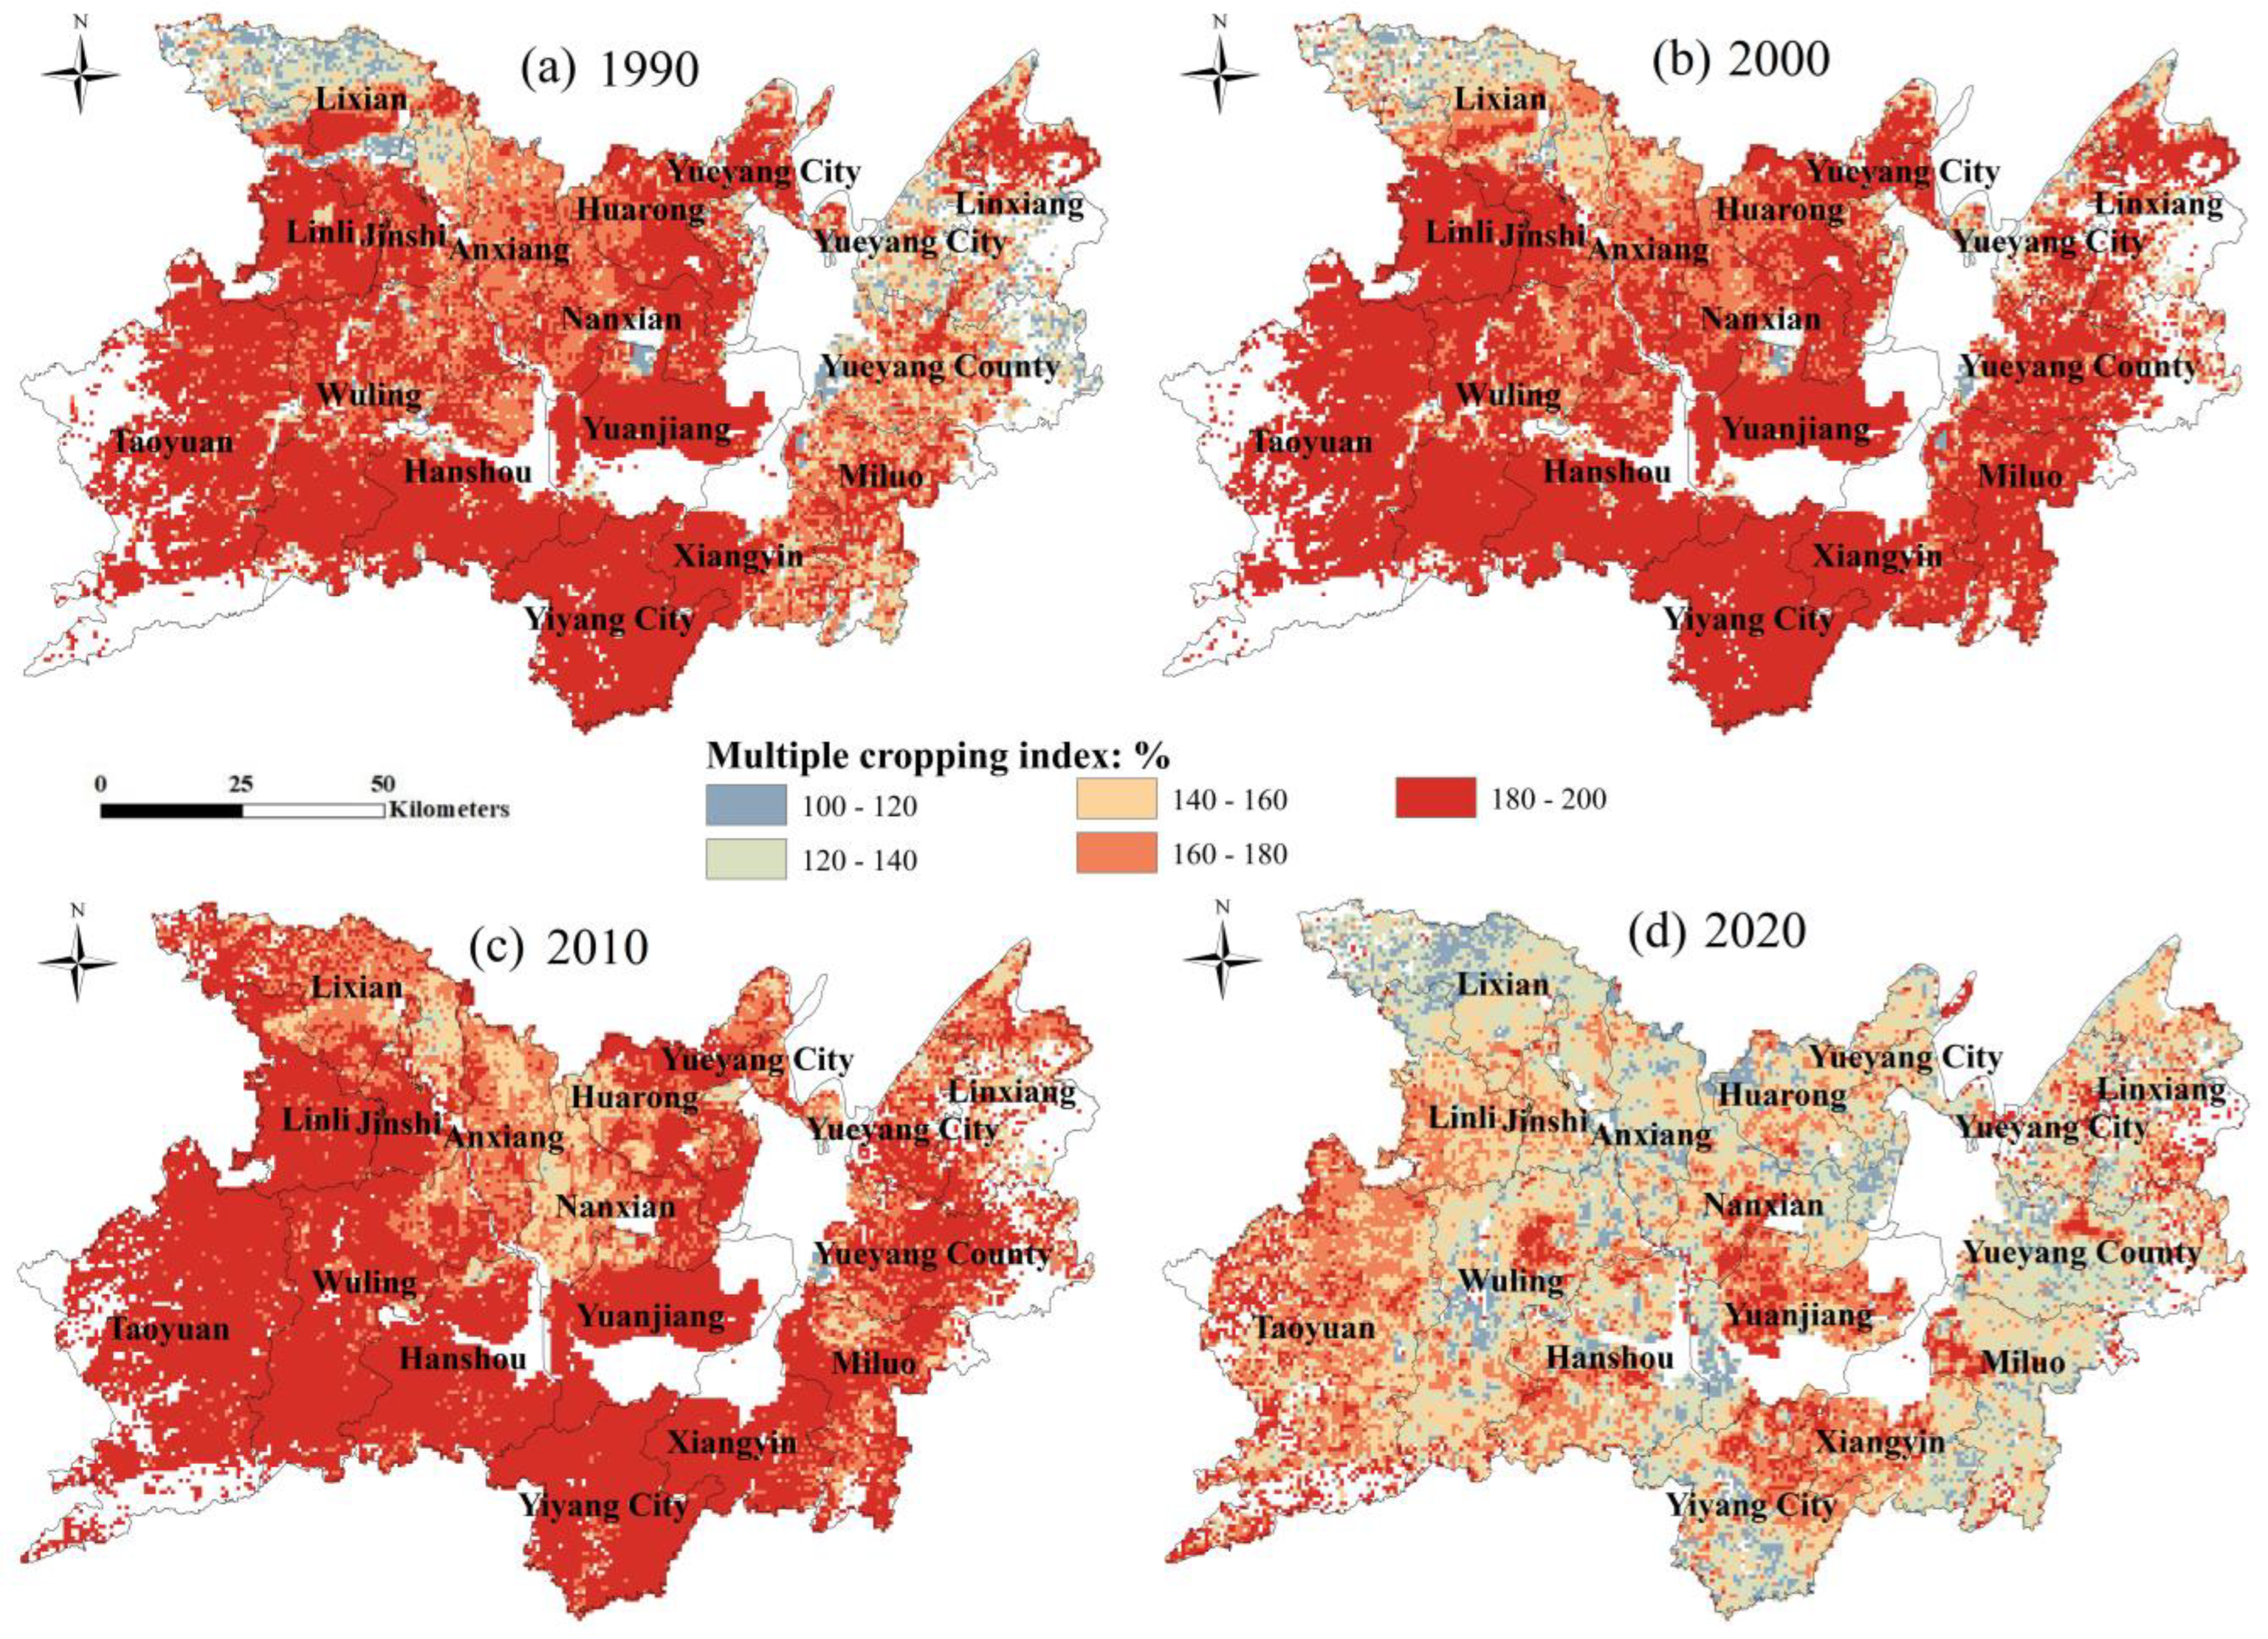
3.1.1. Spatiotemporal Variation of Rice Planting and Multiple Crop Index

Rice was grown in the majority of DTLP’s land throughout the 30 years, and the cultivated area expanded from 5927.66 km2 to 7328.82 km2, according to seven remote sensing images of DTLP taken between 1990 and 2020 (Figure 6). The multiple crop index for rice dropped from 183.68% to 151.98%. The center and northern regions of DTLP held the majority of the single-crop rice planting area, which expanded from 967.61 km2 to 3519.07 km2 (the proportion of rice planting area increased from 16.32% to 48.02%). With the planting area falling from 4960.05 km2 to 3809.75 km2 (the proportion of rice planting area falling from 83.68% to 51.98%), the double-crop rice growing area was concentrated in the central and southern regions of DTLP.
Rice cultivation may be broken down into three stages over the course of 30 years. The planting area for rice, both single-crop and double-crop, decreased from 1990 to 2000, with annual declines of 83.76 km2, 31.60 km2, and 52.16 km2 (14.13%, 32.65%, and 10.52%), respectively. The MCI of rice in the DTLP stayed over 180% during this time (Figure 7 and Figure S3). With the exception of the northern and eastern hilly zones, the MCI of rice was more than 160% based on a 1 km × 1 km grid.
The area planted for rice, single-crop rice, and double-crop rice fluctuated upward from 2000 to 2015, increasing by an average of 99.49 km2, 24.54 km2, and 74.95 km2 (or 29.32%, 56.50%, and 25.33%) per year. The MCI for rice in the DTLP declined initially before rising; the lowest MCI was 168.07% in 2005. The MCI of rice drastically decreased in the center and northern sections of the DTLP, including Anxiang County, Huarong County, and Nanxian County, according to the 1 km × 1 km grid.
The planting area for rice and single-crop rice continued to expand from 2015 to 2020, increasing by an average of 149.27 km2 and 499.85 km2 each year, respectively, whereas the planting area for double-crop rice decreased dramatically, declining by an average of 350.58 km2 per year. The MCI of rice dramatically reduced over this time in the majority of DTLP, and the areas with MCI larger than 180% were mostly found west of Dongting Lake in places like Yuanjiang City, Xiangyin County, and Ziyang District of Yiyang City.

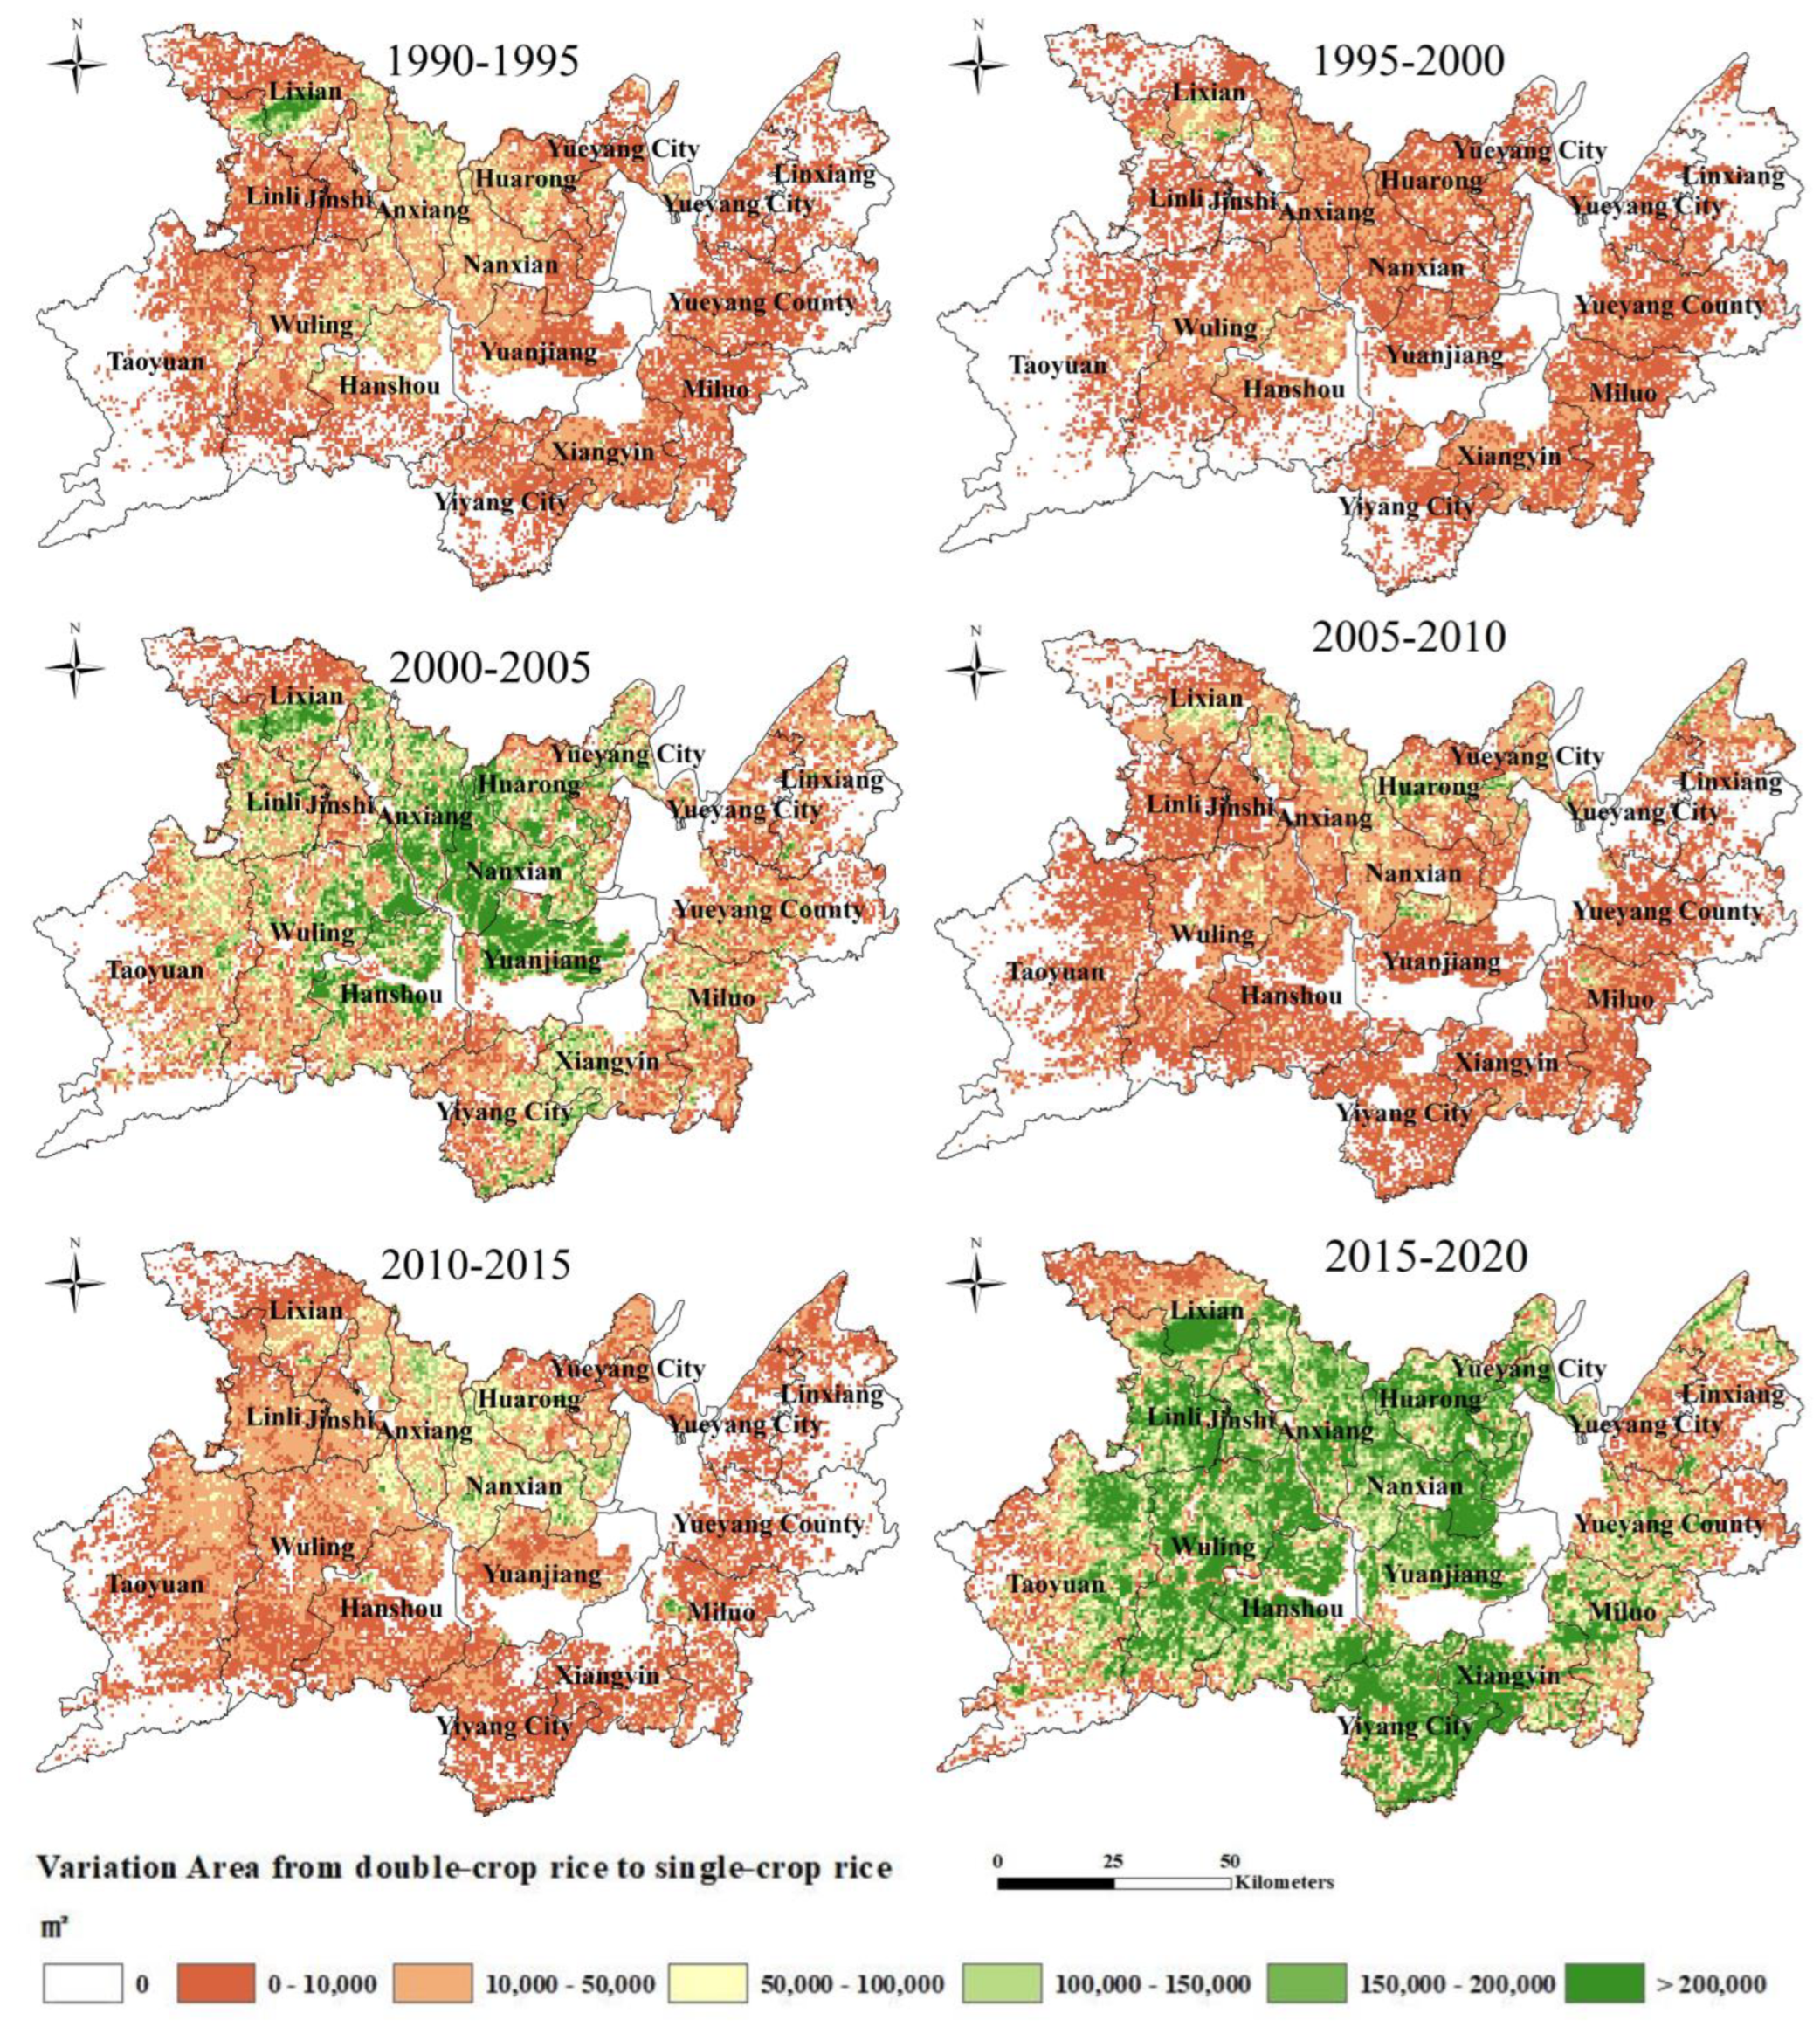
3.1.2. Conversion Characteristics of Single-Crop Rice and Double-Crop Rice

The conversion between single-crop rice and double-crop rice in the DTLP during the six stages in 1990–2020 is the most important way to affect the planting change, accounting for more than 60% of the conversion area (Figure 8 and Figure S4). In 1990–2020, the area of single-crop rice converted to double-crop rice increased from 283.16 km2 to 507.31 km2, accounting for 82.43% and 78.72% of the single-crop rice Areaout, and accounting for 99.78% and 47.57% of the double-crop rice Areain. In the past 30 years, the cultivated land of single-cropping rice converted to double-cropping rice was mainly distributed in the northern part of DTLP. From 1990 to 2020, the cultivated area of double-crop rice converted to single-crop rice increased from 321.17 km2 to 2771.94 km2, accounting for 99.47% and 88.17% of the Areain of single-crop rice, and 73.33% and 98.32% of the Areaout of double-crop rice. In the past 30 years, the spatial distribution of double-crop rice to single-crop rice varied greatly, and the conversion area of double-crop rice to single-crop rice in Northern DTLP was higher than that in Southern DTLP.

3.1.3. Spatiotemporal Variation in STID

The STID of rice planting in the DTLP increased from −97.38% to 66.91% between 1990 and 2020, indicating that the area of rice planting in the DTLP shifted from Areaout to Areain, and the STID revealed an upward trend (Table 2). The Areain showed an increase in the average yearly planting area for rice from 2.35 km2 to 930.86 km2. From 177.18 km2 to 184.51 km2, the yearly Areaout increased.
The STID of single-crop rice increased from −3.10% to 65.98%, indicating that the single-crop rice planting area changed from Areaout to Areain, and the fluctuation range significantly expanded. The average annual Areaout increased from 343.51 km2 to 644.42 km2, and the average annual Areain increased from 322.88 km2 to 3143.69 km2, indicating that the planting area continued to expand.
The STID of double-crop rice decreased from −21.36% to −45.11%, indicating that the planting area continued to expand. The average annual Areaout increased from 437.99 km2 to 2819.35 km2, and the average annual Areain increased from 283.80 km2 to 1066.44 km2.
The conversion area between double-crop rice and non-rice-planting land was found to be much bigger than that between single-crop rice and non-rice-planting land, according to an examination of the overall rice planting transformation. Therefore, compared to single-crop rice, the impact of the change in double-crop rice planting area on changing the STID toward rice planting was substantially greater.

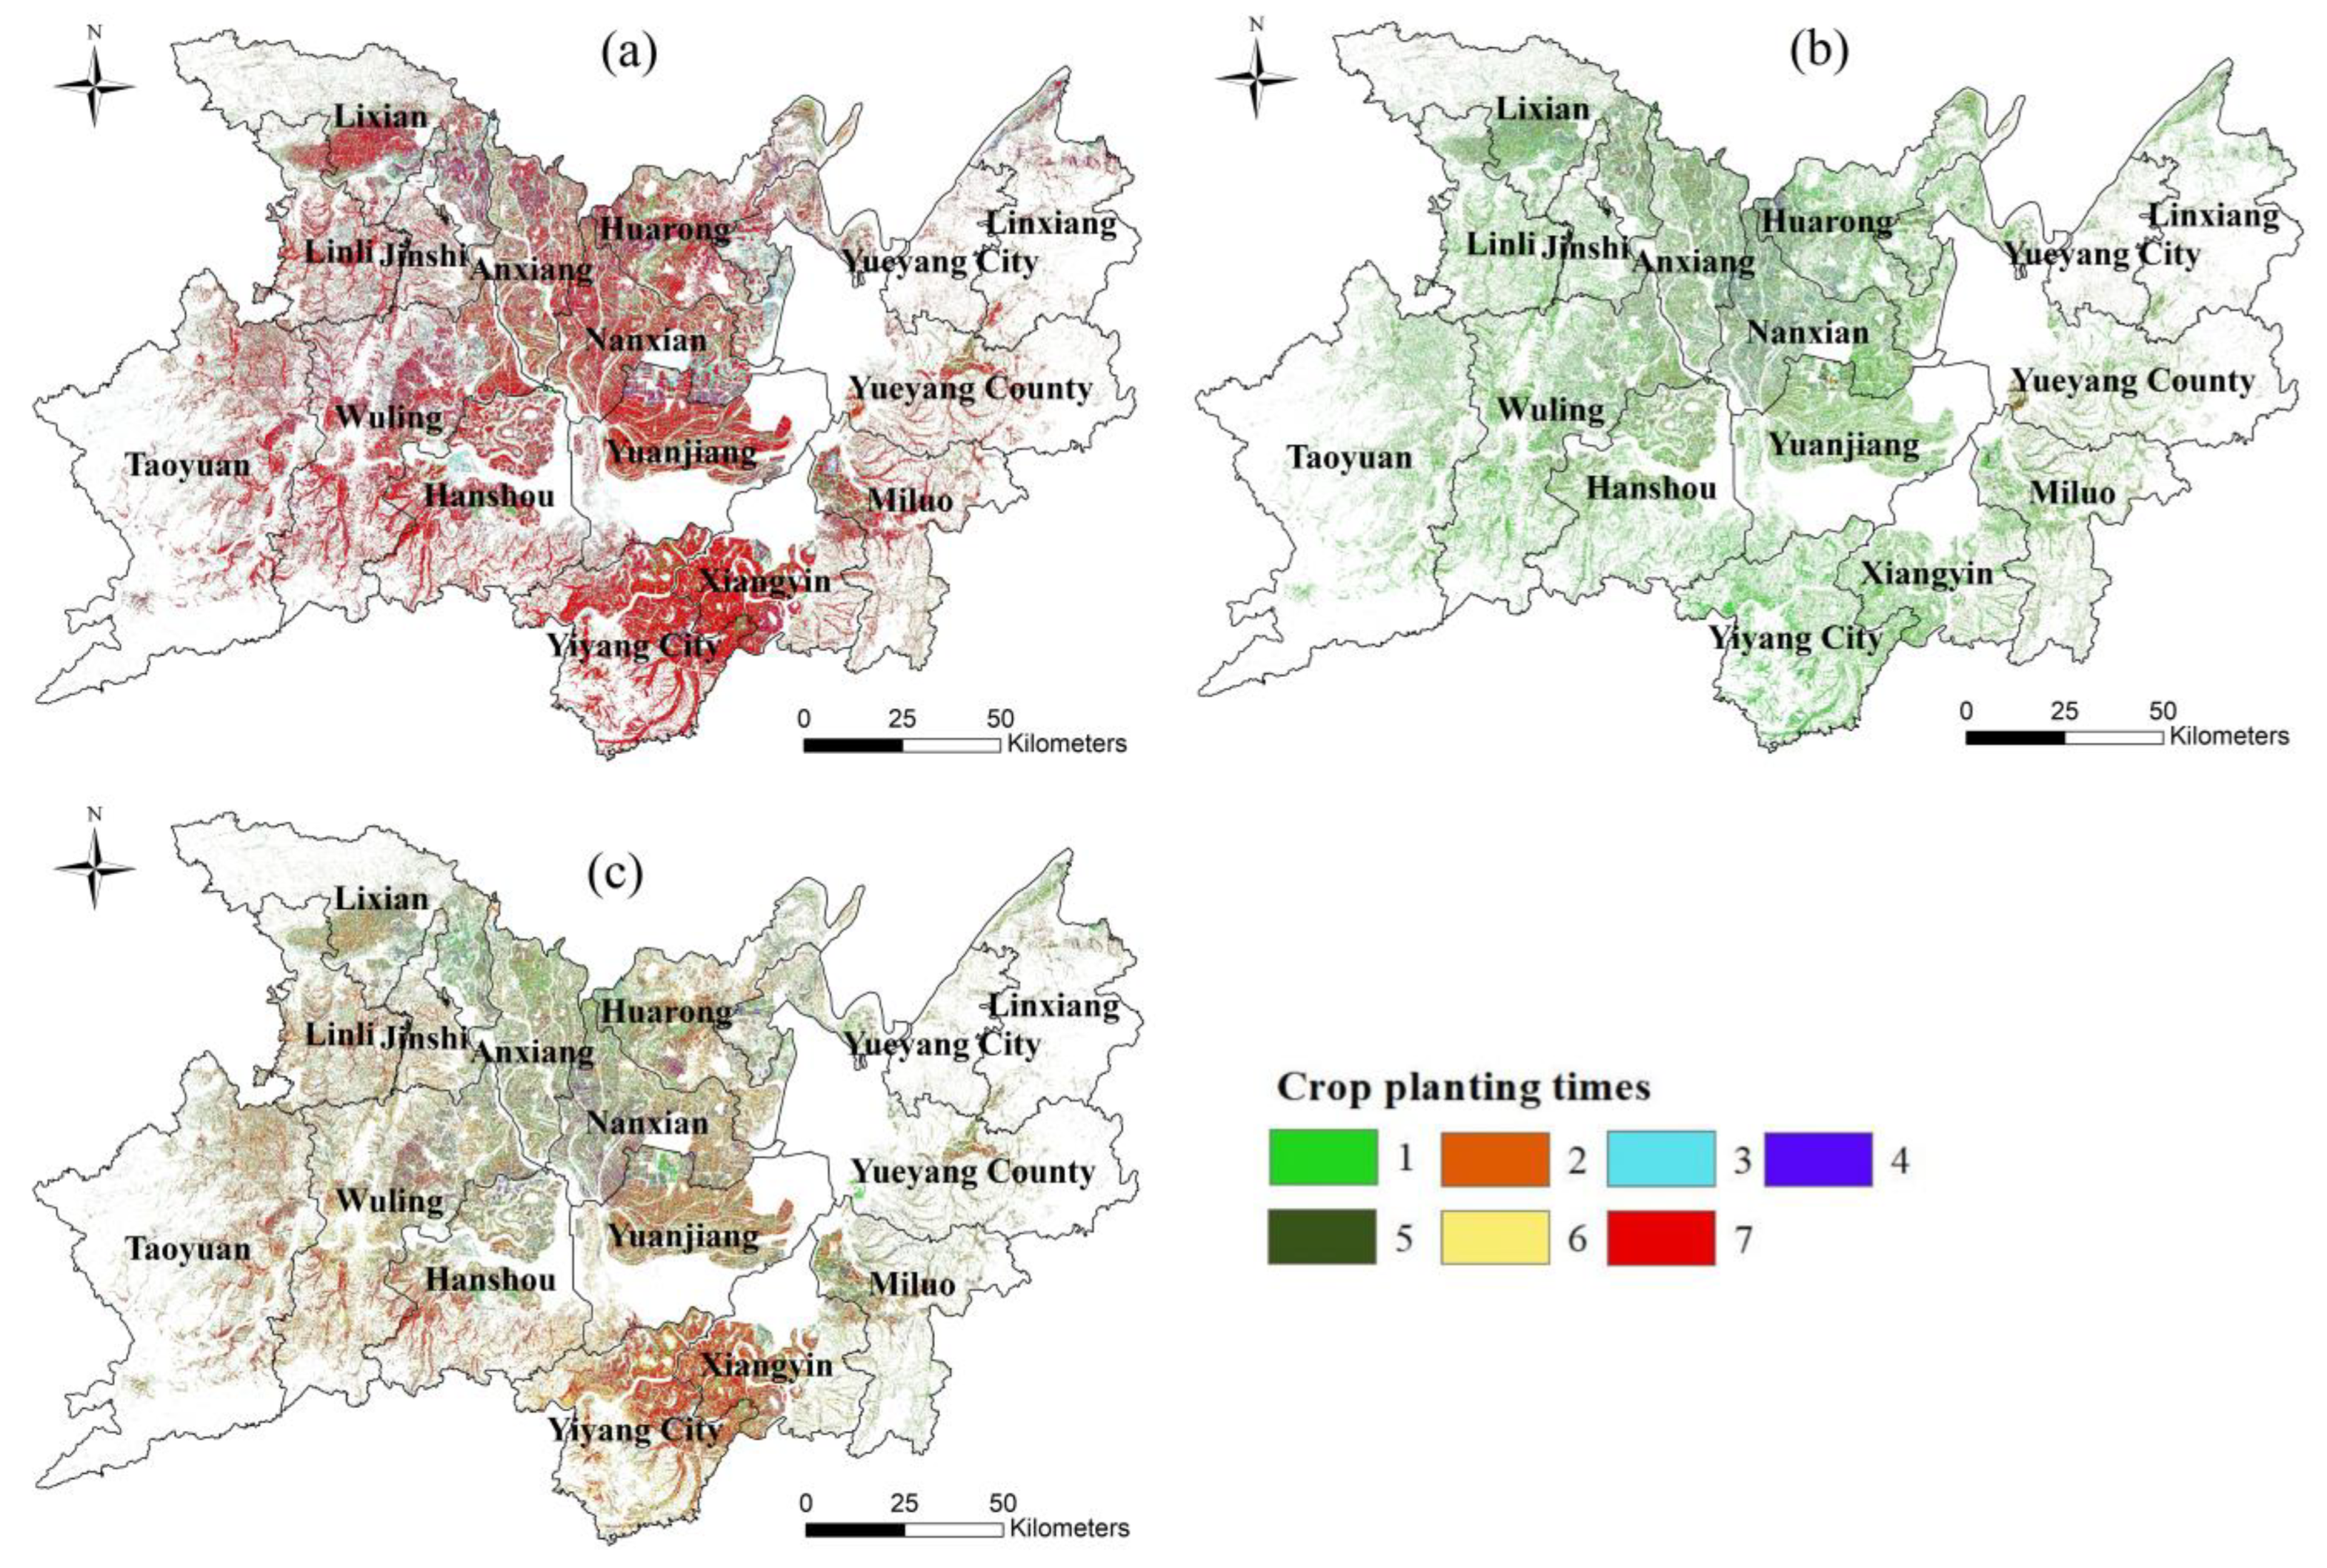
3.1.4. Spatiotemporal Variation in Rice Planting Frequency

The variations in rice planting in the DTLP were depicted at seven successive time nodes between 1990 and 2020, as shown in Figure 9 and Figure 10. The 4524.94 km2 of land that was planted with rice for each of the seven successive time nodes between 1990 and 2020 was dispersed throughout the DTLP. About 1200 km2 is covered by the region with less than three consecutive time nodes, whereas the region with four to six consecutive time nodes is smaller. The number of changes in rice cultivation is mainly 0 and 1, with an area of 4524.94 km2 and 3840.17 km2, respectively. The planting number of single-crop rice was mainly one and primarily grown throughout the previous 30 years, while the other cropping times primarily happened in the middle and northern parts of DTLP. The greater the planting areas, the smaller the planting times. The area is 3572.65 km2 and 1514.88 km2, respectively, with mostly one and two alterations of single-crop rice. Double-crop rice was mostly planted one, two, six, and seven times across an area of roughly 1500 km2 in the past 30 years, primarily in the southwest, center, and west of DTLP. The number of changes in double-crop rice is 0, 1, and 2 and the area is 1346.75 km2, 3618.59 km2, and 2326.41 km2, respectively, and is primarily located in the west of DTLP.

3.2. Stability of Rice Planting

3.2.1. Stability of Rice Planting with 5-Year Intervals

In the DTLP, Table 3 displays the change in the area of cultivated land used for steady rice farming during a 5-year period. Between 1990 and 2020, the extent of steady rice-growing land fluctuated around 5600 km2, with the stable area making up a comparatively high percentage of 87%. The consistent rice-growing area between 1990 and 1995 was 5750.48 km2. The area only reached its lowest point of 4934.16 km2 between 2000 and 2005. After rising for the following 15 years, it peaked in 2015–2020 with an area of 6397.95 km2. With the exception of the southwest mountainous region, the stable agricultural land for rice was broadly dispersed throughout the DTLP over the previous 30 years, and the spatiotemporal structure barely altered. In the majority of the regions, the stable cultivated land area in every 1 km × 1 km grid was more than 0.4 km2 (Figure 11).
The stable arable land of double-crop rice and the conversion area from double-crop rice to single-crop had the most impact on the stability of rice planting, with stable arable land of single-crop rice having less of an impact. In 1990–1995, 1995–2000, and 2010–2015, the stable arable area of double-crop rice was greater than 4000 km2. More than 78% of the stable arable area for rice was devoted to double-crop rice. With just 5.87% and 42.88% of the stable arable area of rice, the stable arable area of single-crop rice and double-crop rice fell to their lowest levels from 2015 to 2020, and only 46.1% and 56.53% of the maximum value in 30 years. In the 1 km × 1 km grid, the stable arable land for single-crop rice was spread between Lixian County, Jinshi City, and Anxiang County, ranging from 0.1 to 0.4 km2, while the stable arable land for double-crop rice was distributed between Hanshou County, Xiangyin County, Yuanjiang City, and the north of Changde City, ranging from 0.2 to 0.8 km2.
In conclusion, double-crop rice’s distribution range has been shrinking in recent years, and as a result, its impact on the stability of rice planting has weakened. In contrast, the conversion of single-crop and double-crop rice has had a significant impact on rice planting stability.

3.2.2. Stability of Rice Planting with 7 Consecutive Periods

Figure 12 shows the results of overlaying the interpreted data from the seven consecutive periods in the DTLP between 1990 and 2020. The steady rice cultivation areas for the previous 30 years were 4524.94 km2, 18.18 km2, and 1379.98 km2 for rice, single-crop rice, and double-crop rice planted seven times, respectively. In the middle and southern portions of the DTLP, the double-crop rice was concentrated in Hanshou County, Xiangyin County, Yuanjiang City, and the north of Changde City with an area of more than 0.4 km2 per 1 km × 1 km grid. However, fewer than 0.1 km2 of single-crop rice is typically planted constantly inside each 1 km × 1 km grid.

4. Discussion

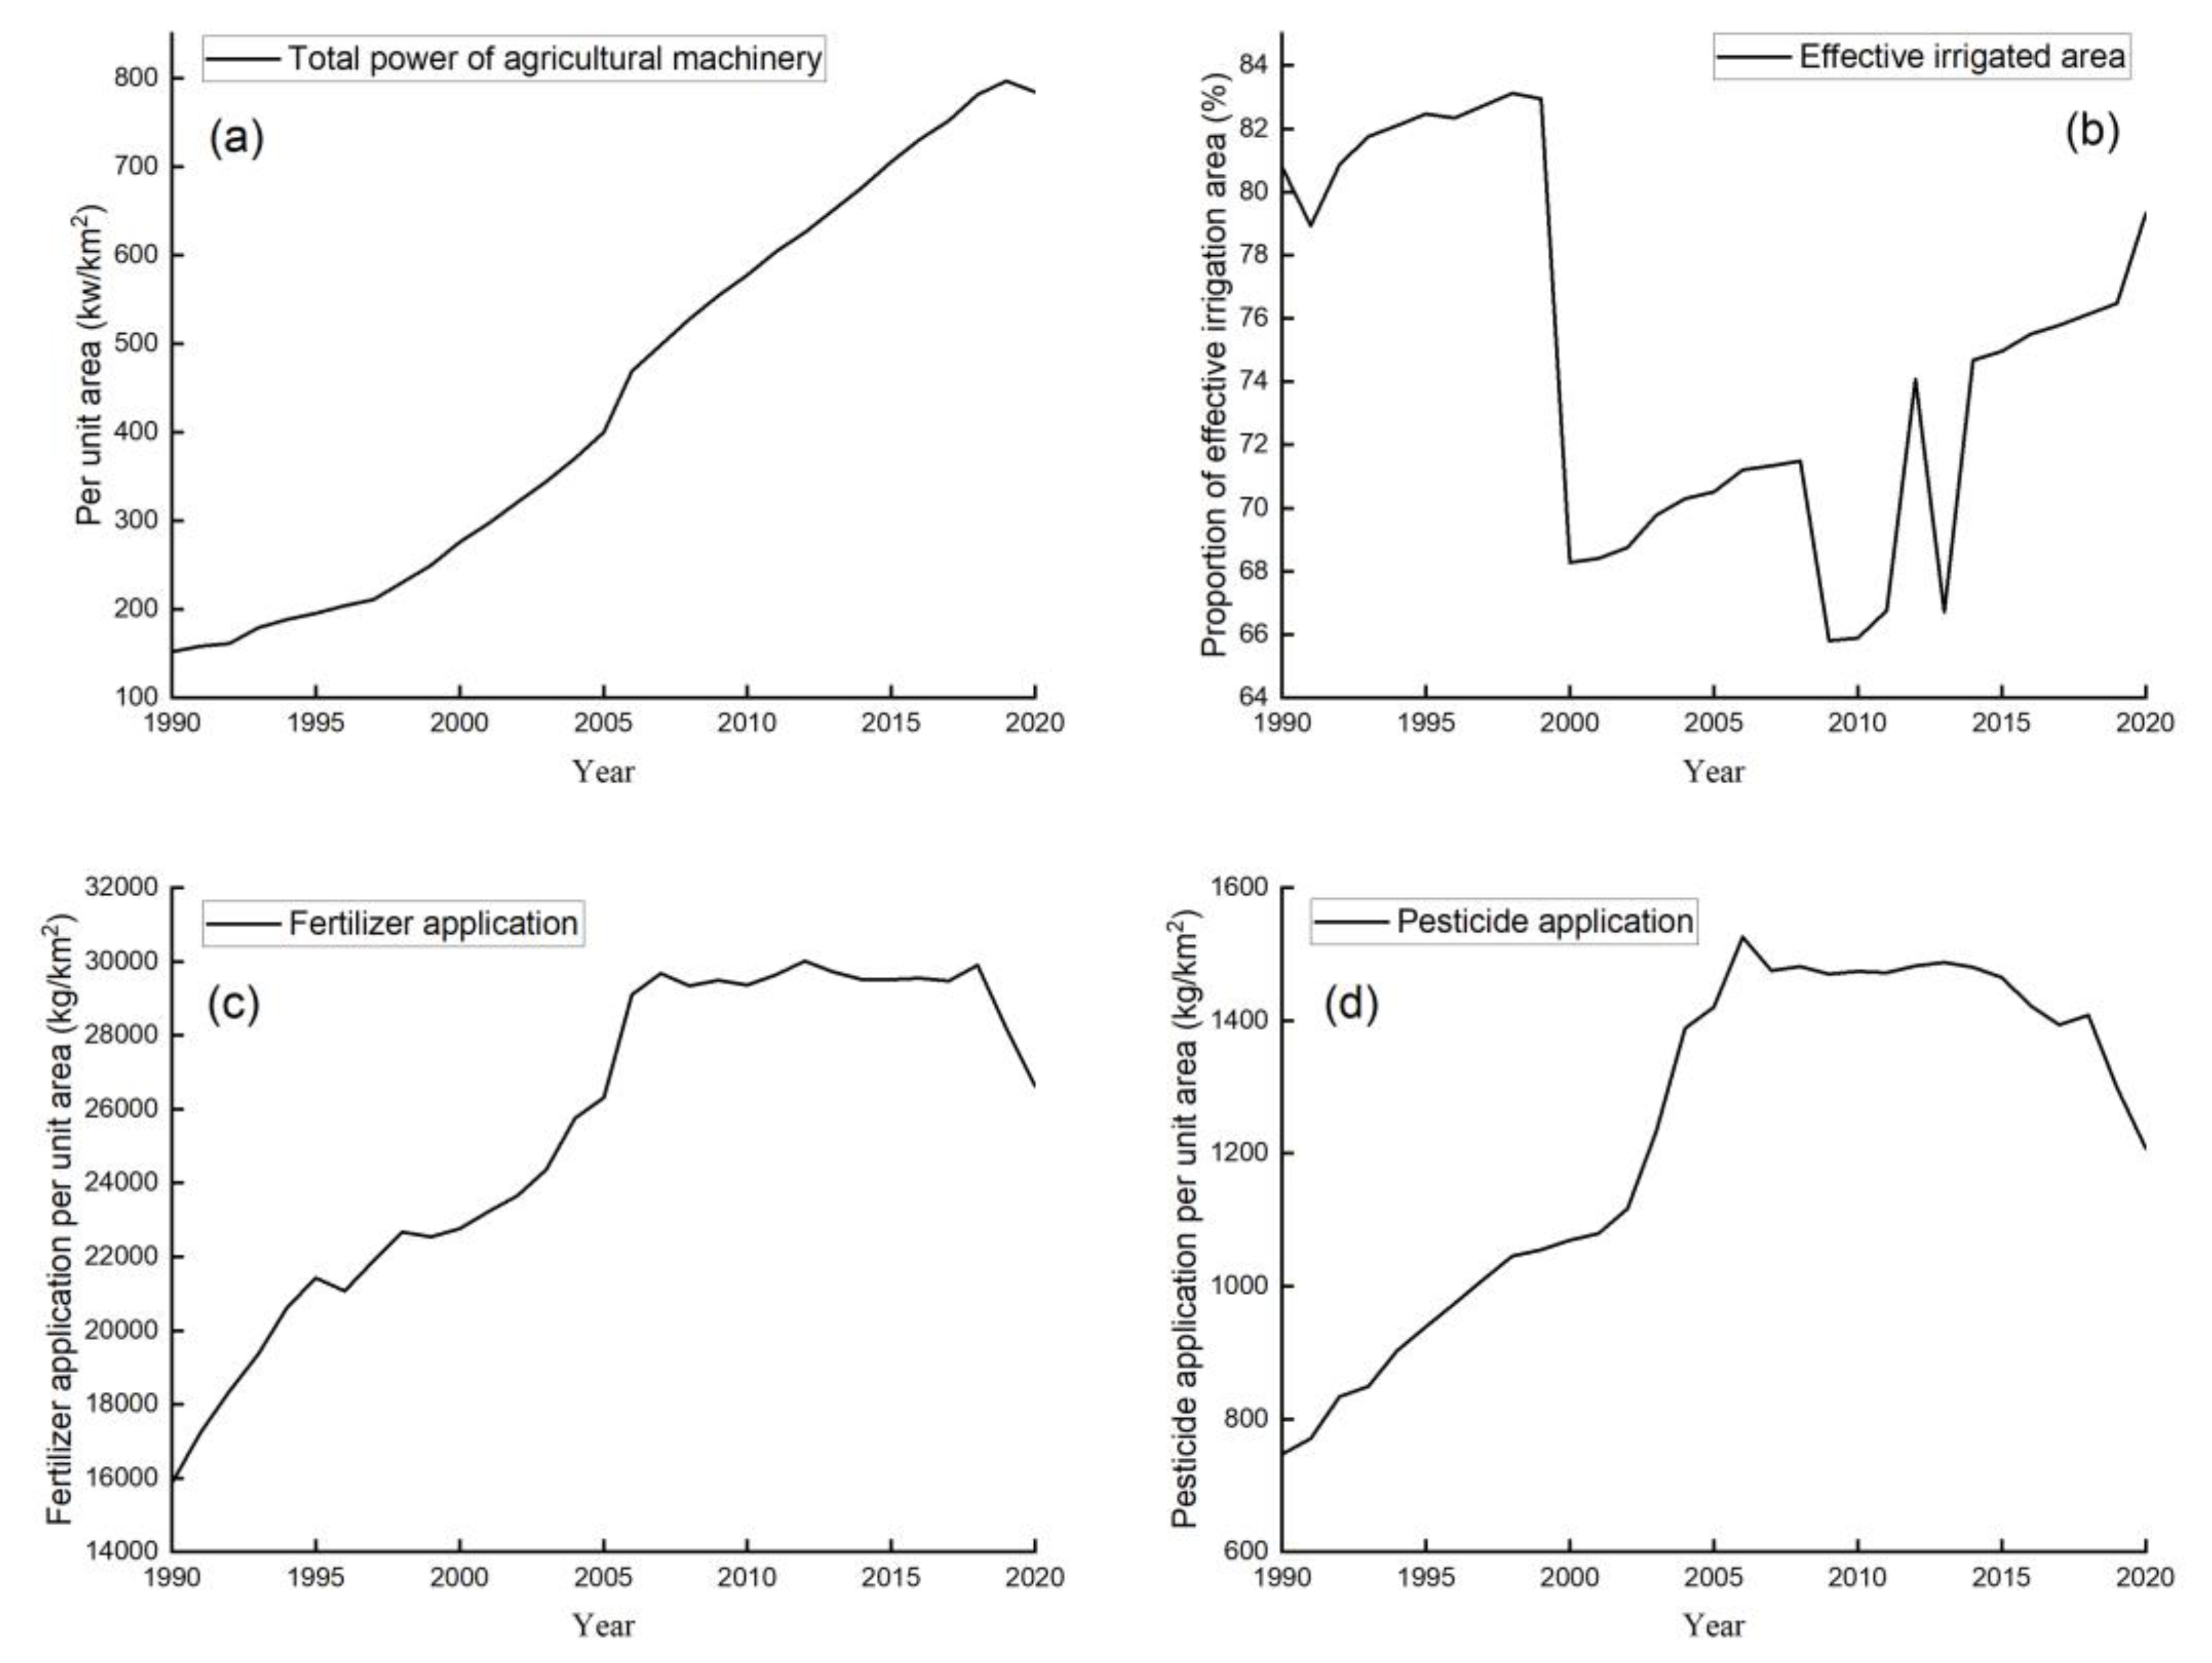
4.1. Agricultural Production Conditions

Despite an increase in the yield of rice per unit, China’s rice production has significantly reduced as a result of a reduction in the planting area (the conversion of double-crop rice to single-crop rice). The trend of production decrease caused by the MCI of rice in the double-crop rice region is consistent with the trend of grain production in China. The factors influencing farmers’ decisions to plant single-crop rice or double-crop rice were examined using the DTLP as an example. On the one hand, the adoption of advantageous agriculture and the quick development of agricultural technology are the key drivers of the conversion of single-crop rice to double-crop rice in the DTLP. China has continued to enhance agricultural input after the agricultural tax was abolished in 2004. Supporting grain production, enhancing the quality of arable land, expanding the seed industry, and averting agricultural disasters are important measures that enhance and benefit agriculture.
Using the lowest purchasing price as an example, early season rice went from CNY 1.4/kg to CNY 2.42/kg, middle-season rice increased from CNY 1.44/kg to CNY 2.54/kg, and late-season rice increased from CNY 1.44/kg to CNY 2.54/kg, all rising by more than 70% between 2004 and 2020. As well as the enhancement of other planting conditions, the use of chemical fertilizers and pesticides are the primary indicators of the advancement of agricultural technology. The production of rice per area increased between 1990 and 2020. Single-crop rice’s yield per unit area grew by 20.97%, from 446.45 kg/mu to 540.08 kg/mu, while double-crop rice’s production per unit area climbed by 3.58%, from 763.70 kg/mu to 791.01 kg/mu (Figure 13) (one mu is equivalent to 1/15 of one hectare and 1/1500 of one square kilometer in China). All of these have kept grain production constant and to some extent relieved the strain on farm jobs.

4.2. Cost and Profit of Rice Cultivation

On the other hand, the low returns of double-crop rice owing to the high cost of planting and the risk of flooding are the major reasons for the switch from double-crop to single-crop rice. The expense and benefit of cultivating rice were on a constant upward trend over the previous 30 years (Figure 14). The price of growing rice increased over time, while the split between labor and land cost varied. Due to the significant decrease in local employment, higher migrant worker earnings directly influence the wages of contracted agricultural labor, increasing the labor expenses associated with grain production. Additionally, there is a lack of agricultural manpower and a trend toward feminization and aging that makes it difficult to carry out high-intensity agricultural production activity. Double-crop rice is less expensive to buy, but it is more difficult to ration than single-crop rice due to its inferior quality. Single-crop rice had a clearly greater per-unit production during the previous five years than double-crop rice. The planting advantage of double-crop rice was negative in 2020, and single-crop rice had a higher net profit of CNY 314.09 than double-crop rice. Therefore, farmers’ excitement for planting double-crop rice will be hampered by a lack of manpower, low prices, and subpar quality. Natural disasters also affect farmers’ choice of planting single-crop and double-crop rice. DTLP is a region prone to flooding in summer. During the rainy season in summer, the early season rice and late rice are at the critical growth period. The risk of double-crop rice planting is higher. In recent years, all regions of DTLP vigorously developed flood avoidance agriculture. Farmers have developed aquaculture, such as crayfish paddies, using the water created by converting paddy fields into ponds. In addition, in recent years, the phenomenon of non-grain farmland is obvious, and rice planting tends to be vegetable planting and other non-grain planting.

4.3. Comparison with Existing Research and Prospects

On the one hand, comparing the existing research [17,46,47], it was found that the conclusions on the spatial distribution characteristics of rice are basically consistent with ours, but the research focus is different. The research of Sang et al. mainly focuses on rice remote sensing recognition and extraction methods and only studies on the current pattern. We not only study the spatial differentiation and temporal variation characteristics of rice patterns but also systematically analyze the impact of socio-economic factors. On the other hand, the spatial pattern of crops is not always unchanged, and the selection of crop categories by agricultural operators has been influenced by various factors such as socio-economic development and national policy guidance. This is also the contribution and innovation of our research to the stability and variability of rice. Dongting Lake is one of the main rice-producing areas in China. Stabilizing the rice planting area is an important measure to ensure national grain security. It is of great practical significance to accurately grasp the rice area, quantitative characteristics, and change trends. Considering the characteristics of rice planting in Dongting Lake, such as complexity, diversity, and frequent changes, the research still has something worth exploring in depth. Due to the limitations of data cloud pollution, we are unable to further strengthen the time scale and can only conduct research at 5-year intervals. The time accuracy of the research still needs to be improved. Meanwhile, in the future, the applicability and differences between different remote sensing data products can be studied to determine the optimal dataset suitable for the region. In the future, the impact of quantitative socio-economic factors on rice cultivation can also be explored.

4.4. Impact Mechanism and Suggestions of Rice Planting

According to our research results, the main reason affecting the stability and variability of rice planting was the cost–profit ratio in Dongting Lake Plain. The economic benefits of farmers planting crops affect their crop selection and planting enthusiasm. The implementation of grain subsidy policies has directly increased the income of grain farmers to a certain extent, stabilized the production area of grain, and mobilized their enthusiasm for grain cultivation. However, in the past five years, the area of rice cultivation has been decreasing year by year, and the marginal benefits of current agricultural policies have been rapidly decreasing. Therefore, socio-economic and agricultural production conditions have a great impact on the spatial distribution of rice.
The Chinese government should improve its current agricultural policies. We propose suggestions from three aspects: Firstly, encourage the transfer of arable land and professional cooperation among grain farmers, and promote the large-scale operation of grain production. The focus of subsidy funds should be shifted toward major grain-producing counties and major grain growers, increasing subsidies for major grain growers and mobilizing their enthusiasm. Secondly, the policy of minimum purchase price for grain has played an important role in supporting and stabilizing grain prices. However, it is recommended to further increase the minimum purchase price for grain and mobilize farmers’ enthusiasm for grain cultivation under relatively stable CPI conditions. Thirdly, the current grain subsidy in China is based on the actual planting area, which has many drawbacks. If the subsidy basis is changed to be based on the amount of commodity grain sold by farmers, it may motivate grain farmers to produce more grain. The more grain farmers sell, the more subsidies they receive, and the higher their enthusiasm for grain cultivation.

5. Conclusions

As China’s most significant traditional commodity grain base, the Dongting Lake Plain experienced regular changes in the spatiotemporal pattern of rice planting. Our research aims included three main aspects: Firstly, the spatiotemporal change in the rice planting area and multiple cropping; Secondly, the transformation properties between single-crop rice and double-crop rice, the stability and variability characteristics of single-crop rice and double-crop rice; Thirdly, the factors influencing changes in rice cultivation.
The findings indicated that the rice planting area has increased by 23.64% over the past 30 years. However, the multiple cropping index decreased by 17.39%. The area of single-crop rice increased by 2.6 times, while the area of double-crop rice decreased by 23.19%. This indicated that the planting intensity of rice has been decreased. The area where rice has been steadily planted for 30 years is approximately 5600 km2, accounting for 87% of all rice planting areas. However, the transformation from double-crop rice to single-crop rice is the most obvious characteristic of internal changes. Especially after 2015, although the rice planting area has increased, the influence of double-crop rice on maintaining rice production has decreased. The main factor affecting the intensity and stability of rice planting was the decrease in farmers’ cost–profit ratio. On the one hand, the planting cost has led farmers to choose more single-crop rice and give up double-crop rice. On the other hand, the marginal benefits of current agricultural policies on rice cultivation have been decreased.
Our research has finely identified the long-term sequence of rice planting patterns and changes, which not only provided a theoretical basis for the refined management of rice but also provided direction and theoretical support for the government to improve agricultural policies. The research also had certain limitations. There were more clouds in the remote sensing image of Dongting Lake Plain, which limited the time resolution. Future research may rely on more detailed data. There were various factors that affect the stability of rice cultivation, and research has provided reasonable explanations from our perspective. Future research may further explore and quantify the comprehensive influencing factors.

Supplementary Materials

The following supporting information can be downloaded at: https://www.mdpi.com/article/10.3390/rs15194814/s1, Figure S1: Flowchart of rice extraction based on phenological vegetation index; Figure S2: Spatial distribution of rice planting in the DTLP; Figure S3: Spatial distribution of rice multiple-crop index in the DTLP based on 1km×1km grid; Figure S4: Spatial distribution of planting area of single-cropping rice to double-cropping rice; Table S1: List of Landsat images used for interpretation; Table S2: List of MOD13Q1 remote sensing images used in this paper; Table S3: Accuracy assessment of main crop spatial distribution maps in 1990–2020 in comparison with statistical data.

Author Contributions

Conceptualization, L.J. and Y.L.; methodology, L.J. and S.W.; software, L.J. and S.W.; validation, L.J. and S.W.; formal analysis, L.J. and Y.L.; investigation, L.J.; resources, L.J. and S.W.; data curation, L.J. and Y.L.; writing—original draft preparation, L.J. and Y.L.; writing—review and editing, L.J. and Y.L.; visualization, L.J. and S.W.; supervision, L.J.; project administration, L.J.; funding acquisition, L.J. All authors have read and agreed to the published version of the manuscript.

Funding

This research was funded by the National Natural Science Foundation of China, grant number 42071253.

Data Availability Statement

Landsat OLI/TM images are available on the United States Geological Survey (USGS) website (https://earthexplorer.usgs.gov/, accessed on 21 March 2021). MOD13Q1 images are available on the National Aeronautics and Space Administration MODIS Data Distribution Center website (https://modis.gsfc.nasa.gov/, accessed on 19 May 2021). DEM (Digital Elevation Model), accumulated temperature, precipitation, and administrative division data are sourced from the Resource and Environmental Science and Data Center of the Chinese Academy of Sciences (https://www.resdc.cn/, accessed on 21 March 2021).

Acknowledgments

The authors thank the editors and anonymous referees for their valuable comments on an earlier version of this manuscript.

Conflicts of Interest

The authors declare no conflict of interest.

References

  1. Galanakis, C.M. The Food Systems in the Era of the Coronavirus (COVID-19) Pandemic Crisis. Foods 2020, 9, 523. [Google Scholar] [CrossRef] [PubMed]
  2. Dijk, M.V.; Morley, T.; Rau, M.L.; Saghai, Y. A meta-analysis of projected global food demand and population at risk of hunger for the period 2010–2050. Nat. Food 2021, 7, 494–501. [Google Scholar] [CrossRef] [PubMed]
  3. Winkler, K.; Fuchs, R.; Rounsevell, M. Global land use changes are four times greater than previously estimated. Nat. Commun. 2021, 12, 2501. [Google Scholar] [CrossRef]
  4. Wang, J.; Lin, Y.; Glendinning, A.; Xu, Y. Land-use changes and land policies evolution in China’s urbanization processes. Land Use Policy 2018, 75, 375–387. [Google Scholar] [CrossRef]
  5. Guneralp, B.G.; Reba, M.; Hales, B.U.; Wentz, E.A.; Seto, K.C. Trends in urban land expansion, density, and land transitions from 1970 to 2010: A global synthesis. Environ. Res. Lett. 2020, 15, 044015. [Google Scholar] [CrossRef]
  6. Kuang, B.; Lu, X.; Zhou, M.; Chen, D. Provincial cultivated land use efficiency in China: Empirical analysis based on the SBM-DEA model with carbon emissions considered. Technol. Forecast. Soc. Chang. 2020, 151, 119874. [Google Scholar] [CrossRef]
  7. Tu, Y.; Chen, B.; Yu, L.; Xin, Q.; Xu, B. How does urban expansion interact with cropland loss? A comparison of 14 Chinese cities from 1980 to 2015. Landsc. Ecol. 2021, 36, 243–263. [Google Scholar] [CrossRef]
  8. Zhou, Y.; Li, X.; Liu, Y. Cultivated land protection and rational use in China. Land Use Policy 2021, 106, 105454. [Google Scholar] [CrossRef]
  9. Zhou, X. Rural land system reforms in China: History, issues, measures and prospects. Land Use Policy 2020, 91, 104330. [Google Scholar] [CrossRef]
  10. Zhou, Y.; Zhong, Z.; Cheng, G. Cultivated land loss and construction land expansion in China: Evidence from national land surveys in 1996, 2009 and 2019. Land Use Policy 2023, 125, 106496. [Google Scholar] [CrossRef]
  11. Wang, J.; Wang, S.; Zhou, C. Quantifying embodied cultivated land-use change and its socioeconomic driving forces in China. Appl. Geogr. 2021, 137, 102601. [Google Scholar] [CrossRef]
  12. Jin, X.; Zhang, Z.; Wu, X.; Xiang, X.; Sun, W.; Bai, Q. Co-ordination of land exploitation, exploitable farmland reserves and national planning in China. Land Use Policy 2016, 57, 682–693. [Google Scholar] [CrossRef]
  13. Song, W.L.M. Farmland conversion decreases regional and national land quality in China. Land Degrad. Dev. 2017, 28, 459–471. [Google Scholar] [CrossRef]
  14. Chen, C.; van Groenigen, K.J.; Yang, H.; Hungate, B.A.; Yang, B.; Tian, Y.; Chen, J.; Dong, W.; Huang, S.; Deng, A.; et al. Global warming and shifts in cropping systems together reduce China’s rice production. Glob. Food Secur. 2020, 24, 100359. [Google Scholar] [CrossRef]
  15. Zhang, N.; Qian, H.; Li, H.; Tang, J.; Yang, T.; Liu, Z.; Liu, Y.; Zhang, B.; Ding, Y.; Jiang, Y. Effect of warming on rice yield and methane emissions in a Chinese tropical double-rice cropping system. Agric. Ecosyst. Environ. 2023, 348, 108409. [Google Scholar] [CrossRef]
  16. Zhang, Z.; Li, Y.; Chen, X.; Wang, Y.; Niu, B.; Liu, D.L.; He, J.; Pulatov, B.; Hassan, I.; Meng, Q. Impact of climate change and planting date shifts on growth and yields of double cropping rice in southeastern China in future. Agric. Syst. 2023, 205, 103581. [Google Scholar] [CrossRef]
  17. Pan, B.; Zheng, Y.; Shen, R.; Ye, T.; Zhao, W.; Dong, J.; Ma, H.; Yuan, W. High Resolution Distribution Dataset of Double-Season Paddy Rice in China. Remote Sens. 2021, 13, 4609. [Google Scholar] [CrossRef]
  18. Waha, K.; Dietrich, J.P.; Portmann, F.T.; Siebert, S.; Herrero, M. Multiple cropping systems of the world and the potential for increasing cropping intensity. Glob. Environ. Chang. 2020, 64, 102131. [Google Scholar] [CrossRef]
  19. Min, J.; Xin, L.; Li, X.; Tan, M.; Wang, R. Decreasing Rice Cropping Intensity in Southern China from 1990 to 2015. Remote Sens. 2018, 11, 35. [Google Scholar]
  20. Yang, R.; Luo, X.; Xu, Q.; Zhang, X.; Wu, J. Measuring the Impact of the Multiple Cropping Index of Cultivated Land during Continuous and Rapid Rise of Urbanization in China: A Study from 2000 to 2015. Land 2021, 10, 491. [Google Scholar] [CrossRef]
  21. Wang, J.; Zhang, Z.; Liu, Y. Spatial shifts in grain production increases in China and implications for food security. Land Use Policy 2018, 74, 204–213. [Google Scholar] [CrossRef]
  22. Chu, L.; Jiang, C.; Wang, T.; Li, Z.; Cai, C. Mapping and forecasting of rice cropping systems in central China using multiple data sources and phenology-based time-series similarity measurement. Adv. Space Res. 2021, 68, 3594–3609. [Google Scholar] [CrossRef]
  23. Han, J.; Zhang, Z.; Luo, Y.; Cao, J.; Zhang, L.; Zhuang, H.; Cheng, F.; Zhang, J.; Tao, F. Annual paddy rice planting area and cropping intensity datasets and their dynamics in the Asian monsoon region from 2000 to 2020. Agric. Syst. 2022, 200, 103437. [Google Scholar] [CrossRef]
  24. Mishra, B.; Busetto, L.; Boschetti, M.; Laborte, A.; Nelson, A. RICA: A rice crop calendar for Asia based on MODIS multiyear data. Int. J. Appl. Earth Obs. Geoinf. 2021, 103, 102471. [Google Scholar] [CrossRef]
  25. Soriano-González, J.; Angelats, E.; Martínez-Eixarch, M.; Alcaraz, C. Monitoring rice crop and yield estimation with Sentinel-2 data. Field Crops Res. 2022, 281, 108507. [Google Scholar] [CrossRef]
  26. Assefa, Y.; Yadav, S.; Mondal, M.K.; Bhattacharya, J.; Parvin, R.; Sarker, S.R.; Rahman, M.; Sutradhar, A.; Prasad, P.V.; Bhandari, H.; et al. Crop diversification in rice-based systems in the polders of Bangladesh: Yield stability, profitability, and associated risk. Agric. Syst. 2021, 187, 102986. [Google Scholar] [CrossRef]
  27. Luo, Y.C.; Zhang, Z.; Li, Z.Y. Identifying the spatiotemporal changes of annual harvesting areas for three staple crops in China by integrating multi-data sources. Environ. Res. Lett. 2020, 15, 074003. [Google Scholar] [CrossRef]
  28. Hashemi, M.G.Z.; Abhishek, A.; Jalilvand, E.; Jayasinghe, S.; Andreadis, K.M.; Siqueira, P.; Das, N.N. Assessing the impact of Sentinel-1 derived planting dates on rice crop yield modeling. Int. J. Appl. Earth Obs. Geoinf. 2022, 114, 103047. [Google Scholar] [CrossRef]
  29. Yang, Q.; Shi, L.; Han, J.; Chen, Z.; Yu, J. A VI-based phenology adaptation approach for rice crop monitoring using UAV multispectral images. Field Crops Res. 2022, 277, 108419. [Google Scholar] [CrossRef]
  30. de Bem, P.P.; de Carvalho Júnior, O.A.; de Carvalho, O.L.F.; Gomes, R.A.T.; Guimarāes, R.F.; Pimentel, C.M.M. Irrigated rice crop identification in Southern Brazil using convolutional neural networks and Sentinel-1 time series. Remote Sens. Appl. Soc. Environ. 2021, 24, 100627. [Google Scholar]
  31. Li, B.; Peng, S.; Shen, R.; Yang, Z.-L.; Yan, X.; Li, X.; Li, R.; Li, C.; Zhang, G. Development of a new index for automated mapping of ratoon rice areas using time-series normalized difference vegetation index imagery. Pedosphere 2022, 32, 576–587. [Google Scholar] [CrossRef]
  32. Liang, S.; Bai, R.; Chen, X. Review of the development of land table quantitative remote sensing in China in 2019. J. Remote Sens. 2020, 24, 618–671. [Google Scholar]
  33. Zhang, L.; Zhang, Y. Object-oriented crop classification based on UAV remote sensing imagery. Glob. Geol. 2022, 25, 60–68. [Google Scholar]
  34. Quan, J.; Wang, Y.; Wang, X. Extraction of Rice Planting Area in Dabie Mountain by Remote Sensing Image: Taking Landsat 8 as an Example. Chin. Agric. Sci. Bull. 2019, 35, 104–111. [Google Scholar]
  35. Han, H. Dynamic Monitoring and Automatic Extraction of Land Use Change Information with Supervised Classification. Master’s Thesis, Changan University, Xi’an, China, 2012. [Google Scholar]
  36. Feng, Q.; Yang, L.; Wang, W. Remote sensing crop classification by convolutional neural network based on temporal spectral reconstruction. J. Univ. Chin. Acad. Sci. 2020, 37, 619–628. [Google Scholar]
  37. Pradeep, K.; Gupta, D.K.; Varun, N.M. Comparison of support vector machine, artificial neural network, and spectral angle mapper algorithms for crop classification using LISS IV data. Int. J. Remote Sens. 2015, 36, 1604–1617. [Google Scholar]
  38. Hunt, M.L.; Blackburn, G.A.; Carrasco, L. High resolution wheat yield mapping using Sentinel-2. Remote Sens. Environ. 2019, 233, 111410–111425. [Google Scholar] [CrossRef]
  39. Dobrini, D.; Gaparovi, M.; Medak, D. Sentinel-1 and 2 time-series for vegetation mapping using random forest classification: A case study of northern Croatia. Remote Sens. 2021, 13, 2321. [Google Scholar] [CrossRef]
  40. Du, B.; Zhang, J.; Wang, Z. Applied Sentinel-2A NDVI time-series and object-oriented decision tree methods for crop classification. J. Earth Inf. Sci. 2019, 21, 740–751. [Google Scholar]
  41. Wang, X.; Han, L.; Yang, J. Multi-characterized winter wheat area extraction under a combination of Sentinel-2 and Landsat 8 data. Surv. Mapp. Bull. 2022, 3, 111–115. [Google Scholar]
  42. Gong, P.; Liu, H.; Zhang, M. Stable classification with limited sample: Transferring a 30-m resolution sample set collected in 2015 to mapping 10-m resolution global land cover in 2017. Sci. Bull. 2019, 64, 370–373. [Google Scholar] [CrossRef]
  43. Wang, D.; Fang, S.; Wang, Z. Rape seed extraction study based on spectral and color characteristics. Trans. Chin. Soc. Agric. Mach. 2018, 49, 158–165. [Google Scholar]
  44. Mi, S.; Tan, X.; Tan, J.; Jiang, L.; Wang, Z. Analysis of influencing factors of rice planting area evolution in Dongting Lake Area during 1987–2017. J. Nat. Resour. 2020, 35, 2499–2510. [Google Scholar] [CrossRef]
  45. Zhang, M.; Zeng, Y. Mapping paddy fields of Dongting Lake area by fusing Landsat and MODIS data. Trans. Chin. Soc. Agric. Eng. 2015, 31, 178–185. [Google Scholar] [CrossRef]
  46. Sang, G.; Tang, Z.; Mao, K.; Deng, G.; Wang, J.; Li, J. High-resolution paddy rice mapping using Sentinel data based on GEE platform:a case study of Hunan province, China. Acta Agron. Sin. 2022, 48, 2409–2420. [Google Scholar]
  47. Jiang, L.; Wu, S.; Liu, Y. Change Analysis on the Spatio-Temporal Patterns of Main Crop Planting in the Middle Yangtze Plain. Remote Sens. 2022, 14, 1141. [Google Scholar] [CrossRef]
Figure 1. Location and DTLP’s geographical surroundings: (a) Spatial distribution of ≥10 °C accumulated temperature and location of Hunan Province in China; (b) Spatial distribution of annual average precipitation of Hunan province and location of the DTLP; and (c) Spatial distribution of elevation in the DTLP.
Remotesensing 15 04814 g001
Figure 2. Phenological calendar of main crops in the DTLP. Day of year (DOY) represented the end time of the phenological period.
Remotesensing 15 04814 g002
Figure 3. Vegetation index change curves of typical features in the DTLP: (a,b) were the NDVI and EVI change curves of land use types; (c,d) was the NDVI and EVI change curves of crops.
Remotesensing 15 04814 g003
Figure 4. Spatial distribution of rice planting in the DTLP in 1990–2020: (a) 1990; (b) 2000; (c) 2010; (d) 2020.
Remotesensing 15 04814 g004
Figure 5. Distribution map of verification points for accuracy evaluation of single-cropping and double-cropping rice.
Remotesensing 15 04814 g005
Figure 6. Spatial distribution of rice planting area in the DTLP from 1990 to 2020 based on 1 km × 1 km grid: (a) Spatial distribution of rice planting area in the DTLP in 1990 and 2020; (b) Spatial distribution of single-crop rice planting area in the DTLP in 1990 and 2020; (c) Spatial distribution of double-crop rice planting area in the DTLP in 1990 and 2020.
Remotesensing 15 04814 g006
Figure 7. Spatial distribution of rice multiple crop index (MCI) in the DTLP from 1990 to 2020 based on 1 km × 1 km grid: (a) 1990 (b) 2000; (c) 2010; (d) 2020.
Remotesensing 15 04814 g007
Figure 8. Spatial distribution of planting area of double-cropping rice to single-cropping rice.
Remotesensing 15 04814 g008
Figure 9. Planting times of seven consecutive time nodes in the DTLP in 1990–2020: (a) rice; (b) single-crop rice; (c) double-crop rice. For example, the “3” in the legend represented that rice was planted three times in one grid in the seven consecutive time nodes. The other numbers were similar.
Remotesensing 15 04814 g009
Figure 10. Changing times of seven consecutive time nodes in the DTLP in 1990–2020: (a) rice; (b) single-crop rice; (c) double-crop rice. For example, the “3” in the legend represented that rice planting was changed three times in one grid in the seven consecutive time nodes. The other numbers were similar.
Remotesensing 15 04814 g010
Figure 11. Spatial distribution of stable arable area of rice in the DTLP in 1990–2020 based on 1 km × 1 km grid: (a) Spatial distribution of stable arable area of single-crop in 1990–1995, 1995–2000, 2000–2005, 2005–2010, 2010–2015, and 2015–2020; (b) Spatial distribution of stable arable area of double-crop rice in 1990–1995, 1995–2000, 2000–2005, 2005–2010, 2010–2015, and 2015–2020.
Remotesensing 15 04814 g011
Figure 12. Spatial distribution of stable arable area of rice of seven consecutive time nodes in the DTLP based on 1 km × 1 km grid: (ac) Spatial distribution of stable arable area of rice, single-crop rice, and double-crop rice.
Remotesensing 15 04814 g012
Figure 13. Agricultural production conditions and production efficiency in Hunan Province in 1990–2020: (a) Total power of agricultural machinery; (b) The proportion of effective irrigated area; (c) Fertilizer application; (d) Pesticide application. One mu is equivalent to 1/15 of one hectare and 1/1500 of one square kilometer in China, where it is a regularly used unit of measurement.
Remotesensing 15 04814 g013
Figure 14. Cost and profit of rice cultivation in Hunan Province in 1990–2020: (a) Proportion of various costs for single-cropping rice; (b) Proportion of various inputs for double-cropping rice; (c) Net profit and cost–profit ratio of single-cropping rice; (d) Net profit and cost–profit ratio of double-cropping rice; (e) Total cost and net profit of rice. One mu is equivalent to 1/15 of a hectare and 1500 square kilometers in China, where it is a regularly used unit of measurement.
Remotesensing 15 04814 g014
Table 1. Accuracy assessment of single- and double-cropping rice maps in comparison with validation samples (1990–2020).
Year1990199520002005201020152020
Overall accuracy/%89.693.494.393.193.694.193.8
Kappa coefficient0.810.860.870.860.860.870.86
Producers accuracy/%82.386.589.086.187.187.587.2
User accuracy/%93.596.598.596.897.398.197.5
Table 2. Changes in rice planting area in the DTLP in six stages in 1990–2020 (km2).
Change Features1990–19951995–20002000–20052005–20102010–20152015–2020
RiceSTDI−97.3891.9268.6449.8321.3766.91
Areain *2.35691.85838.561114.29377.63930.86
other to SR *1.71248.7064.230.3082.49371.74
other to DR *0.64443.15774.331113.99295.13559.12
Areaout *177.1829.13155.95373.13244.62184.51
SR to other60.3615.72147.10214.71133.68137.10
DR to other116.8213.418.85158.41110.9447.41
SRSTDI−3.1059.6975.11−56.21−7.5665.98
Areain322.88395.051365.42282.77471.493143.69
DR to SR321.17146.341301.19282.47389.002771.94
other to SR1.71248.7064.230.3082.49371.74
Areaout343.5199.71194.071008.78548.66644.42
SR to DR283.1683.9946.96794.06414.98507.31
SR to other60.3615.72147.10214.71133.68137.10
DRSTDI−21.3653.49−25.1962.4617.37−45.11
Areain283.80527.13821.291908.06710.121066.44
SR to DR283.1683.9946.96794.06414.98507.31
other to DR0.64443.15774.331113.99295.13559.12
Areaout437.99159.751374.26440.88499.942819.35
DR to SR321.17146.341365.42282.47389.002771.94
DR to other116.8213.418.85158.41110.9447.41
* SR represents single-crop rice; DR represents double-crop rice; STDI represents spatiotemporal dynamic index; Areain and Areaout represent the area of rice cultivated land converted to other land types and the area of other land converted to rice cultivated land, respectively; other to SR and other to DR represents the conversion of non-rice land to single-crop and double-crop rice, respectively; SR to other and DR to other represents the conversion of single-crop and double-crop rice to non-rice land, respectively; DR to SR and SR to DR represents the conversion between single-crop rice or double-crop rice, respectively.
Table 3. Cultivated land area under stable rice cultivation in the DTLP in 1990–2020.
Stability Features1990–19951995–20002000–20052005–20102010–20152015–2020
Areastable km2Rice5750.485060.984934.165335.366204.846397.95
SR *624.1551.93457.58814.22548.31375.39
DR *4522.054278.713064.23444.614852.552743.31
SI %Rice96.9787.5384.1478.290.8985.15
SR48.3652.7322.6938.6734.969.02
DR86.2486.1758.2659.4680.0441.38
* SR stands for single-crop rice; DR stands for double-crop rice; SI stands for stability index; Areastable stands for the area of cultivated land under stable rice cultivation.
Disclaimer/Publisher’s Note: The statements, opinions and data contained in all publications are solely those of the individual author(s) and contributor(s) and not of MDPI and/or the editor(s). MDPI and/or the editor(s) disclaim responsibility for any injury to people or property resulting from any ideas, methods, instructions or products referred to in the content.

