Article

A Case Study on the Convection Initiation Mechanisms over the Northern Edge of Tarim Basin, Xinjiang, Northwest China

1
Xinjiang Key Laboratory of Oasis Ecology, College of Geography and Remote Sensing Sciences, Xinjiang University, Urumqi 830017, China
2
Institute of Desert Meteorology, China Meteorological Administration (CMA), Urumqi 830002, China
3
National Observation and Research Station of Desert Meteorology, Taklimakan Desert of Xinjiang, Urumqi 830002, China
4
Taklimakan Desert Meteorology Field Experiment Station China Meteorological Administration, Urumqi 830002, China
5
Xinjiang Key Laboratory of Desert Meteorology and Sandstorm, Urumqi 830002, China
6
Field Scientific Observation Base of Cloud Precipitation Physics in West Tianshan Mountains, Urumqi 830002, China
7
Xinjiang Cloud Precipitation Physics and Cloud Water Resources Development Laboratory, Urumqi 830002, China
8
Key Laboratory of Mesoscale Severe Weather (Ministry of Education), School of Atmospheric Sciences, Nanjing University, Nanjing 210023, China
*
Author to whom correspondence should be addressed.
These authors contributed equally to this work.
Remote Sens. 2023, 15(19), 4812; https://doi.org/10.3390/rs15194812
Submission received: 29 August 2023 / Revised: 25 September 2023 / Accepted: 30 September 2023 / Published: 3 October 2023

Abstract

:
The convection initiation (CI) mechanisms of severe storms have received increasing attention because severe storms have been occurring more frequently around the globe in recent years. In this work, the CI mechanisms of severe convective weather associated with a gust front (GF) which occurred on 9 July 2016, near the Korla at the northern edge of the Tarim Basin, Xinjiang, is investigated using observational data including Doppler weather radar data and automatic weather stations data, and high-resolution numerical simulation data. The results showed that, during the eastward movement of the GF, a number of convective cells were successively triggered in the vicinity of the GF, which developed rapidly and continuously merged with the convective system from behind, resulting in the further development and maintenance of this convective system. According to the diagnostic analysis of vertical acceleration which can be decomposed into dynamic acceleration ( a d ) and buoyant acceleration ( a b ), it was found that both a d (up to ~4 × 10⁻³ m s−2) and a b (up to ~7 × 10⁻³ m s−2) made positive contributions to the CI. Further analyses based on the decompositions of the a d and a b revealed that the extension term was the main contributor for the a d , while the warming of the dry air due to the release of latent heat from the precipitation condensate made the major contribution to the a b . The extension term indicates the elevated convergence jointly induced by the airflow of mid-level horizontal convective rolls (MHCRs) and updraft flow near the leading edge of the GF. The jointly induced elevated convergent updraft can be considered to be an important contributor for the CI mechanisms.

1. Introduction

Severe convective weather is usually regarded as a serious and catastrophic weather phenomenon, which usually causes extreme weather events such as heavy rainfall, hail, destructive high winds, and sometimes tornadoes, leading to serious human casualties and economic losses [1,2,3,4,5]. In recent years, the frequency of such weather phenomena has further increased, with serious impacts on economic constructions, social development, and people’s lives [6,7,8,9,10,11]. Despite significant improvements in weather forecasting techniques in recent decades, the accurate prediction and issuance of warnings for severe convective weather in a short period of time remain extremely difficult, and forecasting the convection initiation (CI) (i.e., the process whereby air parcels reach their level of free convection, then obtain and maintain positive buoyancy over a significant upward movement, and, finally, initiate a deep convective cloud), in particular, remains an important challenge in the field of weather forecasting [12,13,14,15,16,17,18].
In recent years, several conceptual models of CI mechanisms have been developed through fine-grained observational analyses and numerical simulations of convective systems, and a number of key thermodynamic metrics have been identified for the identification of CI [19,20,21,22,23,24,25,26,27,28]. Lock and Houston [29] calculated and analyzed multiple thermodynamic and dynamic factors in their study of 55,000 CI events that occurred in the United States. They concluded that buoyancy, inhibition, dilution, and lift were the four most critical factors in determining the CI. The study also noted that, while none of the four factors alone could identify the critical conditions for CI, the lift factor was the most commonly used among these factors to identify whether a CI is about to occur. Markowski [30] also pointed out the importance of the lift during the CI, and the lifts generated due to some converging boundaries such as sea-breeze fronts, drylines, and gust fronts (GFs) are the most common contributors associated with the CI.
After precipitation occurs, the descending raindrops generated relatively a cold and moist descending flow due to the evaporative cooling and dragging effect of the raindrops, thus causing a significant decline in the temperature and increase in the relative humidity in the near-surface airmass below the precipitation system. This kind of cold and moist airmass is usually called a cold pool (CP) [14,17,31,32,33]. The boundary of this CP interacts with the ambient airflow to generate a mesoscale boundary, i.e., the gust front (GF). In the regions near the leading edge of the GFs, the airflow from the CP interacts with the ambient airflow and sometimes may continuously trigger convective cells, resulting in the formation of local convective precipitation systems. Jeong et al. [34] studied a mesoscale convective system (MCS) in southeastern Korea and found that CI recur near the GF. They concluded that the CP played a crucial role in the stabilization of the MCS, leading to extreme rainfall in Busan. In Yu and Lin’s study [35], they investigated the evolutionary mechanism of the formation of a convective line along the east coast of Taiwan that lasted for more than 36 h. In addition to evaporative cooling by precipitation, they found that topographic obstruction and radiative cooling caused by the thermal difference between land and sea also played an important role in the formation of near-coastal MCSs and associated CPs. These CPs effectively maintain the convective process for long periods of time by allowing warm and moist air to ascend continuously.
The Lagrangian backward trajectory analysis method is widely used in studies on the CI worldwide [36,37,38,39,40,41]. Weisman et al. [38] examined the mesoscale vortex formation process associated with the 8 May 2009 “Super Derecho” by using two complementary quasi-Lagrangian methods—circulation budgets and inverse trajectory analysis. Zheng et al. [13] combined the Lagrangian backward trajectory analysis with the diagnostic analysis of vertical acceleration for convective cells triggered during the merger process in a study of a merger type sea-breeze front on 31 July 2010 in Bohai Bay, where the vertical acceleration was decomposed into two parts, namely, dynamical acceleration and buoyant acceleration. The results of their analysis showed that both the dynamical and buoyant accelerations played important roles in the CI that occurred during the merger process.
Compared with the large number of studies on CI along the eastern coast of China [8,14,15,16,39,42], few in-depth studies on CI have been carried out in Xinjiang, which is located in an arid and semi-arid region, especially in southern Xinjiang. Previous studies on the CI mechanisms have found that the occurrence of the CIs is usually related to some dynamical effects, such as a low-level jet, GFs, valley winds, and dry lines [5,17,43,44]. As the center of the Eurasian continent, Xinjiang has the characteristics of an arid and semi-arid climate, and the Taklimakan desert in the Tarim Basin is considered to be one of the most arid regions in China. Consequently, the mechanisms of the CI and convection development over the northern edge of the Tarim Basin probably show some different features from those of other regions over mid-eastern parts of China. In addition, the number or density of meteorological stations in Xinjiang are much lower than that of the mid-eastern part of China, due to the relatively sparse population, complex terrain, and harsh environments, such as gobi and desert over many parts in this region. Therefore, the mechanisms of the CI in many parts of Xinjiang are not clearly uncovered, especially near the northern edge of the Tarim Basin which is located near the Taklimakan desert. Consequently, in-depth studies based on some high tempo-spatial resolution numerical studies are urgently needed for understanding the CI mechanisms in this region.
In this work, the CI mechanisms of severe convective weather that occurred over Korla city, located near the northern edge of the Tarim Basin in southern Xinjiang, is investigated using both observational data and high-resolution numerical simulation data. The rest of this paper is organized as follows: Section 2 gives an introduction for the data and methodology, and the Section 3 provides a detailed description of the results. The discussion and conclusion are presented in Section 4 and Section 5.

2. Data and Methodology

2.1. Dataset

The dataset employed in this study comprises conventional observational information acquired from Doppler radar, ground-based automatic weather stations (AWSs, with hourly temporal resolution), and balloon soundings. All of these observational data were sourced from the National Meteorological Center of the China Meteorological Administration. Additionally, National Centers for Environmental Prediction (NCEP)’s final (FNL) reanalysis data with 6 h intervals were also utilized.

2.2. Methods

In order to further investigate the dynamical thermal forcing characteristics of CI, diagnostic analyses of vertical acceleration [31,45] are also carried out in this study. The vertical acceleration was decomposed into dynamic acceleration ( a d ) and buoyant acceleration ( a b ) according to the equation proposed by previous studies [37,46,47] as follows:
d w d t = a b + a d
where a b and a d can be obtained from the following Poisson equations:
2 ( ρ ¯ ( z ) a b ) = g h 2 ρ
2 ( ρ ¯ ( z ) a d ) = z [ ρ ¯ ( z ) ( V ) V ]
where V is the three-dimensional (3D) wind, g is the acceleration of gravity, ρ ¯ is the total density including hydrometeors, and 2 and h 2 are the 3D and horizontal Laplacian operators, respectively.
The air density ( ρ ) is further decomposed into several terms:
ρ = ρ d ( 1 + q v + q h ) = ρ d + ρ v + ρ h
In Equation (4), ρ d represents the density of dry air, ρ v represents the density of water vapor, and ρ h represents the density of hydrometeors.
By the assumption of anelastic approximation, the forcing term on the right-hand side of Equation (3) is decomposed into the following components [37]:
[ ρ ¯ ( z ) ( V ) V ] =
ρ ¯ ( z ) [ ( u x ) 2 + ( v y ) 2 + ( w z ) 2 w 2 d 2 l n ( ρ ¯ ( z ) ) d z 2 ]
+ 2 ρ ¯ ( z ) ( v x u y )
+ 2 ρ ¯ ( z ) ( w x u z + w y v z )
where (5), (6), and (7) on the right side of the equal sign are the curvature, twisting, and extension, respectively. The Poisson equation is solved by substituting each of them into the right-hand side of the equal sign in Equation (3) to calculate the contribution of these three terms, as recommended by previous studies [48,49,50].

3. Results

3.1. Case Overview

From 2200 UTC (Universal Time Coordinated) on 8 July 2016 to 0900 UTC on 9 July 2016, a severe convective weather event associated with a GF occurred along the Luntai, Korla, and Yanqi basins in southern Xinjiang. The 12 h accumulative precipitation at 24 stations exceeded 20.1 mm, and that of four stations exceeded 40.1 mm. Among them, the 6 h accumulative precipitation reached 51.8 mm at Wuzhou Zhuanchang Station, reaching the level of heavy rainstorm (the local precipitation rating standard of Xinjiang is shown in Table 1) [51]. The hourly precipitation obtained from the automatic weather station (AWS) showed that heavy precipitation mainly occurred during 0200–0500 UTC on the 9 July, and the largest hourly rainfall appeared in the Halasu station (reaching 23.3 mm). Moreover, there were a number of stations that experienced short-term heavy precipitation (i.e., a total of 30 stations had hourly rainfall intensity of more than 10 mm, and 7 stations had hourly rainfall intensity of more than 20 mm). This severe convective weather event has the characteristics of high precipitation intensity and relatively concentrated time of occurrence, showing a strong potential impact on local agriculture and transportation.
Numerous previous studies stated that the CI is considered to occur when the composite reflectivity of a newly generated convective cloud reaches 35 dBZ for the first time [14,29]. The observations from the Korla Doppler weather radar (Figure 1) showed that, at 0112 UTC on 9 July (Figure 1a), there was an arc-shaped weak narrow echo band (indicated by a black dashed line), showing the location of the GF located around the periphery of the strong MCS (composite reflectivity reached above 50 dBZ). The GF is located at about 20~50 km southwest of the Korla radar station, and its intensity of composite reflectivity is about 15~20 dBZ. At this time, a convective cell was triggered in front of the GF (indicated by number 1 in Figure 1a). By 0139 UTC (Figure 1b), the GF was located at about 10–20 km southwest of the Korla radar station, and it was moving continuously to the east, showing an orientation in the northeast–southwest direction. Several CIs (labelled with numbers 1–4 in Figure 1b) were triggered over the area behind the moving GF, and the convective cells developed rapidly and continued to merge with the convective system on its behind. At 0211 UTC (Figure 1c), the strength of the convective system over the areas at about 35 km–40 km to the southwest of the Korla radar station was about 55–60 dBZ. In the following two hours, other new convective cells were continuously generated near the GF (Figure 1d–f), and they merged with the convective system before long, resulting in the convective system being further developed and maintained for several hours. In a later period, the convective systems developed into a roughly north–south-oriented band-shaped MCS, and kept moving eastward. By 0415 UTC (Figure 1f), the MCS was further developed in both size and intensity, showing a north–south-oriented distribution of about 110 km in length and 90 km in width. The continuously generated multiple convective cells near the GF and their later merging with the convective system behind are very important for the development of the MCS which was responsible for the heavy precipitation in the region.
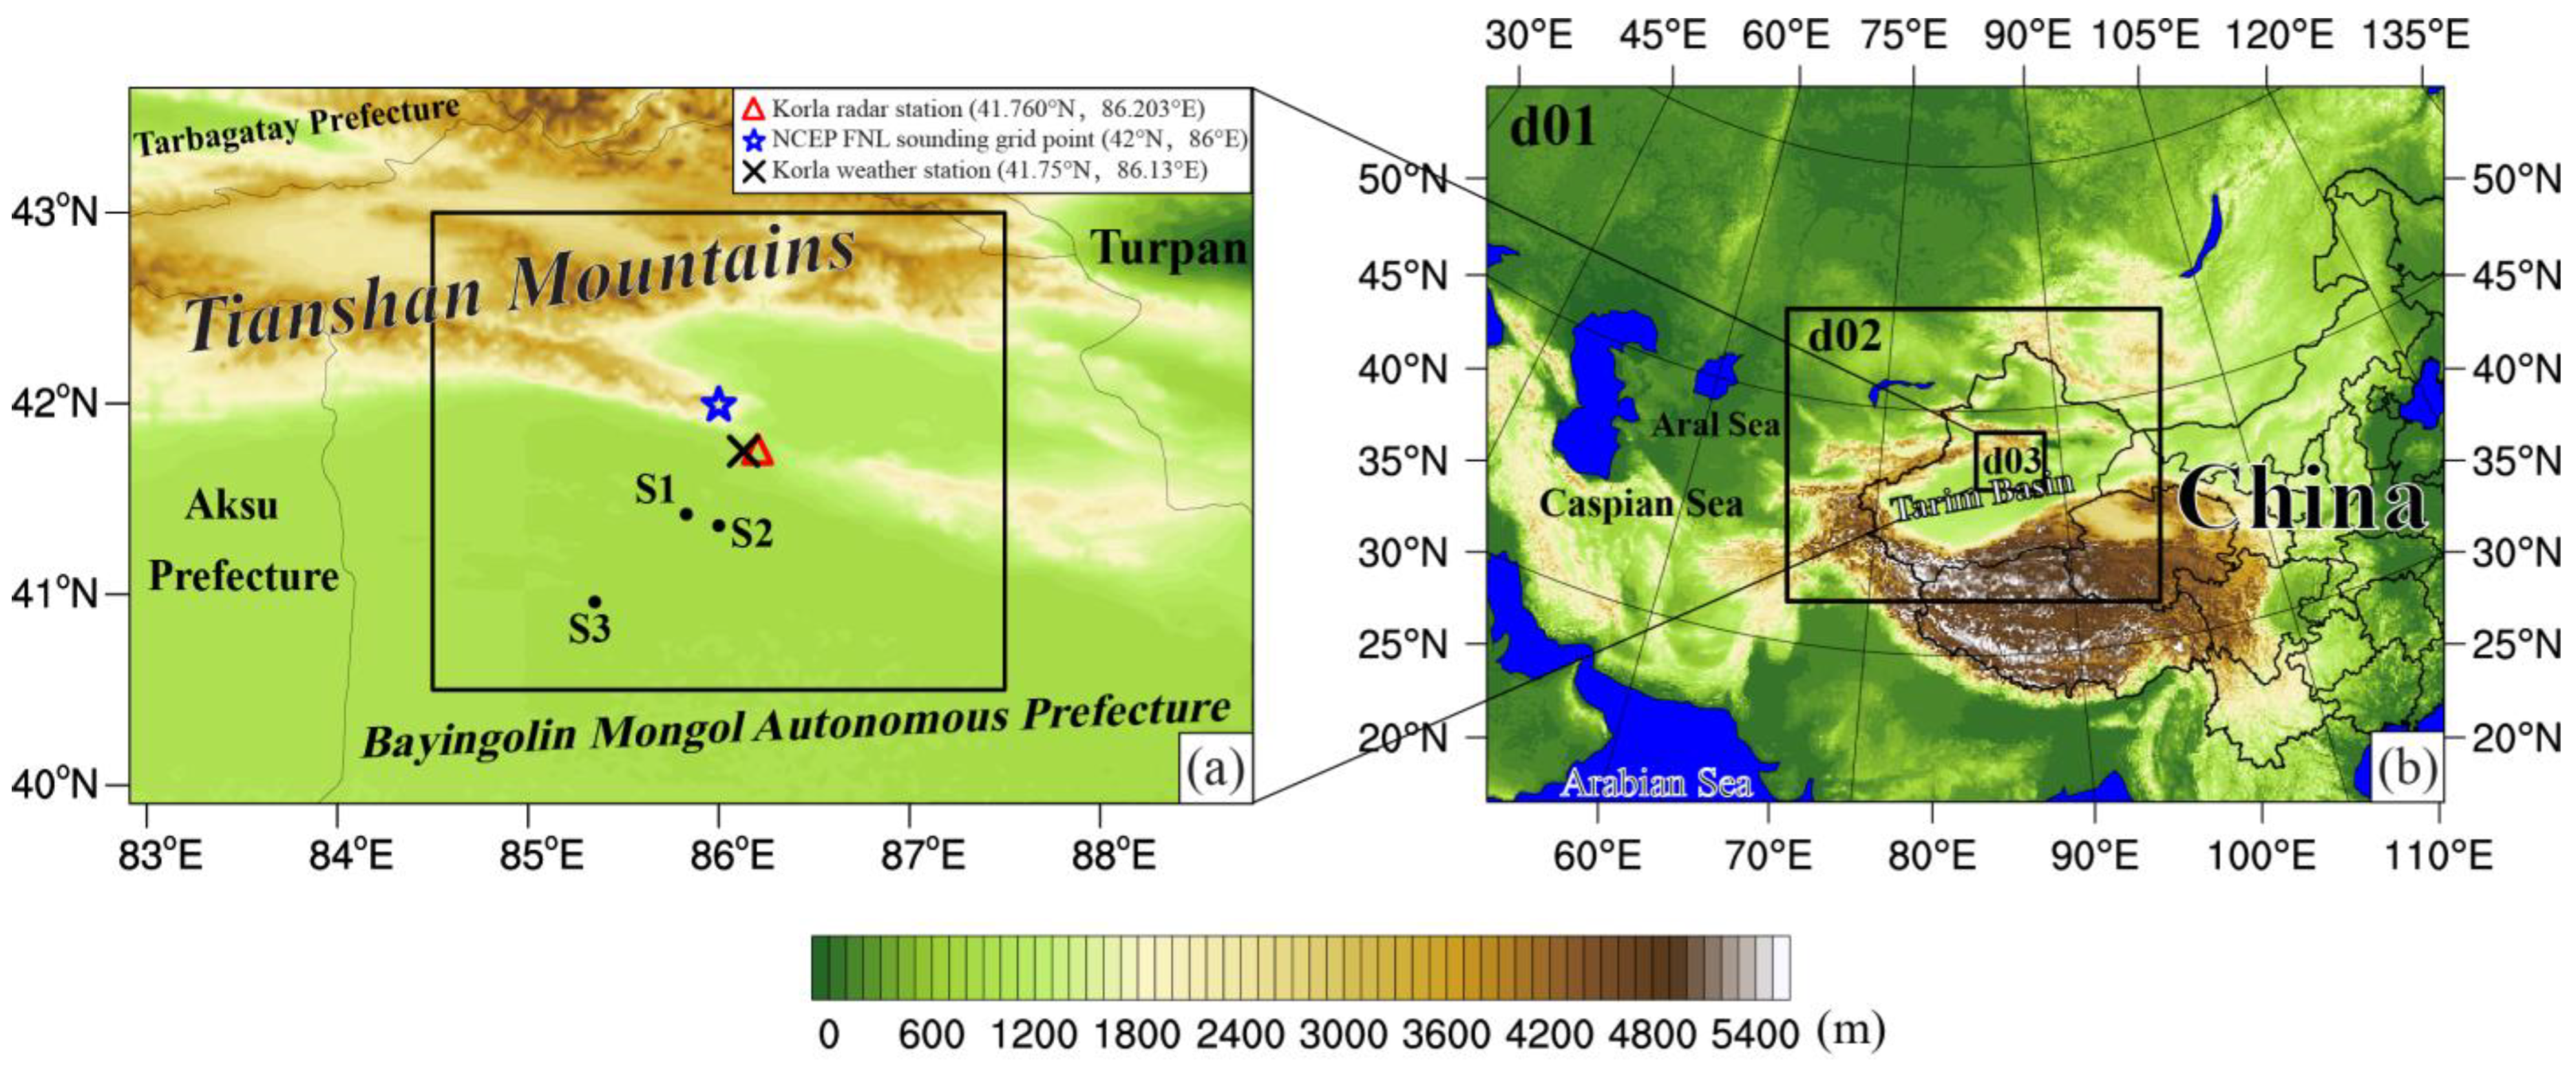
In order to investigate the characteristics of the basic meteorological elements during the passage of the GF, three AWSs were selected over the major area where the GF went through in the study area. As shown in Figure 2, the three AWSs (S1, S2, and S3 in Figure 3) were selected for the targeted analysis of changes in air temperature, wind speed, relative humidity, and pressure during the transit of the GF. The near-surface wind fields at these three AWSs show that there are obvious changes in wind speed and direction at the three stations during the passage of the GF. The near-surface winds before the CI in the region (i.e., before 0100 UTC) were generally westerly winds. During the period when the convective cells in the region were continuously triggered (0100–0500 UTC), the wind speeds at the three AWSs increased significantly. Both S1 and S2 had a significant change in wind direction from westerly to southerly at about 0200 UTC, and the wind direction at S1 changed to northerly at 0300 UTC, whereas the wind direction at S2 changed, but it still remained southerly. At 0300 UTC, the wind direction at S1 changed to northerly, while the wind direction at S2 changed to southerly. By 0400 UTC, the wind direction at S2 changed to northerly. The gusty wind at S1 occurs at 0400 UTC, resulting in the wind speed being increased from about 4 m s−1 to about 9 m s−1. The gusty wind at S2 occurred at 0500 UTC, and the wind speed increased from about 4 m s−1 to about 11 m s−1. At S3, the wind direction changes from southerly to northerly at 0200 UTC, and the wind speed increases from about 2 m s−1 to about 8 m s−1, while the maximum wind speed occurred at about 0500 UTC. The significant increase in wind speed at S1 was observed 1 h earlier than that at S2 and S3, which may be due to the closer location of S1 to the continuously triggered convective cells.
In addition to the significant changes in wind speed and direction, the temperature at these three AWSs during the 0100~0500 UTC period were also characterized by a decreasing trend, especially at S1 and S2, with decreases of about 5 °C~6 °C (from ~23 °C to ~18.5 °C at S1, and from ~25.5 °C to ~19 °C at S2). However, the decrease in temperature at S3 is very small (about 0.5 °C), while the change of the wind speed and direction at this station is rather significant. It can be seen that the GF leads to a significant change in wind speed and direction, along with a decrease in temperature in the near surface over the area where the GF passes. In summary, the above-mentioned characteristics of the basic meteorological elements were consistent with the typical meteorological characteristics (i.e., significant increase in wind speed (with obvious directional shift), decrease in temperature, and increase in humidity and pressure) during the transit of the GF.
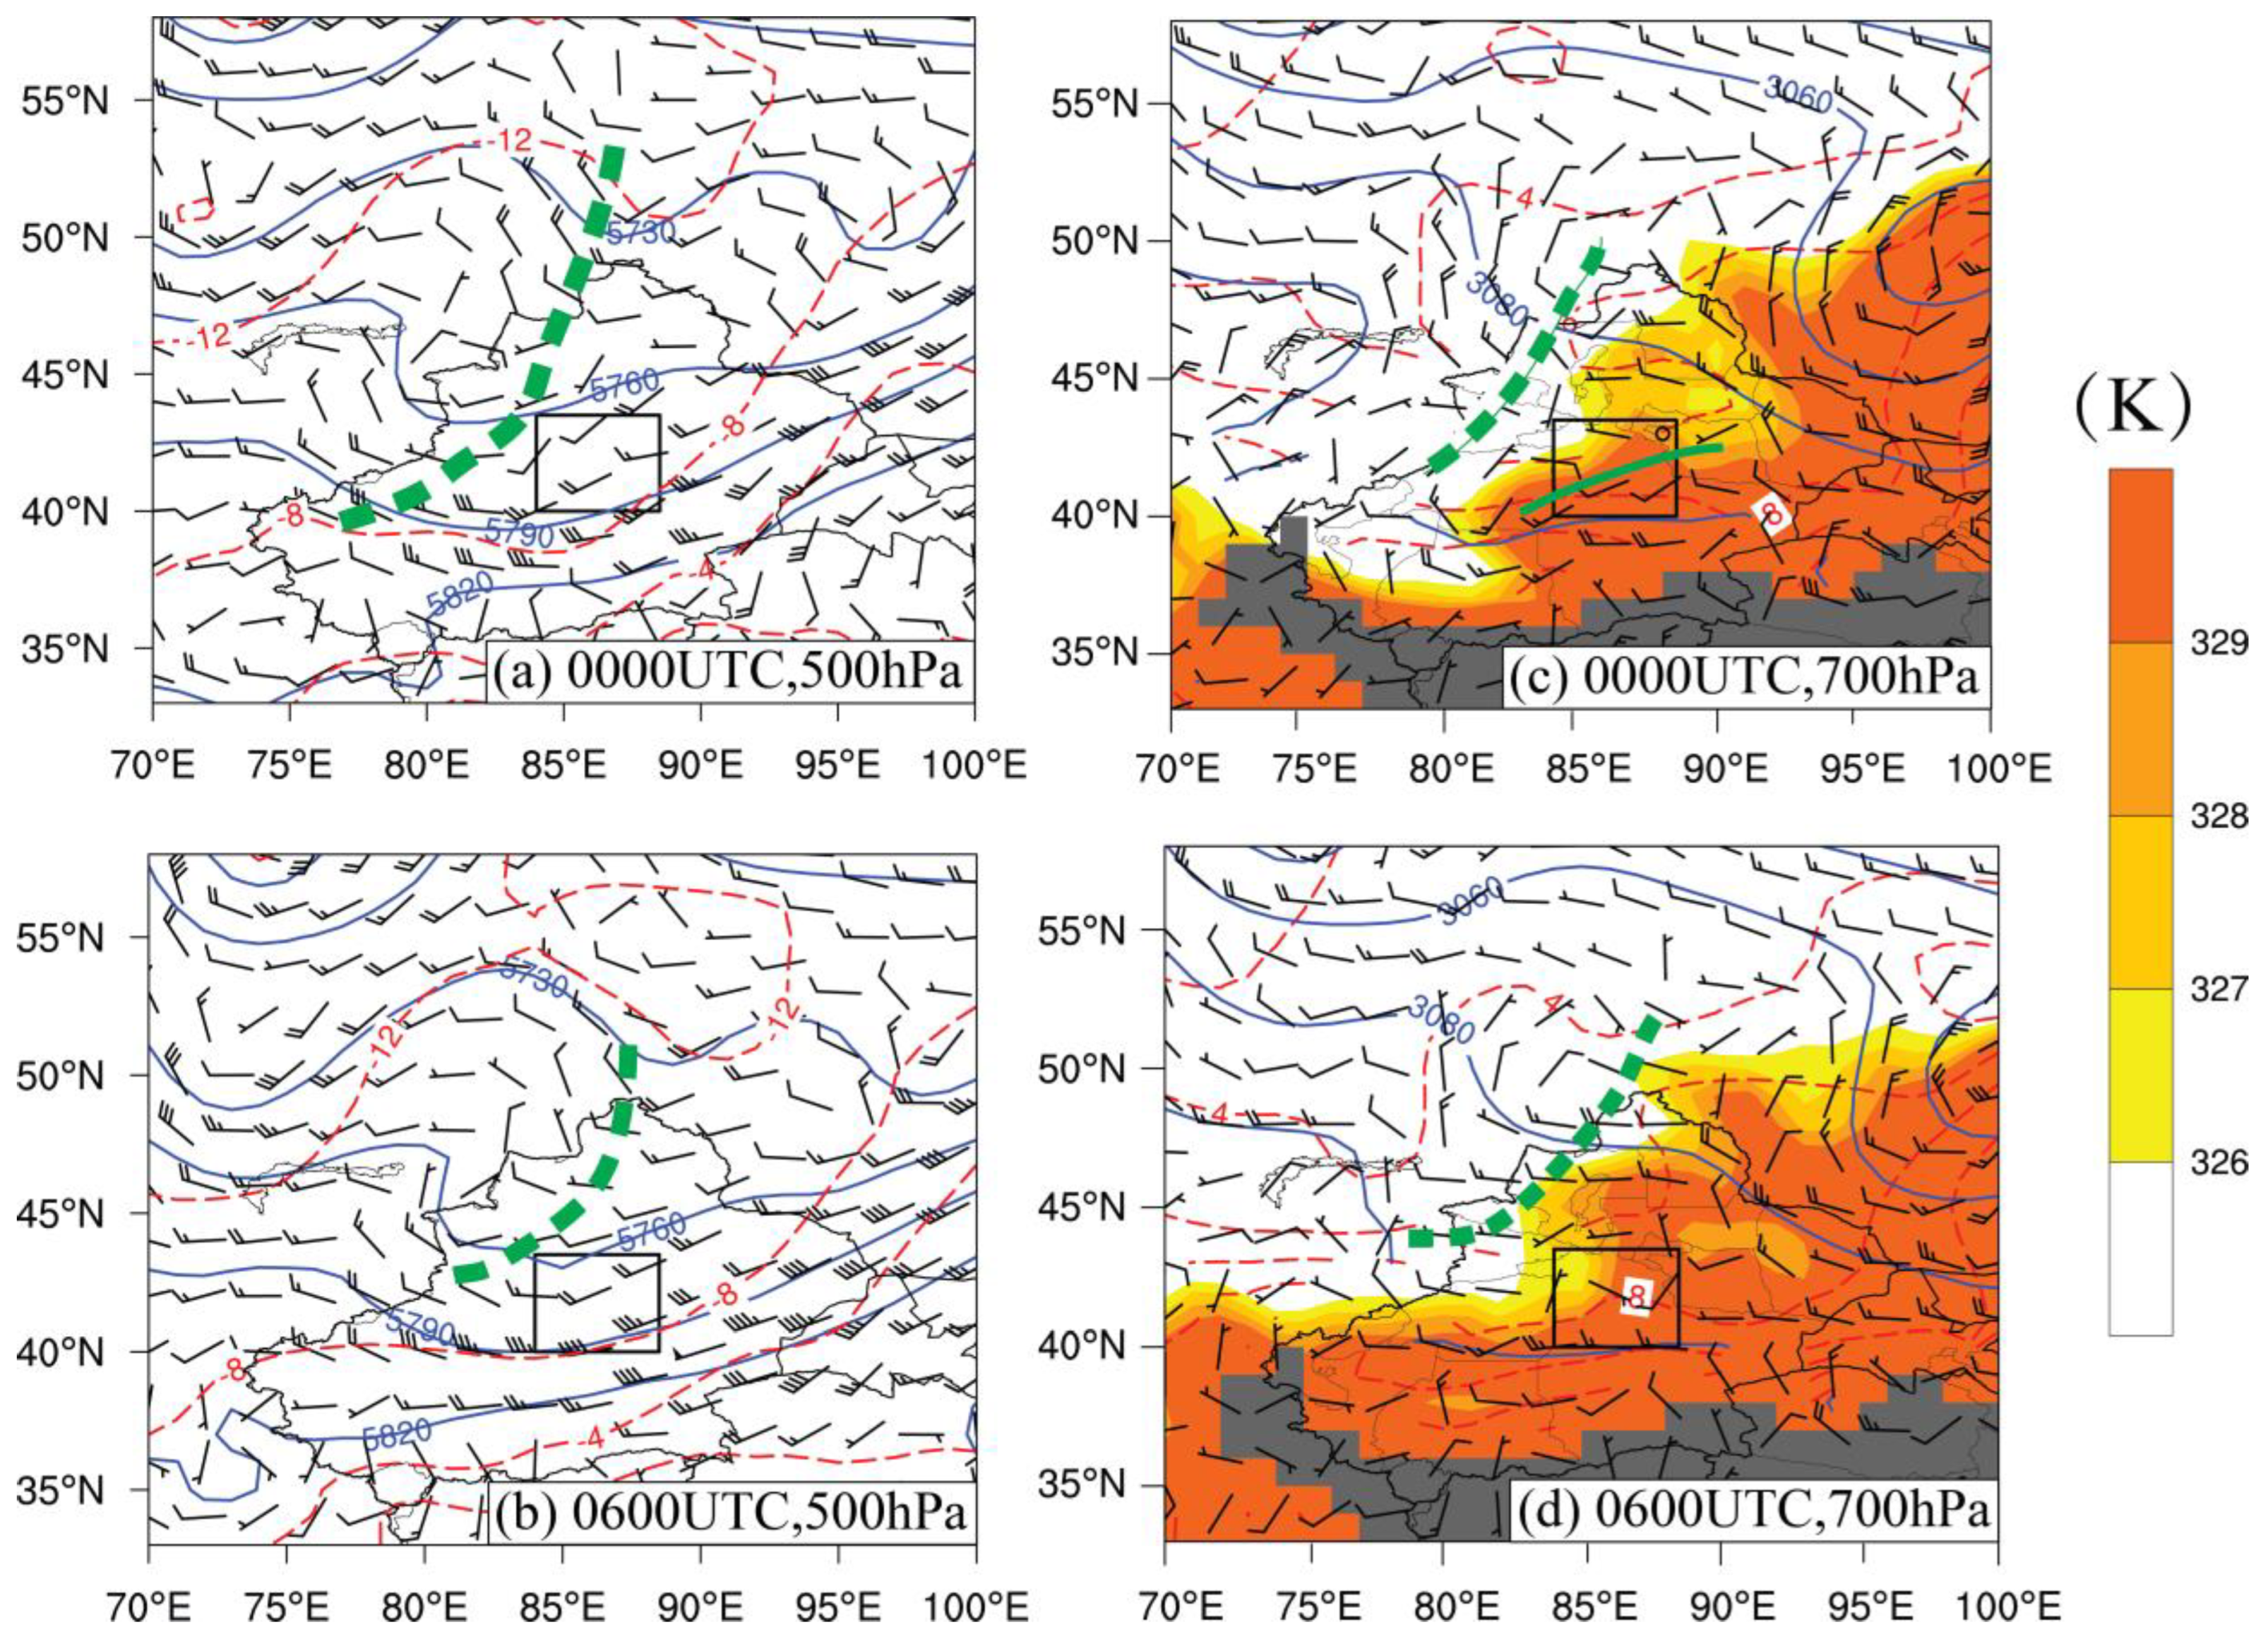
In the following, the corresponding large-scale circulation pattern and atmospheric stratification conditions of this severe convective weather process are analyzed using NCEP/NCAR FNL reanalysis data with a resolution of 1° × 1°. Figure 4 shows the circulation pattern at 500 hPa and 700 hPa on 9 July 2016 at 0000 UTC and 0600 UTC. In the early stage of this severe convective process (i.e., 1800 UTC on the 8 July), the South Asian High (SAH) at 200 hPa was in a “double-high-centered” structure, with its center steadily maintained over the Tibetan Plateau and the northern part of the Indian Peninsula. Moreover, the main body of the SAH showed a zonal distribution, and the western part of the SAH zone was extended northward to some extent, and roughly located over the eastern European region. At 500 hPa, a high-pressure ridge over the area near the Caspian Sea and Aral Sea moved northward, and the Central Asian Trough (CAT) was located over the area near the Lake Balkhash and the western region of Xinjiang. At 0000 UTC (Figure 4a), the CAT was extended southward to some extent, and the Korla was under the control of the southerly flows in front of the CAT. By 0600 UTC (Figure 4b), the CAT was maintained roughly over western Xinjiang. In the lower level at 700 hPa (Figure 4c,d), the study area was influenced by southwesterly winds with relatively warm and moist features which are indicated by a high equivalent temperature zone. There was a clear temperature trough over the northwestern part of Korla, and there was a convergence of southwesterlies and northwesterlies over the Korla, induced probably due to the shear line. This kind of circulation pattern is conducive to transporting the warm and humid air from the southwest to the study area, and it is favorable to the convergence of relatively cold air from the northwest and warm air from the southwest over the study area. This kind of condition is favorable for increasing the atmospheric baroclinic instability and providing a favorable condition for the CI and convection development.
Figure 5 shows the atmospheric stratification characteristics in this region during the convective weather process. The convective available potential energy (CAPE) at 0000 UTC on 9 July (Figure 5c) was 0 J kg−1, and the low level below 2 km was controlled by easterly winds, while the atmosphere near the surface was rather wet, showing the dew-point depression (T-Td) reaching about 2–3 K. The dew-point depression at the altitude of 850 hPa reached about 13 K, indicating an unstable stratification with dry air in the upper layer and wetter air in the lower level. In the level from 750 hPa to 500 hPa, the humidity decreases rapidly, and the dew-point depression was almost about 2 K. At 0600 UCT (Figure 5b), the value of CAPE is increased to 1766 J kg−1, and the atmosphere below 750 hPa was relatively dry (with a dew-point depression of about 8–10 K), and then the dew-point depression decreased to about 4 K at 700 hPa. In the level at about 550–350 hPa, the dew-point depression decreased to about 0 K, indicating the saturated condition of this level. There was a veering vertical shear of horizontal winds in the level from 700 hPa to 650 hPa, indicating a warm advection in this level. This kind of condition can effectively promote the occurrence and development of local convective weather. By 1200 UTC (Figure 5c), the value of CAPE was reduced to 205 J kg−1, showing the significant release of the CAPE. Moreover, the atmosphere near the surface showed rather a dry condition (the dew-point depression reaches about 12 K) at this time. However, the humidity increased rapidly with height, and the dew-point depression decreased to about 3 K at about 750 hPa, and the dew-point depression increased to about 8 K at the level of 650 hPa. The humidity increased again in the level above 525 hPa (the dew-point depression reached about 5 K), while the level above 500 hPa became significantly dry.
In general, the combination of the large-scale circulation pattern and the atmospheric stratification characteristics showed that the study area was influenced by the CAT and the southerly flow in front of the trough, and the CAPE increased rapidly before the occurrence of the convective system. Although the atmospheric stratification that alternated with a relatively dry and wet condition challenges the initiation and development of the convection, the warm advection at the lower level provided a favorable condition for the CI and convection development. However, due to the limitation of the temporal and spatial resolution of the reanalysis data and observational data, the specific mechanisms of the CI in this severe convective weather are still unclear. Therefore, in order to further analyze the CI mechanisms of the severe convective weather, high temporal and spatial resolution numerical simulations were conducted in the following section.

3.2. Setup of Numerical Experiment

In this paper, the mesoscale numerical simulation model WRF (Weather Research and Forecasting Model) (version 4.0) [52] was used for the simulation, and the reanalysis data of NCEP FNL with a 1° × 1° resolution were used as the model’s initial field and boundary conditions. The simulation was performed with two-way nested triple-level domains (the domains are shown in Figure 3b), with horizontal resolutions of 9 km, 3 km, and 1 km, respectively, and a vertical resolution of 50 layers with an integration step of 30 s, and the innermost domain (d03) has 457 × 385 grid points. The microphysical scheme adopted the WSM six-class scheme [53], and the cumulus parameterization scheme used the Kain–Fritsch scheme (closed in d03); the YSU scheme was used for the planetary boundary layer (PBL) scheme [54]; the Rapid Radiative Transfer Model (RRTM) scheme [55,56] was used for both the longwave and shortwave radiation scheme; and the Unified Noah land surface scheme was used for the parameterization. The integration time was 24 h from 1200 UTC on 8 July to 1200 UTC on 9 July, and the output time interval for d03 was 3 min.

3.3. Evaluation of Simulation

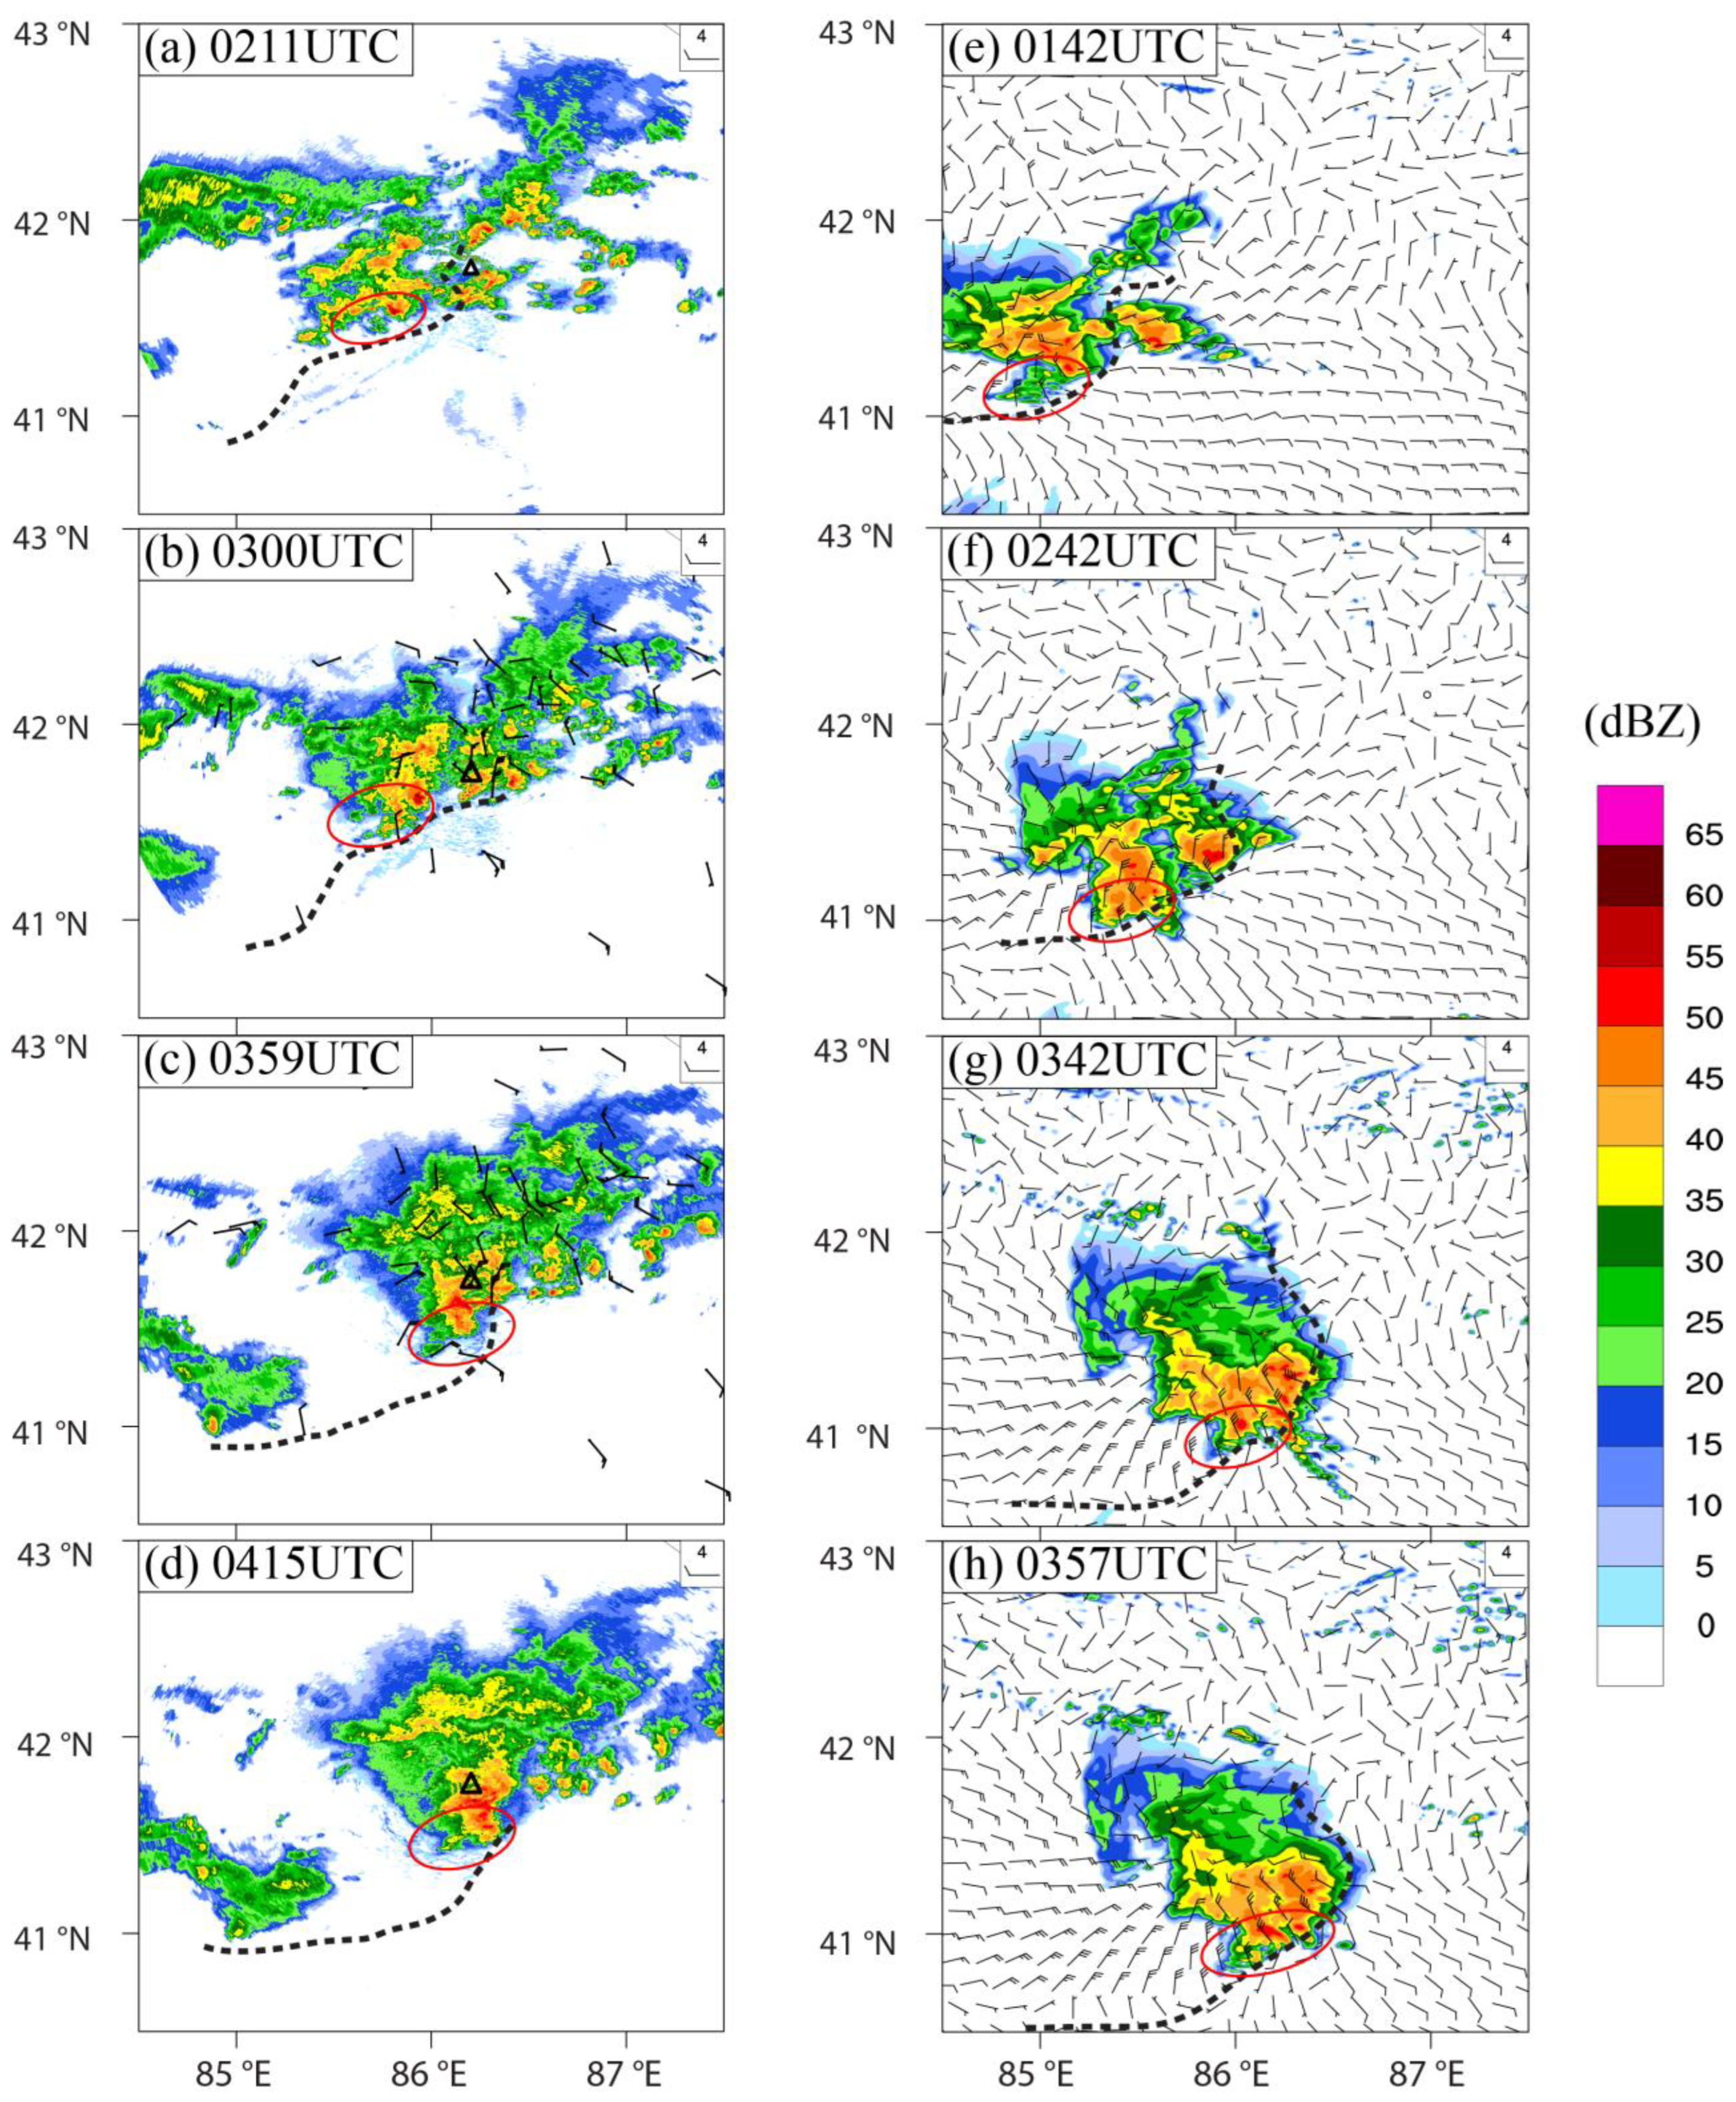
In order to evaluate the simulation results of the WRF model in this study, the composite reflectivity and 6 h accumulative precipitation obtained from the observation and simulation were used to perform a comparative analysis in the following section. It can be seen from the composite reflectivity and 10 m wind characteristics shown in the simulation results (Figure 6) that several CIs (indicated by red ellipses) occurred in the area behind the GF at around 0142 UTC (Figure 6e). Although the simulated time of CIs was about 0.5 h earlier than that of the observations and the location of the CIs were biased about 0.5° to the southwest, the occurrence patterns of the CIs near the GF were generally consistent with those of the radar observation at 0211 UTC (shown by the red ellipse in Figure 6a). By 0242 UTC (Figure 6f), multiple CIs occurred rapidly near the GF during the movement of the GF to the southeast, and the newly initiated convective cells merged into the MCS behind the GF, which was generally consistent with that in the observations. Although the MCS in the simulation was weaker than the one in the observation, and its location was biased southward to some extent. However, the overall morphological features were still consistent with those of the radar observations at 0300 UTC (Figure 6b). By 0357 UTC (Figure 6h), although the MCS in the simulation was a little bit larger in size, and its location still biased to the southeast than that in the observation, the intensity of the MCS was roughly the same as that in the observation, and the maximum composite reflectivity reached above 50 dBZ. Overall, although the CIs in the simulation were earlier than those of the observation, and there were some biases in the morphology and location of the MCS, the simulation results can be considered to be reliable for the characteristics of the occurrence of the CIs associated with the GF in this case.
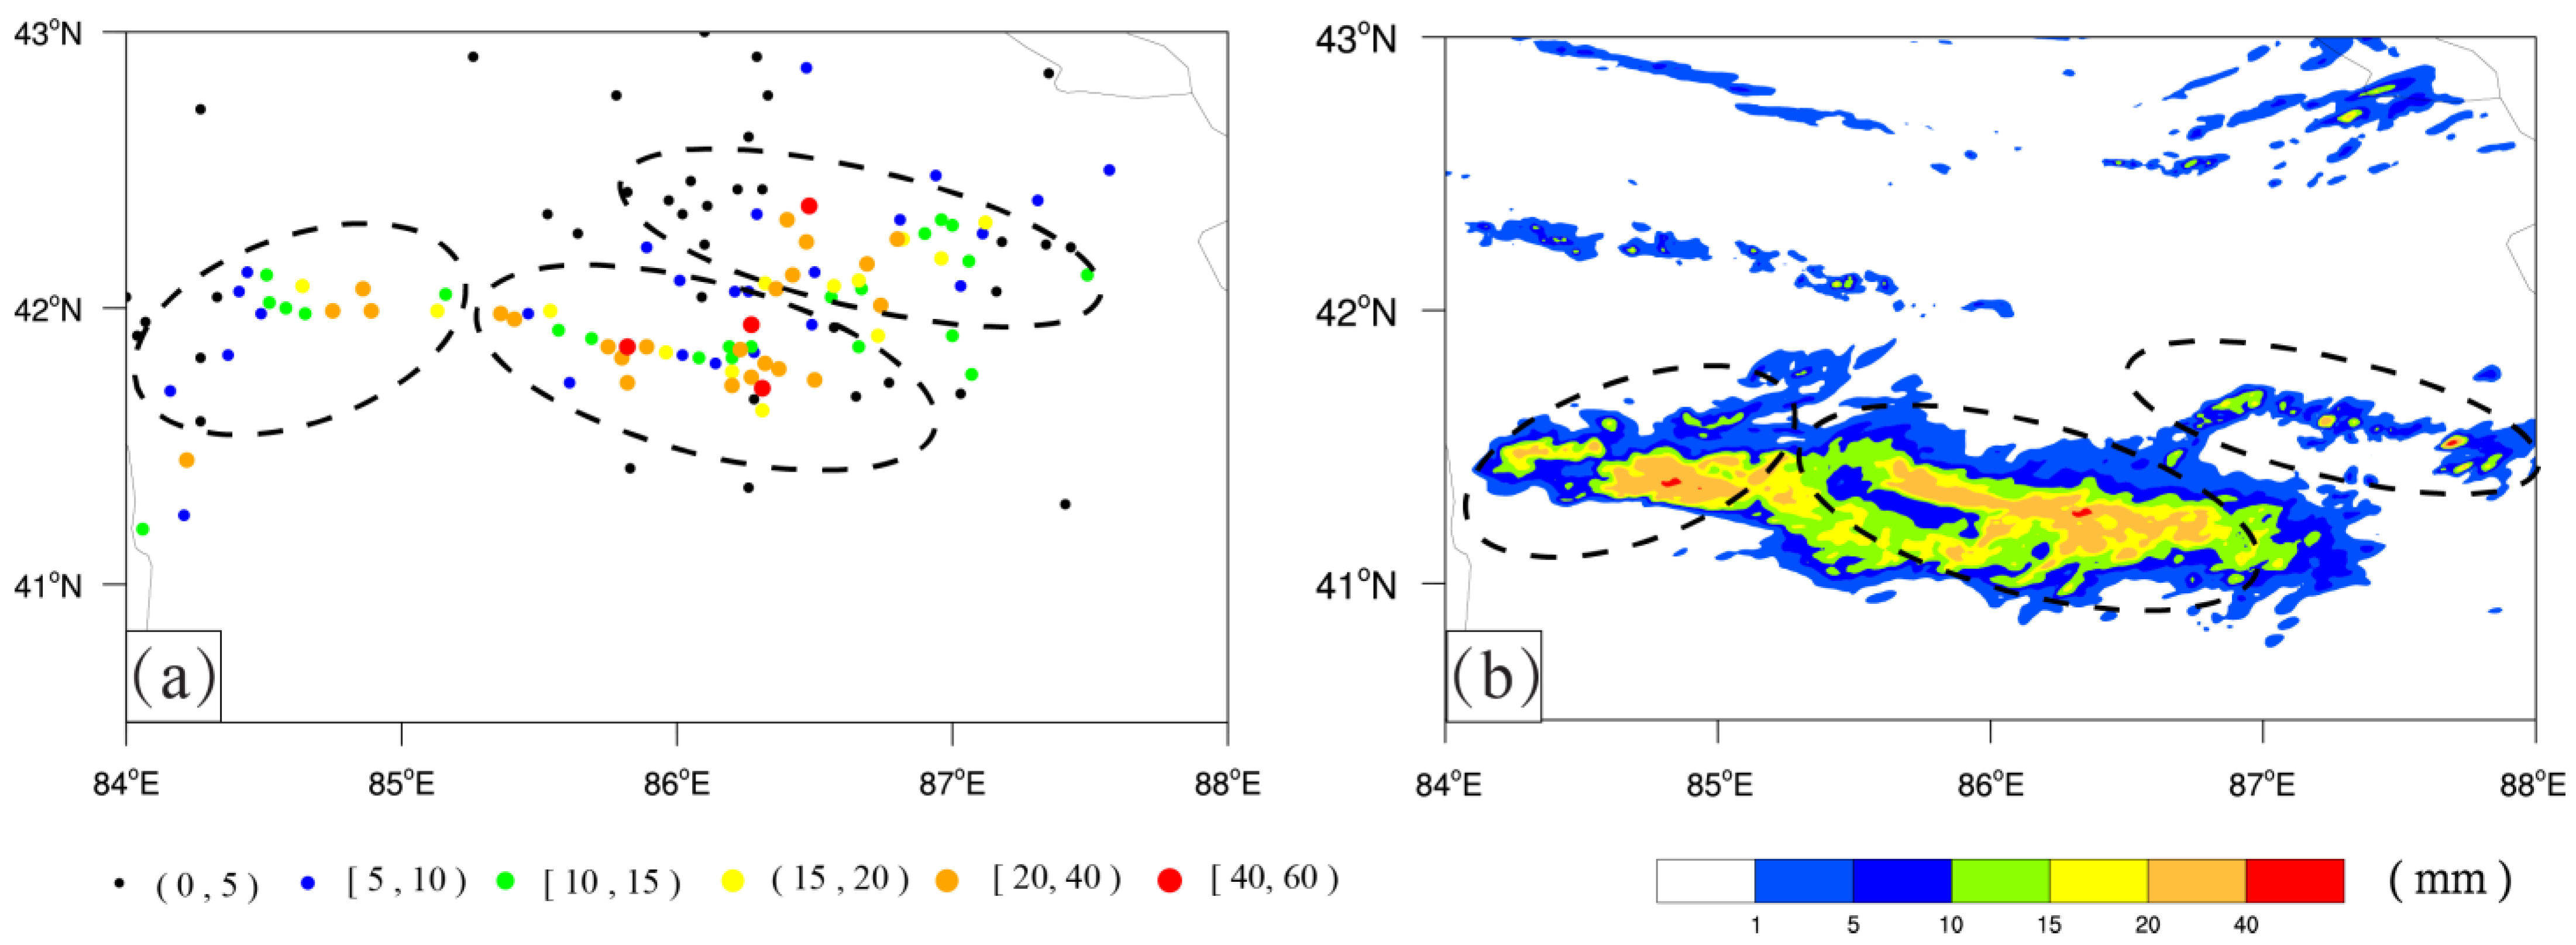
In order to further examine the simulation results from the perspective of precipitation, the simulated 6 h accumulated precipitation was compared with the observed 6 h accumulated precipitation in the following section. As shown in Figure 7a, the distribution of the observed accumulated precipitation during the 0000–0600 UTC on 9 July depicted two band-shaped high-precipitation areas roughly oriented in the “west-northwest–east-southeast” direction (indicated by the two dashed ellipses in the mid-eastern part of the area), and another high precipitation area, roughly oriented in the “east-northeast–west-southwest” direction, can be found in the western part of the area. As can be seen from the corresponding simulation results (Figure 7b), the area of the simulated 6 h accumulated precipitation was biased by about 0.5° to the south, which is consistent with the simulated composite reflectivity analyzed above. This kind of bias in the location of the accumulated precipitation often appeared in some similar studies [11,12,13,14], and it is probably due to some deficiencies of the reanalysis data providing the initial and boundary conditions for the simulation. The distribution of the precipitation rain band shows a similar orientation as the observed counterparts. In addition, the intensity of the simulated precipitation was also consistent with that of the observed precipitation.
In general, it can be deduced that the numerical simulation results reproduced the severe important aspects (i.e., characteristics of the CIs and precipitations) of the severe convective weather in the study area well. The CI mechanisms in this case will be further investigated with high tempo-spatial resolution simulation data in the following section.

3.4. Convection Initiation

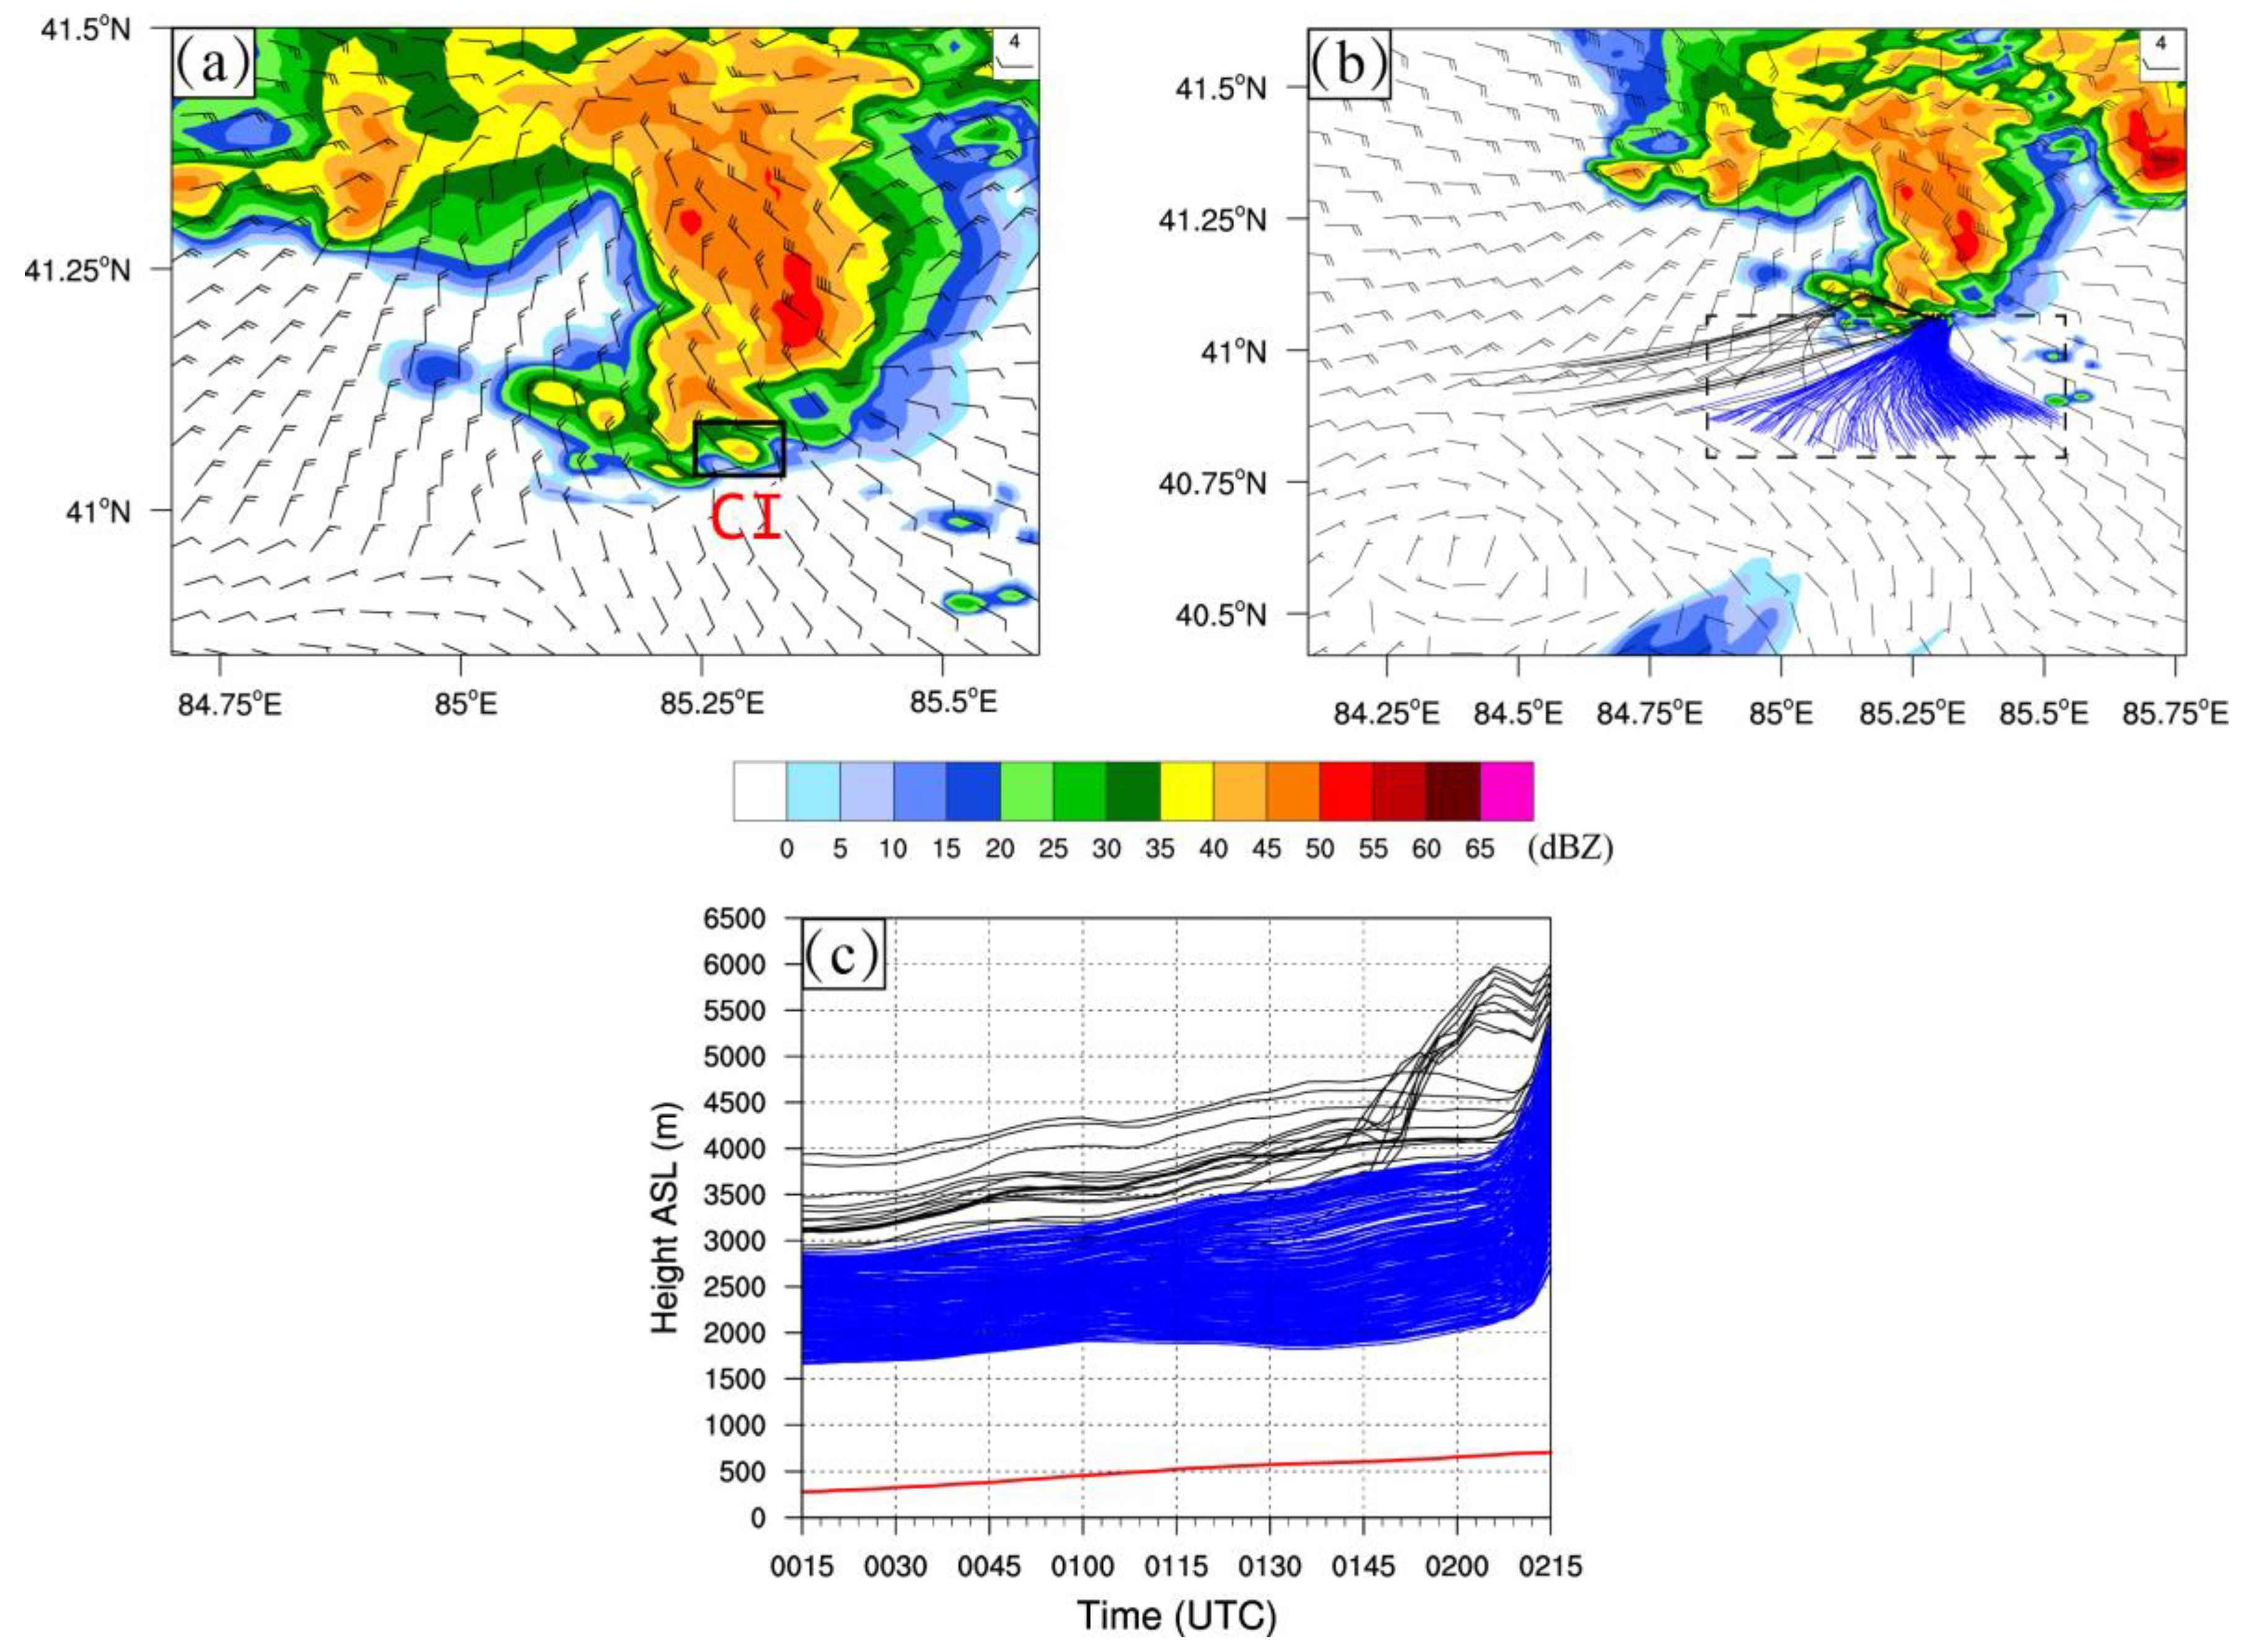
In order to further study the CI mechanisms in this severe convective weather, we selected the time when the composite reflectivity of convective cells initiated near the GF reaches the intensity of 35 dBZ for the first time in the numerical simulation, and analyzed the vertical momentum budgets during the occurrence of the CI by using the Lagrangian backward trajectories. We used MUDPACK, a software developed by Adams (1989) [57] for the calculation of the Poisson equations (i.e., the equation No.2 and No.3 mentioned above in Section 2) on an appropriate 3-D subdomain of the WRF d03 domain. In order to focus on the air parcels that played a major role in the CI, we selected a convective cell as the representative convective cell which was initiated (i.e., the intensity of composite reflectivity reached 35 dBZ for the first time) at 0215 UTC to study the mechanisms of the CI in this case. We also calculated the backward trajectories of air parcels within the representative convective cell for a 2 h period from the CI time (i.e., 0215 UTC). The parcels whose vertical velocities are in the first 20% quantile among the whole air parcels at the CI time are selected for analysis (Figure 8).
As shown in Figure 8a,b, the ambient airflow in front of the GF is dominated by southeasterly winds, and the air parcels within the representative convective cell originated mainly from the south (including the south-east, south, and south-west directions). Figure 8c shows that all selected air parcels came from above the planetary boundary level height (PBLH) indicated by the blue and black lines. Among them, a small fraction of the air parcels (indicated by the solid black lines) come from west, and they had relatively high altitudes at the CI time. In addition, the height of the air parcels increased relatively gently from 0.5 h to 2 h before the CI, generally located in the level at 1500–3000 m ASL, and most of the parcels start to arise rapidly from ~3000 m to ~5500 m in the last ~0.5 h before the CI. Therefore, we will focus on the characteristics of the air parcels in the 0.5 h before the CI in the following section.
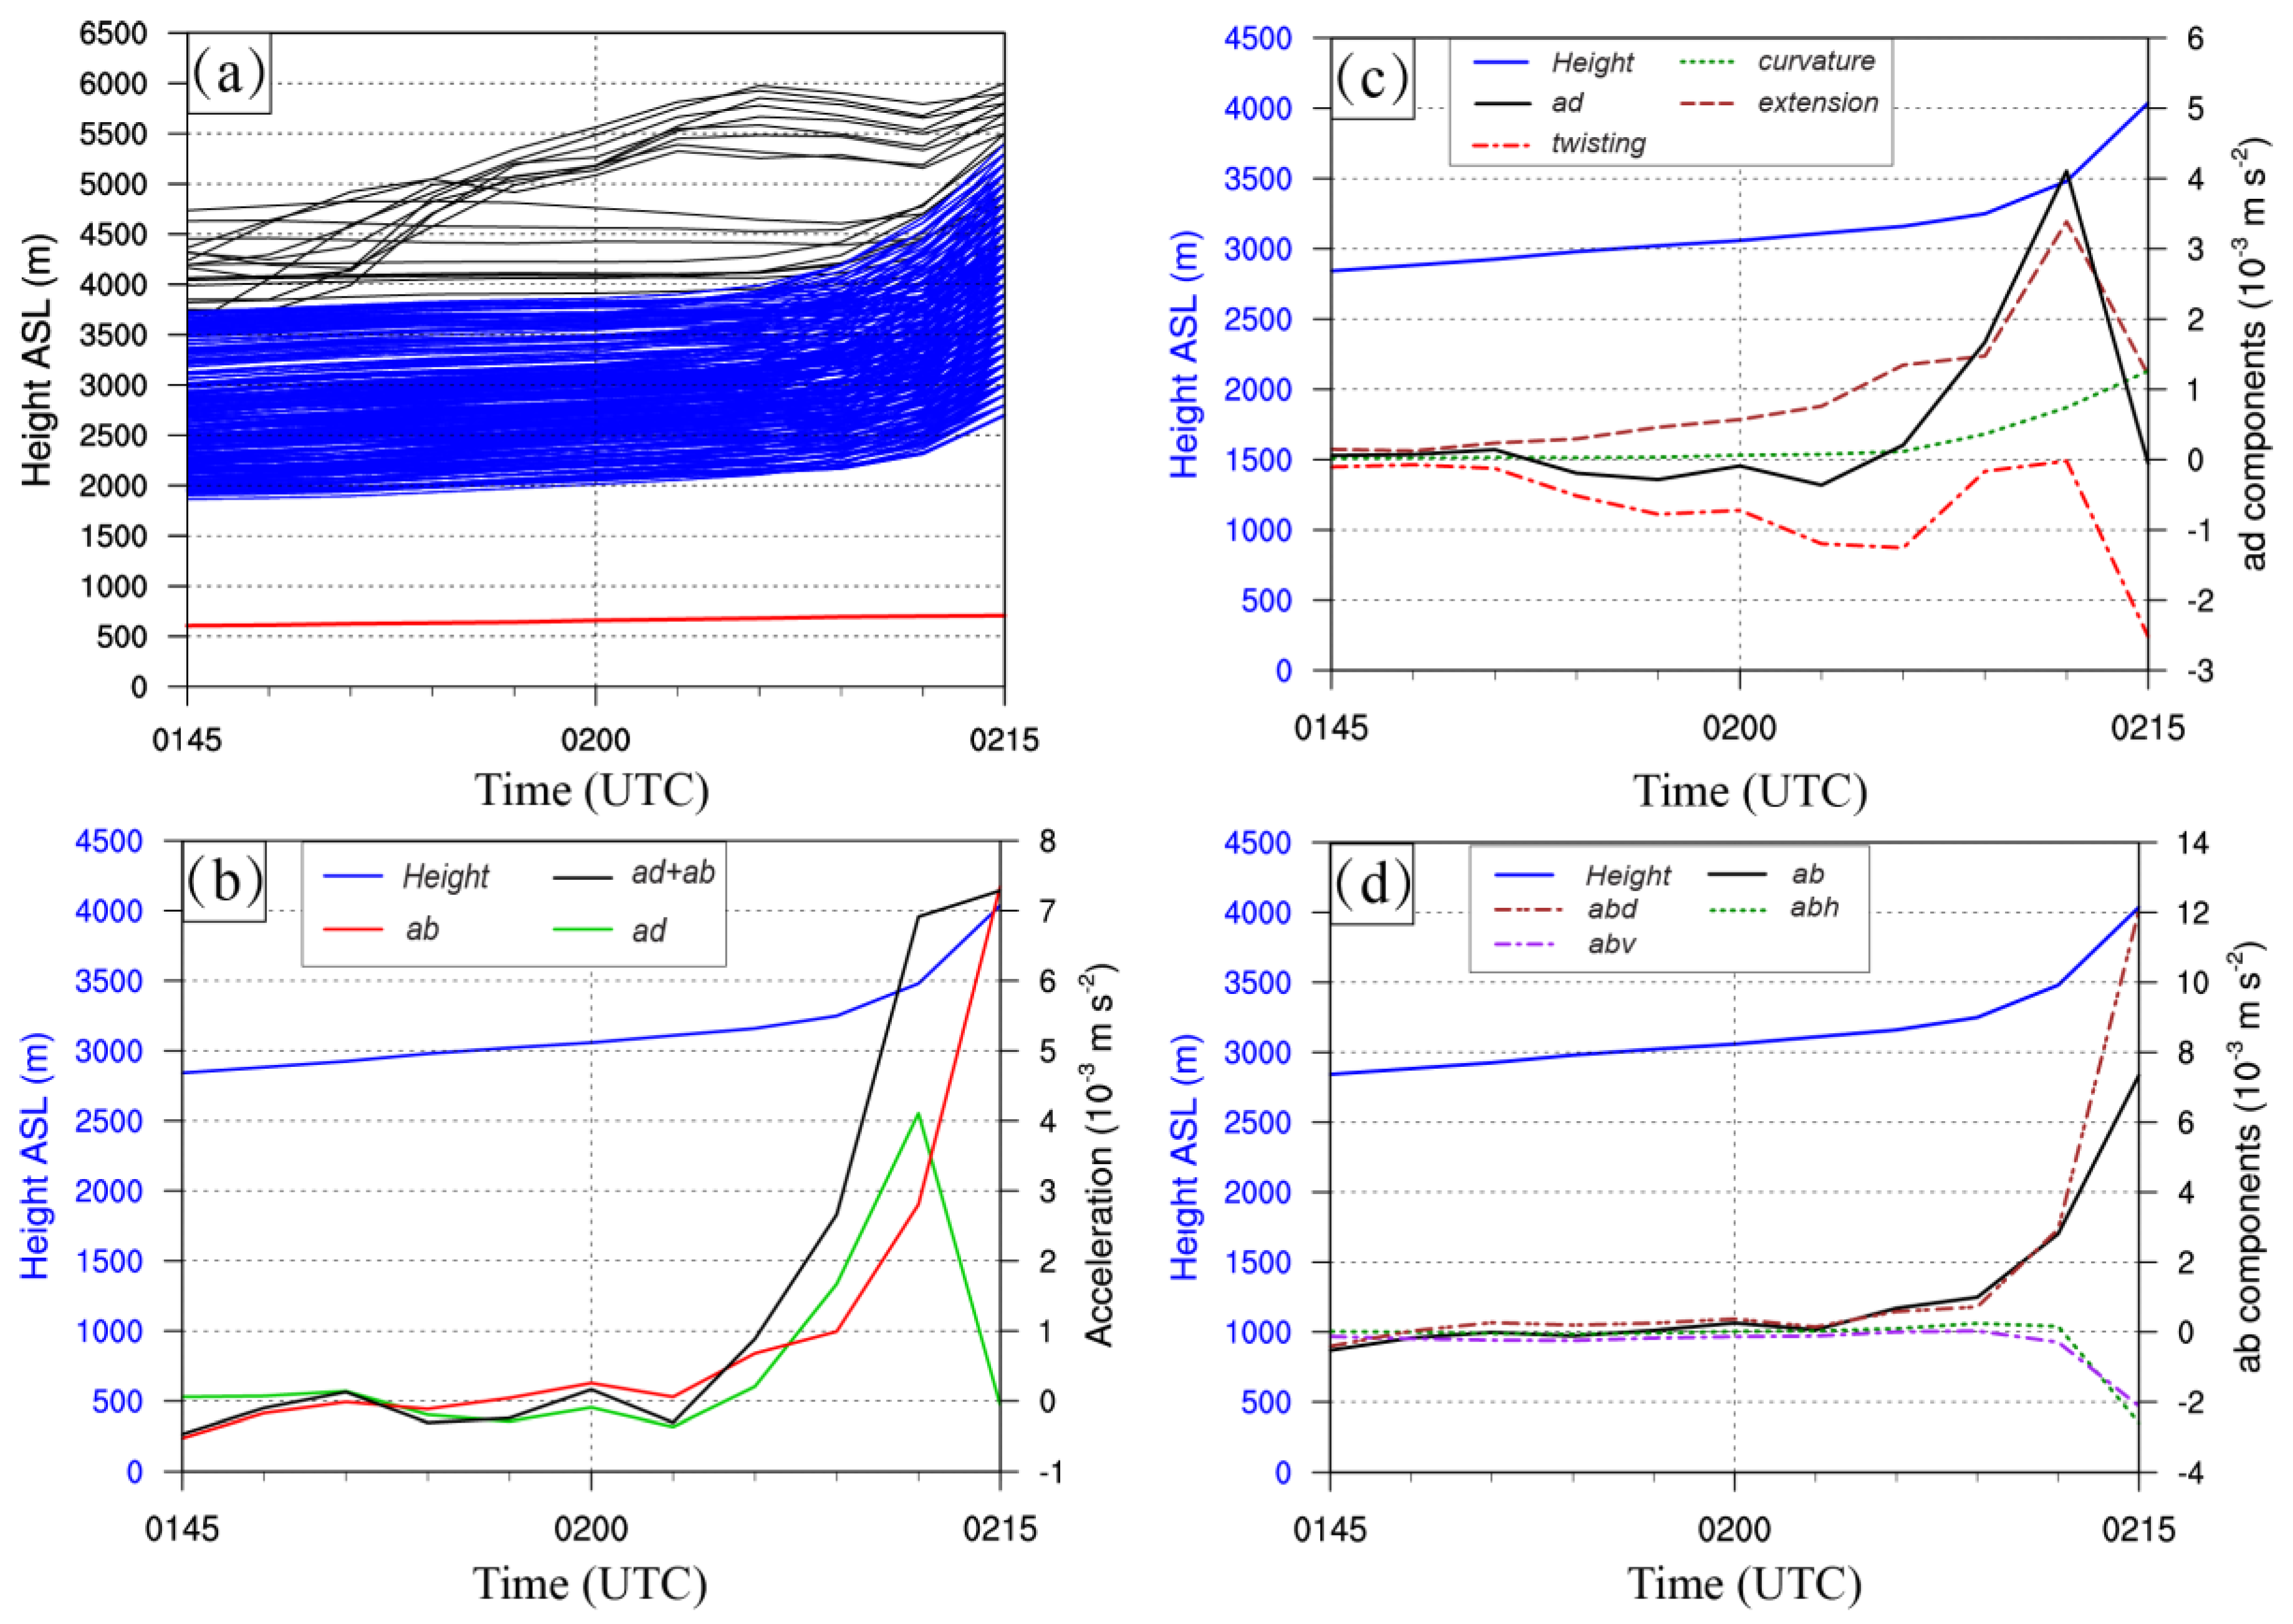
Figure 9a shows the evolution of the height along the backward trajectories of selected air parcels during the period of 0.5 h before the CI. The majority of the air parcels were at 2000~3500 m ASL (above sea level), and the height of most of the air parcels were increased to the level of 2500–5500 m within 15 min before the CI, and all of these air parcels come from above the PBLH (shown by the red solid line in Figure 9a). Therefore, it can be deduced that the representative convective cell belongs to “elevated convection”, in which the conditionally unstable air came from a relatively higher level above the planetary boundary layer.
Evolutions of the averaged height of the trajectories of air parcels, a b and a d along the backward trajectories of air parcels in 0.5 h before the CI are shown in Figure 9b. It is clear that the contributions of a b and a d were almost similar; the difference between a d and a b was about 0.5–1.0 × 10⁻³ m s−2 in the period about 3–15 min before the CI. Specifically, the value of the a d was a little higher (about 1 × 10⁻³ m s−2) than that of the a b during the period of 3–6 min before CI. Figure 9c,d represented the further decomposition of the a b and a d . It can be seen from Figure 9c that the curvature term was slowly enhanced during the period of 0–9 min before the CI, providing a relatively small positive contribution to the a d , while the contribution of the twisting term was negative during the 0.5 h before the CI. However, the extension term increased continuously during the period of 3–24 min before the CI, indicating a consistent positive contribution to the a d . The extension term showed a rather high value during the period of 3–9 min before the CI, and especially increased rapidly in the 3–6 min before the CI, which can be considered to be the major contributor to the a d . The three components of the a b showed that (Figure 9d) the dry air density had provided the dominant contribution for the a b , showing a significantly high value in the last 6 min before the CI.
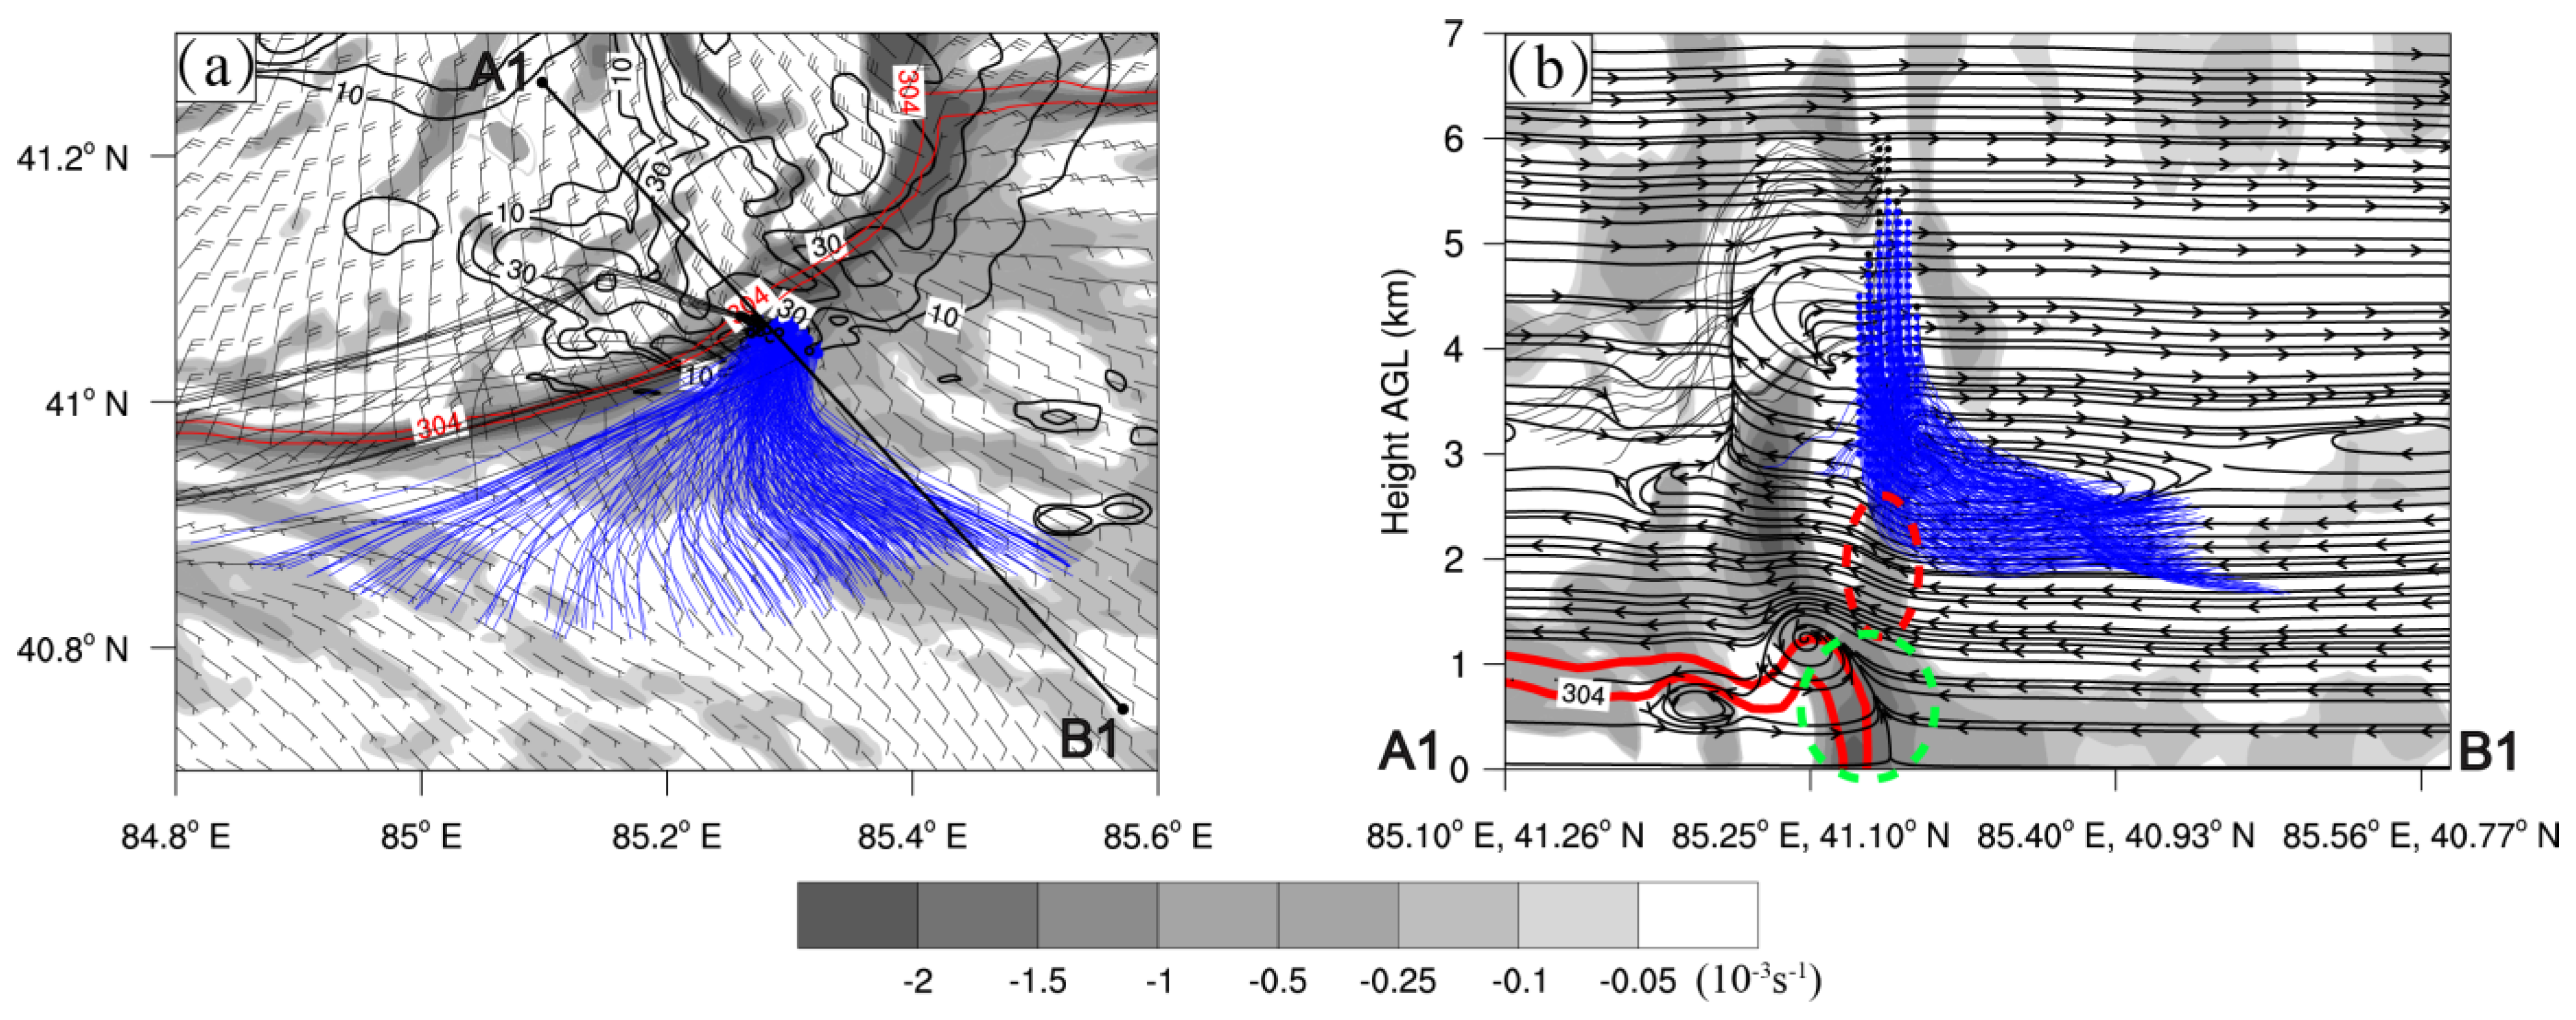
In order to obtain an intuitional understanding about the extension term which provided major contribution for the a d during the CI process within the selected convective cell, we will further investigate the related features of the backward trajectories of the selected air parcels within the convective cell in the following section. Figure 10 shows the divergence and backward trajectories in the area near where the CI occurred. Figure 10b shows the vertical cross section of the divergence and streamlines along the cross section in front of the cold pool (i.e., the GF) at the moment of the CI, along with the projection of the backward trajectories of the selected air parcels. It is clear that there is an intense convergence (indicated by the green dashed ellipse) in the low level below 1.3 km AGL near the GF, along with another convergence (denoted by the red dashed ellipse) which appeared in the level 1.3–2.5 km AGL above the GF. This convergence is known as elevated convergence in this study. The elevated convergence is located just below the location of the selected air parcels at this time. In order to obtain a clearer insight into the spatial relationship between the air parcels and the elevated convergence before the CI, the averaged backward trajectories and locations of the air parcels are analyzed in Figure 11. As shown in Figure 11a, the elevated convergence showed relatively weak intensity (reaching <−0.1 × 10⁻³ s−1, indicated by the red dashed ellipse) just below the averaged location of the air parcels at about 9 min before the CI. At about 6 min before the CI (Figure 11b), the elevated convergence (denoted by the red dashed ellipse) strengthened to some extent (reaching about −0.3 × 10⁻³ s−1), and its vertical extent was also stretched to the level of about 2.5 km AGL. At this time, there were two obvious rotor circulations at about 3 km AGL, and the strengthening of the elevated convergence was almost synchronized with the strengthening of the one rotor circulation located closer to the selected convective cell. These rotor circulations centered at about 3 km AGL look like the horizontal convective rolls; therefore, they are called mid-level horizontal convective rolls (MHCRs) in this study. At 3 min before the CI (Figure 11c), the elevated convergence (indicated by the red dashed ellipse) above the GF was intensified both in size and intensity, showing the intensity of <−0.5 × 10⁻³ s−1 and vertical extent up to ~2.9 km AGL. At this time, the averaged location of the air parcels was lifted up to about 3.5 km AGL, and it was just located above the elevated convergence. It can be deduced that the elevated convergence provided important dynamical convergent forcing (i.e., the intuitive explanation for the extension term mentioned above) to the updrafts of the air parcels during the CI process of the selected representative convective cell.
In order to further investigate the cause of the elevated convergence above the GF, we will further analyze the vertical cross section of the basic dynamic features in the following section. As can be seen in Figure 12a, there was a clear convergent boundary near the leading edge of the GF. It can be seen from the vertical cross section (i.e., Figure 12b) along a line segment (i.e., A2B2) perpendicular to the GF that the vertical extent of the convergence boundary in the low level near the GF was up to 2.5 km ASL (i.e., ~1.5 km AGL), and the elevated convergence (indicated by the red dashed ellipse) above the GF was located at the height of about 2.5–4.2 km ASL (i.e., about 1.5–3.2 km AGL). There was an updraft (indicated by the red hollow arrow) due to the low-level convergence near the leading edge of the GF. In addition, it can be seen from the streamline that there was also an airflow (denoted by the black hollow arrow) brought by the lower branch flow of the MHCRs, coming from the opposite direction of the GF (i.e., easterly winds). Therefore, it can be deduced that the elevated convergence was probably generated due to the convergent effect of these two airflows mentioned above. Consequently, the intense updraft (reaching the value of about 7 m s−1) generated in the level of 3.5–5.5 km AGL was probably due to the dynamic forcing of the elevated convergence (indicated by the black hollow arrow). This conclusion is consistent with the results of the aforementioned analyses based on the backward trajectory analysis of the dynamic forcing ( a d ) for which the extension (denoting the influence of the elevated convergence here) was the major contributor to the a d .
The vertical cross section of the horizontal divergence and vertical wind shear along another line segment (A3B3) were analyzed in the following section, in order to obtain a more robust understanding about the elevated convergence and MHCRs mentioned above. At 0212 UTC (Figure 13b), there are two MHCRs (indicated by the red dashed ellipse) centered at about 3.5 km AGL that can be identified ahead of the GF. By 0215 UTC (Figure 13c), a significant elevated convergence (denoted by the black ellipse) can be identified near the MHCR which is nearly located above the GF, and the corresponding convective cell (indicated by blue contours) which occurred above the elevated convergence. Consequently, it can be concluded that the HCRs and associated elevated convergence above the GF co-existed during the CI process in this case. Moreover, it is noteworthy that a similar elevated convergence can be found in the middle area between the two MHCRs. This kind of elevated convergence may contribute to the CIs that occurred over the area farther from the leading edge of the GF to some extent. However, there was no low-level convergence that can help to further enhance the elevated convergence (which is considered to be an important contributor for the dynamical forcing) in the intermediate region between the two MHCRs; therefore, the CIs were hardly (only a few, if any) able to occur here. As can be seen from the vertical wind shear (Figure 13d,e), relatively strong vertical shear of the horizontal wind (VSHW) occurred at an altitude of about 3.5–5 km ASL in the environment ahead of the GF (shown by the black ellipses). The maximum value of the VSHW was more than 11 × 10−3 s−2. In addition, the wind directions in the low level below 3 km ASL and mid-level above 3.5 km ASL are opposite each other. Therefore, this kind of environment with high VSHW was responsible for the formation of the MHCRs in this area.
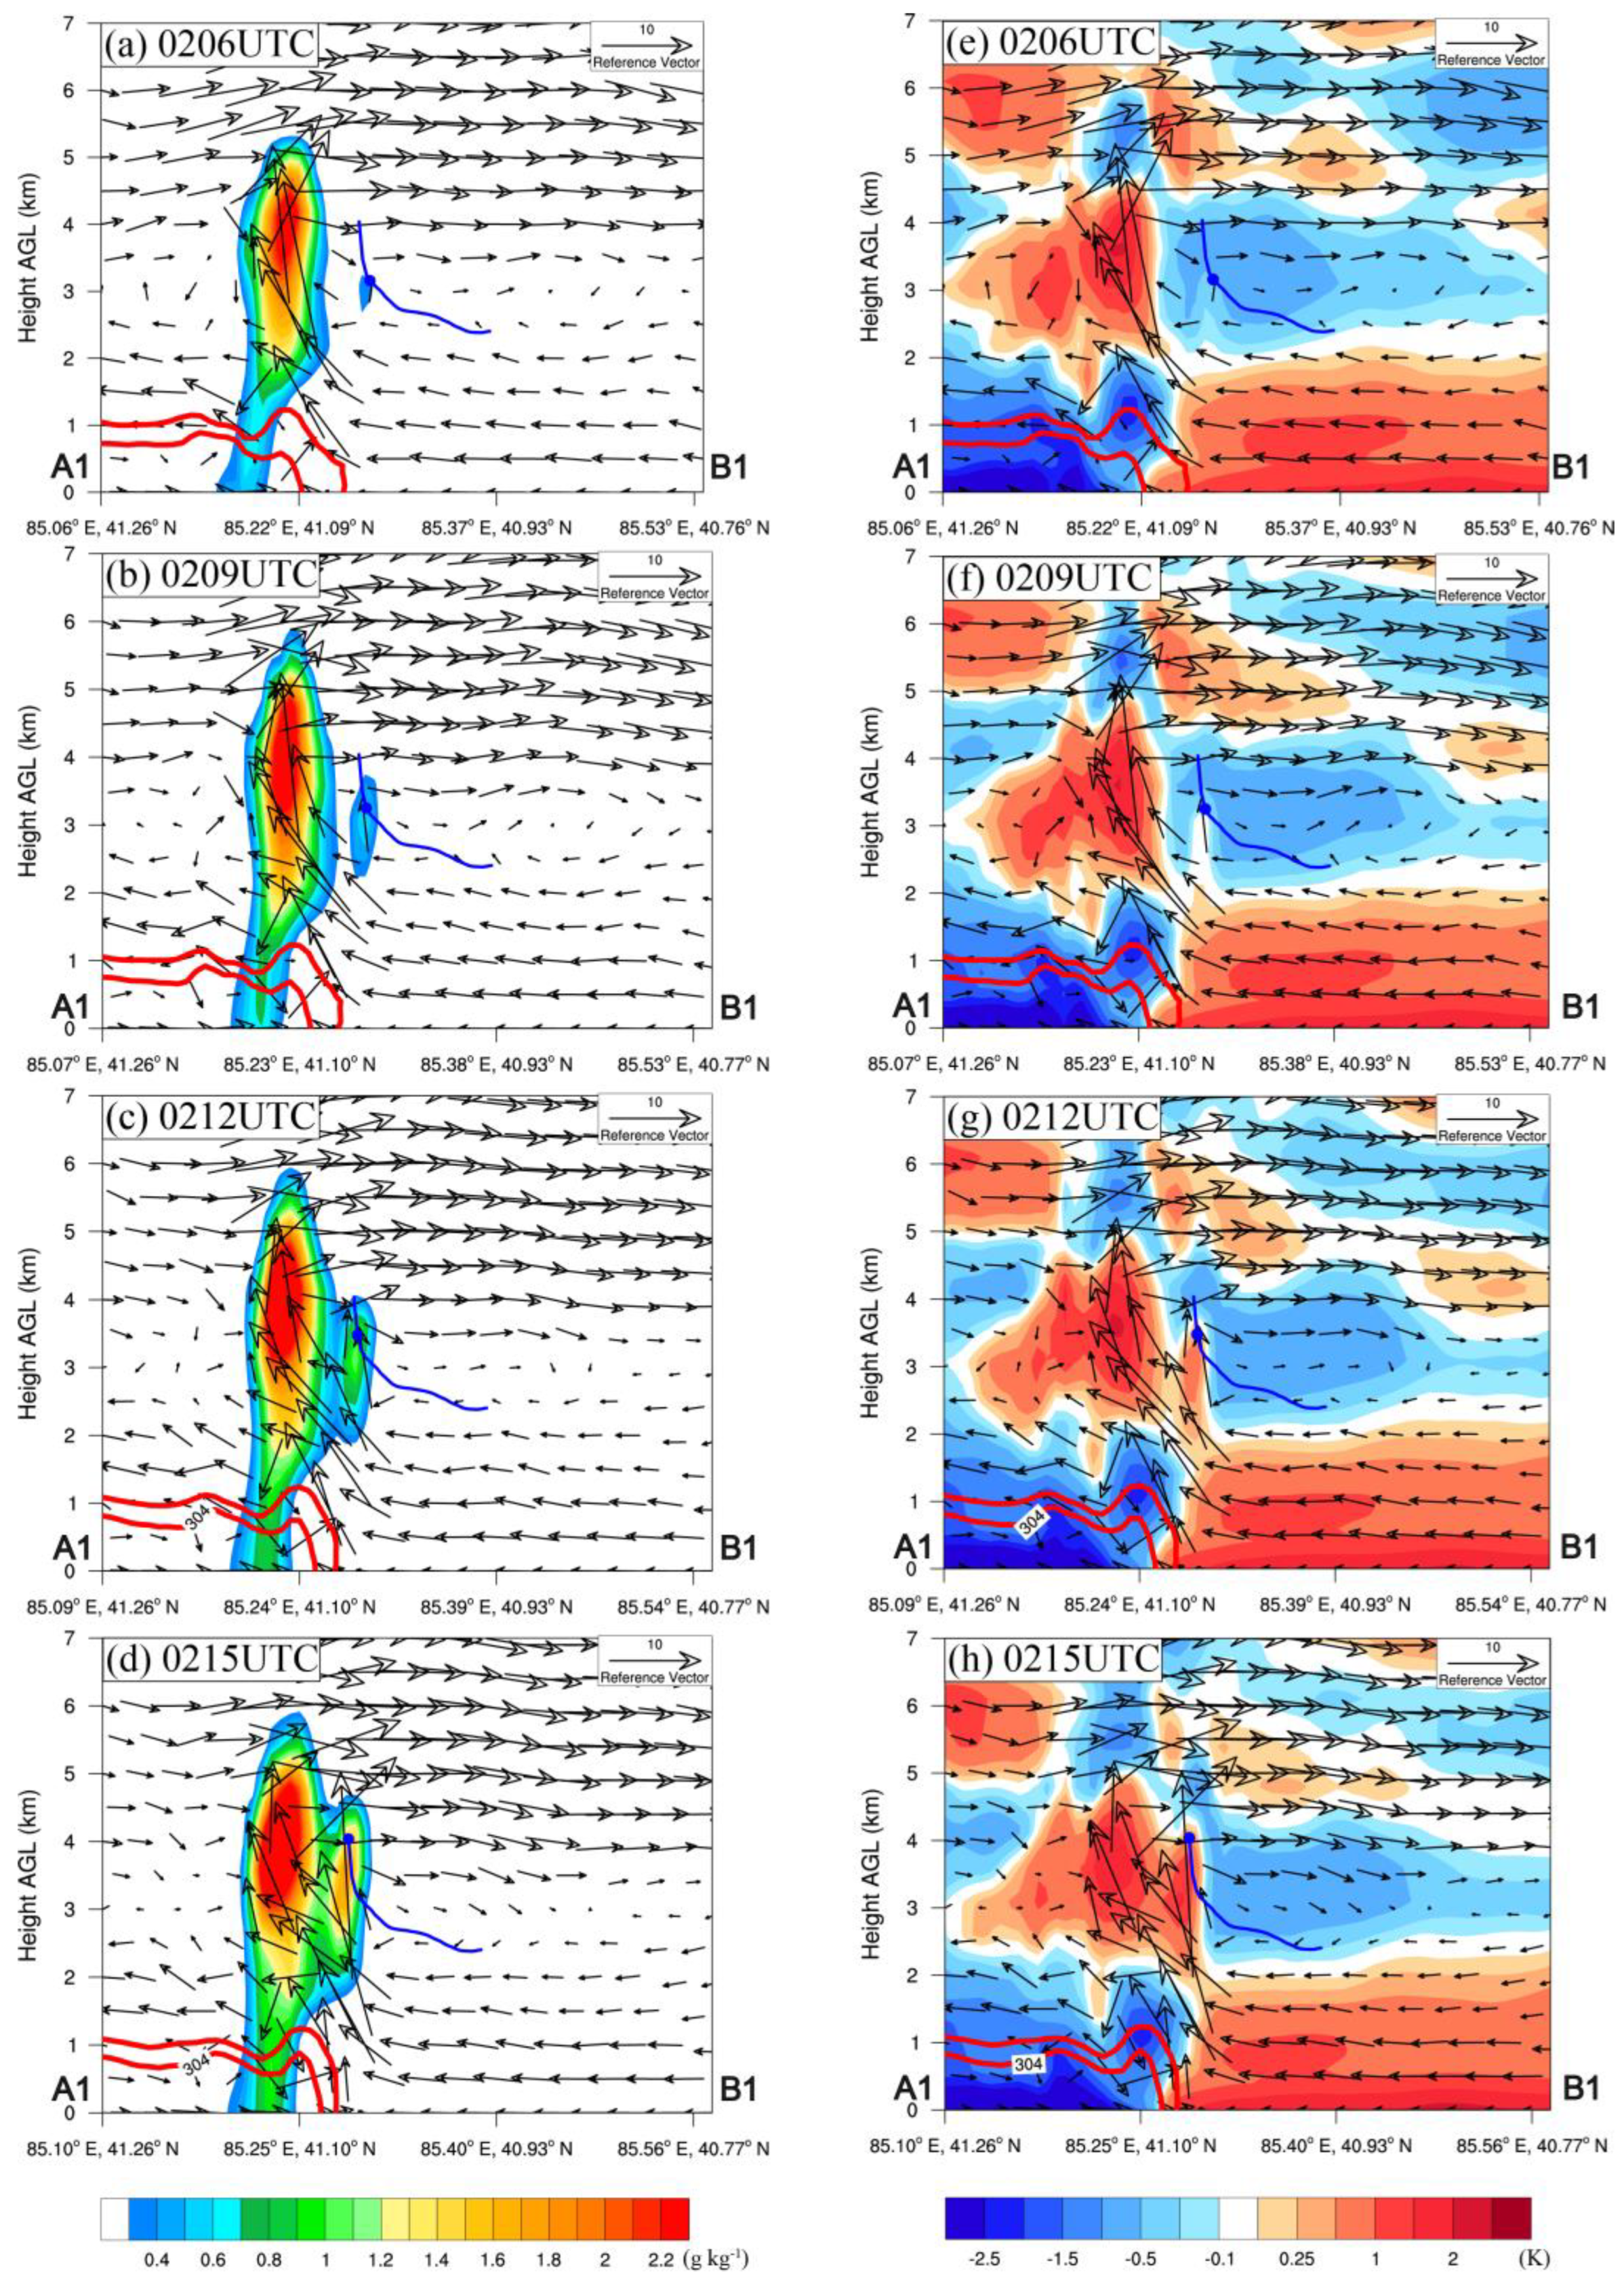
Since the a b d dominates the a b in our previous analysis, we analyzed the characteristics of the vertical cross section of the hydrometeors and the potential temperature anomaly, in order to investigate the main causes of the a b in the following section, because this kind of warming phenomenon was speculated to occur due to the release of latent heat during the condensation of the hydrometeors. At 0206 UTC (Figure 14a,e), the potential temperature anomaly in the environment around the rising air parcels was negative. As time goes on (Figure 14b,c,f,g), significant amounts of hydrometeors began to occur due to the upward movement of the air parcels, along with the significant positive value of the potential temperature anomaly, showing the warming effect due to the release of latent heat in the level of about 2–3.8 km AGL. By 0215 UTC (Figure 14d,h), the hydrometeors and positive potential temperature anomalies had reached very significant states. Consequently, it can be deduced that the release of the latent heat by hydrometeors contributed to the a b .

4. Discussion

The CI has long been one of the primary foci of studies on convective storms because it is essential in the organization and development of the convective storms, and the accurate prediction of the CI plays a significant role in the short-term forecast and nowcasting of severe convective weather. Therefore, many scholars around the world have conducted plenty of research on the CI [58,59,60,61,62,63,64,65]. The results of the Convective Storms Initiation Project (CSIP) carried out by Browning et al. [66] in the southern United Kingdom suggested that the formation of dynamical instabilities at outflow boundaries (i.e., cold pools) and the rise of low-level convergence play an important role in the formation and intensification of convection. The findings in our study (i.e., the CI is subject to convergent lifting near the leading edge of the GF) is consistent with their conclusions. Kang et al. [17] used numerical simulations to study an extreme rainstorm associated with a cold pool that occurred in the Taihang Mountains in northern China, where they found that convective cells were triggered along convergent lines. They noted that the convergent lines were mainly influenced by the combination of cold pool and topography, and that the convergent lines generated by the cold pool are similar to that of our study.
In the previous study [14] on the CI mechanisms over the Bohai Bay region, a similar diagnostic analysis of the vertical acceleration through the Lagrangian backward trajectories showed that, although both vertical and horizontal extension terms played a positive role during the CI process, the twisting term had the greatest contribution to the CI. The twisting term in that study reflects the vertical tilting (to the forward of the GF) of an elevated updraft which was generated by the convergence of a forward-tilting updraft at the GF leading edge and another airflow coming from ahead of the GF. Another investigation [9] on the CI mechanisms over the southwestern Xinjiang stated that the vertical twisting related to the vertical shear of horizontal wind almost completely dominated the dynamic acceleration, while the horizontal curvature and extension showed a very weak contribution. In addition, another study on the CI mechanisms associated with the merger of an immature sea-breeze front and gust front in the Bohai Bay region concluded that the vertical twisting and extension contributed significantly to the dynamic acceleration, and the vertical twisting was generated due to the vertical shear of horizontal wind, while the extension indicated convergences owing to a mid-level blocking convergence effect and squeezing, and (or) the merging of the convergent leading edges of both fronts during their merger processes. However, our findings in the present work differs from these previous works in many aspects. For example, we found that the elevated convergence, which is considered to be the major contributor to the dynamic acceleration, was generated due to the convergent effect of two airflows. One of them was the updraft generated due to the convergence in the low level (below 1.5 km AGL) near the leading edge of the GF, and the other one was the lower branch flow of the mid-level horizontal convective rolls (MHCRs) ahead of the GF. These findings are summarized in Figure 15.
The present findings suggest that it might be useful to pay attention to the MHCRs ahead of the GF when considering the CI in this region. However, given that our present work is only a case study and given the significant complexity of the CI process, additional other studies on the CI mechanisms in the region are needed to obtain more comprehensive results about the CI mechanisms.

5. Conclusions

This paper investigates the convection initiation (CI) mechanisms of severe convective weather associated with a gusty front (GF) on 9 July 2016 in Korla based on automatic weather stations’ (AWSs) observations, Doppler weather radar, reanalysis data, and WRF model high-resolution simulation data. The Korla Doppler weather radar observations indicate that a GF oriented in the northeast–southwest direction was located roughly 10–20 km southeast of the Korla radar station during this severe convective weather event. During the eastward movement of the GF, several convective cells were triggered in its vicinity, which developed rapidly and merged with the convective system behind it to further develop and maintain the convective system. Such multiple convective cells successively occurred in the region near the GF and merged with the convective system behind to intensify the mesoscale convective system (MCS). The rapid development and maintenance of the MCS during their eastward movement were responsible for the occurrence of the heavy precipitation in the region. The major conclusions of this study are as follows:
(1)
This severe convective weather process occurred in favorable conditions with the southwesterly airflow ahead of the Central Asian Trough (CAT) at 500 hPa and the warm and humid southwesterly airflows at 700 hPa. In addition, there was relatively high convective effective potential energy before the occurrence of the rainstorm, and the warm advection at the lower level also provided a favorable condition for the CI.
(2)
The high-resolution WRF model reproduced the severe convective weather and the CI process associated with the GF well. Further analysis based on the vertical momentum budget along the Lagrangian backward trajectories showed that all of the air parcels came from above the planetary boundary layer height; therefore, the convection belonged to “elevated convection”.
(3)
The vertical acceleration of the air parcels during the CI process was decomposed into dynamic acceleration ( a d ) and buoyant acceleration ( a b ), and both of them positively contributed almost in similar strength to the vertical acceleration. The further decomposition of the a d showed that it was mainly dominated by the extension term, while the curvature provides a small positive contribution. However, the twisting term provided a negative contribution to the a d . The a b is mainly controlled by the buoyant acceleration generated due to the release of latent heat with the ascending of the air parcels.
(4)
Further investigations showed that the elevated convergence above the GF in the level about 1.5–3.2 km AGL was the intuitional physical meaning of the extension term which had dominated the a d . This elevated convergence was generated due to the convergent effect of these two airflows: one was the updraft generated due to the convergence in the low level (below 1.5 km AGL) near the leading edge of the GF, while the other one was the lower branch flow of the mid-level horizontal convective rolls (MHCRs) which centered at about 3–3.5 km AGL ahead of the GF. The MHCRs were generated due to the vertical shear of the horizontal winds in that level in front of the GF.

Author Contributions

Data curation: A.A. (Aerzuna Abulimiti), Q.S. and L.Y. (Lin Yuan); formal analysis: A.A. (Aerzuna Abulimiti), Q.S. and L.Y. (Lin Yuan); investigation: A.A. (Aerzuna Abulimiti), Q.S. and L.Y. (Lin Yuan); methodology: A.A. (Aerzuna Abulimiti), Q.S., L.Y. (Lin Yuan), J.M. and L.Y. (Lianmei Yang); project administration: L.Y. (Lianmei Yang); resources: J.Y., L.Y. (Lianmei Yang) and A.A. (Aerzuna Abulimiti); software: A.A. (Aerzuna Abulimiti), Q.S. and J.Y.; supervision: Y.L., J.M. and A.A. (Abuduwaili Abulikemu); validation: Q.S., A.A. (Aerzuna Abulimiti) and A.A. (Abuduwaili Abulikemu); writing—original draft: A.A. (Aerzuna Abulimiti), Q.S. and L.Y. (Lin Yuan); writing—review and editing: A.A. (Abuduwaili Abulikemu), Q.S., L.Y. (Lin Yuan), L.Y. (Lianmei Yang) and J.M. All authors have read and agreed to the published version of the manuscript.

Funding

This work was sponsored by the National Key Research and Development Program of China (No. 2018YFC1507103), Natural Science Foundation of Xinjiang Uygur Autonomous Region (No. 2022D01D86), Tianshan Mountains Talent Project (Grant No. 2022TSYCLJ0003), National Natural Science Foundation of China (No. 42265003), 100 Young Doctors Intro-duction Program of Xinjiang (Tianchi Doctor Program) Foundation (No. 50500/04231200737), and Doctoral Research Startup Foundation of Xinjiang University (No. 50500/62031224618).

Data Availability Statement

The NCEP FNL data can be downloaded from https://rda.ucar.edu/datasets/ds083.2 accessed on 15 June 2022.

Acknowledgments

We thank the anonymous reviewers and all editors for their valuable comments, suggestions and efforts during the handling of our manuscript. We also thank for the High-Performance Computing Center of Nanjing University for performing the numerical calculations in this paper on its IBM Blade cluster system.

Conflicts of Interest

The authors declare no conflict of interest.

References

  1. Marengo, J.A.; Alcantara, E.; Cunha, A.P.; Seluchi, M.; Nobre, C.A.; Dolif, G.; Goncalves, D.; Assis Dias, M.; Cuartas, L.A.; Bender, F.; et al. Flash Floods and Landslides in the City of Recife, Northeast Brazil after Heavy Rain on May 25–28, 2022: Causes, Impacts, and Disaster Preparedness. Weather. Clim. Extrem. 2023, 39, 100545. [Google Scholar] [CrossRef]
  2. Masson-Delmotte, V.; Zhai, P.; Pirani, A.; Connors, S.L.; Péan, C.; Berger, S.; Caud, N.; Chen, Y.; Goldfarb, L.; Gomis, M.I. Climate Change 2021: The Physical Science Basis; Cambridge University Press: Cambridge, UK, 2021; Volume 2. [Google Scholar]
  3. Nanditha, J.S.; Kushwaha, A.P.; Singh, R.; Malik, I.; Solanki, H.; Chuphal, D.S.; Dangar, S.; Mahto, S.S.; Vegad, U.; Mishra, V. The Pakistan Flood of August 2022: Causes and Implications. Earths Future 2023, 11, e2022EF003230. [Google Scholar] [CrossRef]
  4. Li, Z.; Abulikemu, A.; Zhu, K.; Mamtimin, A.; Zeng, Y.; Li, J.; Abulimiti, A.; Kadier, Z.; Abuduaini, A.; Li, C.; et al. Diurnal Variation Characteristics of Summer Precipitation and Related Statistical Analysis in the Ili Region, Xinjiang, Northwest China. Remote Sens. 2023, 15, 3954. [Google Scholar] [CrossRef]
  5. Chen, G.; Zhao, K.; Lu, Y.; Zheng, Y.; Xue, M.; Tan, Z.-M.; Xu, X.; Huang, H.; Chen, H.; Xu, F. Variability of Microphysical Characteristics in the “21· 7” Henan Extremely Heavy Rainfall Event. Sci. China Earth Sci. 2022, 65, 1861–1878. [Google Scholar] [CrossRef]
  6. Kong, M.; Abulikemu, A.; Zheng, J.; Aireti, M.; An, D. A Case Study on Convection Initiation Associated with Horizontal Convective Rolls over Ili River Valley in Xinjiang, Northwest China. Water 2022, 14, 1017. [Google Scholar] [CrossRef]
  7. He, X.; Abulikemu, A.; Mamtimin, A.; Li, R.; Abulimiti, A.; An, D.; Aireti, M.; Zhou, Y.; Sun, Q.; Li, Z.; et al. On the Mechanisms of a Snowstorm Associated with a Low-Level Cold Front and Low-Level Jet in the Western Mountainous Region of the Junggar Basin, Xinjiang, Northwest China. Atmosphere 2023, 14, 919. [Google Scholar] [CrossRef]
  8. Abulikemu, A.; Xu, X.; Wang, Y.; Ding, J.; Zhang, S.; Shen, W. A Modeling Study of Convection Initiation Prior to the Merger of a Sea-Breeze Front and a Gust Front. Atmos. Res. 2016, 182, 10–19. [Google Scholar] [CrossRef]
  9. Abulikemu, A.; Ming, J.; Xu, X.; Zhuge, X.; Wang, Y.; Zhang, Y.; Zhang, S.; Yu, B.; Aireti, M. Mechanisms of Convection Initiation in the Southwestern Xinjiang, Northwest China: A Case Study. Atmosphere 2020, 11, 1335. [Google Scholar] [CrossRef]
  10. Dalagnol, R.; Gramcianinov, C.B.; Crespo, N.M.; Luiz, R.; Chiquetto, J.B.; Marques, M.T.A.; Neto, G.D.; de Abreu, R.C.; Li, S.; Lott, F.C.; et al. Extreme Rainfall and Its Impacts in the Brazilian Minas Gerais State in January 2020: Can We Blame Climate Change? Clim. Resil. Sustain. 2022, 1, e15. [Google Scholar] [CrossRef]
  11. Sun, Q.; Abulikemu, A.; Yao, J.; Mamtimin, A.; Yang, L.; Zeng, Y.; Li, R.; An, D.; Li, Z. A Case Study on the Convection Initiation Mechanisms of an Extreme Rainstorm over the Northern Slope of Kunlun Mountains, Xinjiang, Northwest China. Remote Sens. 2023, 15, 4505. [Google Scholar] [CrossRef]
  12. Abulikemu, A.; Xu, X.; Wang, Y.; Ding, J.; Wang, Y. Atypical Occlusion Process Caused by the Merger of a Sea-Breeze Front and Gust Front. Adv. Atmos. Sci. 2015, 32, 1431–1443. [Google Scholar] [CrossRef]
  13. Zheng, J.; Abulikemu, A.; Wang, Y.; Kong, M.; Liu, Y. Convection Initiation Associated with the Merger of an Immature Sea-Breeze Front and a Gust Front in Bohai Bay Region, North China: A Case Study. Atmosphere 2022, 13, 750. [Google Scholar] [CrossRef]
  14. Abulikemu, A.; Wang, Y.; Gao, R.; Wang, Y.; Xu, X. A Numerical Study of Convection Initiation Associated With a Gust Front in Bohai Bay Region, North China. J. Geophys. Res. Atmos. 2019, 124, 13843–13860. [Google Scholar] [CrossRef]
  15. Hua, S.; Xu, X.; Chen, B. Influence of Multiscale Orography on the Initiation and Maintenance of a Precipitating Convective System in North China: A Case Study. J. Geophys. Res. Atmos. 2020, 125, e2019JD031731. [Google Scholar] [CrossRef]
  16. Wei, P.; Xu, X.; Xue, M.; Zhang, C.; Wang, Y.; Zhao, K.; Zhou, A.; Zhang, S.; Zhu, K. On the Key Dynamical Processes Supporting the 21.7 Zhengzhou Record-Breaking Hourly Rainfall in China. Adv. Atmos. Sci. 2023, 40, 337–349. [Google Scholar] [CrossRef]
  17. Kang, Y.; Peng, X.; Wang, S.; Hu, Y.; Shang, K.; Lu, S. Observational Analyses of Topographic Effects on Convective Systems in an Extreme Rainfall Event in Northern China. Atmos. Res. 2019, 229, 127–144. [Google Scholar] [CrossRef]
  18. Bai, L.; Meng, Z.; Huang, Y.; Zhang, Y.; Niu, S.; Su, T. Convection Initiation Resulting From the Interaction Between a Quasi-Stationary Dryline and Intersecting Gust Fronts: A Case Study. J. Geophys. Res. Atmos. 2019, 124, 2379–2396. [Google Scholar] [CrossRef]
  19. Wilhelmson, R.B.; Chen, C.-S. A Simulation of the Development of Successive Cells along a Cold Outflow Boundary. J. Atmos. Sci. 1982, 39, 1466–1483. [Google Scholar] [CrossRef]
  20. Harrison, S.J.; Mecikalski, J.R.; Knupp, K.R. Analysis of Outflow Boundary Collisions in North-Central Alabama. Weather Forecast 2009, 24, 1680–1690. [Google Scholar] [CrossRef]
  21. Wilson, J.W.; Schreiber, W.E. Initiation of Convective Storms at Radar-Observed Boundary-Layer Convergence Lines. Mon. Weather Rev. 1986, 114, 2516–2536. [Google Scholar] [CrossRef]
  22. Grasmick, C.; Geerts, B.; Turner, D.D.; Wang, Z.; Weckwerth, T.M. The Relation between Nocturnal MCS Evolution and Its Outflow Boundaries in the Stable Boundary Layer: An Observational Study of the 15 July 2015 MCS in PECAN. Mon. Weather Rev. 2018, 146, 3203–3226. [Google Scholar] [CrossRef]
  23. Hirt, M.; Craig, G.C.; Schäfer, S.A.K.; Savre, J.; Heinze, R. Cold-pool-driven Convective Initiation: Using Causal Graph Analysis to Determine What Convection-permitting Models Are Missing. Q. J. R. Meteorol. Soc. 2020, 146, 2205–2227. [Google Scholar] [CrossRef]
  24. Xian, Z.; Pielke, R.A. The Effects of Width of Landmasses on the Development of Sea Breezes. J. Appl. Meteorol. 1991, 1280–1304. Available online: https://www.jstor.org/stable/26185605 (accessed on 23 September 2023). [CrossRef]
  25. Lee, O.; Shun, C.M. Observation of Sea Breeze Interactions at and near Hong Kong International Airport. Meteorol. Appl. 2003, 10, 1–9. [Google Scholar] [CrossRef]
  26. Bergemann, M.; Jakob, C.; Lane, T.P. Global Detection and Analysis of Coastline-Associated Rainfall Using an Objective Pattern Recognition Technique. J. Clim. 2015, 28, 7225–7236. [Google Scholar] [CrossRef]
  27. Wu, F.; Lombardo, K. Precipitation Enhancement in Squall Lines Moving over Mountainous Coastal Regions. J. Atmos. Sci. 2021, 78, 3089–3113. [Google Scholar] [CrossRef]
  28. Birch, C.E.; Roberts, M.J.; Garcia-Carreras, L.; Ackerley, D.; Reeder, M.J.; Lock, A.P.; Schiemann, R. Sea-Breeze Dynamics and Convection Initiation: The Influence of Convective Parameterization in Weather and Climate Model Biases. J. Clim. 2015, 28, 8093–8108. [Google Scholar] [CrossRef]
  29. Lock, N.A.; Houston, A.L. Empirical Examination of the Factors Regulating Thunderstorm Initiation. Mon. Weather Rev. 2014, 142, 240–258. [Google Scholar] [CrossRef]
  30. Markowski, P. Convective Storm Initiation and Organization. In Atmospheric Convection: Research and Operational Forecasting Aspects; Springer: Berlin/Heidelberg, Germany, 2007; pp. 23–28. [Google Scholar]
  31. Schumacher, R.S.; Clark, A.J.; Xue, M.; Kong, F.; Schumacher, R. Factors Influencing the Development and Maintenance of Nocturnal Heavy-Rain-Producing Convective Systems in a 2 Storm-Scale Ensemble. Mon. Weather. Rev. 2013, 141, 2778–2801. [Google Scholar] [CrossRef]
  32. Xiao, X.; Sun, J.; Chen, M.; Qie, X.; Ying, Z.; Wang, Y.; Ji, L. Comparison of Environmental and Mesoscale Characteristics of Two Types of Mountain-to-Plain Precipitation Systems in the Beijing Region, China. J. Geophys. Res. Atmos. 2019, 124, 6856–6872. [Google Scholar] [CrossRef]
  33. Xu Dr., W.; Zipser, E.E.; Chen, Y.L.; Liu, C.; Liou, Y.C.; Lee, W.C.; Jou, B.J.D. An Orography-Associated Extreme Rainfall Event during TiMREX: Initiation, Storm Evolution, and Maintenance. Mon. Weather Rev. 2012, 140, 2555–2574. [Google Scholar] [CrossRef]
  34. Jeong, J.H.; Lee, D.I.; Wang, C.C. Impact of the Cold Pool on Mesoscale Convective System-Produced Extreme Rainfall over Southeastern South Korea: 7 July 2009. Mon. Weather Rev. 2016, 144, 3985–4006. [Google Scholar] [CrossRef]
  35. Yu, C.-K.; Lin, C.-Y. Formation and Maintenance of a Long-Lived Taiwan Rainband during 1–3 March 2003. J. Atmos. Sci. 2017, 74, 1211–1232. [Google Scholar] [CrossRef]
  36. Schenkman, A.D.; Xue, M.; Dawson, D.T. The Cause of Internal Outflow Surges in a High-Resolution Simulation of the 8 May 2003 Oklahoma City Tornadic Supercell. J. Atmos. Sci. 2016, 73, 353–370. [Google Scholar] [CrossRef]
  37. Klemp, J.B.; Rotunno, R. A Study of the Tornadic Region within a Supercell Thunderstorm. J. Atmos. Sci. 1983, 40, 359–377. [Google Scholar] [CrossRef]
  38. Weisman, M.L.; Evans, C.; Bosart, L. The 8 May 2009 Superderecho: Analysis of a 3 Km WRF--ARW Realtime Forecast. In Proceedings of the 25th Conference on Severe Local Storms, Denver, CO, USA, 11–14 October 2010. [Google Scholar] [CrossRef]
  39. Xu, X.; Xue, M.; Wang, Y. Mesovortices within the 8 May 2009 Bow Echo over the Central United States: Analyses of the Characteristics and Evolution Based on Doppler Radar Observations and a High-Resolution Model Simulation. Mon. Weather Rev. 2015, 143, 2266–2290. [Google Scholar] [CrossRef]
  40. Li, Q.; Wang, B.; Xu, J. Energy Balance and Momentum Budgets Due to the Internal Tides Generated by a Group of Submarine Canyons. Ocean Model. 2023, 181, 102126. [Google Scholar] [CrossRef]
  41. Fu, S.; Rotunno, R.; Xue, H. Convective Updrafts near Sea-Breeze Fronts. Atmos. Chem. Phys. 2022, 22, 7727–7738. [Google Scholar] [CrossRef]
  42. Xu, X.; Xue, M.; Wang, Y.; Huang, H. Mechanisms of Secondary Convection within a Mei-Yu Frontal Mesoscale Convective System in Eastern China. J. Geophys. Res. 2017, 122, 47–64. [Google Scholar] [CrossRef]
  43. Du, Y.; Shen, Y.; Chen, G. Influence of Coastal Marine Boundary Layer Jets on Rainfall in South China. Adv. Atmos. Sci. 2022, 39, 782–801. [Google Scholar] [CrossRef]
  44. Du, Y.; Zhang, Q.; Chen, Y.L.; Zhao, Y.; Wang, X. Numerical Simulations of Spatial Distributions and Diurnal Variations of Low-Level Jets in China during Early Summer. J. Clim. 2014, 27, 5747–5767. [Google Scholar] [CrossRef]
  45. Marion, G.R.; Trapp, R.J. The Dynamical Coupling of Convective Updrafts, Downdrafts, and Cold Pools in Simulated Supercell Thunderstorms. J. Geophys. Res. Atmos. 2019, 124, 664–683. [Google Scholar] [CrossRef]
  46. Jeevanjee, N.; Romps, D.M. Effective Buoyancy, Inertial Pressure, and the Mechanical Generation of Boundary Layer Mass Flux by Cold Pools. J. Atmos. Sci. 2015, 72, 3199–3213. [Google Scholar] [CrossRef]
  47. Xu, K.-M.; Randall, D.A. Updraft and Downdraft Statistics of Simulated Tropical and Midlatitude Cumulus Convection. J. Atmos. Sci. 2001, 58, 1630–1649. [Google Scholar] [CrossRef]
  48. Thomsen, S.; Greatbatch, R.J.; Dengler, M.; Kanzow, T.; Krahmann, G. Near-Inertial Waves Interacting with a Coherent Anticyclone off Peru. In Proceedings of the Nergy Transfers in Atmosphere and Ocean, Hamburg, Germany, 20–22 April 2015. [Google Scholar]
  49. Xu, X.; Xue, M.; Wang, Y. The Genesis of Mesovortices within a Real-Data Simulation of a Bow Echo System. J. Atmos. Sci. 2015, 72, 1963–1986. [Google Scholar] [CrossRef]
  50. Torri, G.; Kuang, Z.; Tian, Y. Mechanisms for Convection Triggering by Cold Pools. Geophys. Res. Lett. 2015, 42, 1943–1950. [Google Scholar] [CrossRef]
  51. Duolaite, X. Formulation of Precipitation Intensity Standard of Xinjiang. Chin. J. Desert Oasis Meteorol. 2005, 28, 7–8. [Google Scholar]
  52. Skamarock, W.C.; Klemp, J.B.; Dudhia, J.; Gill, D.O.; Liu, Z.; Berner, J.; Wang, W.; Powers, J.G.; Duda, M.G.; Barker, D.M. A Description of the Advanced Research WRF Version 4. NCAR Tech. Note Ncar/Tn-556+ Str 2019, 145. [Google Scholar]
  53. Hong, S.-Y.; Noh, Y.; Dudhia, J. A New Vertical Diffusion Package with an Explicit Treatment of Entrainment Processes. Mon. Weather Rev. 2006, 134, 2318–2341. [Google Scholar] [CrossRef]
  54. Jiménez, P.A.; Dudhia, J.; González-Rouco, J.F.; Navarro, J.; Montávez, J.P.; García-Bustamante, E. A Revised Scheme for the WRF Surface Layer Formulation. Mon. Weather Rev. 2012, 140, 898–918. [Google Scholar] [CrossRef]
  55. Chen, F.; Dudhia, J. Coupling an Advanced Land Surface–Hydrology Model with the Penn State–NCAR MM5 Modeling System. Part I: Model Implementation and Sensitivity. Mon. Weather Rev. 2001, 129, 569–585. [Google Scholar] [CrossRef]
  56. Iacono, M.J.; Delamere, J.S.; Mlawer, E.J.; Shephard, M.W.; Clough, S.A.; Collins, W.D. Radiative Forcing by Long-lived Greenhouse Gases: Calculations with the AER Radiative Transfer Models. J. Geophys. Res. Atmos. 2008, 113, D13103. [Google Scholar] [CrossRef]
  57. Adams, J.C. MUDPACK: Multigrid Portable FORTRAN Software for the Efficient Solution of Linear Elliptic Partial Differential Equations. Appl. Math. Comput. 1989, 34, 113–146. [Google Scholar] [CrossRef]
  58. Yin, J.; Gu, H.; Liang, X.; Yu, M.; Sun, J.; Xie, Y.; Li, F.; Wu, C. A Possible Dynamic Mechanism for Rapid Production of the Extreme Hourly Rainfall in Zhengzhou City on 20 July 2021. J. Meteorol. Res. 2022, 36, 6–25. [Google Scholar] [CrossRef]
  59. Luo, Y.; Du, Y. The Roles of Low-Level Jets in “21·7” Henan Extremely Persistent Heavy Rainfall Event. Adv. Atmos. Sci. 2023, 40, 350–373. [Google Scholar] [CrossRef]
  60. LeBel, L.J.; Markowski, P.M. An Analysis of the Impact of Vertical Wind Shear on Convection Initiation Using Large-Eddy Simulations- Importance of Wake Entrainment. Mon. Weather Rev. 2023, 151, 1667–1688. [Google Scholar] [CrossRef]
  61. Feng, Z.; Varble, A.; Hardin, J.; Marquis, J.; Hunzinger, A.; Zhang, Z.; Thieman, M. Deep Convection Initiation, Growth, and Environments in the Complex Terrain of Central Argentina during CACTI. Mon. Weather Rev. 2021, 150, 1135–1155. [Google Scholar] [CrossRef]
  62. Singh, I.; Nesbitt, S.W.; Davis, C.A. Quasi-Idealized Numerical Simulations of Processes Involved in Orogenic Convection Initiation over the Sierras de Córdoba. J. Atmos. Sci. 2022, 79, 1127–1149. [Google Scholar] [CrossRef]
  63. Su, L.; Sun, X.; Du, Y.; Fung, J.C.H.; Chen, G. The Roles of Local Convergences in the Convection Initiation of a Record-Breaking Rainfall Event at the Coastal Pearl River Delta in South China. J. Geophys. Res. Atmos. 2023, 128, e2022JD037234. [Google Scholar] [CrossRef]
  64. Fedorovich, E.; Gibbs, J.A.; Shapiro, A. Numerical Study of Nocturnal Low-Level Jets over Gently Sloping Terrain. J. Atmos. Sci. 2017, 74, 2813–2834. [Google Scholar] [CrossRef]
  65. Rao, X.; Zhao, K.; Chen, X.; Huang, A.; Hu, S.; Hu, D.; Liu, X. Roles of Multi-Scale Orography in Triggering Nocturnal Convection at a Summer Rainfall Hotspot Over the South China Coast: A Case Study. J. Geophys. Res. Atmos. 2022, 127, e2022JD036503. [Google Scholar] [CrossRef]
  66. Browning, K.A.; Blyth, A.M.; Clark, P.A.; Corsmeier, U.; Morcrette, C.J.; Agnew, J.L.; Ballard, S.P.; Bamber, D.; Barthlott, C.; Bennett, L.J.; et al. The Convective Storm Initiation Project. Bull. Am. Meteorol. Soc. 2007, 88, 1939–1956. [Google Scholar] [CrossRef]
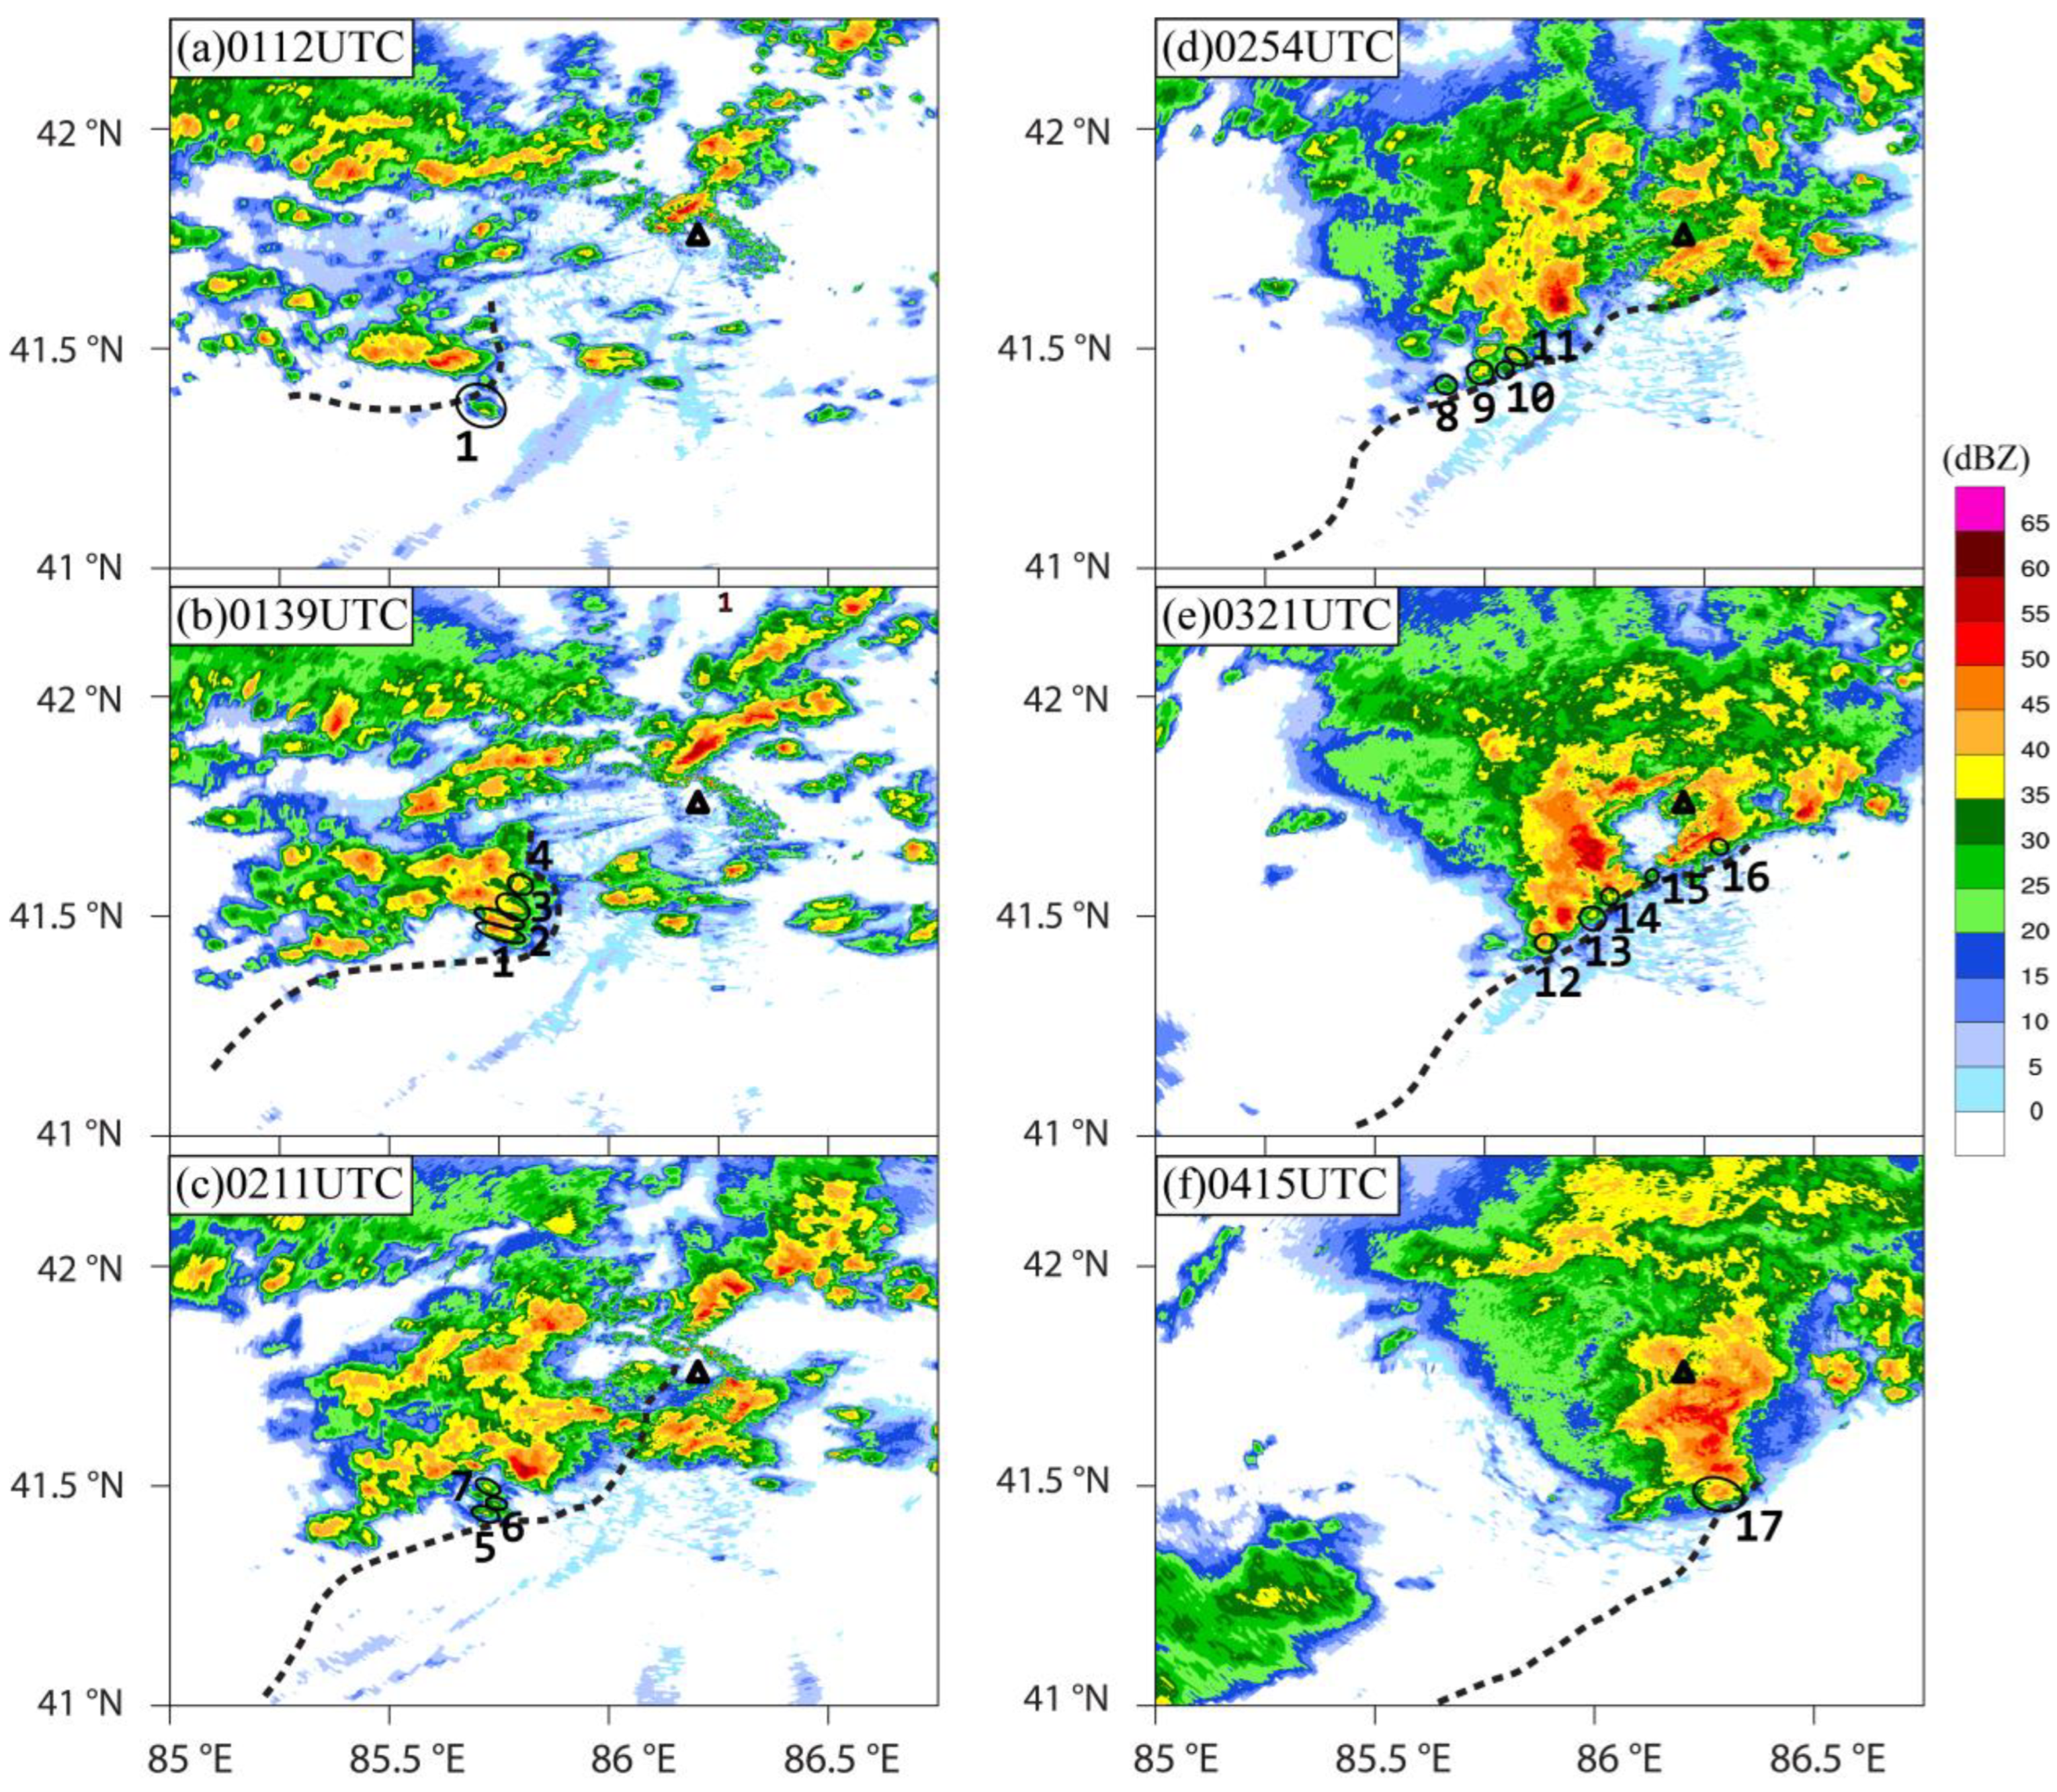
Figure 1. (af) Composite reflectivity (shading, units: dBZ) observed by the Korla Doppler weather radar (where the triangle symbol “Δ” is located) during heavy precipitation on 9 July 2016; the black thick dashed line indicates the GF. The location where the CIs occurred near the GF are indicated by black ellipses and circles with numbers. Detailed time of each panel is shown in the upper left corner.
Remotesensing 15 04812 g001
Figure 2. (ac) Variations of wind speed (red solid lines, units: m s−1), wind (wind barbs, half barbs and full barbs represent 2 and 4 m s−1, respectively), temperature (black solid line, units: °C), relative humidity (green solid line, units: %), and pressure (blue solid line, units: hPa) observed by the three ground-based automatic weather stations (i.e., S1, S2, and S3 shown in Figure 3a) on 9 July 2016. The discontinuities in (c) indicate the missing value of the meteorological elements at that time.
Remotesensing 15 04812 g002
Figure 3. (a) The main area where this severe convective weather occurred, i.e., the third nested (d03) area in (b), and the topographic elevation (shading, units: m). The black dots S1, S2, and S3 indicate the locations of the three ground-based automatic weather stations in Figure 4; the five-pointed star (☆) symbols indicate the NCEP-FNL sounding grid point; the black rectangular box indicates the main study area; and the black and gray solid lines indicate the national and regional boundaries, respectively. (b) The geographic locations and elevations of the WRF model domains (shading, units: m). Blue areas indicate lakes or oceans.
Remotesensing 15 04812 g003
Figure 4. (ad) Geopotential height (gray blue lines, units: gpm), temperature field (red dashed lines, units: °C), and wind field (wind barbs, half barbs, full barbs, and flags represent 2, 4, and 20 m s−1, respectively) at 500 hPa and 700 hPa heights at 0000 UTC and 0600 UTC on 9 July 2016, obtained from NCEP FNL reanalysis data. The colored shading in (c,d) shows the equivalent potential temperature (units: K) above 326 K, the thick green dashed line indicates the height trough, and the solid green line in (c) denotes the shear line. The specific time and height corresponding to each panel are labelled in their lower right corner.
Remotesensing 15 04812 g004
Figure 5. (a) Skew T-logP diagrams at 0000 UTC on 9 July 2016, obtained from the sounding observation data from the Korla meteorological station (its location is indicated by the “×” symbol in Figure 3a); (b) is the same as (a) but for the time at 0600 UTC and obtained from the NCEP FNL reanalysis data at (42°N, 86°E) (its location is indicated by the “☆” symbol in Figure 3a); (c) is the same as (a) but for the time at 1200 UTC, obtained from the sounding observation data from the Korla meteorological station. The detailed time corresponding to each panel is shown in the upper right corner.
Remotesensing 15 04812 g005
Figure 6. (ad) Composite reflectivity (shading, units: dBZ) observed by the Korla radar station on 9 July 2016; (eh) Simulated composite reflectivity (shading, units: dBZ) and wind field (wind barbs, half barbs, full barbs, and flags represent 2, 4, and 20 m s−1, respectively) at 10 m AGL (above ground level). The black thick dashed line indicates the GF, the red solid ellipse indicates the region where the CIs occurred near the GF, and the specific time corresponding to each panel is shown in the upper left corner.
Remotesensing 15 04812 g006
Figure 7. (a) Accumulated precipitation (units: mm) for 6 h (0000~0600 UTC) observed by ground-based automatic weather stations; (b) Simulated accumulative precipitation (shading, units: mm) during the same time period of (a). The black dashed ellipses represent the major precipitation centers in the study area.
Remotesensing 15 04812 g007
Figure 8. (a) Simulated composite reflectivity (shading, units: dBZ) and wind field at 10 m AGL (wind barbs, half barbs, full barbs, and flags represent 2, 4, and 20 m s−1, respectively) at 0215 UTC on 9 July 2016, and the black box and the letter “CI” in red indicate the selected representative convective cell; (b) is the same as (a) but plotted in a broader area, and overlaid the ground-relative backward trajectories (blue and black lines, projected to the ground, calculated from the time of occurrence of the CI) of air parcels for 2 h within the selected representative convective cell (shown in the black box in (a). The black dashed rectangular area shows the area used to calculate the mean planetary boundary level height (PBLH) shown in (c), and the trajectories of the air parcels came roughly from a south direction (including southeast and southwest direction) colored in blue, while the other trajectories of air parcels that came from the west (they also had relatively high altitudes at CI time) are in black. (c) Evolution of the height along the backward trajectories of air parcels with vertical velocities in the top 20% quantile at CI time (i.e., 0215 UTC) within the representative convective cell. The solid red line indicates the PBLH.
Remotesensing 15 04812 g008
Figure 9. (a) Evolution of the height along the backward trajectories of air parcels with vertical velocities in the top 20% quantile at CI time (i.e., at 0215 UTC) within the representative convective cell during the 30 min prior to the CI time; (b) Evolution of the averaged height, dynamic acceleration ( a d ), buoyant acceleration ( a b ), and sum of them ( a b + a d ) of the air parcels in blue in the 30 min before the CI; (c) Evolution of the averaged height, dynamic acceleration ( a d ), and its components (including the twisting, curvature, and extension) of the air parcels in blue in the 30 min before the CI; (d) Evolution of the averaged height, buoyant acceleration ( a b ), and its components due to water vapor ( a b v ), hydrometeors ( a b h ), and dry air ( a b d ) of the air parcels in blue in the 30 min before the CI.
Remotesensing 15 04812 g009
Figure 10. (a) Simulated horizontal divergence (shading, units: 10−3 s−1) and wind field (wind barbs, half barbs, full barbs, and flags represent 2, 4, and 20 m s−1, respectively) at 10 m AGL, composite reflectivity (black contours, units: dBZ), isolines of potential temperature with 304 K and 305 K (red solid lines), and ground-relative backward trajectories (blue and black lines, projected to the ground) of air parcels for 2 h, which is mentioned in Figure 8b, at 0215 UTC on 9 July 2016; (b) Vertical cross section of the divergence (shading, units: 10−3 s−1), streamlines, isolines of potential temperature with 304 K and 305 K (red lines), and backward trajectories (thin lines in blue and black, projected to the cross section) of air parcels for 2 h along line segment A1B1 shown in (a). The black and blue dots indicate the location (projected to the vertical cross section) of the air parcels. The red solid lines (304 K and 305 K isotherms) indicate the thermal boundary of the GF.
Remotesensing 15 04812 g010
Figure 11. (a) Vertical cross section of the horizontal divergence (shading, units: 10−3 s−1), streamlines, averaged height of the backward trajectories (blue line, projected to the cross section) of the air parcels for 2 h, and the averaged location (blue solid dot) of the air parcels at 0206 UTC on 9 July 2016, along line segment A1B1 shown in Figure 10a. The red solid lines (304 K and 305 K isolines of potential temperature) indicate the thermal boundary of the GF. (b,c) are the same as (a) but for the different times. The detailed time corresponding to each panel is shown in the upper left corner. The red solid circle indicates the convergence that played an important role during the occurrence of the CI.
Remotesensing 15 04812 g011
Figure 12. (a) Horizontal divergence (shading, units: 10−3 s−1), composite reflectivity (black contours, units: dBZ), wind field (wind barbs, half barbs, full barbs, and flags represent 2, 4, and 20 m s−1, respectively), and isolines of potential temperature with 304 K and 305 K (red solid lines) at 1000 m ASL on 9 July 2016. The line segment A2B2 indicates the location of the vertical cross section shown in (b); (b) Vertical cross section of the horizontal divergence (shading, units: 10−3 s−1), composite reflectivity (green contours, units: dBZ), vertical velocity (yellow contours, units: m s−1), and streamlines along the line segment A2B2; the grey shading represents the topography, and the detailed time corresponding to each panel is shown in the lower left corner. The hollow arrows colored in red, blue, and black indicate some important airflows related to the convergence shown in the red dashed ellipse.
Remotesensing 15 04812 g012
Figure 13. (a) Horizontal divergence (shading, units: 10−3 s−1), composite reflectivity (black contours, units: dBZ), and wind field (wind barbs, half barbs, full barbs, and flags represent 2, 4, and 20 m s−1, respectively) at 1000 m ASL on 9 July 2016. The line segment A3B3 indicates the location of the vertical cross section shown in (be); (b,c) Vertical cross section of the horizontal divergence (shading, units: 10−3 s−1), composite reflectivity (green contour, units: dBZ), streamlines, and isolines of potential temperature with 304 K and 305 K (red solid line) along the line segment A3B3 shown in (a); (d,e) Vertical wind shear (shading, units: 10−3 s−1), composite reflectivity (green contours, units: dBZ), vertical velocity (blue contours, units: m s−1), and isolines of potential temperature with 304 K and 305 K (red solid line) along line segment A3B3 shown in (a); grey shading represents topography.
Remotesensing 15 04812 g013
Figure 14. (ad) Vertical cross section of hydrometeors (shading, units: g kg−1, including cloud, rain, ice, snow, and graupel), wind (vector arrows), averaged height of the backward trajectories (blue line, projected to the cross section) of the air parcels for 2 h, the averaged location (blue solid dot) of the air parcels along the line segment A1B1 in Figure 10a, and the red solid lines (304 K and 305 K isolines of potential temperature) indicate the thermal boundary of the GF. (eh) are the same as (ad) but for the vertical cross section of potential temperature anomaly (shading, units: K) along the line segment A1B1. The corresponding detailed time of each panel is shown in its upper left corner.
Remotesensing 15 04812 g014
Figure 15. Schematic model summarizing the mechanisms of the CI in this study.
Remotesensing 15 04812 g015
Table 1. Local precipitation rating standard of Xinjiang (units: mm).
RainSnow (In Liquid Form)
Rating12 h
Standard
24 h
Standard
Rating12 h
Standard
24 h
Standard
drizzle0.0~0.10.0~0.2flurries0.0~0.10.0~0.2
light rain0.2~5.00.3~6.0light snow0.2~2.50.3~3.0
medium rain5.1~10.06.1~12.0medium snow2.6~5.03.1~6.0
heavy rain10.1~20.012.1~24.0heavy snow5.1~10.06.1~12.0
rainstorm20.1~40.024.1~48.0blizzard10.1~20.012.1~24.0
heavy rainstorm40.1~80.048.1~96.0heavy blizzard20.1~40.024.1~48.0
torrential rainstorm>80.0>96.0torrential blizzard>40.0>48.0
Disclaimer/Publisher’s Note: The statements, opinions and data contained in all publications are solely those of the individual author(s) and contributor(s) and not of MDPI and/or the editor(s). MDPI and/or the editor(s) disclaim responsibility for any injury to people or property resulting from any ideas, methods, instructions or products referred to in the content.