Article

Slow Slip Events Associated with Seismic Activity in the Hikurangi Subduction Zone, New Zealand, from 2019 to 2022

1
Key Laboratory of Mine Environmental Monitoring and Improving around Poyang Lake, Ministry of Natural Resourcesc, East China University of Technology, Nanchang 330013, China
2
School of Earth and Planetary Sciences (Spatial Sciences), Curtin University, GPO Box U1987, Perth, WA 6845, Australia
3
Key Laboratory for Digital Land and Resources of Jiangxi Province, East China University of Technology, Nanchang 330013, China
4
School of Surveying and Geoinformation Engineering, East China University of Technology, Nanchang 330013, China
5
School of Geography and Ocean Science, Nanjing University, Nanjing 210023, China
*
Author to whom correspondence should be addressed.
Remote Sens. 2023, 15(19), 4767; https://doi.org/10.3390/rs15194767
Submission received: 11 August 2023 / Revised: 23 September 2023 / Accepted: 27 September 2023 / Published: 29 September 2023

Abstract

:
Slow slip events (SSEs) are geophysical phenomena primarily occurring in subduction zones. These events are often associated with seismic activity and can be detected by Global Positioning System (GPS). However, the relationship between SSEs and seismic activity remains unclear. To further investigate SSEs associated with seismic activity, we conducted SSE detection and inversion for the period from 2019 to 2022 on New Zealand’s North Island, where both SSEs and seismic activity frequently occur. By modeling daily GPS coordinate time series from 40 GPS stations and applying the Network Inversion Filter (NIF) method, we obtain surface displacements, cumulative slips, and slip rates for eight shallow SSEs. Subsequently, we conduct a statistical analysis of seismic activity concerning its spatial distribution and frequency before, during, and after SSE occurrences. The results indicate that SSE1 and SSE7 exhibited larger cumulative slips, at 14.35 and 7.20 cm, and surface displacements, at 4.97 and 2.53 cm, respectively. During their occurrences, the seismic frequency noticeably increased to 6.5 and 5.6 events per day in the Eastern Coastal Region (ECR) of New Zealand’s North Island. However, the other six SSEs, characterized by cumulative slips of less than 6 cm and maximum surface displacements of less than 2 cm, did not lead to a noticeable increase in seismic frequency during their occurrences in the ECR. In the Main Slip Regions (MSR) of these eight SSEs, a significant upward trend in seismic frequency was observed during their occurrences. Therefore, it can be inferred that in the ECR of New Zealand’s North Island, all SSEs result in an increased seismic frequency within their respective MSRs, but only significant SSEs impact the seismic frequency of the ECR. Monitoring shallow SSEs may contribute to the identification and recording of seismic activity.

1. Introduction

Slow slip events (SSEs) are geophysical phenomena occurring at the transitional sections of tectonic plates where accumulated stress from plate motion is relieved through slow slippage [1]. Owing to their slow movement and prolonged duration (ranging from several days to years), and the absence of seismic radiation [2], SSEs are challenging to detect via seismometers. Because of the advantages of the all-weather, high-precision, dense distribution, and the ability to be used over wide ranges, the use of the Global Positioning System (GPS) has become the primary detection tool for the SSEs (as shown in Figure 1). Therefore, it is currently extensively employed across the Pacific Ring of Fire subduction zones [3,4], notably in Cascadia [5], Japan [6,7], Mexico [1], Costa Rica [8], and New Zealand [9,10,11].
Beneath the North Island of New Zealand, the Hikurangi subduction zone is complexly formed by the westward subduction of the Pacific Plate beneath the Australian Plate. Since the 20th century, SSEs have been observed in different regions of the North Island. Utilizing continuous GPS monitoring, Douglas, Wallace, and Beavan discovered considerable differences in duration, periodicity, energy release, and hypocenter depth of SSEs on the Hikurangi subduction zone. For instance, at the northern boundary of the subduction zone, shallow SSEs (<15 km) occur every 1–2 years and last 1–5 weeks. Conversely, in the Manawatu and Kapiti regions of the southern edge, deeper SSEs (30–60 km) lasting 12–18 months and recurring approximately every 5 years have been observed [9,11,12,13,14,15].
The Network Inversion Filter (NIF) method, based on processing using Kalman filter, can detect anomalous deviations in steady signals [16,17]. In combination with high temporal resolution data from land-based continuous GPS stations, it enables accurate modeling of fault slips over time and has been employed in numerous spatiotemporal inversions of SSEs [7,8,17,18,19].
Existing research suggests a correlation between SSEs and seismic activity [11,20]. Miyazaki et al. employed GPS data and the NIF method to investigate SSEs in Japan’s Chubu region from 2000 to 2005 [18]. They inferred a heightened probability of seismic activity in the region following an SSE by comparing temporal variations in slip and corresponding Coulomb stress changes on faults. In New Zealand, Yohler and Wallace used the NIF method to invert the 2014 Gisborne offshore SSE, noting its migration characteristics towards and away from the coastline over time-based on total slip distribution [17,21,22], providing critical references for the study of shallow offshore SSE mechanisms.
To analyze the current state of SSEs in New Zealand’s Hikurangi region in recent years and their correlation with seismic activity, we analyzed continuous coordinate time series data from 40 GPS stations on the east coast of the North Island. We extracted the coordinate series containing SSEs from 2019 to 2022 and used the NIF inversion method to compute fault slip vectors and ground displacement vectors for each SSE. By analyzing the spatiotemporal evolution of the slips and evaluating regional seismic activity during and around the SSEs, we explored the spatiotemporal correlation between seismic activity and SSEs at the northern and central edges of the Hikurangi subduction zone.

2. Data and Methodology

2.1. Regional Tectonic

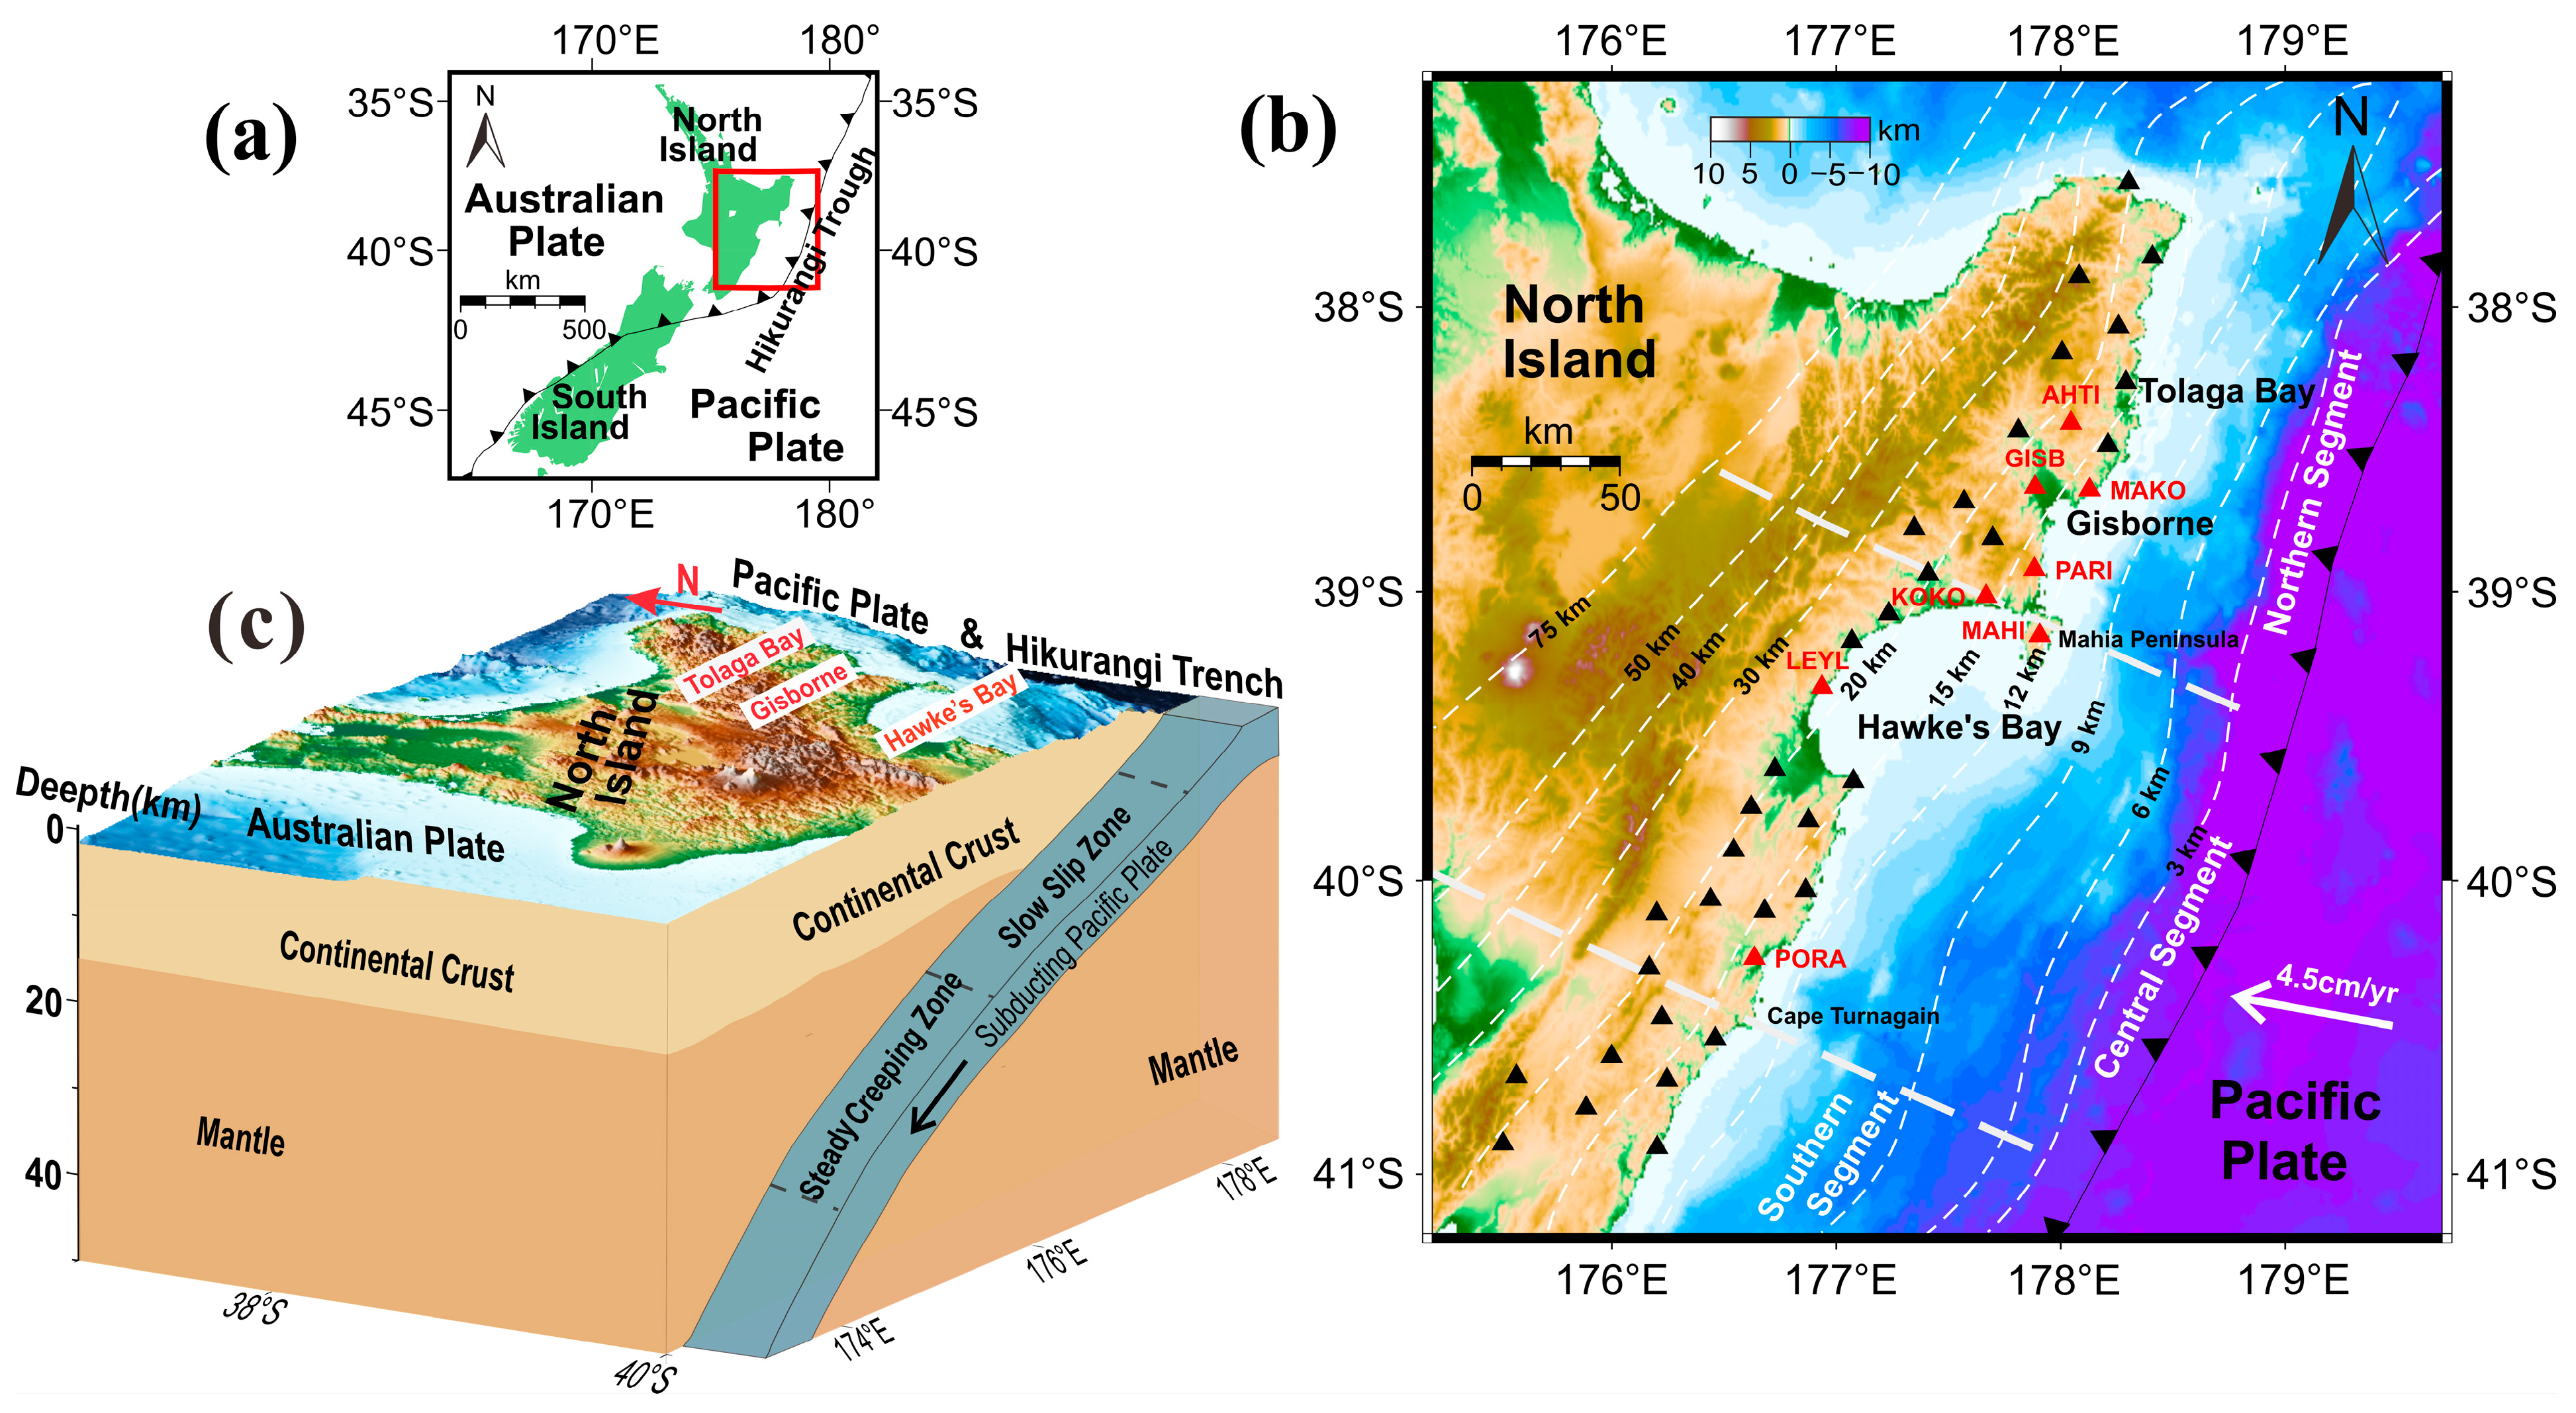
The study area is illustrated in Figure 2. The Pacific Plate subducts westwards beneath the Australian Plate along the Hikurangi Trench at a velocity of approximately 4.5 cm/year, forming the Hikurangi Subduction Zone beneath the North and northeastern South Island [23,24]. Segmented along its strike, the subduction zone can be divided into three parts: the northern section, located north of Mahia; the central section, situated between Mahia and Cape Turnagain; and the southern section, extending from Cape Turnagain to the Chatham Rise, where the subduction terminates at the northeastern South Island. Shallow SSEs (2–20 km deep) frequently occur along the northern and central sections of the subduction margin, primarily distributed in the Tolaga Bay, Gisborne, and Hawke’s Bay regions on the eastern coast of the North Island. In contrast, deeper SSEs (30–60 km deep) regularly take place in the southern regions of Manawatu and Kapiti [25,26].

2.2. Data Source

The geodetic data used in the inversion of slow slip events at the central and northern edge of the Hikurangi subduction zone are derived from 40 GPS stations situated along the eastern coast of the North Island, as indicated by the triangles in Figure 2. These data are provided by the continuous GPS observation network (cGPS) in New Zealand. To establish a reliable time series, the daily solutions for each station are processed using the GAMIT/GLOBK software version 10.70; a detailed description of the methods can be found at https://www.geonet.org.nz/data/types/geodetic (accessed on 26 September 2023). The resulting daily coordinate time series obtained from processing the GPS data gave a horizontal precision within 3 mm and a vertical precision within 5 mm under the ITRF2008 reference frame.

2.3. Methodology

2.3.1. GPS Coordinate Time Series Modeling and SSEs Signals Extraction

To extract the slow slip information from the coordinate time series of GPS stations in the study area, it is first necessary to model the GPS coordinate time series. This can be specifically described by the following model [4,6,7,18]:
X ( t ) = X 0 ( t 0 ) + v t + j b j H ( t t j ) + a ln [ 1 + ( t t e q ) / τ ln ] + i [ S i sin ( ϖ i t ) + C i cos ( ϖ i t ) ] + d ( x , t )
where X ( t ) represents the GPS-based station coordinate time series, t represents time. X 0 represents the constant initial position, and v represents the secular velocity. b j H ( t t j ) represents the step function, where b j is direction and magnitude of the step at time t j , and H is the Heaviside function. a ln [ 1 + ( t t e q ) / τ ln ] represents the post-seismic relaxation term, described by a logarithmic decay function model, where a is the amplitude coefficient, t e q is the time since the earthquake occurred and τ ln is the post-seismic logarithmic relaxation time. The fifth term represents the periodic motion change information of the station, S i and C i are the amplitudes of the harmonic components, and ϖ i is the phase, the most common being the annual and semi-annual cycles. d ( x , t ) represents the displacement time series of SSEs signals, which also includes the benchmark oscillation of a random walk, reference frame errors, noise, etc., where x is the spatial coordinates of the station.
In Equation (1), parameter estimation methods are detailed in reference [4]. However, post-seismic relaxation terms were excluded due to the absence of strong earthquakes between 2018 and 2022, and annual and semi-annual periodic signals were neglected due to their small magnitude and difficulty in estimation amid frequent SSEs. Regarding secular velocity estimation, it was conducted without excluding SSE time series, in contrast to other methods that do exclude them [19]. Both approaches serve their purposes by removing the secular velocity component from GPS time series, thereby highlighting the signals of SSEs. However, neither accounts for the secular velocity variations induced by SSEs. If SSEs alter the secular velocity, estimating the secular velocity remains an approximate value, even when SSE time series are excluded. Therefore, by utilizing long-duration GPS coordinate time series (spanning several years) to investigate short-period (1–2 months) SSEs, we could disregard the impact of SSEs and approximate the secular velocity. Thus, in GPS time series modeling using Equation (1), SSE signals were successfully extracted.
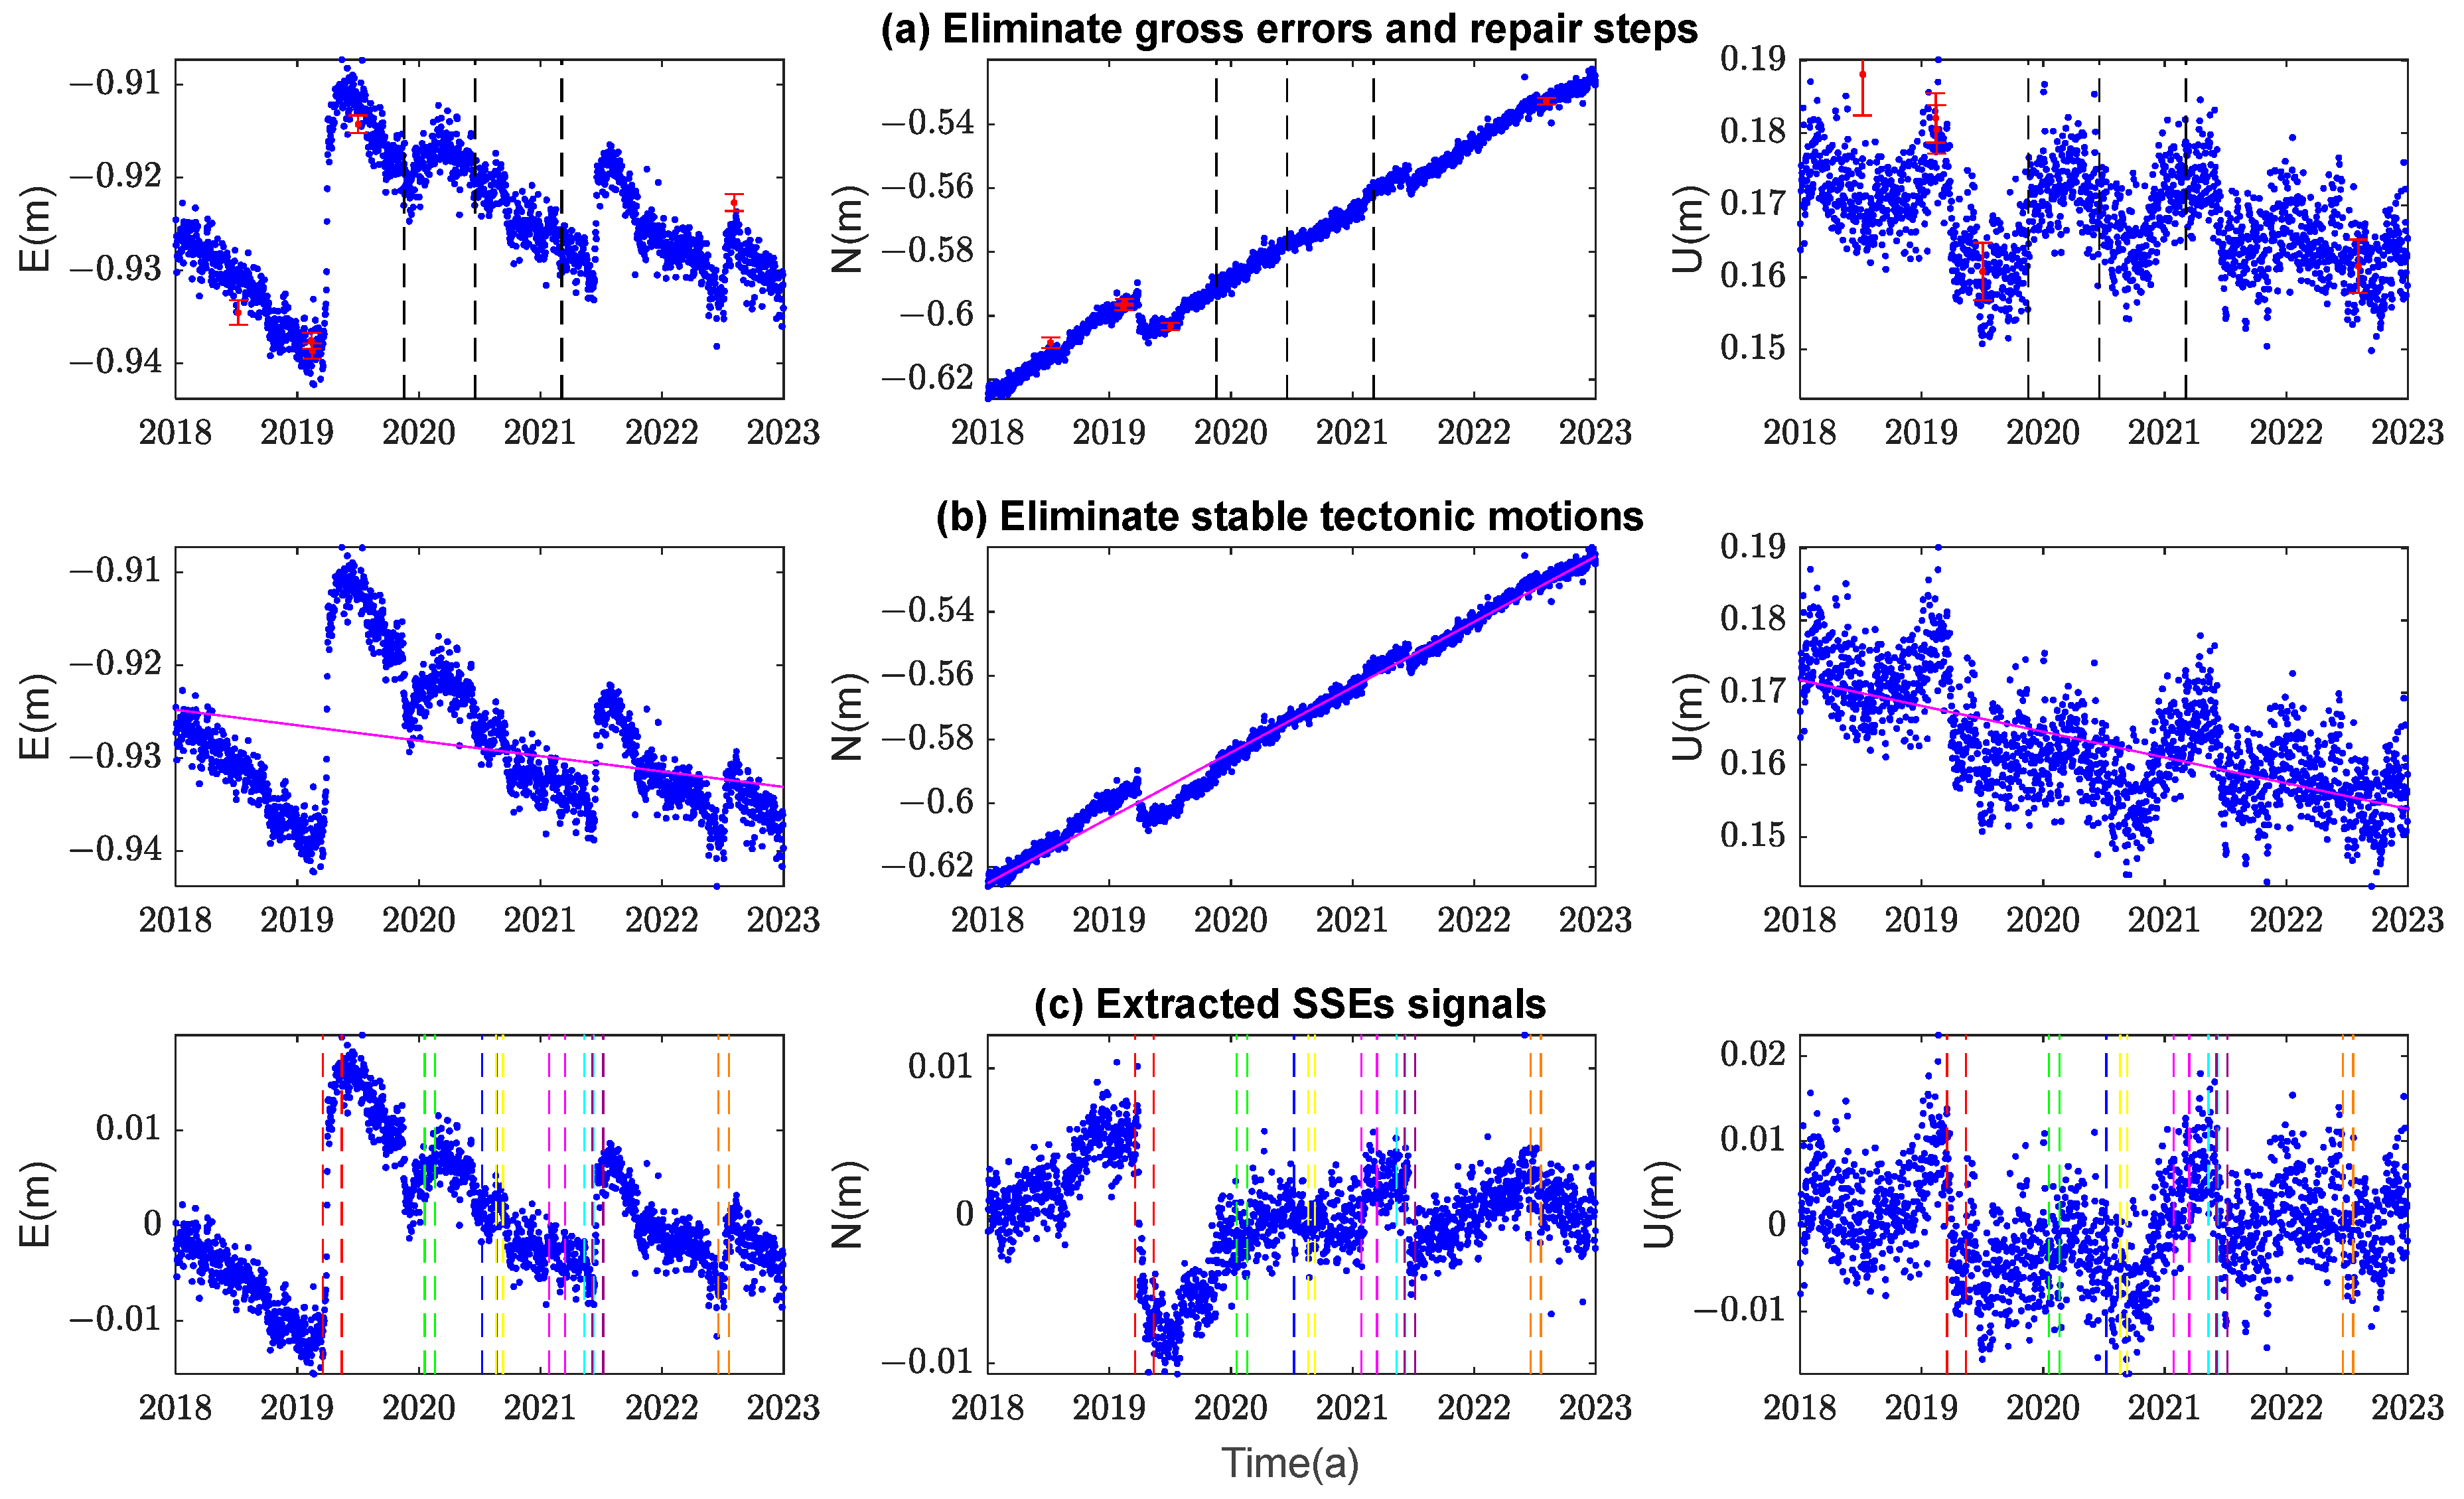
Figure 3 shows the SSEs signals obtained from GPS coordinate time series at the GISB site. The process of extracting GPS slow slip time series at other stations along the Hikurangi Subduction Zone followed a similar procedure. This involved the removal of outliers and the restoration of step functions (Figure 3a—shown as the top panel of Figure 3), eliminating the constant and velocity terms (Figure 3b—middle panel of Figure 3). The resulting residuals (Figure 3c—bottom panel of Figure 3) were displacement time series that include SSEs signals. From the residuals of multiple stations, eight SSEs were identified from 2019 to 2022 (represented by eight colored vertical dashed lines in Figure 3c). These displacement time series of the eight SSEs were subsequently utilized as input signals for slip inversion.
Within a 200 km radius of the study area, the largest earthquake, an Mw 7.3 event, took place in March 2021 with an estimated depth of around 50–70 km [28]. This earthquake (as depicted in Figure 3a, Day of Year, DOY 63, 2021) coincided with the 5th SSE episode (as depicted in Figure 3c, DOY 27–74, 2021). The land surface displacement signals generated by this undersea earthquake appeared relatively weak when observed through the coordinate time series of multiple GPS stations within the study area. Specifically, the step function corrections at the time of this earthquake were consistently within the millimeter range, and no post-seismic relaxation effects were detected. In GPS coordinate time series within the study area, there were no discernible signals attributable to the earthquake. Apart from the influences of the earthquake’s distance and depth, it was also possible that the lack of significant signals might be associated with opposing signals generated by the earthquake and SSEs in the east-west direction. The earthquake occurred in the east-west direction [29], while the predominant directions of SSEs were eastward. These two opposing signals in the east-west direction may potentially mitigate each other. Therefore, if the earthquake had an impact on the study area, it could lead to a reduction in the magnitude of the 5th SSE. However, since the earthquake coincided with the period of SSEs, it was challenging for us to disentangle its effects.

2.3.2. NIF Inversion

Utilizing the displacement time series of SSE signals derived from the GPS coordinate time series, we employed the NIF method to invert the time-related fault slip. According to NIF formula, the geodetic observation data were modeled as a function of site spatial coordinates and time [16,17,18,30] as follows:
d ( x , t ) = A G ( x , ξ ) S ( ξ , t ) n ( ξ ) d A ( ξ ) + F ( x ) f ( t ) + B ( x , t ) + ε ( x , t )
where d ( x , t ) is consistent with Equation (1), which represents the displacement of the surface site caused by fault slip. G ( x , ξ ) represents represents the Green function mapping the fault’s slip and the surface displacement. S ( ξ , t ) represents the slip on the fault plane A at the position ξ at time t . n ( ξ ) represents the normal vector of the fault plane element. F ( x ) f ( t ) represents the coordinate reference frame correction, and the time-related reference frame parameters f ( t ) (including the vectors of network translation, rotation, and scale) are associated with the location of GPS site through Helmert transformation matrix F ( x ) . B ( x , t ) represents the benchmark oscillation of a random walk. ε ( x , t ) denotes the noise, which is assumed to follow a normal distribution [16].
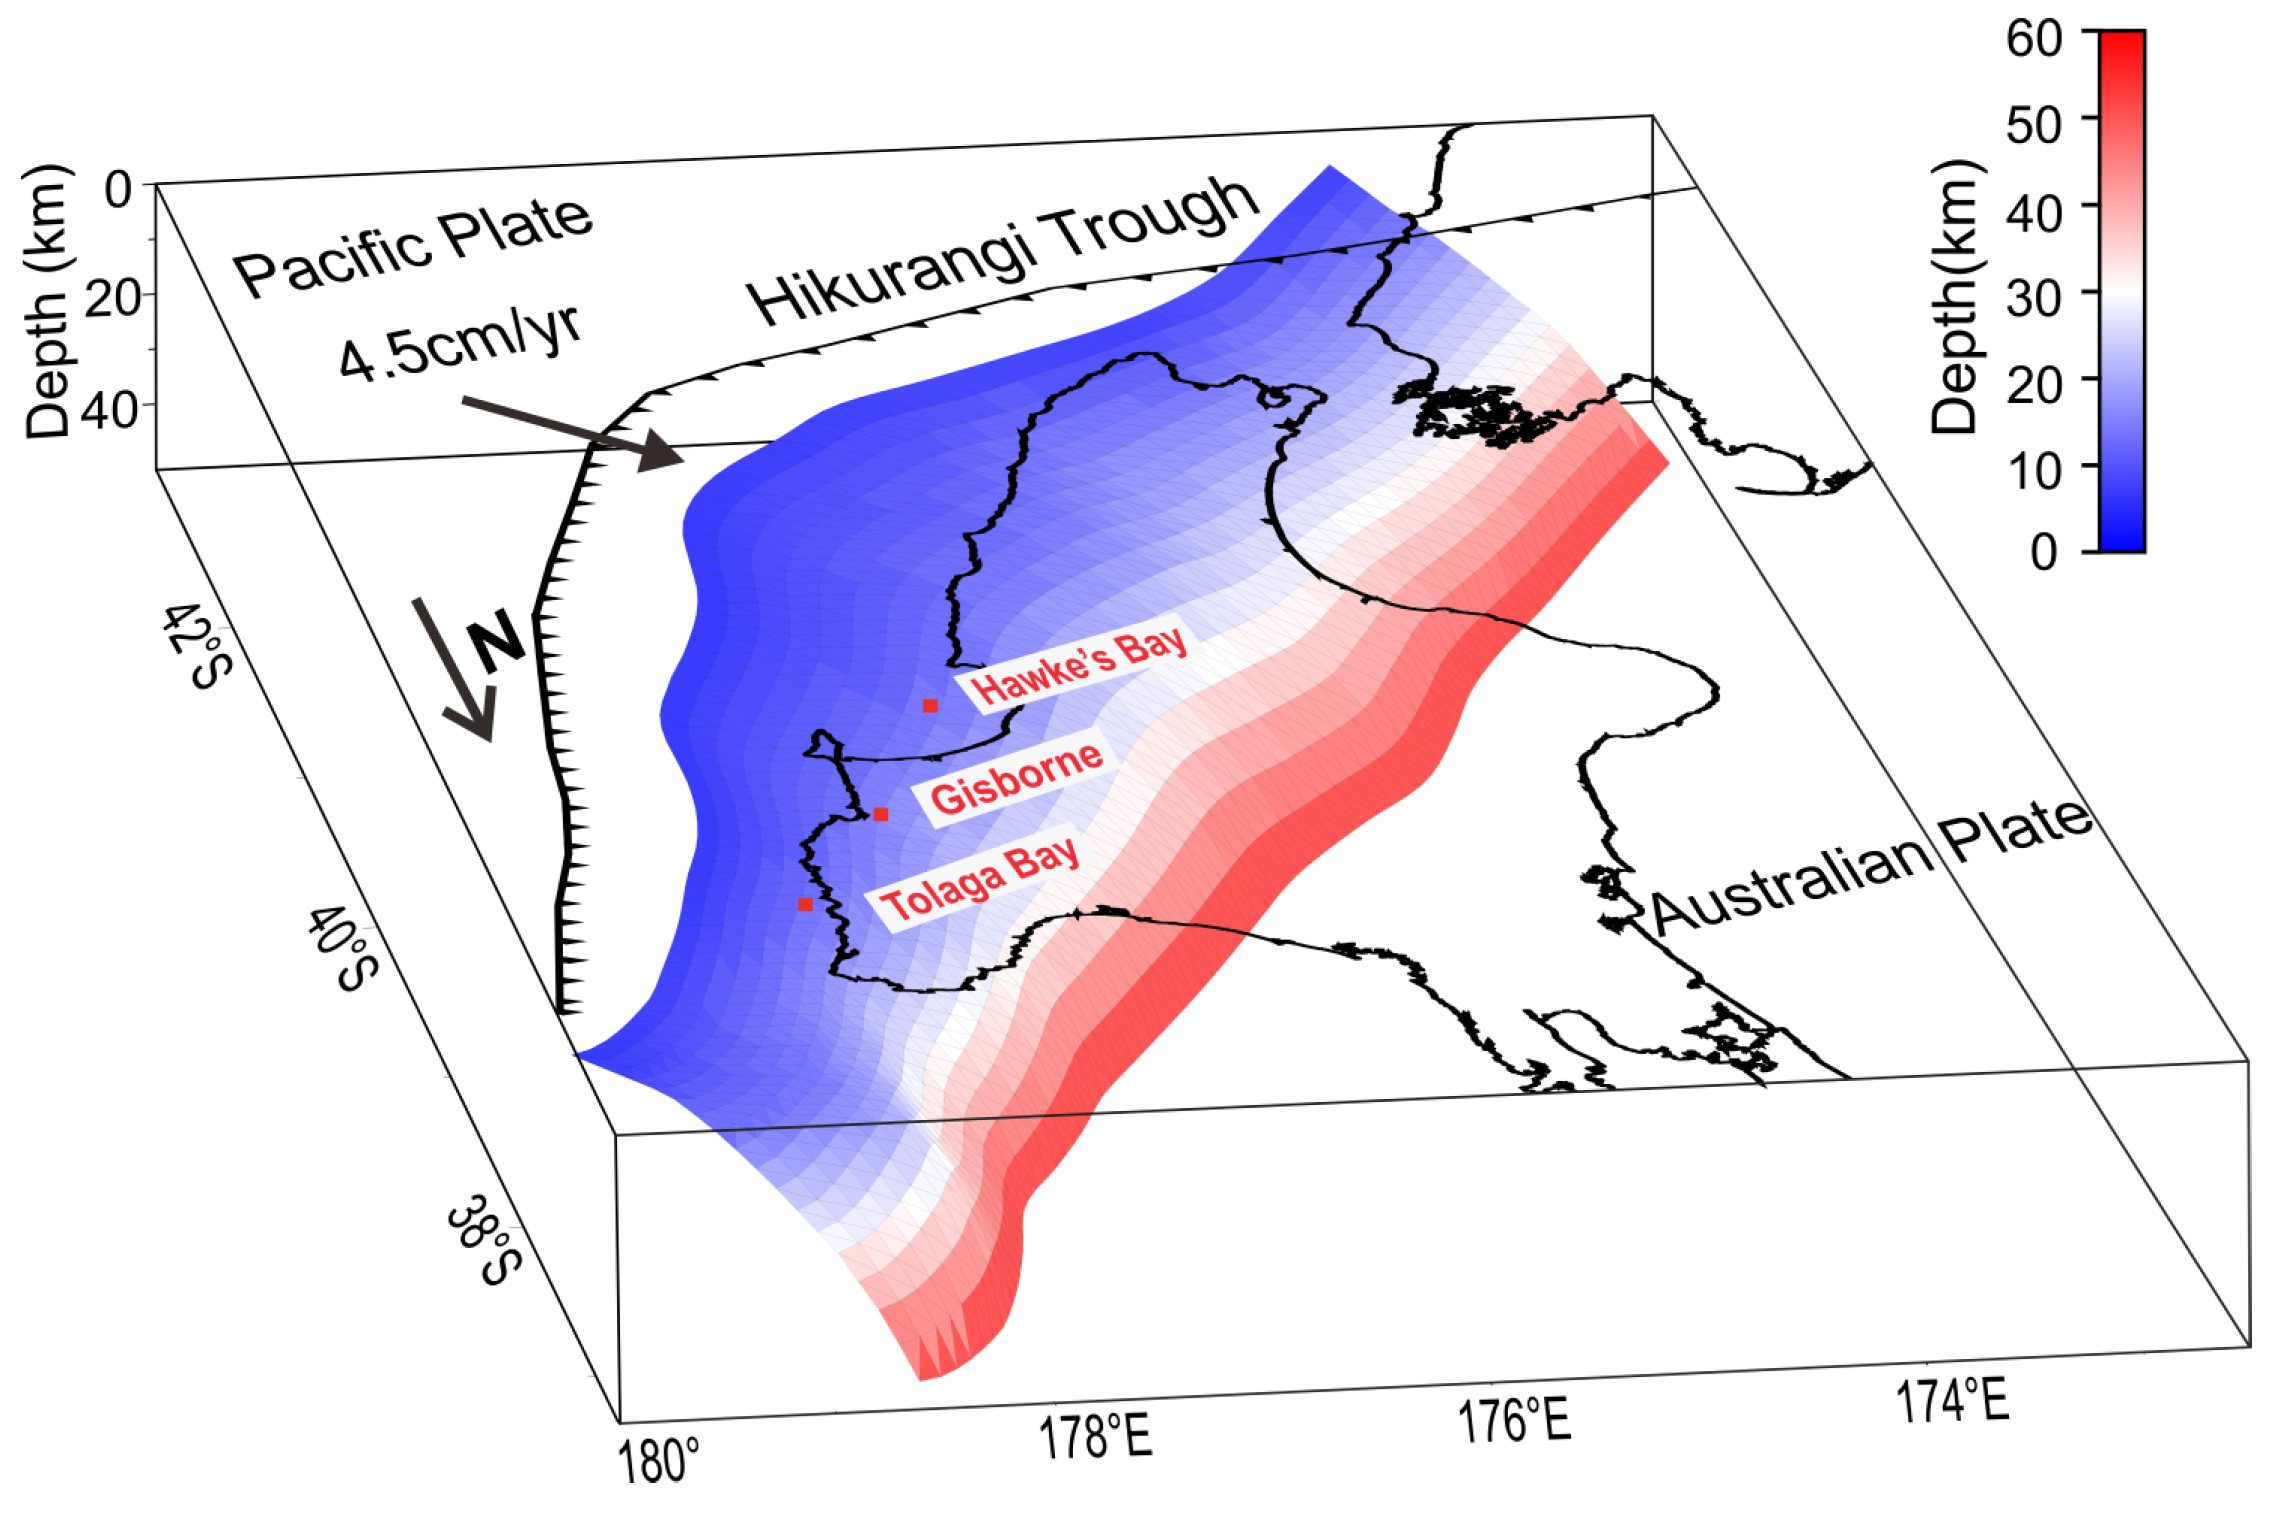
Before employing the NIF method, it is crucial to construct a fault grid that facilitates the generation of fault-specific elastic Green functions required by the method. The fault grid of the Hikurangi Subduction Zone is depicted in Figure 4. The fault geometry structure, as proposed by Williams et al. [27], involves constructing a fault triangle grid based on discrete isodepth points. The minimum length of the triangle sides was set to 10 km, resulting in a total of 2810 triangle grids. In regard to the three-dimensional geometric parameters of the fault, the strike angle was set to 221°, the dip angle was set to 12°, and the rake angle was set to 120°, as reported in [10]. After the proposal of the elastic block model by Wallace [31], subsequent studies [32,33] concluded that the slip direction of SSEs on the subduction interface aligns with the long-term relative motion direction observed at the plate boundary. The slip direction is defined as an angle projected onto the horizontal plane, measured in degrees clockwise from north, and is a constraint in the inversion process. Therefore, we used the long-term plate motion direction as a constraint for determining the slip direction. Additionally, we set the Poisson’s ratio to 0.25, as suggested in [19]. This approach facilitates the development of a comprehensive three-dimensional fault model for the Hikurangi Subduction Zone. After constructing the triangular grids of the fault, the triangular dislocation code developed by Thomas [34] was employed to calculate the Green function on the grids. Subsequently, the fault-specific elastic static Green function was generated. The resulting Green function served as the input data for the NIF method.
The NIF method was employed to effectively determine the spatiotemporal distribution of fault slips. To remove potential high-frequency fluctuation noise in the displacement data, the time-smoothing parameter and space-smoothing parameter were used to constrain the temporal and spatial range of slips, respectively [16,17,19,35]. The visual inspection method was employed to fine-tune the smoothing parameters, ensuring a smoother model and satisfactory data fitting in both temporal and spatial domains [17,19]. In the presence of unstable local benchmark oscillation movement, distinguishing it from smaller-scale tectonic movements (e.g., SSEs) becomes challenging, particularly when the station spacing is larger. The NIF method employed Brownian random motion to model the local benchmark oscillation, assuming a uniform benchmark oscillation value of 0.1 mm year 1 / 2 for all sites during the inversion process [19]. Additionally, other parameters, including reference frame correction and noise, were estimated using the Maximum Likelihood Method (MLE) [16].
Figure 5 shows the results of estimating surface displacements of SSEs using the NIF method to construct the optimal estimation model, illustrated using GISB, AHTI, and MAKO stations as examples (shown in panels a to c, respectively). These three stations are located adjacent to each other, between Tolaga Bay and Gisborne. During the eight SSEs, the three stations exhibited the same direction of displacement, although with varying magnitudes. Overall, the NIF method performs well in inverting the surface displacements in the east (E)-north (N) direction. However, the signal-to-noise ratio for the vertical (U) direction of the slow slips is relatively low, and the displacement magnitudes are smaller than those in the horizontal direction. Mitigating the periodic behavior in the vertical component can improve the signal-to-noise ratio of SSEs. This approach is effective in regions where SSEs occur at intervals longer than one year, and the periodic signals are significant. However, in our study area, the periodic signals are relatively small [19]. The SSEs occur frequently with an annual recurrence, which presents challenges in accurately estimating them. This suggests that a more accurate analysis may require the inclusion of some relative leveling data. Consequently, our subsequent analysis mainly emphasizes horizontal surface displacements.

3. Results

3.1. Surface Displacements

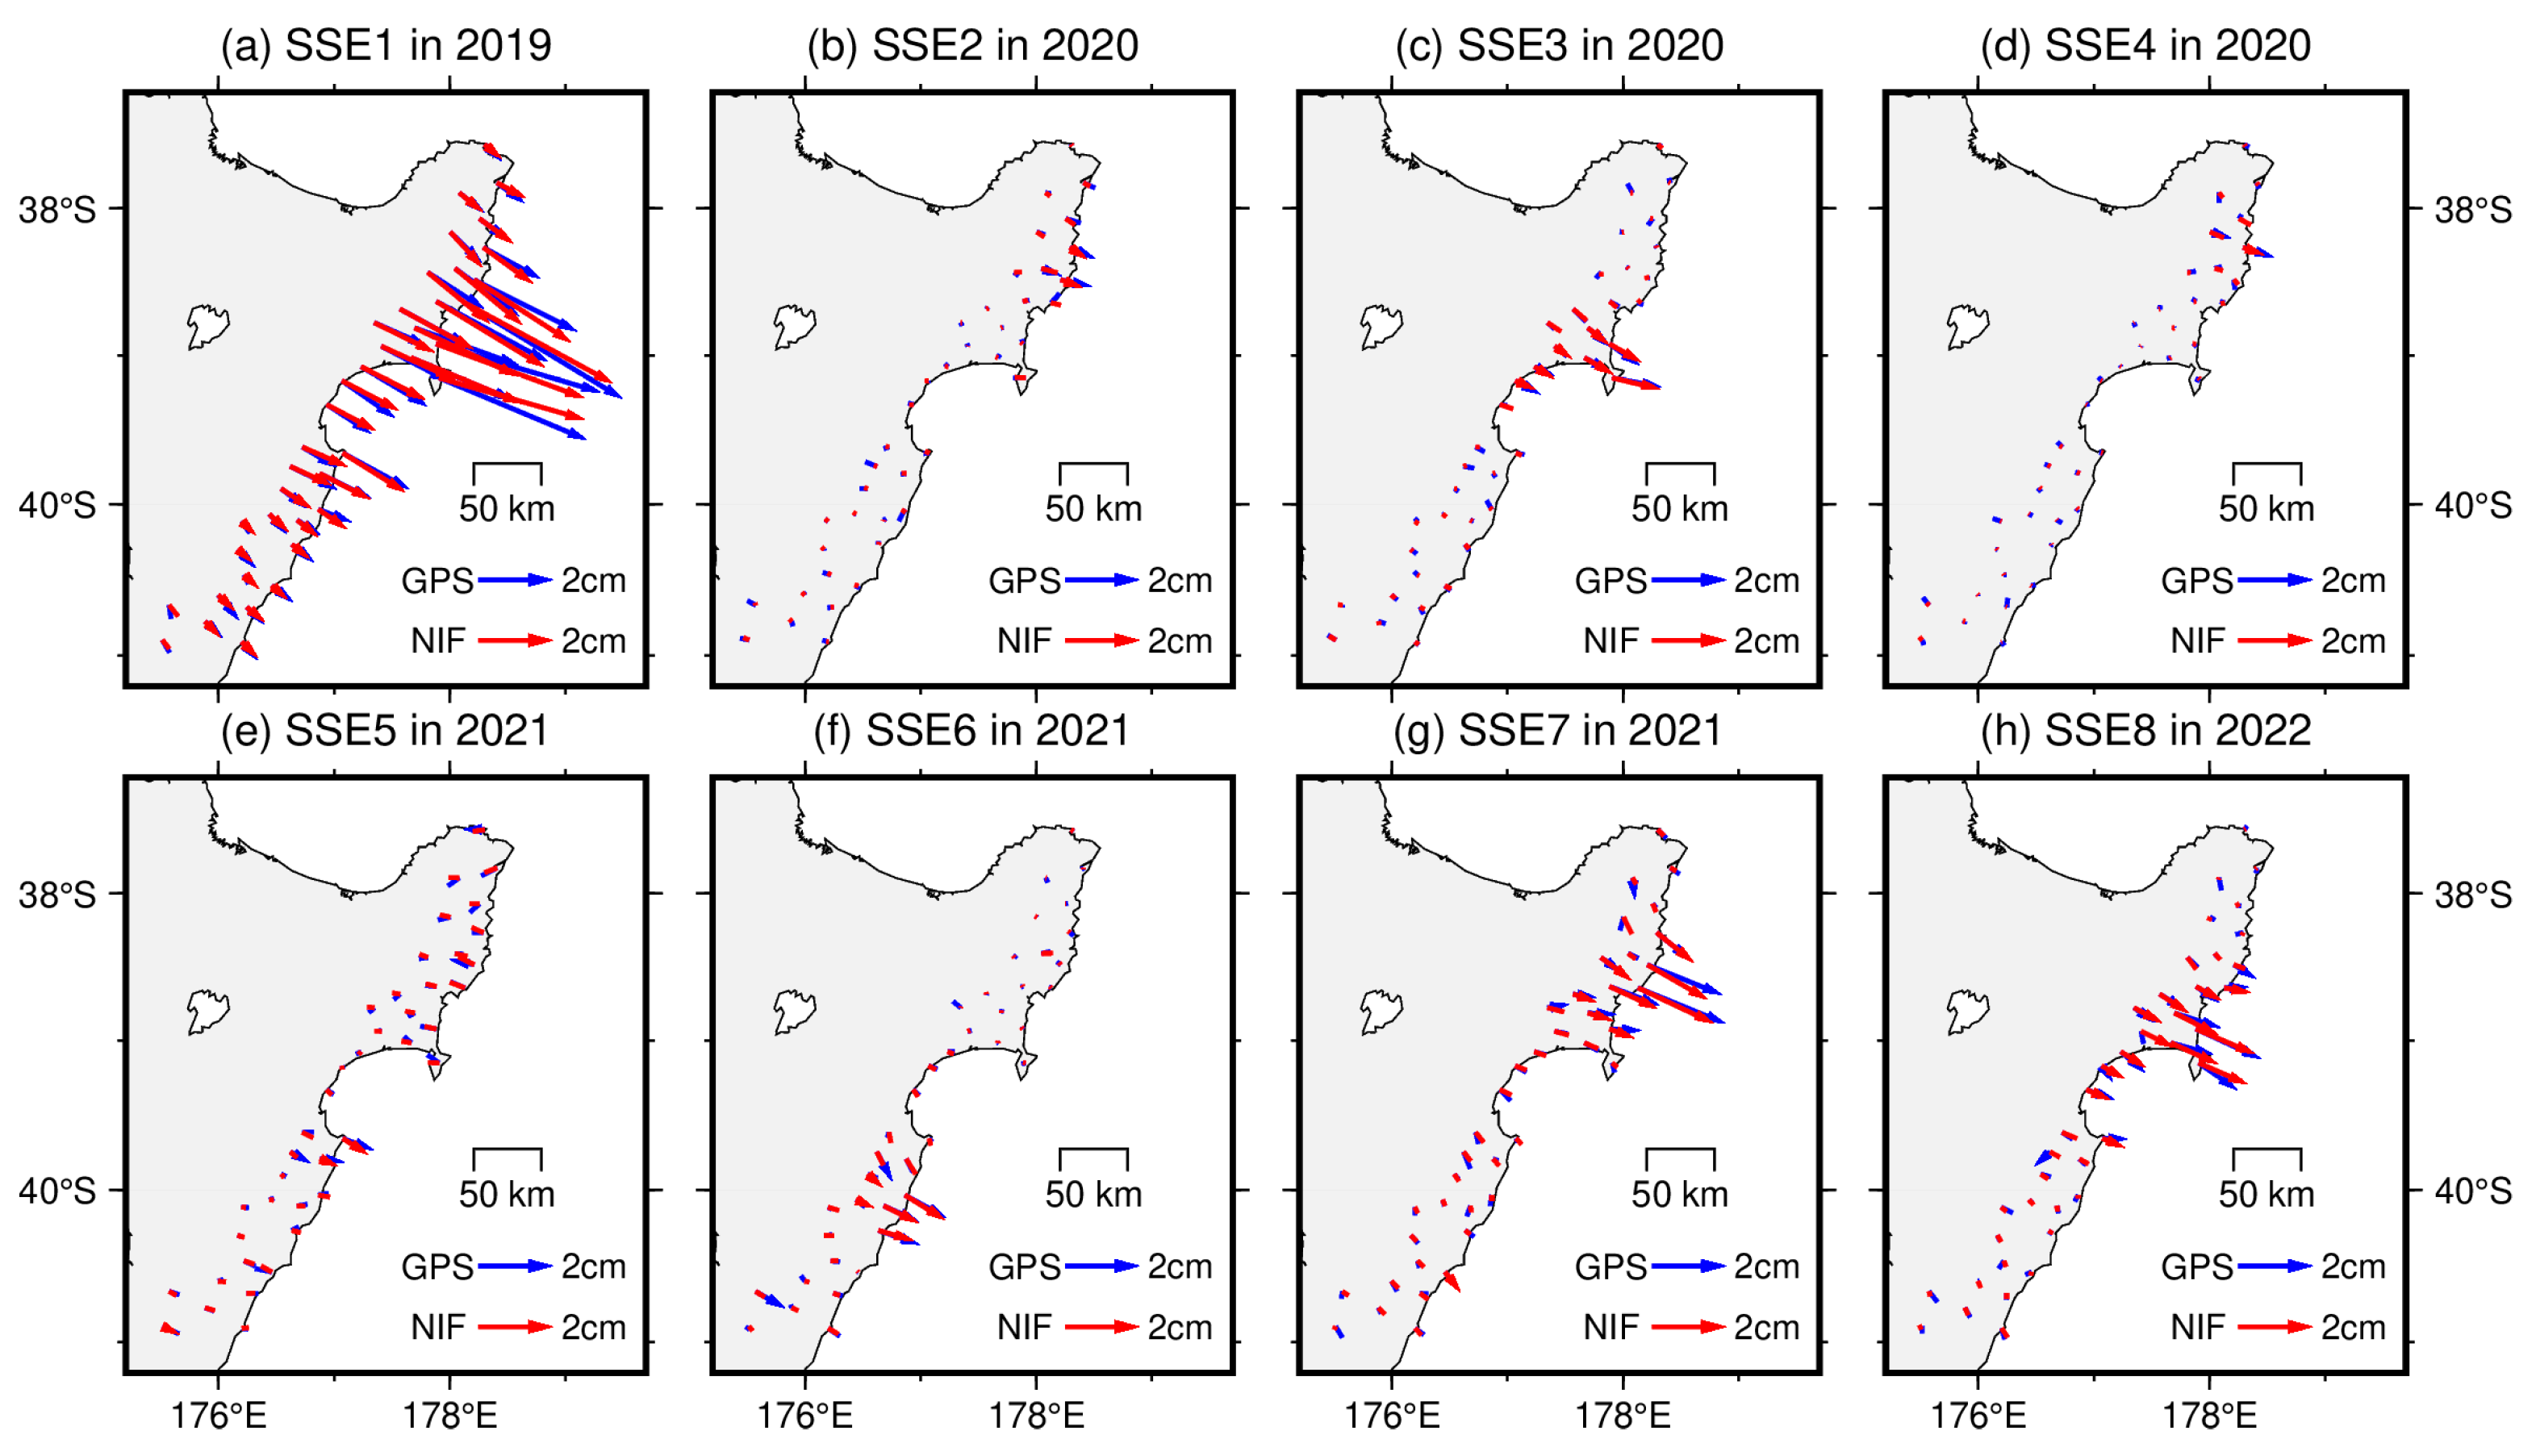
Figure 6a–h shows the comparisons between the surface horizontal displacements of the eight SSEs obtained from GPS coordinate time series and the corresponding estimations derived from the NIF method, representing the optimal slip model. Based on the GPS coordinate time series, the maximum surface displacements induced by the eight SSEs are as follows: 4.97, 0.84, 1.33, 0.87, 0.88, 1.27, 2.53, and 1.92 cm. SSE1 caused the largest surface displacement, while SSE2, SSE4, and SSE5 induced surface displacements that were all smaller than 1 cm. The NIF method first inverts fault slip from GPS-monitored surface displacements and then forward calculates new surface displacements. By computing the differences between GPS and NIF surface displacements, the average differences in the east/north directions at the 40 stations for the eight SSEs are as follows: 1.2/1.4, 0.8/0.6, 0.6/0.7, 0.8/0.7, 0.7/0.8, 0.9/0.7, 0.9/1.0, and 1.4/0.9 mm. Figure 6a–h also demonstrates a high level of agreement between the surface displacements obtained from GPS and NIF, indicating a high precision of the NIF inversion.

3.2. Cumulative Slip

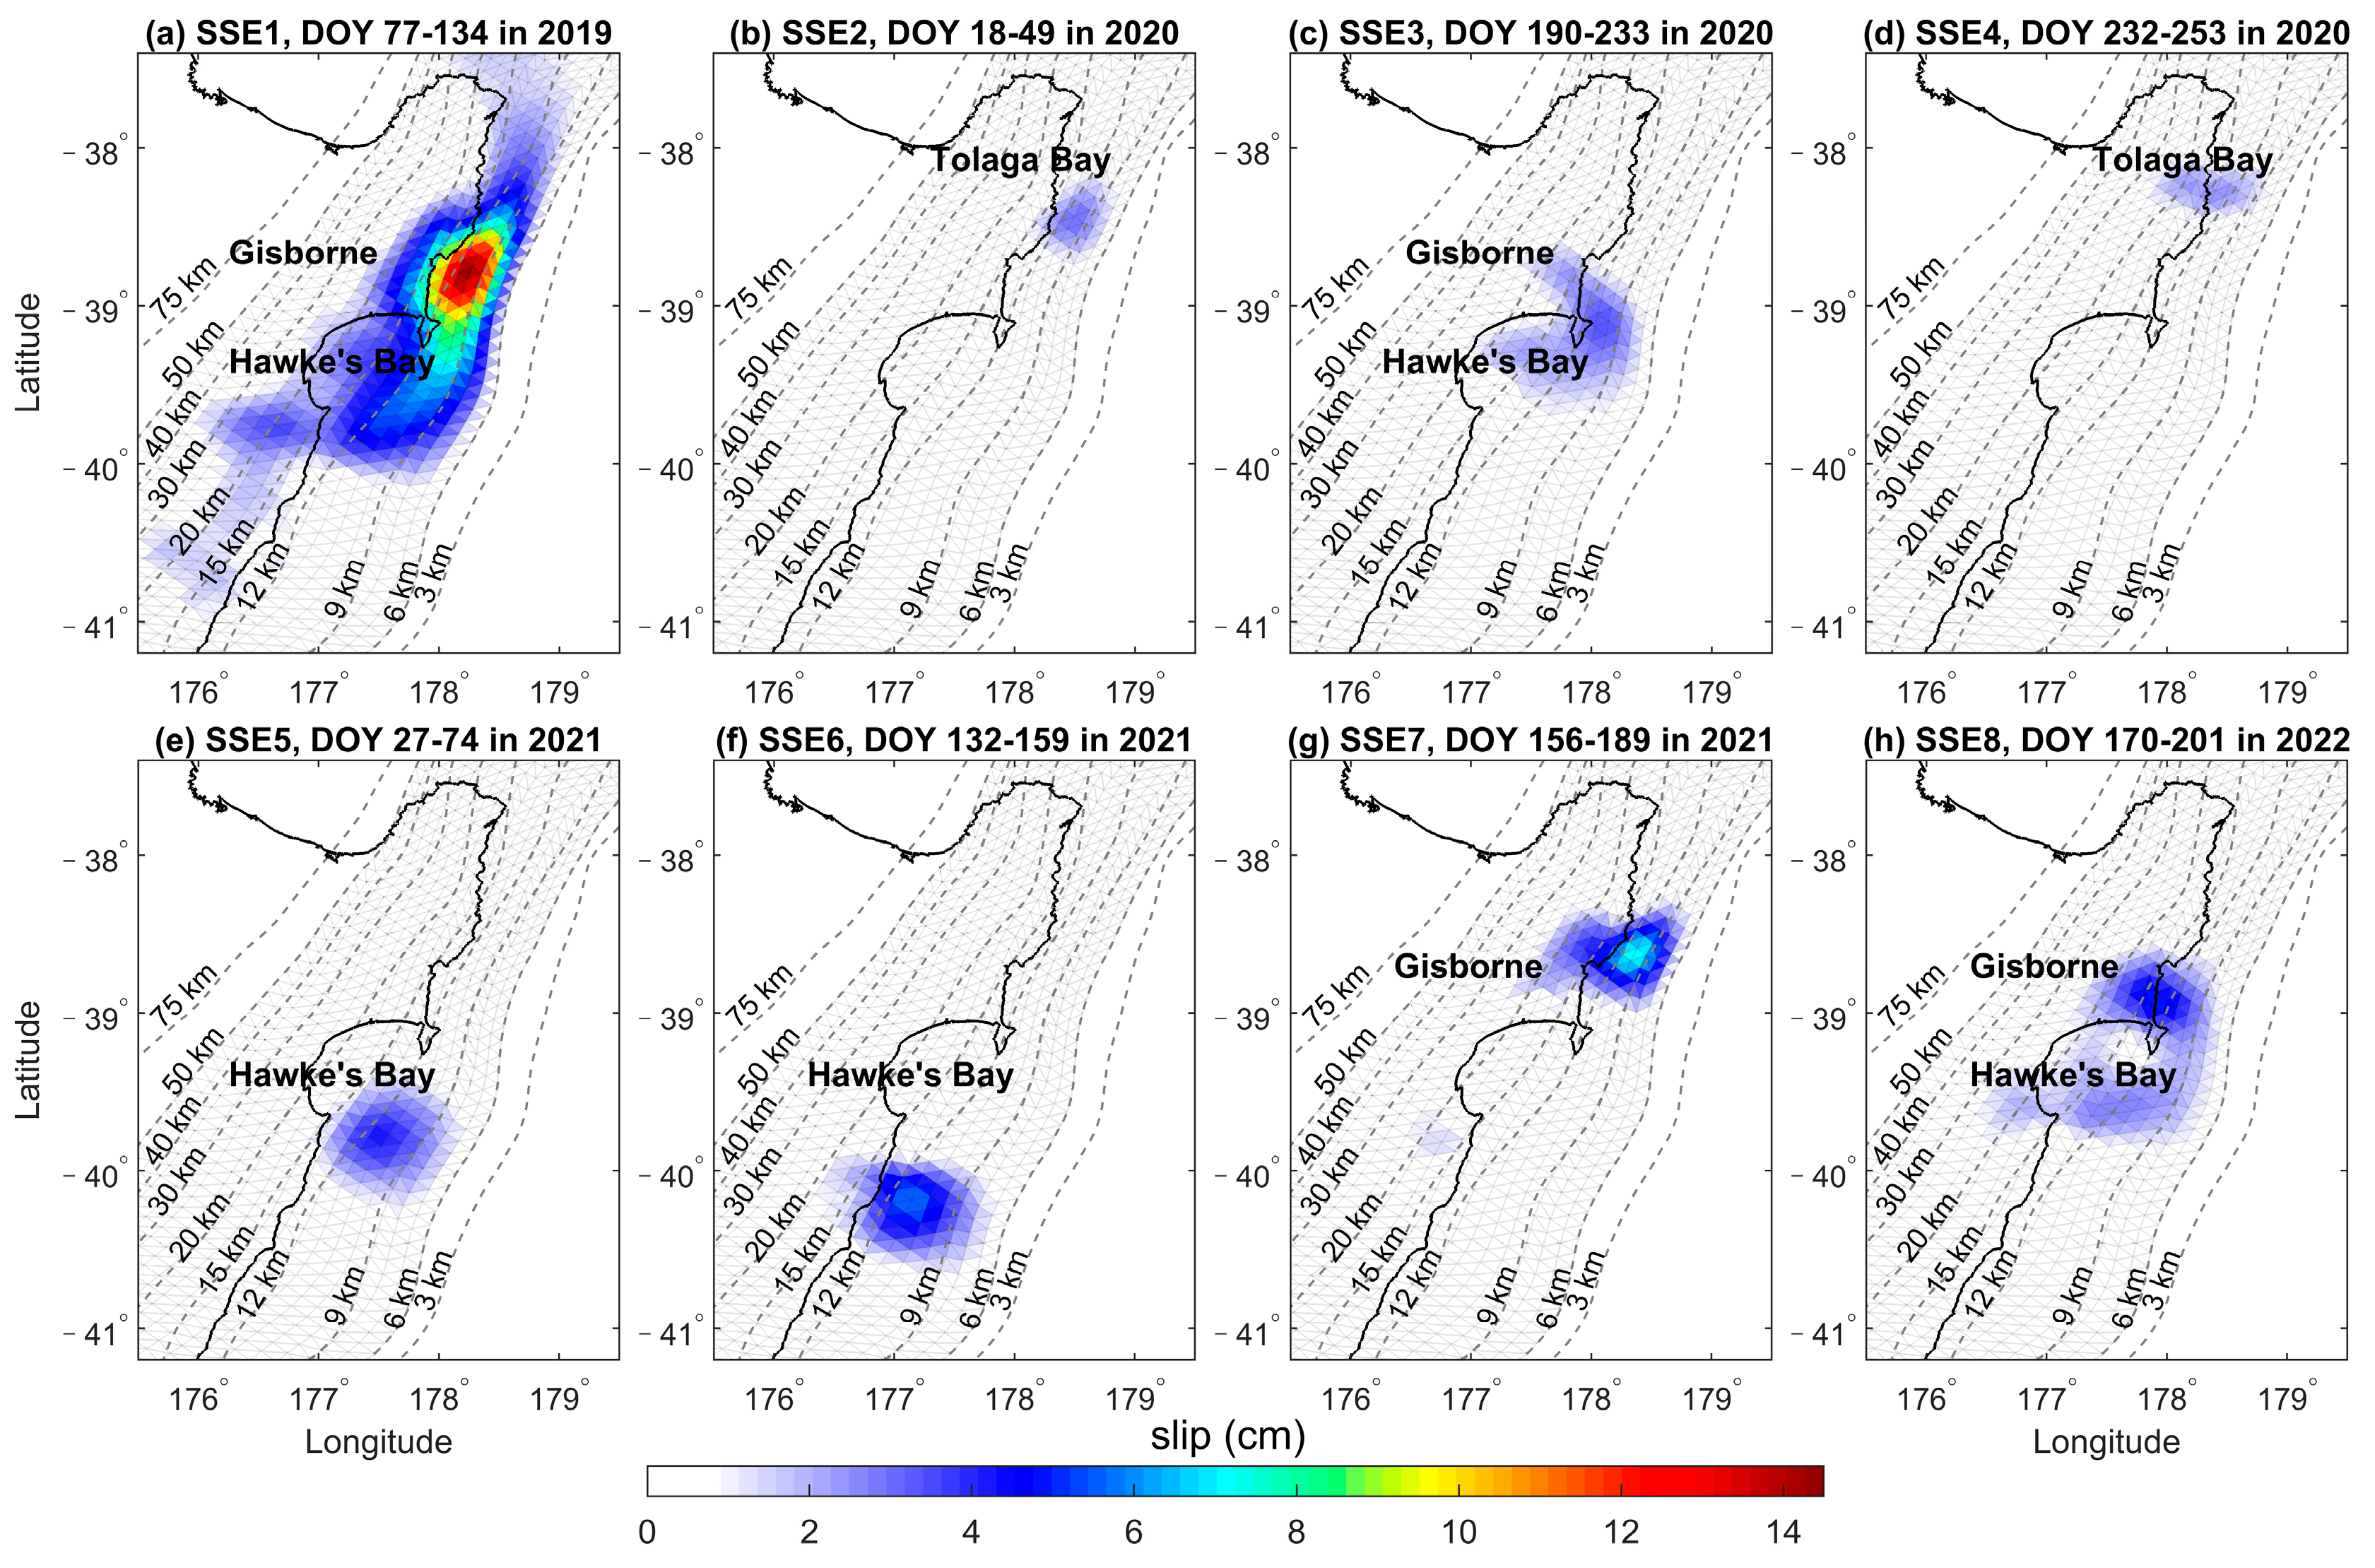
Figure 7 shows the cumulative slip of the faults during the eight SSEs from 2019 to 2022. Among the eight shallow SSEs, SSE2, and SSE4 were observed near Tolaga Bay; SSE1, SSE3, and SSE8 were distributed in Gisborne-Hawke’s Bay; SSE7 occurred in Gisborne; SSE5 and SSE6 were identified near Hawke’s Bay and its southern region. In terms of slip magnitudes, SSE1, occurring in 2019, exhibited the largest cumulative slip of 14.35 cm (Figure 7a), which is consistent with the results obtained by Woods et al. [25]. SSE4, occurring in 2020, had the smallest cumulative slip of 2.39 cm (Figure 7d). The most recent SSE, which took place in 2022, had a cumulative slip of 4.87 cm (Figure 7h). Furthermore, the cumulative slip uncertainties of the eight SSEs do not exceed 3 mm (Figure S1). Concerning slip depths, all eight SSEs occurred within the depth range of 6–20 km.

3.3. Slip Rate

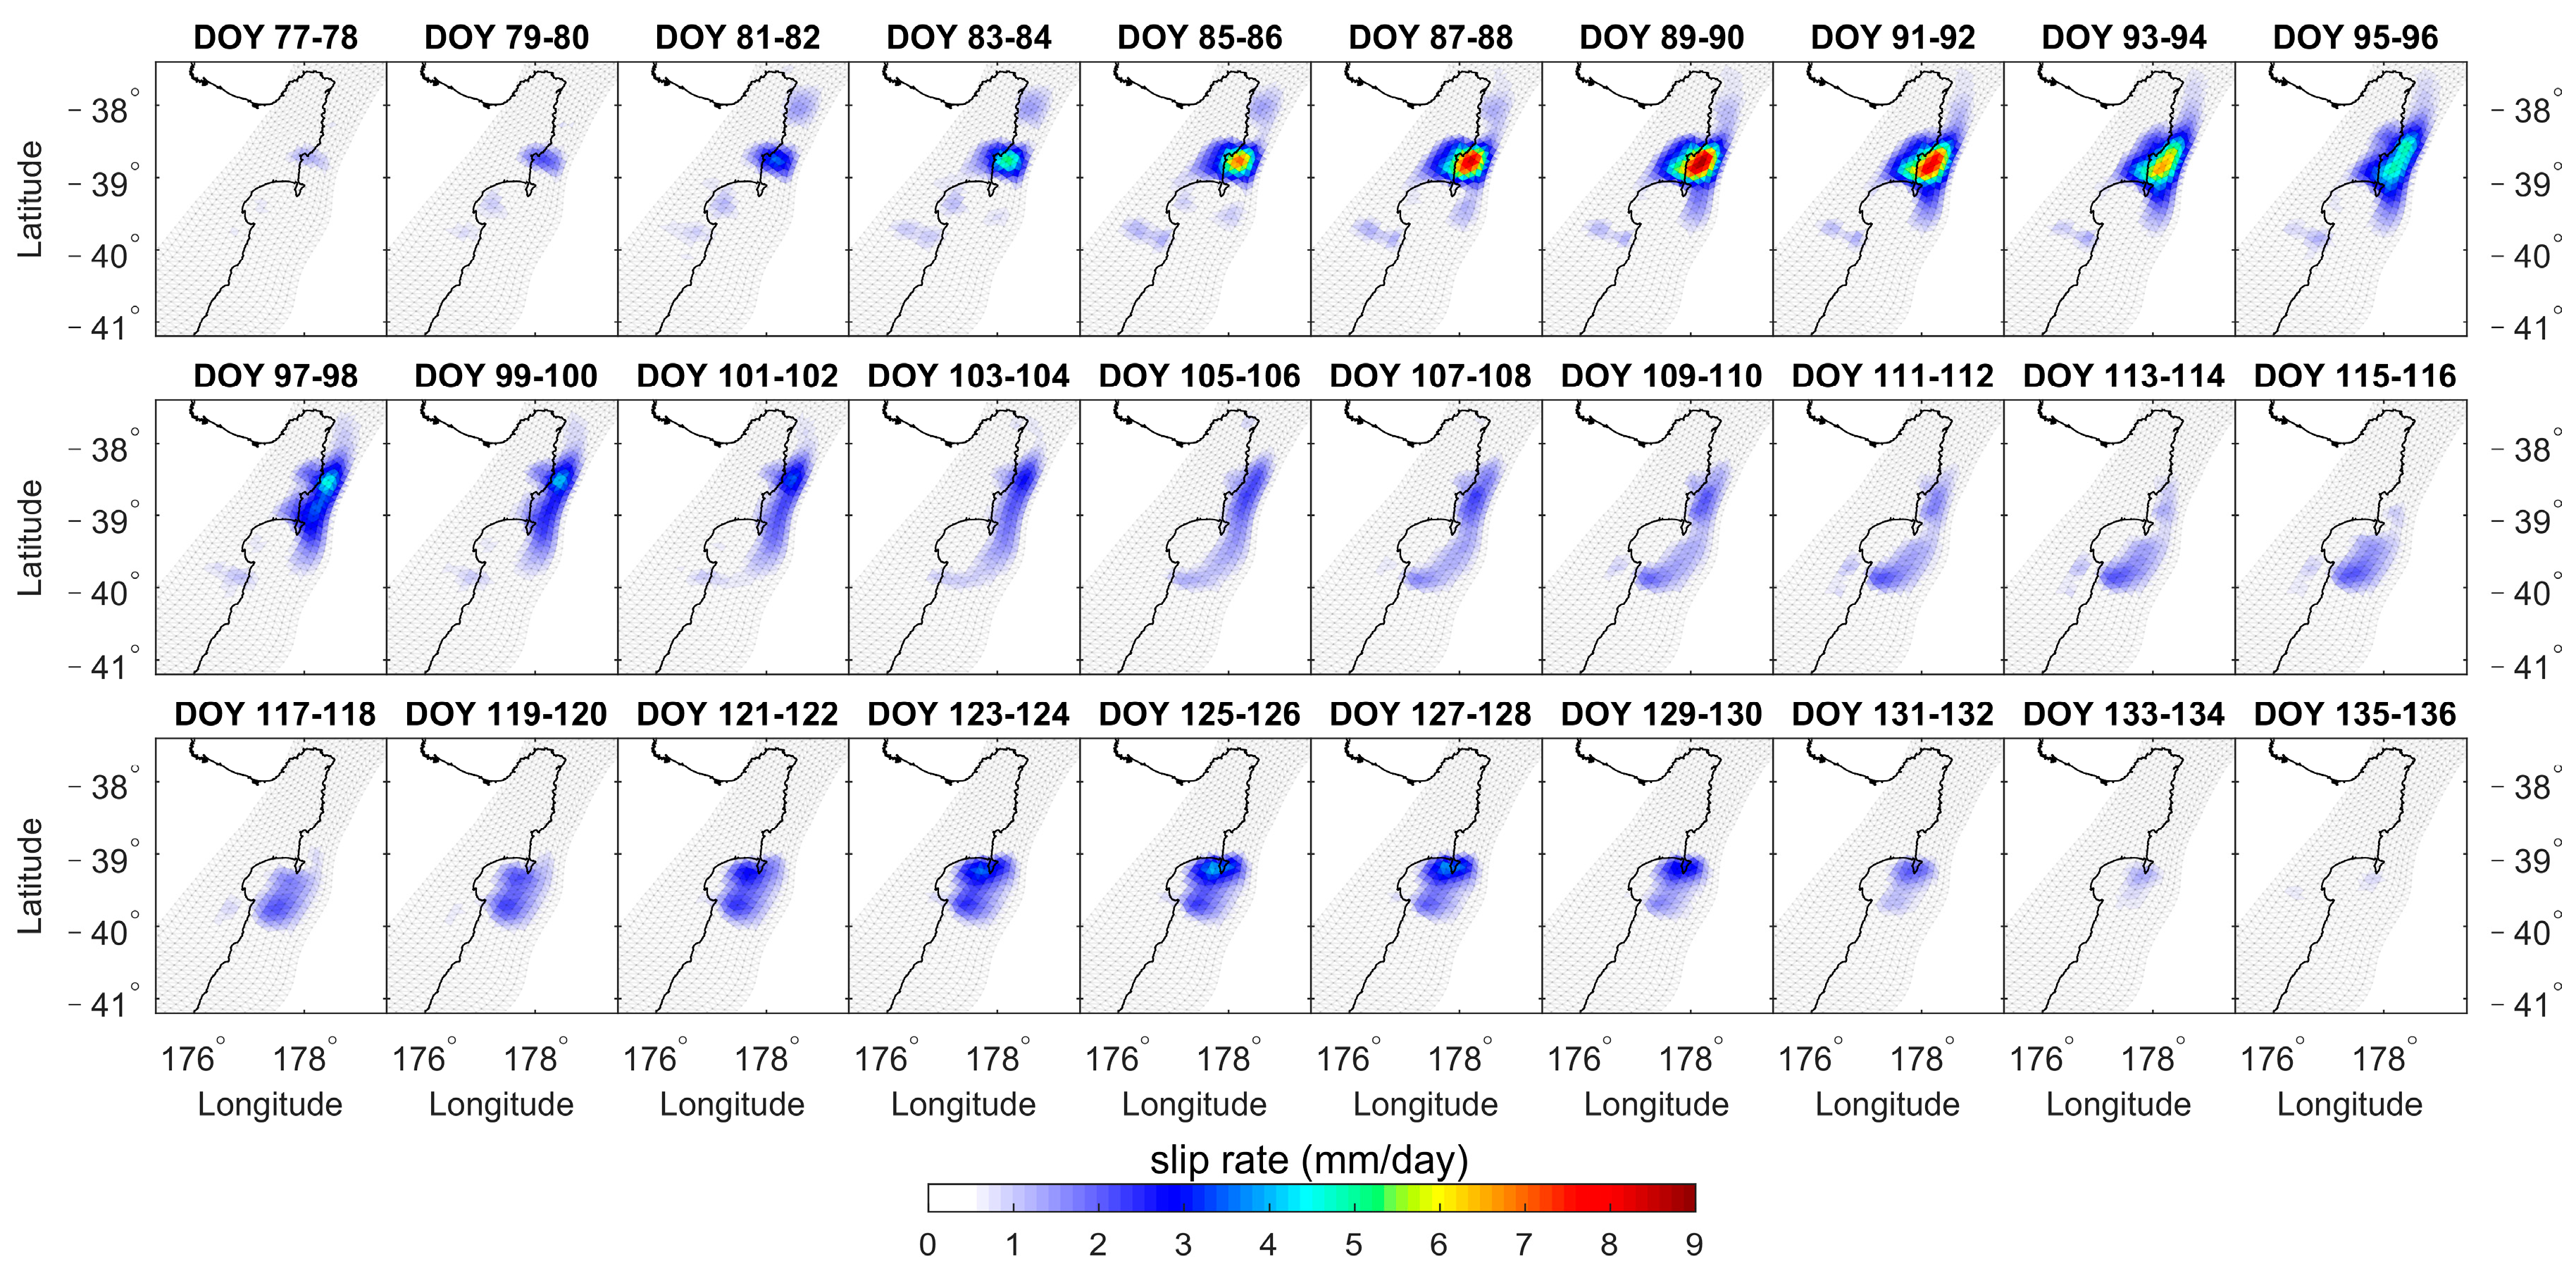
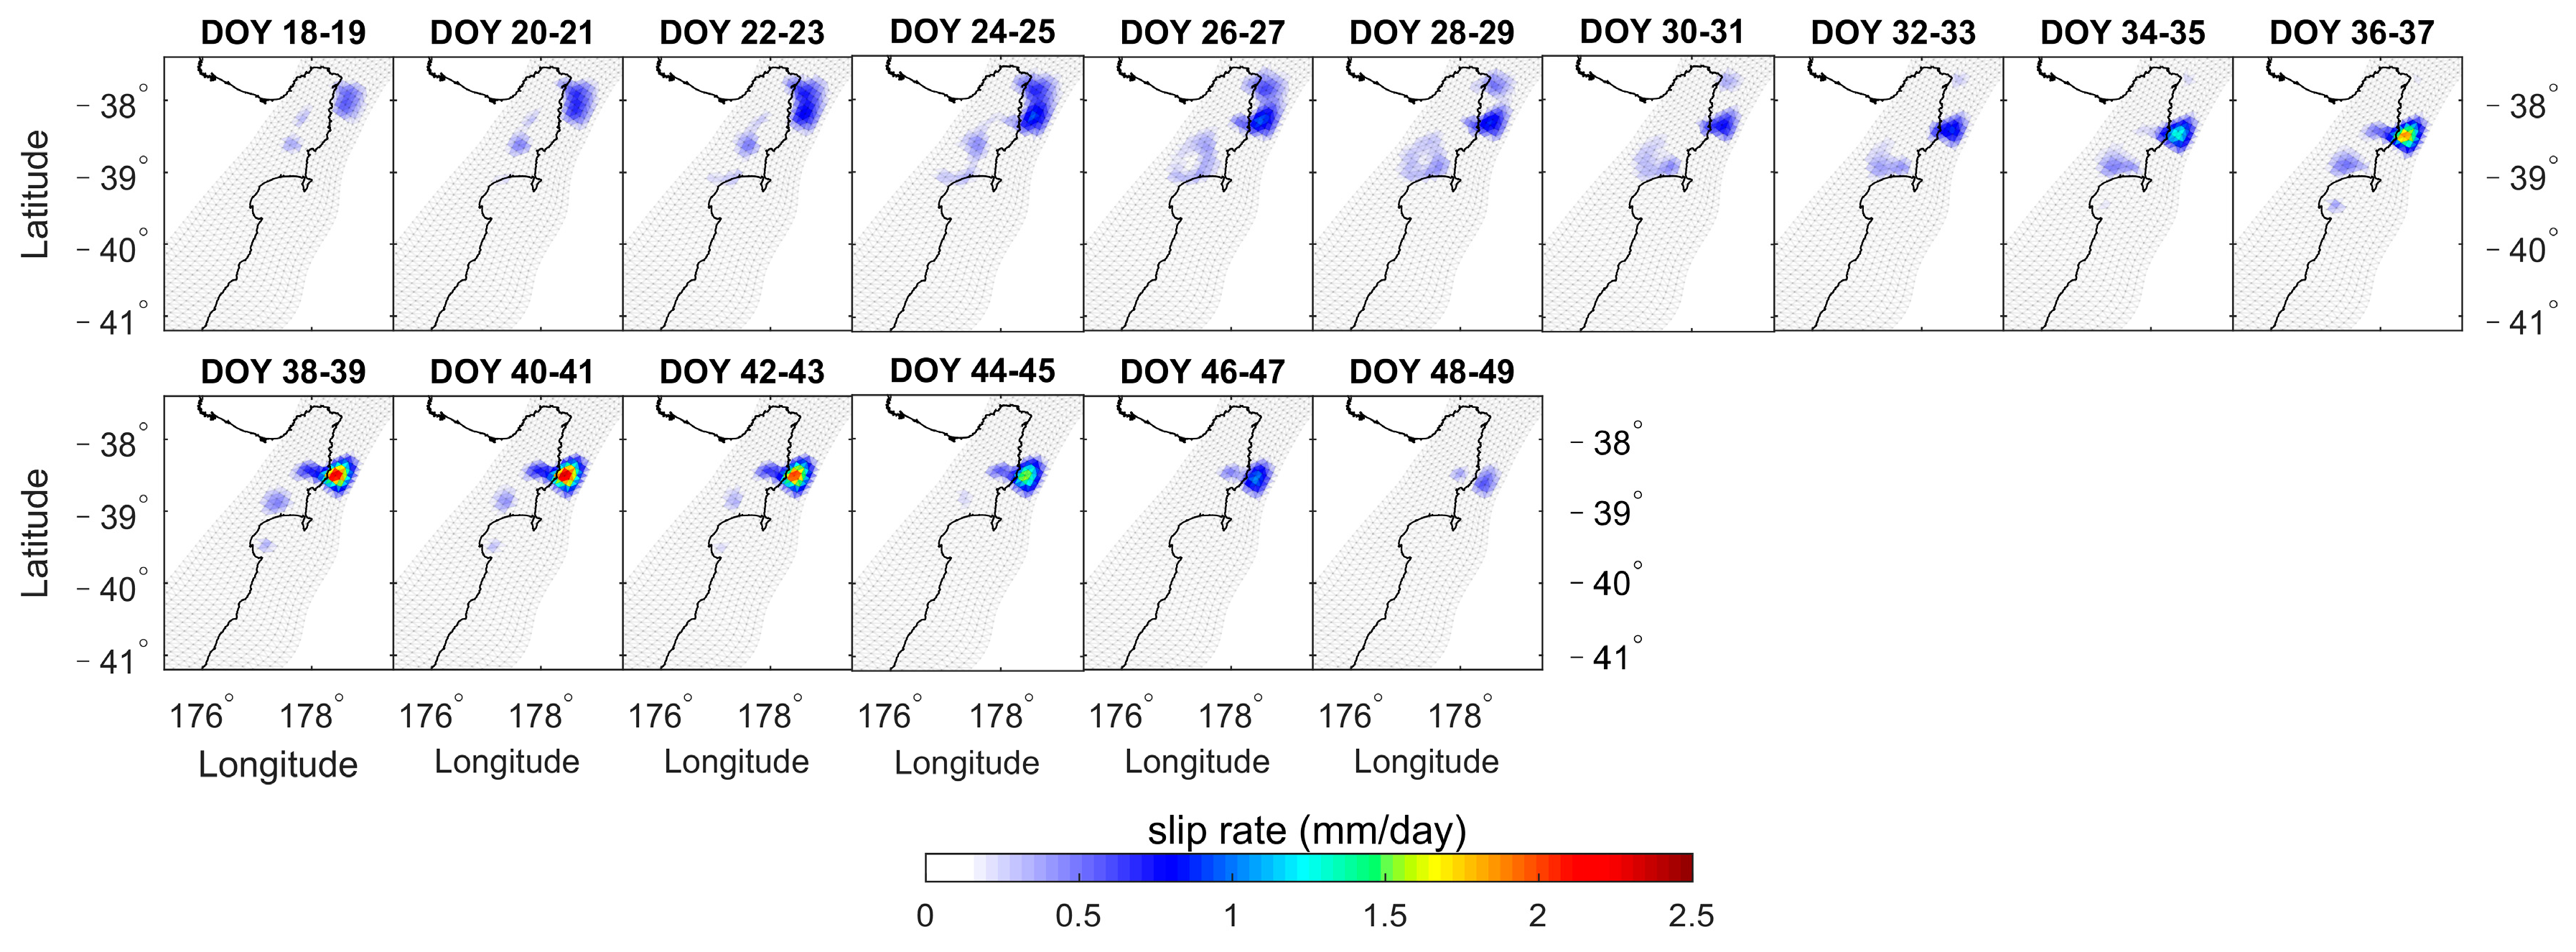
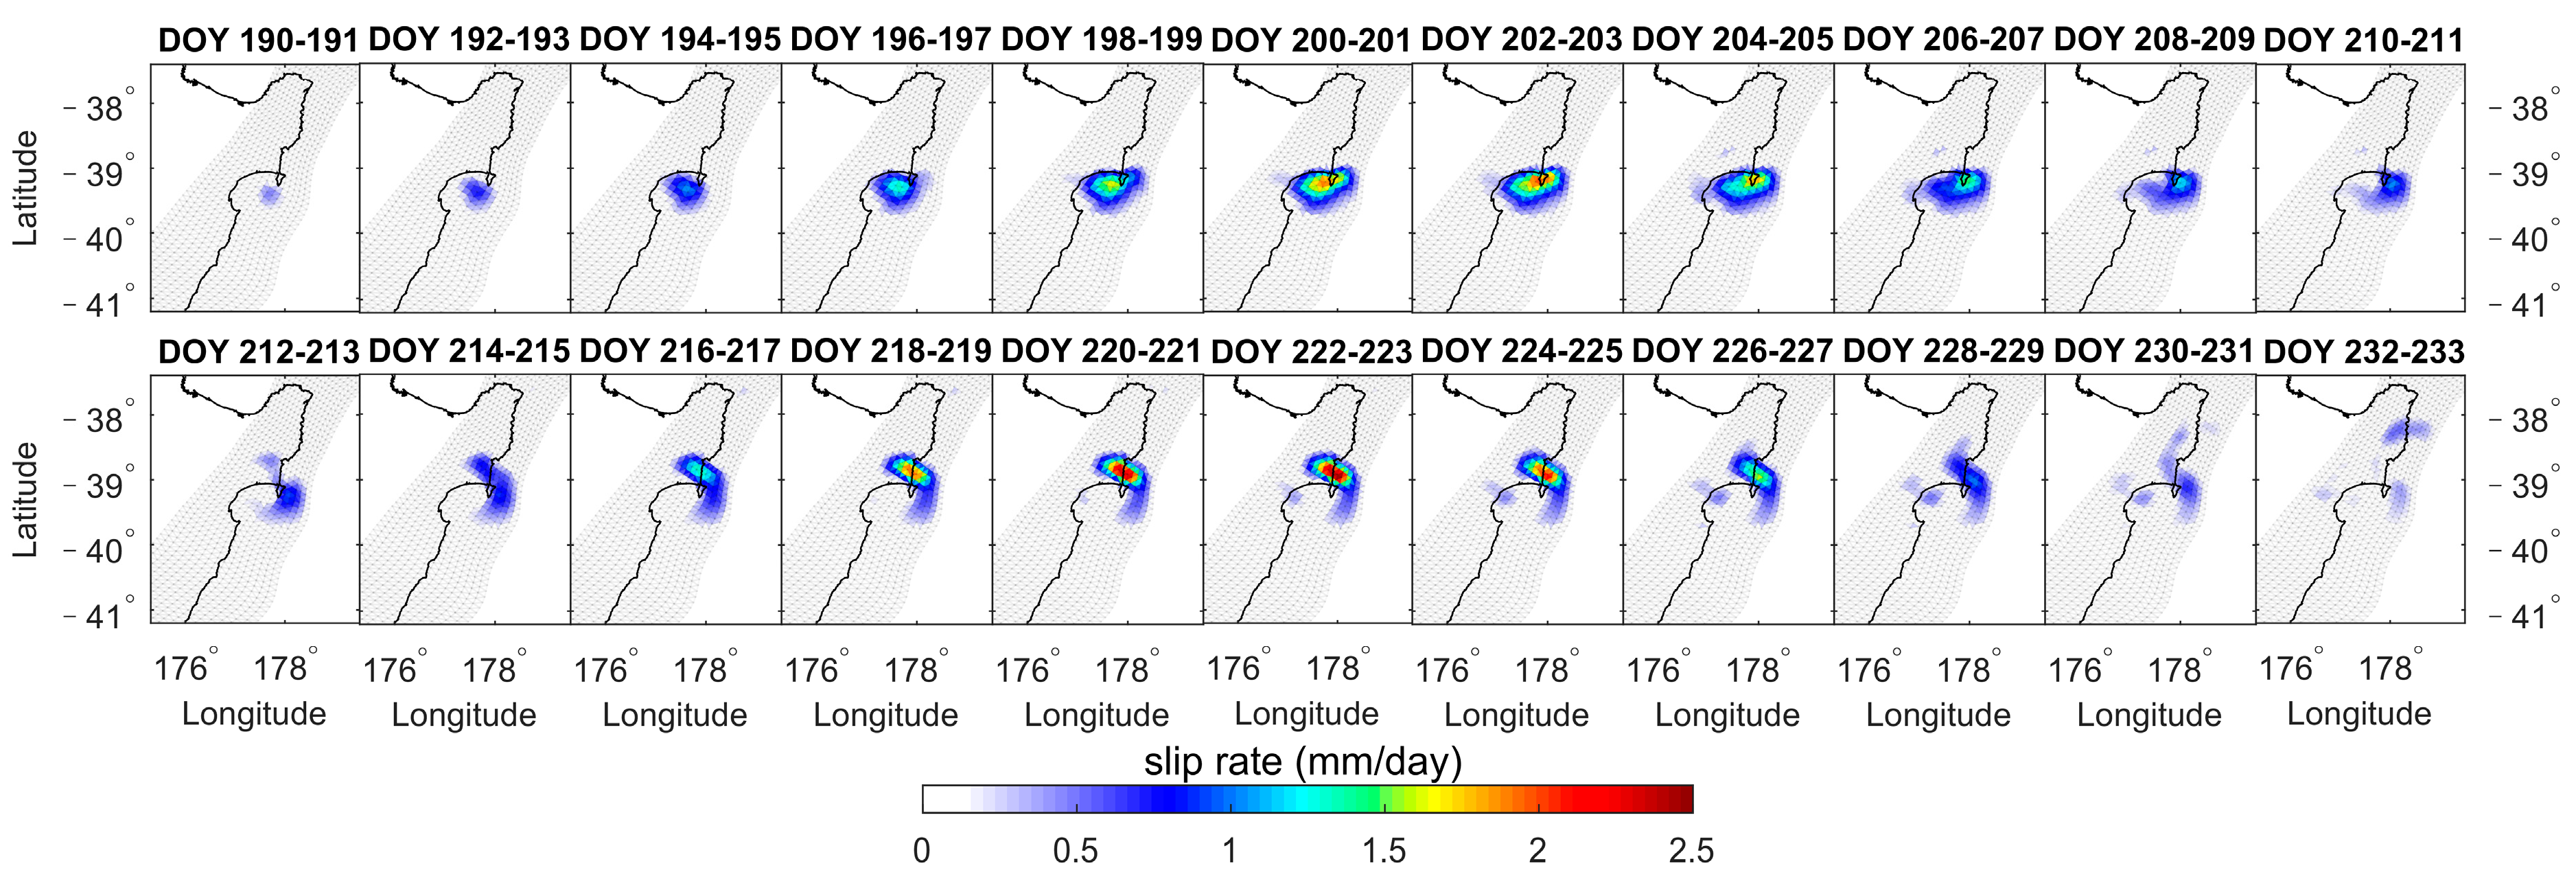
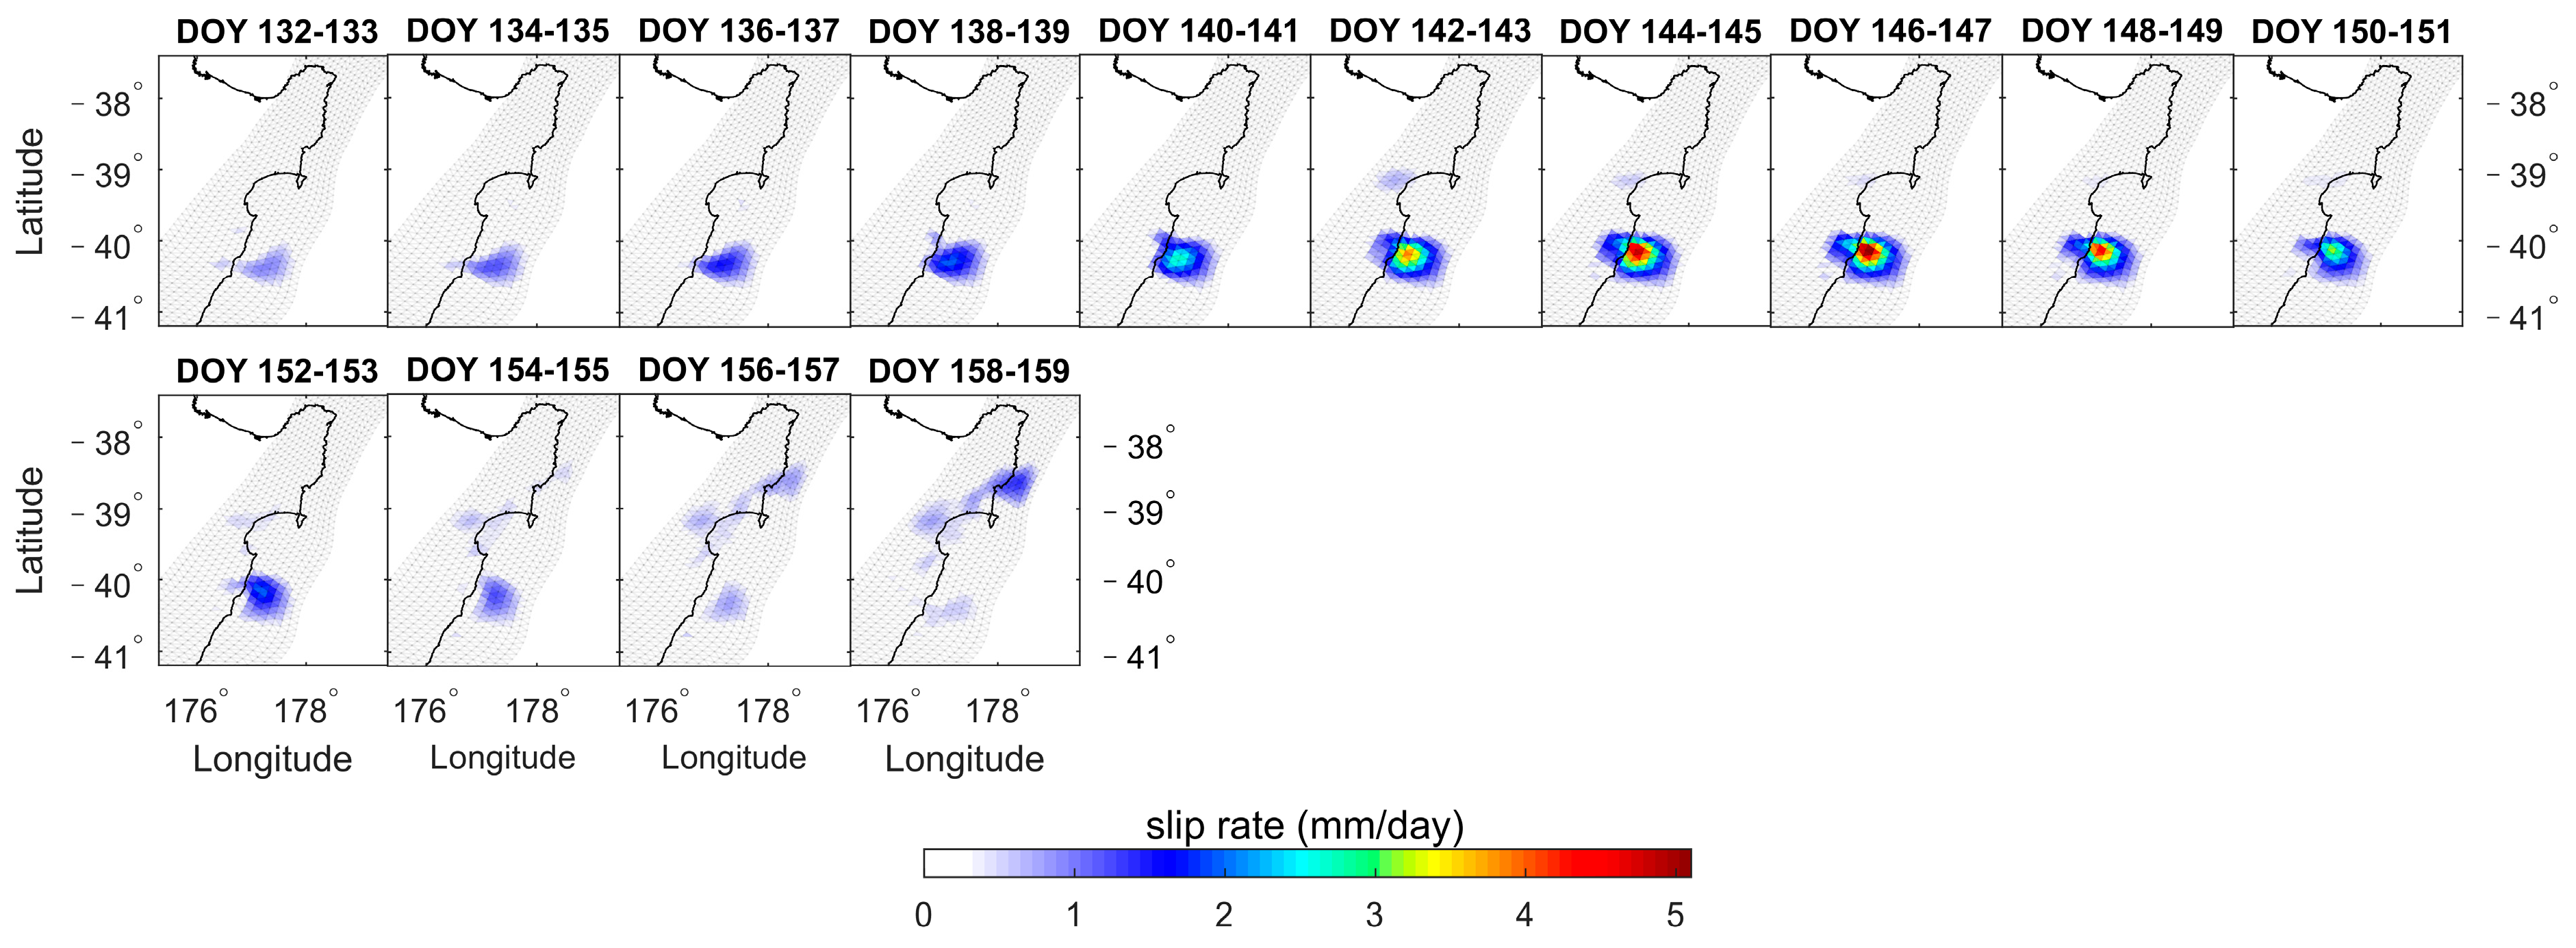
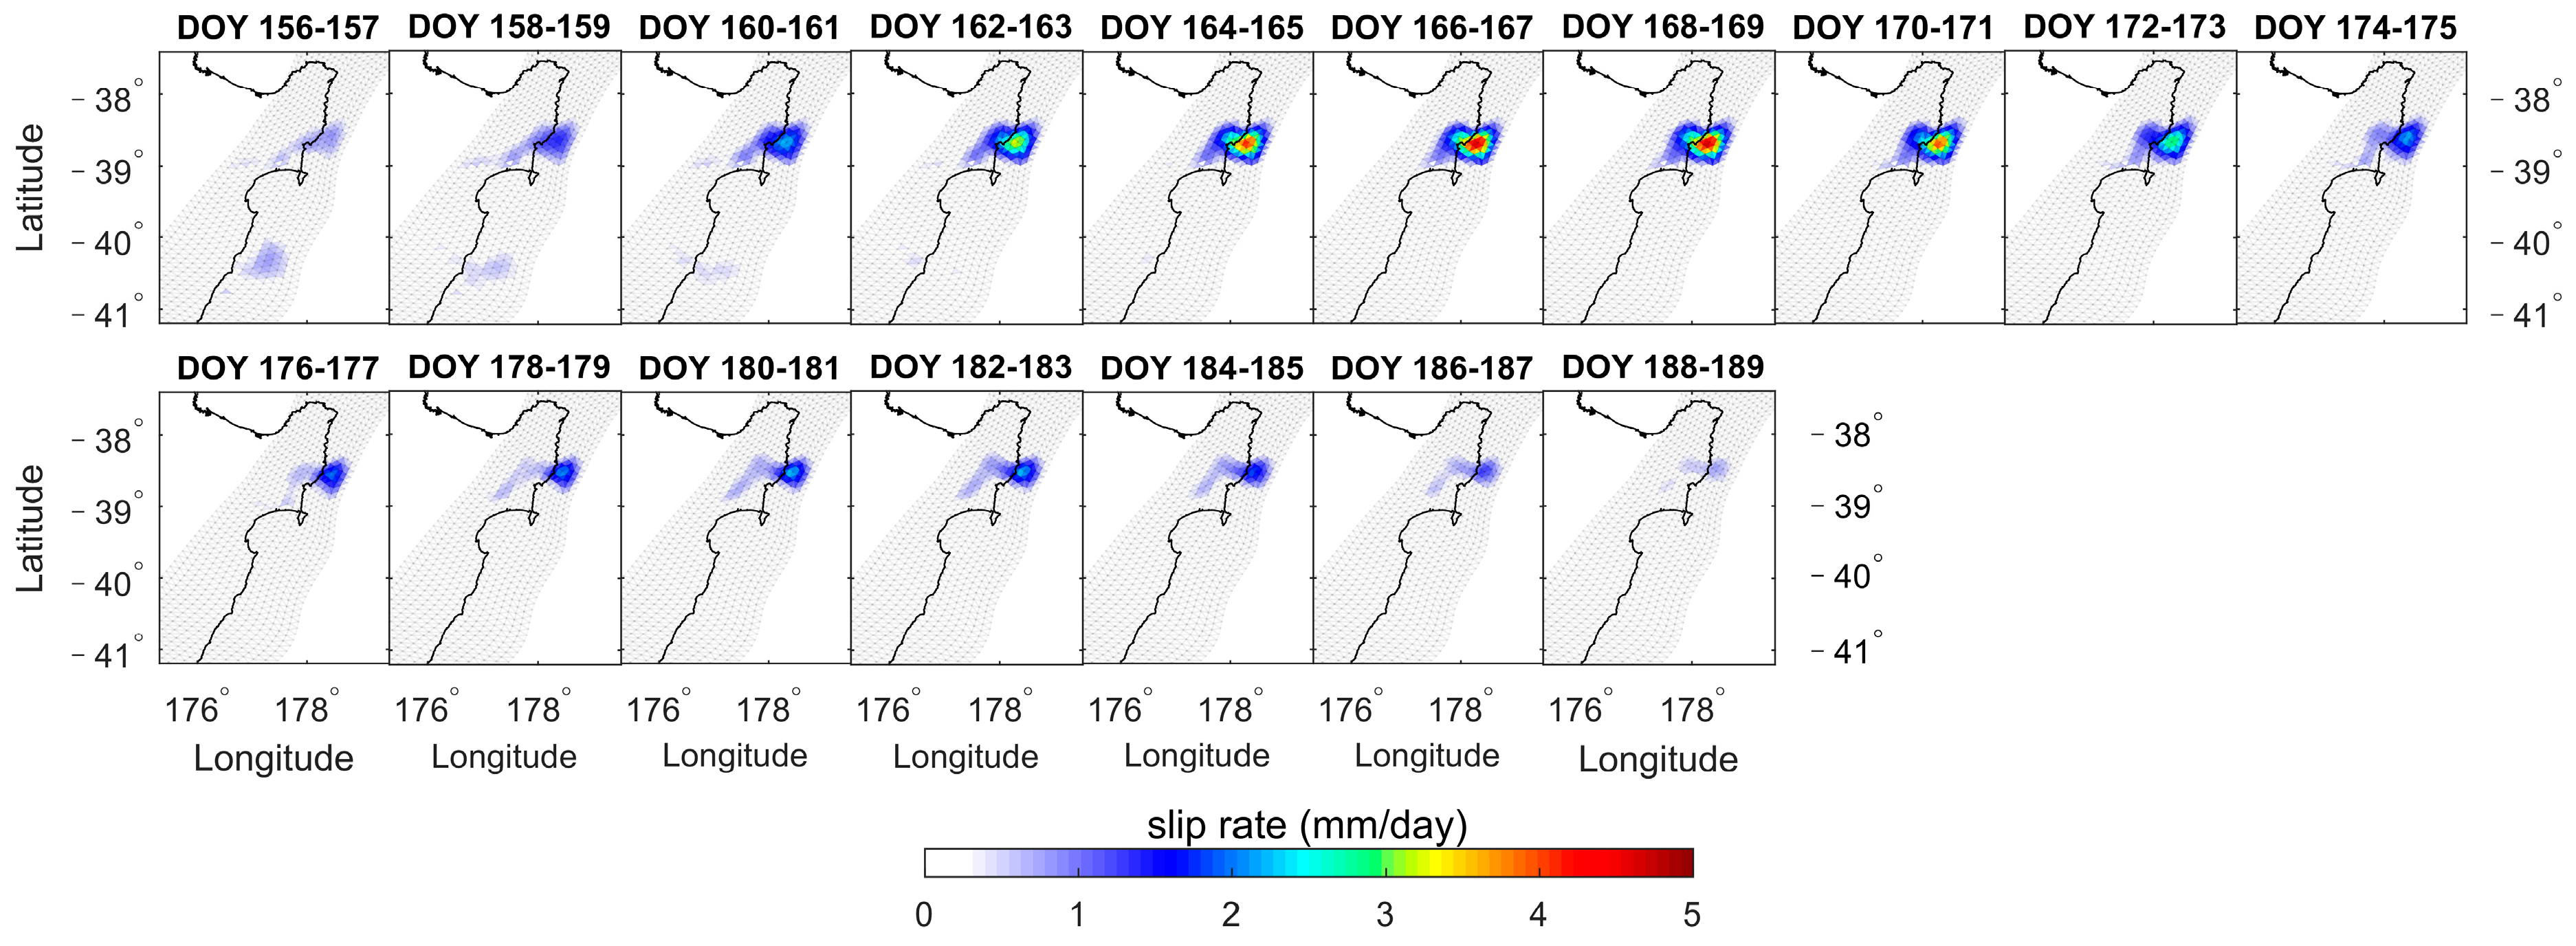
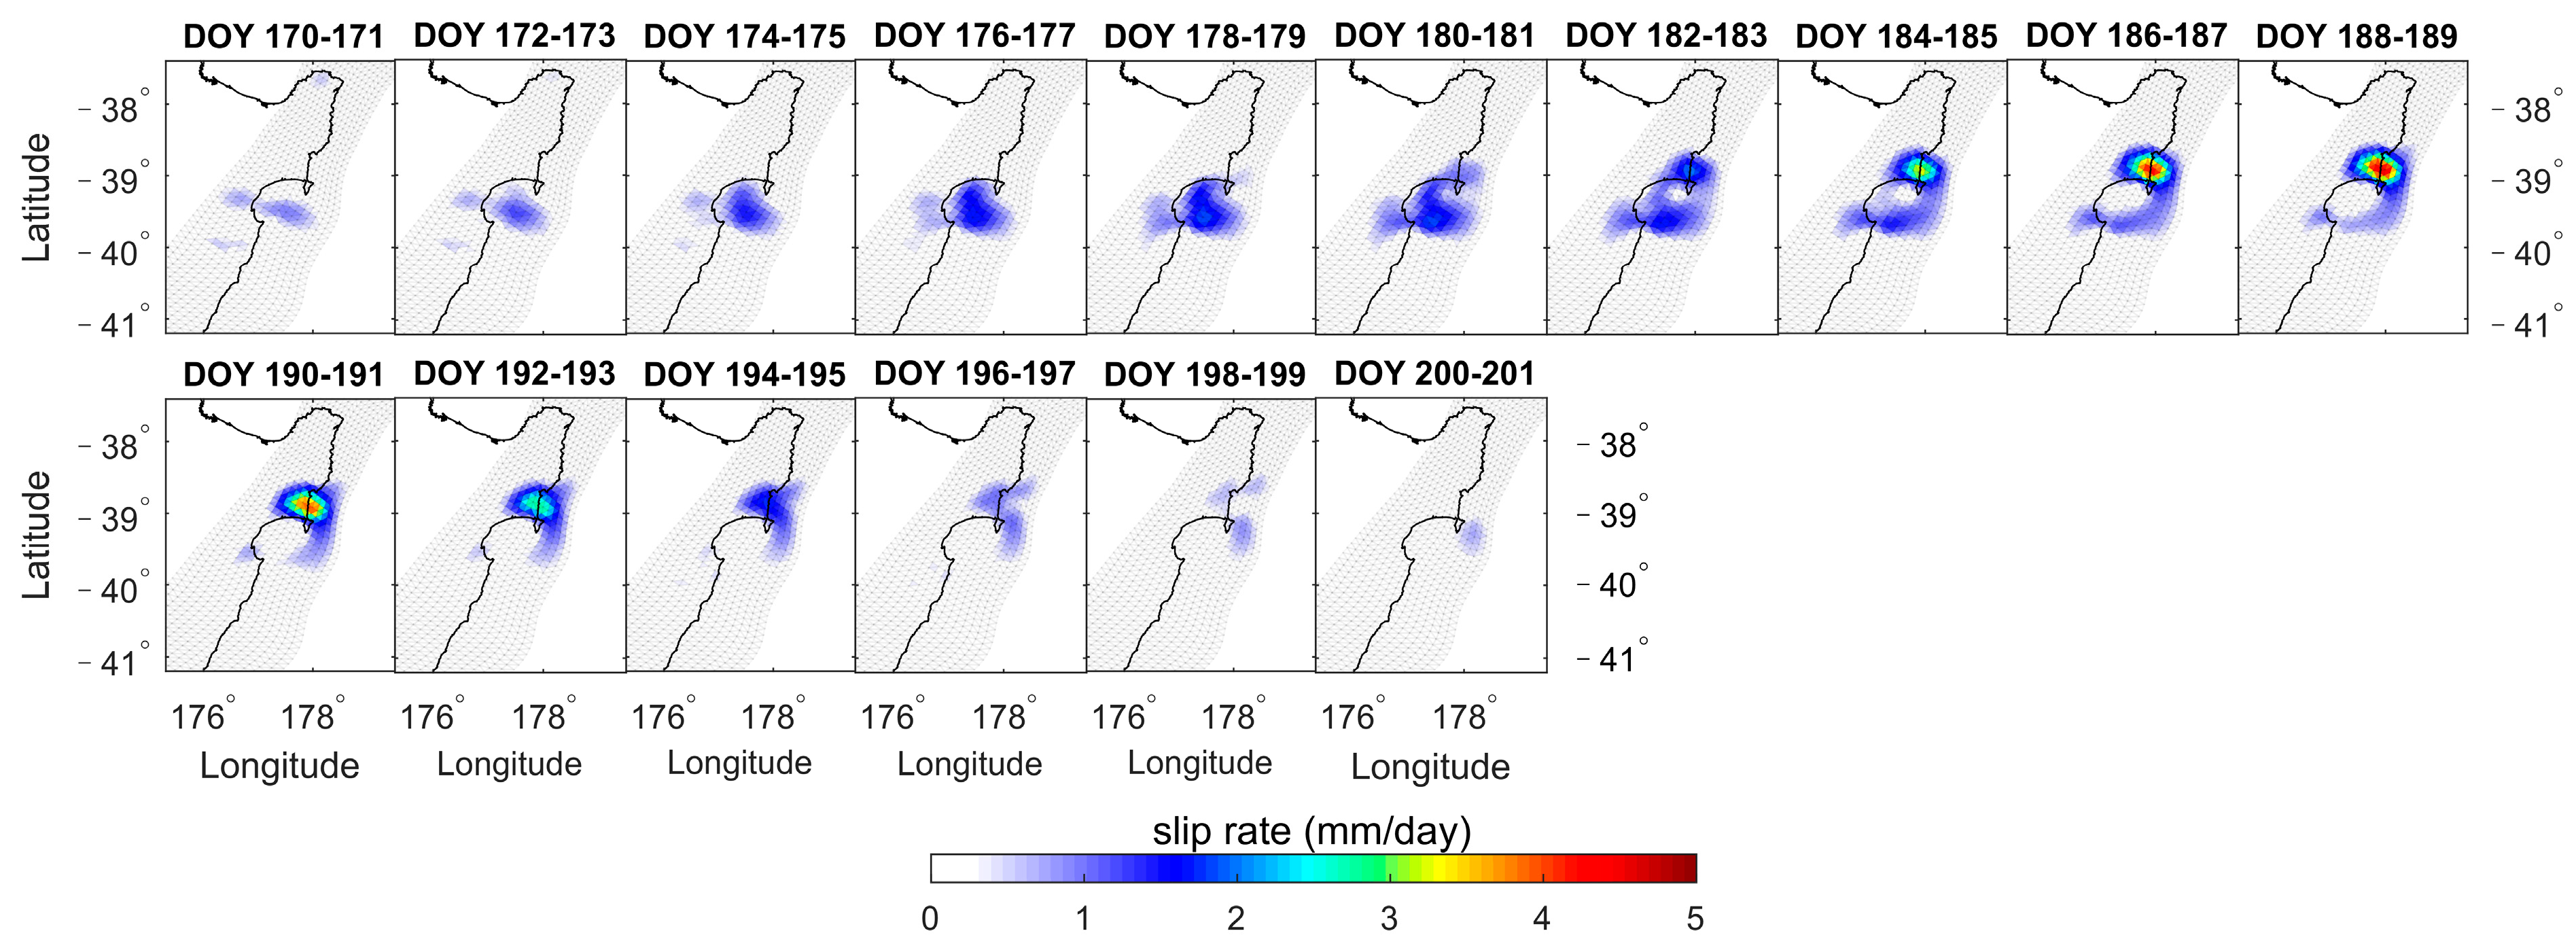
Figure 8, Figure 9, Figure 10, Figure 11, Figure 12, Figure 13, Figure 14 and Figure 15 depict the daily slip rates of the eight SSEs (averaged over two-day intervals). SSE1, SSE2, SSE3, SSE5, and SSE8 exhibit significant bi-phasic behavior characterized by acceleration-deceleration-acceleration-deceleration patterns. In Figure 8, SSE1 accelerates first, reaching a peak slip rate of 8.69 mm/day (2019, DOY 89–90, Gisborne), and next accelerates for a peak of 3.94 mm/day (2019, DOY 125–126, Hawke’s Bay). The two acceleration periods occurred in different geographical regions with some temporal overlap. In Figure 9, SSE2 accelerated first, reaching a peak slip rate of 0.97 mm/day (2020, DOY 18–27, Tolaga Bay), and next accelerated for a peak of 2.30 mm/day (2020, DOY 32–41, Tolaga Bay). Similarly, in Figure 10, SSE3 firstly accelerated, reaching a peak slip rate of 1.98 mm/day (2020, DOY 202–203, Hawke’s Bay), and next, accelerated for a peak of 2.44 mm/day (2020, DOY 222–223, Gisborne). In Figure 12, SSE5 accelerated first, reaching a peak slip rate of 1.55 mm/day (2021, DOY 27–44, Hawke’s Bay), and next accelerated for a peak of 1.89 mm/day (2021, DOY 45–72, Hawke’s Bay). Figure 15 displays SSE8, which accelerated first, reaching a peak slip rate of 1.86 mm/day (2022, DOY 170–181, Hawke’s Bay), and next accelerated for a peak of 4.54 mm/day (2022, DOY 188–189, Gisborne). SSE4 (Figure 11), SSE6 (Figure 13), and SSE7 (Figure 14) exhibited only one acceleration-deceleration phase, with peak slip rates of 1.83 mm/day (2020, DOY 242–243, Tolaga Bay), 5.05 mm/day (2021, DOY 146–147, Hawke’s Bay), and 4.61 mm/day (2021, DOY 168~169, Gisborne), respectively. The magnitudes of the daily slip rates for the eight SSEs differed, and their propagation directions varied as well. SSE1 propagated from northern (Gisborne) to southern (Hawke’s Bay). On the other hand, SSE3 and SSE8 had similar sliding regions to SSE1, propagating along the subduction zone but in the opposite direction, from Hawke’s Bay to Gisborne. SSE2, SSE4, SSE5, SSE6, and SSE7 are associated with the sliding regions of Tolaga Bay, Tolaga Bay, Hawke’s Bay, south of Hawke’s Bay, and Gisborne, respectively.
Table 1 summarizes the statistics of the investigated eight SSEs, including the main slip region, start and end time, maximum surface displacement, cumulative slip, and maximum daily slip rate. The identified SSEs from 2019 to 2021 are generally consistent with the results obtained by Ducellier et al. [36] using wavelet analysis. From 2019 to 2022, these SSEs primarily occurred in the Tolaga Bay, Gisborne, and Hawke’s Bay regions, with a duration ranging from 22 days to 58 days. During the SSEs, the maximum surface displacements ranged from 0.62 to 4.13 cm, the cumulative slips ranged from 2.39 to 14.35 cm, and the daily slip rates ranged from 1.83 to 8.69 mm/day.

3.4. Relationship between SSEs and Seismic Activities

To explore the relationship between SSEs and seismic activities, a spatiotemporal statistical analysis of these events is conducted. The spatial analysis encompasses two distinct regions: firstly, a broad expanse encompassing all eight SSEs, designated as the ‘eastern coastal region (ECR) of the North Island, New Zealand’, and secondly, the ‘main slip regions (MSR)’ of each individual SSE. The latter regions are defined as areas where the cumulative slip accounts for over 90% of the total slip. The temporal analysis extends over specific time intervals, including the period during each SSE (as indicated in Table 1 as ‘Duration’), the period before each SSE (extending backward from the moment of SSE onset by the same ‘Duration’), and the period after each SSE (extending forward from the moment of SSE termination by the same ‘Duration’). Utilizing these spatial and temporal parameters, spatial analysis (as shown in Figure 16) and temporal frequency analysis (as depicted in Figure 17) are conducted by querying the New Zealand earthquake catalog (https://quakesearch.geonet.org.nz/ (accessed on 12 September 2023)).
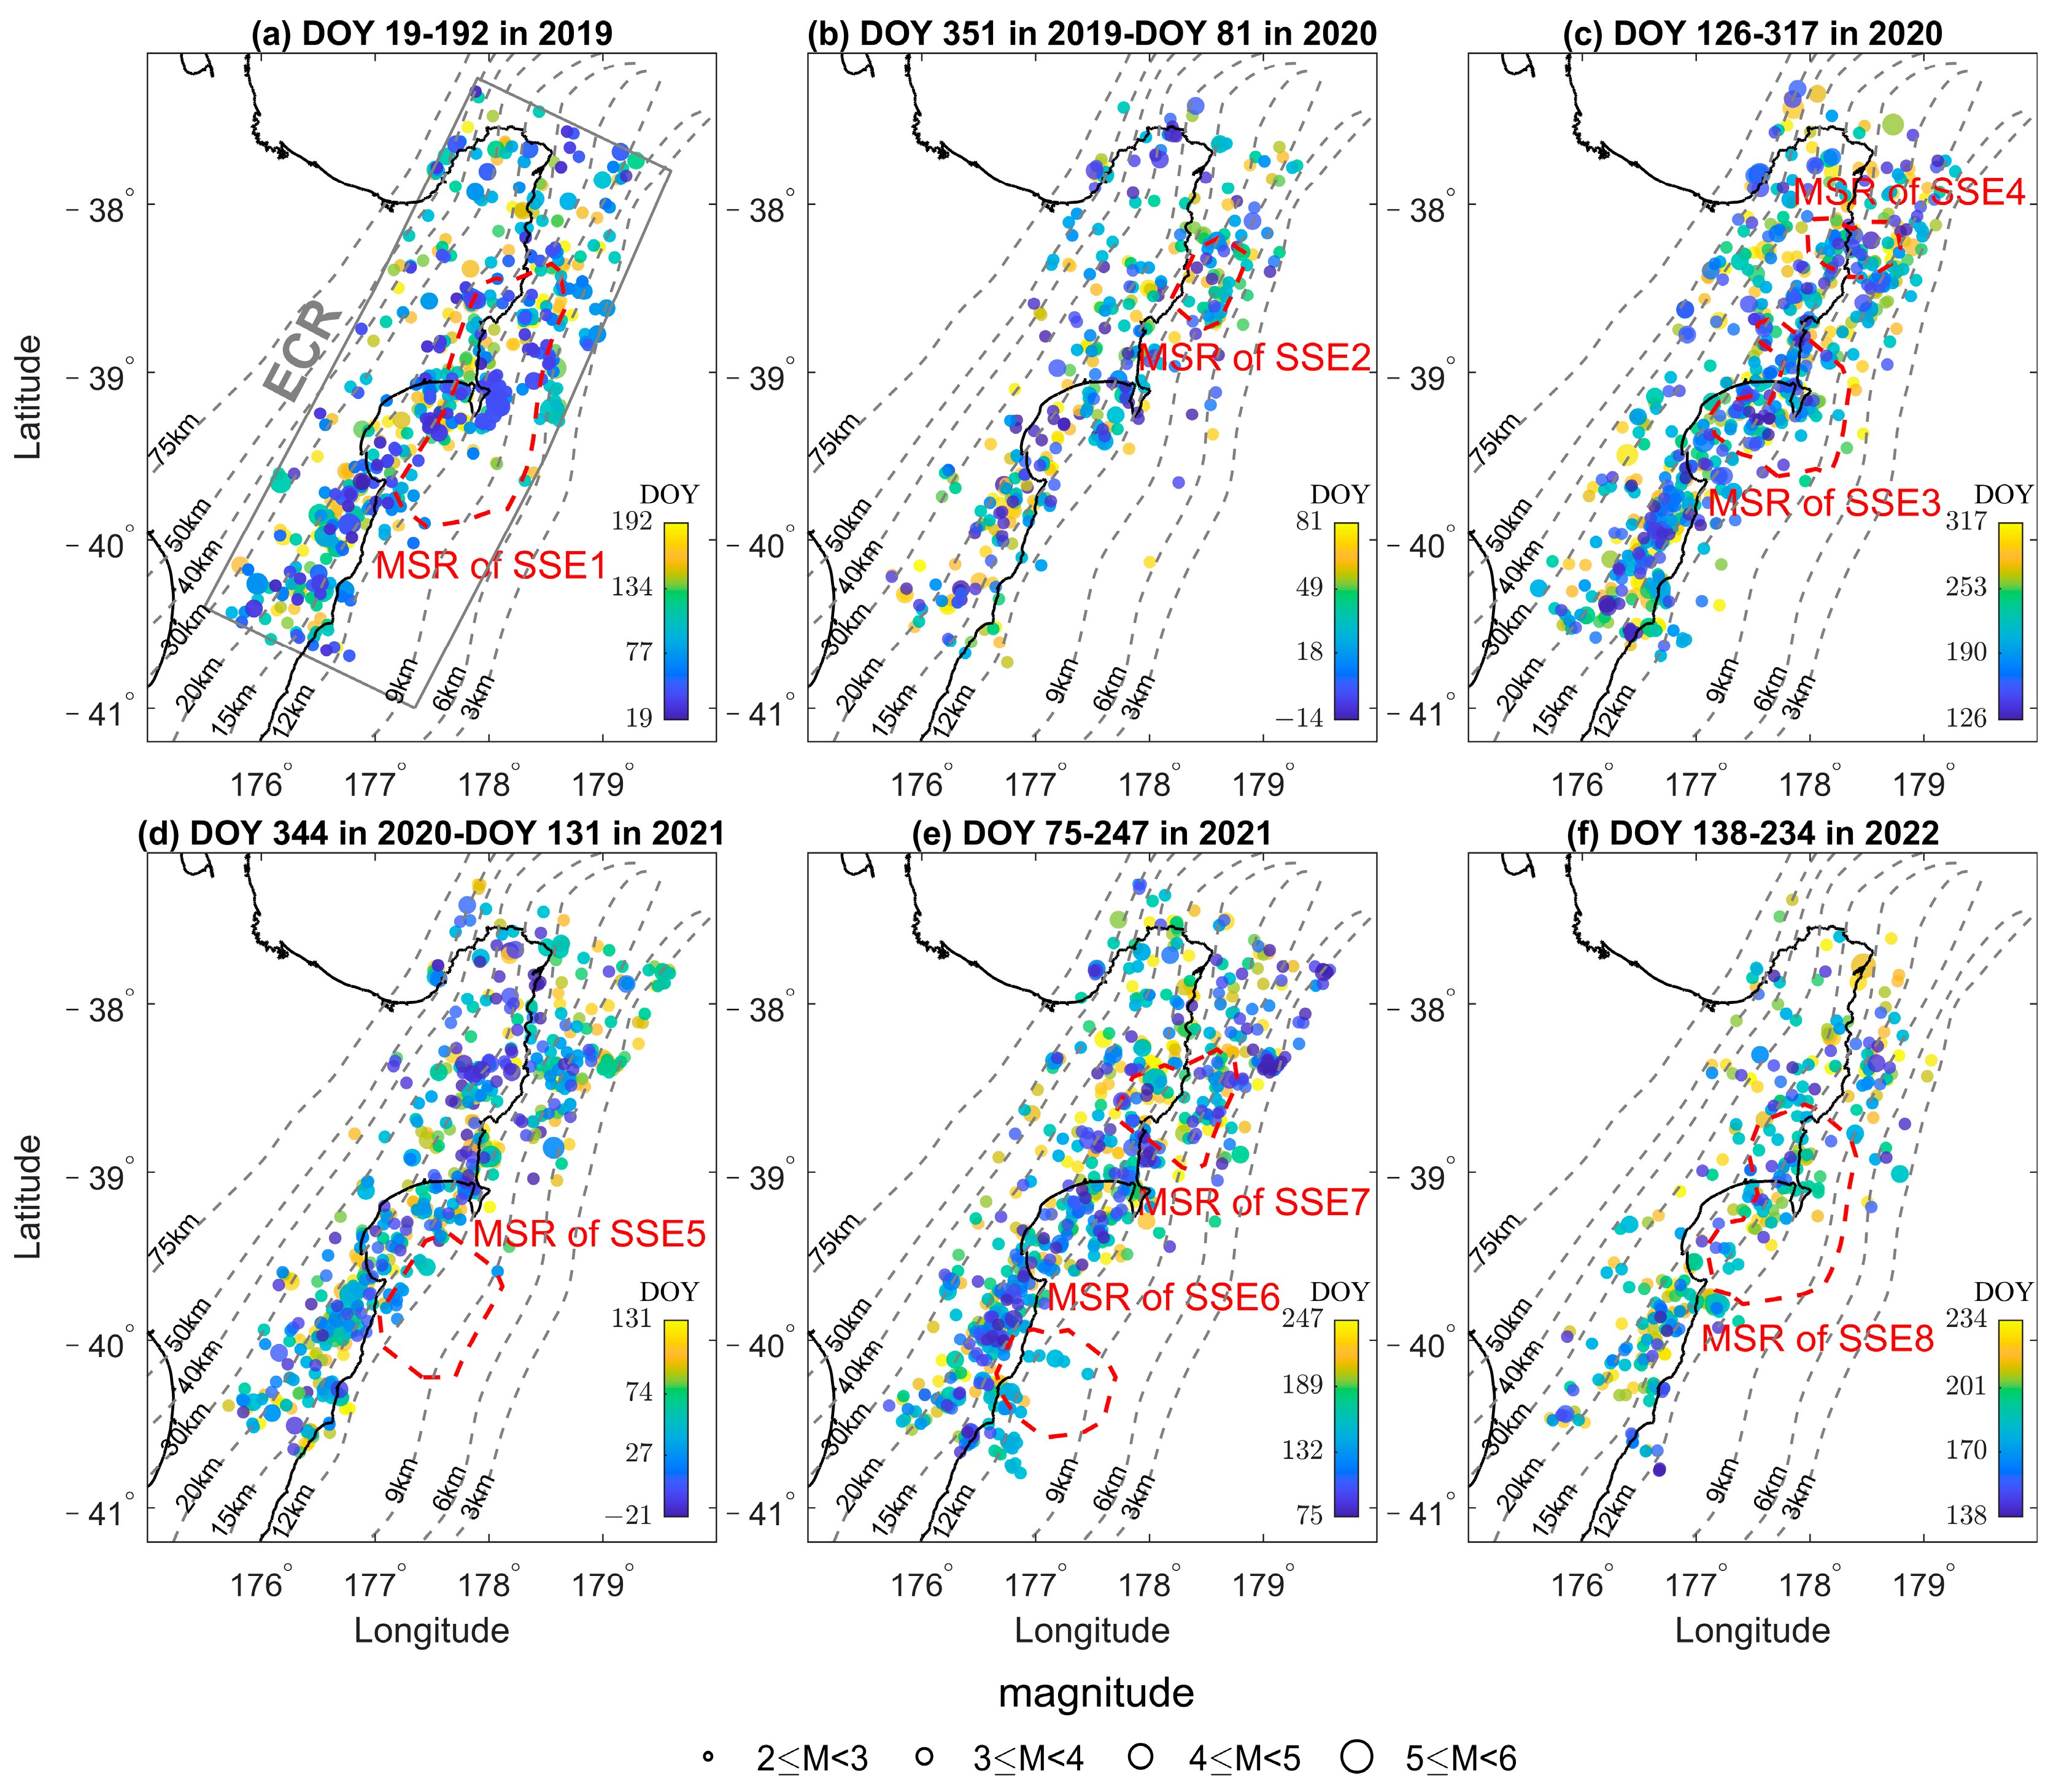
Figure 16a–f shows the spatial distribution of the seismic activities corresponding to before, during, and after the occurrences of the eight SSEs in ECR, as well as in MSR. Due to the partial temporal overlap between SSE3 and SSE4, the seismic activities related to these two SSEs are depicted in the same subplot (Figure 16c). Similarly, SSE6 and SSE7 are shown together in Figure 16d. Therefore, Figure 16 shows only six seismic analysis periods. Due to the high frequency of seismic activity occurrences, many of which are of small magnitude (below magnitude 6), the correlation between SSEs and seismic activity is not readily discernible from the spatial distribution in Figure 16. Therefore, we will conduct a temporal statistical analysis to further investigate their relationship.
Figure 17a,b shows the daily frequency of seismic activities in the ECR and MSR, respectively. For the ECR, during the occurrence of SSE1, the seismic frequency noticeably increases, reaching up to 6.5 events per day, surpassing two events per day before and after SSE1; During the occurrence of SSE7, the seismic frequency increases to 5.6 events per day, which is higher than the frequency of one event per day before and after SSE7. The other six SSEs (with an accumulated slip of less than 6 cm and maximum surface displacement of less than 2 cm) are smaller than SSE1 and SSE7, they have a relatively minor impact on the seismic frequency in the ECR. As for the MSR, during the occurrences of all eight SSEs, there is a noticeable increasing trend in seismic frequency. Thus, we can conclude that significant SSEs in the ECR of New Zealand’s North Island lead to an increased seismic frequency in that area. In contrast, smaller SSEs that only affect localized areas result in a relatively minor increase in seismic frequency.

4. Discussion

Numerous studies have demonstrated the correlation between seismic activity and SSEs. The phenomenon of SSEs accompanied by seismic swarms has been confirmed in multiple subduction zone regions. The seismic activity rate was calculated during SSEs on the margin of the Hikurangi subduction zone using the raw GeoNet earthquake catalog, and it was found that there was an enhanced seismic activity frequency during SSE occurrences [37]. Additionally, an increased seismic activity rate was observed during the 2004 SSE in the Hikurangi northern region [38], which is closely related to the spatial and temporal occurrence of SSEs. Furthermore, in the Boso Peninsula of Japan, there is a strong correlation between SSEs and seismic activity [39,40]. Notably, when the slip rate exceeds 4 m per year, regional seismic activity significantly increases [40]. Therefore, monitoring shallow SSEs in the region may contribute to the detection and recording of seismic activity.
GPS plays a crucial role in the detection of SSEs and the extraction of crustal deformation information. However, GPS coordinate time series are affected by various long-term tectonic movements, making it challenging to detect short-period SSEs occurring within a few days. Moreover, the uneven distribution of GPS stations between land and sea areas can lead to reduced spatial resolution. Therefore, future research will integrate multiple monitoring techniques, such as strainmeters, tiltmeters, seafloor pressure gauges, Interferometric Synthetic Aperture Radar, and others, to comprehensively analyze the region’s geodynamic features. This will further elucidate the physical mechanisms behind SSEs associated with seismic activity.
The triggering mechanisms underlying the correlation between seismic activity and SSEs remain unclear. Some studies show that stress changes induced by seismic activities can trigger SSEs. For instance, based on the temporal correlation between three SSEs and high seismic rates in Guerrero, Mexico, from 1995 to 2006, SSEs may be triggered by stress disturbances caused by nearby earthquakes, playing a significant role in stress communication between the down-dip and up-dip areas of shallow subduction zones [41]. The 2016 MW7.8 Kaikōura earthquake generated static Coulomb stress that triggered deep slow slip in the southern region [42], while dynamic Coulomb stress triggered shallow slow slip in the central and northern regions [21]. Conversely, seismic activities can also inhibit ongoing SSEs. Using cGPS data from the Hikurangi subduction zone in New Zealand, it was observed that stress changes induced by local seismic activity can block an ongoing SSE [22]. Furthermore, these seismic-induced stress changes can also modify the recurrence periods of SSEs. For example, the 2016 Mw7.6 Kumamoto earthquake caused a delay in the recurrence interval of long-term SSEs in Japan’s Bungo channel in 2018–2019, extending it from 5–6 years to 7 years [43]. Similarly, the recurrence intervals of short-term Boso SSEs shifted from 4 to 6 years prior to the 2011 Tohoku earthquake to intervals of 0.6, 2.2, and then 4.4 years after the earthquake [44].
Another perspective on the stress interaction between seismic activities and SSEs posits that SSEs within the subduction zone cause changes in stress within the tectonic plates, disrupting fault stability and triggering earthquakes [6,45,46]. For example, two months before the 2014 Mw7.3 Papanoa earthquake in the Guerrero subduction zone of Mexico, an SSE near the epicenter area led to an increase in static stress, ultimately triggering the initiation of this major earthquake [47]. Three SSEs on the northern margin of the Hikurangi subduction zone triggered the Mw7.1 Te Araroa earthquake in September 2016 [46]. The 2014 Eketahuna earthquake caused dynamic/static stress changes on the Hikurangi subduction interface, and in combination with the varying slip rates of the 2013–2014 Kapiti SSE before and after the earthquake, it is proposed that the interaction mechanism between the two involves slow slip-induced stress changes triggering earthquakes, while earthquake-induced Coulomb stress changes lead to a reduction in slow slip rates, ultimately terminating the SSE [22]. SSEs can alter the regional stress field, increasing or releasing stress on faults, bringing them closer to or further away from failure. Therefore, based on the inferences regarding stress changes between SSEs and seismic activity on the subduction interface, such deductions may aid in seismic hazard assessment.
Indeed, some studies indicate a weak spatiotemporal relationship between seismic activity and SSEs. For instance, at the southernmost Ryukyu Trench, high-pressure fluid activity is suggested to primarily cause the initiation of shallow SSEs and subsequent seismicity. This interpretation offers insights into the widespread occurrence of many shallow SSEs [48]. Additionally, SSE-induced stress loading is unlikely to trigger pre-SSE earthquake swarms, as the pre-SSE earthquake swarm activity ceased before transient GPS displacements occurred. As an alternative explanation, it proposes that intraplate fluid migration before and after SSEs might trigger the pre- and post-SSE earthquake swarms, respectively [49]. Studies have shown that the occurrence of SSEs is related to frictional characteristics between faults [50,51], fluid motion [49,52], and other factors, indicating a complex mechanism behind SSEs.
In summary, there are currently two main mechanisms proposed for the interaction between SSEs and seismic activity along subduction zones. The first involves dynamic and static stress changes on faults, while the second involves fluid migration between the plate interface faults. Considering the perspectives mentioned above and the findings of this study, we believe that there is a correlation between seismic activity and SSEs in the Hikurangi subduction zone of New Zealand. However, the specific mechanisms of interaction between the two phenomena still require further investigation in future research.

5. Conclusions

The study extracts the displacement time series induced by SSEs occurring in the central and northern margins of the Hikurangi Subduction Zone in New Zealand from the daily coordinate time series data obtained from the continuously operating GPS network in the years 2019 to 2022. Subsequently, the NIF method is utilized to invert the spatiotemporal slip processes of the identified eight SSEs. Combining regional seismic data, the correlation between SSEs and seismic activity is discussed. The conclusions are as follows:
  • From 2019 to 2022, a total of eight shallow SSEs were identified in the central and northern margins of the Hikurangi Subduction Zone in New Zealand using GPS displacement time series. The maximum surface displacements of the eight SSEs observed by GPS are as follows: 4.97, 0.84, 1.33, 0.87, 0.88, 1.27, 2.53, and 1.92 cm.
  • The fault slips of the eight SSEs are inverted by NIF. The cumulative slips vary from 2.39 to 14.35 cm, the daily slip rates range from 1.83 to 8.69 mm/day, the depths range of 6–20 km, and the duration ranges from 22 days to 58 days. SSE1, SSE2, SSE3, SSE5, and SSE8 exhibit significant biphasic behavior characterized by acceleration-deceleration-acceleration-deceleration patterns. However, SSE4, SSE6, and SSE7 exhibit only one acceleration-deceleration phase.
  • By analyzing the spatial distribution and daily frequency of seismic activity before, during, and after the eight SSEs in New Zealand’s North Island’s Eastern Coastal Region (ECR), as well as in the Main Slip Regions (MSR) of the SSEs, it is evident that all eight SSEs bring about an increase in seismic frequency within their respective MSR, but only significant SSEs (SSE1 and SSE7, their cumulative slips are over 7 cm) trigger an elevated seismic frequency in the ECR of the New Zealand’s North Island.

Supplementary Materials

The following supporting information can be downloaded at: https://www.mdpi.com/article/10.3390/rs15194767/s1, Figure S1: The cumulative slip uncertainty for the eight SSEs.

Author Contributions

L.Y. and M.L. designed the work, L.Y. processed and analyzed SSE signals from GPS coordinate time series, and Y.S. assisted in the analysis of SSEs and seismic activities. L.Y., Y.S., M.L., A.E.-M. and L.M. contributed to discussion of the method and results, and writing of the paper. All authors have read and agreed to the published version of the manuscript.

Funding

This research was funded by the National Natural Science Foundation of China (41704031, 42061077); the Natural Science Foundation of Jiangxi Science and Technology Department (20232BAB203073); the Key Laboratory for Digital Land and Resources of Jiangxi Province, East China University of Technology (DLLJ202213, DLLJ202203); the Key Laboratory of Mine Environmental Monitoring and Improving around Poyang Lake, Ministry of Natural Resources (MEMI-2021-2022-29).

Data Availability Statement

The GPS time series and Seismic products are available from GeoNet (https://www.geonet.org.nz (accessed on 26 September 2023)).

Acknowledgments

We acknowledge the New Zealand GeoNet programme and its sponsors EQC, GNS Science, LINZ, NEMA and MBIE for providing data used in this study.

Conflicts of Interest

The authors declare no conflict of interest.

References

  1. Villafuerte, C.; Cruz-Atienza, V.M. Insights into the causal relationship between slow slip and tectonic tremor in Guerrero, Mexico. J. Geophys. Res. Solid Earth 2017, 122, 6642–6656. [Google Scholar] [CrossRef]
  2. Schwartz, S.Y.; Rokosky, J.M. Slow slip events and seismic tremor at circum-Pacific subduction zones. Rev. Geophys. 2007, 45, RG3004. [Google Scholar] [CrossRef]
  3. Song, S.; Hao, M.; Li, Y.; Wang, Q. Extraction of transient signal from GPS position time series by employing ICA. Geod. Geodyn. 2023; in press. [Google Scholar] [CrossRef]
  4. Li, M.; Yan, L.; Jiang, Z.; Xiao, G. Insights into spatio-temporal slow slip events offshore the Boso Peninsula in central Japan during 2011–2019 using GPS data. Geod. Geodyn. 2022, 13, 554–563. [Google Scholar] [CrossRef]
  5. Li, D.; Liu, Y. Spatiotemporal evolution of slow slip events in a nonplanar fault model for northern Cascadia subduction zone. J. Geophys. Res. Solid Earth 2016, 121, 6828–6845. [Google Scholar] [CrossRef]
  6. Fukuda, J.i. Variability of the Space-Time Evolution of Slow Slip Events Off the Boso Peninsula, Central Japan, from 1996 to 2014. J. Geophys. Res. Solid Earth 2018, 123, 732–760. [Google Scholar] [CrossRef]
  7. Li, Y.; Zhengdong, L.; Aiping, Z.; Meng, L.; Dingde, Y. NIF inversion and spatiotemporal analysis of GPS monitoring slow slip events. Geomat. Inf. Sci. Wuhan Univ. 2022, 1–13. [Google Scholar] [CrossRef]
  8. Jiang, Y.; Liu, Z.; Davis, E.E.; Schwartz, S.Y.; Dixon, T.H.; Voss, N.; Malservisi, R.; Protti, M. Strain release at the trench during shallow slow slip: The example of Nicoya Peninsula, Costa Rica. Geophys. Res. Lett. 2017, 44, 4846–4854. [Google Scholar] [CrossRef]
  9. Wallace, L.M. Slow Slip Events in New Zealand. Annu. Rev. Earth Planet. Sci. 2020, 48, 175–203. [Google Scholar] [CrossRef]
  10. Zhang, L.; Huang, D.; Shum, C.K.; Guo, R. The 2019 East Coast Slow Slip Event, New Zealand: Spatiotemporal Evolution and Associated Seismicity. Mar. Geod. 2022, 46, 195–215. [Google Scholar] [CrossRef]
  11. Romanet, P.; Ide, S. Ambient tectonic tremors in Manawatu, Cape Turnagain, Marlborough, and Puysegur, New Zealand. Earth Planets Space 2019, 71, 59. [Google Scholar] [CrossRef]
  12. Todd, E.K.; Schwartz, S.Y. Tectonic tremor along the northern Hikurangi Margin, New Zealand, between 2010 and 2015. J. Geophys. Res. Solid Earth 2016, 121, 8706–8719. [Google Scholar] [CrossRef]
  13. Douglas, A. Slow slip on the northern Hikurangi subduction interface, New Zealand. Geophys. Res. Lett. 2005, 32, 16305. [Google Scholar] [CrossRef]
  14. Wallace, L.M.; Beavan, J. A large slow slip event on the central Hikurangi subduction interface beneath the Manawatu region, North Island, New Zealand. Geophys. Res. Lett. 2006, 33, L11301. [Google Scholar] [CrossRef]
  15. Iwasaki, Y.; Mochizuki, K.; Ishise, M.; Todd, E.K.; Schwartz, S.Y.; Zal, H.; Savage, M.K.; Henrys, S.; Sheehan, A.F.; Ito, Y.; et al. Continuous Tremor Activity with Stable Polarization Direction Following the 2014 Large Slow Slip Event in the Hikurangi Subduction Margin Offshore New Zealand. J. Geophys. Res. Solid Earth 2022, 127, e2021JB022161. [Google Scholar] [CrossRef]
  16. Segall, P.; Matthews, M. Time dependent inversion of geodetic data. J. Geophys. Res. Solid Earth 1997, 102, 22391–22409. [Google Scholar] [CrossRef]
  17. Yohler, R.; Bartlow, N.; Wallace, L.M.; Williams, C. Time-Dependent Behavior of a Near-Trench Slow-Slip Event at the Hikurangi Subduction Zone. Geochem. Geophys. Geosystems 2019, 20, 4292–4304. [Google Scholar] [CrossRef]
  18. Miyazaki, S.i.; Segall, P.; McGuire, J.J.; Kato, T.; Hatanaka, Y. Spatial and temporal evolution of stress and slip rate during the 2000 Tokai slow earthquake. J. Geophys. Res. Solid Earth 2006, 111, B03409. [Google Scholar] [CrossRef]
  19. Bartlow, N.M.; Wallace, L.M.; Beavan, R.J.; Bannister, S.; Segall, P. Time-dependent modeling of slow slip events and associated seismicity and tremor at the Hikurangi subduction zone, New Zealand. J. Geophys. Res. Solid Earth 2014, 119, 734–753. [Google Scholar] [CrossRef]
  20. Mouslopoulou, V.; Bocchini, G.M.; Cesca, S.; Saltogianni, V.; Bedford, J.; Petersen, G.; Gianniou, M.; Oncken, O. Earthquake Swarms, Slow Slip and Fault Interactions at the Western-End of the Hellenic Subduction System Precede the Mw 6.9 Zakynthos Earthquake, Greece. Geochem. Geophys. Geosystems 2020, 21, e2020GC009243. [Google Scholar] [CrossRef]
  21. Wallace, L.M.; Kaneko, Y.; Hreinsdóttir, S.; Hamling, I.; Peng, Z.; Bartlow, N.; D’Anastasio, E.; Fry, B. Large-scale dynamic triggering of shallow slow slip enhanced by overlying sedimentary wedge. Nat. Geosci. 2017, 10, 765–770. [Google Scholar] [CrossRef]
  22. Wallace, L.M.; Bartlow, N.; Hamling, I.; Fry, B. Quake clamps down on slow slip. Geophys. Res. Lett. 2014, 41, 8840–8846. [Google Scholar] [CrossRef]
  23. Eijsink, A.M.; Ikari, M.J. Plate-Rate Frictional Behavior of Sediment Inputs to the Hikurangi Subduction Margin: How Does Lithology Control Slow Slip Events? Geochem. Geophys. Geosystems 2022, 23, e2022GC010369. [Google Scholar] [CrossRef]
  24. Leah, H.; Fagereng, Å.; Bastow, I.; Bell, R.; Lane, V.; Henrys, S.; Jacobs, K.; Fry, B. The northern Hikurangi margin three-dimensional plate interface in New Zealand remains rough 100 km from the trench. Geology 2022, 50, 1256–1260. [Google Scholar] [CrossRef]
  25. Woods, K. Investigation of Hikurangi Subduction Zoneslow Slip Events Using Onshore and Offshoregeodetic Data; Victoria University of Wellington: Wellington, New Zealand, 2022. [Google Scholar]
  26. Wang, W.; Savage, M.K.; Yates, A.; Zal, H.J.; Webb, S.; Boulton, C.; Warren-Smith, E.; Madley, M.; Stern, T.; Fry, B.; et al. Temporal velocity variations in the northern Hikurangi margin and the relation to slow slip. Earth Planet. Sci. Lett. 2022, 584, 117443. [Google Scholar] [CrossRef]
  27. Williams, C.A.; Eberhart-Phillips, D.; Bannister, S.; Barker, D.H.N.; Henrys, S.; Reyners, M.; Sutherland, R. Revised Interface Geometry for the Hikurangi Subduction Zone, New Zealand. Seismol. Res. Lett. 2013, 84, 1066–1073. [Google Scholar] [CrossRef]
  28. Okuwaki, R.; Hicks, S.P.; Craig, T.J.; Fan, W.; Goes, S.; Wright, T.J.; Yagi, Y. Illuminating a Contorted Slab with a Complex Intraslab Rupture Evolution During the 2021 Mw 7.3 East Cape, New Zealand Earthquake. Geophys. Res. Lett. 2021, 48, e2021GL095117. [Google Scholar] [CrossRef]
  29. Xie, Y.; Meng, L.; Zhou, T.; Xu, L.; Bao, H.; Chu, R. The 2021 Mw 7.3 East Cape Earthquake: Triggered Rupture in Complex Faulting Revealed by Multi-Array Back-Projections. Geophys. Res. Lett. 2022, 49, e2022GL099643. [Google Scholar] [CrossRef]
  30. Li, Y.; Zhengdong, L.; Meng, L. GPS coordinate time series common mode error extraction methods. GNSS World China 2022, 47, 54–59. [Google Scholar]
  31. Wallace, L.M. Subduction zone coupling and tectonic block rotations in the North Island, New Zealand. J. Geophys. Res. 2004, 109, B12406. [Google Scholar] [CrossRef]
  32. Wallace, L.M.; Barnes, P.; Beavan, J.; Van Dissen, R.; Litchfield, N.; Mountjoy, J.; Langridge, R.; Lamarche, G.; Pondard, N. The kinematics of a transition from subduction to strike-slip: An example from the central New Zealand plate boundary. J. Geophys. Res. Solid Earth 2012, 117, B02405. [Google Scholar] [CrossRef]
  33. Wallace, L.M.; Beavan, J. Diverse slow slip behavior at the Hikurangi subduction margin, New Zealand. J. Geophys. Res. 2010, 115, B12402. [Google Scholar] [CrossRef]
  34. Thomas, A.L. Poly3D: A Three-Dimensional, Polygonal Element, Displacement Discontinuity Boundary Element Computer Program with Applications to Fractures, Faults, and Cavities in the Earth’s Crust; Stanford University: Stanford, CA, USA, 1993. [Google Scholar]
  35. Bartlow, N.M.; Miyazaki, S.i.; Bradley, A.M.; Segall, P. Space-time correlation of slip and tremor during the 2009 Cascadia slow slip event. Geophys. Res. Lett. 2011, 38, L18309. [Google Scholar] [CrossRef]
  36. Ducellier, A.; Creager, K.C.; Schmidt, D.A. Detection of slow slip events using wavelet analysis of GNSS recordings. Geophysics 2022, 112, 2408–2424. [Google Scholar] [CrossRef]
  37. Jacobs, K.M.; Savage, M.K.; Smith, E.C.G. Quantifying seismicity associated with slow slip events in the Hikurangi margin, New Zealand. N. Z. J. Geol. Geophys. 2016, 59, 58–69. [Google Scholar] [CrossRef]
  38. Delahaye, E.J.; Townend, J.; Reyners, M.E.; Rogers, G. Microseismicity but no tremor accompanying slow slip in the Hikurangi subduction zone, New Zealand. Earth Planet. Sci. Lett. 2009, 277, 21–28. [Google Scholar] [CrossRef]
  39. Fukuda, J.i.; Kato, A.; Obara, K.; Miura, S.; Kato, T. Imaging of the early acceleration phase of the 2013-2014 Boso slow slip event. Geophys. Res. Lett. 2014, 41, 7493–7500. [Google Scholar] [CrossRef]
  40. Kano, M.; Fukuda, J.i.; Miyazaki, S.i.; Nakamura, M. Spatiotemporal Evolution of Recurrent Slow Slip Events Along the Southern Ryukyu Subduction Zone, Japan, From 2010 to 2013. J. Geophys. Res. Solid Earth 2018, 123, 7090–7107. [Google Scholar] [CrossRef]
  41. Liu, Y.; Rice, J.R.; Larson, K.M. Seismicity variations associated with aseismic transients in Guerrero, Mexico, 1995–2006. Earth Planet. Sci. Lett. 2007, 262, 493–504. [Google Scholar] [CrossRef]
  42. Wallace, L.M.; Hreinsdóttir, S.; Ellis, S.; Hamling, I.; D’Anastasio, E.; Denys, P. Triggered Slow Slip and Afterslip on the Southern Hikurangi Subduction Zone Following the Kaikōura Earthquake. Geophys. Res. Lett. 2018, 45, 4710–4718. [Google Scholar] [CrossRef]
  43. Ozawa, S.; Kawabata, R.; Kokado, K.; Yarai, H. Long-term slow slip events along the Nankai trough delayed by the 2016 Kumamoto earthquake, Japan. Earth Planets Space 2020, 72, 61. [Google Scholar] [CrossRef]
  44. Ozawa, S.; Yarai, H.; Kobayashi, T. Recovery of the recurrence interval of Boso slow slip events in Japan. Earth Planets Space 2019, 71, 78. [Google Scholar] [CrossRef]
  45. Obara, K.; Kato, A. Connecting slow earthquakes to huge earthquakes. Science 2016, 353, 253–257. [Google Scholar] [CrossRef] [PubMed]
  46. Koulali, A.; McClusky, S.; Wallace, L.; Allgeyer, S.; Tregoning, P.; D’Anastasio, E.; Benavente, R. Slow slip events and the 2016 Te AraroaMw7.1 earthquake interaction: Northern Hikurangi subduction, New Zealand. Geophys. Res. Lett. 2017, 44, 8336–8344. [Google Scholar] [CrossRef]
  47. Radiguet, M.; Perfettini, H.; Cotte, N.; Gualandi, A.; Valette, B.; Kostoglodov, V.; Lhomme, T.; Walpersdorf, A.; Cabral Cano, E.; Campillo, M. Triggering of the 2014 Mw7.3 Papanoa earthquake by a slow slip event in Guerrero, Mexico. Nat. Geosci. 2016, 9, 829–833. [Google Scholar] [CrossRef]
  48. Chen, S.K.; Wu, Y.M.; Chan, Y.C. Episodic Slow Slip Events and Overlying Plate Seismicity at the Southernmost Ryukyu Trench. Geophys. Res. Lett. 2018, 45, 10369–10377. [Google Scholar] [CrossRef]
  49. Nishikawa, T.; Nishimura, T.; Okada, Y. Earthquake Swarm Detection Along the Hikurangi Trench, New Zealand: Insights into the Relationship Between Seismicity and Slow Slip Events. J. Geophys. Res. Solid Earth 2021, 126, e2020JB020618. [Google Scholar] [CrossRef]
  50. Barnes, P.M.; Wallace, L.M.; Saffer, D.M.; Bell, R.E.; Underwood, M.B.; Fagereng, A.; Meneghini, F.; Savage, H.M.; Rabinowitz, H.S.; Morgan, J.K.; et al. Slow slip source characterized by lithological and geometric heterogeneity. Sci. Adv. 2020, 6, eaay3314. [Google Scholar] [CrossRef]
  51. Shreedharan, S.; Ikari, M.; Wood, C.; Saffer, D.; Wallace, L.; Marone, C. Frictional and Lithological Controls on Shallow Slow Slip at the Northern Hikurangi Margin. Geochem. Geophys. Geosystems 2022, 23, e2021GC010107. [Google Scholar] [CrossRef]
  52. Yarce, J.; Sheehan, A.F.; Nakai, J.S.; Schwartz, S.Y.; Mochizuki, K.; Savage, M.K.; Wallace, L.M.; Henrys, S.A.; Webb, S.C.; Ito, Y.; et al. Seismicity at the Northern Hikurangi Margin, New Zealand, and Investigation of the Potential Spatial and Temporal Relationships with a Shallow Slow Slip Event. J. Geophys. Res. Solid Earth 2019, 124, 4751–4766. [Google Scholar] [CrossRef]
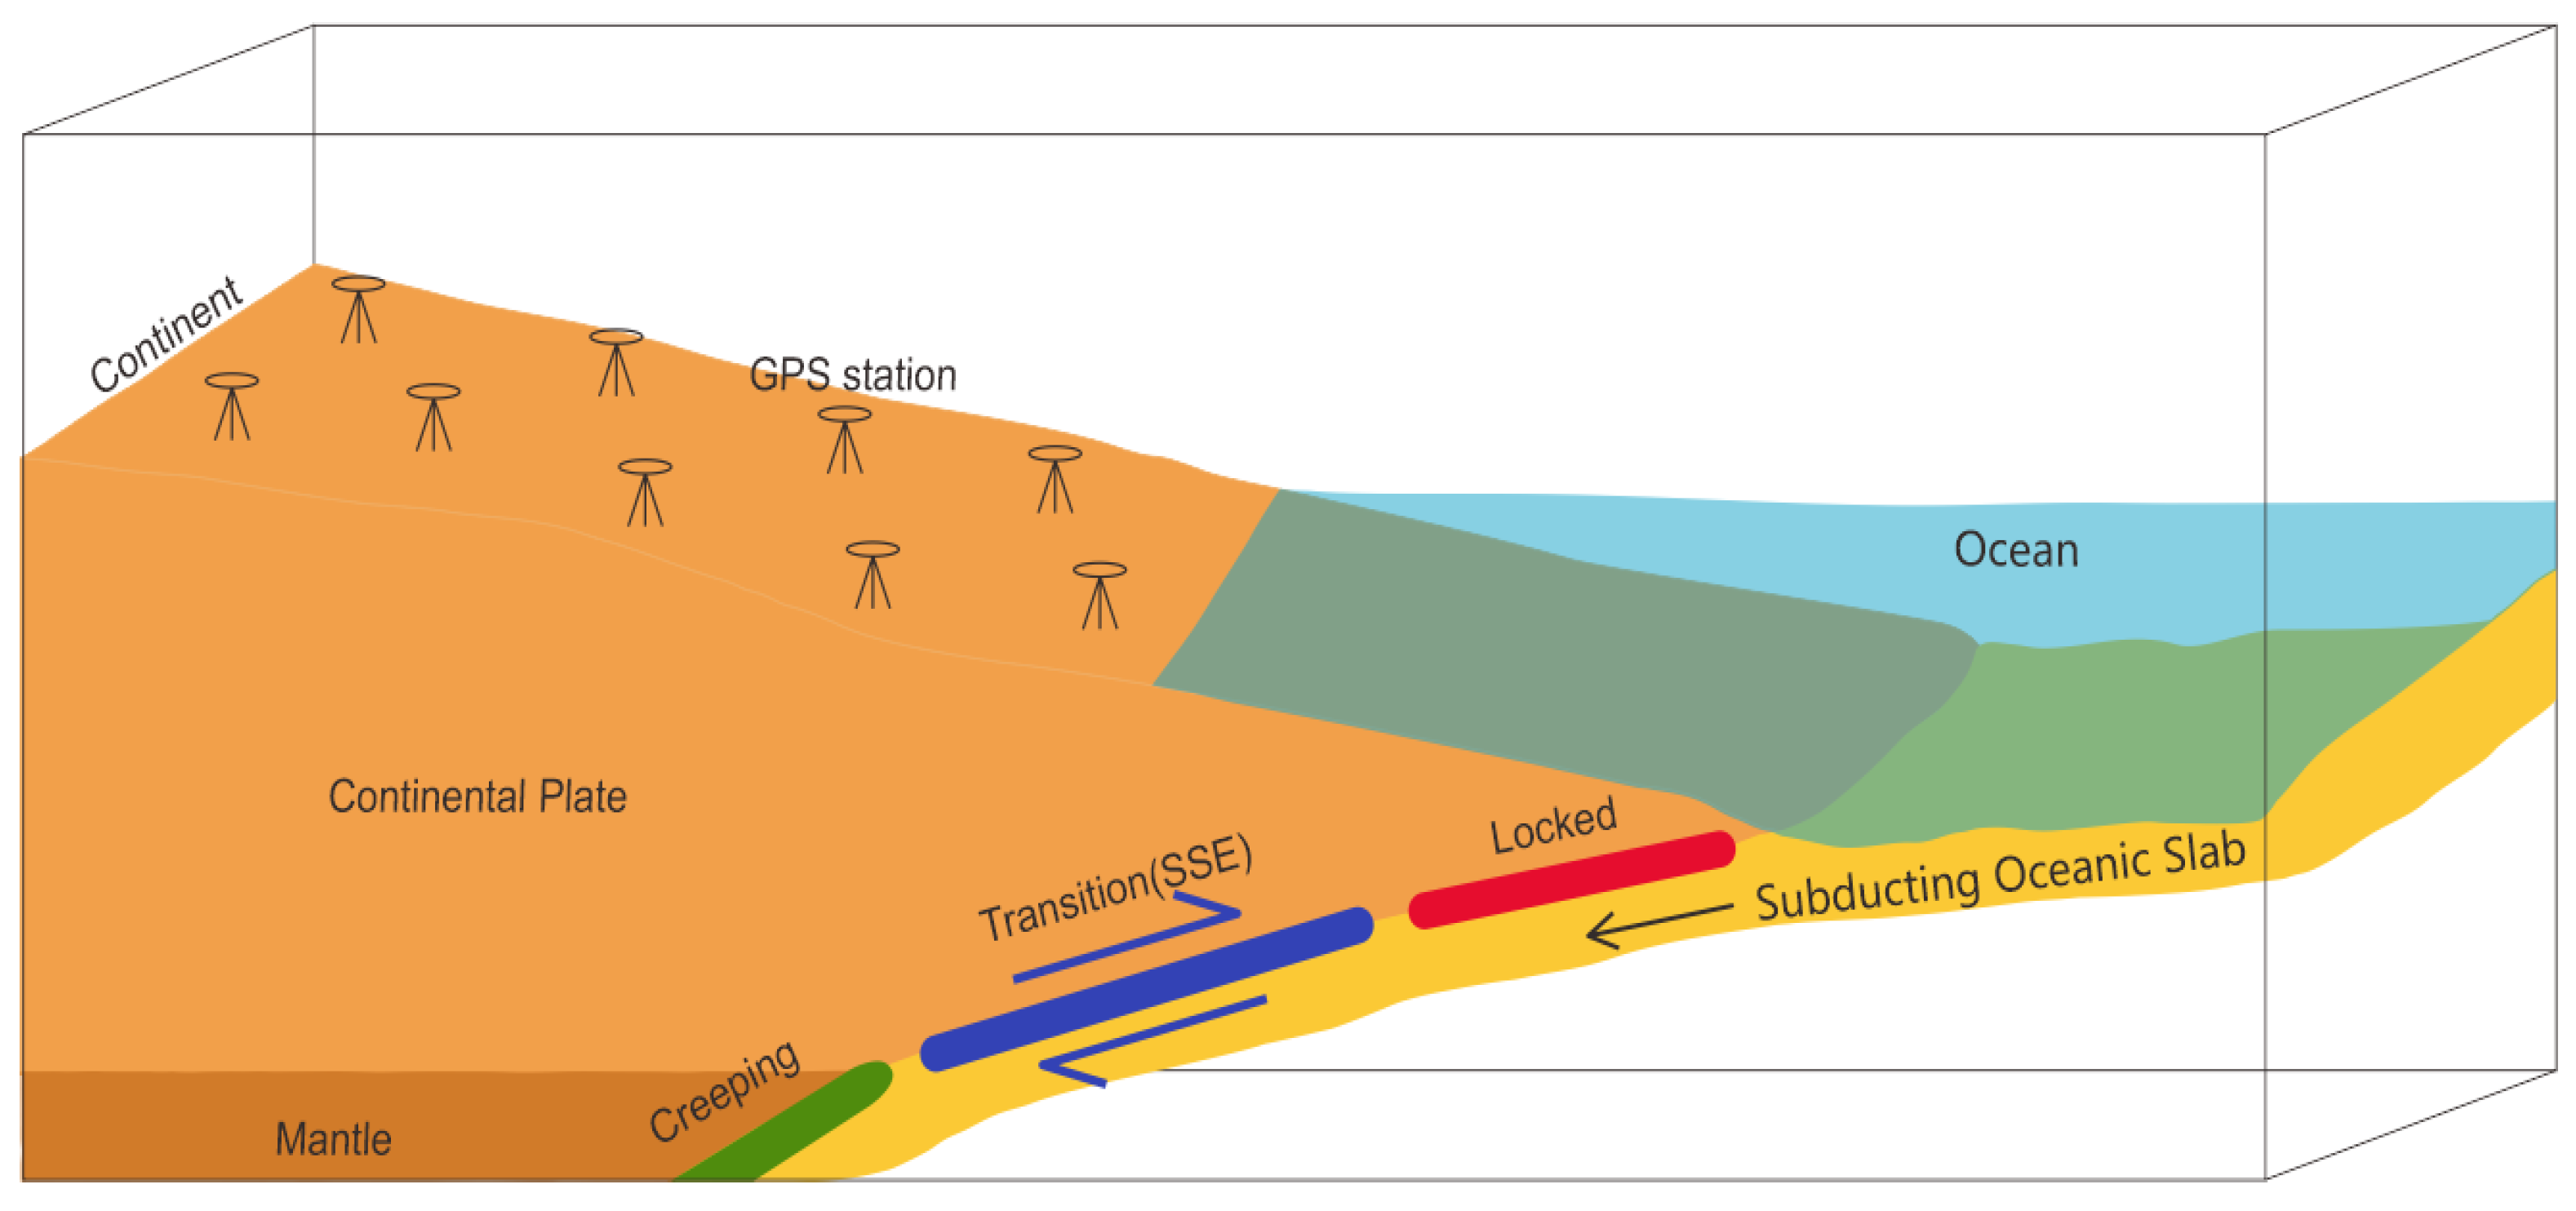
Figure 1. Schematic diagram of the SSE observed by GPS stations, which determines the horizontal (lateral) and vertical (subsidence) motion of their region.
Remotesensing 15 04767 g001
Figure 2. (a) A tectonic map of New Zealand indicating the location of the plate boundary between the Pacific and Australian plates. (b) The red rectangular area within Figure (a) highlights the tectonic environment along the eastern coast of the North Island. Black triangles represent 40 GPS stations distributed along the eastern coast, with the red triangles representing the stations displayed in subsequent figures. The white dashed lines indicate the contour depths of the plate interface, following the plate geometry proposed by Williams et al. [27]. The two bold white dashed lines mark the boundaries of the Hikurangi Subduction Zone in the northern, central, and southern sections. White arrows in (b) depict the relative motion between the Pacific and Australian plates. (c) Cross-sections of the central and northern regions of the Hikurangi Subduction Zone display the areas of slow slip along the subducting plate interface and the stable creeping regions.
Remotesensing 15 04767 g002
Figure 3. The procedure of extracting SSEs signals from GPS coordinate time series in the Hikurangi Subduction Zone. In subfigure (a), the dark dashed vertical lines represent the steps (The steps master file can be found at http://geodesy.unr.edu/NGLStationPages/steps.txt (accessed on 12 September 2023)). The red error bars indicate outliers and their uncertainties exceeding five times the mean error, which are discarded as outliers. The blue dots represent the GPS coordinate time series after step restoration and outlier removal. In subfigure (b), the red diagonal line illustrates the constant and velocity terms in the GPS coordinate time series model, with the blue dots showing the coordinate time series after removing these two terms. In subfigure (c), the blue dots represent the time series of slow slip displacements, and eight different colors of dashed lines are used to mark the eight SSEs.
Remotesensing 15 04767 g003
Figure 4. The fault grid of the Hikurangi Subduction Zone. The colored surface represents the fault grid surface, with colors indicating depth. The black arrow labeled ‘N’ indicates the north direction. Another black arrow denotes the movement direction of the Pacific Plate relative to the Australian Plate. The black jagged line represents the Hikurangi trough. The three red dots roughly correspond to the three regions where SSEs occur: Tolaga Bay, Gisborne, and Hawke’s Bay.
Remotesensing 15 04767 g004
Figure 5. Surface displacements of SSEs using the NIF method using GISB, AHTI, and MAKO stations as an example (the blue dots represent the extracted time series of slow slip displacements from GPS, the solid red line represents the displacement time series obtained from the inversion using the NIF method. Eight different colors of dashed lines are used to mark the eight SSEs).
Remotesensing 15 04767 g005
Figure 6. Surface horizontal displacements of the eight SSEs: GPS vs. NIF estimations.
Remotesensing 15 04767 g006
Figure 7. Cumulative Slip of the investigated eight SSEs.
Remotesensing 15 04767 g007
Figure 8. The slip rate of SSE1 in 2019.
Remotesensing 15 04767 g008
Figure 9. The slip rate of SSE2 in 2020.
Remotesensing 15 04767 g009
Figure 10. The slip rate of SSE3 in 2020.
Remotesensing 15 04767 g010
Figure 11. The slip rate of SSE4 in 2020.
Remotesensing 15 04767 g011
Figure 12. The slip rate of SSE5 in 2021.
Remotesensing 15 04767 g012
Figure 13. The slip rate of SSE6 in 2021.
Remotesensing 15 04767 g013
Figure 14. The slip rate of SSE7 in 2021.
Remotesensing 15 04767 g014
Figure 15. The slip rate of SSE8 in 2022.
Remotesensing 15 04767 g015
Figure 16. Distribution of the seismic activities in the eastern coastal region (ECR) of the North Island, New Zealand. In (a), the gray rectangular box represents the ECR, which is the area for seismic activity statistics. The main slip regions (MSR) of the eight SSEs are indicated within the red dashed lines. The blue, green, and yellow dots represent the seismic activities corresponding to before, during, and after the occurrences of the eight SSEs, and the size of the dots indicates the magnitude of the seismic activity.
Remotesensing 15 04767 g016
Figure 17. The daily frequency of seismic activities corresponding to before, during, and after the occurrences of the eight SSEs in the ECR and MSR.
Remotesensing 15 04767 g017
Table 1. Summary of the eight SSEs for the period 2019–2022.
YearEventMain Slip RegionStart and End TimeMaximum Surface DisplacementCumulative SlipMaximum Daily Slip Rate
(Duration/Day)(cm)(cm)(mm/Day)
2019SSE1Gisborne-Hawke’s Bay77~134 (58 days)4.9714.358.69
2020SSE2Tolaga Bay18~49 (32 days)0.842.932.30
SSE3Gisborne-Hawke’s Bay190~233 (44 days)1.333.371.98
SSE4Tolaga Bay232~253 (22 days)0.872.391.83
2021SSE5Hawke’s Bay27~74 (48 days)0.884.121.89
SSE6South of Hawke’s Bay132~159 (28 days)1.275.655.05
SSE7Gisborne156~189 (34 days)2.537.204.61
2022SSE8Gisborne-Hawke’s Bay170~201 (32 days)1.924.871.86
Disclaimer/Publisher’s Note: The statements, opinions and data contained in all publications are solely those of the individual author(s) and contributor(s) and not of MDPI and/or the editor(s). MDPI and/or the editor(s) disclaim responsibility for any injury to people or property resulting from any ideas, methods, instructions or products referred to in the content.