Article

Evaluating the Performance of the Greenbelt Policy in Beijing Using Multi-Source Long-Term Satellite Observations from 2000 to 2020

1
School of Public Administration and Policy, Renmin University of China, Beijing 100872, China
2
Digital Government and National Government Lab, Renmin University of China, Beijing 100872, China
3
Natural Resources Bureau of Zhangqiu District, Jinan 250200, China
*
Author to whom correspondence should be addressed.
Remote Sens. 2023, 15(19), 4766; https://doi.org/10.3390/rs15194766
Submission received: 21 August 2023 / Revised: 6 September 2023 / Accepted: 21 September 2023 / Published: 29 September 2023

Abstract

:
Beijing is among the first cities in China to implement a greenbelt policy to improve urban vegetation, which plays a crucial role in enhancing the urban ecological environment. The policies have shown remarkable results. However, long-term evaluation of the performance of the greenbelt policies in Beijing has not been carried out in order to quantitatively evaluate their effectiveness. In this study, long-term satellite observations of the normalized difference vegetation index (NDVI), land surface temperature, precipitation, and night-light from 2000 to 2020 are used to investigate the spatio-temporal variabilities in NDVI and explore the mechanisms of the impacts of the greenbelt policies in Beijing. The main results are as follows: (1) From 2000 to 2020, the overall NDVI in Beijing exhibited an upward trend, with the proportion of high-NDVI (>0.8) areas increasing from 26.18% in 2000 to 53.64% in 2020. The proportion of low-NDVI (<0.2) areas continued to decrease from 0.64% in 2000 to 0.2% in 2020. (2) The 1st Greenbelt Zone shows a significant increase in its NDVI (with an average increase of 0.296 units in the NDVI at district level), indicating that the policy’s implementation had a notable effect, while the 2nd Greenbelt Zone was mainly in a degraded state and a declining trend, indicating that its performance fell short of expectations. (3) During the preparation for the 2008 Summer Olympics, while the 1st Greenbelt Zone had a slightly negative effect on NDVI improvement, probably due to urban re-construction, the 2nd Greenbelt Zone showed a significant positive effect, leading to an increase of 0.013 units in the NDVI at district level. In addition, the correlation analysis shows that an increase in annual average land surface temperature leads to a decrease in the NDVI, while annual precipitation has a positive relationship with NDVI changes. This study highlights the importance of long-term satellite observations in evaluating the performance of greenbelt policies in Beijing. The evaluation approach developed in this study can be readily applied to similar cities globally.

Graphical Abstract

1. Introduction

Urban vegetation, as an essential component of the urban ecosystem, plays a crucial role in improving the ecological environment and enhancing urban greenery [1]. Vegetation not only effectively reduces airborne dust transmission and soil erosion, but also plays a key role in carbon sequestration, air quality improvement, and microclimate regulation [2,3,4,5]. Additionally, it contributes to the enhancement of urban residents’ mental well-being, reduces life stress, and holds significant social, cultural, and recreational value [6,7]. With the increasing importance of vegetation in urban areas, it becomes particularly crucial to explore the temporal and spatial variation trends of urban vegetation and the factors influencing these changes.
Beijing is among the first cities in China to implement a greenbelt policy. The 1st Greenbelt Policy was introduced in 1994 to support the Beijing Master Plan of 1991, and the 2nd Greenbelt Policy was introduced in 2003 to support the Beijing Master Plan of 2004–2020 [8]. Over the past three decades, the efforts to improve vegetation coverage in Beijing have shown remarkable results. Beijing’s greenbelt policies have been shown to increase vegetation cover of urban and sub-urban lands, preserve urban green spaces, and protect water bodies and forests [9]. Unfortunately, since the 2000s, new urban development plans and rapid urban sprawl have significantly reduced some of the benefits from the greenbelt policies. Several previous studies have been conducted to investigate the various factors, including climate and human-related activities, that contribute to the inter-annual changes in vegetation coverage in Beijing (e.g., [10,11]). Specifically, Cao et al. [10] quantified the contributions of human activities and climate change to greening in the Beijing–Tianjin–Hebei Region in China and found that climate change had a stronger influence on vegetation coverage than human activities. Zhang et al. [11] characterized the response of vegetation phenology to urbanization using quantitative indicators and found a distinct divergent response of vegetation phenology to urbanization associated with human-related activities. Xie et al. [12] generated the annual land cover maps of Beijing from 2001 to 2020 using Landsat data and investigated the land cover dynamics of Beijing. Huang et al. [13] used annual NDVI time-series from Landsat to detect the land cover dynamics in Beijing in 2015 by classifying the land cover in the city. However, long-term evaluation of the performance of the greenbelt policies has not been carried out in order to evaluate their effectiveness in improving the urban greenery in Beijing.
Satellite observations have been a critical data source for urban vegetation monitoring. The normalized difference vegetation index (NDVI), which is closely related to vegetation coverage, photosynthetic capacity, and biomass, has been widely used to assess vegetation dynamics [1]. The maximum value composition method, first proposed by Holben [14], is commonly employed to reconstruct the NDVI composites used for scientific analysis, which helps eliminate the interference of factors such as clouds [14,15,16]. The variation of the NDVI is influenced by various factors related to the climate and human activities. The impact of climate change primarily manifests in temperature and precipitation, and previous studies have demonstrated the significant influence of temperature and precipitation on NDVI changes [17,18,19]. As population density quickly increases, human activities have become an important factor when studying the influence on the NDVI [1]. Policy-related driving factors such as large-scale ecological construction projects, the implementation of green policies, population density, and economic development levels are also closely related to NDVI changes [9,20,21,22,23].
Identifying the factors influencing the NDVI helps reveal the driving mechanisms of vegetation dynamics [24] and provides valuable insights for future greening management. In this study, we aim to conduct a long-term evaluation of the performance of the 1st and 2nd Greenbelt Policies in Beijing to quantify their effectiveness on improving the urban greenery. The contributions of the greening policies and related driving factors, including climatic variables and human activities, are assessed from multi-source long-term remote sensing datasets by incorporating them into a regression model.
The article is organized as follows: The introduction to the data and methods used in this study is given in Section 2. The results on the spatio-temporal variabilities of the NDVI in Beijing over the past two decades and the quantitative evaluation of the greenbelt policies are presented in Section 3. The discussions on the impact of greening policies on the long-term changes of vegetation in Beijing is in Section 4, followed by conclusions in Section 5.

2. Materials and Methods
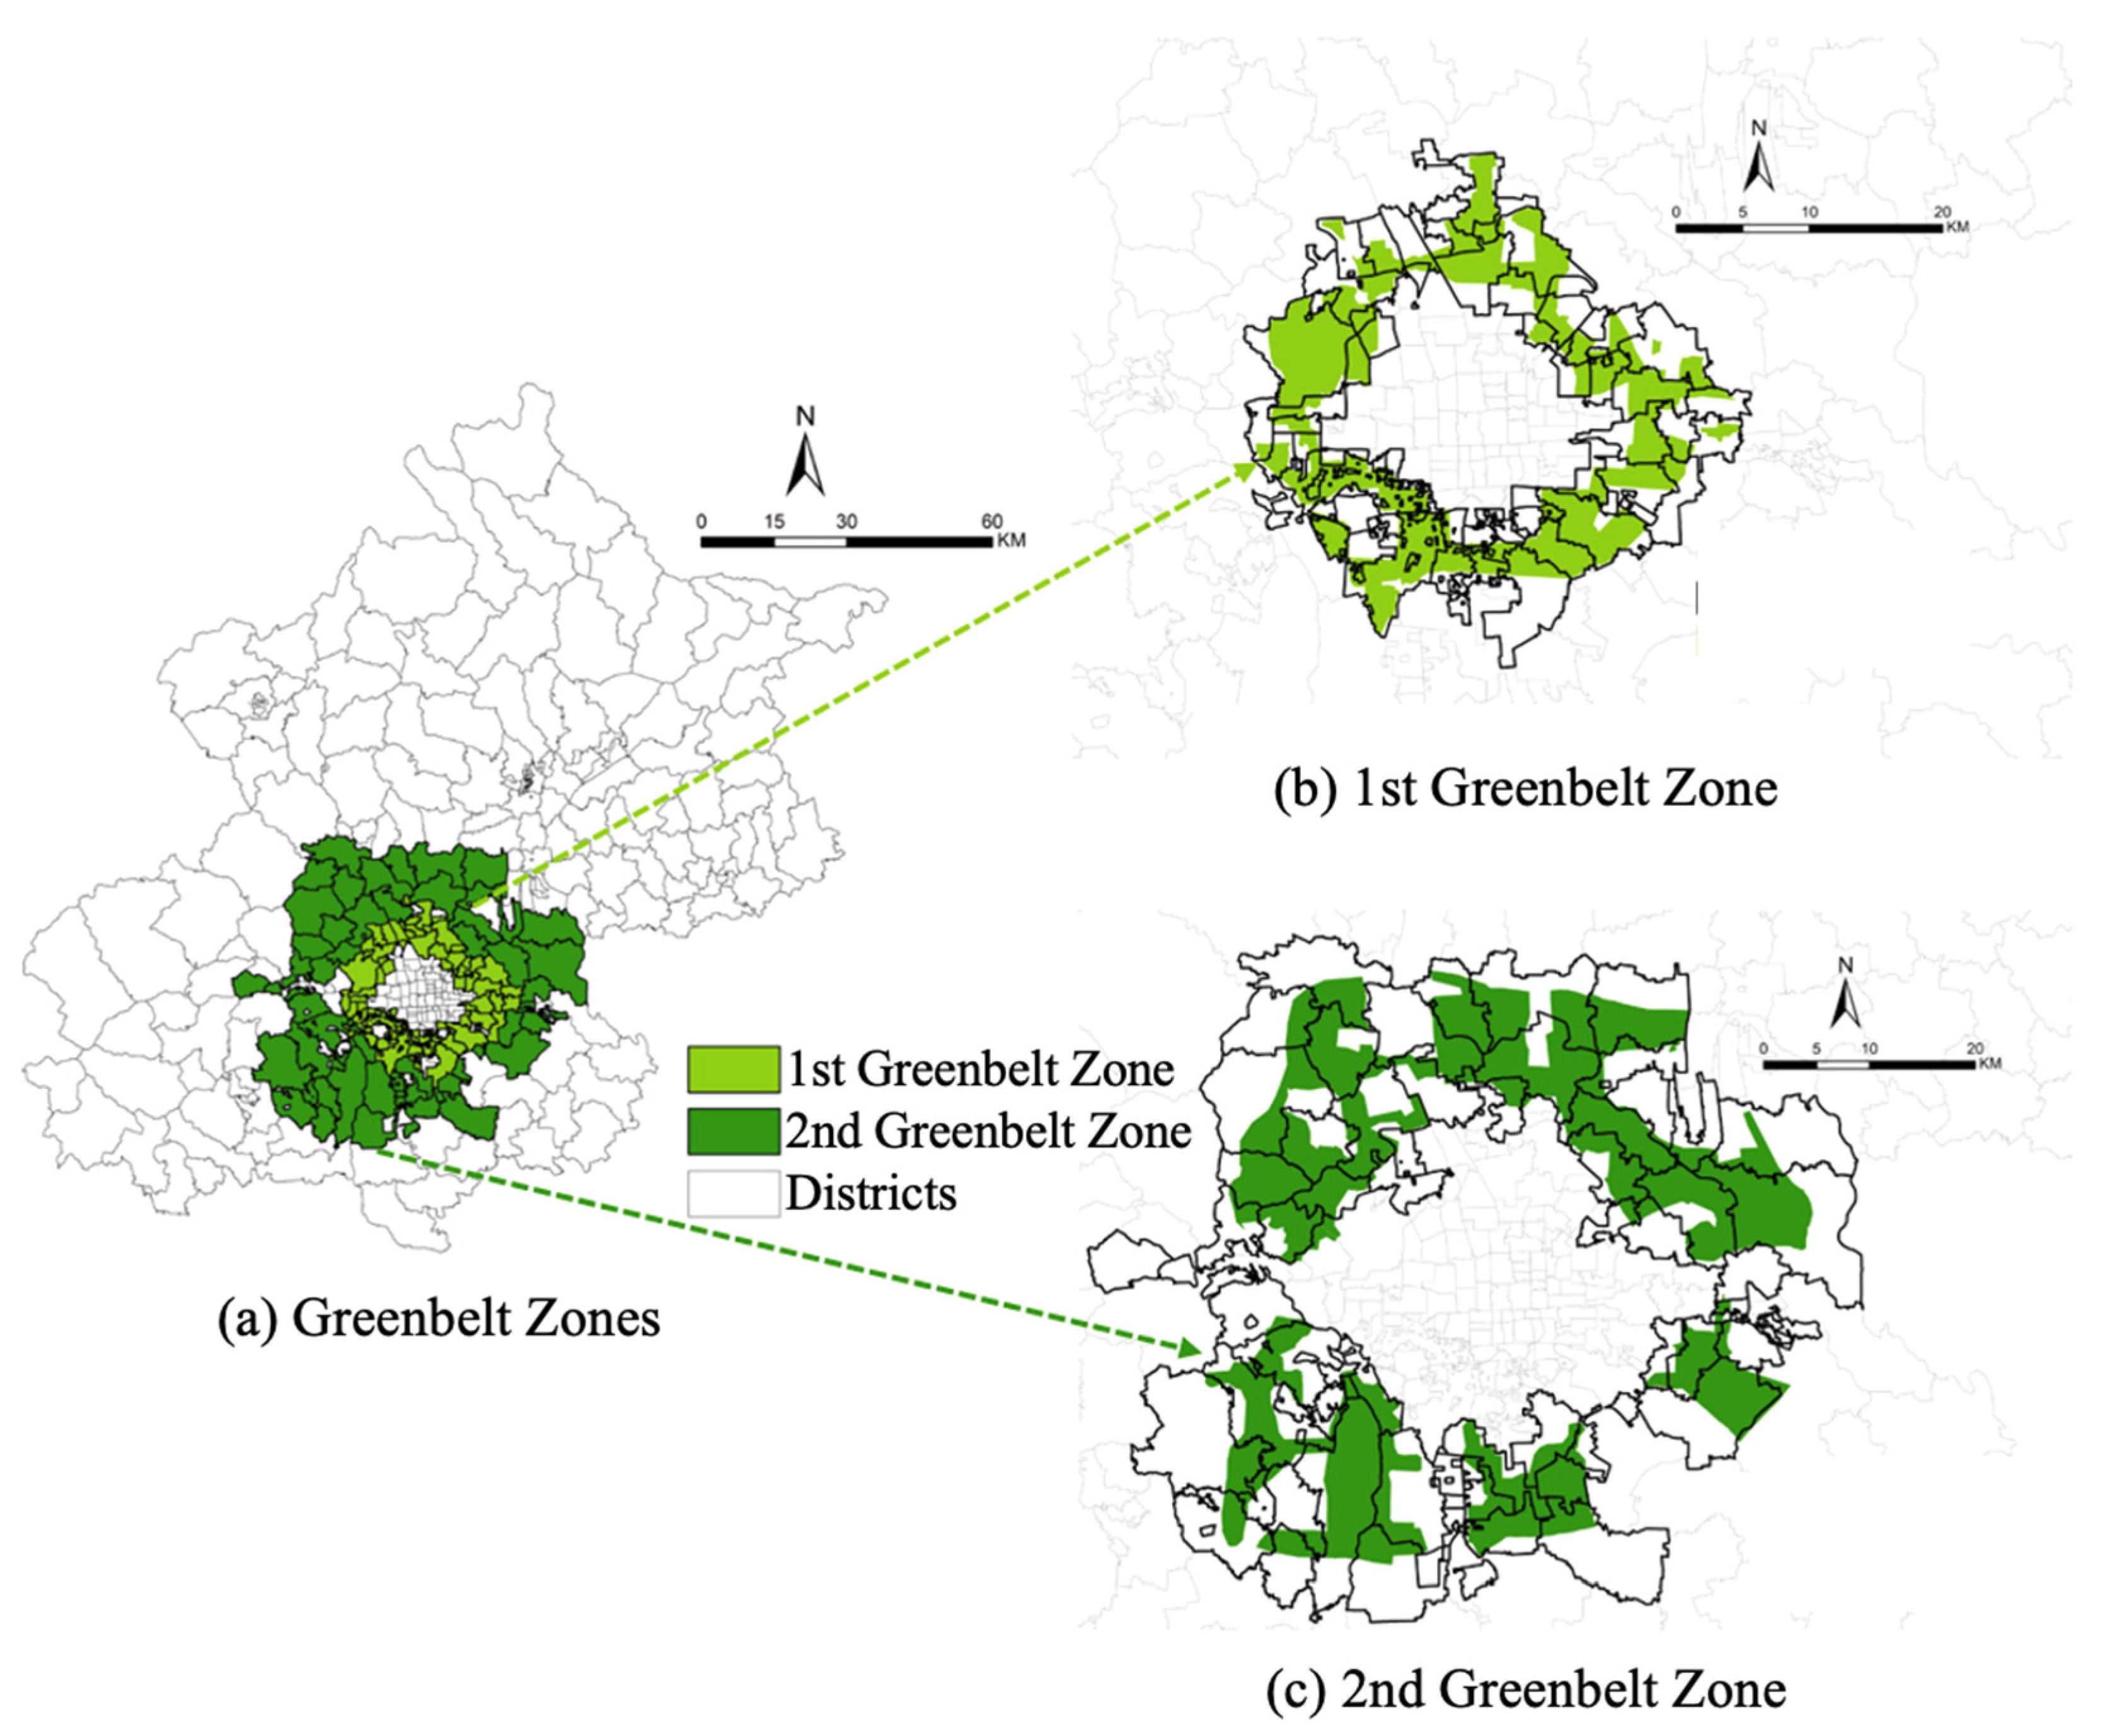
2.1. Study Area

Beijing (Figure 1a) is located in the northern region of China and serves as the capital of the People’s Republic of China. It covers a total area of 16,410 square kilometers and lies in the northern part of the North China Plain. The total population in Beijing has increased from about 13.8 million in 2000 to 21.9 million in 2020. The climate in Beijing is classified as a warm-temperate, semi-humid, and semi-arid monsoon climate. It is characterized by hot and humid summers, cold and dry winters, with an annual rainfall of less than 600 mm, and an average annual temperature between 11 °C and 12 °C. The terrain in Beijing is diverse, with mountainous regions predominantly found in the northwest, accounting for about 62% of the total area of the city. Plains are concentrated in the southeast, comprising approximately 38% of Beijing’s total area.
The greenbelt policy in Beijing has been implemented for almost 30 years and has evolved into two phases, forming the current greenbelt landscape. The pilot policy of the 1st Greenbelt Policy can be traced back to 1994 [25]. In 2000, the publication of [26] marked the comprehensive and large-scale construction of the first phase of the greenbelt areas, as shown in Figure 1b. In 2003, the issuance of Beijing Municipal Government document [27] explicitly signaled the official start of construction of the second phase of greenbelt areas (the 2nd Greenbelt Policy), as shown in Figure 1c. The 1st Greenbelt Zone includes 240 km2 of green areas around the 4th Ring Road, while the 2nd Greenbelt Zone includes 1650 km2 of green areas between the 5th and 6th Ring Roads.

2.2. Datasets

To quantify the spatio-temporal variabilities of vegetation in Beijing and understand their driving mechanisms, long-term satellite observations of NDVI, land surface temperature, precipitation, and night-lights are collected. The details are introduced below.

2.2.1. NDVI Data from MODIS

The NDVI dataset selected in this study is derived from the MOD13Q1.006 product provided by MODIS onboard the Terra satellite managed by the National Aeronautics and Space Administration (NASA). This dataset in its 6th version has a spatial resolution of 250 m and a temporal resolution of 16 days. The NDVI values range from −0.2 to 1 in Beijing, and the time coverage extends from February 2000 to May 2022. The MODIS NDVI is derived based on atmospherically corrected bidirectional surface reflectance and undergoes preprocessing such as geometric correction and radiometric calibration to ensure high accuracy. Although other long-term NDVI datasets, such as Landsat and AVHRR, are also available, we adopted MODIS in this study because of its high accuracy and long-term stability. The high temporal and spatial resolutions of MODIS NDVI make the dataset widely applied in quantitative studies of urban vegetation dynamics (e.g., [28,29]). We used the maximum value composition method to derive the monthly maps of NDVI, and then construct the annual NDVI maps from 2000 to 2020. It has been shown that the maximum value composition method can remove the effect of clouds to some extent, in order to reflect the underlying variabilities of vegetation growth, as suggested by Viovy et al. [30].

2.2.2. Land Surface Temperature Data from MODIS

The land surface temperature dataset is sourced from NASA’s released MOD11A1.061 product, which provides global daily land surface temperature observations. The data have a spatial resolution of 1000 m. The temporal coverage extends from February 24 of 2000 to the present. It has been indicated that the annual average temperature is an important influencing factor that drives the NDVI changes of vegetation [31,32]. Therefore, this study derives the annual mean land surface temperature raster map for the Beijing City area. It is important to note that the MOD11A1.061 product provides both daytime and nighttime land surface temperature values for the study region. Hence, when generating the final output, the daytime and nighttime temperatures are summed and averaged.

2.2.3. Precipitation Dataset

The precipitation dataset is obtained from the Climate Hazards Center InfraRed Precipitation with Station data (CHIRPS) product from the University of California, Santa Barbara, that provides global daily rainfall estimates from rain gauge and satellite observations [33]. The CHIRPS precipitation dataset is used because of its long record (from 1981 to 2022) and high spatial and temporal resolutions. The dataset is generated by combining global climatology, satellite estimates, and in situ observations. CHIRPS precipitation production has been extensively evaluated and shows satisfactory performance [34,35]. The CHIRPS Daily product provides global daily precipitation data (in unit of mm), with a spatial resolution of about 5.5 km. The valid data period spans from 1981 to 2022. In this study, annual precipitation is considered an influential factor in analyzing vegetation NDVI changes, and we employ the sum to aggregate the yearly precipitation raster maps for the study area in Beijing.

2.2.4. Night-Light Composite Dataset

Nighttime light remote sensing has become an increasingly important indicator for reflecting human activities, including social and economic aspects as well as energy consumption. In this study, we used the Prolonged Artificial Nighttime-light Dataset of China (PANDA) which provides long-term night-light composite datasets from 1984 to 2020 with a high spatial resolution of 100 m [36]. PANDA was generated using deep learning based on night-light remote sensing observations from the Defense Meteorological Satellite Program (DMSP) and the Visible Infrared Imaging Radiometer Suite (VIIRS). Accuracy assessment shows that the composite data and original images show a high correlation (with a coefficient of determination of 0.95), indicating a high confidence level of the data quality of the composite product, as suggested by Zhang et al. [36]. It has been shown that the PANDA nighttime light data in this study not only effectively capture the temporal trends of newly developed areas but also exhibit correlations with socioeconomic indicators, including built-up areas, gross domestic product index, and population density.

2.2.5. Population Density Data

The population density data are sourced from the WorldPop center [37], which aims to provide open and researched spatial population data and construct high-resolution geographic spatial data regarding population distribution and dynamic changes. The data chosen for this study are adjusted based on population estimates from the “2019 Revision of World Population Prospects” published by the United Nations Department of Economic and Social Affairs, Population Division. The spatial resolution is 1000 m, with population count per pixel as the unit. The time range is from 2000 to 2020 (one map per year). We obtain the yearly population count maps in the study area at a 1000 m resolution for 20 years from 2000 to 2020.
The above-mentioned datasets are summarized in Table 1. Finally, we have resampled the data (NDVI, precipitation, and night-light index) that have different spatial resolutions into a 1 km by 1 km grid using ArcGIS 10.8 software and unified the input data’s spatial resolution.

2.3. Methods

2.3.1. MODIS Estimate of Long-Term Trends of NDVI Using Linear Regression Analysis

In this study, the method of univariate linear regression was employed to analyze the temporal trends of NDVI in Beijing, thereby reflecting the spatial distribution characteristics of NDVI’s temporal variabilities. When the slope of the regression line is greater than 0, it indicates an improvement in NDVI values at the specific location. Conversely, when the slope is less than 0, it indicates a degradation in NDVI values at the specific location.

2.3.2. Evaluating the Greenbelt Policies Using Fixed Effects Regression

(1)
Fixed effects regression
Regression analysis is an important statistical method widely used to explore the influencing factors and correlations among variables in socio-economic phenomena. To quantify the causal relationship between the greenbelt policies implemented over the past two decades and the vegetation changes in Beijing, we adopted the fixed effects regression model [38,39]. The fixed effects model has an advantage over ordinary regression in that it allows for the fixation of samples along both individual and time dimensions, addressing the issue of omitted variables that do not vary over time but vary across individuals, as well as those that do not vary across individuals but change over time. This improves the accuracy of model coefficient estimation [40].
(2)
Variable Selection
In the fixed effects regression model, to evaluate the effects of the 1st and 2nd Greenbelt Policies on the spatio-temporal NDVI changes in Beijing, associated variables that are relevant are constructed for the quantitative evaluation using regression analysis. Since the district is the specific unit where the greenbelt policies are implemented, the data in this study are analyzed at the district level. Comprehensive, large-scale implementation of the 1st Greenbelt Policy began in 2000. Therefore, the 49 districts involved in the policy implementation from 2000 to 2020 are assigned a value of 1, while the remaining districts are assigned a value of 0, creating the variable for the 1st Greenbelt Policy. Similarly, for the 2nd Greenbelt Policy, the 55 districts in the areas where the policy was implemented from 2004 to 2020 are assigned a value of 1, while the remaining districts are assigned a value of 0, creating the variable for the 2nd Greenbelt Policy. Figure 1 shows the areas where the 1st and 2nd Greenbelt Policies were implemented at the district level.
At the same time, the preparation for the 2008 Summer Olympics had a significant impact on Beijing’s greening construction. To fulfill the greening targets submitted to the International Olympic Committee, the Beijing Municipal Government implemented a series of measures to promote ecological restoration and green construction [41]. The districts that were already established throughout the city from 2001, when Beijing won the bid for the Olympics, to 2008, when the Olympics were hosted, were assigned a value of 1, while districts that were established in other years were assigned a value of 0, resulting in the variable for the Summer Olympics. The summary of variables is shown in Table 2.

3. Spatio-Temporal Changes in Vegetation in Beijing over the Past 20 Years

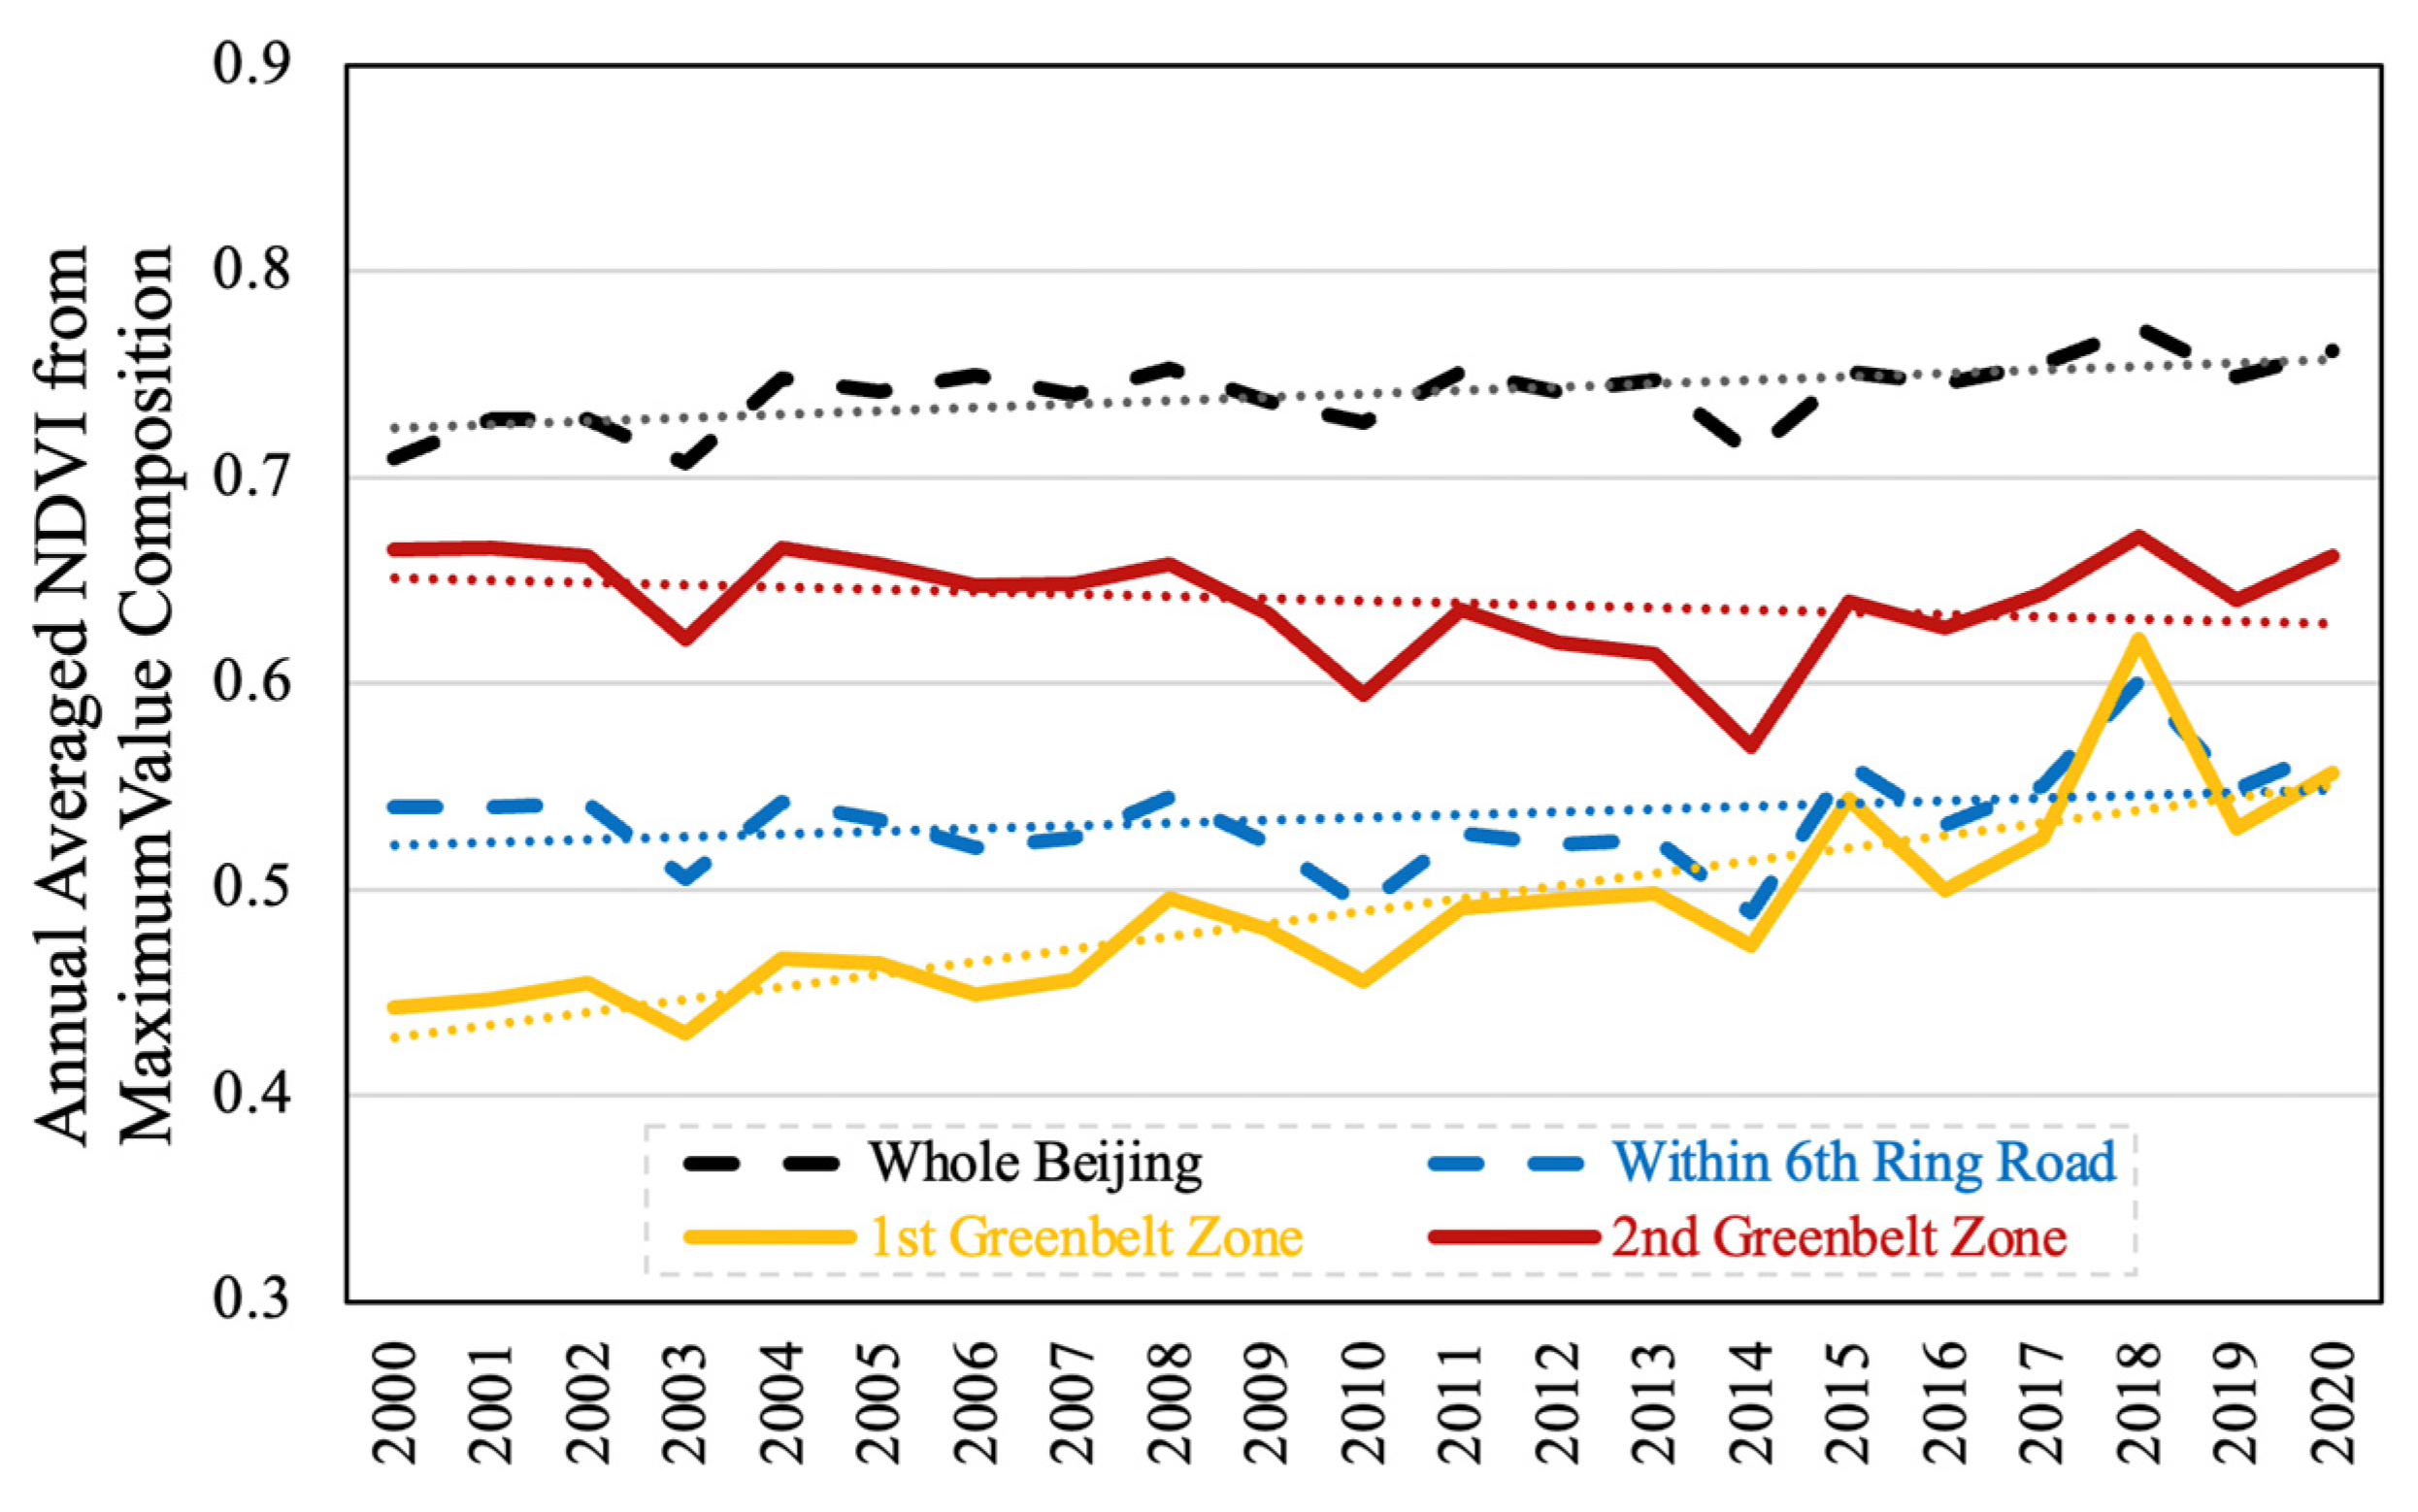
3.1. Interannual NDVI Variations

The annual NDVI data for Beijing were processed to obtain the average NDVI changes in different regions over the past 20 years, as shown in Figure 2. Overall, the overall Beijing region has exhibited an improving trend in its NDVI from 2000 to 2020, with the most noticeable improvements observed during the periods of 2000–2008 and 2014–2020. This result agrees with Tu et al. [41], who demonstrated that the preparation for the 2008 Summer Olympics had a positive impact on vegetation recovery in Beijing. During this period, the government made targeted investments in green resources to improve the vegetation conditions and meet international environmental standards for hosting sporting events. As a result, the NDVI of Beijing showed an increasing trend from 2000 to 2008 (for the 2008 Summer Olympics) and from 2014 to 2020 (for the 2022 Winter Olympics). Additionally, the implementation of projects such as the control of sand sources between Beijing and Tianjin and afforestation of millions of acres has accelerated the improvement of vegetation growth and the expansion of vegetated areas in Beijing [42].
From a spatial distribution perspective, the averaged NDVI values for the entire area of Beijing, the 2nd Greenbelt Zone, the area within the 6th Ring Road, and the 1st Greenbelt Zone reduced successively, as shown in Figure 2. This may be due to the varying proportions of urbanization within different regions. For instance, the 1st Greenbelt Zone has a higher degree of urbanization with dense buildings, resulting in a lower NDVI value. On the other hand, the 2nd Greenbelt Zone has a larger urban area proportion compared with the 1st Greenbelt Zone and comprises the area within the 6th Ring Road, leading to a higher NDVI value. However, despite the lower NDVI value in the 1st Greenbelt Zone compared with other regions, it shows the most significant NDVI improvement within its area. This demonstrates that the implementation of the 1st Greenbelt Policy has had a very positive effect on vegetation recovery in the region. On the contrary, the NDVI trend in the 2nd Greenbelt Zone has been declining over the past 20 years, indicating that the implementation of the 2nd Greenbelt Policy has not yielded the expected results. In addition, the NDVI data are not increasing uniformly, probably due to the complex effects of climatological and human-activities-related factors that have different impacts on the greenery in Beijing.

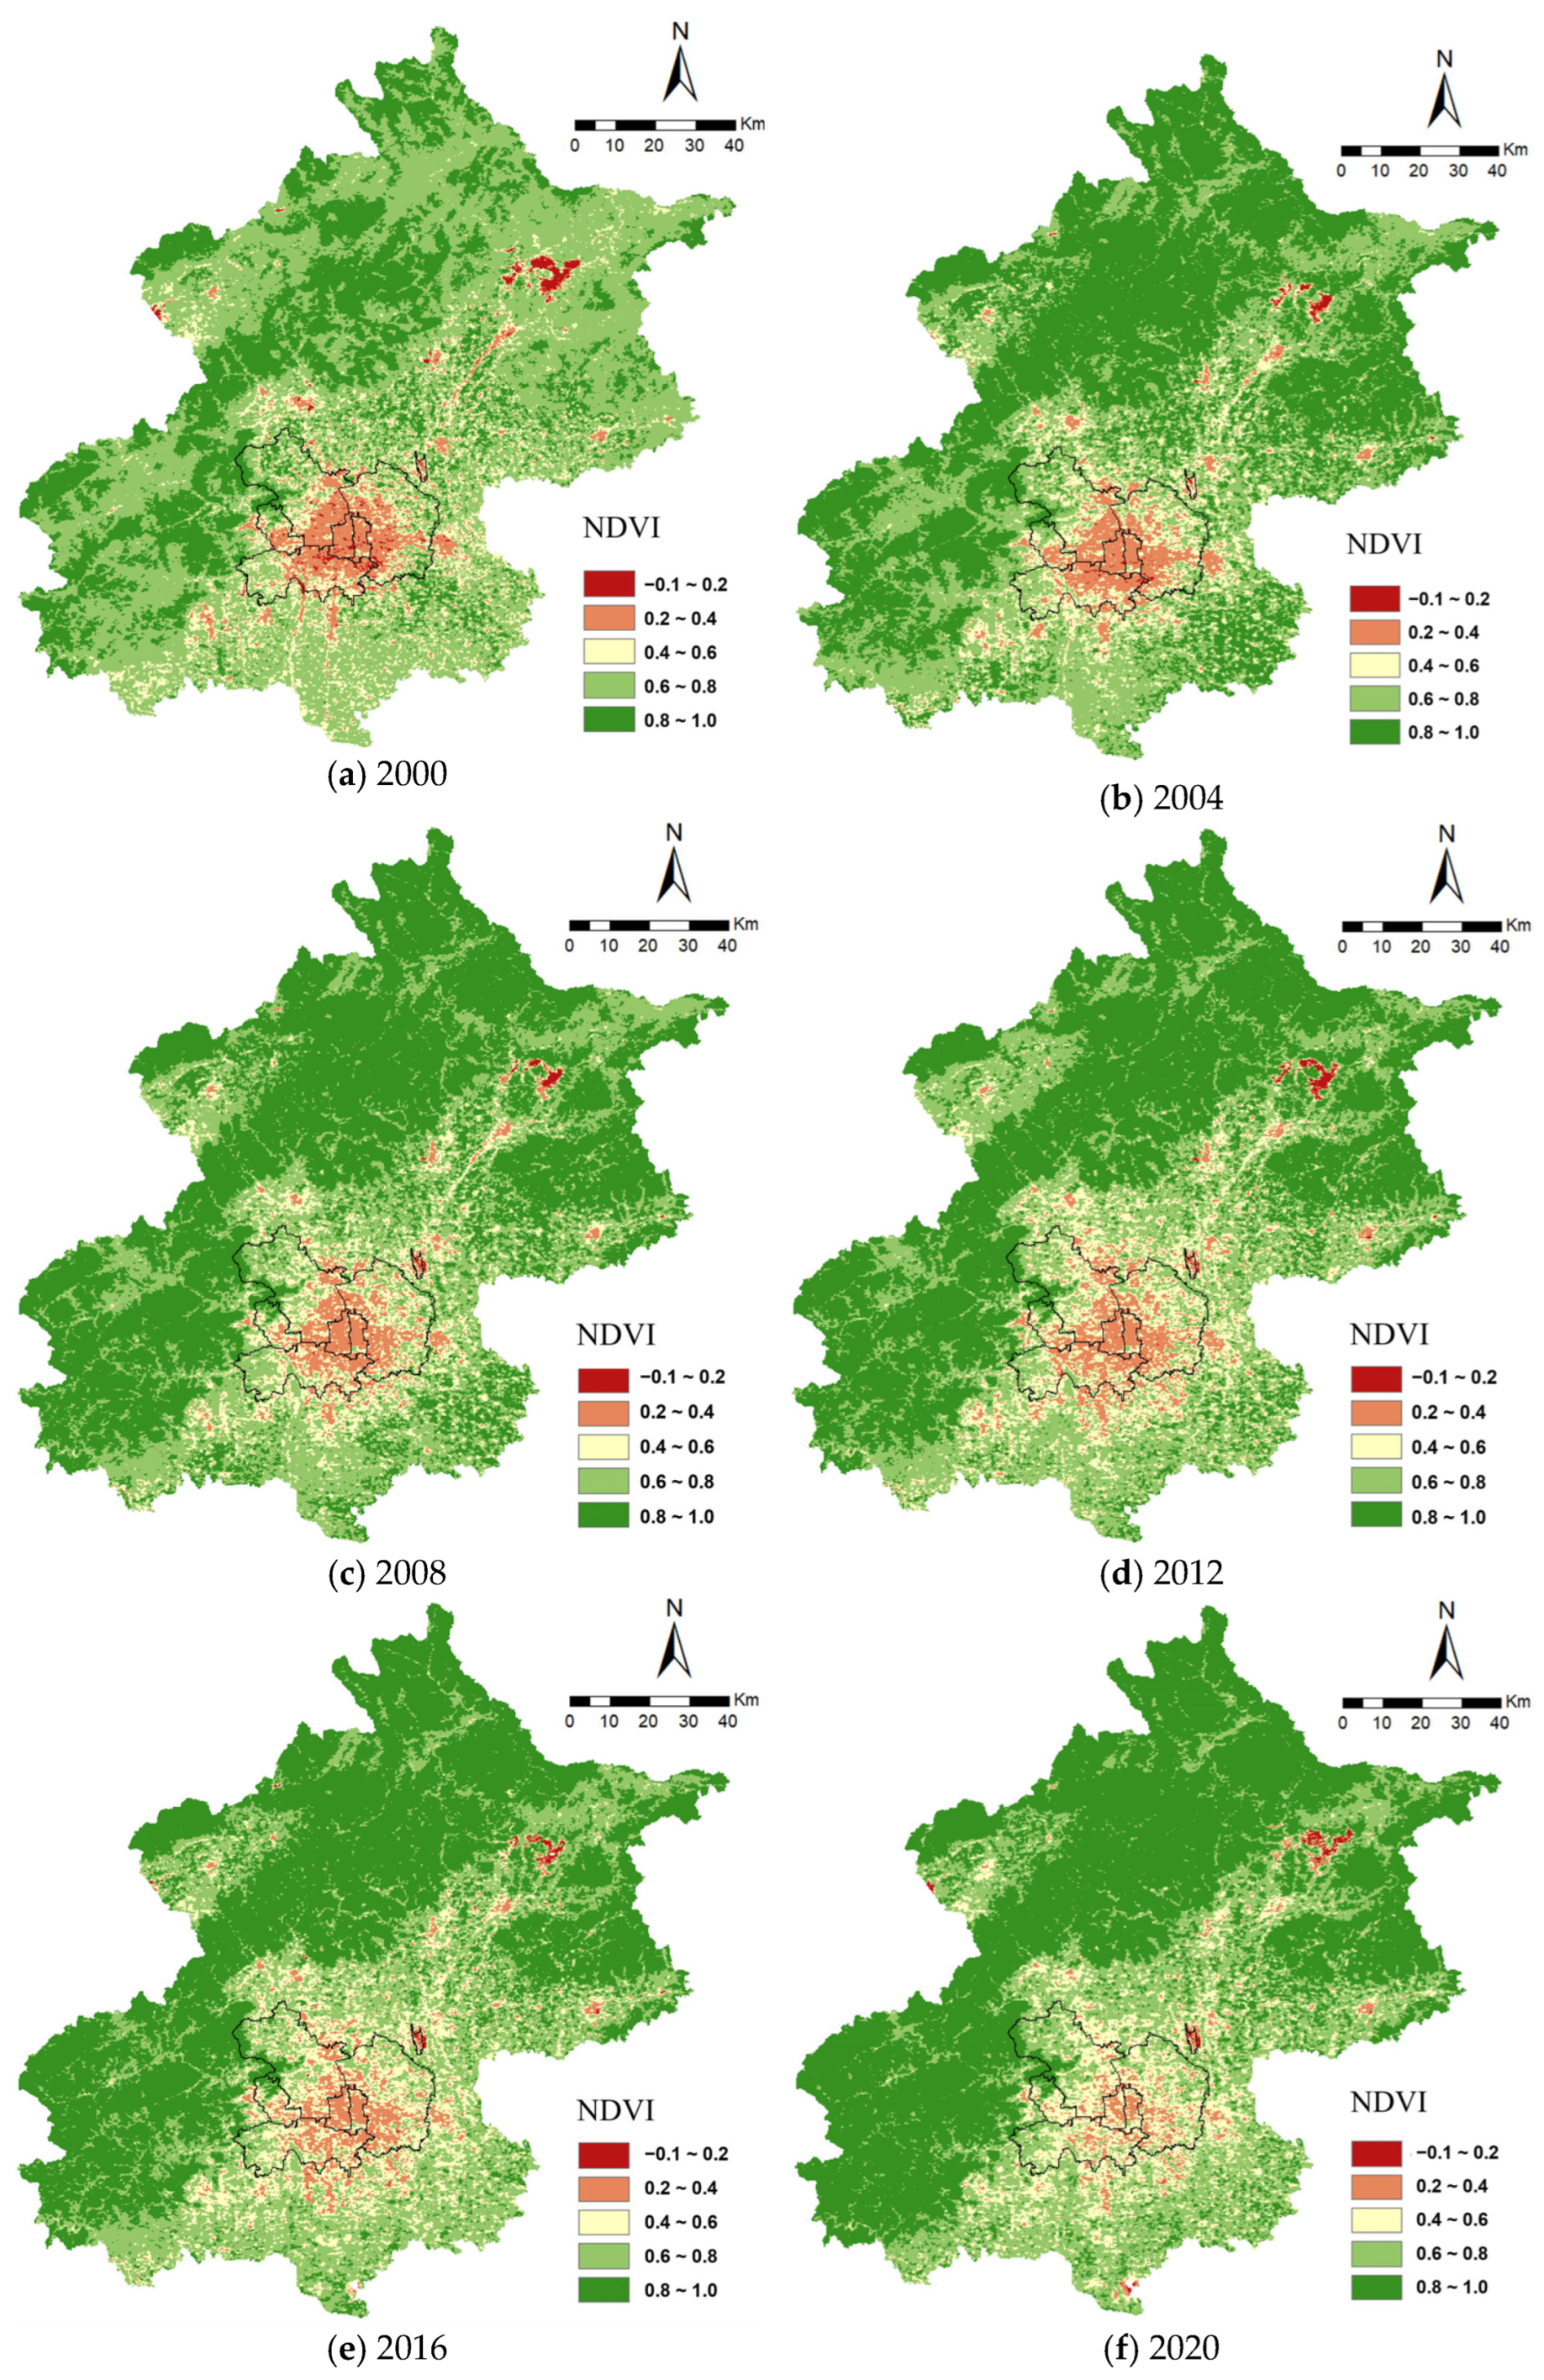
3.2. Spatial and Temporal Variations in NDVI in Beijing

The NDVI raster maps for the six representative years of 2000, 2004, 2008, 2012, 2016, and 2020 for the entire area of Beijing are shown in Figure 3. Based on the range of NDVI values, the vegetation growth condition in the study area is categorized into five levels from low to high NDVI value ranges (Table 3). Different colors were used in the spatial map to represent different classes, with Class I (in deep red), Class II (in orange), Class III (in yellow), Class IV (in light green), and Class V (in green) representing NDVI ranges of −0.1 to 0.2, 0.2 to 0.4, 0.4 to 0.6, 0.6 to 0.8, and 0.8 to 1, respectively. Higher NDVI values indicate better vegetation density and quality, while lower NDVI means the opposite. From a spatial distribution perspective, NDVI shows a circular trend of gradual increase from the center to the outskirts. The areas with NDVI values higher than 0.8 are mainly distributed in the mountainous regions in the northeast, northwest, and southwest of Beijing. In contrast, the plain areas in the east have lower NDVI values compared with the surrounding mountainous regions. The central urban area exhibits the lowest NDVI values.
From the temporal trend, it is evident that the averaged NDVI of the overall Beijing region has significantly improved over the past two decades, with an increase in high NDVI areas (NDVI value between 0.8 and 1.0) and a decrease in low NDVI areas (NDVI value between −0.1 to 0.2). The most prominent changes in NDVI values are observed in the ranges of 0.6 to 0.8 (Class IV) and 0.8 to 1 (Class V). These two ranges exhibit opposite trends: Class IV shows a decreasing trend, while Class V shows an increasing trend. In the year 2000, Class IV areas (NDVI between 0.6 and 0.8) accounted for 57.09% of the total area in Beijing, while the Class V area (NDVI between 0.8 and 1.0) was only 26.18%. However, by the year 2020, the Class V area became the largest, occupying 53.64% of the total area, marking an increase of approximately 27.46% in proportion and indicating a significant improvement in the NDVI. At the same time, the proportion of Class I areas (NDVI below 0.2) showed a shrinking trend. In 2000, the Class I area accounted for the highest proportion at 0.64%. By 2020, this proportion had stabilized at around 0.2%. The reduction in the area with the lowest NDVI value reflects the positive outcomes of vegetation recovery efforts in Beijing.
Since the implementation units of the 1st Greenbelt and 2nd Greenbelt Policies are mainly concentrated in the areas between the 4th Ring Road and the 6th Ring Road in Beijing, this study selects the area within the 6th Ring Road to further investigate the spatio-temporal variations in the vegetation NDVI for representative years, as shown in Figure 4. The proportion of vegetation NDVI values within the 6th Ring Road for the representative years is presented in Table 4. Overall, the proportion of areas within the 6th Ring Road with low vegetation NDVI values (<0.2) has decreased over the past two decades, as presented in Table 4. It has decreased from 1.82% in 2000 to 0.2% in 2020, representing a reduction of approximately 1.6%. The proportion of areas with NDVI values between 0.2 and 0.4 has decreased from 28.52% to 12.68%, indicating a decrease of about 16%. This suggests that a considerable portion of the area within the 6th Ring Road has experienced a significant recovery of vegetation coverage from 2000 to 2020.
The proportion of areas with high vegetation NDVI values (>0.8) has gradually decreased from 9.23% in 2000 to 5.30% in 2020, representing a reduction of approximately 4%. Although there has been a slight improvement after 2016, the overall trend still leans towards degradation compared with earlier years. These areas are primarily concentrated in the 2nd Greenbelt Zone, which extends from the periphery of the 1st Greenbelt Zone to the 6th Ring Road. The reasons for the above decrease include the following: (1) over the past two decades, Beijing has undergone rapid population expansion, with urban areas gradually expanding from the 1st Greenbelt Zone around the 4th Ring Road to the 2nd Greenbelt Zone, mainly within the 6th Ring Road. During this process of urban expansion, inevitable destruction of greenery in the outer regions of the 6th Ring Road occurred, leading to a decrease in NDVI values. Simultaneously, with the fast economic development, urbanization processes in the downtown region and the 1st Greenbelt Zone have become relatively flattened. Citizens have become increasingly aware of the importance of the ecological environment for residential life and have initiated large-scale greening projects. As a result, the inner regions within the 6th Ring Road exhibit a more favorable vegetation recovery scenario, with NDVI values increasing over the years.

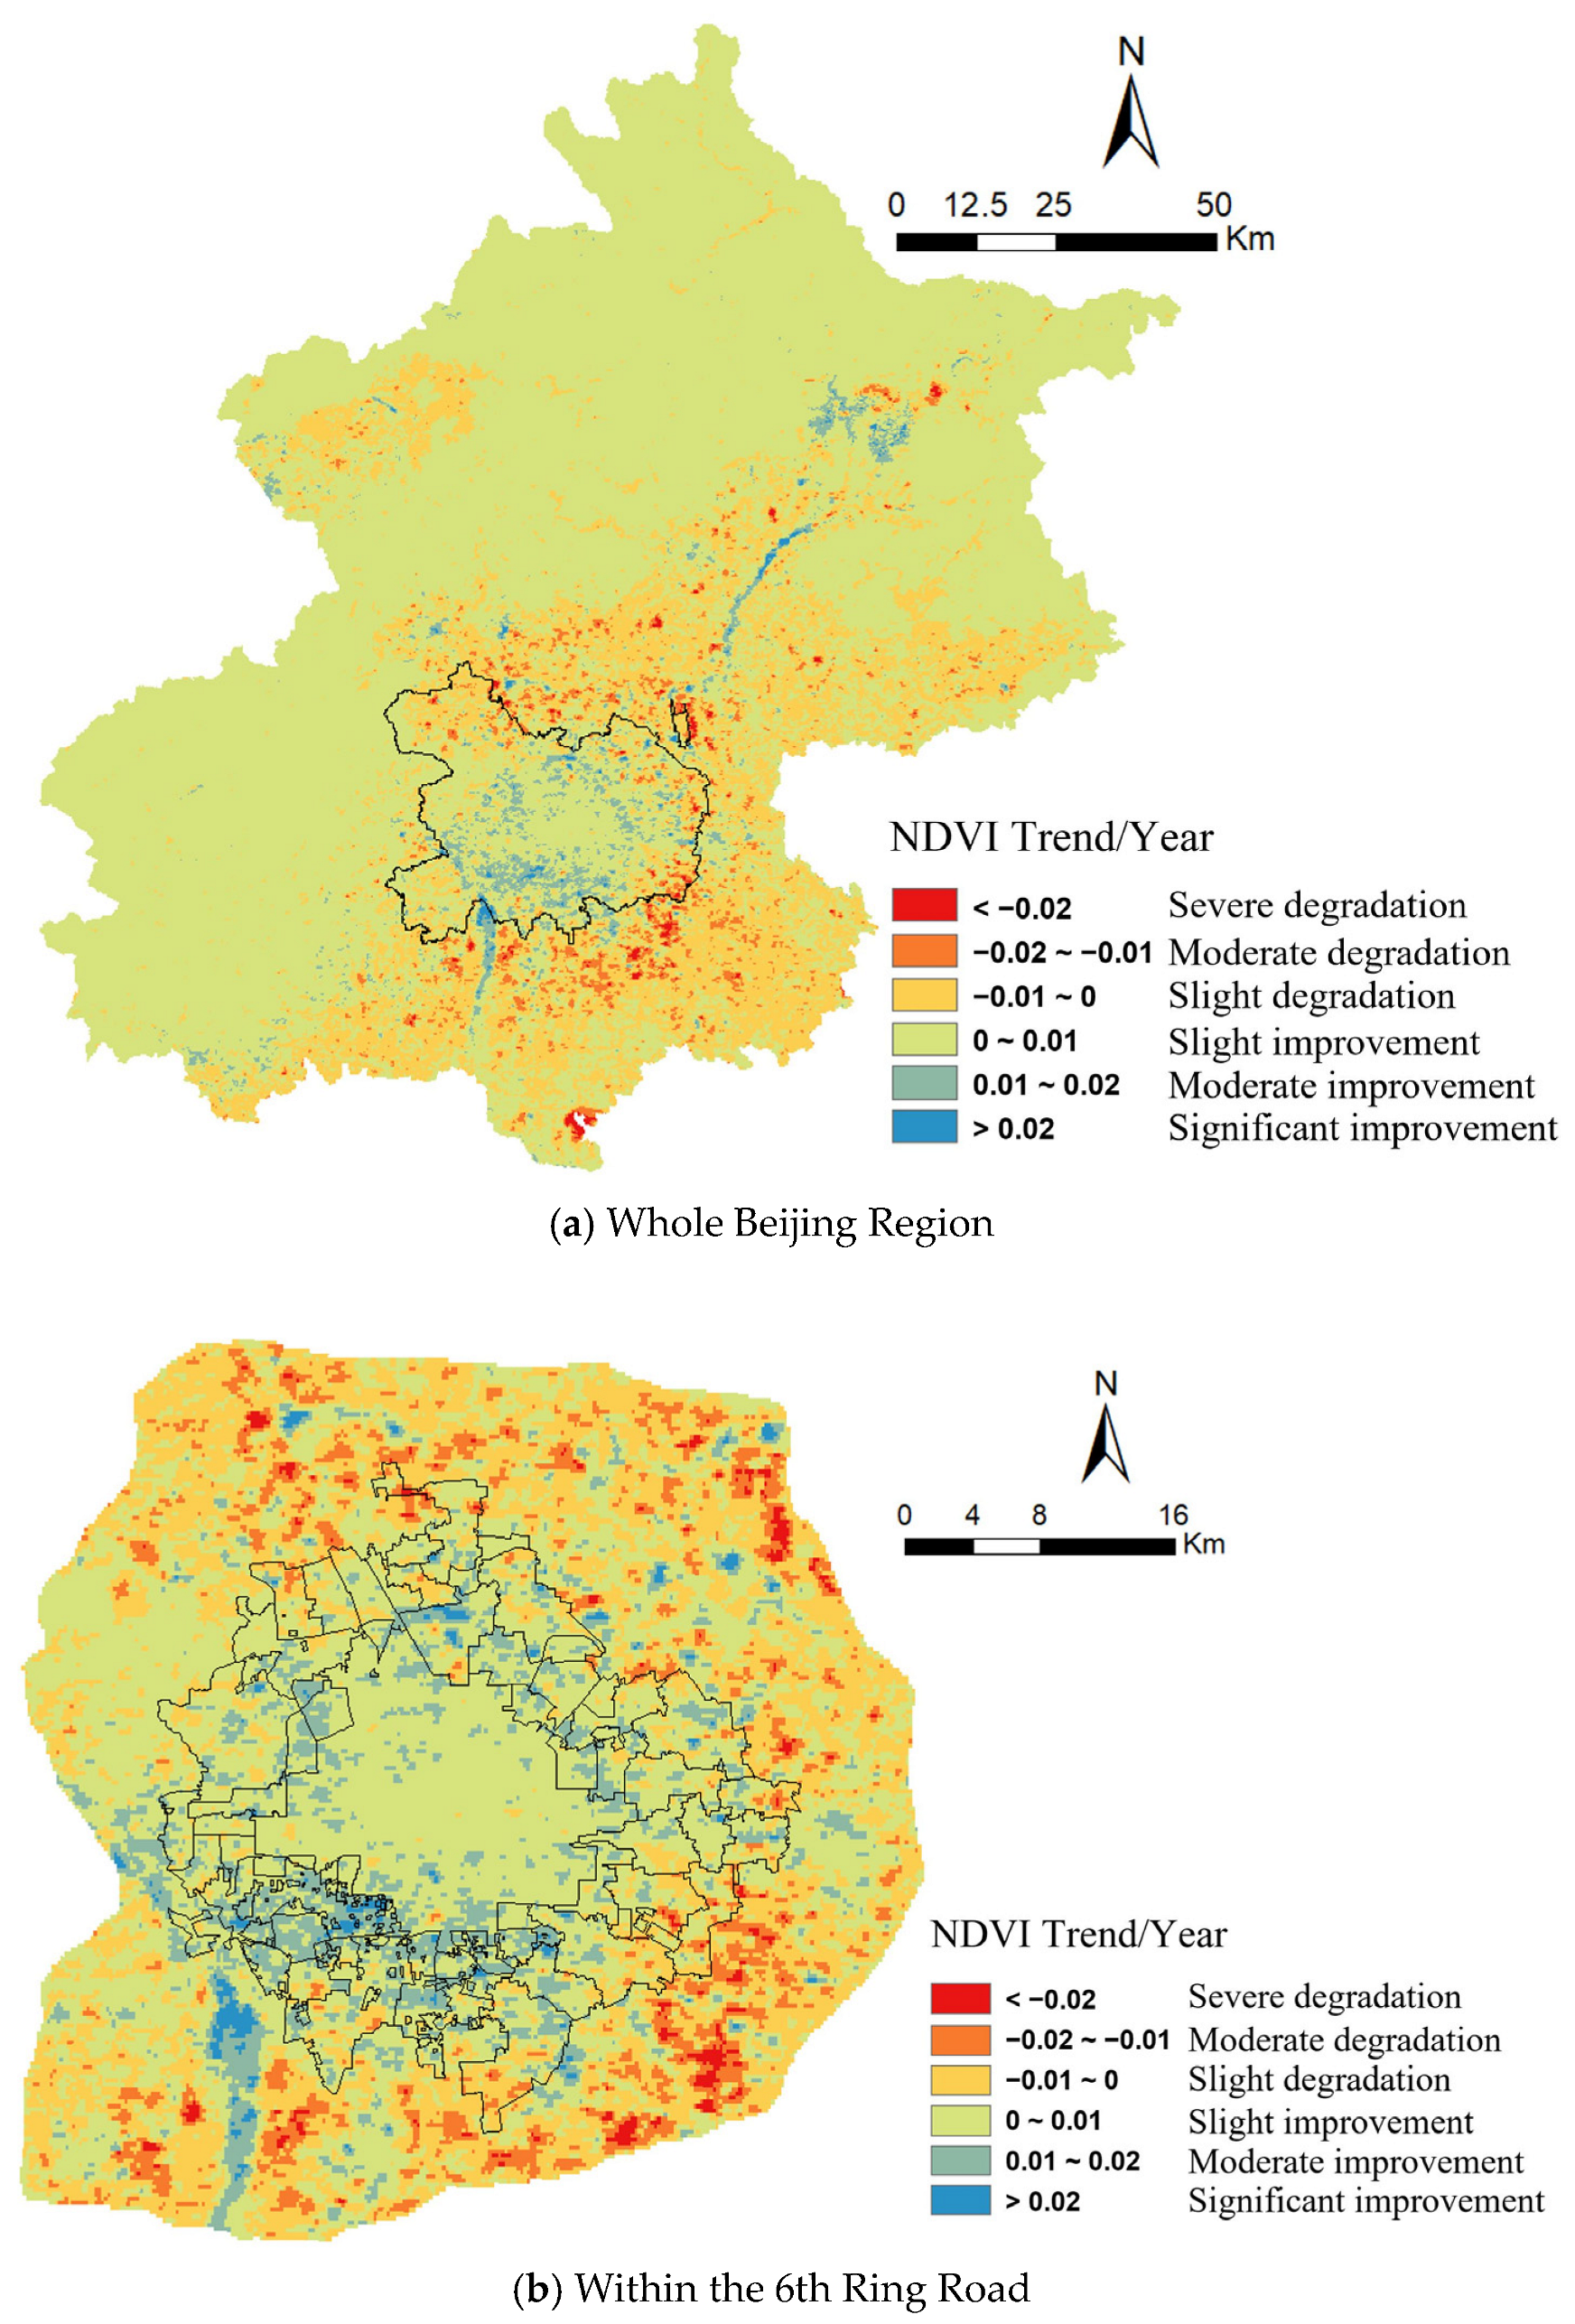
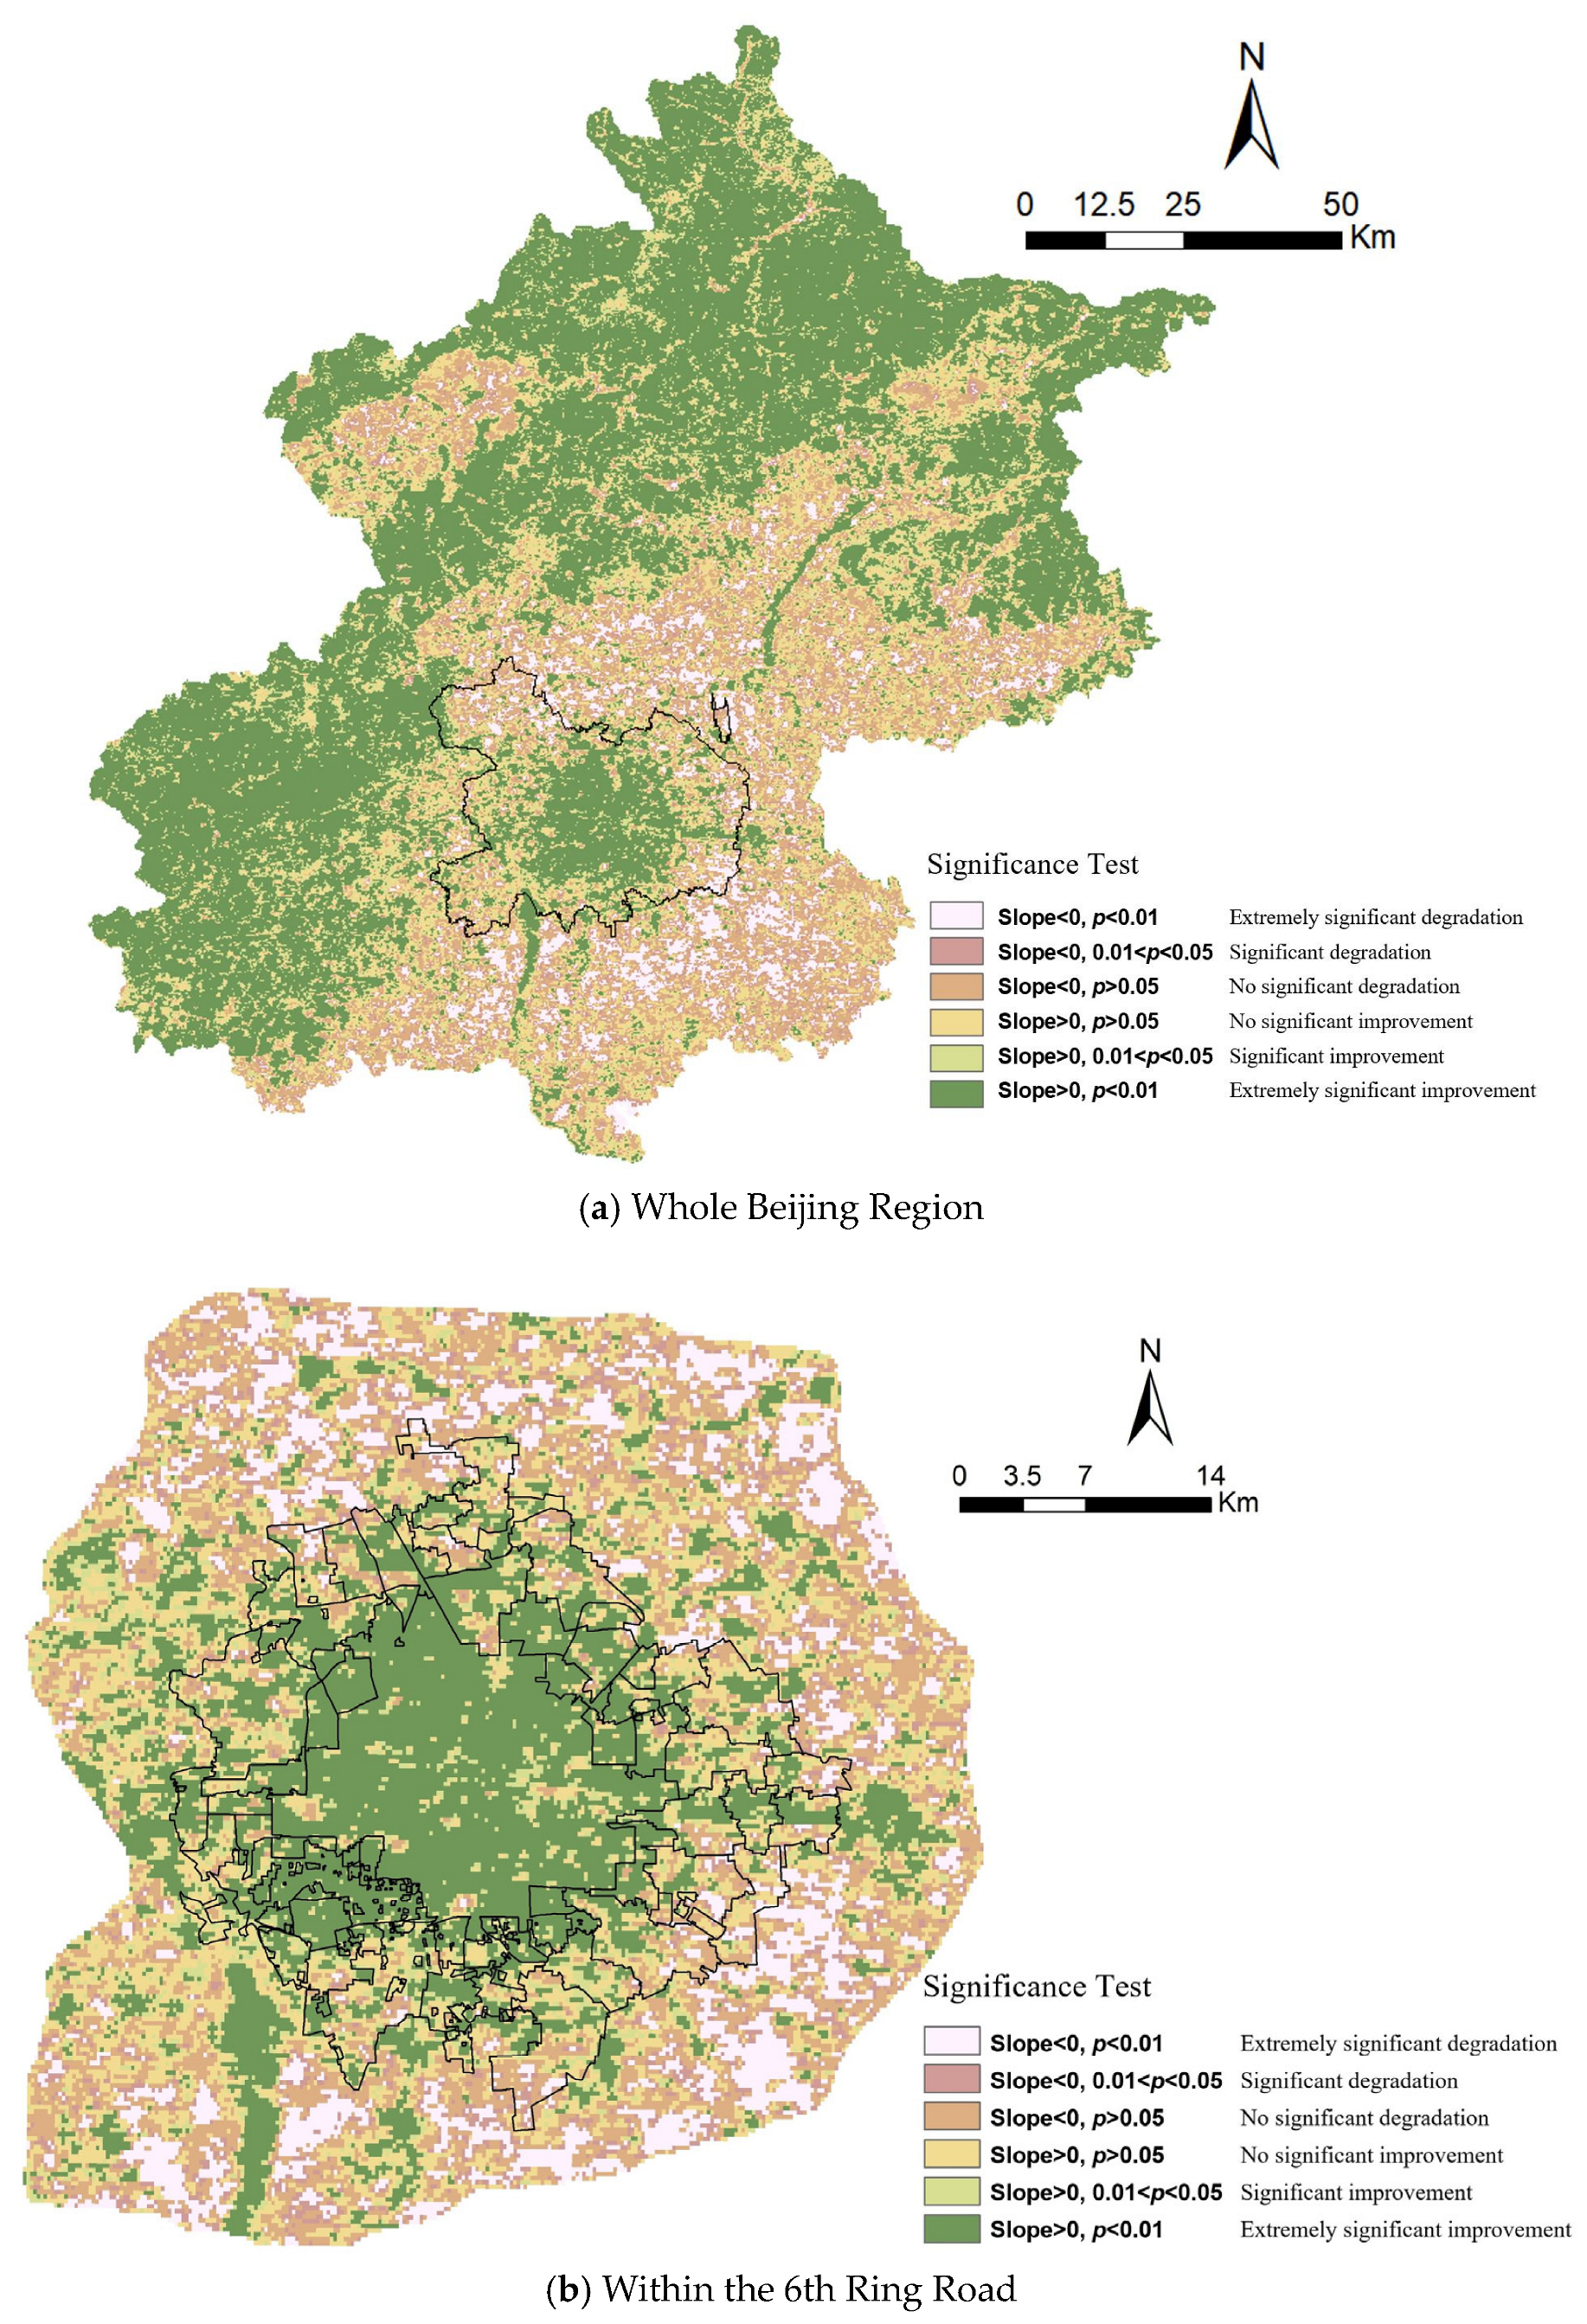
3.3. Temporal Trends of NDVI Change in Beijing from 2000 to 2020

Using regression analysis, we estimated the trend slope of NDVI change in the past 20 years in Beijing, from 2000 to 2020. The estimate of the slope from linear regression is derived for all grids using the annual maps of the NDVI. Figure 5a illustrates the spatial variation of NDVI trend slopes, where areas with a positive slope value, represented by light green, light blue, and dark blue areas, indicate an improving NDVI. The corresponding statistics for the proportional area of different NDVI trends are presented in Table 5. The figure shows that the majority of NDVI trends are larger than 0, accounting for approximately 75.21% of Beijing’s total area. Among them, the area with an NDVI trend slope between 0 and 0.01, indicating slight improvement, is the largest, and covers around 72.67% of the city’s total area and 96.62% of the area with improved NDVI values. These areas are mainly concentrated in the mountainous regions in the northeast, northwest, and southwest of Beijing. The area with the highest improvement (>0.02/year) is relatively small, representing only 0.19% of the city’s total area, and it is mainly concentrated within the 6th Ring Road of Beijing. The area with an NDVI trend slope less than 0, representing vegetation degradation, accounts for approximately 24.79% of Beijing’s total area. Among the degradation levels, the area with the highest proportion is the “slight degradation” class with trend slope values ranging from −0.01 to 0, covering 22.07% of Beijing’s total area. The regions with slight NDVI degradation are mostly located on the outskirts of and near the 6th Ring Road and the southeast plain area in Beijing.
Figure 5b shows the details of the NDVI trend map within the 6th Ring Road in Beijing. The areas of vegetation having an NDVI trend slope greater than 0 account for 59.93% of the total area. It can be noted that these areas are mainly concentrated in the 1st Greenbelt Zone and the downtown urban area surrounded by the 1st Greenbelt Zone. Among them, the area with slight improvement (from 0.0 to 0.01/year) covered the largest proportion, covering 48.71% of the area, which is mainly distributed in the regions implementing the 1st Greenbelt Policy and the urban downtown of Beijing. The area with the largest improvement (>0.02/year) accounted for 0.88% of the total area and was mainly concentrated in the 1st Greenbelt Zone. On the other hand, the area with an NDVI slope of less than 0 accounted for 40.07% of the total area. The areas with slight degradation (from −0.01/year to zero), covering 31.10% of the area within the 6th Ring Road, were mostly distributed in the 2nd Greenbelt Zone. The moderately severe (between −0.02/year and −0.01/year) and severe degradation (<−0.02/year) areas accounted for 7.92% and 1.05%, respectively, of the total area, and are mainly found in the 2nd Greenbelt Zone. The results based on this trend analysis show that the vegetation recovery efforts in the 1st Greenbelt Zone have achieved significant progress over the past 20 years. However, the implementation of policies in the 2nd Greenbelt Zone did not meet expectations, with a large area that exhibits degraded vegetation.
Furthermore, we carried out a significance test to quantify the significance level of the NDVI trend, as shown in Figure 5. The results are shown in Figure 6a for the whole Beijing region and (b) for the region within the 6th Ring Road. The proportional area of different significance level for the NDVI trends is given in Table 6. Overall, we can see within the 6th Ring Road that the areas showing moderate to severe degradation and moderate to severe improvement have significant trends in general. However, outside the 6th Ring Road, while the mountainous regions show significant improvement, the NDVI trend for most of the plain regions may not be significant.

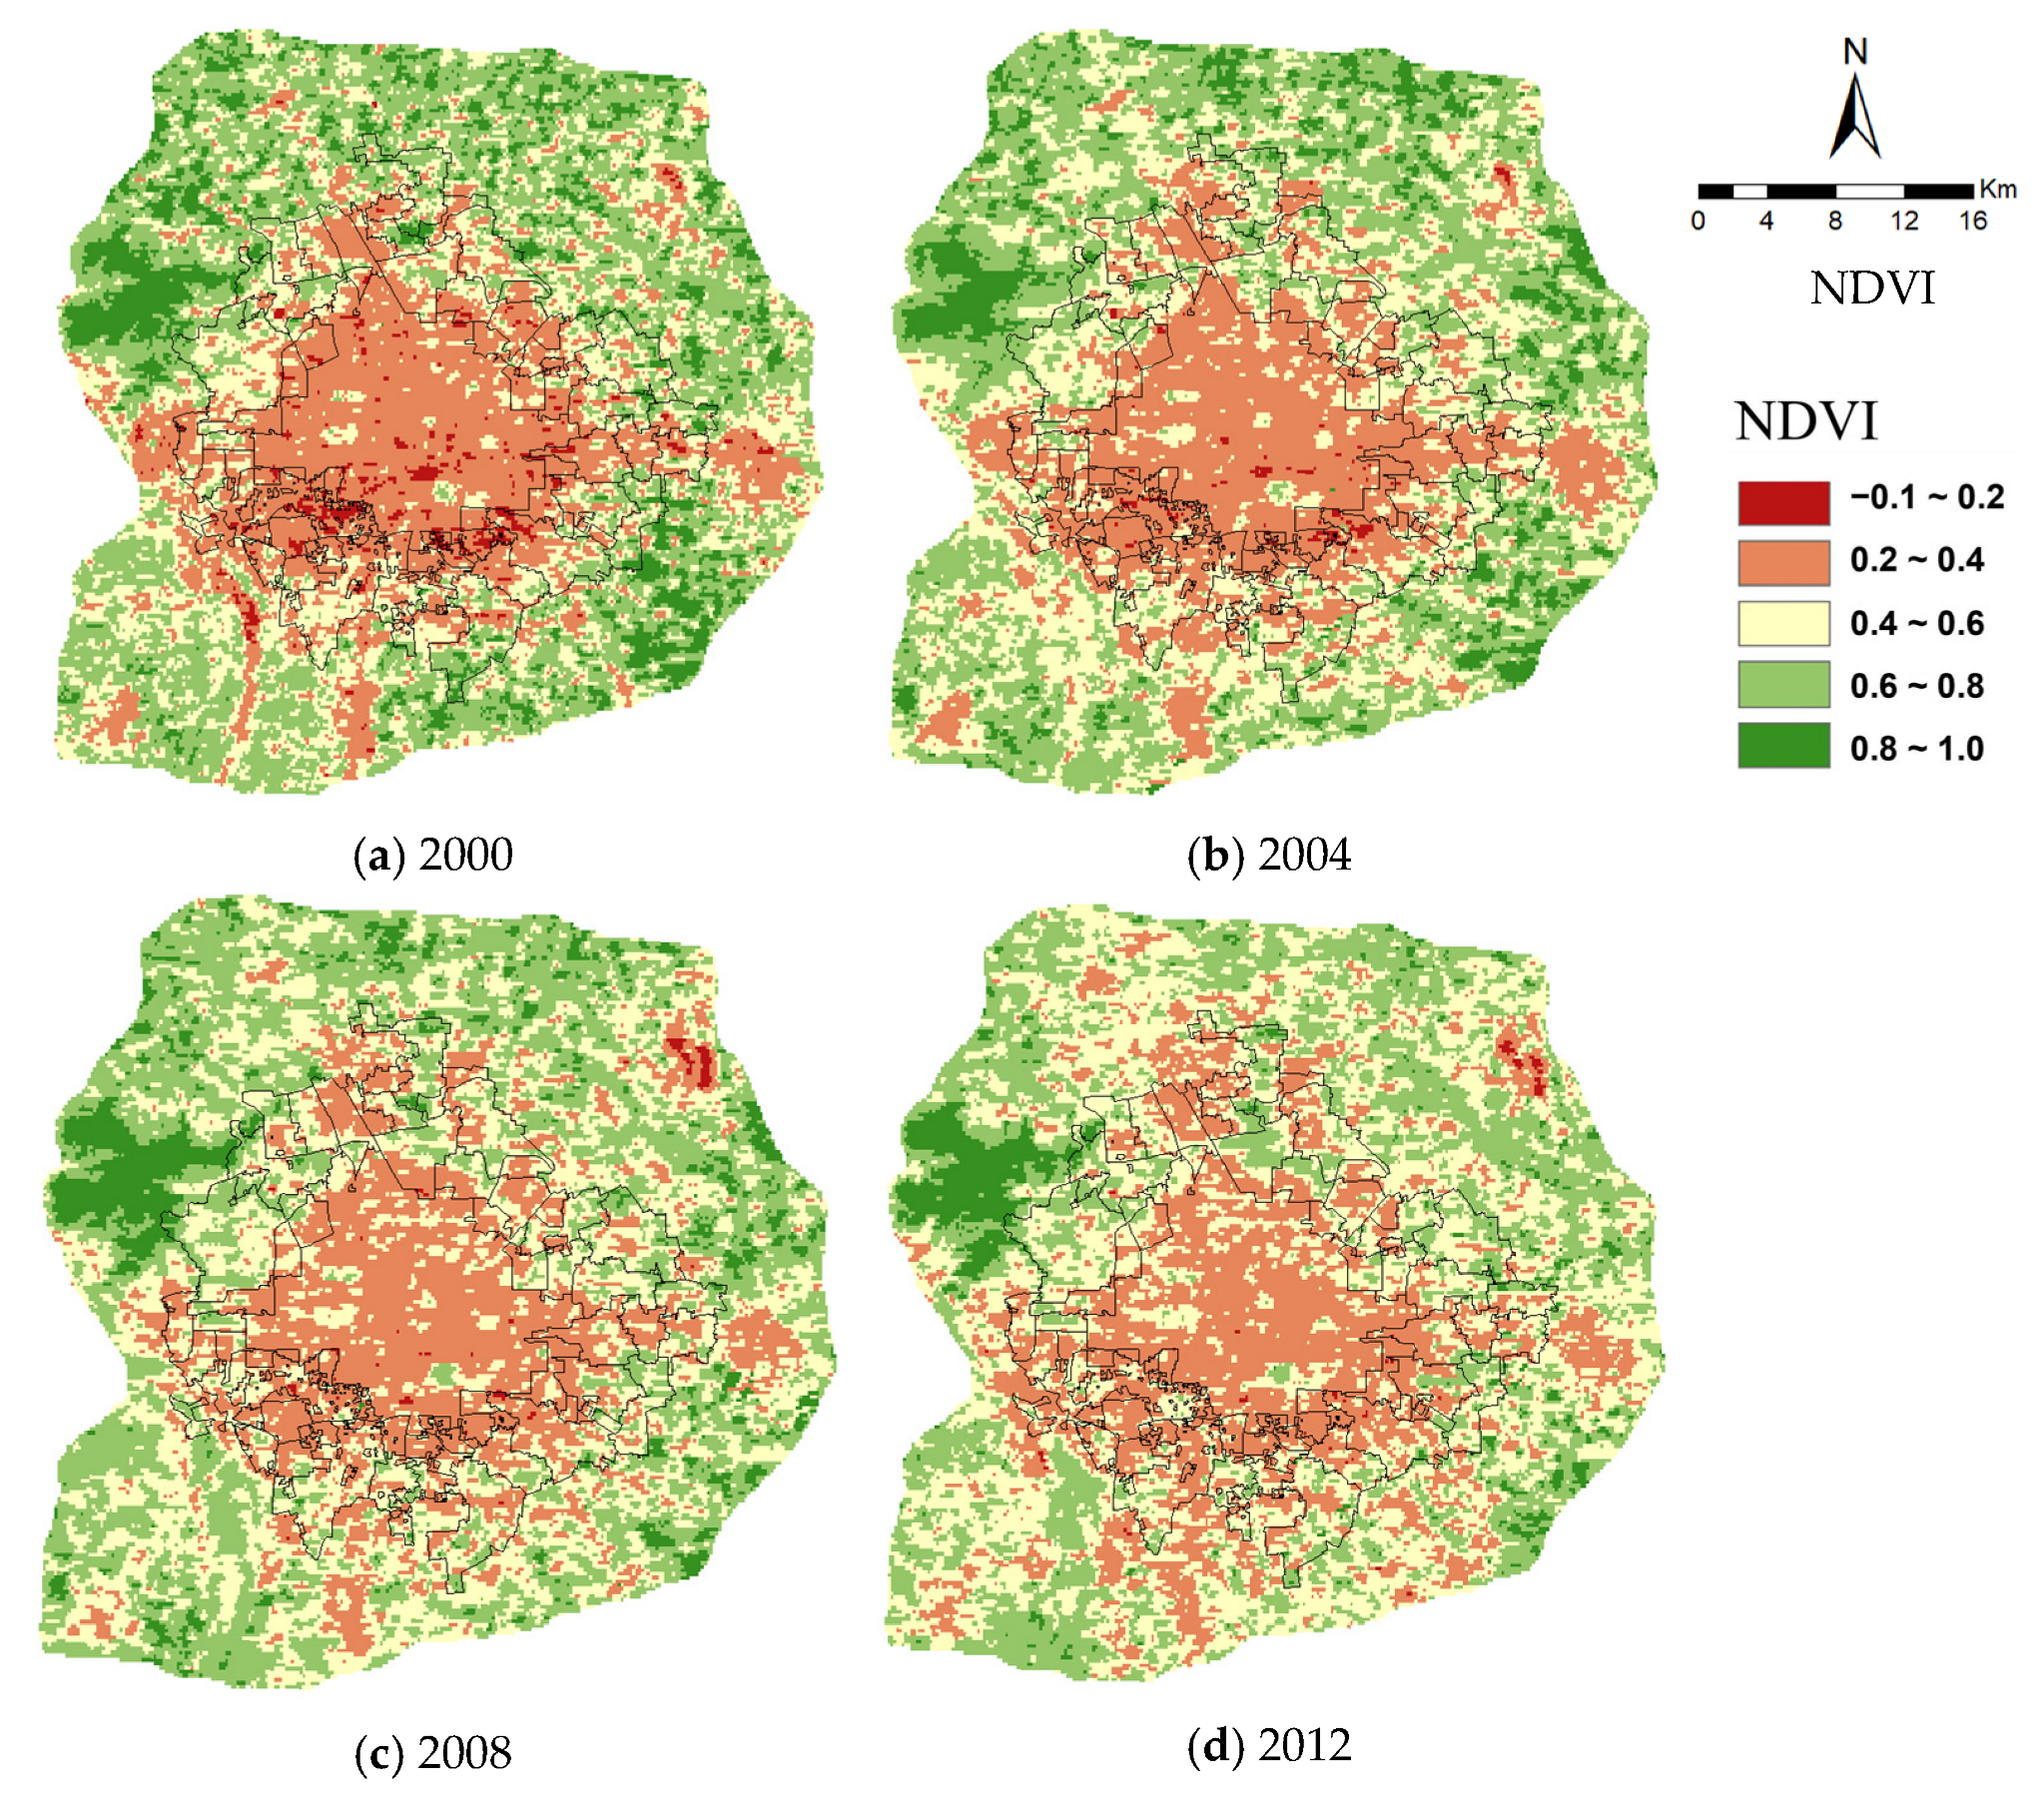
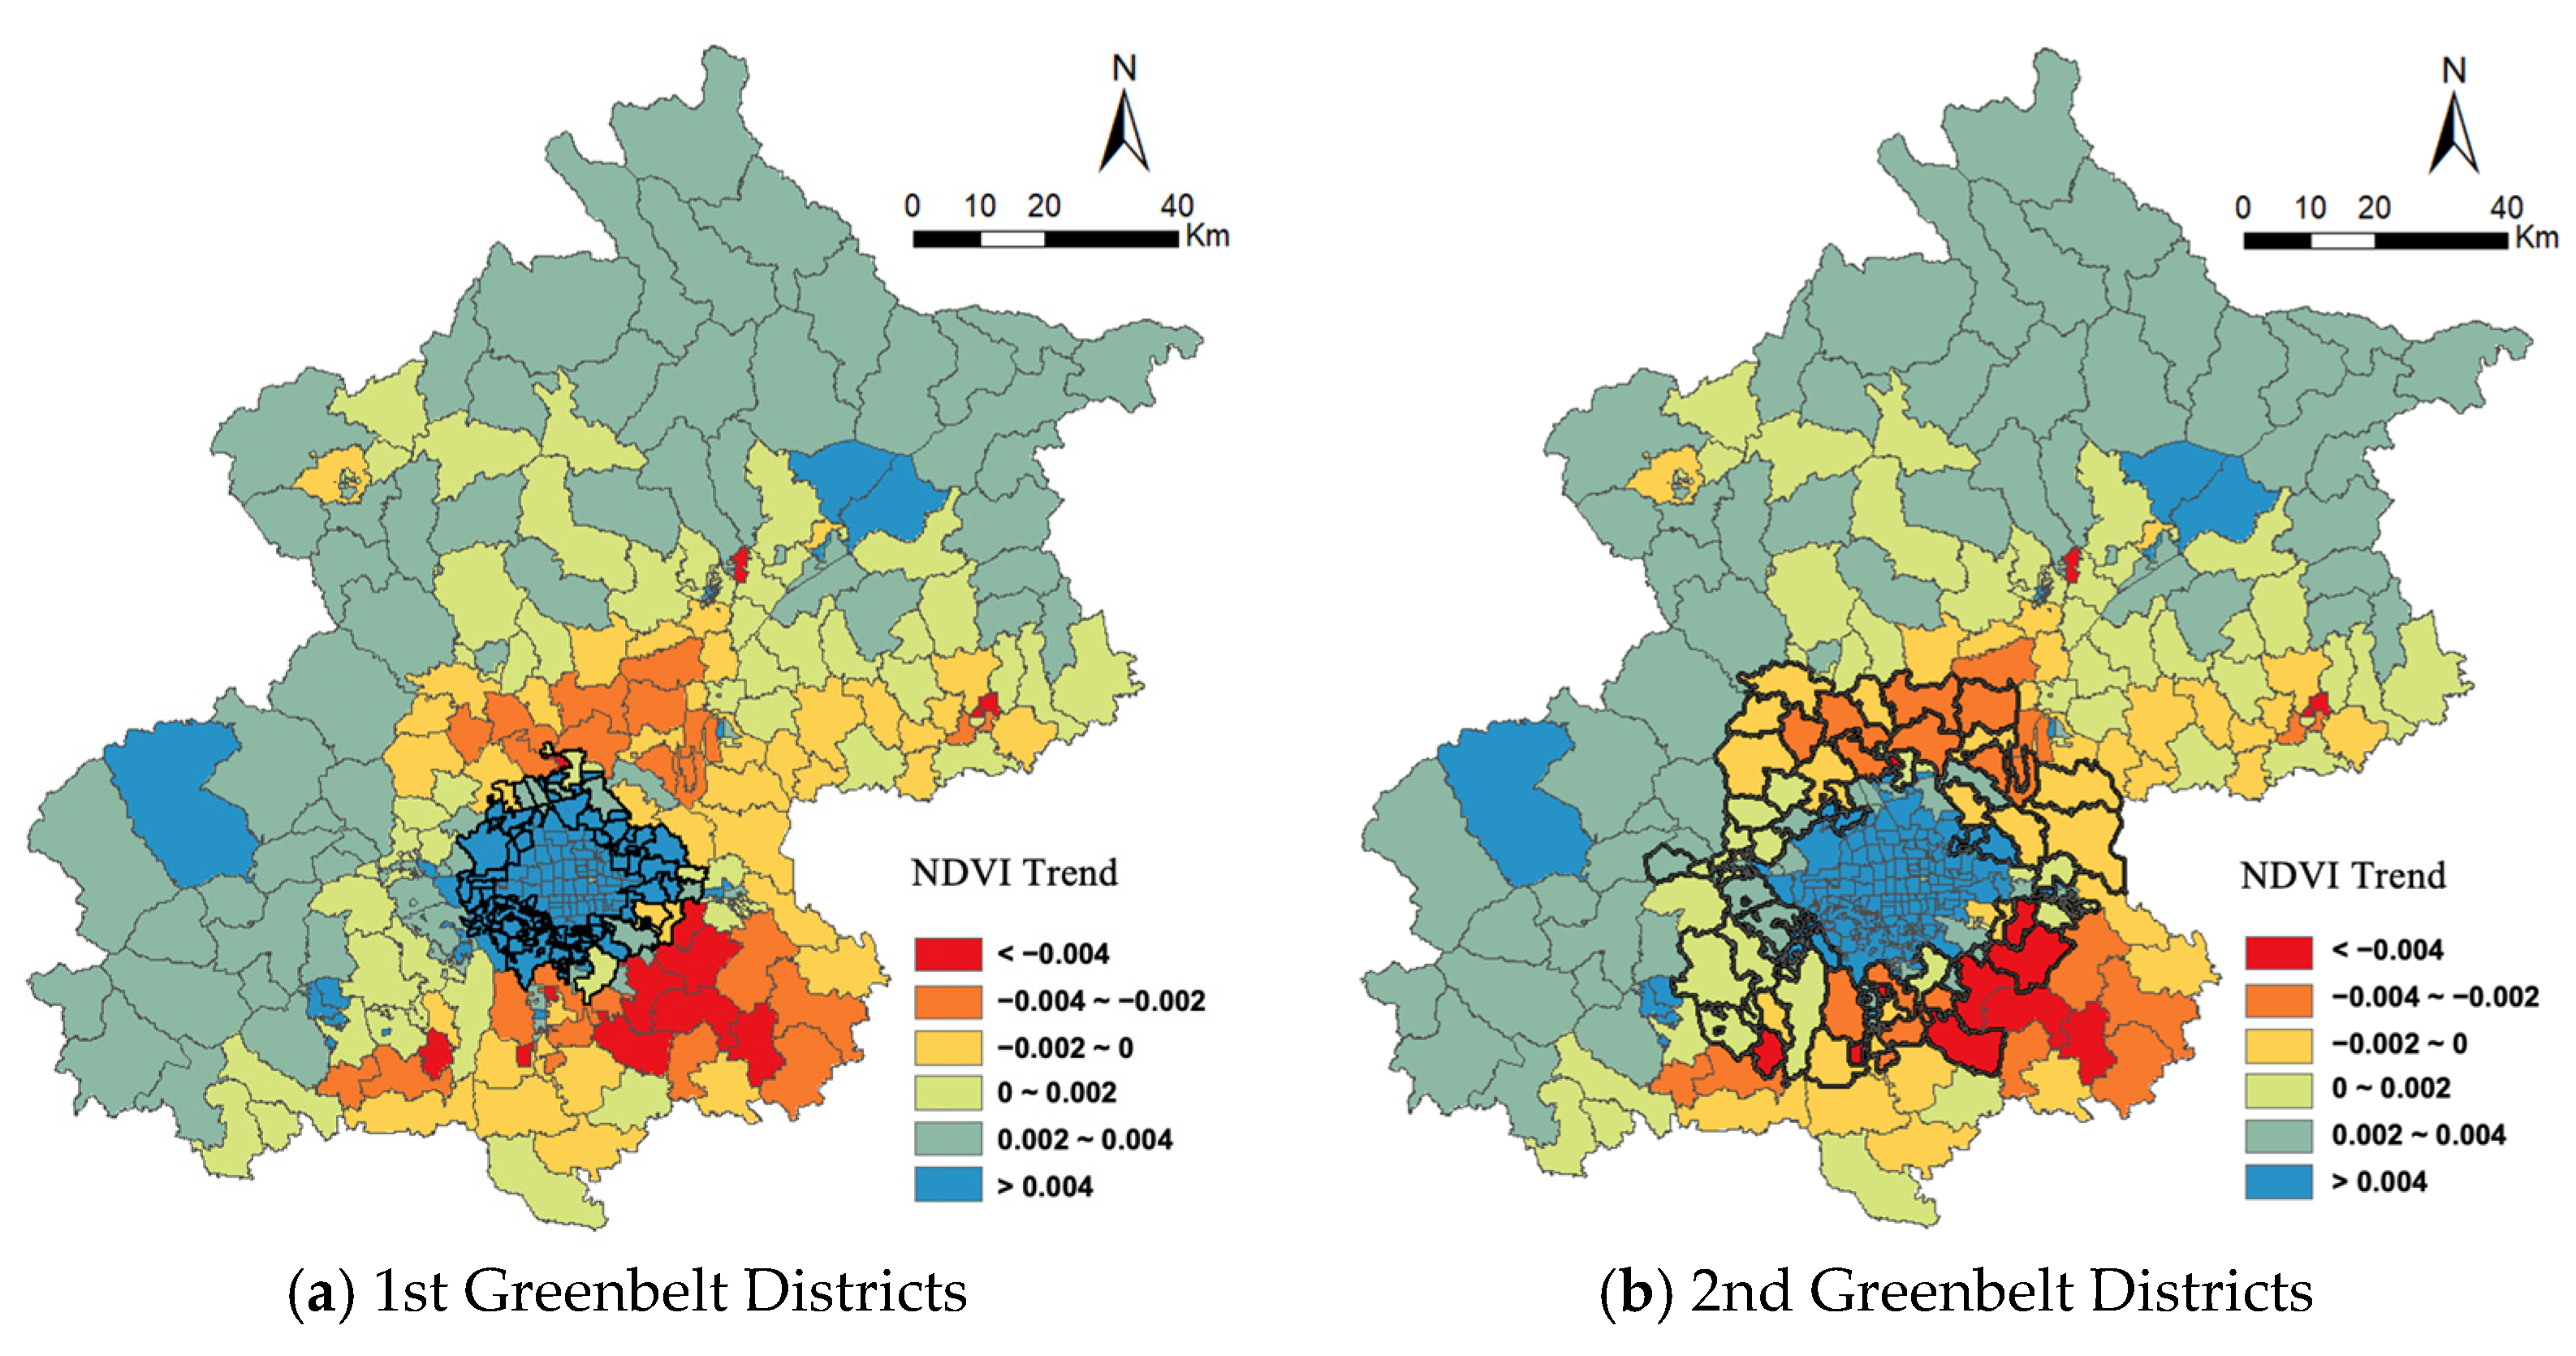
3.4. The Spatio-Temporal Variations of NDVI in Beijing at District Level

In the subsequent section, the investigation of the impacts of the greenbelt policies focuses on Beijing’s district-level vegetation NDVI. The average NDVI values for each district are calculated to quantify the trend slope using linear regression of the annual NDVI in Beijing from 2000 to 2020. The results are illustrated in Figure 7.
It can be observed that there has been a significant improvement in the average vegetation NDVI values of Beijing’s districts from 2000 to 2020. The districts improvements are mainly distributed across two regions: (1) in the peripheral mountainous areas of Beijing, predominantly located in the northeastern, southwestern, and northwestern districts; (2) in the central urban districts of Beijing, including the districts within the 1st Greenbelt Zone and the downtown urban area. Moreover, the degree of improvement in vegetation NDVI is higher in the central urban districts compared with the peripheral mountainous districts (as indicated by the blue areas in the figure). For the districts within the 1st Greenbelt Zone, most of them show an improvement in NDVI. There are a total of 49 districts within the 1st Greenbelt Zone, among which 47 districts exhibit a positive slope in their trend of NDVI, indicating an improvement trend. This suggests that the 1st Greenbelt Policy has significantly increased the district-level vegetation NDVI values over the past two decades. In the case of the 2nd Greenbelt Zone consisting of 55 districts, it is important to note that 7 of these districts overlap with those from the 1st Greenbelt Zone. Among the remaining 48 districts, 26 exhibit a positive slope in their trend of vegetation NDVI, while 29 districts exhibit a negative slope. This indicates that over the past two decades, a majority of districts within the 2nd Greenbelt Zone are experiencing a degradation trend in NDVI. This suggests that the implementation of the 2nd Greenbelt Policy has not yielded the expected improvement in vegetation coverage for most districts.

4. Quantitative Evaluation of the Performance of the Greenbelt Policies

4.1. Model Setting

In this study, professional Stata® software (version 17; https://www.stata.com/; accessed on 1 June 2023) is used for the regression analysis. When dealing with panel data, individual effects exist in both fixed effects and random effects forms. Therefore, it is necessary to determine whether the model should adopt the fixed effects model or the random effects model. We carried out the Hausman test [43] to determine whether to use the fixed effects model or the random effects model for analyzing the panel data in this study. In this test, the null hypothesis is that the random disturbances are uncorrelated with the explanatory variables, indicating that the model should use the random effects model. The selected variables are shown in Table 2. However, the p-value is less than 0.00001, strongly rejecting the null hypothesis. Therefore, it is concluded that the model should adopt the fixed effects model. Based on this test, the model is set as follows in this study:
Y i , t = k = 1 k a k X k , i , t + Y e a r t + D i s t r i c t i + u i , t = k = 1 k a k X k , i , t + Y e a r t + D i s t r i c t i + u i , t
In the equation, i represents different district units in Beijing, t represents the time series (different years), and k represents the k-th explanatory variable as shown in Table 2. Y i , t represents the dependent variable, which represents the NDVI index of the i-th district in the t-th year. X k , i , t represents the explanatory variables, including policy variables, annual land surface temperature, annual precipitation, and other influencing factors as shown in Table 2. Y e a r t and S t r e e t i represent the year-specific fixed effect and districts-specific fixed effect, respectively, while u i , t represents the random disturbance term. This equation sets up a relationship between the changes in NDVI and the associated factors, including the natural and human-activity-related variables ( X k , i , t ), and the space ( D i s t r i c t i )- and time ( Y e a r t )-related variables. Such a model setting has been widely adopted to understand the impact factors on vegetation dynamics (e.g., [44,45]).

4.2. Collinearity Test

Before conducting the fixed effect regression analysis, it is necessary to perform a test for multi-collinearity among the independent variables to eliminate the interference caused by highly correlated relationships between explanatory variables (Table 2). In this study, the variance inflation factor (VIF) method is used for this diagnosis, and the results are shown in Table 7. A higher VIF value indicates a more severe multi-collinearity issue. According to the rule, the maximum VIF value of any variable should not exceed 10. In the table, the highest VIF value is 3.51, which is much lower than 10. Therefore, we can conclude that there is no multi-collinearity among the variables.

4.3. Results from Fixed Effects Regression Model

The results from the fixed effects regression analysis performed to explore the implementation effect of the greenbelt policies on the NDVI changes in a statistical context are shown in Table 8. Three different models with varied combinations of variables are presented. Model I and Model II analyze the 1st and 2nd Greenbelt Policies as core explanatory variables, respectively. Model III includes the variable of the 2008 Summer Olympics and discusses the interaction effect between the Summer Olympics and the greenbelt policies. The fitted coefficients and the t-test statistics are shown, with significance level indicated by stars. The t-test statistics are in parentheses. For the significance levels, * p < 0.1, ** p < 0.05, and *** p < 0.01. A positive value for the fitted coefficient represents a positive correlation between the variable and the NDVI changes in Beijing. According to Model I, the 1st Greenbelt Policy has a significant positive impact on the increase in the NDVI in Beijing. The implementation of the 1st Greenbelt Policy led to an average increase of 0.296 units in the NDVI for districts in Beijing over the past two decades. Since NDVI values range between −1.0 and 1.0, the improvement is relatively evident. On the other hand, the coefficient of the 2nd Greenbelt Policy in Model II shows the opposite effect, indicating that the implementation of the 2nd Greenbelt Policy accelerated the degradation of the NDVI for districts in Beijing over the past two decades. This is probably due to the fact that the 2nd Greenbelt Zone has gradually become a focus of urban development and construction as population expands in Beijing. Model III further confirms the conclusions obtained in Model II, demonstrating that the 1st Greenbelt Policy has a promoting effect on NDVI improvement, while the 2nd Greenbelt Policy does not meet expectations. It is worth mentioning that during the 2008 Summer Olympics period, the 1st Greenbelt Policy had a negative impact on the improvement in NDVI for the districts, whereas the implementation of the 2nd Greenbelt Policy actually promoted NDVI improvement. According to the results from Model III in Table 8, the implementation of the 2nd Greenbelt Policy led to an increase of 0.013 units in NDVI for the districts. Further analysis of these specific effects is discussed in the discussion section.

4.4. Robustness Test for the Fixed Effects Regression Model Analysis

A robustness test is carried out to show if the conclusions still stand with a different way of preprocessing the NDVI datasets from MODIS. In this study, the variable representing the vegetation coverage and growth status in Beijing is the annual maximum NDVI derived using the maximum value composition method, as described in Section 2. However, the annual average NDVI is sometimes used to represent vegetation growth characteristics. Therefore, in this robustness test, the dependent variable was changed to the annual average NDVI in order to observe the significance of each explanatory variable. As shown in Table 9, although the exact values may change for different variables, the greenbelt policies, as described earlier, remain significant in the robustness test, indicating that the results obtained in the previous analysis are valid.

5. Discussion

5.1. Positive Outcomes from the Implementation of the 1st Greenbelt Policy

Based on the comprehensive results in Table 8, the implementation of the 1st Greenbelt Policy has played a positive role in improving the NDVI for the districts over the past 20 years from 2000 to 2020. During the implementation process of the greenbelt policy, it has continuously optimized its tasks in response to the changing environments. For example, the Beijing Municipal Government and the Beijing Development and Reform Commission have released the “Beijing Master Plan (2016–2035)” that has put forward requirements for the construction of the 1st Greenbelt Zone and provided financial subsidies. The Beijing Development and Reform Commission and the Bureau of Landscape and Greening took the lead in coordinating and overseeing the construction work in the greenbelt zones. The Beijing Bureau of Landscape and Greening focused on concrete implementation, while they emphasized the need for cooperation and collaboration among various departments. The policy also clarified the responsibility of district governments as the main entities responsible for greenbelt zone construction and established corresponding organizational leadership structures to ensure the effective implementation of the policies.
In Model 3 of Table 8, it is shown that during the preparation for the Beijing Summer Olympics (2001–2008), the 1st Greenbelt Zone had a slightly negative effect on NDVI improvement. This means that in the first ten years of implementing the 1st Greenbelt Policy, instead of increasing the local vegetation NDVI value, it resulted in a reduction of green areas. There are several possible reasons. Firstly, it was mentioned that the construction of greenbelt zones is not only aimed at improving the ecological environment but also serves the goal of promoting urbanization in the urban–rural fringe areas. During the implementation of the greenbelt policy, local infrastructure construction, old village renovation, and improvement of living conditions for rural residents were carried out simultaneously. Particularly, in the process, some farmland and green spaces were converted into construction land for the development of commercial buildings. Secondly, during the period from 2000 to 2008, the expansion of Beijing’s urban area exceeded the government’s expectations. In this period, a large number of migrants moved to Beijing. The actual migrant population in 2000 was 3.82 million, and by 2005, the migrant population reached 3.57 million. People from all over the country were attracted by the employment opportunities in the big city, and providing sufficient living space and job opportunities for these migrants became a major challenge. As the urban area of Beijing was already densely populated, the only option was to expand towards rural areas, and naturally, the urban–rural fringe areas where the 1st Greenbelt Zone was located became the main areas to accommodate Beijing’s urban expansion.
The government needed funds to construct the greenbelt zones, and as the wave of urban expansion spread to these areas, land transfer became a solution to address the aforementioned challenges. The government sold land to developers to raise funds for relocating local farmers and for the construction of greenbelts. However, the reality is that both the government and developers are often more interested in the development of construction land. Looking back to the present day in 2023, the 1st Greenbelt Zone is now part of the central urban area of Beijing, characterized by economic prosperity and a high concentration of population. During the period from 2000 to 2008, although the greenbelt policies achieved certain results in terms of afforestation, they also led to a significant sacrifice of green spaces, with a considerable expansion of construction land. Additionally, the illegal construction of villages and towns, along with insufficient regulatory enforcement, has further reduced the green areas in the 1st Greenbelt Zone.

5.2. Mixed Outcomes from the Implementation of the 2nd Greenbelt Policy

Based on the results from Table 8, the estimated coefficients of the 2nd Greenbelt Policy are all negative, indicating that the implementation of this policy has had a negative impact on NDVI changes. The policy’s execution has not been ideal and has failed to achieve its intended goals. The reasons for this are as follows: Firstly, the 2nd Greenbelt Policy has not undergone updates since its implementation. The outdated policy content and lack of implementation incentives have made it difficult to meet current needs. For instance, the compensation and maintenance standards for the trees in the 2nd Greenbelt Zone are still based on those from 2003, which hinders the possibility of attracting social capital investment. Secondly, in recent years, with the acceleration of urbanization and improvements in transportation conditions, the 2nd Greenbelt Zone has gradually become a focus of urban development and construction. As shown in Figure 7, most implementation units in the 2nd Greenbelt Zone are located within the 6th Ring Road of Beijing. Along with urbanization, the central urban area has expanded, and the 2nd Greenbelt Zone has gradually transformed into new urban—rural integration zones. These developments have led to an increase in the population size and the proliferation of illegal constructions in the 2nd Greenbelt Zone, resulting in a phenomenon where there is “no available land for greening” in the current state of the 2nd Greenbelt Zone.
During the preparation for the 2008 Summer Olympics, the impact coefficient of the 2nd Greenbelt Policy shows a positive effect. According to the results from Model III in Table 8, the implementation of the 2nd Greenbelt Policy led to an increase of 0.013 units in NDVI for the districts. The reasons for this are as follows: Firstly, from 2001 to 2008, it was a period when significant efforts were made to construct the 1st Greenbelt Zone, and the primary focus for land allocation was still on the 1st Greenbelt Zone. Therefore, during this time, there were not many construction activities and illegal structures in the 2nd Greenbelt Zone. Secondly, the 2nd Greenbelt Policy was officially released in 2003. At the beginning of policy implementation, the supervisory effect was relatively strong, and the government would inevitably invest resources to strengthen the construction. Additionally, in order to fulfill the commitment made to the International Olympic Committee in terms of greening targets, it was reasonable to expect an increase in the NDVI of the 2nd Greenbelt Zone during this period.

5.3. Contribution of Other Related Factors in NDVI Changes in Beijing

Overall, annual average land surface temperature and precipitation have a significant correlation with NDVI changes. According to the results from Table 8, an increase in annual average land surface temperature leads to a decrease in the NDVI, indicating a negative relationship between the two. On the other hand, annual precipitation shows a positive relationship with NDVI changes. The coefficient for annual average land surface temperature is higher than that of precipitation. Previous ecological studies have shown that the relationship between the NDVI and climate varies across different regions. However, the regression model presented in this study reflects the average effect, representing the overall average level for the districts in Beijing. By examining the variations in the affected units, it can be observed that the influence of land surface temperature and precipitation on the NDVI is much smaller compared with the implementation of greening policies (1st and 2nd Greenbelt Policies and the 2008 Summer Olympics). This indicates that the main reason for the increase in the NDVI in greenbelt areas in recent years is the implementation of these policies.
Over the past 20 years, the population density in Beijing has shown a positive impact on the changes in the NDVI. Generally, as cities expand, the concentration of population increases. To accommodate the influx of population, cities tend to expand and increase the amount of built-up land, leading to an increase in building density. Consequently, a higher population density usually has a negative impact on vegetation. However, as the economy and society develop, when cities reach an advanced stage of development, the government tends to focus on the urban ecological environment and implement a series of environmental protection measures. This leads to increased investment in urban greening to meet the residents’ demand for a high-quality living environment. During the period from 2001 to 2008, a large influx of population occurred in the downtown urban area of Beijing, leading to a decrease in the NDVI across this region. In recent years, Beijing has undertaken a series of measures to enhance the level of urban greening, expand green spaces, and beautify the ecological landscape. These measures include promoting rooftop greening of public buildings, vertical greening of overpasses, and constructing small- and microparks, among others, to meet the residents’ urgent demand for an ecological city. Therefore, the increase in population density caused by urbanization may initially lead to a decrease in the local NDVI. However, with the implementation of various greening measures, the NDVI may later rebound and increase as the urban greening level improves. These two phases have been reflected in the changes in the NDVI within the 6th Ring Road in Beijing, as shown in Figure 2, which shows a slight annual decrease before 2012 and an annual increase after 2012.

6. Conclusions

This study evaluates the outcomes and performance of the 1st and 2nd Greenbelt Policies in Beijing using long-term satellite observations of the NDVI, land surface temperature, precipitation, and night-light from 2000 to 2020. It employs regression trend analysis to explore the spatio-temporal variabilities in NDVI in Beijing. Fixed effects regression models are designed to quantify the influencing factors of the NDVI and explore the mechanism of the impacts of greenbelt policies on the greenery changes in Beijing. The main conclusions are as follows:
(1) From 2000 to 2020, the overall NDVI in Beijing exhibited an upward trend, with the proportion of high-NDVI (>0.8) areas increasing from 26.18% in 2000 to 53.64% in 2020. The proportion of low-NDVI (<0.2) areas continued to decrease to 0.2% in 2020. The area with improving trends accounts for 75.21% of the entire area of Beijing, indicating a significant improvement in vegetation coverage.
(2) Spatial analysis reveals a circular variation pattern of the NDVI in Beijing, which gradually increases from the center to the outskirts. The outskirt mountainous areas have a higher NDVI compared with the eastern plain and central urban areas. High-NDVI regions are mainly distributed in the northeastern, northwestern, and southwestern mountainous areas of Beijing. The area within the 6th Ring Road, the 1st Greenbelt Zone, and the core urban area of Beijing show more evident vegetation improvement, indicating a notable policy effect and evident vegetation improvement. However, in the areas where the 2nd Greenbelt Policy is implemented, vegetation predominantly exhibited a deteriorating trend. A considerable part of the region experienced a decrease in greenery over the past two decades.
(3) The implementation of the 1st Greenbelt Policy led to an average increase of 0.296 units in NDVI for districts in Beijing over the past two decades. The implementation of the 2nd Greenbelt Policy accelerated the degradation of the NDVI for districts in Beijing over the past two decades. During the preparation for the 2008 Summer Olympics, while the 1st Greenbelt Zone had a slightly negative effect on NDVI improvement, probably due to urban re-construction, the 2nd Greenbelt Zone shows a significant positive effect, leading to an increase of 0.013 units in the NDVI for the urban districts.
This study highlights the importance of long-term satellite observations for evaluating the performance of greenbelt policies in Beijing. The evaluation approach developed in this study can be applied to similar cities globally. A comparison of the research results among global cities will shed light on the similarities and differences when implementing greenbelt policies globally. However, one limitation of this study is that the regression method is not able to fully disentangle the impacts of different climatic variables and urban greening policies. As urban regions are experiencing fast warming under climate change, the joint effects of climate change and greening policies need more future investigations.

Author Contributions

Conceptualization, F.-Y.G.; methodology, F.-Y.G. and C.W.; software, C.W.; validation, F.-Y.G. and C.W.; formal analysis, F.-Y.G. and C.W.; investigation, F.-Y.G. and C.W.; resources, F.-Y.G. and C.W.; data curation, F.-Y.G. and C.W.; writing—original draft preparation, F.-Y.G. and C.W.; writing—review and editing, F.-Y.G.; visualization, F.-Y.G. and C.W.; supervision, F.-Y.G.; project administration, F.-Y.G.; funding acquisition, F.-Y.G. All authors have read and agreed to the published version of the manuscript.

Funding

This work was supported by National Natural Science Foundation of China (Grant No. 42301477), and the Humanities and Social Science Fund of Ministry of Education (Grant No. 22YJCZH034). This research was supported by Public Computing Cloud, Renmin University of China (PCC@RUC).

Data Availability Statement

The NDVI data are available from https://lpdaac.usgs.gov/products/mod13q1v006/ (accessed on 1 June 2023); The Land Surface Temperature data are available from https://lpdaac.usgs.gov/products/mod11a1v006/ (accessed on 1 June 2023); The precipitation data are available from https://www.chc.ucsb.edu/data/chirps (accessed on 1 June 2023); The night-light index data are available from https://cstr.cn/18406.11.Socioeco.tpdc.271202 (accessed on 1 June 2023); The world population data are available from https://hub.worldpop.org/doi/10.5258/SOTON/WP00674 (accessed on 1 June 2023). These datasets are also available from the corresponding author upon request.

Acknowledgments

The authors wish to give special thanks to the two reviewers for their valuable comments and suggestions that help to improve our research.

Conflicts of Interest

The authors declare no conflict of interest.

References

  1. Zhou, Y. Understanding urban plant phenology for sustainable cities and planet. Nat. Clim. Chang. 2022, 12, 302–304. [Google Scholar] [CrossRef]
  2. Bowler, D.E.; Buyung-Ali, L.; Knight, T.M.; Pullin, A.S. Urban greening to cool towns and cities: A systematic review of the empirical evidence. Landsc. Urban Plan. 2010, 97, 147–155. [Google Scholar] [CrossRef]
  3. Li, F.; Wang, R.; Paulussen, J.; Liu, X. Comprehensive concept planning of urban greening based on ecological principles: A case study in Beijing, China. Landsc. Urban Plan. 2005, 72, 325–336. [Google Scholar] [CrossRef]
  4. Nowak, D.J.; Crane, D.E.; Stevens, J.C. Air pollution removal by urban trees and shrubs in the United States. Urban For. Urban Green. 2006, 4, 115–123. [Google Scholar] [CrossRef]
  5. Nowak, D.J. Atmospheric carbon reduction by urban trees. J. Environ. Manag. 1993, 37, 207–217. [Google Scholar] [CrossRef]
  6. Eisenman, T.S.; Churkina, G.; Jariwala, S.P.; Kumar, P.; Lovasi, G.S.; Pataki, D.E.; Weinberger, K.R.; Whitlow, T.H. Urban trees, air quality, and asthma: An interdisciplinary review. Landsc. Urban Plan. 2019, 187, 47–59. [Google Scholar] [CrossRef]
  7. Zhang, W.; Yang, J.; Ma, L.; Huang, C. Factors affecting the use of urban green spaces for physical activities: Views of young urban residents in Beijing. Urban For. Urban Green. 2015, 14, 851–857. [Google Scholar] [CrossRef]
  8. Ma, M.; Jin, Y. What if Beijing had enforced the 1st or 2nd greenbelt?–Analyses from an economic perspective. Landsc. Urban Plan. 2019, 182, 79–91. [Google Scholar] [CrossRef]
  9. Yang, J.; Zhou, J. The failure and success of greenbelt program in Beijing. Urban For. Urban Green. 2007, 6, 287–296. [Google Scholar] [CrossRef]
  10. Cao, W.; Wu, D.; Huang, L.; Pan, M.; Huhe, T. Determinizing the contributions of human activities and climate change on greening in the Beijing–Tianjin–Hebei Region, China. Sci. Rep. 2021, 11, 21201. [Google Scholar] [CrossRef]
  11. Zhang, Y.H.; Yin, P.Y.; Li, X.C.; Niu, Q.D.; Wang, Y.X.; Cao, W.T.; Huang, J.X.; Chen, H.; Yao, X.C.; Yu, L.; et al. The divergent response of vegetation phenology to urbanization: A case study of Beijing city, China. Sci. Total Environ. 2022, 803, 150079. [Google Scholar] [CrossRef] [PubMed]
  12. Xie, S.; Liu, L.; Zhang, X.; Yang, J. Mapping the annual dynamics of land cover in Beijing from 2001 to 2020 using Landsat dense time series stack. ISPRS J. Photogramm. Remote Sens. 2022, 185, 201–218. [Google Scholar] [CrossRef]
  13. Huang, H.; Chen, Y.; Clinton, N.; Wang, J.; Wang, X.; Liu, C.; Gong, P.; Yang, J.; Bai, Y.; Zheng, Y.; et al. Mapping major land cover dynamics in Beijing using all Landsat images in Google Earth Engine. Remote Sens. Environ. 2017, 202, 166–176. [Google Scholar] [CrossRef]
  14. Holben, B.N. Characteristics of maximum-value composite images from temporal AVHRR data. Int. J. Remote Sens. 1986, 7, 1417–1434. [Google Scholar] [CrossRef]
  15. Li, S.; Xu, L.; Jing, Y.; Yin, H.; Li, X.; Guan, X. High-quality vegetation index product generation: A review of NDVI time series reconstruction techniques. Int. J. Appl. Earth Obs. Geoinf. 2021, 105, 102640. [Google Scholar] [CrossRef]
  16. Carreiras, J.M.B.; Pereira, J.M.C.; Shimabukuro, Y.E.; Stroppiana, D. Evaluation of compositing algorithms over the Brazilian Amazon using SPOT-4 VEGETATION data. Int. J. Remote Sens. 2003, 24, 3427–3440. [Google Scholar] [CrossRef]
  17. Fu, W.; Lü, Y.; Harris, P.; Comber, A.; Wu, L. Peri-urbanization may vary with vegetation restoration: A large scale regional analysis. Urban For. Urban Green. 2018, 29, 77–87. [Google Scholar] [CrossRef]
  18. Li, D.; Wu, S.; Liang, Z.; Li, S. The impacts of urbanization and climate change on urban vegetation dynamics in China. Urban For. Urban Green. 2020, 54, 126764. [Google Scholar] [CrossRef]
  19. Stow, D.; Daeschner, S.; Hope, A.; Douglas, D.; Petersen, A.; Myneni, R.; Zhou, L.; Oechel, W. Variability of the seasonally integrated normalized difference vegetation index across the north slope of Alaska in the 1990s. Int. J. Remote Sens. 2003, 24, 1111–1117. [Google Scholar] [CrossRef]
  20. Zhou, W.; Wang, J.; Qian, Y.; Pickett, S.T.; Li, W.; Han, L. The rapid but “invisible” changes in urban greenspace: A comparative study of nine Chinese cities. Sci. Total Environ. 2018, 627, 1572–1584. [Google Scholar] [CrossRef]
  21. Qian, Y.; Zhou, W.; Li, W.; Han, L. Understanding the dynamic of greenspace in the urbanized area of Beijing based on high resolution satellite images. Urban For. Urban Green. 2015, 14, 39–47. [Google Scholar] [CrossRef]
  22. Bengston, D.N.; Youn, Y.C. Urban containment policies and the protection of natural areas: The case of Seoul’s greenbelt. Ecol. Soc. 2006, 11, 3. [Google Scholar] [CrossRef]
  23. Zhang, S.; Liu, J.; Song, C.; Chan, C.S.; Pei, T.; Wenting, Y.; Xin, Z. Spatial-temporal distribution characteristics and evolution mechanism of urban parks in Beijing, China. Urban For. Urban Green. 2021, 64, 127265. [Google Scholar] [CrossRef]
  24. Liu, C.; Liu, J.; Zhang, Q.; Ci, H.; Gu, X.; Gulakhmadov, A. Attribution of NDVI Dynamics over the Globe from 1982 to 2015. Remote Sens. 2022, 14, 2706. [Google Scholar] [CrossRef]
  25. Beijing Municipal Government. No. 7 The Approval from Beijing Municipal Government on the Proposal from Beijing Municipal Commission Regarding Designation of the Greenbelt; Pub. L. No. Jingzhengfa (7); Beijing Municipal Government: Beijing, China, 1994.
  26. Beijing Municipal Government. No. 7 Opinions on Accelerating the Construction of Green Belt Areas in Beijing; Pub. L. No. Jingzhengfa (12); Beijing Municipal Government: Beijing, China, 2000.
  27. Beijing Municipal Government. No. 15 The Approavel from Beijing Municipal Government on the Proposal of Establishing the Second Greenbelt; Pub. L. No. Jingzhenghan (15); Beijing Municipal Government: Beijing, China, 2003.
  28. Huete, A.; Didan, K.; Miura, T.; Rodriguez, E.P.; Gao, X.; Ferreira, L.G. Overview of the radiometric and biophysical performance of the MODIS vegetation indices. Remote Sens. Environ. 2002, 83, 195–213. [Google Scholar] [CrossRef]
  29. Buyantuyev, A.; Wu, J.G. Urbanization alters spatiotemporal patterns of ecosystem primary production: A case study of the Phoenix metropolitan region, USA. J. Arid Environ. 2009, 73, 512–520. [Google Scholar] [CrossRef]
  30. Viovy, N.; Arino, O.; Belward, A.S. The best index slope extraction (BISE)—A method for reducing noise in NDVI time-series. Int. J. Remote Sens. 1992, 13, 1585–1590. [Google Scholar] [CrossRef]
  31. Julien, Y.; Sobrino, J.A.; Verhoef, W. Changes in land surface temperatures and NDVI values over Europe between 1982 and 1999. Remote Sens. Environ. 2006, 103, 43–55. [Google Scholar] [CrossRef]
  32. Karnieli, A.; Agam, N.; Pinker, R.T.; Anderson, M.; Imhoff, M.L.; Gutman, G.G.; Panov, N.; Goldberg, A. Use of NDVI and land surface temperature for drought assessment: Merits and limitations. J. Clim. 2010, 23, 618–633. [Google Scholar] [CrossRef]
  33. Funk, C.C.; Peterson, P.J.; Landsfeld, M.F.; Pedreros, D.H.; Verdin, J.P.; Rowland, J.D.; Romero, B.E.; Husak, G.J.; Michaelsen, J.C.; Verdin, A.P. A Quasi-Global Precipitation Time Series for Drought Monitoring; U.S. Geological Survey Data Series 832; U.S. Geological Survey: Reston, VA, USA, 2014; 4p. Available online: http://pubs.usgs.gov/ds/832/ (accessed on 1 June 2023).
  34. Funk, C.; Peterson, P.; Landsfeld, M.; Pedreros, D.; Verdin, J.; Shukla, S.; Husak, G.; Rowland, J.; Harrison, L.; Hoell, A.; et al. The climate hazards infrared precipitation with stations—A new environmental record for monitoring extremes. Sci. Data 2015, 2, 150066. [Google Scholar] [CrossRef]
  35. Gao, F.; Zhang, Y.; Ren, X.; Yao, Y.; Hao, Z.; Cai, W. Evaluation of CHIRPS and its application for drought monitoring over the Haihe River Basin, China. Nat. Hazards 2018, 92, 155–172. [Google Scholar] [CrossRef]
  36. Zhang, L.; Ren, Z.; Chen, B.; Gong, P.; Fu, H.; Xu, B. A Prolonged Artificial Nighttime-light Dataset of China (1984–2020). National Tibetan Plateau Data Center 2021. Available online: https://cstr.cn/18406.11.Socioeco.tpdc.271202 (accessed on 1 June 2023).
  37. WorldPop (www.worldpop.org—School of Geography and Environmental Science, University of Southampton; Department of Geography and Geosciences, University of Louisville; Departement de Geographie, Universite de Namur) and Center for International Earth Science Information Network (CIESIN), Columbia University 2018. Global High Resolution Population Denominators Project—Funded by The Bill and Melinda Gates Foundation. Available online: https://worldpop.arcgis.com/arcgis/rest/services/WorldPop_Population_Density_1km/ImageServer (accessed on 1 June 2023). [CrossRef]
  38. Wu, J.; Yao, F.; Li, W.; Si, M. VIIRS-based remote sensing estimation of ground-level PM2. 5 concentrations in Beijing–Tianjin–Hebei: A spatiotemporal statistical model. Remote Sens. Environ. 2016, 184, 316–328. [Google Scholar] [CrossRef]
  39. Duncan, J.M.; Dash, J.; Atkinson, P.M. Elucidating the impact of temperature variability and extremes on cereal croplands through remote sensing. Glob. Chang. Biol. 2015, 21, 1541–1551. [Google Scholar] [CrossRef] [PubMed]
  40. Allison, P.D. Fixed Effects Regression Models; SAGE Publications: Thousand Oaks, CA, USA, 2009. [Google Scholar] [CrossRef]
  41. Tu, Y.; Chen, B.; Yang, J.; Xu, B. Olympic effects on reshaping urban greenspace of host cities. Landsc. Urban Plan. 2023, 230, 104615. [Google Scholar] [CrossRef]
  42. Yao, N.; van den Bosch, C.C.K.; Yang, J.; Devisscher, T.; Wirtz, Z.; Jia, L.; Duan, J.; Ma, L. Beijing’s 50 million new urban trees: Strategic governance for large-scale urban afforestation. Urban For. Urban Green. 2019, 44, 126392. [Google Scholar] [CrossRef]
  43. Hausman, J.A. Specification tests in econometrics. Econometrica 1978, 46, 1251–1271. [Google Scholar] [CrossRef]
  44. Krishnaswamy, J.; John, R.; Joseph, S. Consistent response of vegetation dynamics to recent climate change in tropical mountain regions. Glob. Chang. Biol. 2014, 20, 203–215. [Google Scholar] [CrossRef]
  45. Peng, J.; Liu, Z.; Liu, Y.; Wu, J.; Han, Y. Trend analysis of vegetation dynamics in Qinghai–Tibet Plateau using Hurst Exponent. Ecol. Indic. 2012, 14, 28–39. [Google Scholar] [CrossRef]
Figure 1. (a) Maps of districts in Beijing with highlighted districts covering the 1st Greenbelt Zone in dark green and the 2nd Greenbelt Zone in light green; (b) The spatial distribution of the 1st Greenbelt Zone; (c) The spatial distribution of the 2nd Greenbelt Zone.
Remotesensing 15 04766 g001
Figure 2. Trends in NDVI changes in Beijing from 2000 to 2020. The NDVI data are annual mean MODIS NDVI observations derived using maximum value composition method. The NDVI time series for the whole Beijing, the region within the 6th Ring Road, the 1st Greenbelt Zone, and the 2nd Greenbelt Zone are shown.
Remotesensing 15 04766 g002
Figure 3. Spatial maps of NDVI in Beijing for representative years of 2000, 2004, 2008, 2012, 2016, and 2020, color coded into five different classes from low to high with different NDVI ranges. The black lines in (a) indicate the administrative regions of downtown Beijing.
Remotesensing 15 04766 g003
Figure 4. Spatial maps of NDVI within the 6th Ring Road in Beijing for representative years of 2000, 2004, 2008, 2012, 2016, and 2020. The black lines indicate the 1st Greenbelt Zone.
Remotesensing 15 04766 g004aRemotesensing 15 04766 g004b
Figure 5. Spatial maps of NDVI trend slope in unit of NDVI value per year for (a) the whole Beijing region, and (b) the region within the 6th Ring Road. The black lines in (a) indicate the administrative regions of downtown Beijing, and in (b) indicate the 1st Greenbelt Zone. The trend is derived using linear regression using annual NDVI data from 2000 to 2020. Five categories are indicated according to their NDVI trend value ranges.
Remotesensing 15 04766 g005
Figure 6. Spatial maps of the significance of the NDVI trend for (a) the whole Beijing region, and (b) the region within the 6th Ring Road. The black lines in (a) indicate the administrative regions of downtown Beijing, and in (b) indicate the 1st Greenbelt Zone. The significance of trend is based on the p-value calculated from applying linear regression using annual NDVI data from 2000 to 2020. A trend with a p-value less than 0.05 is defined as “significant”, and with a p-value less than 0.01, it is defined as “extremely significant”.
Remotesensing 15 04766 g006
Figure 7. The spatial maps of NDVI trend slope at district level in unit of NDVI value per year for the whole Beijing region. The 1st Greenbelt Zone is highlighted in (a), while the 2nd Greenbelt Zone is highlighted in (b) in black lines. The trend is derived using linear regression using annual NDVI data from 2000 to 2020. Five categories are indicated according to their NDVI trend value ranges.
Remotesensing 15 04766 g007
Table 1. Summary of multi-source datasets used in this study.
VariablesData SourcesTime (Year)Spatial ResolutionLinks or References
NDVIMOD13Q12000–2020250 mhttps://lpdaac.usgs.gov/products/mod13q1v006
(accessed on 1 June 2023)
Land surface temperatureMOD11A12000–20201000 mhttps://lpdaac.usgs.gov/products/mod11a1v006
(accessed on 1 June 2023)
PrecipitationCHIRPS2000–20205000 m[34]
Population
density
WorldPop2000–20201000 m[37]
Night-light indexNational Tibetan Plateau Data Center2000–2020100 m[36]
Table 2. Summary of variables associated with vegetation coverage to evaluate the effects of the 1st and 2nd Greenbelt Policies on the spatio-temporal NDVI changes in Beijing.
VariablesVariable NamesDescription
Dependent VariableNDVIThis indicates the coverage of district vegetation and the growth status of vegetation, with values ranging from −1 to 1. A larger value represents higher district vegetation coverage and better growth.
Key Explanatory Variable1st Greenbelt PolicyThe 49 districts related to the 1st Greenbelt Policy during 2000–2020.
2nd Greenbelt PolicyThe 55 districts related to the 2nd Greenbelt Policy during 2004–2020.
2008 Summer OlympicsAll 331 districts in Beijing during 2001–2008.
Other Related VariablesAnnual LSTThe average surface temperature of each district in Beijing (unit: °C).
Annual PrecipitationThe annual total precipitation for each district in Beijing (unit: millimeters).
Population DensityThe population density per square kilometer for each district in Beijing (unit: number per square kilometer).
Night-Light IndexThe normalized light intensity index of each district in Beijing.
Table 3. Proportional area of different NDVI data ranges in Beijing for representative years.
Year200020042008201220162020
NDVI
−0.1~0.20.64%0.20%0.15%0.24%0.17%0.20%
0.2~0.45.13%4.47%3.98%4.81%4.21%2.64%
0.4~0.610.95%9.11%9.76%12.28%13.04%12.23%
0.6~0.857.09%37.37%33.75%34.58%33.89%31.29%
0.8~1.026.18%48.85%52.35%48.09%48.70%53.64%
Table 4. Same as Table 3, but for areas within the 6th Ring Road in Beijing.
Year200020042008201220162020
NDVI
−0.1~0.21.82%0.46%0.30%0.20%0.28%0.20%
0.2~0.428.25%26.65%24.74%27.27%23.36%12.68%
0.4~0.626.61%31.84%35.06%40.17%41.94%45.81%
0.6~0.834.10%33.90%33.50%28.17%30.43%36.01%
0.8~1.09.23%7.15%6.40%4.19%3.99%5.30%
Table 5. Proportional area of different NDVI trends from 2000 to 2020 for the whole Beijing region and the region within the 6th Ring Road. The NDVI trends for different categories are also indicated.
RegionsWhole Beijing RegionWithin the 6th Ring Road
Categories
Severe degradation
(trend < −0.02/year)
0.28%1.05%
Moderate degradation
(−0.02/year < trend < −0.01/year)
2.45%7.92%
Slight degradation
(−0.01/year < trend < −0.0/year)
22.07%31.10%
Slight improvement
(0.0/year < trend < 0.01/year)
72.67%48.71%
Moderate improvement
(0.01/year < trend < 0.02/year)
2.35%10.34%
Significant improvement
(trend > −0.02/year)
0.19%0.88%
Table 6. Proportional area of different significance level for the NDVI trends from 2000 to 2020 for the whole Beijing region and the region within the 6th Ring Road. The significance of trend is based on the p-value calculated from applying linear regression using annual NDVI data from 2000 to 2020. A trend with a p-value less than 0.05 is defined as “significant”, and with a p-value less than 0.01, it is defined as “extremely significant”.
RegionsWhole Beijing RegionWithin the 6th Ring Road
NDVI Trend
Extremely significant degradation5.56%12.70%
Significant degradation3.32%5.74%
No significant degradation15.06%21.28%
No significant improvement18.89%22.38%
Significant improvement8.68%7.73%
Extremely significant improvement48.48%30.17%
Table 7. Results from multi-collinearity among the independent variables.
VariablesVIF1/VIF
Annual Land Surface Temperature3.450.289920
Annual Precipitation1.400.714479
Population Density2.190.457112
Night-Light Index3.450.289578
1st Greenbelt Policy1.170.858044
2nd Greenbelt Policy1.230.810510
2008 Summer Olympics1.360.733724
Mean VIF2.04
Table 8. Results from fixed effects regression analysis to quantify the implementation effect of the greenbelt policies on the NDVI changes in Beijing. Three different models with varied combinations of variables are presented. The fitted coefficients and the t-test statistics are shown, with significance level indicated by stars. The t-test statistics are in parentheses. For the significance levels, ** p < 0.05, and *** p < 0.01.
Variable NameModel IModel IIModel III
1st Greenbelt Policy0.296 *** 0.291 **
(19.09) (19.96)
2nd Greenbelt Policy −0.021 ***−0.026 ***
(−3.63)(−3.80)
2008 Summer Olympics 0.001
(0.17)
2008 Summer Olympics and 1st Greenbelt Policy −0.023 ***
(−6.66)
2008 Summer Olympics and 2nd Greenbelt Policy 0.013 ***
(3.02)
Annual LST−0.190 ***−0.178 ***−0.184 ***
(−9.29)(−8.88)(−9.28)
Annual Precipitation0.007 ***0.007 ***0.008 ***
(5.43)(5.30)(5.78)
Population density0.012 ***0.011 ***0.011 ***
(14.88)(14.70)(15.19)
Night-Light Index−0.013 ***−0.010 ***−0.009 ***
(−4.80)(−3.71)(−3.18)
Constant0.396 ***0.365 ***0.373 ***
(10.78)(9.98)(10.39)
DistrictYesYesYes
TimeYesYesYes
N695169516951
adj. R20.9750.9750.976
Table 9. Similar to Table 7, but for robustness test for the fixed effects regression model analysis using annual average NDVI instead of annual maximum NDVI. See text for details. For the significance levels, ** p < 0.05, and *** p < 0.01.
Variable NameModel IModel IIModel III
1st Greenbelt Policy0.0831 *** 0.080 **
(19.09) (10.52)
2nd Greenbelt Policy −0.012 ***−0.016 ***
(−3.22)(−3.68)
2008 Summer Olympics 0.029 ***
(9.45)
2008 Summer Olympics and 1st Greenbelt Policy −0.015 ***
(−5.84)
2008 Summer Olympics and 2nd Greenbelt Policy 0.009 ***
(3.90)
Annual LST−0.143 ***−0.136 ***−0.135 ***
(−10.57)(−10.22)(−10.06)
Annual Precipitation0.004 ***0.004 ***0.004 ***
(5.91)(5.78)(6.16)
Population Density0.004 ***0.004 ***0.003 ***
(9.24)(9.01)(8.83)
Night-Light Index−0.006 ***−0.004 ***−0.004 ***
(−3.73)(−2.83)(−2.11)
Constant0.363 ***0.346 ***0.343 ***
(15.58)(15.02)(14.81)
DistrictYesYesYes
TimeYesYesYes
N695169516951
adj. R20.9750.9750.976
Disclaimer/Publisher’s Note: The statements, opinions and data contained in all publications are solely those of the individual author(s) and contributor(s) and not of MDPI and/or the editor(s). MDPI and/or the editor(s) disclaim responsibility for any injury to people or property resulting from any ideas, methods, instructions or products referred to in the content.

