Article

Research on Landslide Trace Recognition by Fusing UAV-Based LiDAR DEM Multi-Feature Information

1
Faculty of Geography, Yunnan Normal University, Kunming 650500, China
2
China Energy Engineering Group, Yunnan Electric Power Design Institute Co., Ltd., Kunming 650051, China
*
Author to whom correspondence should be addressed.
Remote Sens. 2023, 15(19), 4755; https://doi.org/10.3390/rs15194755
Submission received: 25 August 2023 / Revised: 25 September 2023 / Accepted: 27 September 2023 / Published: 28 September 2023
(This article belongs to the Special Issue Lidar for Environmental Remote Sensing: Theory and Application)

Abstract

:
Landslide traces are crucial geomorphological features of landslides. Through the recognition of landslide traces, a better grasp of the topographical features of landslides can be achieved, thereby aiding in the enhancement of capabilities for the prevention, response, and management of landslides. Aiming at the complex topographic features of landslide traces, only using a single DEM product could provide a complete and comprehensive recognition of landslide traces. A method of landslide tracing recognition based on the fusion of multi-feature information from the Unmanned Aerial Vehicle-based Light Detection and Ranging (UAV-based LiDAR) Digital Elevation Model (DEM) is proposed. First, a high-precision DEM is constructed by using the LiDAR point cloud data. Based on the DEM, four multi-feature images that can enhance the landslide geomorphology are generated: hillshading, slope, positive openness, and sky-view factor. Furtherore, the DEM multi-feature images were fused using the Visualization for Archaeological Topography (VAT) method to obtain the DEM Multi-Feature Fusion Image (DEM-DFFI). Finally, the landslide traces were extracted from the DEM-DFFI based on fractal theory. The method presented in this paper makes full use of DEM multi-feature images and fuses them, which can accurately and clearly show the topographic and geomorphological features of landslides. Based on this, it helps improve landslide trace recognition accuracy.

1. Introduction

Landslide traces refer to the marks left on the ground when surface materials slide downward during a landslide event. These traces manifest as cracks, terraces, depressions, and mounds, among other phenomena, on the surface. These areas, compared to the surrounding mountains where no landslides have occurred, are characterized by more fragmented rock and loose structures, thus resulting in lower stability. Under the action of external factors such as earthquakes, rainfall, and human engineering activities, it is easy for landslides to resurrect sliding and destabilizing damages again, leading to the recurrence of disasters that pose a threat to humans [1,2,3,4,5,6]. Therefore, the rapid and efficient recognition of landslide traces holds significant practical importance for geological disaster warning and disaster prevention and mitigation.
DEM can represent the topography of landslide areas, while landslide traces are a type of topography left during the occurrence and development of landslides [7,8]. Currently, the recognition of landslide traces based on DEM images can be mainly categorized into the following three methods: (1) Generating hillshading from DEM: This method involves manually visually interpreting the boundaries and internal traces of landslides by calculating the hillshading using a single light source direction, making it more effective in recognizing a single landslide boundary. Nevertheless, it is affected by the solar elevation angle and azimuth, causing shadows in the landslide area and making it difficult to clearly display the landslide traces, which can impact the interpretation accuracy and precision [9,10]. (2) To avoid the impact of a single light source, landslide trace recognition can be carried out using the Sky-View Factor (SVF). The SVF is not influenced by illumination and can better show the geomorphic features of the landslide and then analyze the morphological structure of the landslide. However, for the micro-geomorphic features inside the landslide, SVF cannot reflect the real topographic features of the landslide [11,12,13]. (3) The use of slope for landslide recognition because, when the landslide occurs, the soil or rock on the mountain will slide downward so that the landslide area significantly differs in slope from the surrounding mountain. Using the slope difference can effectively recognize the landslide area as a whole, but it is not very effective in recognizing the traces inside the landslide [14,15]. The above methods using a single DEM image can only represent a single feature of the landslide, and the recognition accuracy is limited.
In order to better carry out landslide trace recognition, the comprehensive use of DEM multi-feature images for landslide trace recognition shows the characteristics of landslides from different perspectives. The Red Relief Image Map (RRIM) was generated based on positive openness, negative openness, and slope [16,17,18]. This method synthesizes the terrain openness and slope to enhance the display of landslides and, simultaneously, makes the landslide have a three-dimensional display effect and a better display effect on the landslide traces [19,20,21]. However, this method only overlays the two images without fusion processing and relies on manual visual interpretation of landslides, which has certain shortcomings.
In conclusion, the current landslide traces are mainly recognized by manual visual interpretation, and the recognition process is subject to a certain degree of subjectivity. To overcome these problems, this study introduces fractal theory. In landslide research, there is a certain fractal characteristic of similarity between the boundary and the overall shape of a landslide. Additionally, the landslide traces and the overall landslide also exhibit statistical fractal features [22,23,24]. Therefore, this study introduces fractal theory to determine the range of terrain anomalies in landslide traces based on the fractal structure of landslides. It further extracts abnormal values from landslide traces to reduce the influence of subjective factors.
Due to the presence of vegetation cover in landslide areas, optical remote sensing cannot obtain the true topography of the landslide beneath the vegetation. However, UAV-based LiDAR has the capability to penetrate vegetation, allowing for the clear visualization of landslide traces beneath the vegetation cover. This overcomes the problem of vegetation obscuration encountered in optical remote sensing [8,25,26,27]. Furthermore, landslide areas often have complex terrain, and UAV-based LiDAR has the capability to acquire high-precision terrain information, allowing for the collection of accurate elevation data and the generation of DEM for the landslide area. Based on this, this paper utilizes UAV-based LiDAR to obtain point cloud data to generate high-precision DEM and constructs multi-feature images for landslide trace recognition, which can reflect the elevation changes, bumps, and other terrain features of the landslide area. Furthermore, the study combines the DEM multi-feature products to create an image that can display the characteristics of the landslide from a global to a local scale. Leveraging fractal theory, the study then extracts the features of the landslide traces, providing a new approach for the recognition of landslide traces.

2. Study Area and Data

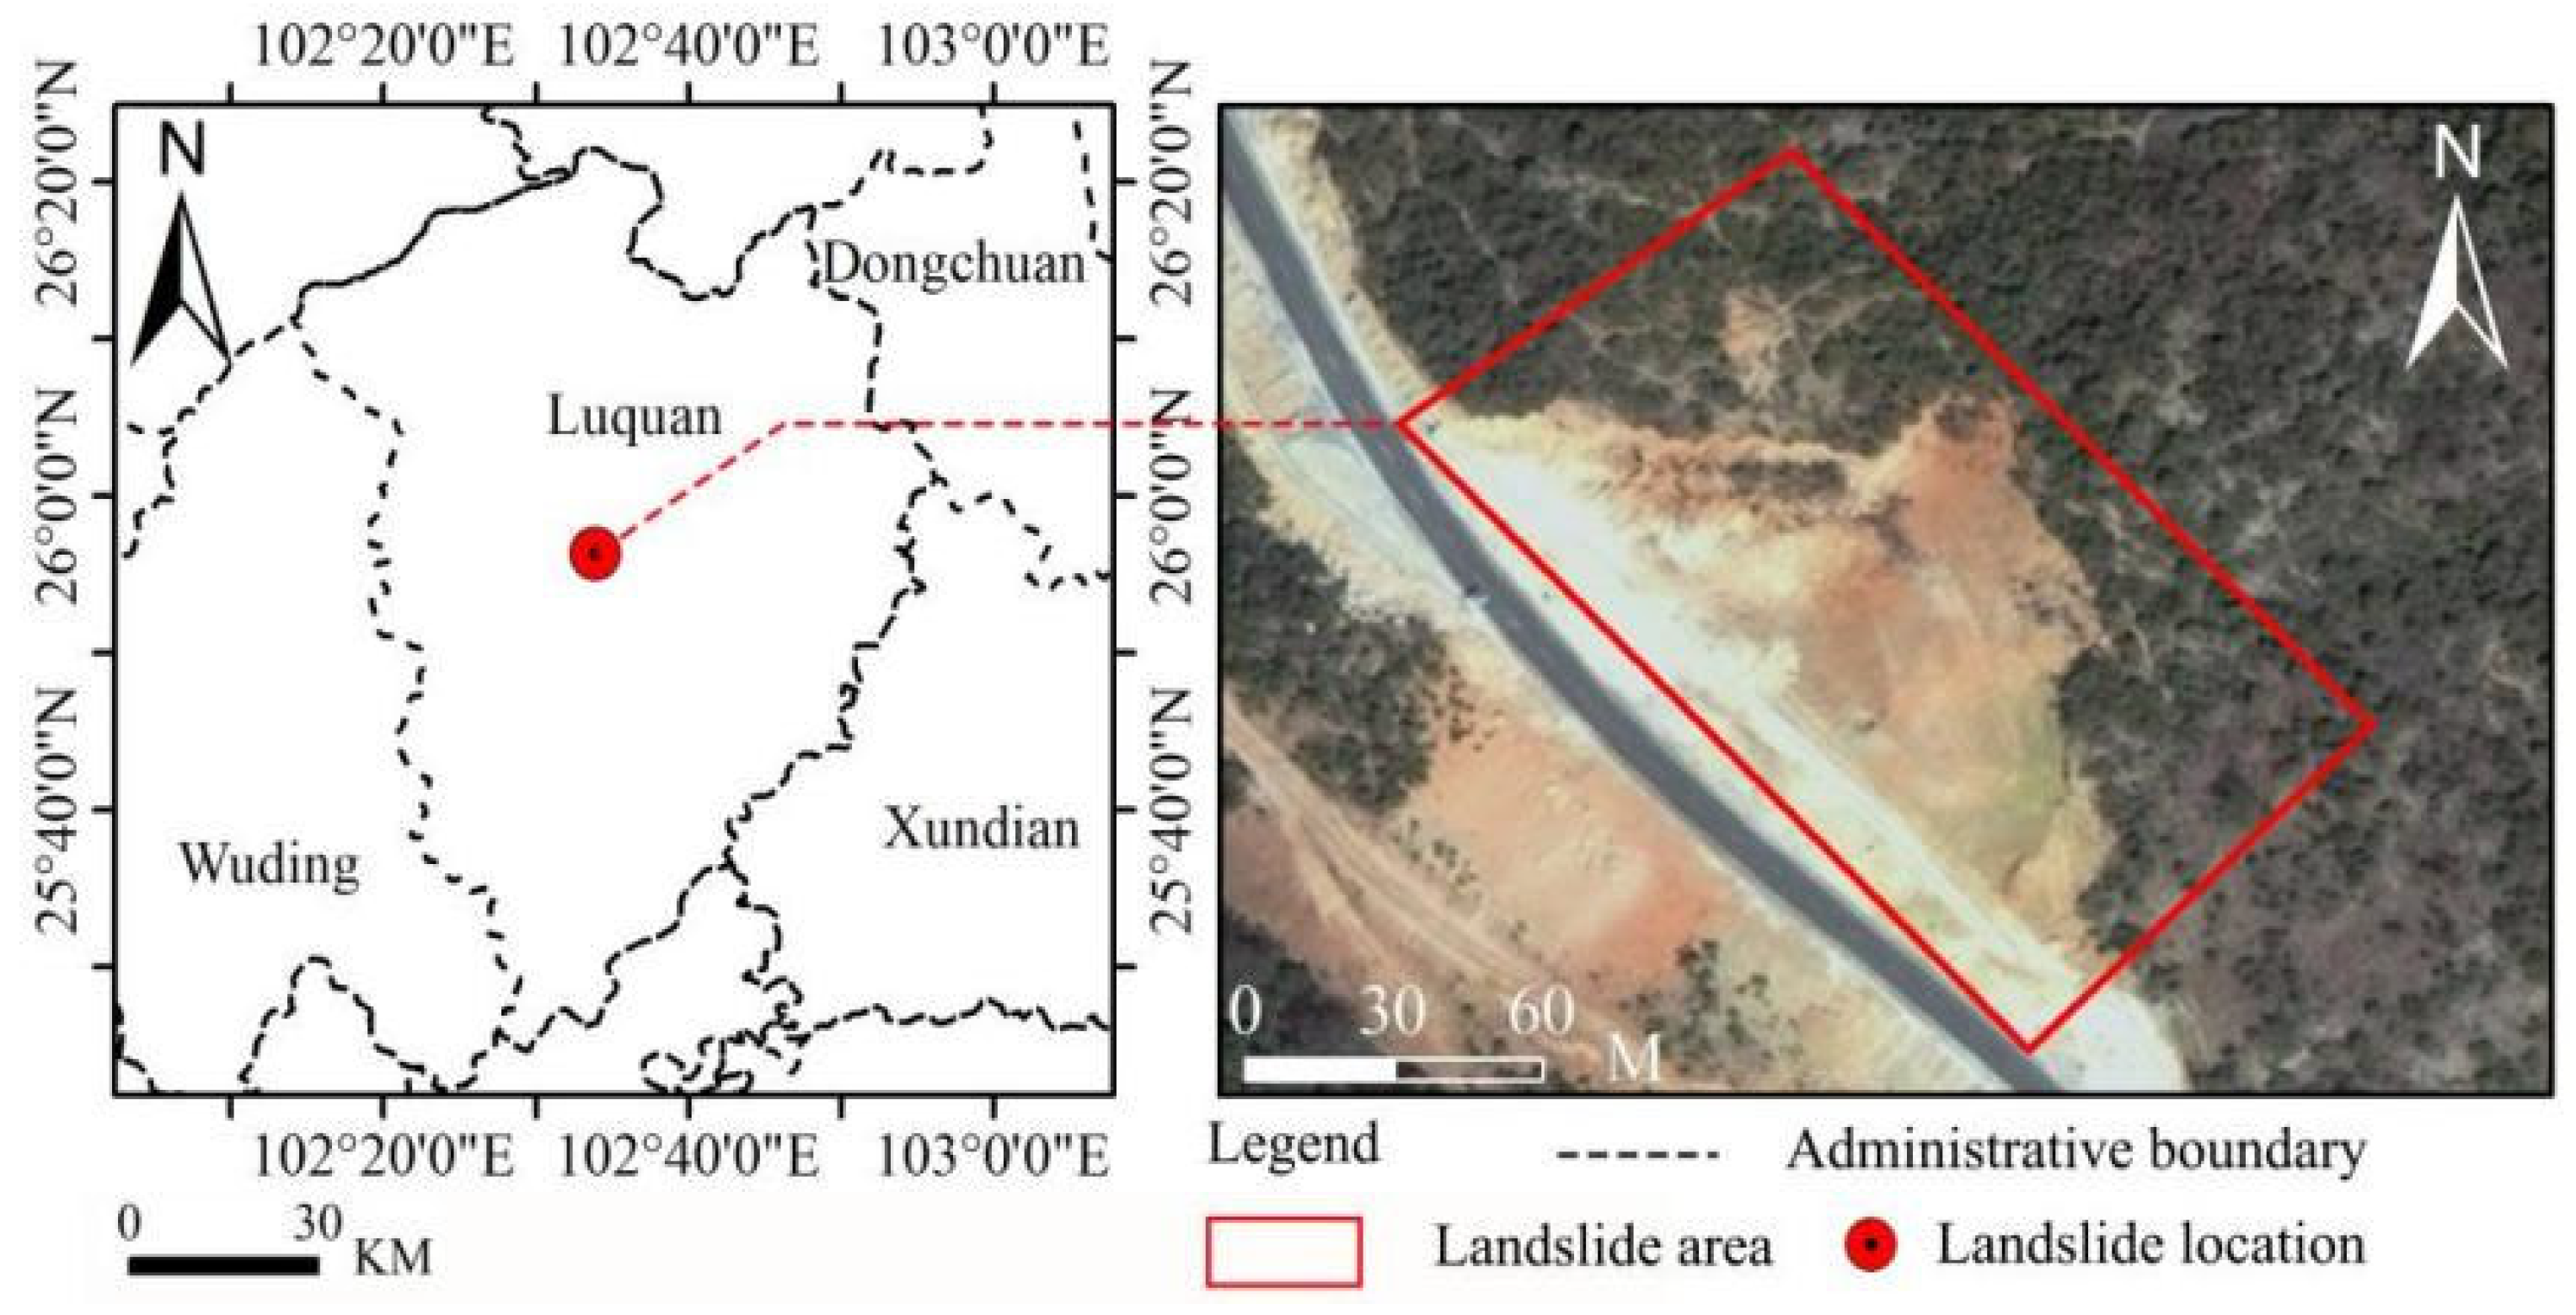
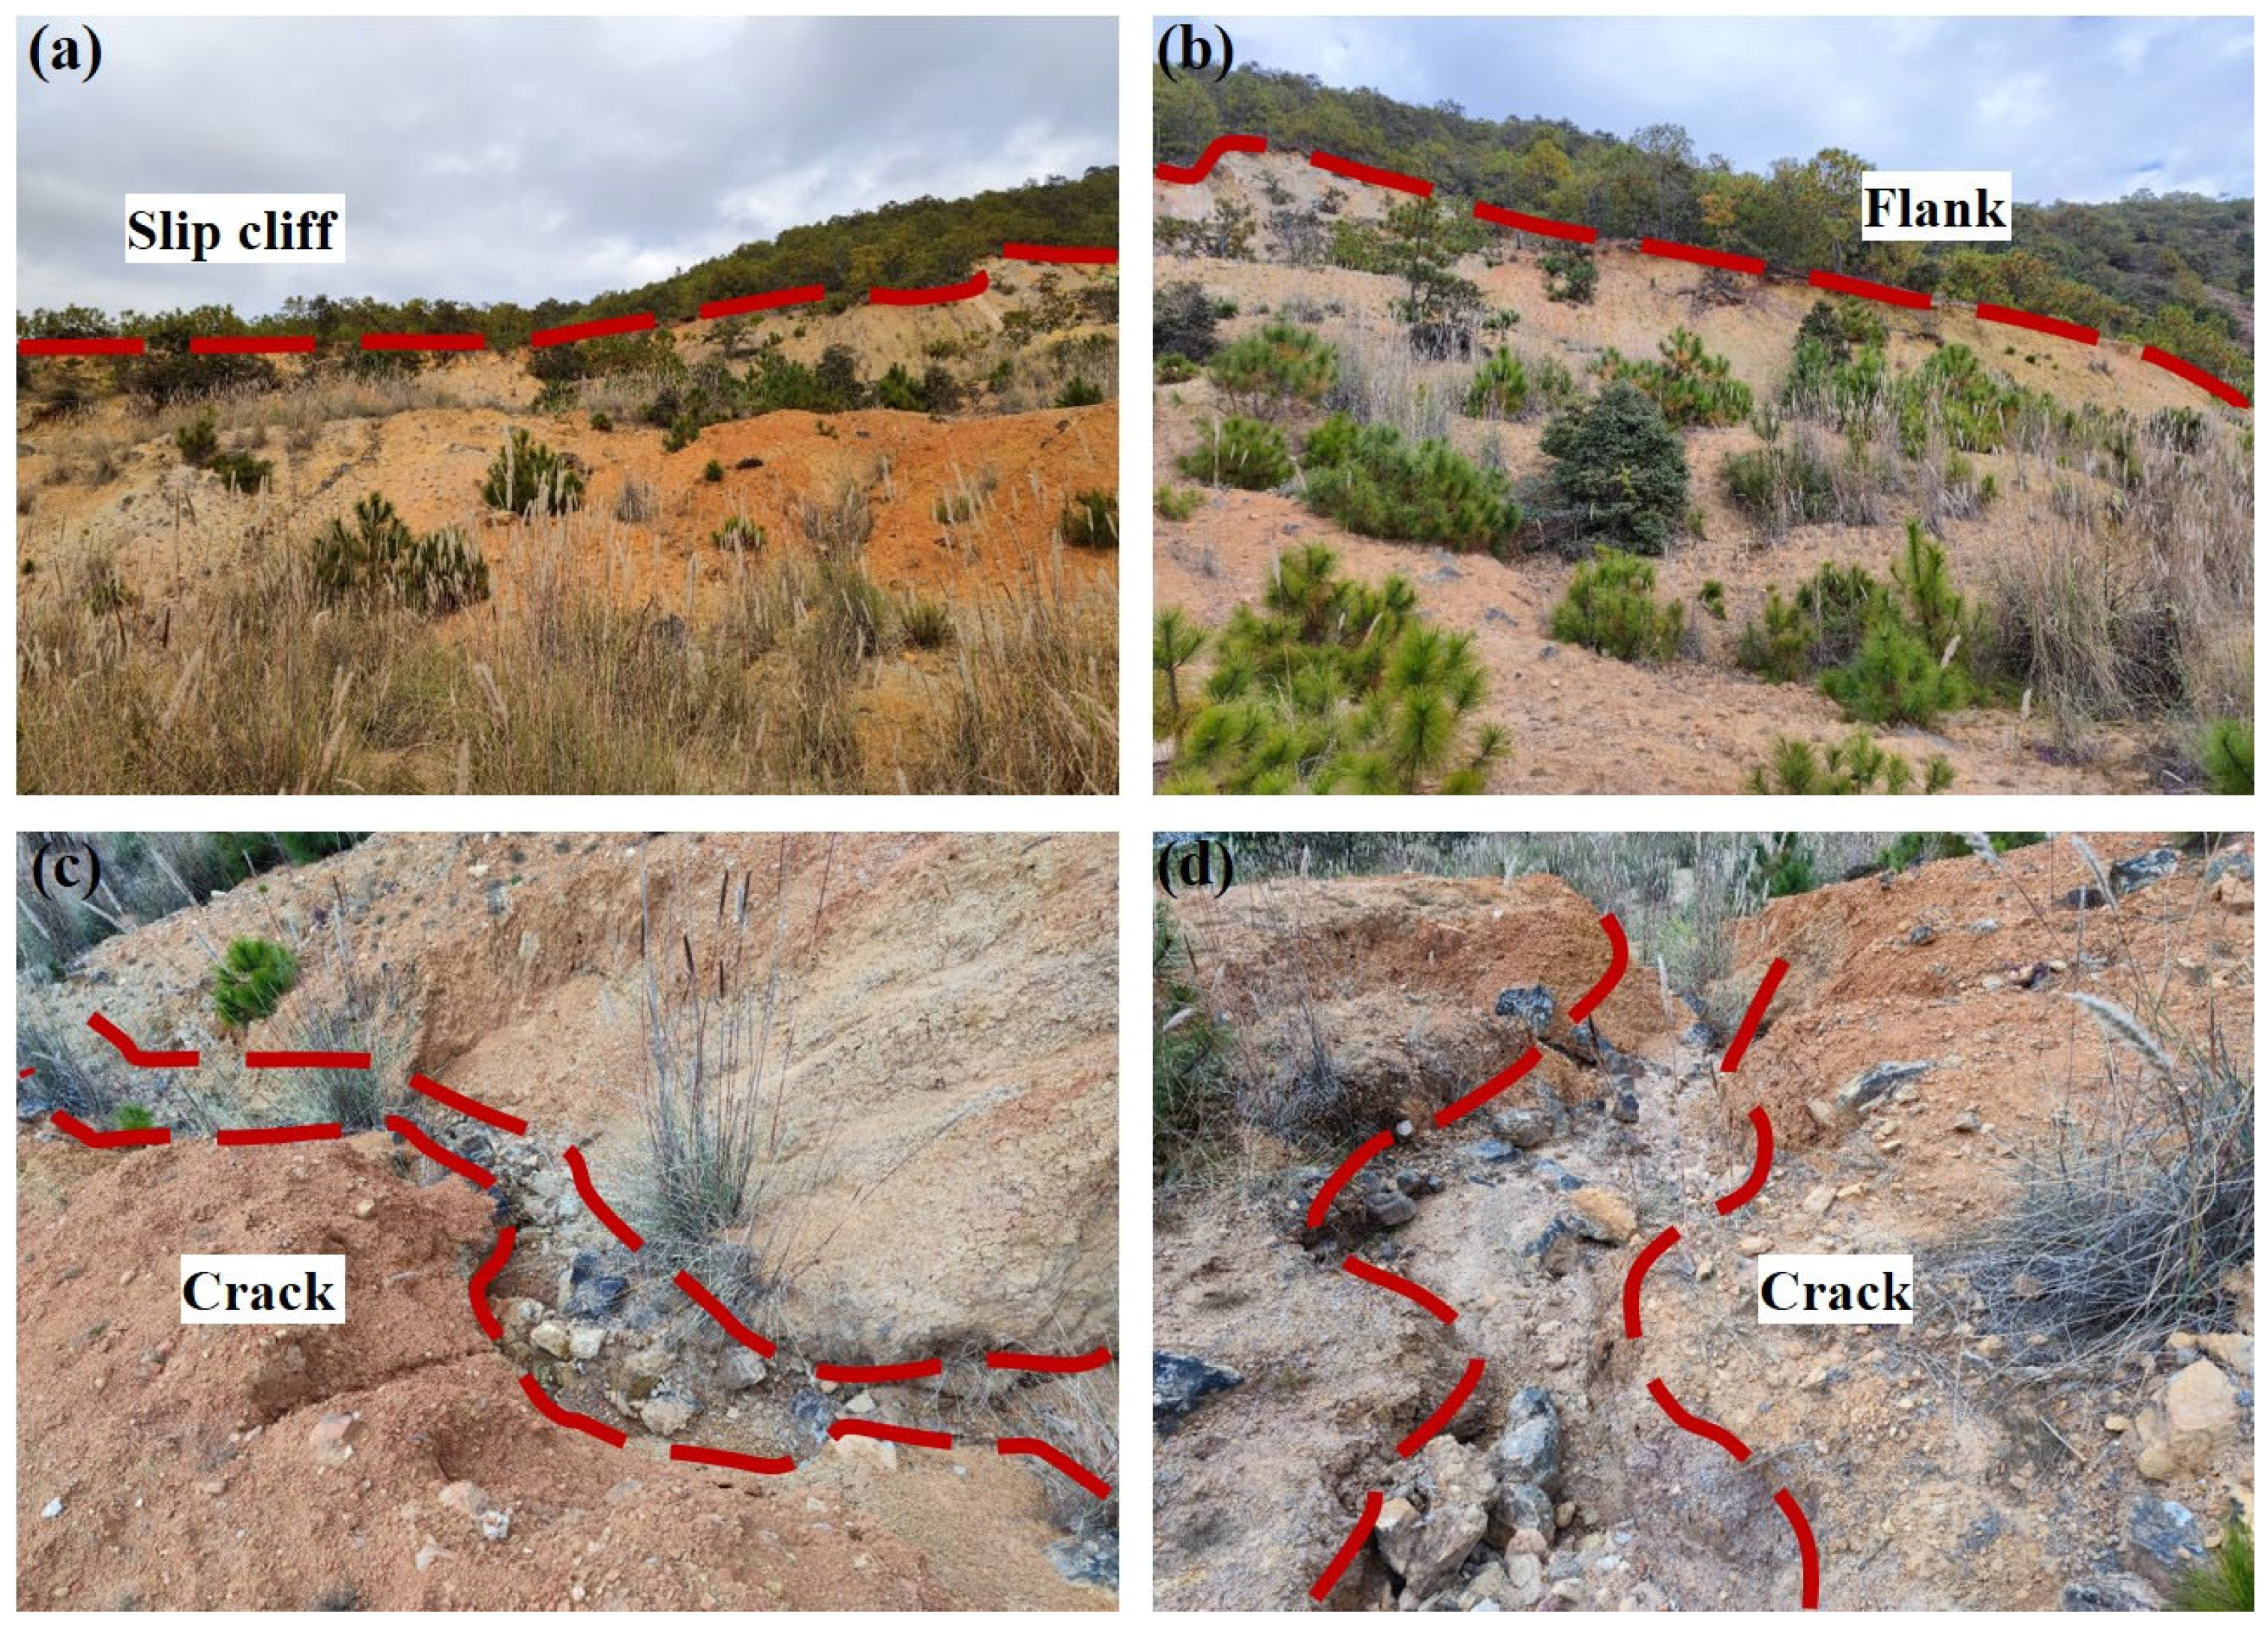
2.1. Overview of the Study Area

The study area of this paper is located beside a highway in Luquan Yi and Miao Autonomous County, Kunming City, Yunnan Province, China, where a landslide occurred (Figure 1). The landslide is approximately 150 m long and 95 m wide, with a height difference of about 50 m. Its overall shape resembles the letter “M”. The landslide’s surface is covered with vegetation and exhibits low shear strength, making it prone to deformations. The top material of the landslide tends to move downward, and there are significant accumulations of debris at the bottom (Figure 2). Due to the abundant annual rainfall in Luquan Yi and Miao Autonomous County, the average annual rainfall is 1000 mm to 1100 mm. The rainfall during the rainy season from May to October can reach 90% of the annual rainfall, of which the rainfall from June to August accounts for 50% to 70% of the annual rainfall. Under the influence of rainfall, the landslide here is extremely easy to slide again, resulting in reduced stability and affecting the safety of the highway, so it is vital to recognize the traces of landslides.

2.2. Data Acquisition and Processing

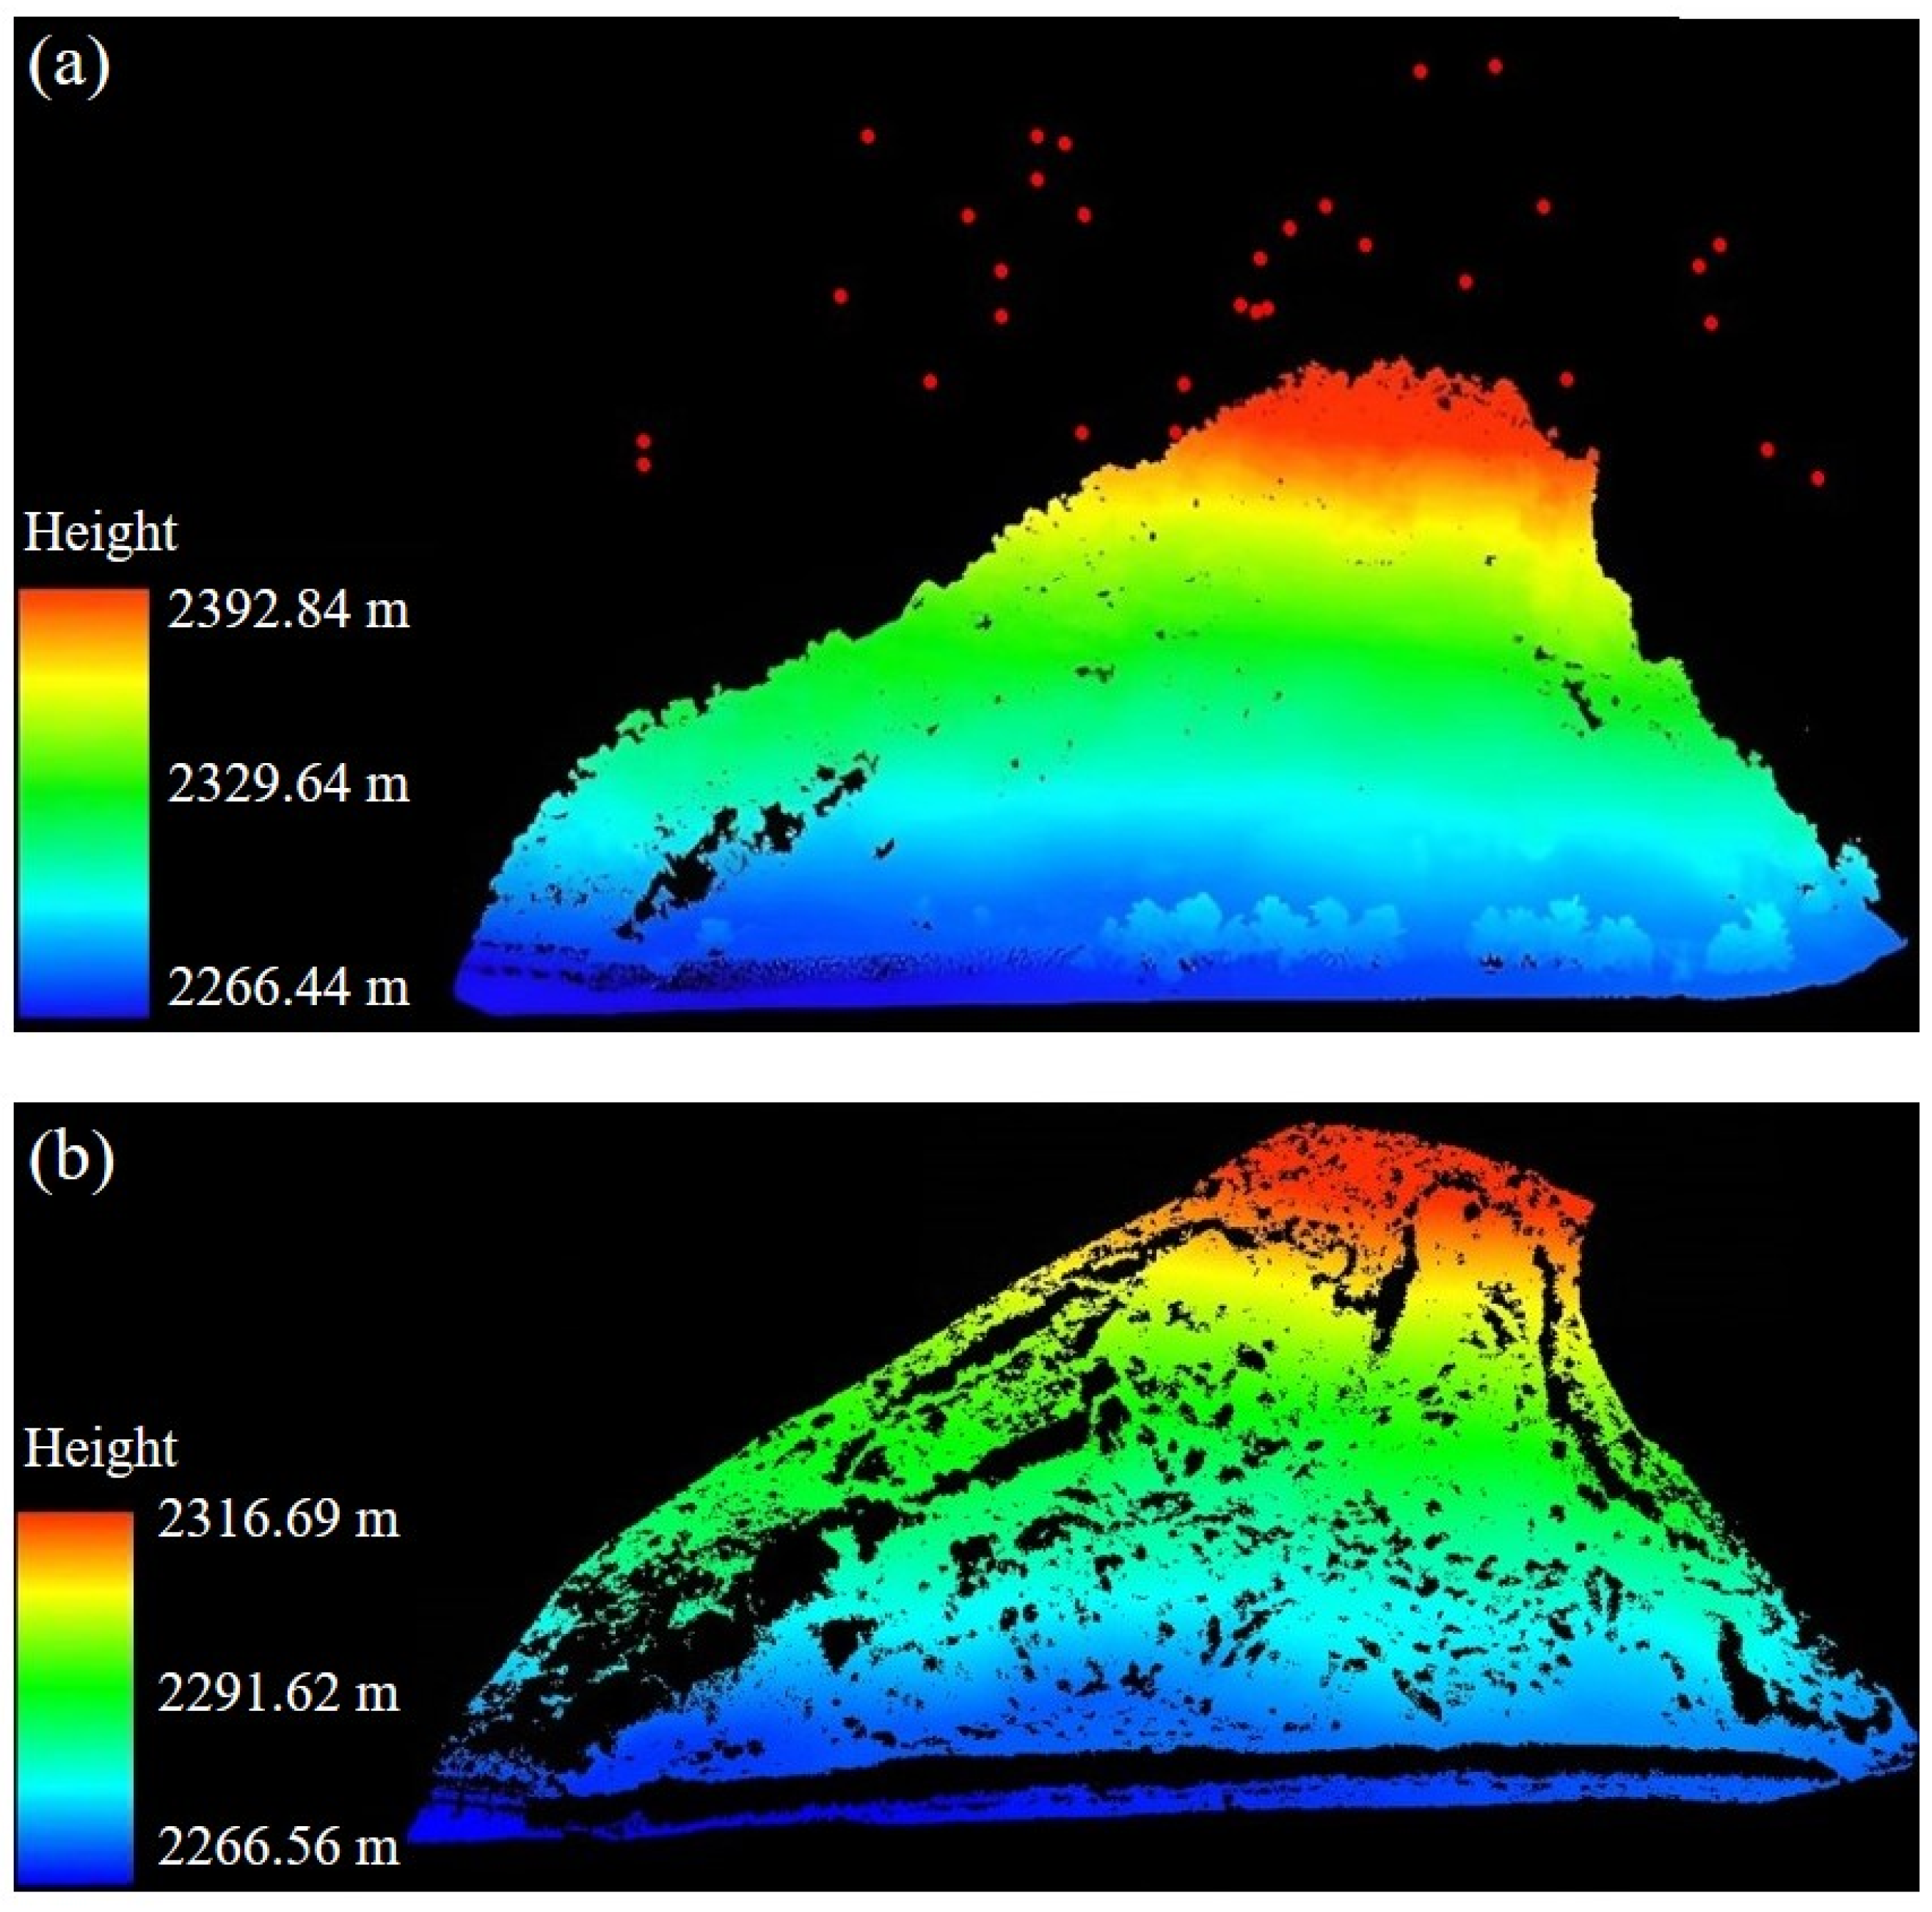
2.2.1. Point Cloud Data Acquisition

The UAV-based LiDAR point cloud data for this study was collected in June 2022 on a clear and windless day. Data was collected using the Feima D2000 unmanned aerial vehicle (UAV) equipped with the D-LiDAR2000 sensor. The specific parameters are shown in Table 1.
The collected original point cloud (Figure 3a) shows that there are high coarse noise points in the original point cloud, so denoising is necessary to improve data quality.
The original point cloud was processed using the Statistical Outlier Removal algorithm [28] for denoising, resulting in a denoised point cloud (Figure 3a). The denoised point cloud was then subjected to the Improved Progressive TIN Densification (IPTD) algorithm [29] to classify ground points, resulting in a ground point cloud (Figure 3b).

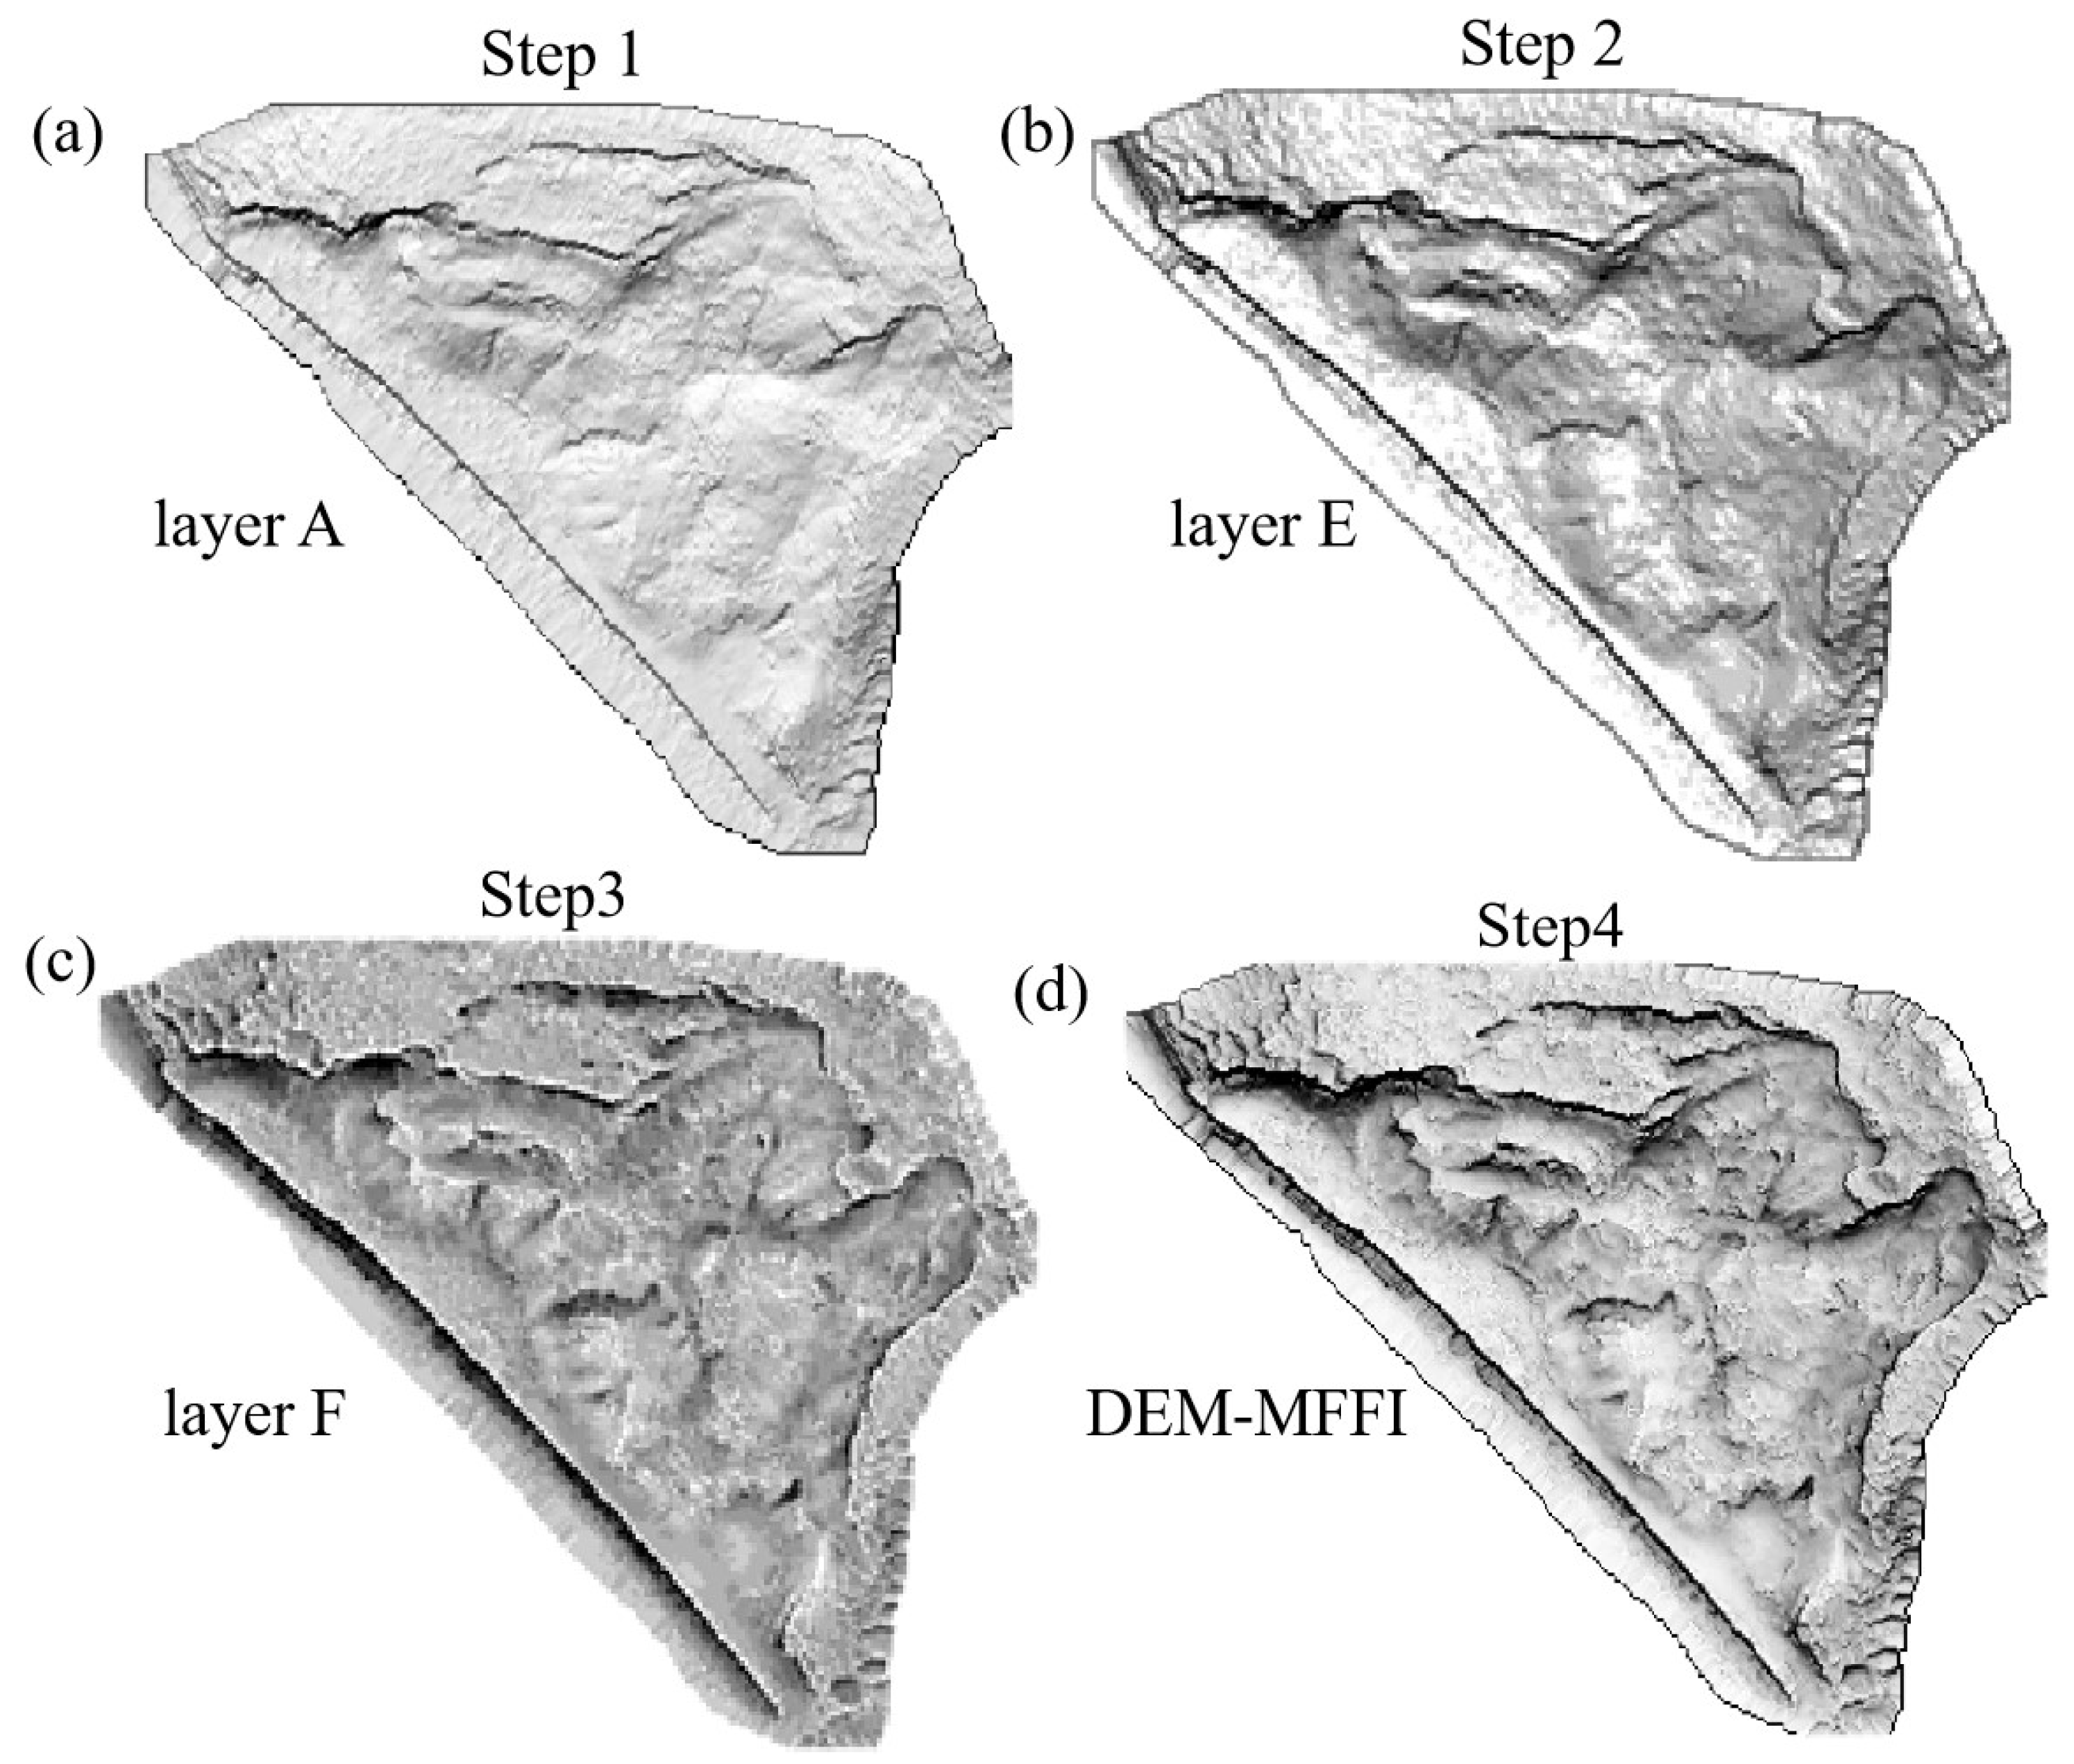
2.2.2. Construction of DEM Multi-Feature Images

First, the preprocessed LiDAR point cloud data was interpolated using the Inverse Distance Weighting (IDW) method to generate a DEM with a resolution of 0.5 m. Next, based on the DEM, four multi-feature information images are generated, including hillshading, slope, positive openness, and the sky-view factor. These multi-feature information images are used to create a DEM Multi-Feature Fusion Image (DEM-MFFI).

3. Landslide Traces Feature Recognition

The landslide trace recognition process is divided into two parts: Step 1: Coarse recognition of landslide traces. The C-A fractal model is applied to extract landslide features based on DEM-MFFI. Step 2: Landslide contour extraction. Remove the noise caused by the weak terrain bumps to get the real landslide traces, and then extract the landslide trace contour to get the location range of the landslide traces. The overall process flowchart is shown below (Figure 4).

3.1. DEM Multi-Feature Image Fusion Method

In the different feature images of the DEM, the hillshading depicts the overall elevation variations in the landslide area. At the same time, the slope enhances the three-dimensional effect of the terrain. The positive openness highlights the display of small-scale terrain, and the sky-view factor enhances the visualization of larger landform features in the landslide area. Combining these features further enhances the visibility of subtle terrain details in the landslide area.
The VAT (Visualization for Archaeological Topography) method [30] is used to perform fusion processing on the DEM-MFFI. Multi-feature image fusion requires at least two layers: the top and bottom layers. The fusion method is determined by the top layer, and the opacity value is adjusted to control the transparency of the top layer, allowing the bottom layer to be displayed to a certain extent. The methods mainly include Opacity, Normal, Luminosity, Screen, Multiply, and Overlay. The four layers—the hillshading, the slope, the positive openness, and the sky-view factor—are labeled as layers A, B, C, and D, respectively.
The multi-feature image fusion process involves four steps:
Step 1: First, use layer A as the bottom layer image with the fusion method set to “Normal” to display the overall terrain features of the landslide. The sun altitude angle is set to 35°, and the azimuth angle is set to 315°. This setting creates prominent shadows and relief on the terrain, highlighting its details.
Step 2: Process layer B with the fusion method set to “Luminosity” and opacity set to 50%. Fuse it with the hillshading to give the landslide area a three-dimensional effect. The layer obtained by fusion is labeled E.
Step 3: Process layer C with the fusion method set to “Overlay” and opacity set to 50% to emphasize the display of subtle terrain variations in the landslide area. The layer obtained by fusing it with the E layer is then noted as F.
Step 4: Process layer D with the fusion method set to “Multiply” and opacity set to 25% to enhance the display of overall large-scale landform features in the landslide. The combination of aspect and sky-view factors further enhances the visibility of micro-terrain features in the landslide. DEM-MFFI is obtained by fusing the D layer with the F layer.
The above Steps 1–4 processes are shown as follows (Figure 5).
After completing Steps 1 to 4, the final result is the DEM Multi-Feature Fusion Image (DEM-MFFI). The fusion parameters used for the DEM multi-feature images are shown in Table 2.

3.2. Landslide Traces Feature Recognition

After generating the DEM Multi-Feature Fusion Image (DEM-MFFI), further recognition of landslide traces is conducted using fractal theory. The recognition process involves two stages: coarse recognition and landslide traces and contour extraction. Coarse recognition is based on the C-A fractal model for extracting anomaly values related to landslide traces, which provides initial recognition of the landslide traces. The landslide traces contour extraction involves denoising the extracted landslide traces to eliminate the influence of noise on the extraction results. Furthermore, the contour range of the denoised landslide traces is extracted to accurately determine the location of the landslide traces.

3.2.1. Coarse Recognition of Landslide Traces Based on Fractal Theory

The natural world is nonlinear, and fractal phenomena are widely present in the field of geosciences. The occurrence of landslides is an example of a nonlinear phenomenon [31]. The occurrence and development of landslides exhibit complex nonlinear characteristics resulting from the combined effects of various geological activities. When a landslide occurs, the initially smooth mountain terrain undergoes significant changes, forming visible traces on the surface. The boundaries of the landslide traces share similarities with the overall shape of the landslide, and the distribution of the landslide traces and the landslide itself also exhibit statistical fractal features. This indicates that landslides have distinct fractal characteristics. Therefore, considering the application of fractal theory for the coarse recognition of landslide traces can help extract the landslide traces. According to fractal theory, the Concentration-Area fractal model (C-A fractal) is used to distinguish background and anomaly values in geoscientific data [32]. Landslide traces exhibit differences from the surrounding mountains and belong to terrain anomalies. Applying the C-A fractal model allows for recognizing landslide traces by determining the anomaly values based on the pixel brightness-area pattern.
The following equation represents the C-A fractal model:
A C > v = v D v > 0 , D > 0
l g A C > v represents the area of the region in the DEM-MFFI where the pixel brightness value C is greater than the set pixel brightness threshold v, v is the threshold value, and D is the fractal dimension.
When performing landslide trace recognition work, the number of DEM-MFFI pixels is denoted as n, and the brightness values of each pixel are represented as P = P j ,   j = 1 , 2 , 3 , 4 , , n . Moreover, the number of occurrences Aj (where Aj represents the total sum of frequency counts greater than or equal to v and Pi denotes each pixel value greater than Pj) is calculated for Pi > Pj.
Taking the logarithm of both sides of the above Equation (1), we obtain a linear relationship between l g A C > v and l g v . By plotting a scatter plot of l g A C > v and l g v on a double-logarithmic graph, it is observed that within a certain range, l g A C > v and l g v show a linearly correlated curve. The method of least squares can be applied to fit a straight line with a slope of -D to the data points. The C-A fractal double logarithmic schematic is shown below (Figure 6).
The two fitted lines represent the background area and the landslide traces target area, and the intersection of these two lines is the threshold for recognizing landslide traces anomalies. By applying the exponential operation to the intersection point, the anomaly threshold can be obtained. Based on this threshold, background values can be distinguished from landslide trace anomalies at the DEM-DFFI.
After obtaining the anomaly values in the landslide area, the DEM-MFFI can be binarized using the threshold. This process allows the DEM-MFFI to be divided into target and background areas, thereby generating a binary image that preliminarily extracts the landslide traces.

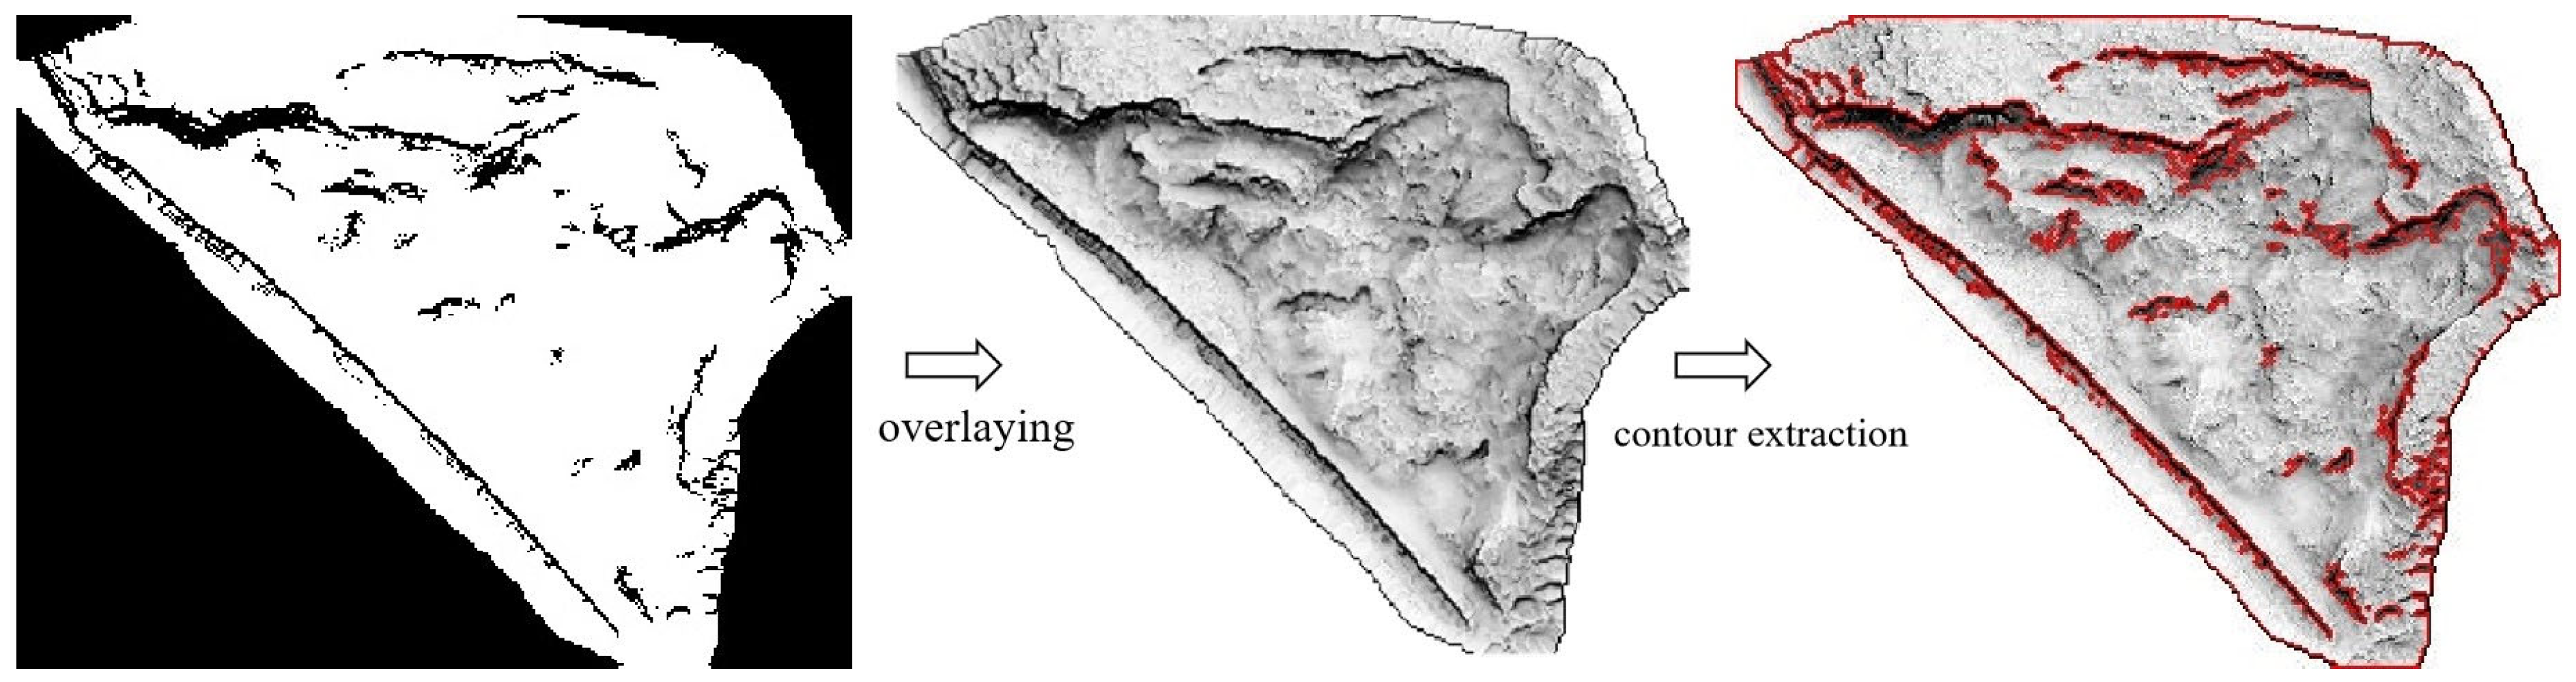
3.2.2. Landslide Traces Contour Extraction

Due to the fragile geological environment in the landslide area, there can be many weak terrain features causing topographic protrusions. Therefore, after the preliminary binarization process to obtain the landslide traces, some noise points may exist, such as loose soil accumulations. It is necessary to perform denoising on the extracted landslide traces. The Mean-Shift algorithm is used to denoise the landslide traces, resulting in a binary image. This algorithm can effectively remove noise while preserving the edge information of the image, thereby improving the accuracy of landslide trace recognition [33]. After removing the noise, the denoised binary image is superimposed on the DEM-MFFI; then, the external contour of the landslide traces is found in the denoised binary image based on the contour finding algorithm; finally, the external contour of the landslide traces is extracted based on the contour drawing algorithm, and the final landslide traces can be obtained.

4. Results

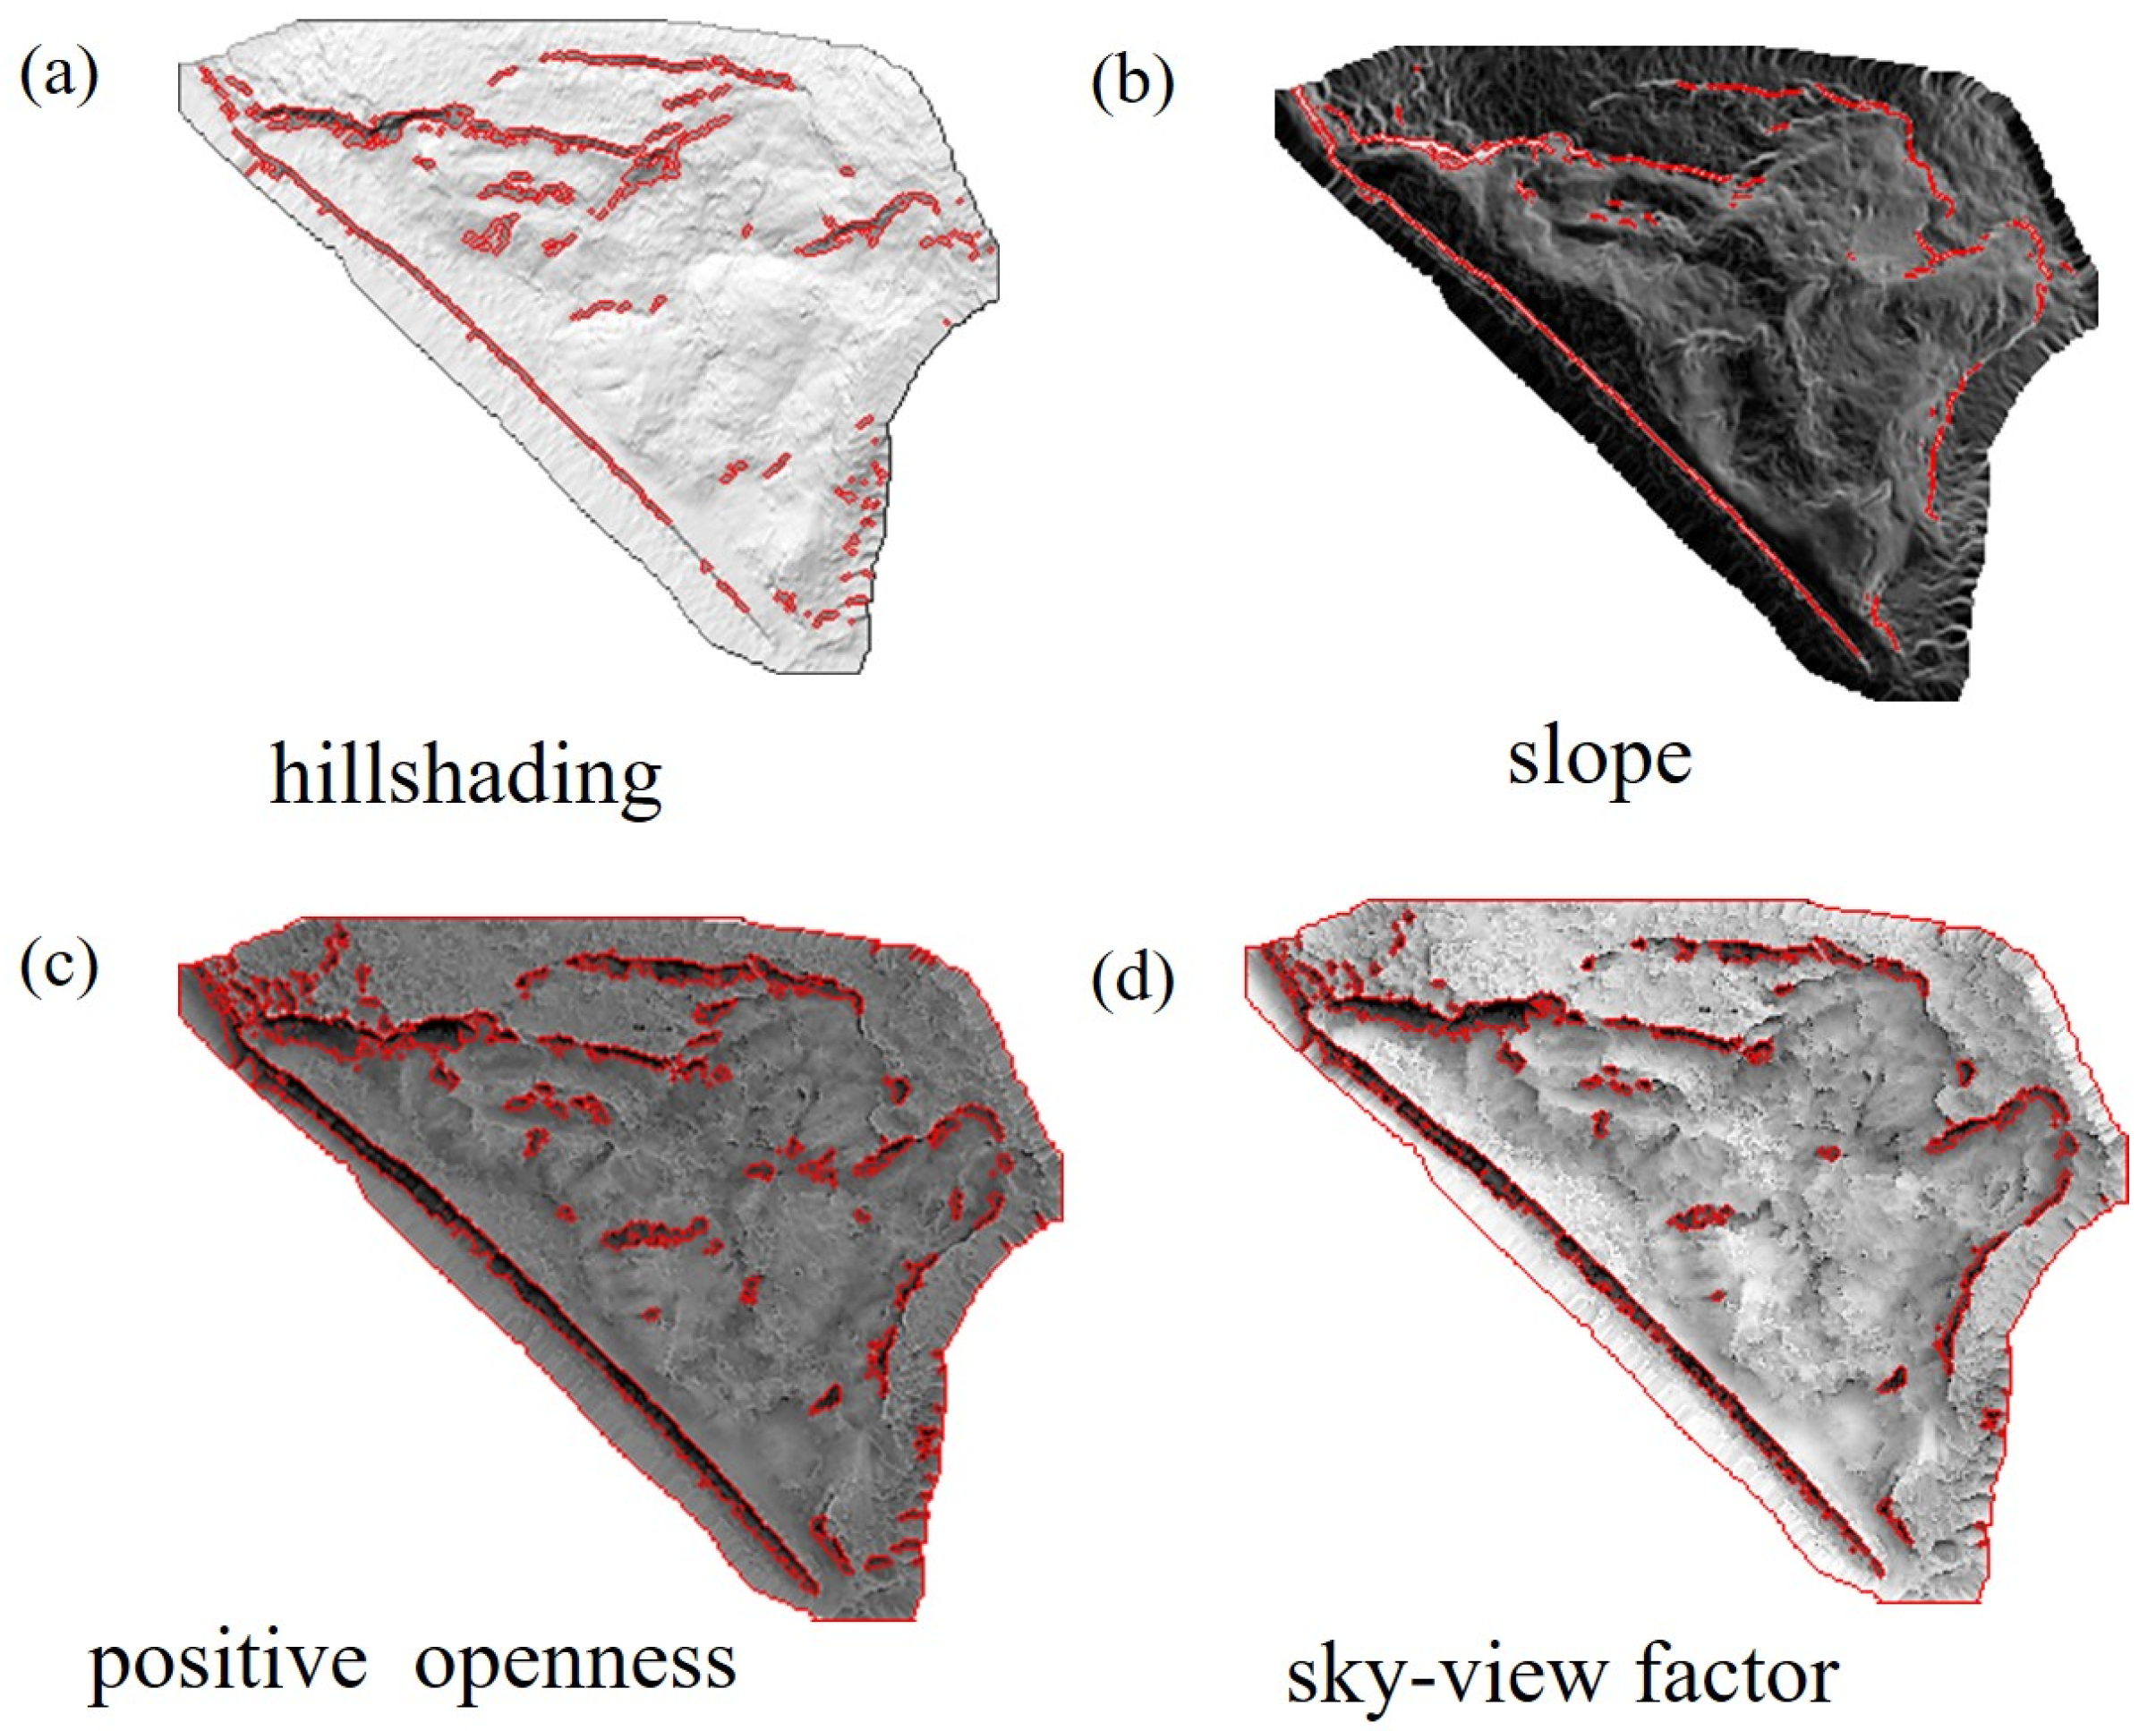
4.1. Results of DEM Multi-Feature Image Construction

Based on the methods described in Section 2.2.2, the results of DEM and four types of multi-feature images, including hillshading, slope, positive openness, and sky-view factor, are shown below (Figure 7). We processed the point cloud data using LiDAR360 software v5.3 to generate a DEM and then used the Relief Visualization Toolbox (RVT) [13,34] to generate four multi-feature images.
The elevation values of the landslide perimeter and the surrounding mountains can be seen from the DEM with apparent differences, and the area where the landslide is located can be initially obtained. In the hillshading image (Figure 7a), the landslide area appears as a concave region compared to the surrounding mountains, indicating a depressed state of the landslide area. Additionally, it shows the deformation and damage to the terrain after the landslide occurrence, displaying the overall topographic characteristics of the landslide area with its ups and downs. From the figure, it can be observed that there are noticeable cracks on the left wing of the landslide, and the mountain has undergone severe deformation. In the slope image (Figure 7b), the boundary of the landslide exhibits extremely high slope values, which are significantly different from the surrounding slope values. This distinct difference in slope values makes it easy to distinguish the landslide boundary from the adjacent mountainous terrain. Within the interior of the landslide, the slope values tend to be more concentrated, showing an overall pattern of decreasing slope values from high to low. In the positive openness image (Figure 7c), the boundary of the landslide is clearly visible, and the micro-topographic features within the landslide are well displayed. The sky-view factor image (Figure 7d) enhances the visualization of the overall terrain features of the landslide, providing better insight into the micro-topographic characteristics within the landslide.

4.2. DEM Construction Results of the DEM Multi-Feature Fusion Image

According to the method described in Section 3.1, the DEM-MFFI (Figure 8) is obtained. It fully integrates the characteristics of the four feature images mentioned above, allowing for a clear display of the micro-terrain features of the landslide. Moreover, it is not affected by the direction and shape of the terrain features, ensuring that the landslide’s terrain features are accurately represented from any perspective. The fusion enhancement significantly improves the recognition of landslide traces.
In the detailed image of the DEM-MFFI (Figure 9), it can be observed that the boundary of the landslide is steep and significantly distinct from the surrounding mountains, allowing for the effective recognition of the landslide area. The micro-geomorphic features inside the landslide can be well displayed, and it can be seen that the terrain inside the landslide is rough, and the slip cliff and the flanks of the landslide are extremely clear (Figure 9a–d). In the interior of the landslide, especially near the left flank, the obvious landslide terraces generated by sliding and accumulation during the landslide process can be observed (Figure 9e,h). Noticeable depressions can be observed in the lower part of the landslide (Figure 9f,g). Therefore, the DEM-MFFI can authentically showcase the micro-geomorphic features of the landslide, effectively enhancing the recognition of the landslide traces.

4.3. Recognition Results of Landslide Traces Based on Fractal Theory

After generating the DEM multi-feature image, landslide trace anomalies are extracted based on the C-A fractal model, enabling accurate recognition of the landslide trace area. The specific process is outlined as follows.

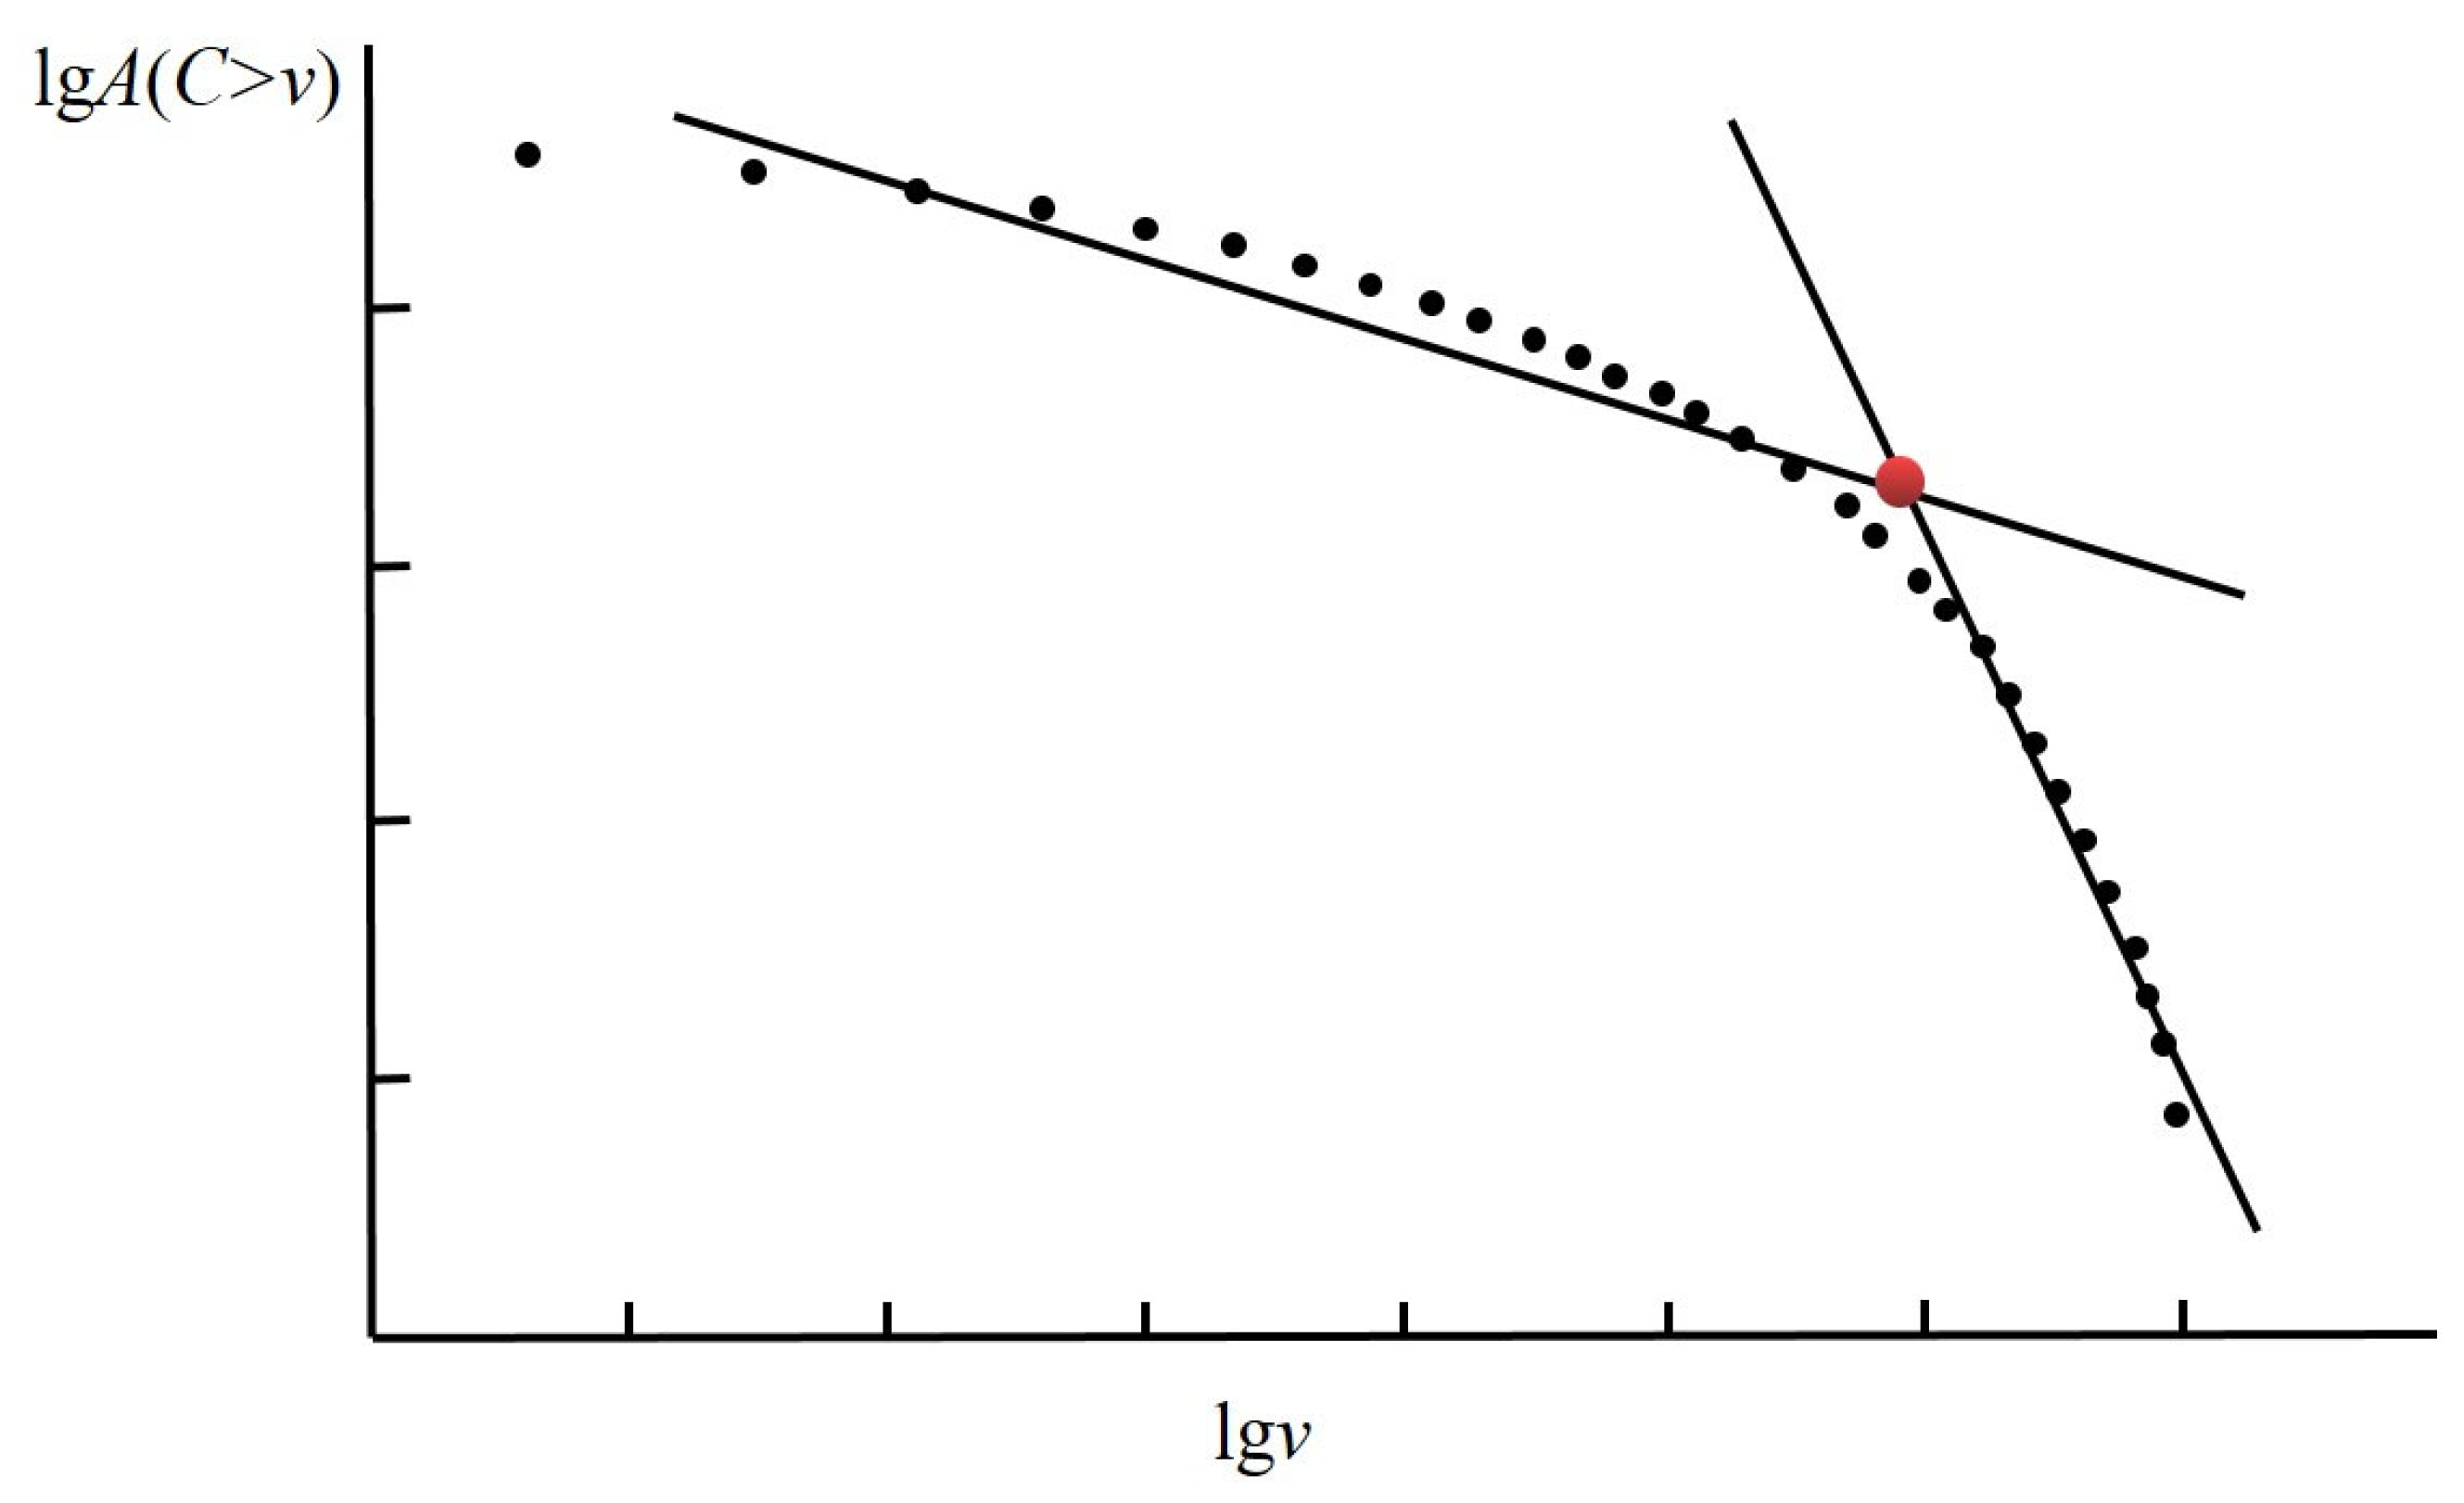
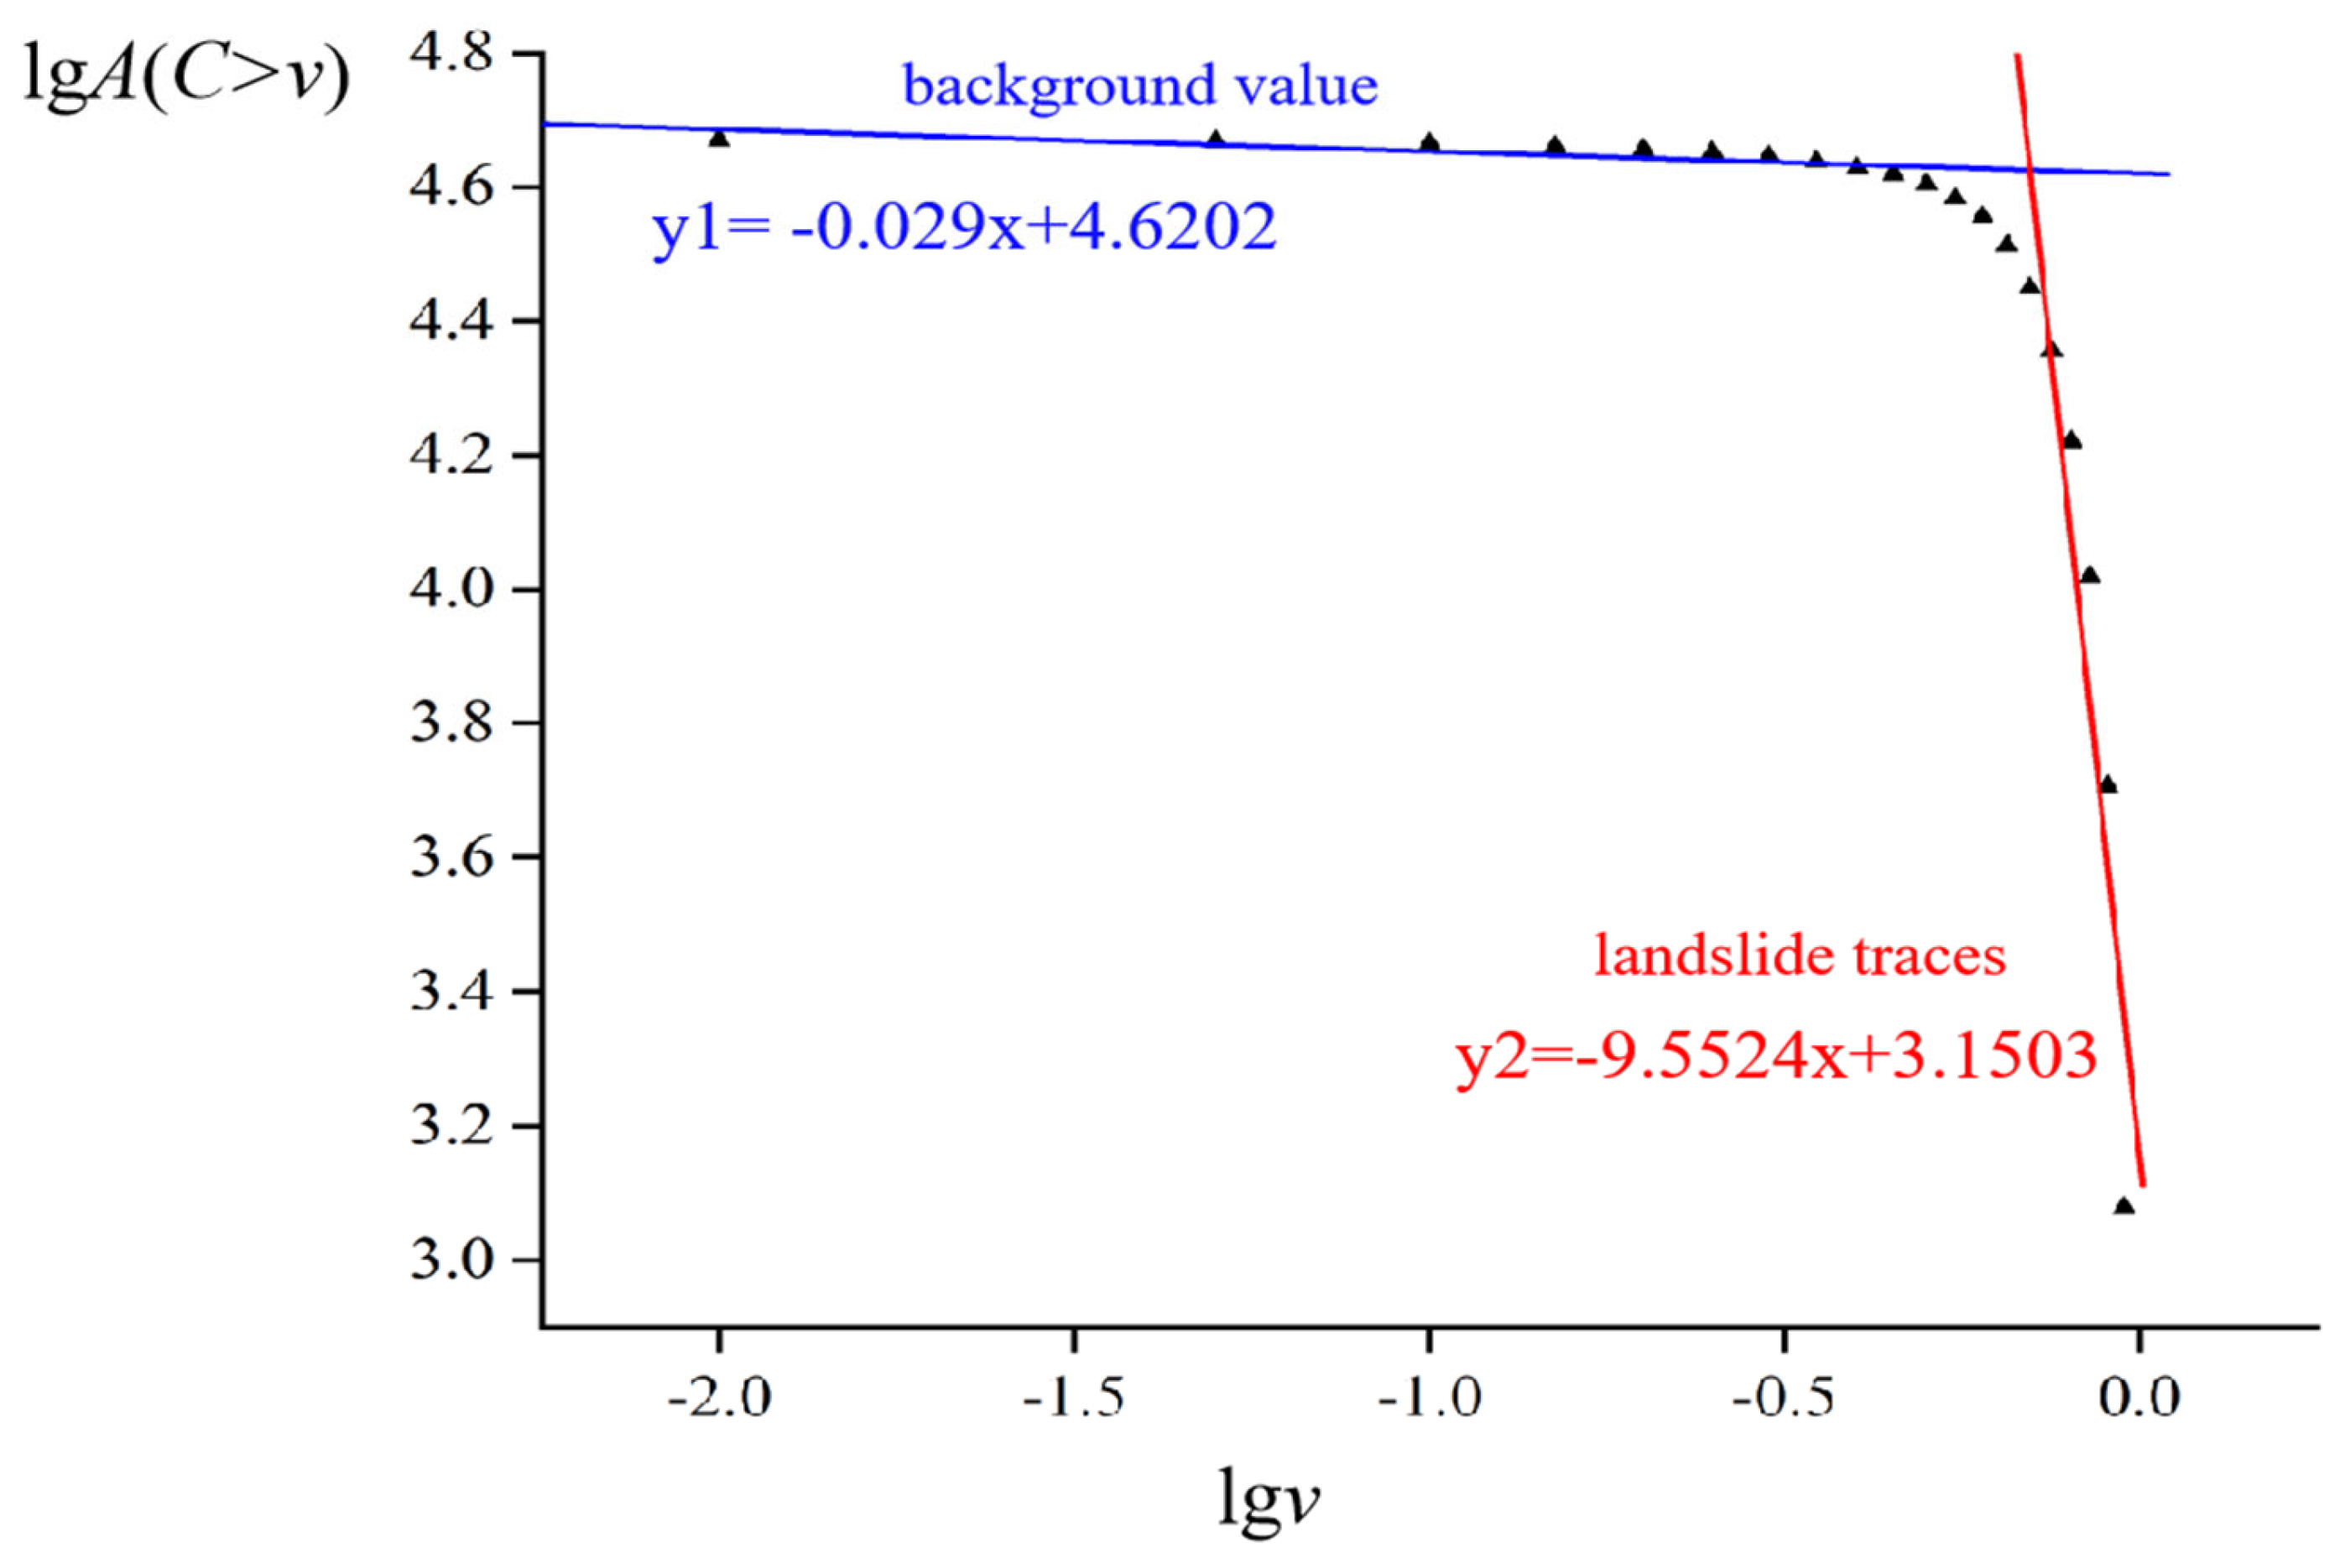
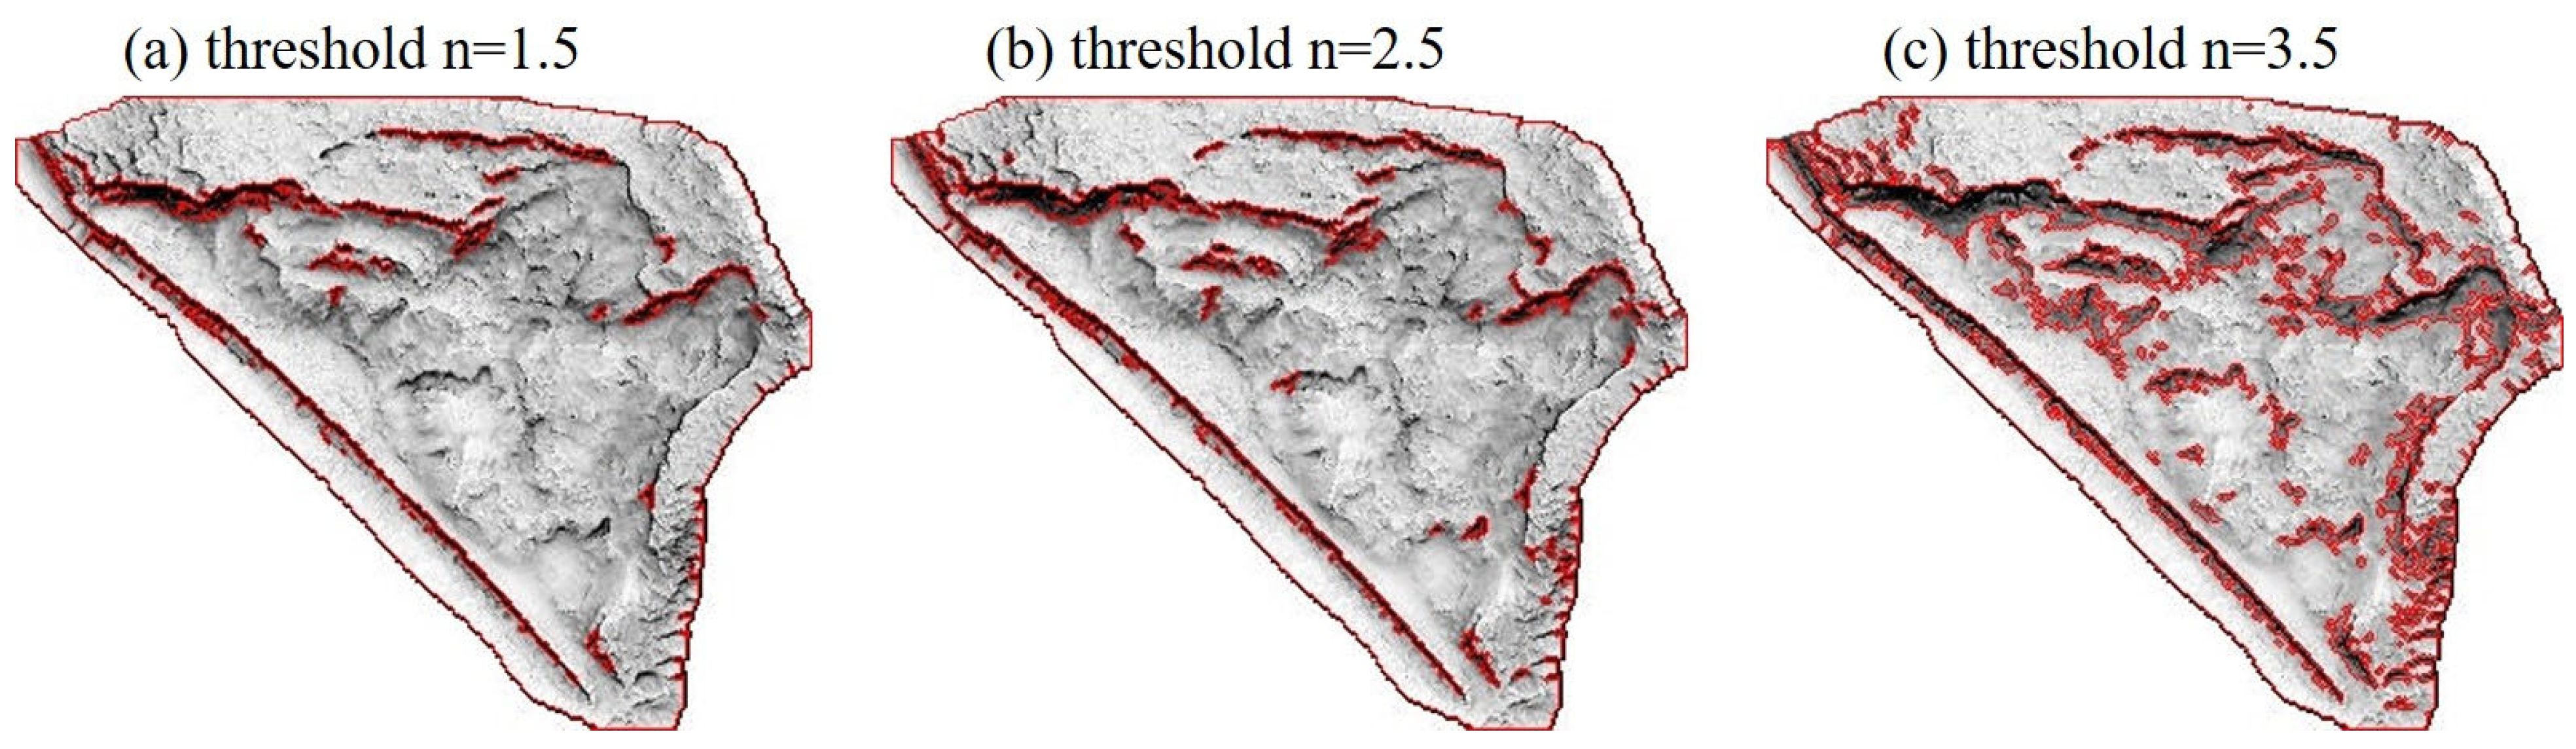
4.3.1. Coarse Recognition of Landslide Traces Based on C-A Fractal

The process of obtaining landslide traces and anomaly values using the C-A fractal model from Section 3.2.1 involves the following steps: Firstly, statistical analysis of the grayscale values in the DEM-MFFI is conducted. Moreover, a double-logarithmic scatter plot of lgA(C > v) against lgv is generated from the grayscale data of the DEM-MFFI. The scatter plot is fitted with two lines of different slopes using the least squares method. Finally, the intersection point of these two lines is subjected to an exponential calculation to determine the anomaly threshold for landslide traces.
The C-A fractal double-logarithmic plot obtained from statistical analysis of grayscale values in the DEM-MFFI is presented below (Figure 10).
Two fitted lines with different slopes can be obtained by applying the least squares method to fit the discrete points generated from the grayscale data linearly. These two lines hold distinct meanings, corresponding to the background values of non-landslide traces and the landslide traces within the study area. The y1 line, characterized by a shallower slope, represents the background values of non-landslide traces. On the other hand, the y2 line, with a significantly smaller slope than y1, symbolizes the terrain anomalies caused by landslides. These anomalies are treated as outlier values, signifying landslide traces forming after a landslide event.
The intersection point of the two fitted lines corresponds to the sought-after threshold to determine the outlier values of the landslide traces. By solving for this intersection point, the anomaly values can be determined. The calculated x-coordinate value of the intersection point for the two fitted lines is −0.15 in terms of lgv. The lower limit of the grayscale value for the anomaly in the DEM-MFFI can be obtained through exponentiation of this value as 0.71. In other words, when the grayscale value of a DEM-MFFI pixel reaches 0.71, it corresponds to the presence of landslide traces.
By using the anomalies obtained from the C-A fractal model and binarizing the DEM-MFFI based on the openCV platform, preliminary landslide traces in the study area can be obtained (Figure 11b). In the image, pixels exceeding the threshold are indicative of landslide traces, while pixels below the threshold represent the background area. The black regions in the image correspond to the landslide traces, whereas the white regions signify the background.
The binary image (Figure 11b) shows that landslide features such as cracks, rumbles, and sunken depressions within the landslide perimeter and inside the landslide are effectively recognized. However, due to the fragile geological environment of the area where the landslide occurs, external forces (gravity and human activities) will cause some weak topographic bumps of small soil fragments to accumulate and become noise after binarization. Therefore, to extract the landslide traces more accurately, it is necessary to further denoise the extraction results to remove the noise and extract the landslide traces.

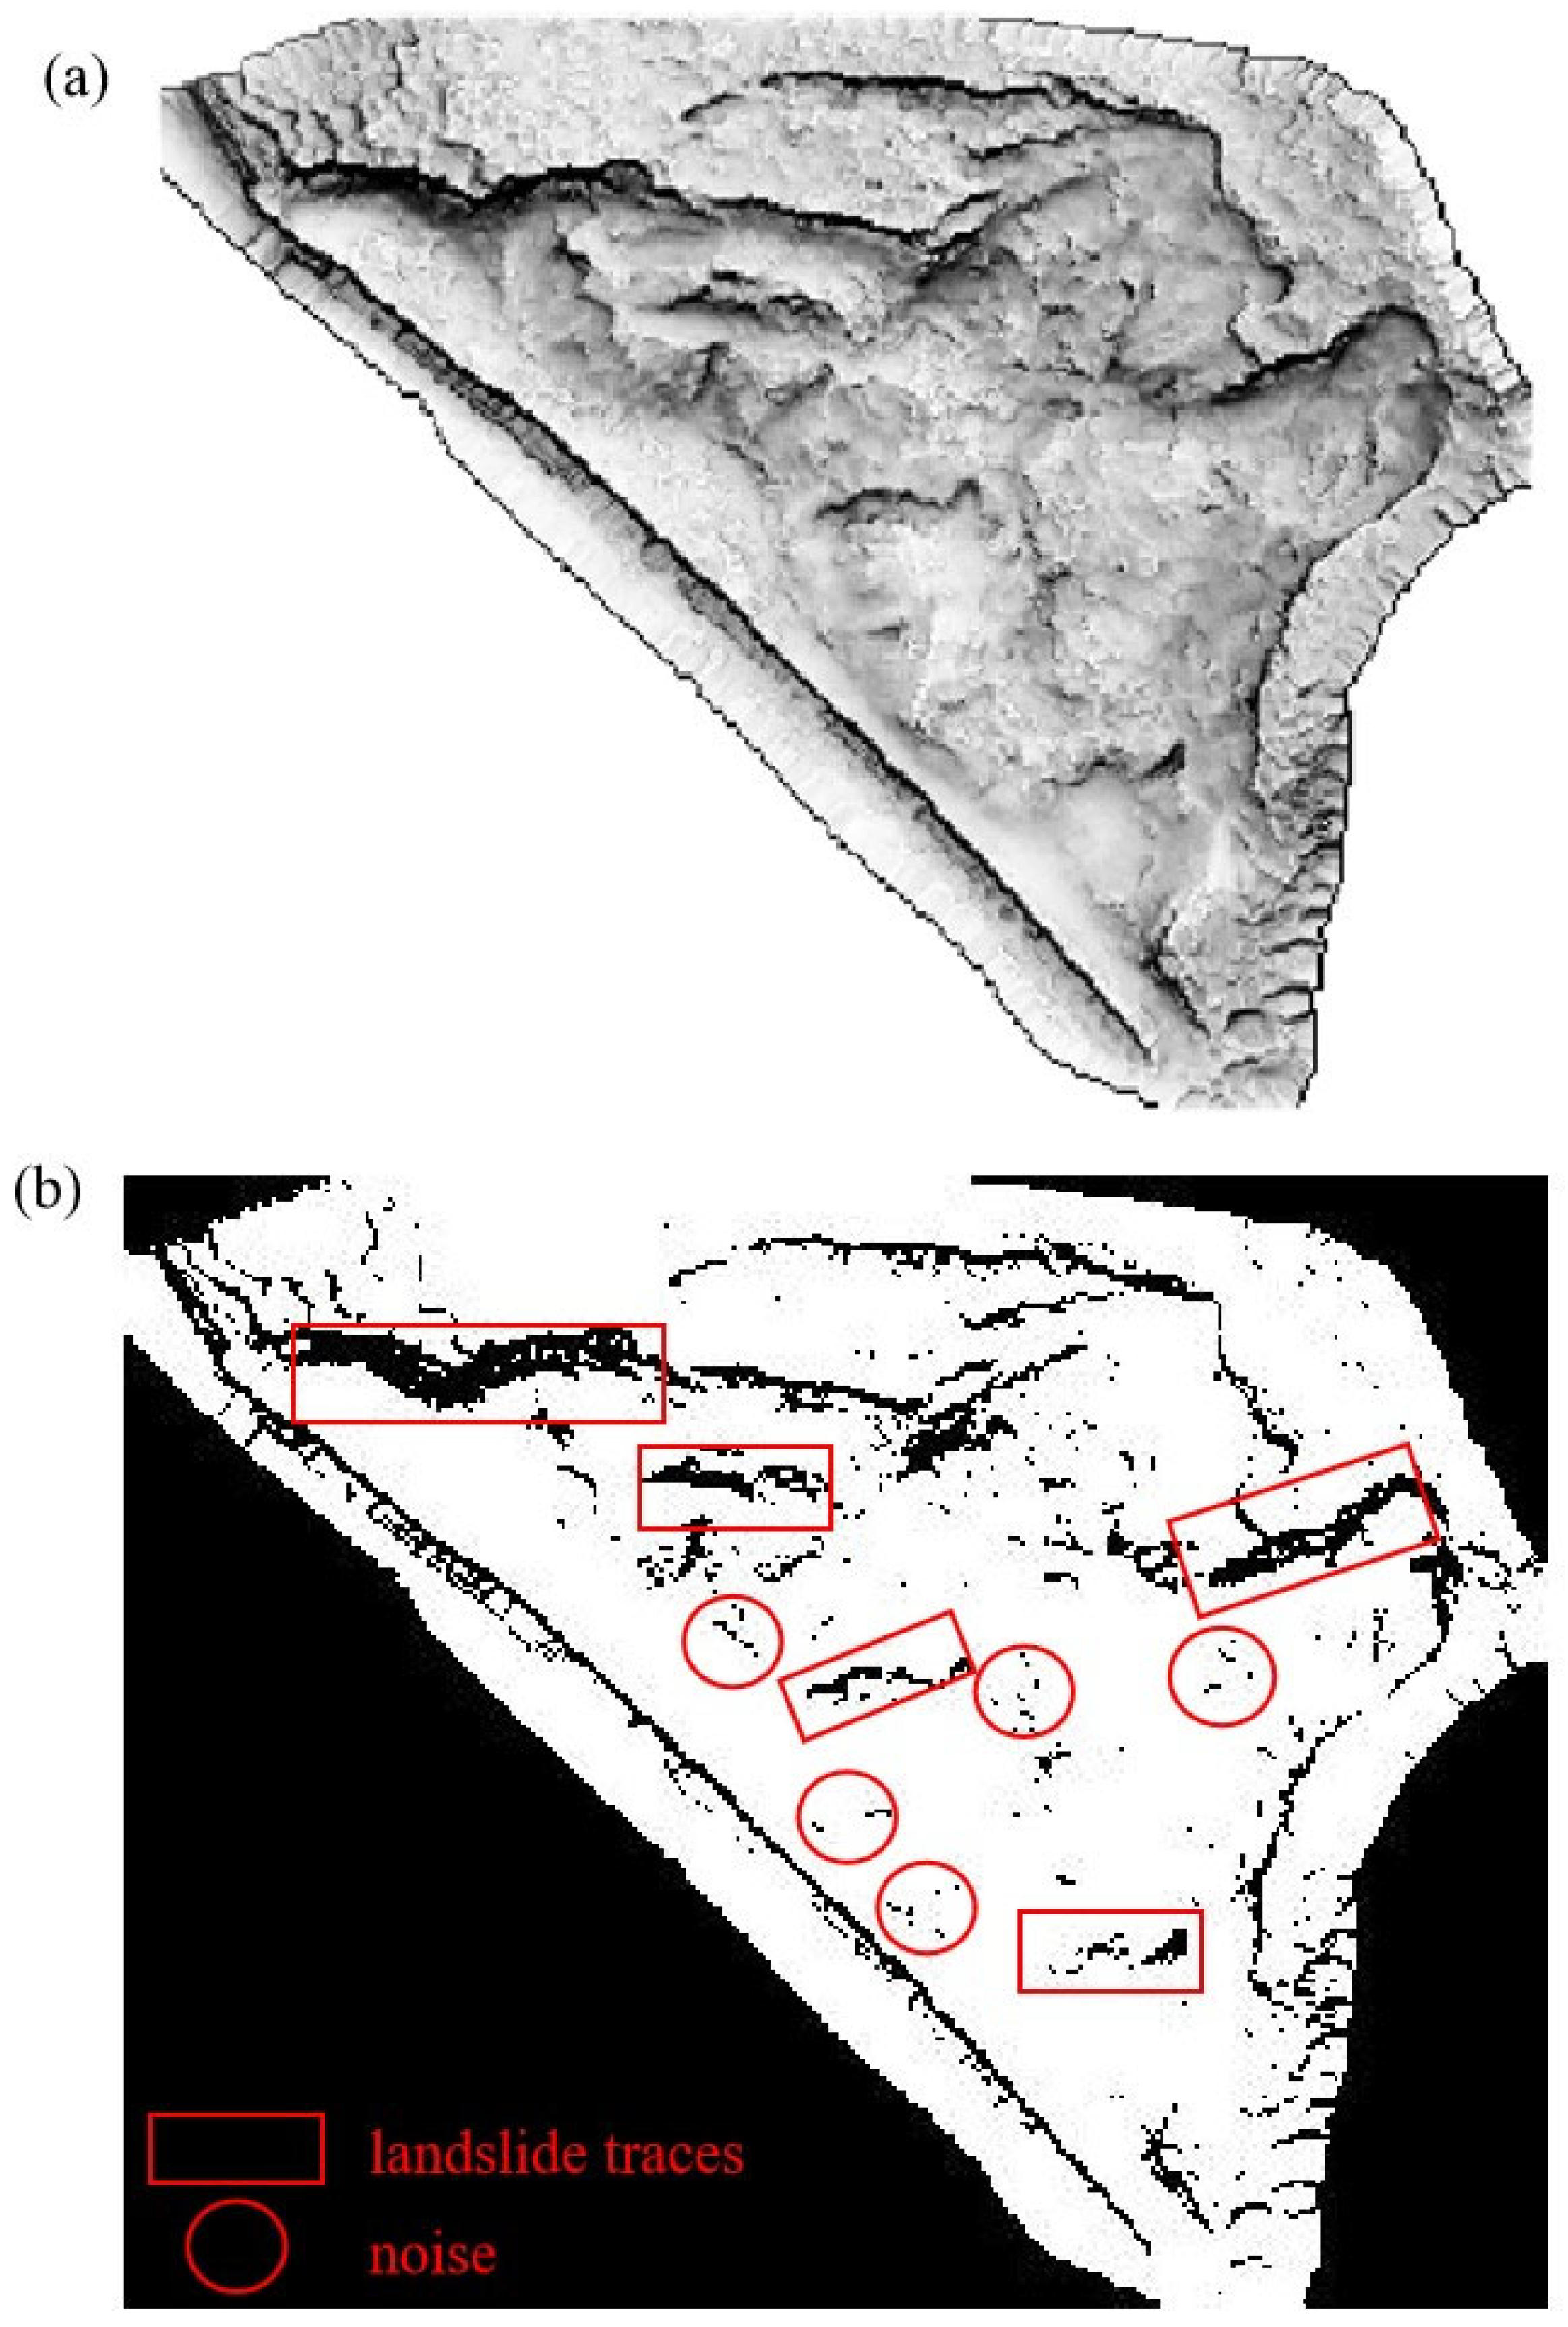
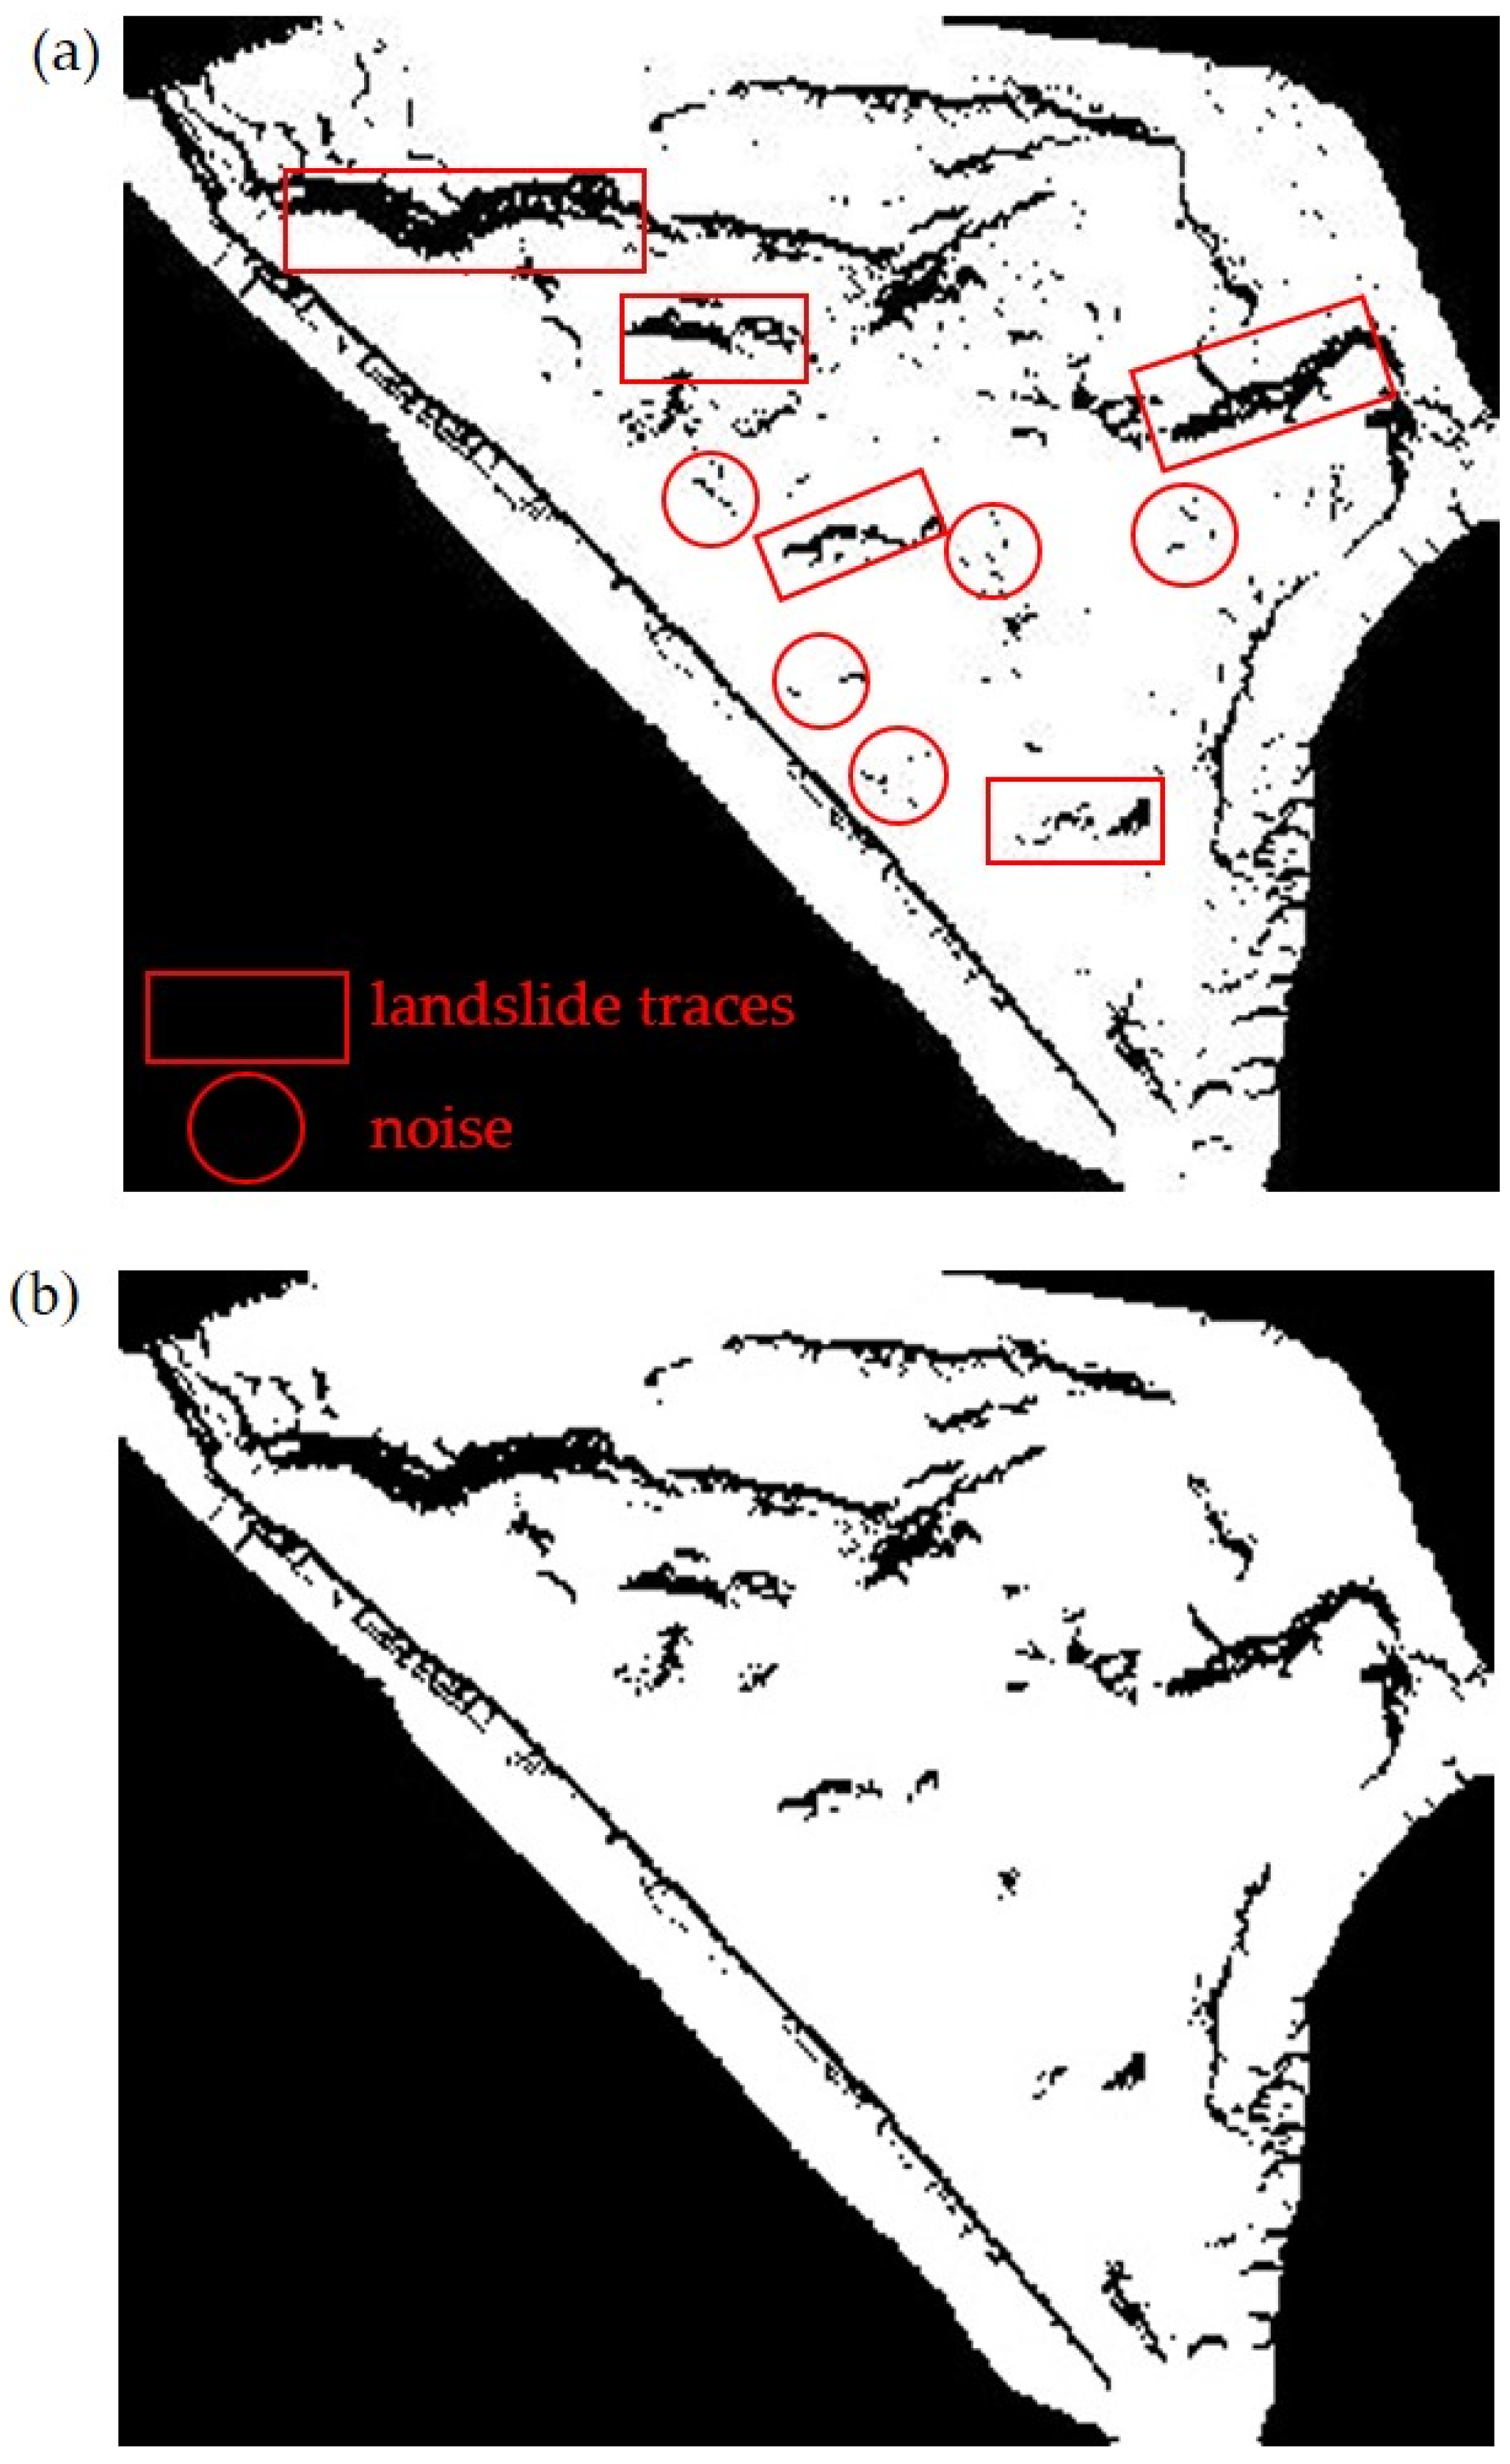
4.3.2. Landslide Traces Denoising Processing Results

To further enhance the accuracy of landslide trace recognition, this study employs the Mean-Shift algorithm [33] based on the openCV platform to denoise the extracted landslide features. The denoised image (Figure 12b) shows that the denoising process effectively eliminates noise caused by weak terrain protrusions while retaining genuine landslide trace information. The denoised image preserves the authentic landslide traces by removing irrelevant interference, thus further enhancing the precision of landslide traces extraction.

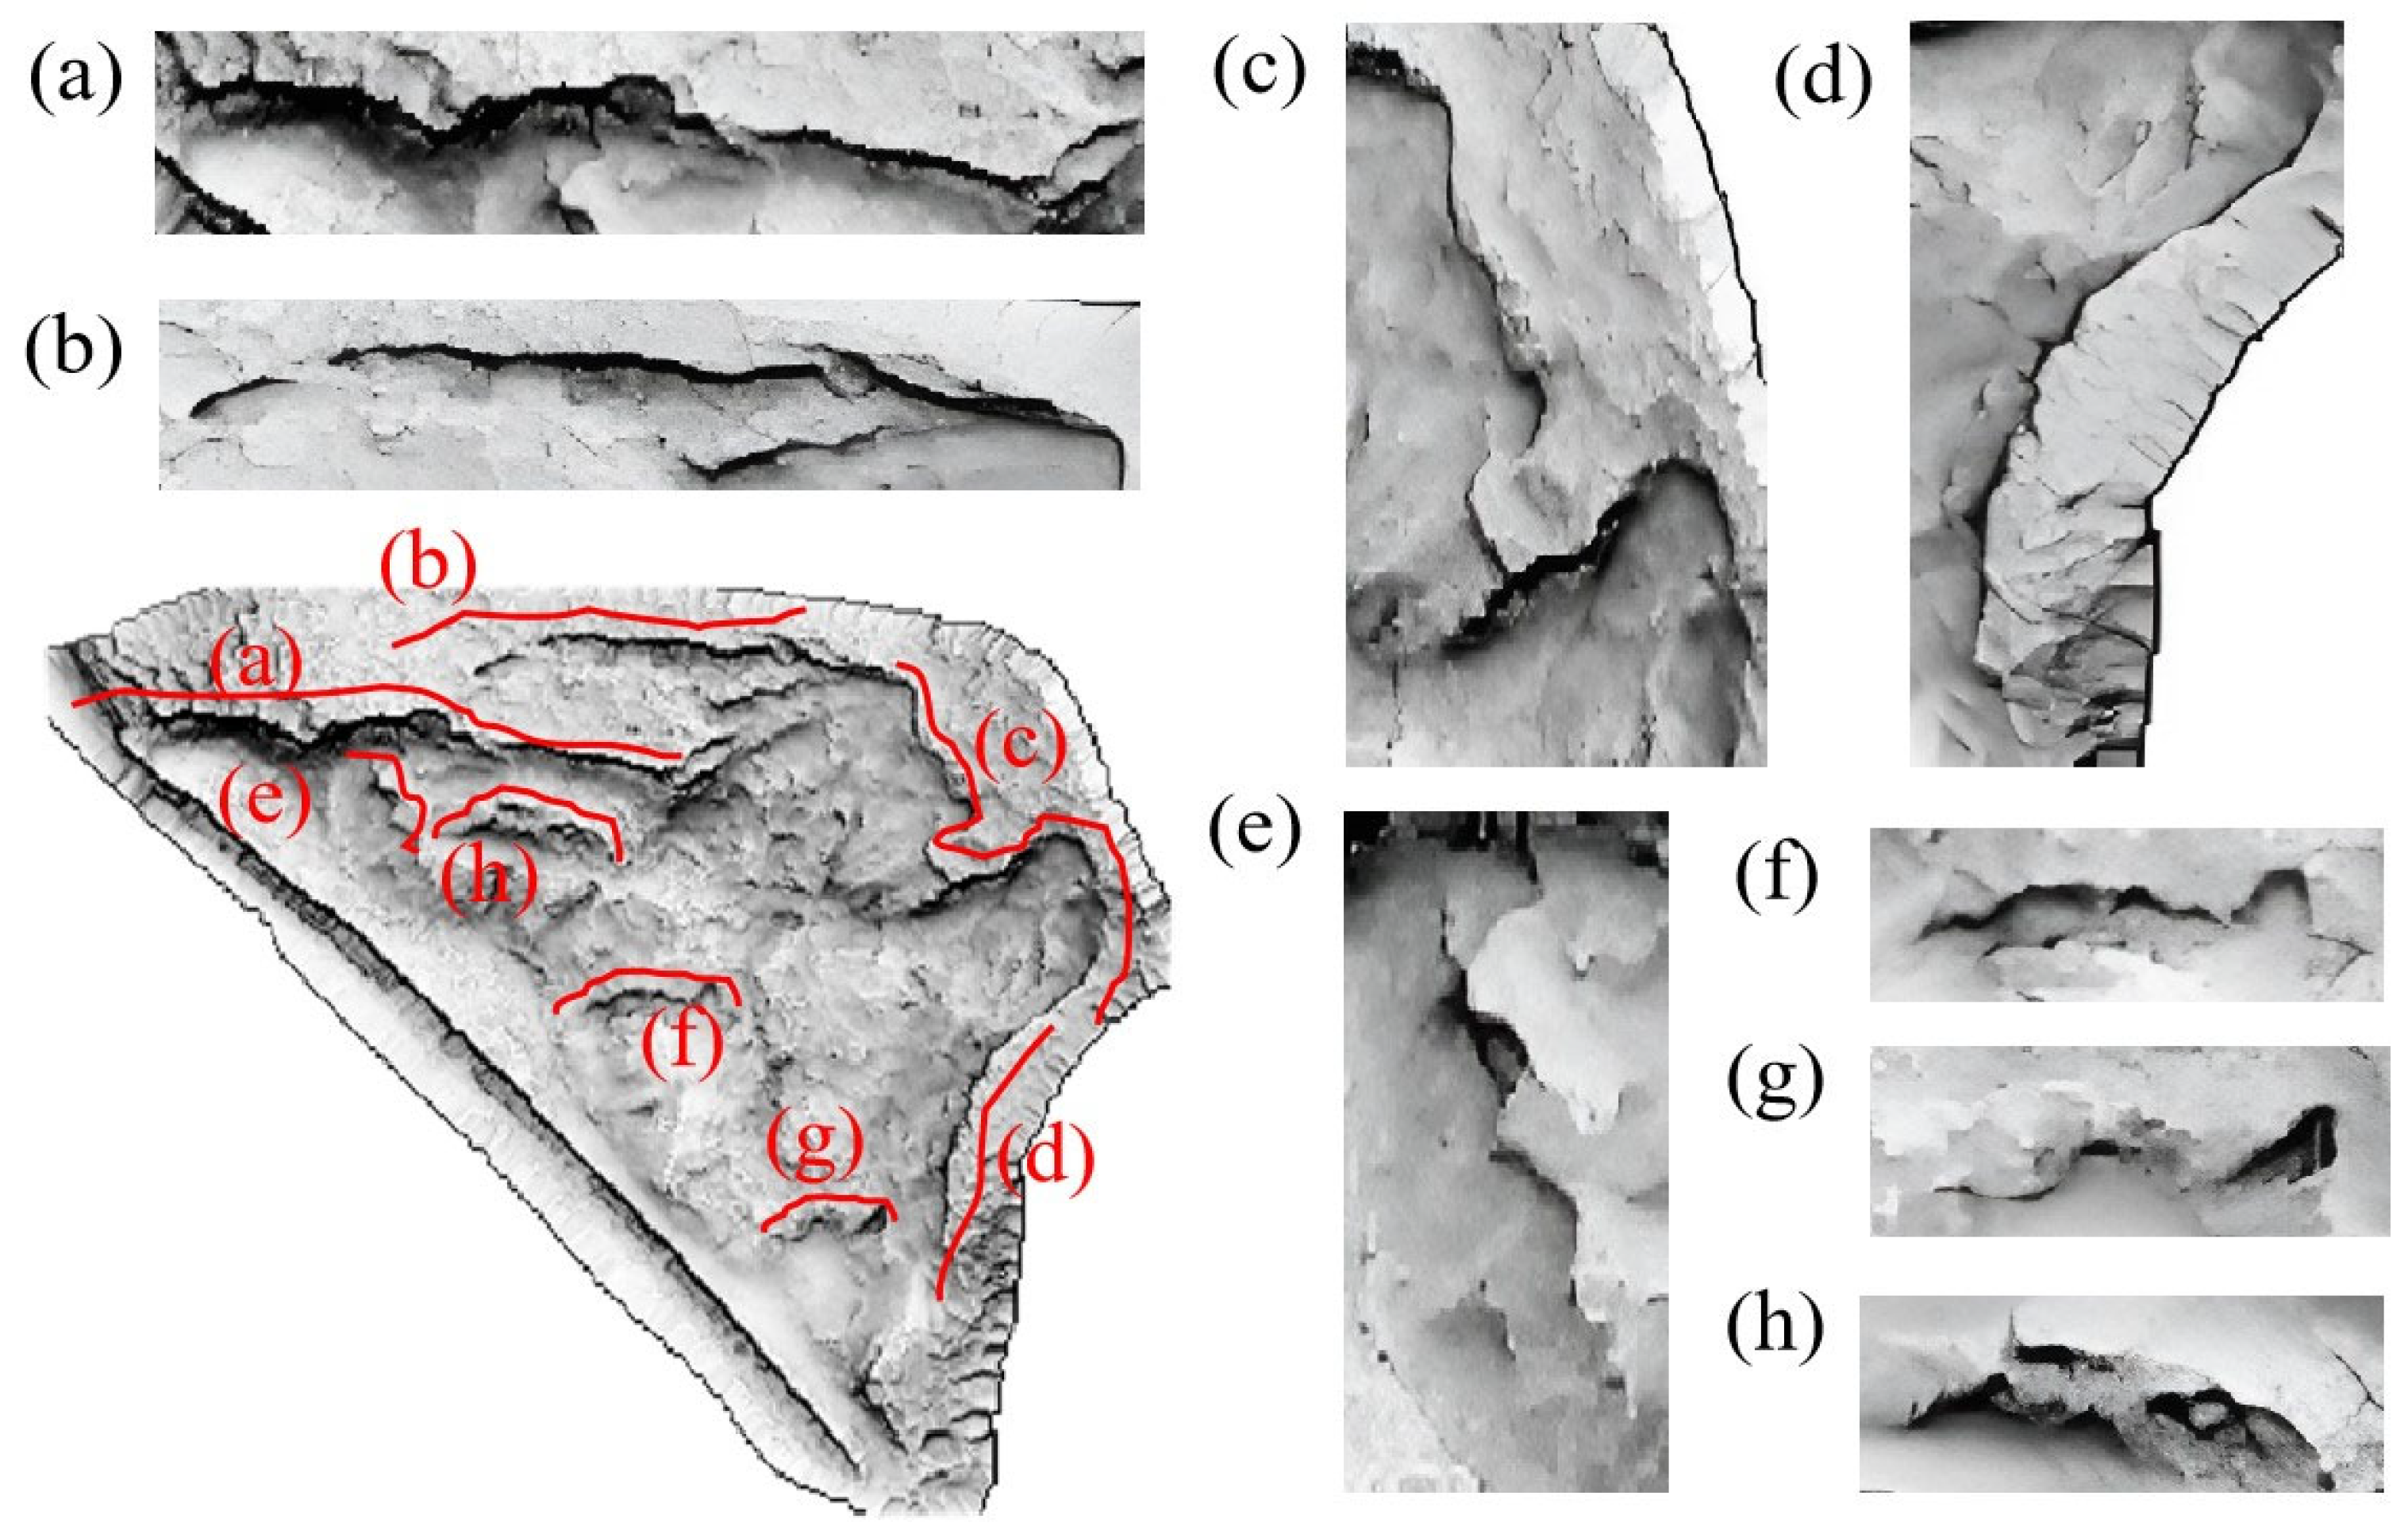
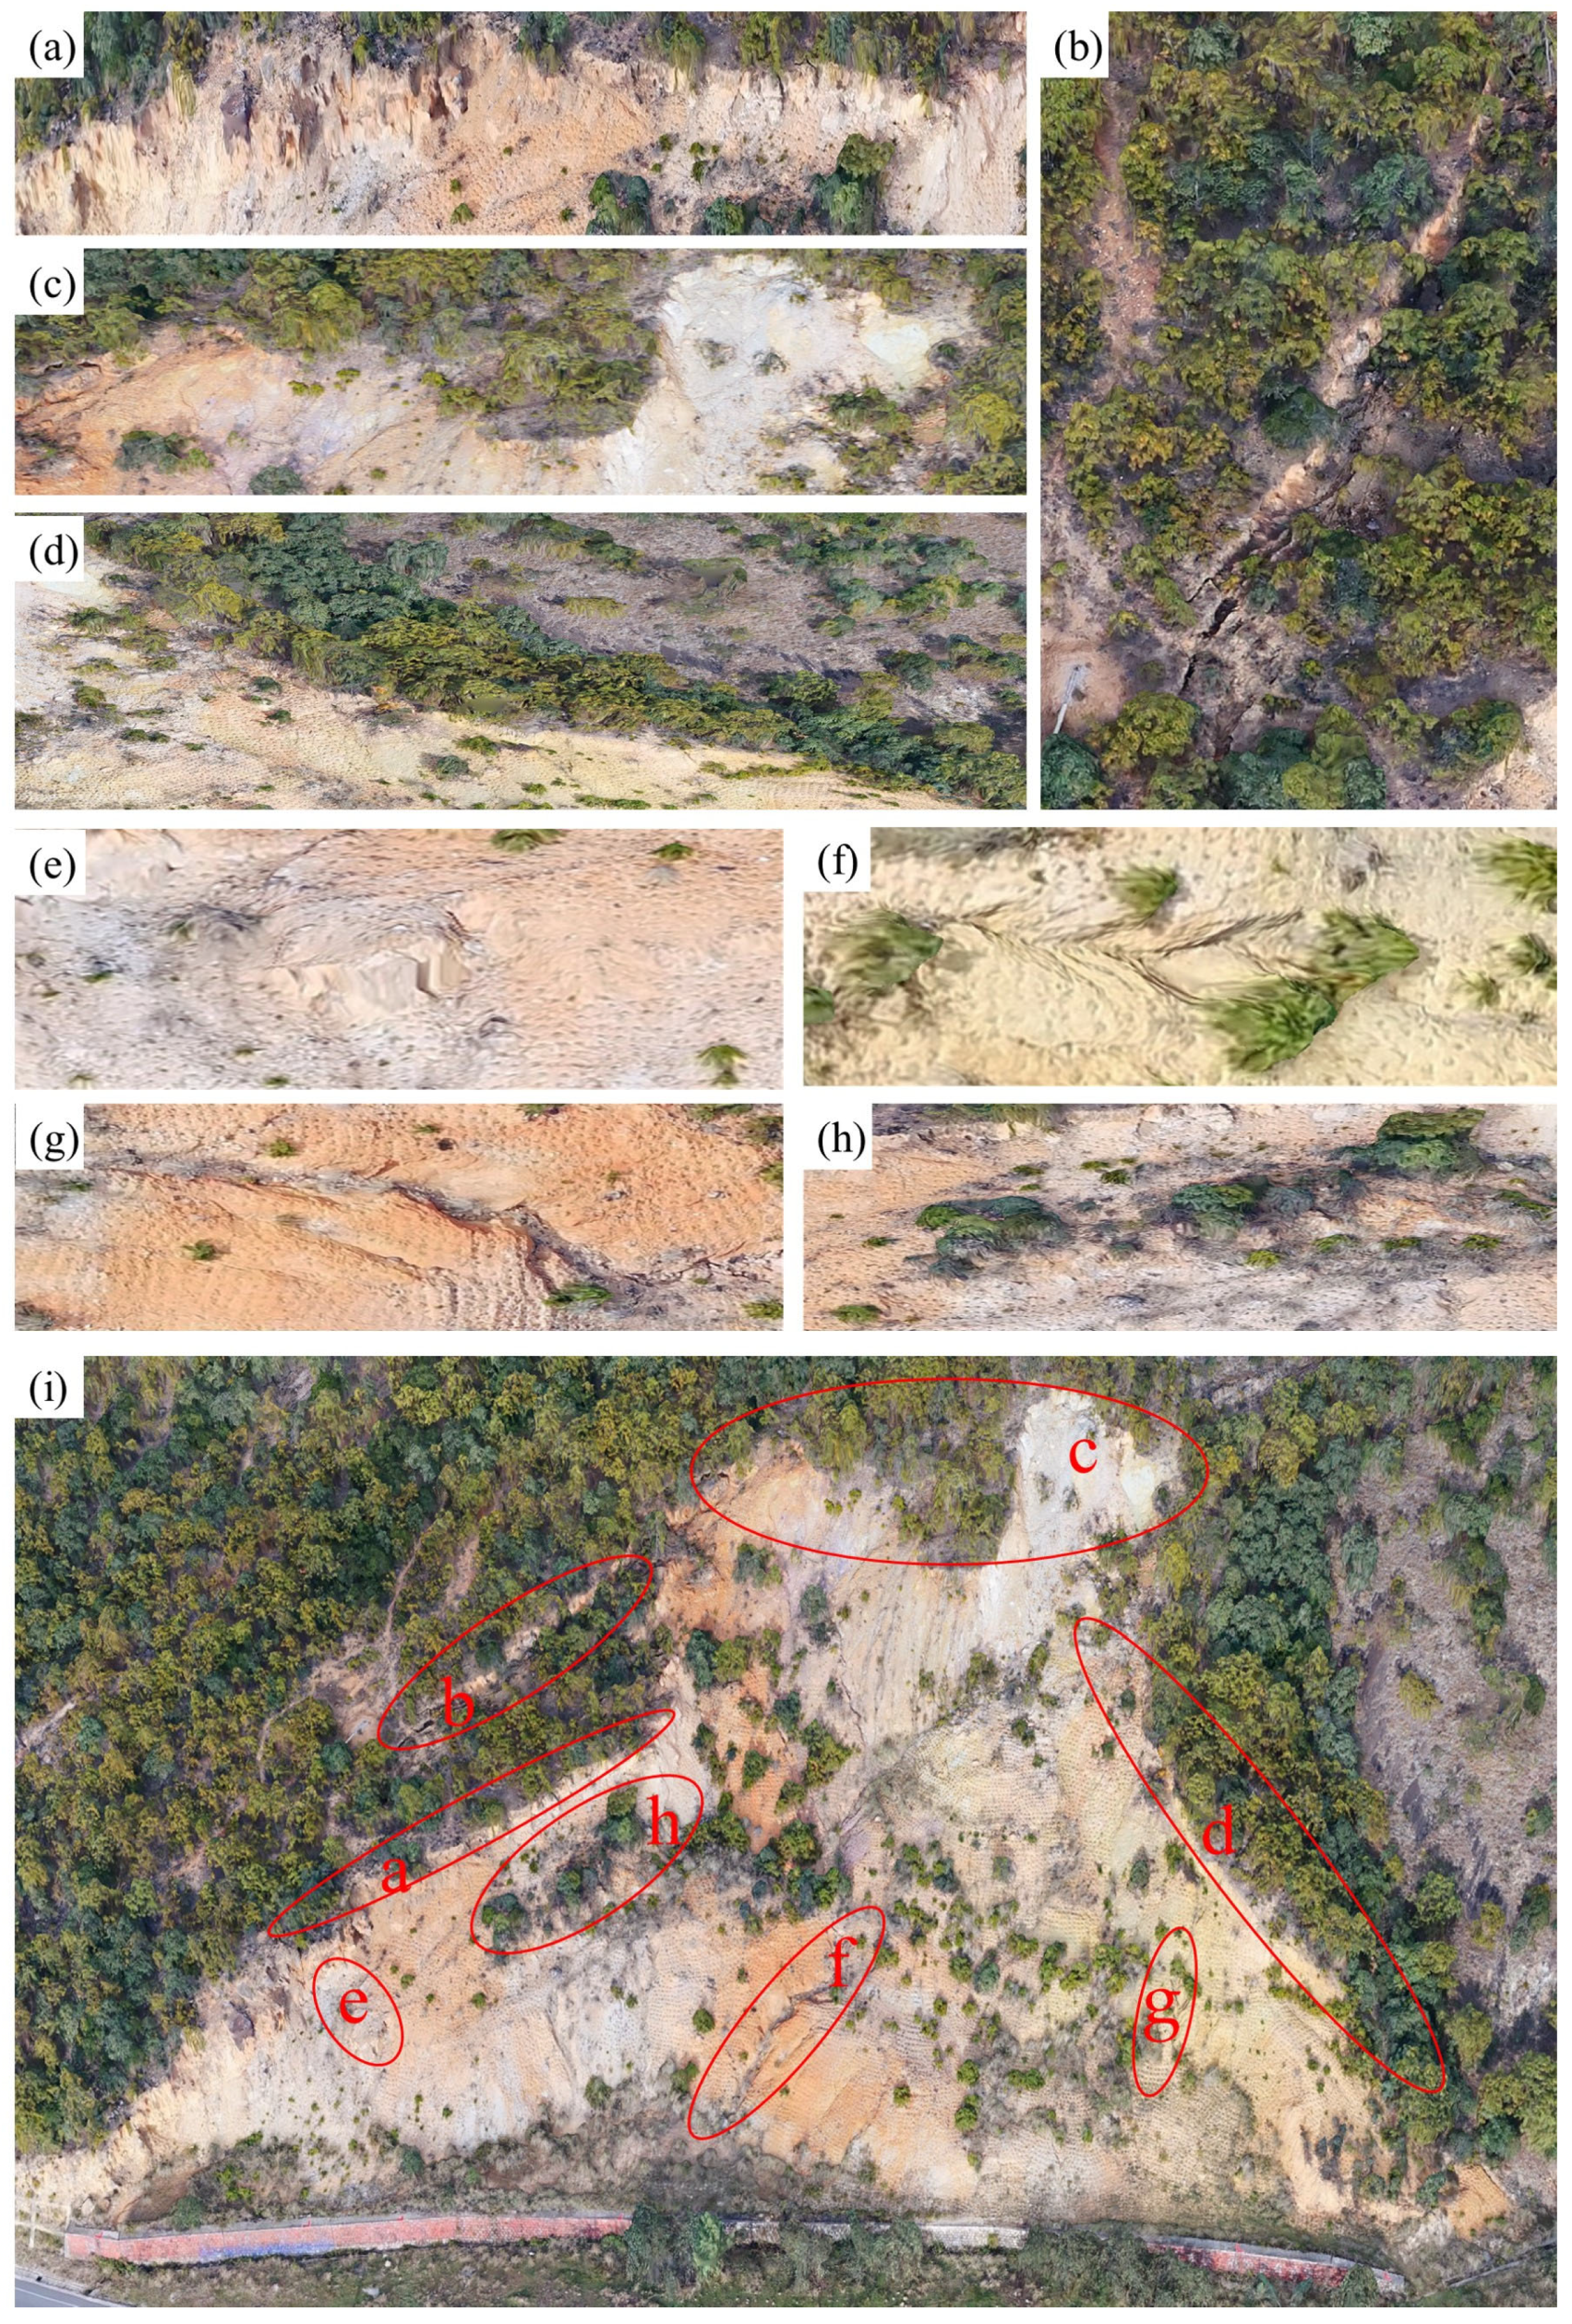
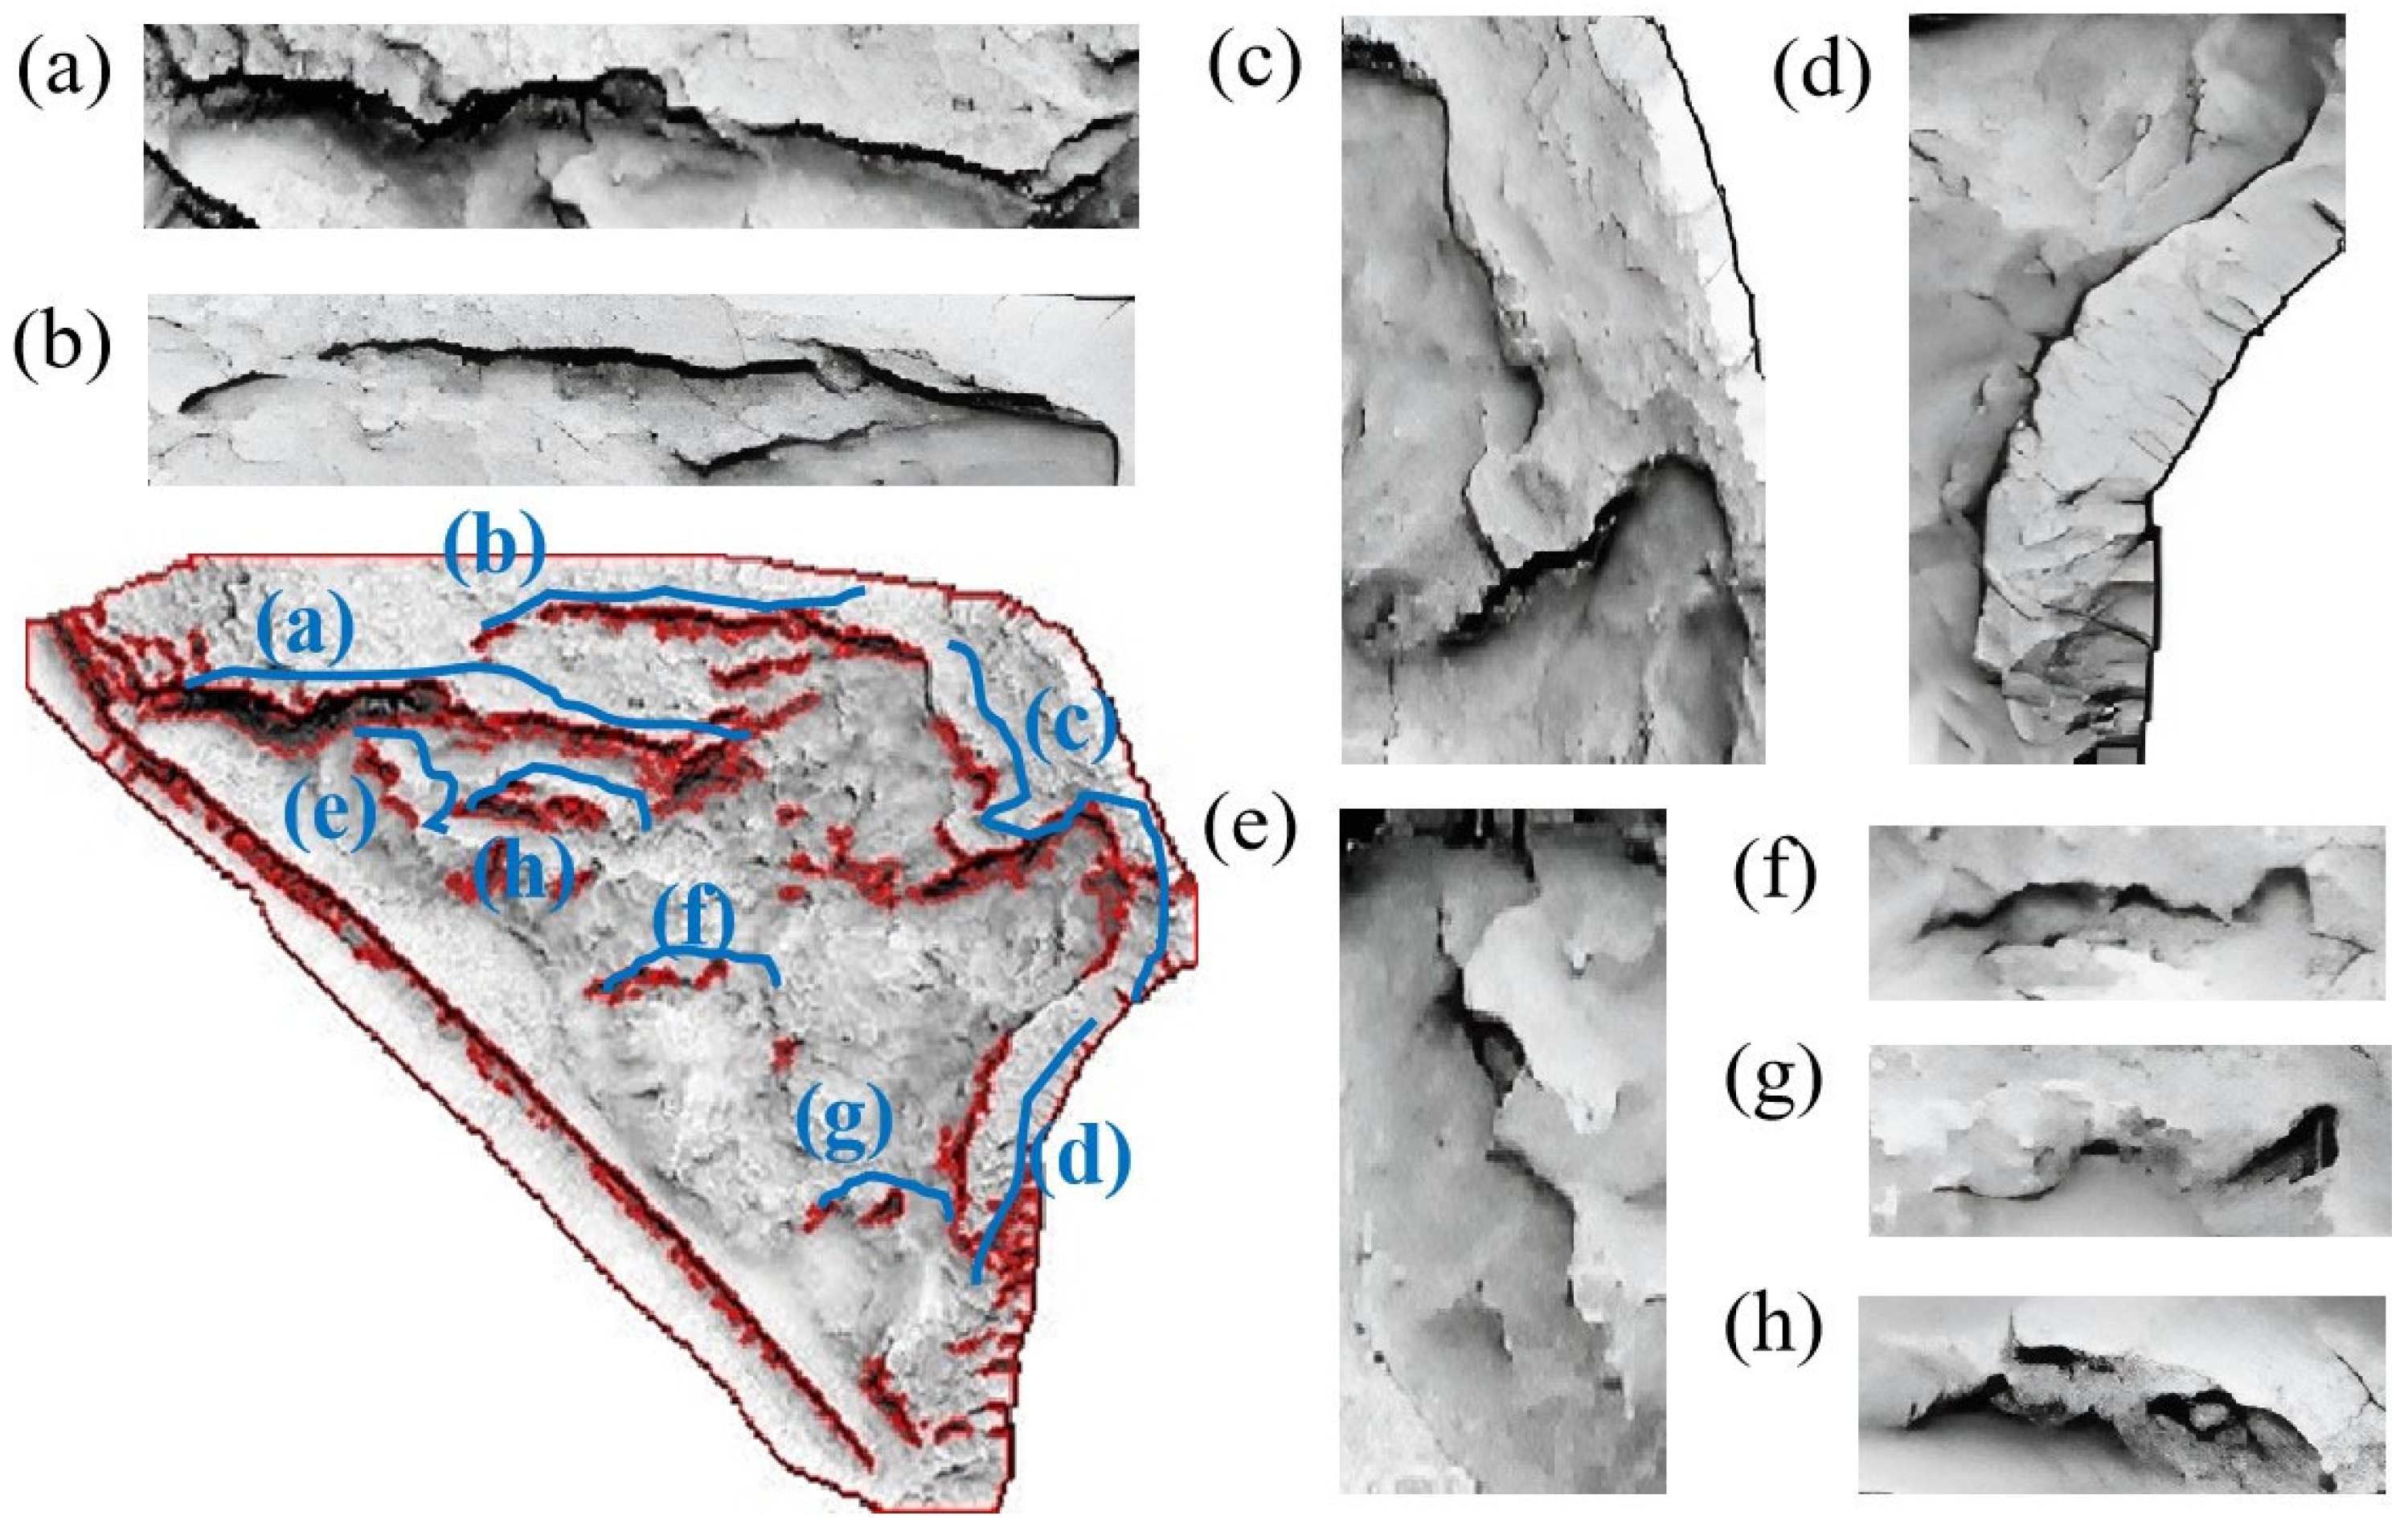
4.3.3. Results of Landslide Traces Contour Extraction

The landslide traces were effectively extracted using the contour extraction algorithm, and the traces of cracks, terraces, and depressions within the landslide perimeter and inside the landslide were effectively recognized in the final result of the landslide trace extraction (Figure 13).
In order to verify the effectiveness of the recognition results in this study, a three-dimensional model of the landslide area was constructed using the Context Capture software (Figure 14). From the three-dimensional model, the cracks in the upper-left corner of the landslide area can be observed (Figure 14b) and the landslide walls (Figure 14a,c,d). Due to vegetation coverage within the landslide interior, the optical three-dimensional model does not accurately reflect the authentic terrain features. As a result, the recognition of landslide terraces (Figure 14e,h) and depressions (Figure 14f,g) is unclear. However, on the DEM-MFFI, the recognition of landslide terraces (Figure 15e,h) and depressions (Figure 15f,g) is effective.

5. Discussion

A method for recognizing landslide trace features based on the fusion of multi-feature information from UAV-based LiDAR DEM is presented in this paper. The aim is to enhance the recognition of landslide traces and facilitate a deeper understanding of the terrain and topographic characteristics of landslides. In this section, the proposed method will be discussed, and the advantages of its application will be explored.
Initially, point cloud data acquired by UAV-based LiDAR was employed as the data source to construct a high-precision DEM and generate various multi-feature images that enhance the depiction of landslide terrain, including hillshading, slope, positive openness, and sky-view factor. These multi-feature information images offer a diverse perspective on the characteristics of landslides, thereby providing a foundational dataset for the accurate recognition of landslide traces. Subsequently, the Visualization for Archaeological Topography (VAT) method was applied to fuse and enhance the multi-feature information images of the DEM. By fusing these multi-feature information images, the DEM-MFFI was created. This enhanced representation effectively portrays the micro-terrain features of the landslide with greater clarity and accuracy.
Compared to optical remote sensing, the approach employed in this study, based on UAV-based LiDAR data, presents distinct advantages regarding landslide trace recognition. Firstly, while two-dimensional imagery primarily captured by optical remote sensing lacks terrain information, the acquisition of three-dimensional point cloud data is enabled by UAV-based LiDAR, delivering detailed insights into terrain and topography. Through the construction of high-precision DEM and the generation of multi-feature images illustrating landslide terrain, various aspects of the landslide’s characteristics can be comprehensively displayed from diverse perspectives, thereby facilitating the accurate recognition of landslide traces.
Finally, based on fractal theory, this paper extracts landslide traces from multi-feature fusion images. By applying fractal theory, landslide traces can be accurately located and extracted, improving the accuracy of landslide trace recognition. Compared with traditional mathematical analysis methods, fractal theory can reduce manual intervention based on the self-similarity between ground features. This paper uses the interquartile range method (IQR) and the single DEM product to recognize landslide traces [35]. Firstly, the statistical analysis of the DEM-MFFI pixel values was carried out, and the first quartile (Q1) was found to be 0.6, and the third quartile (Q3) was obtained to be 0.85. IQR is determined by the difference between the third quartile (Q3) and the first quartile (Q1). In this paper, n times the obtained IQR is used as the threshold for landslide trace extraction, and n = 1.5, 2.5, and 3.5 are respectively used to extract landslide traces. The extraction result is shown in Figure 16.
The recognition results (Figure 16) show that when n = 1.5, only a tiny portion of the landslide traces are recognized. When n = 2.5, the landslide perimeter is better recognized, but the landslide interior features are not accurately recognized. When n = 3.5, a large number of irrelevant weak terrain bumps are recognized, and the overall recognition of the landslide is poor. It can be seen that the IQR method for landslide traces recognition is highly dependent on the selection of the threshold n, and there is a certain degree of subjectivity, so the method proposed in this paper has certain advantages in recognizing landslide traces.
In addition, this study utilizes four single DEM products of hillshading, slope, positive openness, and sky view factor for landslide trace recognition using the method proposed in this paper, and the results are shown in Figure 17.
From the recognition results of the hillshading (Figure 17a), only part of the landslide perimeter area can be recognized, while the detailed features inside the landslide are blurred out and the subtle topography inside the landslide cannot be shown, which affects the accuracy and reliability of the recognition of the landslide traces. From the recognition result of the slope (Figure 17b), due to the large value of slope at the perimeter of the landslide and the gentle slope in the interior of the landslide, only the perimeter of the landslide can be recognized by using the slope, while the interior traces cannot be recognized. From the positive openness recognition results (Figure 17c): Because positive openness represents the degree of surface convexity, it provides relatively good results for recognizing elevated features along the landslide’s perimeter, including internal convex traces. However, it blurs the display of concave terrain, resulting in less effective recognition of concave landslide traces. From the results of the sky-view factor (Figure 17d), the sky-view factor can recognize the steep area of the landslide perimeter. However, it is not able to recognize the small traces inside the landslide, thus limiting its effectiveness in recognition.
In summary, all four single DEM products cannot completely recognize landslide traces. However, DEM-MFFI combines the features of the four DEM products, which can clearly show the small topographic features of landslides, and at the same time, it is not affected by the direction and shape of the topographic features, so it can completely recognize the landslide traces.

6. Conclusions

This study generated a high-precision DEM using UAV-based LiDAR point cloud data. Four DEM multi-feature images were generated, including hillshading, slope, positive openness, and sky-view factor. These multi-feature images were fused to create the DEM-MFFI, effectively enhancing the visualization of the landslide micro-terrain features. Leveraging the distinct fractal characteristics of landslides, the C-A fractal method was employed to accurately extract the landslide traces from a landslide site adjacent to a road in Luquan Miao and Yi Autonomous County, Yunnan Province, China. The following two conclusions were drawn:
  • UAV-based LiDAR point cloud data can be utilized to generate high-precision DEM and generate multi-feature images based on DEM. This study produced sky-view factor, slope, openness, and hillshading images, which were effectively enhanced through image fusion using the Visualization for Archaeological Topography (VAT) method, thereby improving the recognition of landslide traces.
  • Landslides result from complex geological activities and exhibit fractal characteristics in their occurrence and development. Utilizing the C-A fractal approach enables the effective extraction of landslide traces, overcoming the limitations of traditional statistical methods that manually select threshold values for the recognition of landslide traces.

Author Contributions

Conceptualization, P.D.; methodology, L.H.; software, L.H.; validation, L.H., P.D. and J.L. (Jiajia Liu); formal analysis, L.H. and J.L. (Jiajia Liu); investigation, L.H.; resources, P.D.; data curation, P.D.; writing—original draft preparation, L.H.; writing—review and editing, L.H., J.L. (Jia Li) and P.D.; visualization, L.H.; supervision, P.D. and J.L. (Jia Li); project administration, P.D.; funding acquisition, P.D. All authors have read and agreed to the published version of the manuscript.

Funding

This research was funded by the National Natural Science Foundation of China (No. 41961061), the Yunnan Fundamental Research Projects (No. 202301AT070061), the ‘Revitalizing Yunnan Talents Support Program’ project funding support (No. YNWR-QNBJ-2020-048, No. YNWR-QNBJ-2020-103), the Yunnan Academician and Expert Workstation (No. 2017IC063), and the Yunnan Provincial Basic Research Project-Key Project (No. 202201AS070024).

Data Availability Statement

The raw and processed data required for the current study could not be shared as they are also part of the ongoing research.

Conflicts of Interest

The authors declare no conflict of interest.

References

  1. Okyay, U.; Telling, J.; Glennie, C.L.; Dietrich, W.E. Airborne lidar change detection: An overview of Earth sciences applications. Earth-Sci. Rev. 2019, 198, 102929. [Google Scholar] [CrossRef]
  2. Azmoon, B.; Biniyaz, A.; Liu, Z. Use of High-Resolution Multi-Temporal DEM Data for Landslide Detection. Geosciences 2022, 12, 378. [Google Scholar] [CrossRef]
  3. Cai, J.; Zhang, L.; Dong, J.; Dong, X.; Li, M.; Xu, Q.; Liao, M. Detection and characterization of slow-moving landslides in the 2017 Jiuzhaigou earthquake area by combining satellite SAR observations and airborne Lidar DSM. Eng. Geol. 2022, 305, 106730. [Google Scholar] [CrossRef]
  4. Fang, K.; Tang, H.; Li, C.; Su, X.; An, P.; Sun, S. Centrifuge modelling of landslides and landslide hazard mitigation: A review. Geosci. Front. 2022, 14, 101493. [Google Scholar] [CrossRef]
  5. Van Tien, P.; Luong, L.; Duc, D.M.; Trinh, P.T.; Quynh, D.T.; Lan, N.C.; Thuy, D.T.; Phi, N.Q.; Cuong, T.Q.; Dang, K.; et al. Rainfall-induced catastrophic landslide in Quang Tri Province: The deadliest single landslide event in Vietnam in 2020. Landslides 2021, 18, 2323–2327. [Google Scholar] [CrossRef]
  6. Xu, Q.; Zhao, B.; Dai, K.; Dong, X.; Li, W.; Zhu, X.; Yang, Y.; Xiao, X.; Wang, X.; Huang, J.; et al. Remote sensing for landslide investigations: A progress report from China. Eng. Geol. 2023, 321, 107156. [Google Scholar] [CrossRef]
  7. Wu, Q.; Liu, Y.; Tang, H.; Kang, J.; Wang, L.; Li, C.; Wang, D.; Liu, Z. Experimental study of the influence of wetting and drying cycles on the strength of intact rock samples from a red stratum in the Three Gorges Reservoir area. Eng. Geol. 2023, 314, 107013. [Google Scholar] [CrossRef]
  8. Frangen, T.; Pavić, M.; Gulam, V.; Kurečić, T. Use of a LiDAR-derived landslide inventory map in assessing Influencing factors for landslide susceptibility of geological units in the Petrinja area (Croatia). Geol. Croat. 2022, 75, 35–49. [Google Scholar] [CrossRef]
  9. Wang, H.B.; Liu, G.J.; Xu, W.Y.; Wang, G.H. GIS-based landslide hazard assessment: An overview. Prog. Phys. Geogr. 2005, 29, 548–567. [Google Scholar]
  10. Van Den Eeckhaut, M.; Poesen, J.; Verstraeten, G.; Vanacker, V.; Moeyersons, J.; Nyssen, J.; Van Beek, L.P.H. The effectiveness of hillshade maps and expert knowledge in mapping old deep-seated landslides. Geomorphology 2005, 67, 351–363. [Google Scholar] [CrossRef]
  11. Lee, C.F.; Huang, W.K.; Huang, C.M.; Chi, C.C.; Mikos, M.; Tiwari, B.; Yin, Y.; Sassa, K. Deep-Seated Landslide Mapping and Geomorphic Characteristic Using High Resolution DTM in Northern Taiwan. In Advancing Culture of Living with Landslides; Springer: Berlin/Heidelberg, Germany, 2017; pp. 767–777. [Google Scholar]
  12. Lo, C.M.; Lee, C.F.; Keck, J. Application of sky view factor technique to the interpretation and reactivation assessment of landslide activity. Environ. Earth Sci. 2017, 76, 375. [Google Scholar] [CrossRef]
  13. Zakšek, K.; Oštir, K.; Kokalj, Ž. Sky-view factor as a relief visualization technique. Remote Sens. 2011, 3, 398–415. [Google Scholar] [CrossRef]
  14. Chen, G.; Li, X.; Chen, W.; Cheng, X.; Zhang, Y.; Liu, S. Extraction and application analysis of landslide influential factors based on LiDAR DEM: A case study in the Three Gorges area, China. Nat. Hazards 2014, 74, 509–526. [Google Scholar] [CrossRef]
  15. Chu, H.J.; Chen, Y.C.; Ali, M.Z.; Hofle, B. Multi-Parameter Relief Map from High-Resolution DEMs: A Case Study of Mudstone Badland. Int. J. Environ. Res. Public Health 2019, 16, 1109. [Google Scholar] [CrossRef] [PubMed]
  16. Chiba, T.; Kaneta, S.; Suzuki, Y. Red relief image map: New visualization method for three dimensional data. ISPRS Arch. 2008, 37, 1071–1076. [Google Scholar]
  17. Kaneda, H.; Chiba, T. Stereopaired Morphometric Protection Index Red Relief Image Maps (Stereo MPI-RRIMs): Effective Visualization of High-Resolution Digital Elevation Models for Interpreting and Mapping Small Tectonic Geomorphic Features. Bull. Seismol. Soc. Am. 2019, 109, 99–109. [Google Scholar] [CrossRef]
  18. Codru, I.; Niacsu, L.; Enea, A.; Bou-imajjane, L. Gully Head-Cuts Inventory and Semi-Automatic Gully Extraction Using LiDAR and Topographic Openness-Case Study: Covurlui Plateau, Eastern Romania. Land 2023, 12, 1199. [Google Scholar] [CrossRef]
  19. Fang, C.; Fan, X.; Zhong, H.; Lombardo, L.; Tanyas, H.; Wang, X. A Novel Historical Landslide Detection Approach Based on LiDAR and Lightweight Attention U-Net. Remote Sens. 2022, 14, 4357. [Google Scholar] [CrossRef]
  20. Yordanov, V.; Truong, Q.; Brovelli, M. Estimating Landslide Surface Displacement by Combining Low-Cost UAV Setup, Topographic Visualization and Computer Vision Techniques. Drones 2023, 7, 85. [Google Scholar] [CrossRef]
  21. Dai, K.; Li, Z.; Xu, Q.; Tomas, R.; Li, T.; Jiang, L.; Zhang, J.; Yin, T.; Wang, H. Identification and evaluation of the high mountain upper slope potential landslide based on multi-source remote sensing: The Aniangzhai landslide case study. Landslides 2023, 20, 1405–1417. [Google Scholar] [CrossRef]
  22. Liu, L.; Li, S.; Li, X.; Jiang, Y.; Wei, W.; Wang, Z.; Bai, Y. An integrated approach for landslide susceptibility mapping by considering spatial correlation and fractal distribution of clustered landslide data. Landslides 2019, 16, 715–728. [Google Scholar] [CrossRef]
  23. Yi, S.; Li, R.; Pu, X.; Fu, S. The fractal characteristics of fractures structure and activities distribution of the Zameila Mountain landslide in Tibet, China. In Engineering Geology. A Global View from the Pacific Rim, Proceedings of the 8th International Congress of the IAEG, Vancouver, BC, Canada, 21–25 September 1998; CRC Press: Rotterdam, The Netherlands, 2000; Volume 6, pp. 4245–4248. [Google Scholar]
  24. Yi, S.M.; Sun, Y.Z. Fractal characterization of regional landslide activities and its significance. In Proceedings of the International Symposium on Engineering Geology and the Environment, Athens, Greece, 23 June 1997; Volume 1, pp. 1155–1158. [Google Scholar]
  25. Sincic, M.; Bernat Gazibara, S.; Krkac, M.; Lukacic, H.; Arbanas, S.M. The use of high-resolution remote sensing data in preparation of input data for large-scale landslide hazard assessments. Land 2022, 11, 1360. [Google Scholar] [CrossRef]
  26. Wang, Z.; Tang, W.; Ma, Z.; Li, Y.; Yang, B.; Li, W.; Li, Y. Early identification of ridge-top landslide hazards in Jiuzhaigou area using InSAR-LiDAR method. Bull. Surv. Map. 2023, 5, 9–15. [Google Scholar]
  27. Fang, K.; Zhang, J.; Tang, H.; Hu, X.; Yuan, H.; Wang, X.; An, P.; Ding, B. A quick and low-cost smartphone photogrammetry method for obtaining 3D particle size and shape. Eng. Geol. 2023, 322, 107170. [Google Scholar] [CrossRef]
  28. Balta, H.; Velagic, J.; Bosschaerts, W.; De Cubber, G.; Siciliano, B. Fast statistical outlier removal based method for large 3D point clouds of outdoor environments. IFAC-PapersOnLine 2018, 51, 348–353. [Google Scholar] [CrossRef]
  29. Zhao, X.; Guo, Q.; Su, Y.; Xue, B. Improved progressive TIN densification filtering algorithm for airborne LiDAR data in forested areas. ISPRS J. Photogramm. Remote Sens. 2016, 117, 79–91. [Google Scholar] [CrossRef]
  30. Verbovsek, T.; Popit, T.; Kokalj, Z. VAT Method for Visualization of Mass Movement Features: An Alternative to Hillshaded DEM. Remote Sens. 2019, 11, 2946. [Google Scholar] [CrossRef]
  31. Mandelbrot, B. How long is the coast of Britain? Statistical self-similarity and fractional dimension. Science 1967, 156, 636–638. [Google Scholar] [CrossRef] [PubMed]
  32. Cheng, Q.; Agterberg, F.; Ballantyne, S. The separation of geochemical anomalies from background by fractal methods. J. Geochem. Explor. 1994, 51, 109–130. [Google Scholar] [CrossRef]
  33. Comaniciu, D.; Meer, P. Mean shift: A robust approach toward feature space analysis. IEEE Trans. Pattern Anal. Mach. Intell. 2002, 24, 603–619. [Google Scholar] [CrossRef]
  34. Kokalj, Ž.; Somrak, M. Why not a single image? Combining visualizations to facilitate fieldwork and on-screen mapping. Remote Sens. 2019, 11, 747. [Google Scholar] [CrossRef]
  35. Tarolli, P.; Sofia, G.; Dalla Fontana, G. Geomorphic features extraction from high-resolution topography: Landslide crowns and bank erosion. Nat. Hazards 2012, 61, 65–83. [Google Scholar] [CrossRef]
Figure 1. Location map of the study area.
Remotesensing 15 04755 g001
Figure 2. Landslide traces: (a) is the slip cliff, (b) is the flank, and (c,d) are the cracks.
Remotesensing 15 04755 g002
Figure 3. (a) Original point cloud and (b) ground point cloud.
Remotesensing 15 04755 g003
Figure 4. Overall process flowchart.
Remotesensing 15 04755 g004
Figure 5. Fusion process of DEM-MFFI: (a) is the layer A, (b) is the layer E, (c) is the layer F, and (d) is the DEM-MFFI.
Remotesensing 15 04755 g005
Figure 6. C-A fractal double logarithmic illustration.
Remotesensing 15 04755 g006
Figure 7. DEM and multi-feature images: (a) hillshading, (b) slope, (c) positive openness, (d) sky-view factor, and (e) DEM.
Remotesensing 15 04755 g007
Figure 8. Fusion result of DEM multi-feature images.
Remotesensing 15 04755 g008
Figure 9. A detailed image of DEM-MFFI: (a,d) is the flank; (b) is the crack; (c) is the slip cliff; (e,h) is the terrace; and (f,g) are the depressions.
Remotesensing 15 04755 g009
Figure 10. C-A fractal double logarithmic plot of the study area.
Remotesensing 15 04755 g010
Figure 11. (a) DEM-MFFI and (b) binary image.
Remotesensing 15 04755 g011
Figure 12. (a) Binary image and (b) denoised image.
Remotesensing 15 04755 g012
Figure 13. The final landslide trace extraction result.
Remotesensing 15 04755 g013
Figure 14. Three-dimensional model of the landslide area: (a,d) is the flank; (b) is the crack; (c) is the slip cliff; (e,h) is the terrace; (f,g) are the depressions; and (i) is the three-dimensional model.
Remotesensing 15 04755 g014
Figure 15. Landslide traces recognition result using DEM-MFFI: (a,d) is the flank; (b) is the crack; (c) is the slip cliff; (e,h) is the terrace; and (f,g) are the depressions.
Remotesensing 15 04755 g015
Figure 16. Landslide trace recognition results using the IQR method.
Remotesensing 15 04755 g016
Figure 17. Results of a single DEM product for recognizing landslide traces.
Remotesensing 15 04755 g017
Table 1. UAV flight parameter.
TypeFlight Parameters
Relative Altitude H (m)110
Number of Laser Returns (count)3
Pulse Repetition Frequency (kpts/s)240
Flight Speed (m/s)8
Range Accuracy (cm)±2
Lateral Overlap (%)85
Longitudinal Overlap (%)75
Scanning ModeRepeat Scanning
Table 2. Fusion parameter settings for DEM multi-feature images.
DEM Multi-Feature ImagesSettingsHistogram Stretch Type
Min–Max
Blending
Order, Type, and Opacity
sky-view factorradius of 5 m, 16
directions
linear, 0.65–1.00Three multiples,
25%
positive opennessradius of 5 m, 16
directions
linear, 68°–92°Two overlays,
50%
slope linear, 0°–55°One luminosity,
50%
hillshadingangle of 35°,
azimuth of 315°
linear, 0.00–1.00Zero base layer
Disclaimer/Publisher’s Note: The statements, opinions and data contained in all publications are solely those of the individual author(s) and contributor(s) and not of MDPI and/or the editor(s). MDPI and/or the editor(s) disclaim responsibility for any injury to people or property resulting from any ideas, methods, instructions or products referred to in the content.

