Abstract
To realize fast and effective synthetic aperture radar (SAR) deception jamming, a high-quality SAR deception jamming template library can be generated by performing sample augmentation on SAR deception jamming templates. However, the current sample augmentation schemes of SAR deception jamming templates face certain problems. First, the authenticity of the templates is low due to the lack of speckle noise. Second, the generated templates have a low similarity to the target and shadow areas of the input templates. To solve these problems, this study proposed a sample augmentation scheme based on generative adversarial networks, which can generate a high-quality library of SAR deception jamming templates with shadows. The proposed scheme solved the two aforementioned problems from the following aspects. First, the influence of the speckle noise was considered in the network to avoid the problem of reduced authenticity in the generated images. Second, a channel attention mechanism module was used to improve the network’s learning ability of the shadow features, which improved the similarity between the generated template and the shadow area in the input template. Finally, the single generative adversarial network (SinGAN) scheme, which is a generative adversarial network capable of image sample augmentation for a single SAR image, and the proposed scheme were compared regarding the equivalent number of looks and the structural similarity between the target and shadow in the sample augmentation results. The comparison results demonstrated that, compared to the templates generated by the SinGAN scheme, those generated by the proposed scheme had targets and shadow features similar to those of the original image and could incorporate speckle noise characteristics, resulting in a higher authenticity, which helps to achieve fast and effective SAR deception jamming.
1. Introduction
Synthetic aperture radar (SAR) deception jamming technology is effective in concealing important military facilities and operational equipment [1,2,3], enabling covert military operations [4,5]. The SAR deception jamming technology has the advantage of low power requirements, making it a popular research topic [6,7,8,9]. At present, the schemes for SAR deception jamming at the software level include using a SAR deception jamming template library and electromagnetic scattering models. Between the existing techniques, using a SAR deception jamming template library costs less time and manpower than using electromagnetic scattering models for deception jamming, which further facilitates the rapid implementation of deception jamming in practical scenarios. The effect of using a SAR deception jamming template library for deception jamming depends on the refinement level of the deception jamming templates [10,11,12]. However, deception jamming templates with a lower authenticity can be easily detected by the enemy, which reduces the effectiveness of deception jamming. In the SAR imaging of side-looking radar, real targets exhibit shadow features. Therefore, using SAR deception jamming templates with shadows for deception jamming is more deceptive than using templates without shadows. By augmenting the existing templates, an efficient library of SAR deception jamming templates with shadows can be established.
Currently, there are two types of sample augmentation schemes for SAR deception jamming templates with shadows, namely traditional schemes and deep learning-based schemes. The first type involves traditional techniques, such as translation, rotation, and scaling, to obtain augmented SAR deception jamming template libraries with shadows [13]. However, these schemes do not fundamentally alter the internal information in the images but only change the shape of the image targets at a geometric level. The processed shadow parts often lose their authentic correspondence with the targets, which limits the utility of deception jamming. The second type involves deep learning-based approaches for image sample augmentation, where deep learning models effectively capture the complex data distribution and features in SAR deception jamming templates with shadows, thus enabling the generation of more realistic and diverse templates [14]. There are two types of deep learning schemes: generating using a single template and generating using a dataset. Due to the easier availability of individual templates, using a single template has more advantages in terms of usability [15,16].
However, both types of the above-mentioned schemes do not consider the influence of SAR’s inherent speckle noise, leading to a lower similarity with the input template and a significant decrease in the authenticity of the deception jamming templates. Therefore, it is necessary to consider the characteristics of SAR’s speckle noise and design a fast and accurate sample augmentation network specifically for SAR deception jamming templates with shadows. This will enable the acquisition of a library of shadowed SAR deception jamming templates that are highly adaptable, diverse, and authentic within a short period of time. The existing deep learning models have significant differences in their speckle noise features between the generated SAR image and the original image when generating SAR images with speckle noise, resulting in poor performance. Introducing separate speckle noise can make the generated SAR image contain speckle noise features that are closer to the original image. The proposed scheme mainly uses the spatial attention mechanism (SAM) block, the inception block, and the residual dense block with the attention mechanism in the generator and uses a mixture of speckle noise and Gaussian noise as the noise input, which improves the network’s ability to extract features of targets, shadows, backgrounds, and speckle noise features. This results in the generated deception jamming templates having a high similarity with the input image template and a high authenticity.
The remainder of this paper is organized as follows. Section 2 describes the features of the input SAR spoofing jamming template with shadows and the training process and structure of the proposed generative adversarial network model. Section 3 evaluates the generated images and compares the proposed scheme with the single generative adversarial network (SinGAN) scheme, which is a generative adversarial network capable of image sample augmentation for a single SAR image. Finally, Section 4 concludes this paper.
2. Materials and Scheme
2.1. Scheme Overview
To realize the rapid and realistic sample augmentation of SAR deception jamming templates with shadows, it is necessary to design a network that considers the speckle noise and shadow features of the templates. This design aims to generate SAR deception jamming templates with shadows that have a higher similarity and accuracy than the input template with shadows. Since speckle noise is an inherent noise in SAR images, simulating the speckle noise and using it as one of the noise inputs is essential to enhance the deceptive nature of the generated SAR deception jamming templates with shadows. Through processing using a GAN, the speckle noise can be preserved in the generated templates with shadows. Moreover, in the SAR deception jamming templates with shadows, the background brightness is usually slightly darker in the shadowed areas than in other image areas, resulting in minimal brightness differences between the shadow regions and the surrounding areas. This makes it challenging for a GAN to learn the shadow features effectively. Therefore, it is necessary to enhance a network’s ability to extract shadow features. The specific workflow of the proposed scheme is as follows.
The network proposed in this scheme employs a pyramid-like multi-scale structure as an overall framework to capture the internal information in the SAR deception jamming templates with shadows. Due to the multiple scales of the network, from bottom to top, the scale gradually changes from rough to fine, and the shape of the generator and discriminator is similar to a pyramid, as shown in Figure 1. Each level of the pyramidal structure has a GAN responsible for generating and discriminating samples of the SAR deception jamming templates with shadows at the current scale [15]. The specific network architecture is shown in Figure 1. This approach requires capturing only the structural data of a single SAR deception jamming template with shadows at different scales and using it as a training set. Namely, this approach focuses on capturing both the global information and detailed local information of the SAR deception jamming templates with shadows.
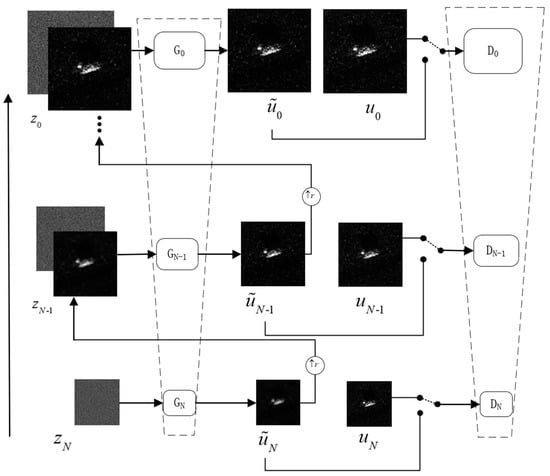
Figure 1.
Structure of the network. is the noise, is the input image, is the generated image, is the generator, is the number of layers, and is the discriminator.
As shown in Figure 1, represents the scale of the pyramid, which is defined by the size of the input SAR deception jamming template with shadows; represents the downsampled result set of the original input SAR deception jamming template with shadows at different scales, with a downsampling factor of , where and . is determined by the size of the input image, the initial image in the network, and the scale of the pyramid. The pyramid model starts training from the coarsest scale, and the first generator is capable of generating the augmented samples based on the input mixed noise , which is a combination of Gaussian white noise and speckle noise . The specific process can be expressed as follows.
After generating the sample by mixing the noise , the upsampled result of and the Gaussian white noise are both inputted into the next scale’s generator . Then, the generator generates a new sample . This process is performed iteratively, and the output of each scale’s generator can be represented as follows.
where represents the generator output at the ()th scale, where is the generator at that scale; refers to the mixed noise input specific to the ()th scale; and represents the upsampled output of from the th scale generator.
Noise from the th scale and the upsampled output of the generator at the ()th scale are simultaneously inputted into the generator. The main function of the generator is to generate the missing data in and incorporate them into . This process generates a new sample of the SAR deception jamming template with shadows, which is denoted by and can be expressed as follows.
where represents the mapping function from the upsampled output and noise , which is used to generate the details for the generator at the ()th scale.
The generators at the same scale share a similar structure. The entire training process progresses from bottom to top, starting from coarse to fine scales. At each scale, the output of a generator , in addition to being passed to the generator at the next scale, is fed into the discriminator . The discriminator compares the generated output from the th scale generator with the data obtained by downsampling the input SAR deception jamming template with shadows at the current scale. This process continues until the discriminator is unable to distinguish between the real and fake samples. A SAR deception jamming template with shadows, which is denoted by , is composed of three regions with different features: the target region , the shadow region , and the background region , as given in Equation (8). The target region contains complex and bright detailed information with regular shapes; a shadow region is characterized by darker areas and relatively clean content; the background region usually exhibits distinct texture details and lacks clear geometric shapes, making it easier for the network to learn.
2.2. Characteristics of the Input Template
During the training of the network proposed in this scheme, this network required an input of a SAR target deceptive jamming template with shadows. Based on the speckle noise characteristics and shadow features of the input template, the network performed sample augmentation on the SAR target deceptive jamming template with shadows.
The speckle noise refers to the granular speckle patterns that appear in SAR images due to the interaction of different echo phases during the SAR imaging process [17,18,19], as shown in Figure 2.
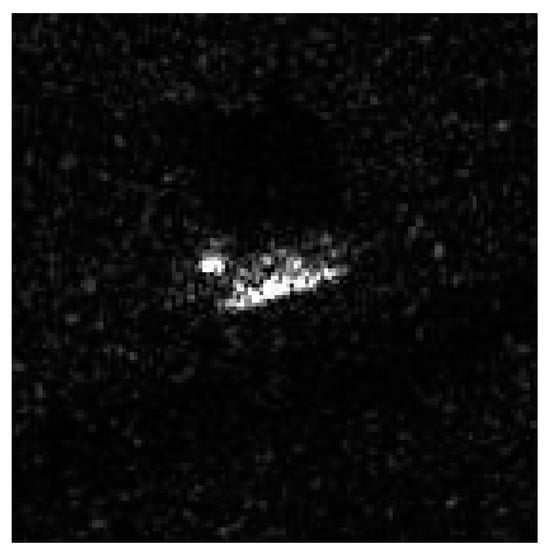
Figure 2.
SAR images with speckle noise.
This noise is an inherent characteristic of SAR images. Coherent speckle noise represents a multiplicative noise in SAR images, and a random distribution of SAR images can be mathematically modeled as follows [20].
where represents the observed SAR image, is the ideal image without speckle noise, and denotes the speckle noise generated during the SAR system imaging. The amplitude of the speckle noise in a SAR image follows a Rayleigh distribution, which is expressed by the following [21].
where represents the variance.
Given the imaging characteristics of side-looking SAR, certain areas of a target may be occluded and not illuminated by radar, resulting in no echo being generated. As a result, in the image domain, unilluminated areas appear as dark regions, known as shadows [22,23,24], as shown in Figure 3. Since the shadow regions are not illuminated by radar, a receiver does not receive any echo signals from these areas, and thus, there is no interaction between the different echo phases, leading to the absence of speckle noise in the shadow regions of a SAR deceptive jamming template.
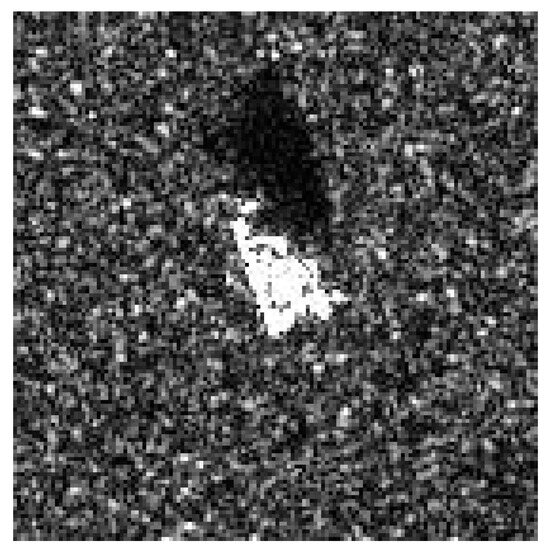
Figure 3.
SAR image tanks and its shadow.
Since the pixel intensity values of shadow regions should be minimal in the entire image, it is possible to identify shadow points by searching for subregions with the minimum average intensity in an image. In a SAR deceptive jamming template with shadows, a sliding window with side length is moved within an image, and the average intensity value within each window is computed. The shadow point corresponds to the center point of the subregion with the minimum average intensity, which can be expressed as follows.
where represents the side image length; , and .
All the pixels in the shadow area can be found using Equation (7). Therefore, the shadow region can be expressed by the following.
2.3. Specific Description of the Scheme
2.3.1. Generator Structure
The generator used a mixture of Gaussian noise and speckle noise as its initial input noise . Between the five fully convolutional networks composed of convolutional layers (Conv) [25], batch normalization layers (BN), and leaky rectified linear units (Leaky ReLU), a spatial attention mechanism (SAM) block was introduced [26,27,28,29]. At the image region level, it was required that the network capture high corresponding regions in the feature map, so that the model paid more attention to the corresponding regions of the feature map and processes the feature regions. The structure of the SAM block used pooling layers, convolutional layers, and sigmod activation functions to process the output of the SAM block, thereby achieving a response to the information from the different regions. The SAM block aimed to enhance the learning ability of a network toward the target and shadow regions. At the image region level, the SAM block helped the network capture the high-response areas in a feature map, particularly focusing on the regions corresponding to shadows in the feature map. It facilitated the processing of the shadow features in the SAR deception jamming template . Since the target and its shadow are crucial during the learning process, and the extraction of shadow features is challenging, an attention mechanism was adopted to improve the network’s capability of extracting the shape and contour features of the shadow region in a SAR deception jamming template . The inception block [30], which was placed in front of the generator , consisted of multiple scales, thus enabling a more detailed extraction of the shape contours and internal details of the SAR target and its shadow, and thereby enhancing the authenticity of the generated samples. After the generator convolved the input image with a convolution kernel of size 3 × 3, the output in the image was used as the input of the inception block. The inception block took the input as four branches, convolved them using convolution kernels of different sizes, and then spliced them together in the feature dimension. This block also reduced redundant information and accelerated the convergence speed. In addition, due to the different receptive fields, this module could obtain features at different scales, resulting in richer features. After the convolution operation, BN was performed, and then the activation function was used to better simulate the nonlinear features. Each pixel could stack more convolutions in the same receptive field to extract more features. The residual dense blocks with attention mechanisms used both residual connection and dense connection network design methods [31]. Among them, the dense connection part made full use of the features extracted by convolution at each level, had high feature extraction capabilities, and could prevent network problems. If it was too deep, the gradient would disappear. Residual connections allowed for the characteristics of forward propagation to be retained, that is, the results of each layer were obtained based on the previous results. This connection method not only prevented the disappearance of the network gradient, but also contributed to the convergence of the network. The residual dense blocks with attention mechanisms used in this article could make full use of the characteristics of the different scale targets obtained by the multi-scale module and improve the quality of the images generated by the generator. The residual dense blocks were densely connected by five convolutional layers, and each convolutional layer passed information to all the subsequent layers. Residual scaling was performed when calculating the output of this structure. After multiplying the residual by a constant between 0 and 1, it was added to the output of the main path, which effectively avoided the instability of the network structure. This paper added an attention mechanism based on the residual dense block. The first four convolutional layers of this module adopted a dense connection method to obtain more feature information. The last convolutional layer fused these feature information. The fused features passed through the channel attention module and the regional attention module. The different channels and regions were weighted, and the weighted features were used as the residuals and fused with the input of the module in the form of an addition of corresponding channels. The structure of the generator is shown in Figure 4.

Figure 4.
Block diagram of the generator.
2.3.2. Discriminator Structure
The discriminator adopted the patch-GAN approach [32,33,34], which was inspired by the Markovian discriminator concept. The discriminator consisted of five fully convolutional layers that used a downsampling scheme to capture the data distribution at the current scale, as shown in Figure 5. The discriminator used both the input SAR deception jamming template with shadows and the generated SAR deception jamming template with shadows as the input data. The fully convolutional network was responsible for learning the internal distribution information in the two input SAR deception jamming templates at the same scale. By calculating the loss function, the fully convolutional network discriminated between the real and generated SAR deception jamming templates with shadows at the current scale. In the adversarial game between the generator and discriminator , the generated SAR deception jamming templates with shadows became increasingly realistic. The comparison and loss function calculation were performed by contrasting the SAR deception jamming template with shadows generated at the current scale with the downsampled SAR deception jamming template with shadows.

Figure 5.
Structural diagram of the discriminator.
2.3.3. Loss Function
The model training started from the coarsest scale and followed the multi-scale structure shown in Figure 1. After training a scale, the corresponding GAN for that scale was fixed. The training loss of the th GAN included the adversarial loss and the reconstruction loss , which can be expressed as follows.
where represents the weight of the reconstruction loss in the training loss. The following section introduces the two losses separately.
Adversarial loss: Each scale’s generator was accompanied by a Markovian discriminator , which discriminated the authenticity of the generated shadowed SAR deception jamming templates at that scale. The discriminator’s discrimination of the mean value of the spectrum can be expressed by the following.
where is the average value function; is the distribution of a real image; is the distribution of the generated image; is the distribution of obeying ; is the distribution of obeying ; is the concentration area of the real sample; is the concentration area of the generated sample; is randomly interpolated between and , and ; is the distribution of obeying ; represents the discriminator output when discriminating the input shadowed SAR deception jamming template; represents the output of the discriminator when discriminating the generated shadowed SAR deception jamming template; represents the expectation; is the gradient operator; represents the norm; and represents the weight of the gradient loss function.
Reconstruction loss: To generate a specific noise map of the original image , assume that , where is the noise reconstructed at the th scale, and ; is the fixed noise map; and is the image generated at the th scale using the noise map. When , the reconstruction loss can be expressed by the following.
When , the reconstruction loss can be expressed by the following.
The training loss can be calculated by the adversarial loss and the reconstruction loss.
3. Results
3.1. Experimental Description
The experimental data included images from the MSTAR dataset [35,36,37]. The MSTAR data were collected using the Sandia National Laboratories SAR sensor platform with X-band SAR sensors, having a resolution of 0.3 m in the spotlight mode [38]. The publicly available MSTAR dataset consisted of ten different categories of ground targets, including armored vehicles (BMP-2, BRDM-2, BTR-60, and BTR-70), tanks (T-62, T-72), rocket launchers (2S1), anti-aircraft units (ZSU-234), trucks (ZIL-131), and bulldozers (D7). Furthermore, the MSTAR dataset covered various depression angles and orientations and has been widely used for testing and performance comparisons between SAR automatic target recognition algorithms.
In the experiment, the MSTAR data on a T72 tank with shadows were used as the input data for training the network proposed in this scheme. The goal was to generate a library of SAR deception jamming templates with shadows.
The experimental parameters were set as follows. The coarsest scale image size was set to 26 pixels × 26 pixels, the number of pyramid scales was set to eight, the sampling scale factor was 1.27, the number of training times for each scale was 2000, and the initial learning rate of the generator and discriminator was taken as 0.0005, the parameter update method adopted the adaptive moment estimation algorithm, and the exponential decay rate of the first-order moment estimation was taken as 0.5.
The loss variation curve during the training process is shown in Figure 6. The image had the number of training times as the horizontal axis and the loss function as the vertical axis. As the number of training times increased, the curve gradually decreased, and there was no overfitting or underfitting. When the number of training times was 2000, the value of the loss function was close to 0, indicating that the model performed well.
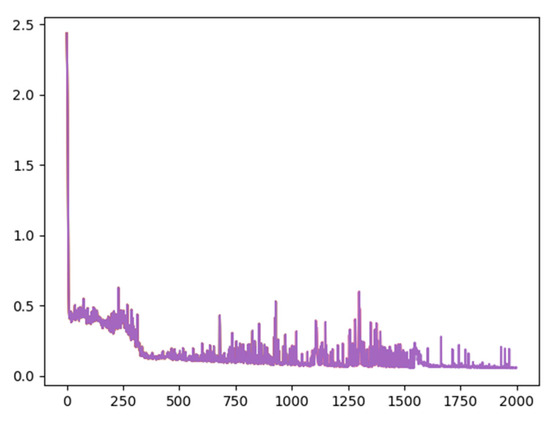
Figure 6.
The loss variation curve.
3.2. Experimental Result
The primary objective of the proposed network was to extract multi-faceted features from a target. It aimed to create SAR deception jamming templates with shadows that bear a striking resemblance to the shadowed features present in the input SAR deception jamming templates associated with the T72 tank. The 48 SAR deception jamming template with shadows of the T72 tank generated by the proposed network is presented in Figure 7. The comparison between the real SAR deception jamming template with shadows of the T72 tank and the SAR deception jamming template with shadows of the T72 tank generated by the proposed network is presented in Figure 1.
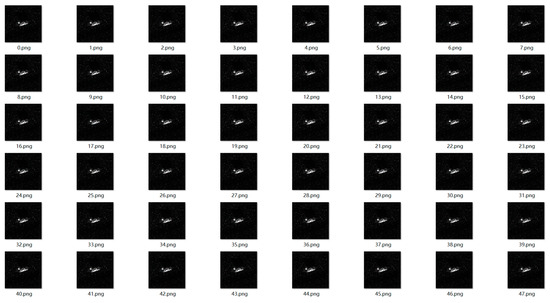
Figure 7.
48 SAR deception jamming templates with shadows of the T72 tank generated by the proposed network.
The SAR deception jamming template with shadows of the T72 tank generated by the proposed network showed that the image exhibited prominent features of speckle noise, indicating a high level of authenticity. Moreover, the shadow contour of the T72 tank was realistic and well defined, and the edges and internal details of the tank were accurately represented. The visual comparison of the real and generated SAR deception jamming template with shadows demonstrated that the generated template had a high level of authenticity.
3.3. Effectiveness Analysis of the Scheme
3.3.1. Quantitative Analysis of the Image Quality
To evaluate the quality of the generated SAR deception jamming templates with shadows, its targets, shadows, and speckle noise were assessed.
The equivalent number of looks (ENL) was used to measure the relative strength of the speckle noise in the deceptive jamming templates [39,40,41,42]. The ENL depicted the smoothness of the images and reflected the speckle character, since speckle noise appears grainy and may add false edges to an originally smooth region [43]. A lower ENL value indicated a greater presence of speckle noise. The ENL was calculated by the following.
where represents the mean value of the SAR image, and represents the standard deviation of the SAR image. The ENL was calculated for the background regions in each image.
The correlation coefficient (CC) describes the statistical correlation between two images. The more similar the two images, the greater the correlation coefficient [44]. For the original image and the generated image , with the size of , the average gradient index can be defined as the following.
where and are the mean values of and , respectively.
The gradient-based structural similarity (GSSIM) combines the information of the luminance comparison , contrast comparison , and gradient-based structure comparison in the image, which is shown in the equation below [45].
where
where and are the mean values of and , respectively, which reflect the luminance comparison information. and are the standard deviation of and , respectively, which reflect the contrast comparison information. and represent the gradient values of the pixels in row and column of and , respectively. , , and are the small constants that prevent the denominator from being zero. The parameters of , , and are greater than zero. In this paper, , , and . The higher the GSSIM value, the more similar and will be [46].
The average gradient (AG) can reflect the presentation abilities of the image details and textures, which is always used to assess the image sharpness [47]. For the evaluated image with the size of , the average gradient index can be defined as the following.
where are the coordinates of the image; and denote the horizontal and vertical gradient values, respectively. The larger the average gradient value, the richer information contained in the image, and the better the fused result.
The mean squared difference (MSD) is frequently used to measure the difference between the values predicted by a model, and it is utilized to evaluate the fluctuation of the gray value of the image and the degree of focus of the image [48]. For a given deceptive jamming template , the MSD can be defined as the following.
where is the average gray value of the given deceptive jamming template . A larger MSD corresponds to a clearer image.
The evaluation results shown in Figure 8 regarding the above four evaluation indicators are presented in Table 1.
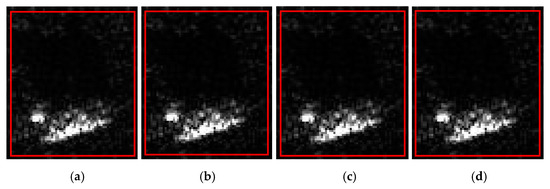
Figure 8.
Real image and three generated samples. (a) Real image; (b) sample 1; (c) sample 2; (d) sample 3.

Table 1.
Evaluation index calculation results.
Table 1 shows that the original image shown in Figure 8a had an ENL value of 2.5604. The generated SAR deception jamming templates with shadows had ENL values of 1.9764, 1.9090, and 1.9092, with an average value of 1.9315. Therefore, the difference between the ENL values of the generated templates and the original image was small, indicating a high similarity between the images of 75.44% (the ratio of the ENL between the two images). This result suggested that the generated SAR deception templates had a high authenticity.
The AG value of the original image shown in Figure 8a was 2.7145. The AG values of the generated SAR deception jamming templates with shadows were 2.7114, 2.6935, and 2.7235, respectively, with an average value of 2.7095. Therefore, the difference between the AG values of the generated template and the original image was small, indicating a high similarity of 97.41% (the ratio of the AG between the two images). This indicated that the generated SAR deception template had a high texture and structural similarity with the original image.
The MSD value of the original image shown in Figure 8a was 0.1540. The MSD values of the generated SAR deception jamming templates with shadows were 0.1580, 0.1580, and 0.1583, respectively, with an average value of 0.1581. Therefore, the difference between the MSD values of the generated template and the original image was small, indicating a high similarity of 97.41% (the ratio of the MSD between the two images). This indicated that the generated SAR deception template had a high similarity of grayscale and focusing characteristics with the original image.
For the original image and the generated SAR deception templates, the GSSIM and CC values of the target and shadow regions were calculated. The GSSIM values of the target and shadow regions of the original image and the generated templates were 0.9518, 0.9516, and 0.9546, with an average value of 0.9527, which indicated a high similarity of 95.27% between the generated and original images. The CC values of the target and shadow regions of the original image and the generated templates were 0.9964, 0.9963, and 0.9967, with an average value of 0.9965, which indicated a high similarity of 99.65% between the generated and original images. Therefore, the proposed scheme could generate SAR deception jamming templates with shadows that could exhibit a high similarity to the original image and have a high authenticity.
The following was an experiment on the truck (ZIL-131) and a calculation of the evaluation indicators. The generated images were shown in Figure 9.
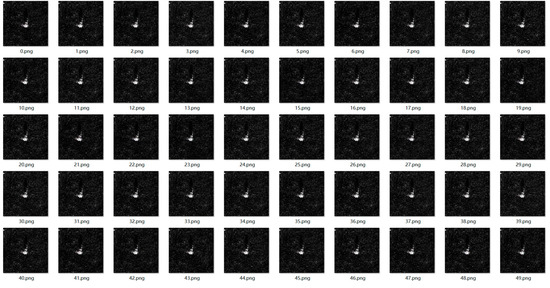
Figure 9.
50 SAR deception jamming templates with shadows of the trucks (ZIL-131) generated by the proposed network.
Table 2 showed that the similarities of the ENL value, the AG value, the MSD value, the GSSIM value, and CC value between the generated templates and the original image were 0.8333, 0.9627, 0.9833, 0.8626, and 0.9213, respectively, which indicated that the generated SAR deception template had a high texture and structural similarity with the original image and a high authenticity.

Table 2.
Evaluation index calculation results.
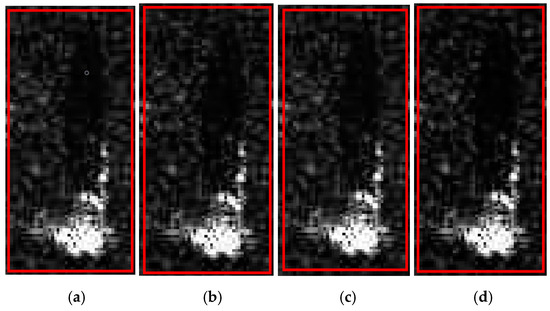
Figure 10.
Real image and three generated samples. (a) Real image; (b) sample 1; (c) sample 2; (d) sample 3.
Table 2.
Evaluation index calculation results.
| Image | ENL | AG | MSD | GSSIM | CC |
|---|---|---|---|---|---|
| Figure 10a (the original image) | 3.0648 | 4.3137 | 0.1200 | — | — |
| Figure 10b (the first sample) | 2.8589 | 4.1149 | 0.1167 | 0.8562 | 0.9060 |
| Figure 10c (the second sample) | 2.4291 | 4.3661 | 0.1206 | 0.9117 | 0.9543 |
| Figure 10d (the third sample) | 2.3734 | 3.9767 | 0.1166 | 0.8200 | 0.9036 |
| Average of the samples | 2.5538 | 4.1526 | 0.1180 | 0.8626 | 0.9213 |
| Similarity | 0.8333 | 0.9627 | 0.9833 | 0.8626 | 0.9213 |
3.3.2. Comparison with the SinGAN Scheme
This experiment was performed on shadowed T72 tank samples from the MSTAR dataset. Since the SinGAN is currently one of the schemes that could perform sample augmentation on the shadowed SAR deception jamming template, the SinGAN scheme was employed for the image sample augmentation of the SAR deception templates with shadows, resulting in a dataset of 48 T72 tank SAR deception templates, as shown in Figure 11. The comparison between the real SAR deception jamming template with shadows of the T72 tank and the SAR deception jamming template with shadows of the T72 tank generated by the proposed network is presented in Figure 11. Due to the poor quality of the generated images, three of the better images were selected for comparison.
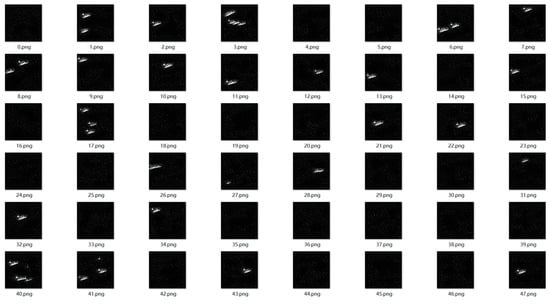
Figure 11.
48 SAR deception jamming templates with shadows of the T72 tank generated by the SinGAN.
The evaluation results shown in Figure 12 regarding the above four evaluation indicators are presented in Table 3.
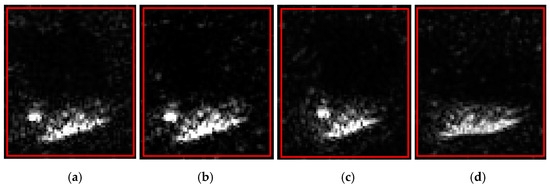
Figure 12.
Real image and three generated samples. (a) Real image; (b) sample 1; (c) sample 2; (d) sample 3.

Table 3.
Evaluation index calculation results.
The results in Table 3 showed that the ENL value of the original image shown in Figure 12a was 2.5604, and the ENL values of the generated SAR deception jamming templates with shadows were 1.6677, 1.7150, and 0.5637, with an average value of 1.3155. The average ENL of the generated templates showed a significant difference from the original image’s ENL value, indicating a low similarity of only 51.38%. This result suggested that the generated templates exhibited weaker speckle noise than the proposed approach, resulting in a lower authenticity.
The AG value of the original image shown in Figure 12a was 2.7145. The AG values of the generated SAR deception jamming templates with shadows were 2.3372, 2.1778, and 2.4288, respectively, with an average value of 2.3146. Therefore, the difference between the AG values of the generated template and the original image was significant, indicating a low similarity of 85.27% between the images. This indicated that the generated SAR deception template had a low texture and structural similarity with the original image.
The MSD value of the original image shown in Figure 12a was 0.1540. The MSD values of the generated SAR deception jamming templates with shadows were 0.1404, 0.1429, and 0.1766, respectively, with an average value of 0.1533, indicating a high similarity of 99.55% between the images. This indicated that the generated SAR deception template had a high similarity of grayscale and focusing characteristics with the original image.
For the original image and the generated SAR deception templates, the GSSIM and CC values of the target and shadow regions were calculated. The GSSIM values of the target and shadow regions of the original image and the generated templates were 0.5998, 0.5710, and 0.5514, with an average value of 0.5741, which indicated a low similarity of 57.41% between the generated and original images. The CC values of the target and shadow regions of the original image and the generated templates were 0.6492, 0.6353, and 0.8903, with an average value of 0.7249, which indicated a low similarity of 72.49% between the generated and original images. Therefore, the SinGAN scheme could generate SAR deception jamming templates with shadows that could exhibit a low similarity to the original image and have a low authenticity.
The following was an experiment on the truck (ZIL-131) and a calculation of the evaluation indicators. The generated images were shown in Figure 13.
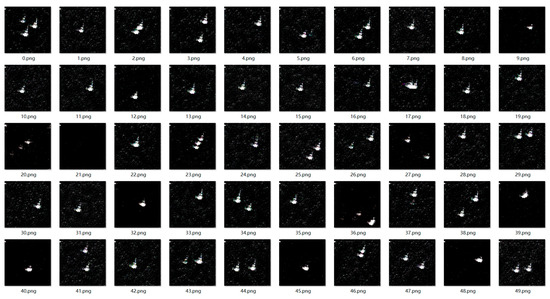
Figure 13.
50 SAR deception jamming template with shadows of the trucks (ZIL-131) generated by the SinGAN scheme.
Table 4 shows that the MSD value similarity was high, which indicated that the generated SAR deception template had a high similarity of grayscale and focusing characteristics with the original image. However, the similarities of the ENL value, the AG value, the GSSIM value, and CC value between the generated templates and the original image were 0.2181, 0.5816, 0.3677, and 0.1545, respectively, which indicated that the generated SAR deception template had a low texture and structural similarity with the original image and low authenticity.

Table 4.
Evaluation index calculation results.
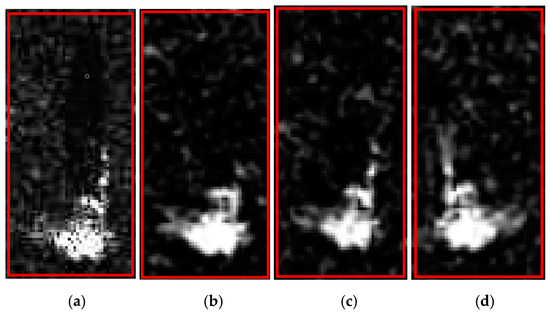
Figure 14.
Real image and three generated samples. (a) Real image; (b) sample 1; (c) sample 2; (d) sample 3.
Table 4.
Evaluation index calculation results.
| Image | ENL | AG | MSD | GSSIM | CC |
|---|---|---|---|---|---|
| Figure 14a (the original image) | 3.0648 | 4.3137 | 0.1200 | — | — |
| Figure 14b (the first sample) | 0.5175 | 2.4920 | 0.1198 | 0.3569 | 0.2734 |
| Figure 14c (the second sample) | 0.6091 | 2.3711 | 0.1206 | 0.4121 | 0.1214 |
| Figure 14d (the third sample) | 0.8786 | 2.6636 | 0.1300 | 0.3341 | 0.0686 |
| Average of the samples | 0.6684 | 2.5089 | 0.1235 | 0.3677 | 0.1545 |
| Similarity | 0.2181 | 0.5816 | 0.9717 | 0.3677 | 0.1545 |
3.3.3. Supplementary Experiments
The following two sets of supplementary experiments were performed using SAR tank (T72) images.
Firstly, we removed the spatial attention mechanism block from the generator without changing the other conditions, and the generated images are shown in Figure 15.

Figure 15.
Generated samples without the spatial attention mechanism block.
Table 5 shows that the similarities of the AG value, the MSD value, the GSSIM value, and CC value between the generated templates and the original image were 0.8798, 0.8161, 0.5574, and 0.2623, respectively, which indicated that the generated SAR deception template had a low texture and structural similarity with the original image. However, the original image shown in Figure 16a had an ENL value of 2.5604. The generated SAR deception jamming templates with shadows had an average ENL value of 2.8903, indicating a high similarity between the generated templates and the original image of 88.59%. It can be seen that when the SAM block was removed, the targets in the images had different appearance shapes, and they could not be identified as the shape of a tank. The low similarity between the tank and its shadow in the generated deception jamming template and the original image indicated that the quality of the generated deception jamming template was poor. This result suggested that the SAM block improved the network’s learning ability for the targets and their shadows.

Table 5.
Evaluation index calculation results.
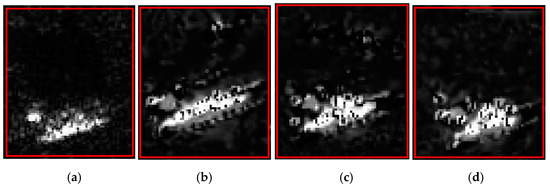
Figure 16.
Real image and three generated samples. (a) Real image; (b) sample 1; (c) sample 2; (d) sample 3.
Secondly, we replaced the mixed noise input into the generator with Gaussian noise and performed the experiment without changing the other conditions. The generated images are shown in Figure 17.
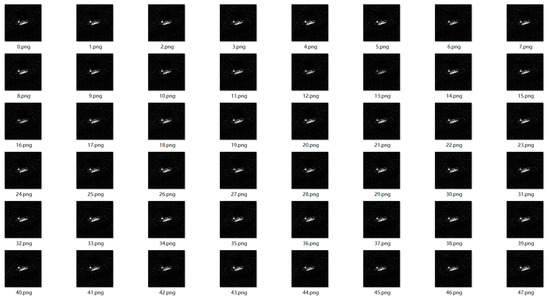
Figure 17.
Generated samples using the scheme without speckle noise.
Table 6 shows that the similarities of the AG value, the MSD value, the GSSIM value, and CC value between the generated templates and the original image were 0.9818, 0.9853, 0.8651, and 0.9811, respectively, which indicated that the generated SAR deception template had a high texture and structural similarity with the original image. However, the original image shown in Figure 18a had an ENL value of 2.5604. The generated SAR deception jamming templates with shadows had an average ENL value of 1.6314, indicating a low similarity between the generated templates and the original image of 63.71%. This result suggested that the generated SAR deception templates had a low authenticity. From this, it can be seen that the speckle noise improved the authenticity of the generated deception jamming templates.

Table 6.
Evaluation index calculation results.
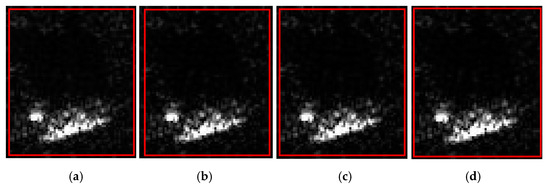
Figure 18.
Real image and three generated samples. (a) Real image; (b) sample 1; (c) sample 2; (d) sample 3.
4. Discussion
To achieve fast and effective SAR deception jamming, it is necessary to perform sample augmentation on SAR deception jamming templates to generate a high-quality template dataset. Currently, the existing sample augmentation schemes for SAR deception jamming templates face two main problems: low authenticity due to the absence of speckle noise and low similarity between the shadow regions in the generated templates and the original image. Therefore, this paper proposed a sample augmentation scheme based on GANs that could generate high-quality SAR deception jamming templates with shadows.
The proposed scheme adopted a pyramid-style multi-scale structure as an overall framework to capture the internal information in SAR deception jamming templates with shadows. Each level of the pyramidal structure had a GAN responsible for generating and discriminating the SAR deception jamming samples at that level. The generator used residual dense blocks with attention mechanisms, multi-scale modules, and region attention modules to enhance the network’s learning capability of the shadow features. In addition, speckle noise was introduced as the input data to the generator, ensuring that the generated images contained the characteristic features of speckle noise. The discriminator adopted a patch-GAN approach with five fully convolutional layers used to assess the quality of the generated images and compute the corresponding loss function, which improved the ability of both the generator and the discriminator iteratively to produce increasingly realistic images.
The effectiveness of the proposed scheme was demonstrated by comparing its results with those of the SinGAN scheme, regarding five evaluation metrics: the ENL, the AG, the MSD, the GSSIM, and the CC values. The comparison results showed that this scheme was significantly more similar to the original image in terms of the target, shadow, and speckle noise than the SinGAN scheme. This validated the effectiveness of the proposed approach for generating SAR deception jamming templates with shadows. Supplementary experiments were conducted to prove the effectiveness of the network’s speckle noise and spatial attention mechanism block.
In future research, more complex inception modules, such as Inception V3, could be considered to improve the computational efficiency of the generator further.
Author Contributions
Conceptualization, S.L.; methodology, Q.Z.; validation, Q.Z., W.L. and G.L.; formal analysis, Y.L.; investigation, K.C.; data curation, W.L.; writing—original draft preparation, G.L.; writing—review and editing, S.L.; supervision, K.C.; project administration, Y.L. All authors have read and agreed to the published version of the manuscript.
Funding
This research was funded by the Stable-Support Scientific Project from the China Research Institute of Radiowave Propagation, Grant No. A132003W02.
Data Availability Statement
Not applicable.
Acknowledgments
This experiment was supported by the Aerospace Information Innovation Institute of the Chinese Academy of Sciences and the China Radio Propagation Institute, and we would like to express our heartfelt thanks!
Conflicts of Interest
The authors declare no conflict of interest.
References
- Brown, W.M. Synthetic Aperture Radar. IEEE Trans. Aerosp. Electron. Syst. 1967, AES-3, 217–229. [Google Scholar] [CrossRef]
- Doerry, A.W.; Dickey, F.M. Synthetic aperture radar. Opt. Photonics News. 2004, 15, 28–33. [Google Scholar] [CrossRef]
- Sun, Z.; Leng, X.; Lei, Y.; Xiong, B.; Ji, K.; Kuang, G. BiFA-YOLO: A Novel YOLO-Based Method for Arbitrary-Oriented Ship Detection in High-Resolution SAR Images. Remote Sens. 2021, 13, 4209. [Google Scholar] [CrossRef]
- Qin, J.; Liu, Z.; Ran, L.; Xie, R.; Tang, J.; Zhu, H. An SAR Image Automatic Target Recognition Method Based on the Scattering Parameter Gaussian Mixture Model. Remote Sens. 2023, 15, 3800. [Google Scholar] [CrossRef]
- Pei, J.; Huo, W.; Wang, C.; Huang, Y.; Zhang, Y.; Wu, J.; Yang, J. Multiview deep feature learning network for SAR automatic target recognition. Remote Sens. 2021, 13, 1455. [Google Scholar] [CrossRef]
- Zhou, F.; Zhao, B.; Tao, M.; Bai, X.; Chen, B.; Sun, G. A large scene deceptive jamming method for space-borne SAR. IEEE Trans. Geosci. Remote Sens. 2013, 51, 4486–4495. [Google Scholar] [CrossRef]
- Sun, L.; Zhang, H.; Tang, Y.; Zhang, C. Research on deceptive jamming technologies against SAR. In Proceedings of the 2009 2nd Asian-Pacific Conference on Synthetic Aperture Radar, Xi’an, China, 26–29 October 2009; IEEE: Piscataway, NJ, USA; pp. 521–525. [Google Scholar]
- Wang, H.; Zhang, S.; Wang, W.-Q.; Huang, B.; Zheng, Z.; Lu, Z. Multi-scene deception jamming on SAR imaging with FDA antenna. IEEE Access 2019, 8, 7058–7069. [Google Scholar] [CrossRef]
- Sun, Q.; Shu, T.; Yu, K.-B.; Yu, W. Efficient deceptive jamming method of static and moving targets against SAR. IEEE Sens. J. 2018, 18, 3610–3618. [Google Scholar] [CrossRef]
- Tian, T.T.; Zhou, F.; Bai, X.; Zhang, Z.; Zhao, B.; Fan, W. A partitioned deceptive jamming method against TOPSAR. IEEE Trans. Aerosp. Electron. Syst. 2019, 56, 1538–1552. [Google Scholar] [CrossRef]
- Zhao, B.; Huang, L.; Li, J.; Liu, M.; Wang, J. Deceptive SAR jamming based on 1-bit sampling and time-varying thresholds. IEEE J. Sel. Top. Appl. Earth Obs. Remote Sens. 2018, 11, 939–950. [Google Scholar] [CrossRef]
- Zhao, B.; Huang, L.; Li, J.; Zhang, P. Target reconstruction from deceptively jammed single-channel SAR. IEEE Trans. Geosci. Remote Sens. 2017, 56, 152–167. [Google Scholar] [CrossRef]
- Vlahakis, V.; Ioannidis, M.; Karigiannis, J.; Tsotros, M.; Gounaris, M.; Stricker, D.; Gleue, T.; Daehne, P.; Almeida, L. Archeoguide: An augmented reality guide for archaeological sites. IEEE Comput. Graph. Appl. 2002, 22, 52–60. [Google Scholar] [CrossRef]
- Wenzel, M. Generative Adversarial Networks and Other Generative Models. Machine Learning for Brain Disorders; Springer: New York, NY, USA, 2012; pp. 139–192. [Google Scholar]
- Shaham, T.R.; Dekel, T.; Michaeli, T. Singan: Learning a generative model from a single natural image. In Proceedings of the IEEE/CVF International Conference on Computer Vision, Seoul, Republic of Korea, 27 October–2 November 2019; pp. 4570–4580. [Google Scholar]
- Fan, W.; Zhou, F.; Zhang, Z.; Bai, X.; Tian, T. Deceptive jamming template synthesis for SAR based on generative adversarial nets. Signal Process. 2020, 172, 107528. [Google Scholar] [CrossRef]
- Goodman, J.W. Some fundamental properties of speckle. JOSA 1976, 66, 1145–1150. [Google Scholar] [CrossRef]
- Lee, J.S.; Grunes, M.R.; De Grandi, G. Polarimetric SAR speckle filtering and its implication for classification. IEEE Trans. Geosci. Remote Sens. 1999, 37, 2363–2373. [Google Scholar]
- Raney, R.K.; Wessels, G.J. Spatial considerations in SAR speckle consideration. IEEE Trans. Geosci. Remote Sens. 1988, 26, 666–672. [Google Scholar] [CrossRef]
- Mullissa, A.G.; Marcos, D.; Tuia, D.; Herold, M.; Reiche, J. DeSpeckNet: Generalizing deep learning-based SAR image despeckling. IEEE Trans. Geosci. Remote Sens. 2020, 60, 1–15. [Google Scholar] [CrossRef]
- Lee, J.S.; Jurkevich, L.; Dewaele, P.; Wambacq, P.; Oosterlinck, A. Speckle filtering of synthetic aperture radar images: A review. Remote Sens. Rev. 1994, 8, 313–340. [Google Scholar] [CrossRef]
- Tang, X.; Zhang, X.; Shi, J.; Wei, S.; Yu, L. SAR deception jamming target recognition based on the shadow feature. In Proceedings of the 2017 25th European Signal Processing Conference (EUSIPCO), Kos Island, Greece, 28 August–2 September 2017; IEEE: Piscataway, NJ, USA; pp. 2491–2495. [Google Scholar]
- Papson, S.; Narayanan, R.M. Classification via the shadow region in SAR imagery. IEEE Trans. Aerosp. Electron. Syst. 2012, 48, 969–980. [Google Scholar] [CrossRef]
- Cui, J.; Gudnason, J.; Brookes, M. Radar shadow and superresolution features for automatic recognition of MSTAR targets. In Proceedings of the International Radar Conference, Arlington, VA, USA, 9–12 May 2005; IEEE: Piscataway, NJ, USA; pp. 534–539. [Google Scholar]
- Nebauer, C. Evaluation of convolutional neural networks for visual recognition. IEEE Trans. Neural Netw. 1998, 9, 685–696. [Google Scholar] [CrossRef]
- Zhu, X.; Cheng, D.; Zhang, Z.; Lin, S.; Dai, J. An empirical study of spatial attention mechanisms in deep networks. In Proceedings of the IEEE/CVF International Conference on Computer Vision, Seoul, Republic of Korea, 27 October–2 November 2019; pp. 6688–6697. [Google Scholar]
- Chun, M.M.; Jiang, Y. Contextual cueing: Implicit learning and memory of visual context guides spatial attention. Cogn. Psychol. 1998, 36, 28–71. [Google Scholar] [CrossRef]
- Hoffman, J.E.; Subramaniam, B. The role of visual attention in saccadic eye movements. Percept. Psychophys. 1995, 57, 787–795. [Google Scholar] [CrossRef]
- Deubel, H.; Schneider, W.X. Saccade target selection and object recognition: Evidence for a common attentional mechanism. Vis. Res. 1996, 36, 1827–1837. [Google Scholar] [CrossRef]
- Szegedy, C.; Vanhoucke, V.; Ioffe, S.; Shlens, J.; Wojna, Z. Rethinking the inception architecture for computer vision. In Proceedings of the IEEE Conference on Computer Vision and Pattern Recognition, New Orleans, LA, USA, 26 June–1 July 2016; pp. 2818–2826. [Google Scholar]
- Zhang, Y.; Tian, Y.; Kong, Y.; Zhong, B.; Fu, Y. Residual dense network for image super-resolution. In Proceedings of the IEEE Conference on Computer Vision and Pattern Recognition, Salt Lake City, UT, USA, 18–22 June 2018; pp. 2472–2481. [Google Scholar]
- Wang, Y.; Yan, X.; Guan, D.; Wei, M.; Chen, Y.; Zhang, X.P.; Li, J. Cycle-snspgan: Towards real-world image dehazing via cycle spectral normalized soft likelihood estimation patch gan. IEEE Trans. Intell. Transp. Syst. 2022, 23, 20368–20382. [Google Scholar] [CrossRef]
- Leihong, Z.; Zhai, Y.; Xu, R.; Wang, K.; Zhang, D. An End-to-end Computational Ghost Imaging Method that Suppresses. Phys. Rev. Lett. 2002, 89, 113601. [Google Scholar]
- Saypadith, S. A Study on Anomaly Detection in Surveillance. Neural Netw. 2006, 313, 504–507. [Google Scholar]
- Lin, C.; Peng, F.; Wang, B.H.; Sun, W.F.; Kong, X.J. Research on PCA and KPCA self-fusion based MSTAR SAR automatic target recognition algorithm. J. Electron. Sci. Technol. 2012, 10, 352–357. [Google Scholar]
- Keydel, E.R.; Lee, S.W.; Moore, J.T. MSTAR extended operating conditions: A tutorial. Algorithms Synth. Aperture Radar Imag. III 1996, 2757, 228–242. [Google Scholar]
- Yang, Y.; Qiu, Y.; Lu, C. Automatic target classification-experiments on the MSTAR SAR images. In Proceedings of the Sixth International Conference on Software Engineering, Artificial Intelligence, Networking and Parallel/Distributed Computing and First ACIS International Workshop on Self-Assembling Wireless Network, Towson, MD, USA, 20–22 June 2005; IEEE: Piscataway, NJ, USA; pp. 2–7. [Google Scholar]
- Chakraborty, S.; Amrita, A.; Choudhury, T.; Sille, R.; Dutta, C.; Dewangan, B.K. Multi-view deep cnn for automated target recognition and classification of synthetic aperture radar image. J. Adv. Inf. Technol. Vol. 2022, 13, 415–416. [Google Scholar] [CrossRef]
- Vespe, M.; Greidanus, H. SAR image quality assessment and indicators for vessel and oil spill detection. IEEE Trans. Geosci. Remote Sens. 2012, 50, 4726–4734. [Google Scholar] [CrossRef]
- Tang, Z.; Yu, C.; Deng, Y.; Fang, T.; Zheng, H. Evaluation of Deceptive Jamming Effect on SAR Based on Visual Consistency. IEEE J. Sel. Top. Appl. Earth Obs. Remote Sens. 2021, 14, 12246–12262. [Google Scholar] [CrossRef]
- Cui, Y.; Zhou, G.; Yang, J.; Yamaguchi, Y. Unsupervised estimation of the equivalent number of looks in SAR images. IEEE Geosci. Remote Sens. Lett. 2011, 8, 710–714. [Google Scholar] [CrossRef]
- Kulkarni, S.; Kedar, M.; Rege, P.P. Comparison of Different Speckle Noise Reduction Filters for RISAT-1 SAR Imagery. In Proceedings of the 2018 International Conference on Communication and Signal Processing (ICCSP), Melmaruvathur, India, 16–19 March 2018; IEEE: Piscataway, NJ, USA; pp. 0537–0541. [Google Scholar]
- Gong, G.; Zhang, H.; Yao, M. Speckle noise reduction algorithm with total variation regularization in optical coherence tomography. Opt. Express 2015, 23, 24699–24712. [Google Scholar] [CrossRef] [PubMed]
- Asuero, A.G.; Sayago, A.; González, A.G. The correlation coefficient: An overview. Crit. Rev. Anal. Chem. 2006, 36, 41–59. [Google Scholar] [CrossRef]
- Liu, Y.; Yue, H. The Temperature Vegetation Dryness Index (TVDI) Based on Bi-Parabolic NDVI-Ts Space and Gradient-Based Structural Similarity (GSSIM) for Long-Term Drought Assessment Across Shaanxi Province, China (2000–2016). Remote Sens. 2018, 10, 959. [Google Scholar] [CrossRef]
- Chen, G.H.; Yang, C.L.; Xie, S.L. Gradient-based structural similarity for image quality assessment. In Proceedings of the 2006 International Conference on Image Processing, Atlanta, GA, USA, 8–11 October 2006; IEEE: Piscataway, NJ, USA; pp. 2929–2932. [Google Scholar]
- Cui, G.; Feng, H.; Xu, Z.; Li, Q.; Chen, Y. Detail preserved fusion of visible and infrared images using regional saliency extraction and multi-scale image decomposition. Opt. Commun. 2015, 341, 199–209. [Google Scholar] [CrossRef]
- Zhao, W.; Wang, D.; Lu, H. Multi-focus image fusion with a natural enhancement via a joint multi-level deeply supervised convolutional neural network. IEEE Trans. Circuits Syst. Video Technol. 2018, 29, 1102–1115. [Google Scholar] [CrossRef]
Disclaimer/Publisher’s Note: The statements, opinions and data contained in all publications are solely those of the individual author(s) and contributor(s) and not of MDPI and/or the editor(s). MDPI and/or the editor(s) disclaim responsibility for any injury to people or property resulting from any ideas, methods, instructions or products referred to in the content. |
© 2023 by the authors. Licensee MDPI, Basel, Switzerland. This article is an open access article distributed under the terms and conditions of the Creative Commons Attribution (CC BY) license (https://creativecommons.org/licenses/by/4.0/).