Abstract
Precipitation fluctuations in the Pearl River Basin (PRB) have a significant impact on river runoff, causing huge economic losses and casualties. However, future precipitation variations in the PRB remain unclear. Therefore, we explored the projected changes in precipitation in the PRB based on the coupled model intercomparison project phase 6 (CMIP6) model via three shared socio-economic pathways scenarios (SSP1-2.6, SSP2-4.5, and SSP5-8.5). In our study, the optimal ensemble of global climate models in the PRB was identified using the comprehensive rating index (CRI), which is based on climatology, spatial variation, and interannual variability, and it was used to analyze potential precipitation changes in the basin in the period 2025–2100. The results showed that the CMIP6 models underestimated precipitation in the PRB; the consistency between the observations and the multi-model ensemble mean of the four best models was higher than those of any other ensembles, and the CRI value was highest (0.92). The annual precipitation in the PRB shows a significant increasing trend under three scenarios from 2025 to 2100 (p < 0.01), with the highest rate of precipitation increase being seen under the high-emission scenario. By the end of the 21st century, the regional mean precipitation in the PRB will increase by 13%, 9.4%, and 20.1% under SSP1-2.6, SSP2-4.5, and SSP5-8.5 scenarios, respectively. Spatially, the entire basin is projected to become wetter, except for a slight decrease of less than 6% in the central part of the basin and the Pearl River Delta in the near term in the 21st century, and the highest increases are projected to occur in the Xijiang River basin.
1. Introduction
As an important process involved in the hydrological cycle and water resources provided by terrestrial ecosystems [1], precipitation greatly influences regional flooding, drought, and sustainable development [2]. The Intergovernmental Panel on Climate Change has found that the intensity, frequency, and duration of climate extremes increase in the context of climate change [3,4,5], in turn influencing regional mean runoff [6] and causing extreme events, such as flooding [7] and drought [8]. The Pearl River Basin (PRB) is one of the three main basins in China; its downstream region is economically developed and densely populated, and its upstream region covers many farming areas [9,10]. Since the late 1970s, the PRB has played an important role in enabling the sustainable development of the Chinese economy. In particular, the Pearl River Delta accounts for ~0.4% of China’s land territory, ~20% of its national gross domestic product, and 40% of all foreign investment in the country [11,12]. However, because the basin’s climate is primarily governed by subtropical monsoons, precipitation is unevenly distributed throughout the year, which leads to frequent large and heavy floods during the flood season, as well as a continuous dry period [13]. Under the trend of warming, the basin suffers frequent and severe droughts and floods, which cause large economic losses and ecosystem destruction [14,15,16,17]. To improve socio-economic and ecological security in the PRB, it is important to explore the variability in future precipitation.
Global climate models (GCMs) produced through the efforts of the scientific community within the framework of the Coupled Model Intercomparison Project (CMIP) are widely used to understand historical climate change and predict future changes in climatic conditions [18,19,20]. At present, the CMIP is in phase 6 (CMIP6). Compared to CMIP5, CMIP6 has significantly improved physical procedures, biogeochemical cycles, the spatial resolution, and the parameterizing methods [21]. Additionally, future scenarios include the feedback provided to different forcings, land use changes, geo-engineering, and an updated collection of shared socio-economic pathways (SSPs), ensuring that the analyses are more realistic [22]. Therefore, many researchers have forecasted future precipitation variability at the global and regional scale using the CMIP6 datasets. Examples of previously studied areas include the globe [23,24], South America [25], Northern Europe [26], and Central Asia [27]. Moreover, many studies have been conducted in terms of the aspect of projecting precipitation in various regions of China using GCMs [28,29,30]. For instance, Tian and Guo [31] projected a fluctuating upward trend in mean annual precipitation in China from 2015 to 2099 based on the selected eight models assessed under all SSP scenarios. Another study Chen and Duan [32] reported that there will be an increase in seasonal precipitation over the Tibetan Plateau during the 21st century. However, GCM outputs include various uncertainties arising from the structure of the models, parametrization, assumptions, calibration processes, etc., [33]. It is vital to evaluate the accuracy of GCM outputs for different variables in various regions before conducting future regional climate studies [34]. This approach allows us to fully comprehend the underlying biases affecting simulations within a given region, as well as ensure the selection of models with superior performance to enhance the precision of projected variations. Zhu and Ji [35] evaluated the performance of outputs from the High-Resolution Model Intercomparison Project in three major river basins (the Yellow River Basin, Yangtze River Basin, and the PRB) in China and concluded that high-resolution simulations clearly improved precipitation indices, particularly in CMIP5. Xiao and Lu [36] screened the best models from among 47 CMIP5 GCMs in terms of precipitation simulations in the PRB; five models (BCC-CSM1.1, CanESM2, CSIRO-Mk3.6.0, GISS-E2-R, and MPI-ESM-LR) performed well in this respect. Previous studies of the PRB were limited to a few models or previously published GCMs, and the regional performance of each model was not evaluated in detail [37,38]. The results of these studies may not reliably represent the pattern of precipitation in the basin. Consequently, it is necessary to evaluate newly released models of future precipitation trends in the PRB.
The outputs of single models are invariably subject to bias and uncertainty, and they, thus, prevent accurate predictions of future climatic patterns [39,40]. Generally, the multi-model ensemble average (MME) approach can eliminate the most noise in single models, thereby reducing uncertainties in simulations and enhancing model performance compared to those of individual models [41]. Previous studies projected the precipitation applied via the MME approach to GCMs [42,43,44]. For example, Wu and Lei [29] used the MME to predict the future characteristics of the upper Yangtze River. They noted that the mean annual precipitation would increase under the three SSPs, with a significant increase occurring under SSP1-2.6. However, some models do not perform well for certain variables at the regional scale [27,45]. The simulation performance of the MME is profoundly influenced by poorly performing models. Therefore, compared to the MME, the multi-model ensemble mean of the best models (BMME) may provide more reliable and credible projections because it only considers high-performing models [46,47]. Moreover, the optimal number of GCMs required to generate the ensemble has not been determined [48]. Previous studies mainly used ensembles comprising 3–10 descending models [32,49,50,51] or set thresholds to enable evaluation indicators to identify the best models [52]. Thus, these studies have some limitations in terms of determining the best simulations for a given region. Therefore, determining the most appropriate datasets and optimal number of GCMs required to generate the ensemble in the PRB is another goal of this study.
In this study, we assessed the ability of CMIP6 GCMs to reproduce the historical precipitation in the PRB and simulated the spatiotemporal changes in precipitation for three periods (near term: 2025–2044; medium term: 2045–2064; long term: 2081–2100) in the 21st century under the combined scenarios of the shared socio-economic pathways and representative concentration pathways (SSPs-RCPs). We sought to answer the following questions: (1) how well do CMIP6 models reproduce the climatology, spatial patterns, and interannual variability in historical precipitation in the PRB? (2) Which ensemble method is optimal for the simulation of the precipitation, and how effective is the statistical bias correction method that we applied? (3) How will annual precipitation change in terms of time and space in the PRB under the three scenarios. The exploration of these questions is not only beneficial in terms of further understanding the way in which precipitation in the PRB responds to global warming, but also of great importance to perform further research into changes in hydrological drought and flood, improving water resource management, mitigating watershed disaster risks, optimizing agricultural and ecosystem management, and helping communities to cope with climate change in the region.
2. Methods and Materials
2.1. Study Area
The Pearl River (Figure 1), which is located in southern China, is the third largest river in China, having a watershed of 4.54 × 10⁵ km2. The Pearl River flows through Yunnan, Guizhou, Guangxi, Guangdong, Hunan, and Jiangxi provinces and northern Vietnam. It consists of the West River, North River, and East River and the Pearl River Delta system [53]. The terrain in the basin is complex and diverse, but mainly comprises mountains and hills. The plain area is small and diffuse, accounting for only 5.5% of the total area. The terrain decreases from the northwest to the southeast [12]. The PRB is located in the tropical and subtropical climate zones; the central part of the Tropic of Cancer crosses the basin. The annual average temperature is 14–22 °C, and the annual average precipitation rate is 1200–2200 mm. The seasonal distribution of precipitation is uneven; about 80% of annual precipitation occurs between April and September, and there is no or little rain for 3 consecutive months during the dry season [54,55].
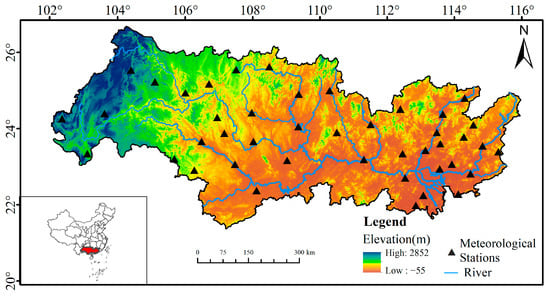
Figure 1.
Location of the Pearl River Basin and distribution of meteorological stations.
2.2. Data
The daily precipitation rate simulations for CMIP6 covering the historical period (1995–2014) and the future period (2015–2100) were obtained from the Earth System Grid Federation website (https://esgf-node.llnl.gov/search/cmip6, accessed on 3 June 2022). Twenty-one CMIP6 GCMs were considered, and the condition of selection was the availability of precipitation variables, which were available for the historical period, and three SSPs, which were available at the start of this study. Table 1 presents a summary of the detailed information used by the 21 CMIP6 models. The future projections will be driven by three new scenarios—SSP1-2.6, SSP2-4.5, and SSP5-8.5—that combined the SSPs and representative concentration pathways (RCPs). Specifically, the SSP1-2.6 represents the combined effects of low social vulnerability, low challenges for mitigation, and a low forcing signal. The SSP2-4.5 is a scenario that combines intermediate societal vulnerability with an intermediate forcing level. The SSP5-8.5 is the only SSP scenario in which emissions are high enough to produce a radiative forcing of 8.5 W m−2 in 2100 [22,56]. The SSP1-2.6, SSP2-4.5 and SSP5-8.5 scenarios used in our study symbolized a low-, a medium-, and a high-emission scenario, respectively. In addition, because of the inconsistent resolution of the model data, we interpolated all selected models into a 0.25° × 0.25° spatial grid using bilinear interpolation.

Table 1.
List of CMIP6 GCMs used in this study.
Daily precipitation data derived from 1995 to 2014 at 43 national standard meteorological stations were obtained from the Chinese Meteorological Administration (http://data.cma.cn/) and used as the reference dataset to evaluate the models. Figure 1 shows the locations of the stations. The CN05.1 data from 1961 to 2014, which were obtained through interpolation using data derived from over 2400 observing stations in China, had a 0.25-degree spatial resolution and daily temporal resolution. It has been reported to have good performance in China [57]. The data were used as a reference to perform the bias correction of the CMIP6 models.
2.3. Methodology
2.3.1. Model Evaluation Metrics
Model performance in terms of precipitation simulation relative to observations during the historical period was evaluated in the domains of climatology, spatial patterns, and interannual variability. Specifically, climatology was evaluated using the normalized mean absolute error (NMAE) [58], which was calculated as follows:
where MAE is the mean absolute error between the observations and GCM simulations, and MAEcmip6med is the median MAE in all selected CMIP6 models. A negative NMAE for a dataset suggests a superior performance compared to most CMIP6 models.
The Taylor skill score (TSS) was employed to assess the models’ ability to reproduce spatial patterns of precipitation, which are widely used to assess the regional performance of GCMs [50,59]. TSS was expressed as follows:
where R is the spatial correlation coefficient between the observations and GCM simulations, and Ro is the maximum possible correlation coefficient; σm and σo are the standard deviations of the GCM simulations and observations, respectively. A value nearing 1 signifies a higher degree of agreement between the observations and simulations in terms of spatial performance.
The interannual variability skill (IVS) score was used to evaluate the interannual variability in the simulations relative to the observations [60,61]. The formula was as follows:
where STDm and STDo are the standard deviations of the GCM simulations and observations, respectively. Lower IVS values signified the more accurate reproduction of the interannual variability in CMIP6 models.
2.3.2. Comprehensive Rating Metrics
As there are multiple evaluation metrics, it is necessary to calculate model rankings to determine the comprehensive performance. The comprehensive rating index (CRI) has been widely used to rank the performance of GCMs [27,50,62] and was defined as follows:
where n and m are the number of indices and models, respectively. The closer the CRI value is to 1, the more optimal the model’s performance.
2.3.3. Bias Correction
The application of GCMs in climate change impact and adaptation studies was constrained by the inherent systematic biases arising from modeling the atmospheric system using mathematical and physical equations [63,64]. The basic premise of bias correction is that the relationship observed between regional and large-scale climate variables in current climatic conditions is similarly applicable to future scenarios [65]. The quantile mapping (QM) method corrects this bias by mapping the cumulative distribution function (CDF) of the model (Fm) to the CDF of the observations (Fo):
where Xm is the original modeled data for a given future timeframe, and Xcorr is the corresponding bias-corrected outcome; Fo−1 is the inverse CDF of the observation. The QM method is widely applied in hydrological and climate change studies conducted in various regions due to its superior performance compared to those of other methods.
2.3.4. Assessment of Predictions of Future Changes in Precipitation
The BMME approach is widely recognized as an effective way to reduce uncertainties in individual model simulations, thereby improving the accuracy and credibility of predictions [46,66,67]. To facilitate a more accurate analysis of future precipitation changes in the PRB, we utilized the BMME method to mitigate biases in CMIP6 GCMs simulations. It is necessary to point out that when performing the current analysis, we only employed a simple multiple models mean and did not consider the weights of the individual models.
We conducted an analysis of future precipitation changes using multiple indicators, focusing on temporal variations and spatial distributions. Specifically, the precipitation anomaly percentage was used to analyze the projected changes and spatial distributions of annual precipitation under three scenarios (SSP1-2.6, SSP2-4.5, and SSP5-8.5) relative to the historical reference period (1995–2014); Meanwhile, an examination was conducted to assess the model’s agreement of the projected climate change signals. The change signal was considered robust to be when ≥75% of the members agreed on the direction of change [68,69]. Sen’s slope [70,71] and the Mann–Kendall significance (MK) test [72,73] were used to explore the temporal variations and changes in trends of annual precipitation in the time series. Uncertainty related to model differences were quantified in terms of the signal-to-noise ratio (SNR) [74,75], which was defined as follows:
where M is the muti-data ensemble mean, and σ is the standard deviation. SNR > 1 indicated a higher level of consistency between models within an MME or BMME, i.e., higher confidence in the projection.
3. Results
3.1. Evaluation of CMIP6 Models
3.1.1. Climatology
In this section, we comprehensively assess the precipitation prediction performance of CMIP6 models based on climatology, spatial variation, and interannual variability. For climatology, the precipitation biases (Figure 2) and NMAE (Figure 3a) exhibited obvious discrepancies between the 21 CMIP6 models. The relative bias between different models and observed annual precipitation has a large spatial heterogeneity, and the reproduction degree of annual precipitation of some models is better in the middle of the basin than in the western plateau and eastern coastal area. Precipitation bias ranged from −0.92 to 2.93 mm/d, with more than half of the models showing “dry deviation” in the PRB. The bias was smallest for the NorESM2-LM and largest for FGOALS-g3. Wet bias was seen in all models in the western plateau, ranging from 6 to 244%. The top-10 models (NMAE < 0) in terms of the climatology simulation were NorESM2-MM, KACE-1-0-G, TaiESM1, EC-Earth3-Veg, MPI-ESM1-2-LR, EC-Earth3, MPI-ESM1-2-HR, INM-CM5-0, IPSL-CM6A-LR, and MRI-ESM2-0.
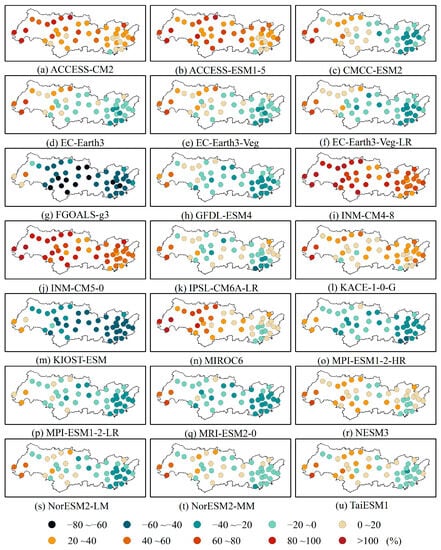
Figure 2.
Spatial pattern of the relative bias between the CMIP6 GCMs and the observations derived from 1995 to 2014.
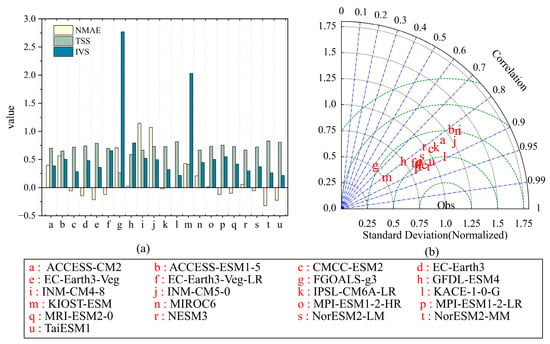
Figure 3.
(a) Comparison between climatology, spatial patterns, and interannual variability skill scores between CMIP6 models simulating precipitation and observations. (b) Taylor diagram.
3.1.2. Spatial Variation
A Taylor diagram is presented to visually display the spatial performances of selected GCMs (Figure 3b). The spatial correlation coefficient, standardized standard deviations, and standardized root mean square errors for the 21 GCMs range from 0.61 to 0.91, 0.47 to 1.33, and 0.41 to 0.8, respectively. For the spatial correlation coefficient, except for the FGOALS-g3 model, the values are all greater than 0.8, indicating that the simulations of precipitation in the PRB produced by the majority of CMIP6 models are reliable. Regarding the values of standardized standard deviation, there is a significant dispersion among the GCMs, with more than half of the models exhibiting lower standard deviations than those observed, indicating that the majority of models underestimate the spatial variability in precipitation within the basin. Figure 3a presents the TSS values for each GCM, which range from 0.26 (FGOALS-g3) to 0.83 (NorESM2-MM), indicating substantial variations in the abilities of different models to capture the spatial patterns of annual precipitation in the PRB. More than 80% of the models have TSS values greater than 0.6, demonstrating the abilities of CMIP6 climate models to capture the spatial patterns of precipitation in the PRB. Among these models, NorESM2-MM, KACE-1-0-G, TaiESM1, EC-Earth3-Veg, and MPI-ESM1-2-LR perform well in terms of capturing the spatial patterns of precipitation.
3.1.3. Interannual Variability
Figure 4 shows the bias of precipitation amount during the period 1995–2014 for each month and model. Precipitation in the PRB is concentrated between April and September; average monthly precipitation exceeds 100 mm in that period. From the figure, it is evident that the KIOST-ESM and FGOALS-g3 models significantly underestimate monthly precipitation, particularly during the summer season, with the relative bias being >30%. This finding is consistent with the previous findings, indicating a clear dry bias in the precipitation simulations of these two models in the PRB. On the other hand, the ACCESS-CM2, ACCESS-ESM1-5, INM-CM4-8, INM-CM5-0, and MIROC6 models overestimate summer precipitation in the basin. Based on the detailed explanation provided in Section 3, the IVS was employed as an indicator to assess the models’ abilities to replicate interannual variability. Figure 3a shows IVS values of precipitation between the observations and model simulations. Except for the FGOALS-g3 and KIOST-ESM models, which have IVS values greater than 2, all models have IVS values below 1, indicating that CMIP6 climate models can accurately reproduce the interannual variation in precipitation in the PRB. Among these models, the models that exhibit the most accurate representation of interannual variability are TaiESM1, KACE-1-0-G, NorESM2-MM, CMCC-ESM2, and NESM3. It is worth noting that the best-performing models in terms of interannual variability were not consistent with those noted in terms of spatial variation. Therefore, in order to obtain a comprehensive assessment of CMIP6 GCMs, it is important to consider multiple metrics based on their specific applications.
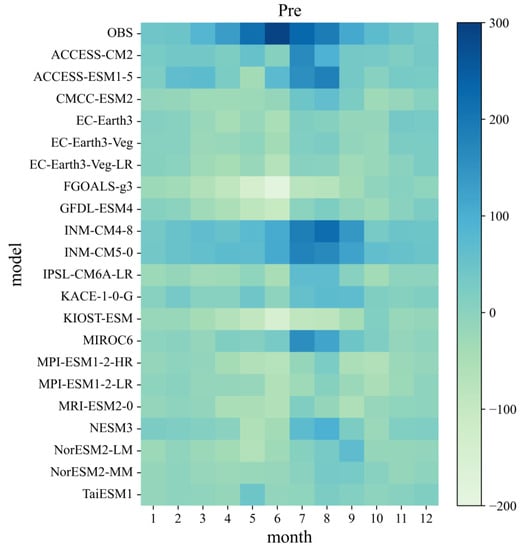
Figure 4.
The bias of precipitation relative to the observation during the period 1995–2014 for each month and model. OBS, monthly precipitation observation.
3.1.4. Overall Model Performance
To identify the best-performing models, the CRI was applied to rank the models in terms of climatology, spatial pattern, and interannual variability by employing three metrics (NMAE, TSS, and IVS). The NorESM2-MM, TaiESM1, EC-Earth3-Veg, KACE-1-0-G, EC-Earth3, CMCC-ESM2, IPSL-CM6A-LR, MPI-ESM1-2-LR, MRI-ESM2-0, and NorESM2-LM models had better performance in terms of precipitation predictions over the PRB; they all had CRI values above the median (0.48) (Figure 5a).
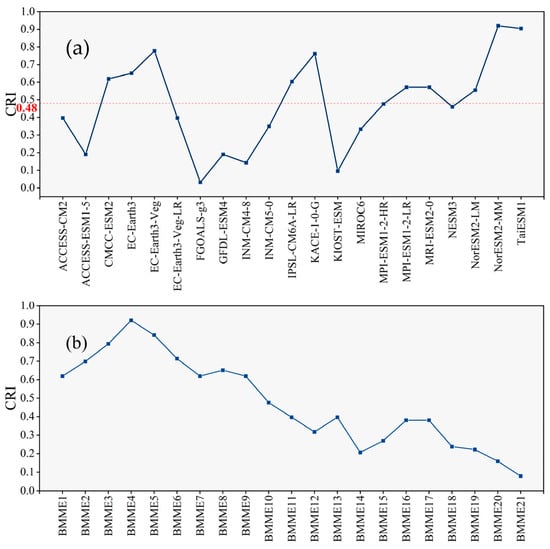
Figure 5.
Comprehensive rating index (CRI) values for 21 GCMs (a) and 21 multi-model ensembles (b). The red dotted line is the median.
A single model alone cannot provide a comprehensive assessment of future projections; the MME approach provides more robust predictions. Therefore, we ranked all of the models in descending order based on their previous CRI values, and we constructed 21 skill-based BMMEs. The ensembles included the varying numbers of models (from 1 to 21), where BMME1 was the best single model with respect to the PRB and BMME21 denoted the MME. We assessed the simulation performance of the 21 ensembles by calculating the NMAE, TSS, and IVS to obtain the ranking of each ensemble, and the CRI was employed to obtain the overall ranking of the ensembles. Figure 5b shows the historical simulated CRI values of each ensemble. The result reveals that the performance of the BMME surpasses the MME. Notably, the best ensembles used to simulate precipitation in the PRB is the multi-model ensemble mean of four optimal models (BMME4), which was generated via the NorESM2-MM, TaiESM1, EC-Earth3-Veg, and KACE-1-0-G models; the CRI was highest for BMME4 at 0.92.
3.2. GCMs Correction
We used the QM method to correct the outputs of the four best models (NorESM2-MM, TaiESM1, EC-Earth3-Veg, and KACE-1-0-G) that make up the BMME4. Figure 6 illustrates the spatial pattern of relative bias in the mean annual precipitation between the BMME4 and observation. The results demonstrate a noticeable reduction in the bias between the bias-corrected BMME4 and the observed bias. For instance, prior to bias correction, the annual mean precipitation rate in the upstream area of the PRB was significantly overestimated, having a maximum deviation of 62.7%. However, after the bias correction, the maximum deviation decreased to 7.73%. Meanwhile, we calculated the values of three evaluation metrics (NMAE, TSS and IVS) for the bias-corrected BMME4 and BMME4 models. The NMAE, TSS, and IVS values for BMME are −0.04, 0.86, and 0.42, respectively; after bias correction, these values changed to −0.24, 0.92, and 0.25, respectively. These results indicated that the BMME4, after being bias corrected via the QM method, effectively reduces the bias between the simulation and observation, and it exhibits better performance across the perspectives of climatology, spatial patterns, and interannual variability than the non-bias-corrected model. The bias-corrected BMME4 results can be employed to perform future precipitation change analysis. Therefore, in the following analysis, the bias-corrected BMME4 is used to explore the future precipitation changes in the PRB during the period 2025–2100.
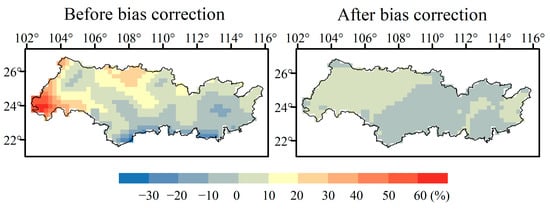
Figure 6.
The spatial pattern of relative bias in annual precipitation between the multi-model ensemble mean of the four optimal models (BMME4) and the observations made during the period 1995–2014.
3.3. Future Changes in Annual Precipitation
3.3.1. Interannual Variability in the Projected Changes
The trends of annual precipitation under the three scenarios during the period 2025–2100 were analyzed using the MK test and Sen’s slope (Table 2). There was a noteworthy and statistically significant increase in precipitation from 2025 to 2100, with a confidence level of 0.01, and the precipitation slopes exhibited differences between different scenarios. Specifically, the annual precipitation is predicted to increase by 22.42, 19.08, and 36.92 mm/decade under the SSP1-2.6, SSP2-4.5, and SSP5-8.5 pathways, respectively.

Table 2.
Results of the trend analysis of annual precipitation projected for the period 2025–2100.
The projected variations in average precipitation in the PRB over time are shown in Figure 7; the precipitation anomaly percentage is expressed according to the average of the historical period (1995–2014). Generally, the mean annual precipitation in the PRB uniformly increased in the period 2025–2100, with some differences seen between the three scenarios. For example, the annual precipitation anomaly percentage from 2025 to 2100 ranged from −12.5 to 22.3% (SSP1-2.6), −13 to 23.1% (SSP2-4.5), and −13.7 to 42.6% (SSP5-8.5), respectively. As time progressed, the precipitation anomaly showed a gradual increasing trend under different time frames. By the end of the 21st century (2081–2100), the annual average precipitation is projected to increase by 10.2, 6.7, and 17.4% under the SSP5-8.5, SSP2-4.5, and SSP1-2.6 pathways, respectively.
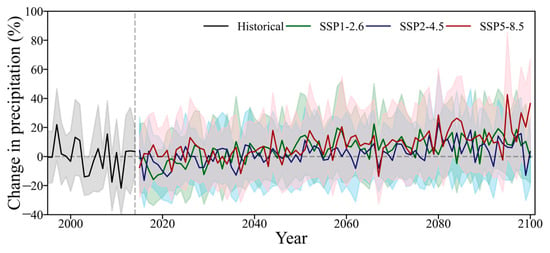
Figure 7.
Annual precipitation anomaly in the Pearl River Basin relative to the period 1995–2014 under three scenarios in the period 1995–2100. Historical (black), SSP1-2.6 (dark green), SSP2-4.5 (dark blue), and SSP5-8.5 (dark red) simulations are shown.
3.3.2. Spatial Distribution of the Projected Changes
The spatial patterns of the annual precipitation trends during the period 2025–2100 under the three scenarios are shown in Figure 8. The annual precipitation shows a significant increasing trend in most parts of the PRB in the 21st century under the three scenarios (p < 0.05), being in the range 14.12–80.84 mm/decade. Notable spatial differences can be seen across different scenarios, with the highest increases seen under the high-emission scenario. For instance, the linear trends increase from the central part to the western and eastern parts of the basin, with the highest growth trend (>30 mm/decade) being concentrated in the Beijiang River Basin under the SSP1-2.6 pathway. Under the SSP2-4.5 pathway, the largest trends (>40 mm/decade) are mainly concentrated in the middle of the PRB, and the rate of increase in the annual precipitation rate is projected to gradually decrease from the middle to the periphery. With the increase in the emission concentration, the entire basin will experience significant increases (p < 0.05) in the precipitation rate under the SSP5-8.5 pathway, and the p-values for over 98% of the basin are less than 0.01. The precipitation rate increases ranges from 17.3 to 80.8 mm/decade, and the highest trends are concentrated in the Beijiang River Basin, the Dongjiang River Basin, and the Liujiang River Basin.
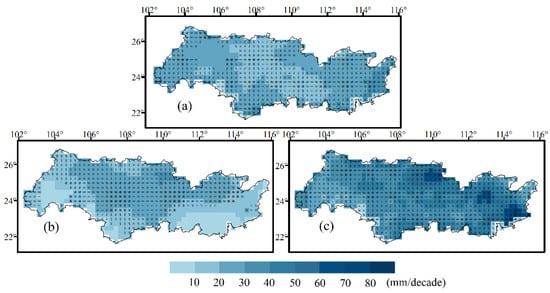
Figure 8.
Spatial trends of projected annual precipitation during the period 2025–2100 under three scenarios ((a) SSP1-2.6, (b) SSP2-4.5, and (c) SSP5-8.5). A plus sign (+) in the grid indicates a significant trend at p < 0.05.
Figure 9 shows the projected percentage variations in the annual precipitation rate in the PRB for the near term (2025–2044), medium term (2045–2064), and long term (2081–2100) under the three scenarios relative to the period 1995–2014. Overall, the projected precipitation rate across nearly the entire basin showed a trend of increase compared to the historical period in the three periods under all three scenarios, except for a slight decrease of less than 6% in the central part of the basin and the Pearl River Delta in the near term in the 21st century. The projected precipitation in most of the PRB showed a robust increase in the three periods, with much higher increases being seen in the long term than in the near term. In the near term, the precipitation changes range from −5.2 to 11.8% under the SSP1-2.6 scenario, −4.8 to 11.3% under the SSP2-4.5 scenario, and −4% to 15.6% under the SSP5-8.5 scenario, with the spatial average increases reaching 3.7%, 2.6% and 13%, respectively. Meanwhile, the projected precipitation increase is 2.7~23.8%, 2.1~21% and 9.7~36.9% in the long term relative to the period 1995–2014, with the spatial averages of the increases reaching 13%, 9.4% and 20.1% under the SSP1-2.6, SSP2-4.5 and SSP5-8.5 pathways, respectively. The entire basin is projected to become wetter by the end of the 21st century under all three emission scenarios, with the highest growth rates observed under the high-emission scenarios. Furthermore, the result showed that the higher increases are projected to occur in the Xijiang River Basin.
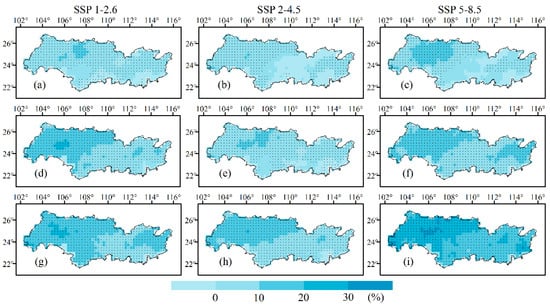
Figure 9.
Annual precipitation anomaly in the Pearl River Basin in the (a–c) near term, (d–f) medium term and (g–i) long term relative to the period 1995–2014 under three scenarios. A black dot in the grid indicates that at least 80% of the models in the grid area make predictions in the same direction as the signal.
3.3.3. Uncertainties of the Projected Changes
To analyze the uncertainty in precipitation projections, we calculated the SNR for the BMME4 between the beginning, middle, and end of the century under three scenarios (Figure 10). The SNR has been used to measure the spread and magnitude of discrepancies within the bias-corrected BMME4 dataset. The SNR being < 1 indicates that the signal is less reliable and the noise is significant. SNR being > 4 may suggest that the distribution differences between multiple datasets may be small, indicating a strong consistency between the models. A larger SNR represents less uncertainty in the projected climate change signals. The SNR used to project precipitation exceeds four under three scenarios (Figure 10) for the near, mid, or long term. This finding implies that the selected GCMs, which have demonstrated an accurate representation of past precipitation patterns in this study, have good consistency in terms of predicting future annual precipitation rates. In the near term, the range of SNR for precipitation is the highest, with high values often coexisting with areas of high precipitation rate change. This finding indicates that the signal of future precipitation changes in this sub-region is robust. In the long term, the range of SNR values narrows, and the magnitude of uncertainty under SSP5-8.5 becomes greater than in other scenarios. The uncertainty in the projected precipitation rate in the PRB gradually increases over time.
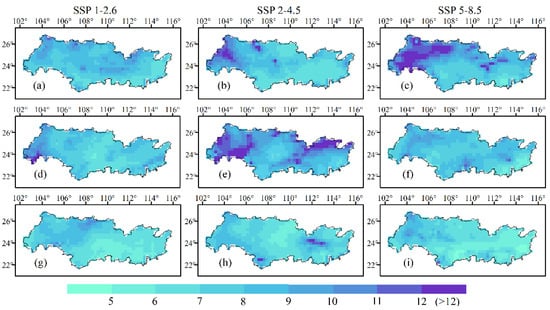
Figure 10.
The signal-to-noise ratio (SNR) for the projected precipitation rate calculated for the multi-model ensemble mean of the four optimal models (BMME4) in the (a–c) near term, (d–f) medium term and (g–i) long term.
4. Discussion
In this study, we evaluated the ability of CMIP6 models to simulate precipitation in the PRB in terms of climatology, spatial patterns, and interannual variability using three indices (NMAE, TSS, and IVS). The simulation results were compared to observations obtained from 1995 to 2014. The results show that the CMIP6 GCMs can reliably reproduce the precipitation characteristics in the PRB. However, there is some bias between the simulation and the observation. Most of the CMIP6 models had a dry bias in the PRB; this phenomenon was also observed in previous published CMIP3 and CMIP5 models [76,77]. Despite the CMIP6 GCMs having an improved physical algorithm and more complicated physical processes, they still have a dry bias in South China [78]. The bias might be attributed to the uncertainty involved in simulating large-scale atmospheric circulations in the models [79,80,81,82]. The underestimation of the meridional wind speed over the Tibetan Plateau implies that less water vapor transportation to the southern regions of China occurs, which may consequently contribute to a dry bias in precipitation [83]. In addition, we also cannot overlook the impact of inherent and systematic biases relative to observations due to a coarser resolution, imperfect boundary conditions, poor parameterizations, misrepresentation of physical processes, etc. [25,84,85]. To mitigate the impacts of these biases, we applied bias correction to the selected models based on the precipitation products, and the result demonstrated that the QM method could reduce the bias of GCMs and effectively improved the simulation performance of the GCMs.
To determine the optimal ensemble required to perform precipitation simulation in the PRB, we calculated the CRI value of each ensemble according to the three indicators of climatology, spatial patterns, and interannual variability. The MME had the lowest CRI value (0.08), which indicates that it had the lower ranking among all ensembles for all three metrics, and the BMME approach outperformed the MME [60,66]. These results show that the MME is very limited compared to other ensembles, and a straightforward average ensemble derived from all models may not be optimal for climate change exploration in PRB. However, the BMME, which is based on models with better skill, eliminates the effect of poorly performing models and provides a highly reliable signal that greatly reduces uncertainties [86]. Therefore, this study recommends applying the BMME approach to carry out more reliable future projections. Furthermore, the ensemble of the four best models (NorESM2-MM, TaiESM1, EC-Earth3-Veg, and KACE-1-0-G), which had the highest CRI value (0.92), performed better than the best single model and all other ensembles, suggesting that BMME4 may be a good choice to perform climate change studies in the PRB. It should be noted that some of the models participating in CMIP have similarities in terms of their physical process modules, and code sharing between models results in similar numerical calculations and process expressions in certain aspects. Simple multi-model ensembles can inevitably amplify the weights of certain biases. In the future, the ability of the weighted MME to simulate precipitation should be further considered.
Precipitation projections can provide assistance with the implementation of integrated watershed management and disaster prevention, as well as proactive responses to climate change. Warming in the PRB is predicted to exceed 1 °C/decade [87]. Evapotranspiration and precipitation in the basin would theoretically increase under global warming [39,88]. Min et al. [89] predicted that the precipitation in East Asia will exhibit a faster growth rate than the global average in the 21st century. Our results based on CMIP6 models indicate that precipitation in the PRB will significantly increase (p < 0.01) in the 21st century under the three scenarios. The linear trend of precipitation changes reaches the highest level (36.92 mm/decade) under the high-emission scenario SSP5-8.5, with all grid points having passed the 95% significant test. Lu K. et al. [90] have also identified similar findings, i.e., that precipitation under the SSP5-8.5 will show a wetter trend in the whole of China than SSP1-2.6 and SSP2-4.5, whether it occurs in the near term or long term. The above results also indicate the greater sensitivity of the climate system to anthropogenic warming. The projected increase in precipitation is directly proportional to the magnitude of the radiation force [91]. The precipitation pattern in the PRB is profoundly influenced by the Asian summer monsoon, which projected a trend of earlier onset and later retreat in the future owing to global warming [92,93,94]. The prolonged duration of the rainy season will bring about increased terrestrial precipitation. We projected the high-growth areas to be mainly located in the west of the basin, namely in the Xijiang River Basin, compared to the baseline period (1995–2014), which helps to increase the water resources available downstream. However, the Xijiang River Basin, with its complex terrain, will face increased risks of mountainous disasters and floods due to longer durations of precipitation. This issue poses threats to downstream water conservancy projects and the safety of residents. Therefore, it is of great societal significance to further explore the future runoff changes and the future trends of hydrological drought and flood risks in the basin in the context of global warming based on existing studies of future precipitation changes.
The uncertainties in climate models have often been a limiting factor, particularly at a local scale [95,96]. However, the uncertainties in GCMs are unavoidable [97]. The SNR has been a key attribute in climate research, as it measures the level of consistency between members of the multi-model ensemble by focusing on the spread between them [66,74,75]. A higher SNR implies a smaller range of uncertainty in terms of predicting climate change signals. The BMME method with larger SNR values has been used in this study, which argues that climate change projections generated via a subset of superior-performing models are reliable. Additionally, the uncertainty in the projected precipitation in the PRB gradually increases over time. Various factors, such as emissions scenarios and GCM structures, still impact the uncertainty of the projected precipitation rate. Future studies should give more consideration to ensemble approaches that assign weights based on the performance of each GCM to obtain more reliable climate projections and explore more varied approaches to reduce uncertainty.
5. Conclusions
To the best of our understanding, our study was the first study to assess the ability of 21 CMIP6 GCMs to reproduce historical precipitation in the PRB, using meteorological observations related to climatology, spatial patterns, and interannual variability. In this study, various model performance indices were used to comprehensively evaluate the performances of single models, and model rankings were obtained. In this manner, we determined the optimal number of GCMs required to complete ensemble generation. Then, based on the multi-model ensemble mean of the optimal models (with bias correction), the annual precipitation changes in the PRB under the three scenarios during the period 2025–2100 were predicted. The results show the following findings:
- The evaluation showed that most of the CMIP6 models had a dry bias in the PRB. For a given single model, performance varied greatly between indices. According to all indices, the NorESM2-MM, TaiESM1, EC-Earth3-Veg, KACE-1-0-G, EC-Earth3, CMCC-ESM2, IPSL-CM6A-LR, MPI-ESM1-2-LR, MRI-ESM2-0, and NorESM2-LM models exhibited good performances in the PRB, with CRI values exceeding the median (0.48).
- We determined the optimal ensemble to perform precipitation simulation in the PRB. When the ensemble number was set to 4 (NorESM2-MM, TaiESM1, EC-Earth3-Veg, and KACE-1-0-G), precipitation in the PRB could be best simulated, and the CRI value (0.92) was higher than that of any single model and all other ensembles, including the MME. In addition, the QM method could effectively correct the bias of the selected models, having a better performance than before bias correction in all metrics. The corrected precipitation outputs can be used to model regional hydrological models and simulate and predict the potential changes in runoff under different scenarios in the future.
- The annual precipitation in the PRB from 2025 to 2100 showed a significant increasing trend under all three scenarios. Annual precipitation is projected to increase by 22.42, 19.08, and 36.92 mm/decade under the SSP1-2.6, SSP2-4.5, and SSP5-8.5 pathways, respectively. By the end of the 21st century, mean precipitation in the PRB will increase by 13%, 9.4%, and 20.1% under the SSP1-2.6, SSP2-4.5 and SSP5-8.5 pathways, respectively; the increases will be higher the western area of the basin, namely the Xijiang River Basin.
- Uncertainties are inevitable in precipitation projections. In this paper, the BMME approach was adopted to reduce such uncertainties, but there is still room for improvement. To further improve the accuracy of precipitation projections, more methods (such as assigning weight by considering the skill of the models) should be compared in future studies.
Author Contributions
Conceptualization, methodology, data curation, visualization, formal analysis, writing original draft, and writing review and editing, M.H.; Conceptualization and supervision, Funding acquisition, Y.C.; Methodology and supervision, H.S.; supervision, J.L. All authors have read and agreed to the published version of the manuscript.
Funding
This work was supported by the Natural Science Foundation of China (No. 51961125206) and the Science and Technology Program of Guangdong Province (No. 2020B1515120079).
Data Availability Statement
Data sharing concerns are not applicable.
Conflicts of Interest
The authors declare no conflict of interest regarding the publication of this paper.
References
- Ajami, H. Geohydrology: Global Hydrological Cycle.Encyclopedia of Geology (Second Edition). 2021, pp. 393–398. Available online: https://www.semanticscholar.org/paper/Geohydrology%3A-Global-Hydrological-Cycle-Ajami/0ba3f562bb27d6e074c907ce6bddeeef330d0a0e (accessed on 3 July 2022).
- Held, I.M.; Soden, B.J. Robust Responses of the Hydrological Cycle to Global Warming. J. Clim. 2006, 19, 5686–5699. [Google Scholar] [CrossRef]
- Donat, M.G.; Lowry, A.L.; Alexander, L.V.; O’Gorman, P.A.; Maher, N. More extreme precipitation in the world’s dry and wet regions. Nat. Clim. Chang. 2016, 6, 508–513. [Google Scholar] [CrossRef]
- Solomon, S.C.; Qin, D.-h.; Manning, M.R.; Chen, Z.R.; Marquis, M.; Averyt, K.B.; Tignor, M.M.B.; Miller, H.L. Climate Change 2007: The Physical Science Basis. Contribution of Working Group I to the Fourth Assessment Report of the Intergovernmental Panel on Climate Change. Summary for Policymakers. 2007. Available online: https://www.ipcc.ch/site/assets/uploads/2018/02/ar4_syr_full_report.pdf (accessed on 3 July 2022).
- Westra, S.; Alexander, L.V.; Zwiers, F.W. Global Increasing Trends in Annual Maximum Daily Precipitation. J. Clim. 2013, 26, 3904–3918. [Google Scholar] [CrossRef]
- Xiong, L.; Yu, K.; Zhang, H.; Zhang, L. Annual runoff change in the headstream of Yangtze River and its relation to precipitation and air temperature. Hydrol. Res. 2013, 44, 850. [Google Scholar] [CrossRef]
- Berghuijs, W.R.; Aalbers, E.E.; Larsen, J.R.; Trancoso, R.; Woods, R.A. Recent changes in extreme floods across multiple continents. Environ. Res. Lett. 2017, 12, 114035. [Google Scholar] [CrossRef]
- Dai, A. Characteristics and trends in various forms of the Palmer Drought Severity Index during 1900–2008. J. Geophys. Res. Atmos. 2011, 116, D12115. [Google Scholar] [CrossRef]
- Wu, X.; Wang, Z.; Guo, S.; Liao, W.; Zeng, Z.; Chen, X. Scenario-based projections of future urban inundation within a coupled hydrodynamic model framework: A case study in Dongguan City, China. J. Hydrol. 2017, 547, 428–442. [Google Scholar] [CrossRef]
- Zhang, S.; Lu, X.X.; Higgitt, D.L.; Chen, C.-T.A.; Han, J.; Sun, H. Recent changes of water discharge and sediment load in the Zhujiang (Pearl River) Basin, China. Glob. Planet. Chang. 2008, 60, 365–380. [Google Scholar] [CrossRef]
- Chen, Y.D.; Zhang, Q.; Xu, C.-Y.; Lu, X.; Zhang, S. Multiscale streamflow variations of the Pearl River basin and possible implications for the water resource management within the Pearl River Delta, China. Quat. Int. 2010, 226, 44–53. [Google Scholar] [CrossRef]
- Zheng, J.; Zhang, Q.; Shi, P.; Gu, X.; Zheng, Y. Spatiotemporal Characteristics of Extreme Precipitation Regimes and Related Driving Factors in the Pearl River Basin. Sci. Geogr. Sin. 2017, 37, 283–291. [Google Scholar]
- Liu, L.; Jiang, T.; Yuan, F. Observed (1961–2007) and Projected (2011–2060) Climate Change in the Pearl River Basin. Adv. Clim. Chang. Res. 2009, 5, 209–214. [Google Scholar]
- Chen, Y.D.; Zhang, Q.; Xiao, M.; Singh, V.P. Transition probability behaviors of drought events in the Pearl River basin, China. Stoch. Environ. Res. Risk Assess. 2017, 31, 159–170. [Google Scholar] [CrossRef]
- Su, C.; Chen, X. Covariates for nonstationary modeling of extreme precipitation in the Pearl River Basin, China. Atmos. Res. 2019, 229, 224–239. [Google Scholar] [CrossRef]
- Xu, K.; Qin, G.; Niu, J.; Wu, C.; Huang, G.; Wang, P. Comparative analysis of meteorological and hydrological drought over the Pearl River basin in southern China. Hydrol. Res. 2018, 50, nh2018178. [Google Scholar] [CrossRef]
- Zhi-Yong, W.; Gui-Hua, L.; Zhi-Yu, L.; Jin-Xing, W.; Heng, X. Trends of Extreme Flood Events in the Pearl River Basin during 1951–2010. Adv. Clim. Chang. Res. 2013, 4, 110–116. [Google Scholar] [CrossRef]
- Cowtan, K.; Hausfather, Z.; Hawkins, E.; Jacobs, P.; Mann, M.E.; Miller, S.K.; Steinman, B.A.; Stolpe, M.B.; Way, R.G. Robust comparison of climate models with observations using blended land air and ocean sea surface temperatures. Geophys. Res. Lett. 2015, 42, 6526–6534. [Google Scholar] [CrossRef]
- Miao, C.; Duan, Q.; Sun, Q.; Huang, Y.; Kong, D.; Yang, T.; Ye, A.; Di, Z.; Gong, W. Assessment of CMIP5 climate models and projected temperature changes over Northern Eurasia. Environ. Res. Lett. 2014, 9, 055007. [Google Scholar] [CrossRef]
- Pandey, B.K.; Khare, D.; Kawasaki, A.; Mishra, P.K. Climate Change Impact Assessment on Blue and Green Water by Coupling of Representative CMIP5 Climate Models with Physical Based Hydrological Model. Water Resour. Manag. 2018, 33, 141–158. [Google Scholar] [CrossRef]
- Eyring, V.; Bony, S.; Meehl, G.A.; Senior, C.A.; Stevens, B.; Stouffer, R.J.; Taylor, K.E. Overview of the Coupled Model Intercomparison Project Phase 6 (CMIP6) experimental design and organization. Geosci. Model Dev. 2016, 9, 1937–1958. [Google Scholar] [CrossRef]
- O’Neill, B.C.; Tebaldi, C.; van Vuuren, D.P.; Eyring, V.; Friedlingstein, P.; Hurtt, G.; Knutti, R.; Kriegler, E.; Lamarque, J.F.; Lowe, J.; et al. The Scenario Model Intercomparison Project (ScenarioMIP) for CMIP6. Geosci. Model Dev. 2016, 9, 3461–3482. [Google Scholar] [CrossRef]
- Du, Y.; Wang, D.; Zhu, J.; Wang, D.; Qi, X.; Cai, J. Comprehensive assessment of CMIP5 and CMIP6 models in simulating and projecting precipitation over the global land. Int. J. Climatol. 2022, 42, 6859–6875. [Google Scholar] [CrossRef]
- Na, Y.; Fu, Q.; Kodama, C. Precipitation Probability and Its Future Changes from a Global Cloud-Resolving Model and CMIP6 Simulations. J. Geophys. Res. Atmos. 2020, 125, e2019JD031926. [Google Scholar] [CrossRef]
- Rivera, J.A.; Arnould, G. Evaluation of the ability of CMIP6 models to simulate precipitation over Southwestern South America: Climatic features and long-term trends (1901–2014). Atmos. Res. 2020, 241, 104953. [Google Scholar] [CrossRef]
- Moradian, S.; Torabi Haghighi, A.; Asadi, M.; Mirbagheri, S.A. Future Changes in Precipitation over Northern Europe Based on a Multi-model Ensemble from CMIP6: Focus on Tana River Basin. Water Resour. Manag. 2022, 37, 2447–2463. [Google Scholar] [CrossRef]
- Jiang, J.; Zhou, T.; Chen, X.; Zhang, L. Future changes in precipitation over Central Asia based on CMIP6 projections. Environ. Res. Lett. 2020, 15, 054009. [Google Scholar] [CrossRef]
- Ding, Y.; Jiang, C.; Zhou, Z.; Gao, T.; Wang, S.; Zhang, X.; Cai, H.; Shi, H. Evaluation of precipitation and its time series components in CMIP6 over the Yellow River Basin. Clim. Dyn. 2023, 60, 1203–1223. [Google Scholar] [CrossRef]
- Wu, H.; Lei, H.; Lu, W.; Liu, Z. Future changes in precipitation over the upper Yangtze River basin based on bias correction spatial downscaling of models from CMIP6. Environ. Res. Commun. 2022, 4, 045002. [Google Scholar] [CrossRef]
- Zhao, N.; Jiao, Y.; Zhang, L. Projections of precipitation change from CMIP6 based on a new downscaling method in the Poyang Lake basin, China. J. Hydrol. Reg. Stud. 2022, 42, 101138. [Google Scholar] [CrossRef]
- Tian, J.; Zhang, Z.; Ahmed, Z.; Zhang, L.; Su, B.; Tao, H.; Jiang, T. Projections of precipitation over China based on CMIP6 models. Stoch. Environ. Res. Risk Assess. 2021, 35, 831–848. [Google Scholar] [CrossRef]
- Chen, R.; Duan, K.Q.; Shang, W.; Shi, P.H.; Meng, Y.L.; Zhang, Z.P. Increase in seasonal precipitation over the Tibetan Plateau in the 21st century projected using CMIP6 models. Atmos. Res. 2022, 277, 106306. [Google Scholar] [CrossRef]
- Kay, A.L.; Davies, H.N.; Bell, V.A.; Jones, R.G. Comparison of uncertainty sources for climate change impacts: Flood frequency in England. Clim. Chang. 2009, 92, 41–63. [Google Scholar] [CrossRef]
- Akinsanola, A.A.; Kooperman, G.J.; Pendergrass, A.G.; Hannah, W.M.; Reed, K.A. Seasonal representation of extreme precipitation indices over the United States in CMIP6 present-day simulations. Environ. Res. Lett. 2020, 15, 094003. [Google Scholar] [CrossRef]
- Zhu, X.; Ji, Z.; Wen, X.; Lee, S.-Y.; Wei, Z.; Zheng, Z.; Dong, W. Historical and projected climate change over three major river basins in China from Fifth and Sixth Coupled Model Intercomparison Project models. Int. J. Climatol. 2021, 41, 6455–6473. [Google Scholar] [CrossRef]
- Xiao, H.; Lu, G.; Wu, Z.; Liu, Z. Flood response to climate change in the Pearl River basin for the next three decades. J. Hydraul. Eng. 2013, 44, 1409–1419. [Google Scholar]
- Wang, X.; Yang, T.; Li, X.; Shi, P.; Zhou, X. Spatio-temporal changes of precipitation and temperature over the Pearl River basin based on CMIP5 multi-model ensemble. Stoch. Environ. Res. Risk Assess. 2017, 31, 1077–1089. [Google Scholar] [CrossRef]
- Zhu, X.; Lee, S.-Y.; Wen, X.; Ji, Z.; Lin, L.; Wei, Z.; Zheng, Z.; Xu, D.; Dong, W. Extreme climate changes over three major river basins in China as seen in CMIP5 and CMIP6. Clim. Dyn. 2021, 57, 1187–1205. [Google Scholar] [CrossRef]
- Allen, M.R.; Ingram, W.J. Constraints on future changes in climate and the hydrologic cycle. Nature 2002, 419, 224–232. [Google Scholar] [CrossRef]
- Wu, Y.; Zhong, P.-a.; Xu, B.; Zhu, F.; Fu, J. Evaluation of global climate model on performances of precipitation simulation and prediction in the Huaihe River basin. Theor. Appl. Climatol. 2018, 133, 191–204. [Google Scholar] [CrossRef]
- Feng, J.; Lee, D.-K.; Fu, C.; Tang, J.; Sato, Y.; Kato, H.; McGregor, J.L.; Mabuchi, K. Comparison of four ensemble methods combining regional climate simulations over Asia. Meteorol. Atmos. Phys. 2011, 111, 41–53. [Google Scholar] [CrossRef]
- Jia, W.U.; Bo-Tao, Z.; Ying, X.U. Response of Precipitation and Its Extremes over China to Warming: CMIP5 Simulation and Projection. Chin. J. Geophys. 2015, 58, 461–473. [Google Scholar] [CrossRef]
- Tian, D.; Guo, Y.; Dong, W. Future changes and uncertainties in temperature and precipitation over China based on CMIP5 models. Adv. Atmos. Sci. 2015, 32, 487–496. [Google Scholar] [CrossRef]
- Xu, K.; Xu, B.; Ju, J.; Wu, C.; Dai, H.; Hu, B.X. Projection and uncertainty of precipitation extremes in the CMIP5 multimodel ensembles over nine major basins in China. Atmos. Res. 2019, 226, 122–137. [Google Scholar] [CrossRef]
- Dong, Z.; Liu, H.; Baiyinbaoligao; Hu, H.; Khan, M.Y.A.; Wen, J.; Chen, L.; Tian, F. Future projection of seasonal drought characteristics using CMIP6 in the Lancang-Mekong River Basin. J. Hydrol. 2022, 610, 127815. [Google Scholar] [CrossRef]
- Chen, H.; Sun, J. How the “best” models project the future precipitation change in China. Adv. Atmos. Sci. 2009, 26, 773–782. [Google Scholar] [CrossRef]
- Seo, K.-H.; Ok, J. Assessing Future Changes in the East Asian Summer Monsoon Using CMIP3 Models: Results from the Best Model Ensemble. J. Clim. 2013, 26, 1807–1817. [Google Scholar] [CrossRef]
- Ahmed, K.; Sachindra, D.A.; Shahid, S.; Demirel, M.C.; Chung, E.S. Selection of multi-model ensemble of general circulation models for the simulation of precipitation and maximum and minimum temperature based on spatial assessment metrics. Hydrol. Earth Syst. Sci. 2019, 23, 4803–4824. [Google Scholar] [CrossRef]
- Hussain, M.; Yusof, K.W.; Mustafa, M.R.U.; Mahmood, R.; Jia, S. Evaluation of CMIP5 models for projection of future precipitation change in Bornean tropical rainforests. Theor. Appl. Climatol. 2018, 134, 423–440. [Google Scholar] [CrossRef]
- Jiang, Z.; Li, W.; Xu, J.; Li, L. Extreme Precipitation Indices over China in CMIP5 Models. Part I: Model Evaluation. J. Clim. 2015, 28, 8603–8619. [Google Scholar] [CrossRef]
- Salehie, O.; Hamed, M.M.; Ismail, T.B.; Shahid, S. Projection of droughts in Amu river basin for shared socioeconomic pathways CMIP6. Theor. Appl. Climatol. 2022, 149, 1009–1027. [Google Scholar] [CrossRef]
- Srivastava, A.; Grotjahn, R.; Ullrich, P.A. Evaluation of historical CMIP6 model simulations of extreme precipitation over contiguous US regions. Weather Clim. Extrem. 2020, 29, 100268. [Google Scholar] [CrossRef]
- Juan, T. The Generalizations and Hydrological Character Analysis of Pearl River Basin. Water Conserv. Sci. Technol. Econ. 2007, 13, 31–33. [Google Scholar]
- Wu, C.; Huang, G. Projection of climate extremes in the Zhujiang River basin using a regional climate model. Int. J. Climatol. 2016, 36, 1184–1196. [Google Scholar] [CrossRef]
- Zhang, Q.; Xu, C.Y.; Becker, S.; Zhang, Z.X.; Chen, Y.D.; Coulibaly, M. Trends and abrupt changes of precipitation maxima in the Pearl River basin, China. Atmos. Sci. Lett. 2009, 10, 132–144. [Google Scholar] [CrossRef]
- Meinshausen, M.; Nicholls, Z.J.; Lewis, J.; Gidden, M.J.; Vogel, E.; Freund, M.; Beyerle, U.; Gessner, C.; Nauels, A.; Bauer, N.; et al. The shared socio-economic pathway (SSP) greenhouse gas concentrations and their extensions to 2500. Geosci. Model Dev. 2020, 13, 3571–3605. [Google Scholar] [CrossRef]
- Wu, J.; Gao, X.J. A gridded daily observation dataset over China region and comparison with the other datasets. Chin. J. Geophys.-Chin. Ed. 2013, 56, 1102–1111. [Google Scholar] [CrossRef]
- Gleckler, P.J.; Taylor, K.E.; Doutriaux, C. Performance metrics for climate models. J. Geophys. Res. Atmos. 2008, 113, D06104. [Google Scholar] [CrossRef]
- Taylor, K.E. Summarizing multiple aspects of model performance in a single diagram. J. Geophys. Res. Atmos. 2001, 106, 7183–7192. [Google Scholar] [CrossRef]
- Chen, W.; Jiang, Z.; Li, L. Probabilistic Projections of Climate Change over China under the SRES A1B Scenario Using 28 AOGCMs. J. Clim. 2011, 24, 4741–4756. [Google Scholar] [CrossRef]
- Deng, H.; Hua, W.; Fan, G. Evaluation and Projection of Near-Surface Wind Speed over China Based on CMIP6 Models. Atmosphere 2021, 12, 1062. [Google Scholar] [CrossRef]
- Zhang, Y.; You, Q.; Chen, C.; Ge, J.; Adnan, M. Evaluation of Downscaled CMIP5 Coupled with VIC Model for Flash Drought Simulation in a Humid Subtropical Basin, China. J. Clim. 2018, 31, 1075–1090. [Google Scholar] [CrossRef]
- Ojha, R.; Nagesh Kumar, D.; Sharma, A.; Mehrotra, R. Assessing Severe Drought and Wet Events over India in a Future Climate Using a Nested Bias-Correction Approach. J. Hydrol. Eng. 2013, 18, 760–772. [Google Scholar] [CrossRef]
- Wood, A.W.; Leung, L.R.; Sridhar, V.; Lettenmaier, D.P. Hydrologic Implications of Dynamical and Statistical Approaches to Downscaling Climate Model Outputs. Clim. Chang. 2004, 62, 189–216. [Google Scholar] [CrossRef]
- Wilby, R.L.; Charles, S.P.; Zorita, E.; Timbal, B.; Whetton, P.; Mearns, L. Guidelines for Use of Climate Scenarios Developed from Statistical Downscaling Methods. Environmental Science. 2004. Available online: https://zenodo.org/record/1438320 (accessed on 3 July 2022).
- Kwon, S.-H.; Kim, J.; Boo, K.-O.; Shim, S.; Kim, Y.; Byun, Y.-H. Performance-based projection of the climate-change effects on precipitation extremes in East Asia using two metrics. Int. J. Climatol. 2019, 39, 2324–2335. [Google Scholar] [CrossRef]
- Li, J.; Zhao, Y.; Chen, D.; Kang, Y.; Wang, H. Future precipitation changes in three key sub-regions of East Asia: The roles of thermodynamics and dynamics. Clim. Dyn. 2022, 59, 1377–1398. [Google Scholar] [CrossRef]
- Mastrandrea, M.D.; Field, C.B.; Stocker, T.F.; Edenhofer, O.; Ebi, K.L.; Frame, D.J.; Held, H.; Kriegler, E.; Mach, K.J.; Matschoss, P.R.; et al. Guidance Note for Lead Authors of the IPCC Fifth Assessment Report on Consistent Treatment of Uncertainties. 2010. Available online: https://www.ipcc.ch/site/assets/uploads/2018/05/uncertainty-guidance-note.pdf (accessed on 3 July 2022).
- Nashwan, M.S.; Shahid, S. Future precipitation changes in Egypt under the 1.5 and 2.0 °C global warming goals using CMIP6 multimodel ensemble. Atmos. Res. 2022, 265, 105908. [Google Scholar] [CrossRef]
- Sen, P.K. Estimates of the Regression Coefficient Based on Kendall’s Tau. J. Am. Stat. Assoc. 1968, 63, 1379–1389. [Google Scholar] [CrossRef]
- Theil, H. A Rank-Invariant Method of Linear and Polynomial Regression Analysis. In Henri Theil’s Contributions to Economics and Econometrics: Econometric Theory and Methodology; Raj, B., Koerts, J., Eds.; Springer: Dordrecht, The Netherlands, 1992; pp. 345–381. [Google Scholar]
- Kendall, M.G. Rank Correlation Methods. Mathematics. 1949. Available online: https://www.semanticscholar.org/paper/Rank-Correlation-Methods-Kendall/b7000835226609a5c0ff6dacb5c2cc9d38dfe916 (accessed on 30 November 2022).
- Mann, H.B. Nonparametric Tests Against Trend. Econometrica 1945, 13, 245. [Google Scholar] [CrossRef]
- Kim, J.; Park, S.K. Uncertainties in calculating precipitation climatology in East Asia. Hydrol. Earth Syst. Sci. 2016, 20, 651–658. [Google Scholar] [CrossRef]
- Kim, J.; Sanjay, J.; Mattmann, C.; Boustani, M.; Ramarao, M.V.S.; Krishnan, R.; Waliser, D. Uncertainties in estimating spatial and interannual variations in precipitation climatology in the India–Tibet region from multiple gridded precipitation datasets. Int. J. Climatol. 2015, 35, 4557–4573. [Google Scholar] [CrossRef]
- Jiang, D.B.; Wang, H.J.; Lang, X.M. Evaluation of East Asian climatology as simulated by seven coupled models. Adv. Atmos. Sci. 2005, 22, 479–495. [Google Scholar]
- Qin, J.; Su, B.; Tao, H.; Wang, Y.; Huang, J.; Jiang, T. Projection of temperature and precipitation under SSPs-RCPs Scenarios over northwest China. Front. Earth Sci. 2021, 15, 23–37. [Google Scholar] [CrossRef]
- Yang, X.; Zhou, B.; Xu, Y.; Han, Z. CMIP6 Evaluation and Projection of Temperature and Precipitation over China. Adv. Atmos. Sci. 2021, 38, 817–830. [Google Scholar] [CrossRef]
- Xin, X.G.; Wu, T.; Zhang, J.; Yao, J.; Fang, Y. Comparison of CMIP6 and CMIP5 simulations of precipitation in China and the East Asian summer monsoon. Int. J. Climatol. 2020, 40, 6423–6440. [Google Scholar] [CrossRef]
- Huang, D.-Q.; Zhu, J.; Zhang, Y.-C.; Huang, A.-N. Uncertainties on the simulated summer precipitation over Eastern China from the CMIP5 models. J. Geophys. Res. Atmos. 2013, 118, 9035–9047. [Google Scholar] [CrossRef]
- Niu, X.; Wang, S.; Tang, J.; Lee, D.-K.; Gao, X.; Wu, J.; Hong, S.; Gutowski, W.J.; McGregor, J. Multimodel ensemble projection of precipitation in eastern China under A1B emission scenario. J. Geophys. Res. Atmos. 2015, 120, 9965–9980. [Google Scholar] [CrossRef]
- Zhou, T.; Li, Z. Simulation of the east asian summer monsoon using a variable resolution atmospheric GCM. Clim. Dyn. 2002, 19, 167–180. [Google Scholar] [CrossRef]
- Tang, B.; Hu, W.; Duan, A. Assessment of Extreme Precipitation Indices over Indochina and South China in CMIP6 Models. J. Clim. 2021, 34, 7507–7524. [Google Scholar] [CrossRef]
- Berg, P.; Moseley, C.; Haerter, J.O. Strong increase in convective precipitation in response to higher temperatures. Nat. Geosci. 2013, 6, 181–185. [Google Scholar] [CrossRef]
- Wang, C.; Zhang, L.; Lee, S.-K.; Wu, L.; Mechoso, C.R. A global perspective on CMIP5 climate model biases. Nat. Clim. Change 2014, 4, 201–205. [Google Scholar] [CrossRef]
- Chang, E.K.M.; Guo, Y.; Xia, X. CMIP5 multimodel ensemble projection of storm track change under global warming. J. Geophys. Res. Atmos. 2012, 117, D23118. [Google Scholar] [CrossRef]
- Sun, Q.; Miao, C.; Duan, Q. Projected changes in temperature and precipitation in ten river basins over China in 21st century. Int. J. Climatol. 2015, 35, 1125–1141. [Google Scholar] [CrossRef]
- Houghton, J.E.T.; Ding, Y.; Griggs, D.; Noguer, M.; van der Linden, P.; Dai, X.; Maskell, M.; Johnson, C. Climate Change 2001: The Scientific Basis; Intergovernmental Panel on Climate Change: Geneva, Switzerland, 2001; Volume 881, p. 881. [Google Scholar]
- Min, S.-K.; Legutke, S.; Hense, A.; Cubasch, U.; Kwon, W.-T.; Oh, J.-H.; Schlese, U. East Asian Climate Change in the 21st Century as Simulated by the Coupled Climate Model ECHO-G under IPCC SRES Scenarios. J. Meteorol. Soc. Japan. Ser. II 2006, 84, 1–26. [Google Scholar] [CrossRef][Green Version]
- Lu, K.; Arshad, M.; Ma, X.; Ullah, I.; Wang, J.; Shao, W. Evaluating observed and future spatiotemporal changes in precipitation and temperature across China based on CMIP6-GCMs. Int. J. Climatol. 2022, 42, 7703–7729. [Google Scholar] [CrossRef]
- Bai, H.; Xiao, D.; Wang, B.; Liu, D.L.; Feng, P.; Tang, J. Multi-model ensemble of CMIP6 projections for future extreme climate stress on wheat in the North China plain. Int. J. Climatol. 2021, 41, E171–E186. [Google Scholar] [CrossRef]
- Kitoh, A.; Endo, H.; Krishna Kumar, K.; Cavalcanti, I.F.A.; Goswami, P.; Zhou, T. Monsoons in a changing world: A regional perspective in a global context. J. Geophys. Res. Atmos. 2013, 118, 3053–3065. [Google Scholar] [CrossRef]
- Lee, J.-Y.; Wang, B. Future change of global monsoon in the CMIP5. Clim. Dyn. 2014, 42, 101–119. [Google Scholar] [CrossRef]
- Moon, S.; Ha, K.-J. Temperature and precipitation in the context of the annual cycle over Asia: Model evaluation and future change. Asia-Pac. J. Atmos. Sci. 2017, 53, 229–242. [Google Scholar] [CrossRef]
- Knutti, R.; Sedláček, J. Robustness and uncertainties in the new CMIP5 climate model projections. Nat. Clim. Change 2013, 3, 369–373. [Google Scholar] [CrossRef]
- Schmittner, A.; Latif, M.; Schneider, B. Model projections of the North Atlantic thermohaline circulation for the 21st century assessed by observations. Geophys. Res. Lett. 2005, 32, L23710. [Google Scholar] [CrossRef]
- Hawkins, E.; Sutton, R. The potential to narrow uncertainty in projections of regional precipitation change. Clim. Dyn. 2011, 37, 407–418. [Google Scholar] [CrossRef]
Disclaimer/Publisher’s Note: The statements, opinions and data contained in all publications are solely those of the individual author(s) and contributor(s) and not of MDPI and/or the editor(s). MDPI and/or the editor(s) disclaim responsibility for any injury to people or property resulting from any ideas, methods, instructions or products referred to in the content. |
© 2023 by the authors. Licensee MDPI, Basel, Switzerland. This article is an open access article distributed under the terms and conditions of the Creative Commons Attribution (CC BY) license (https://creativecommons.org/licenses/by/4.0/).