


Actual Evapotranspiration Dominates Drought in Central Asia
 ,
,
Abstract
:
1. Introduction
2. Data and Methods
2.1. Study Area
2.2. Data Sources
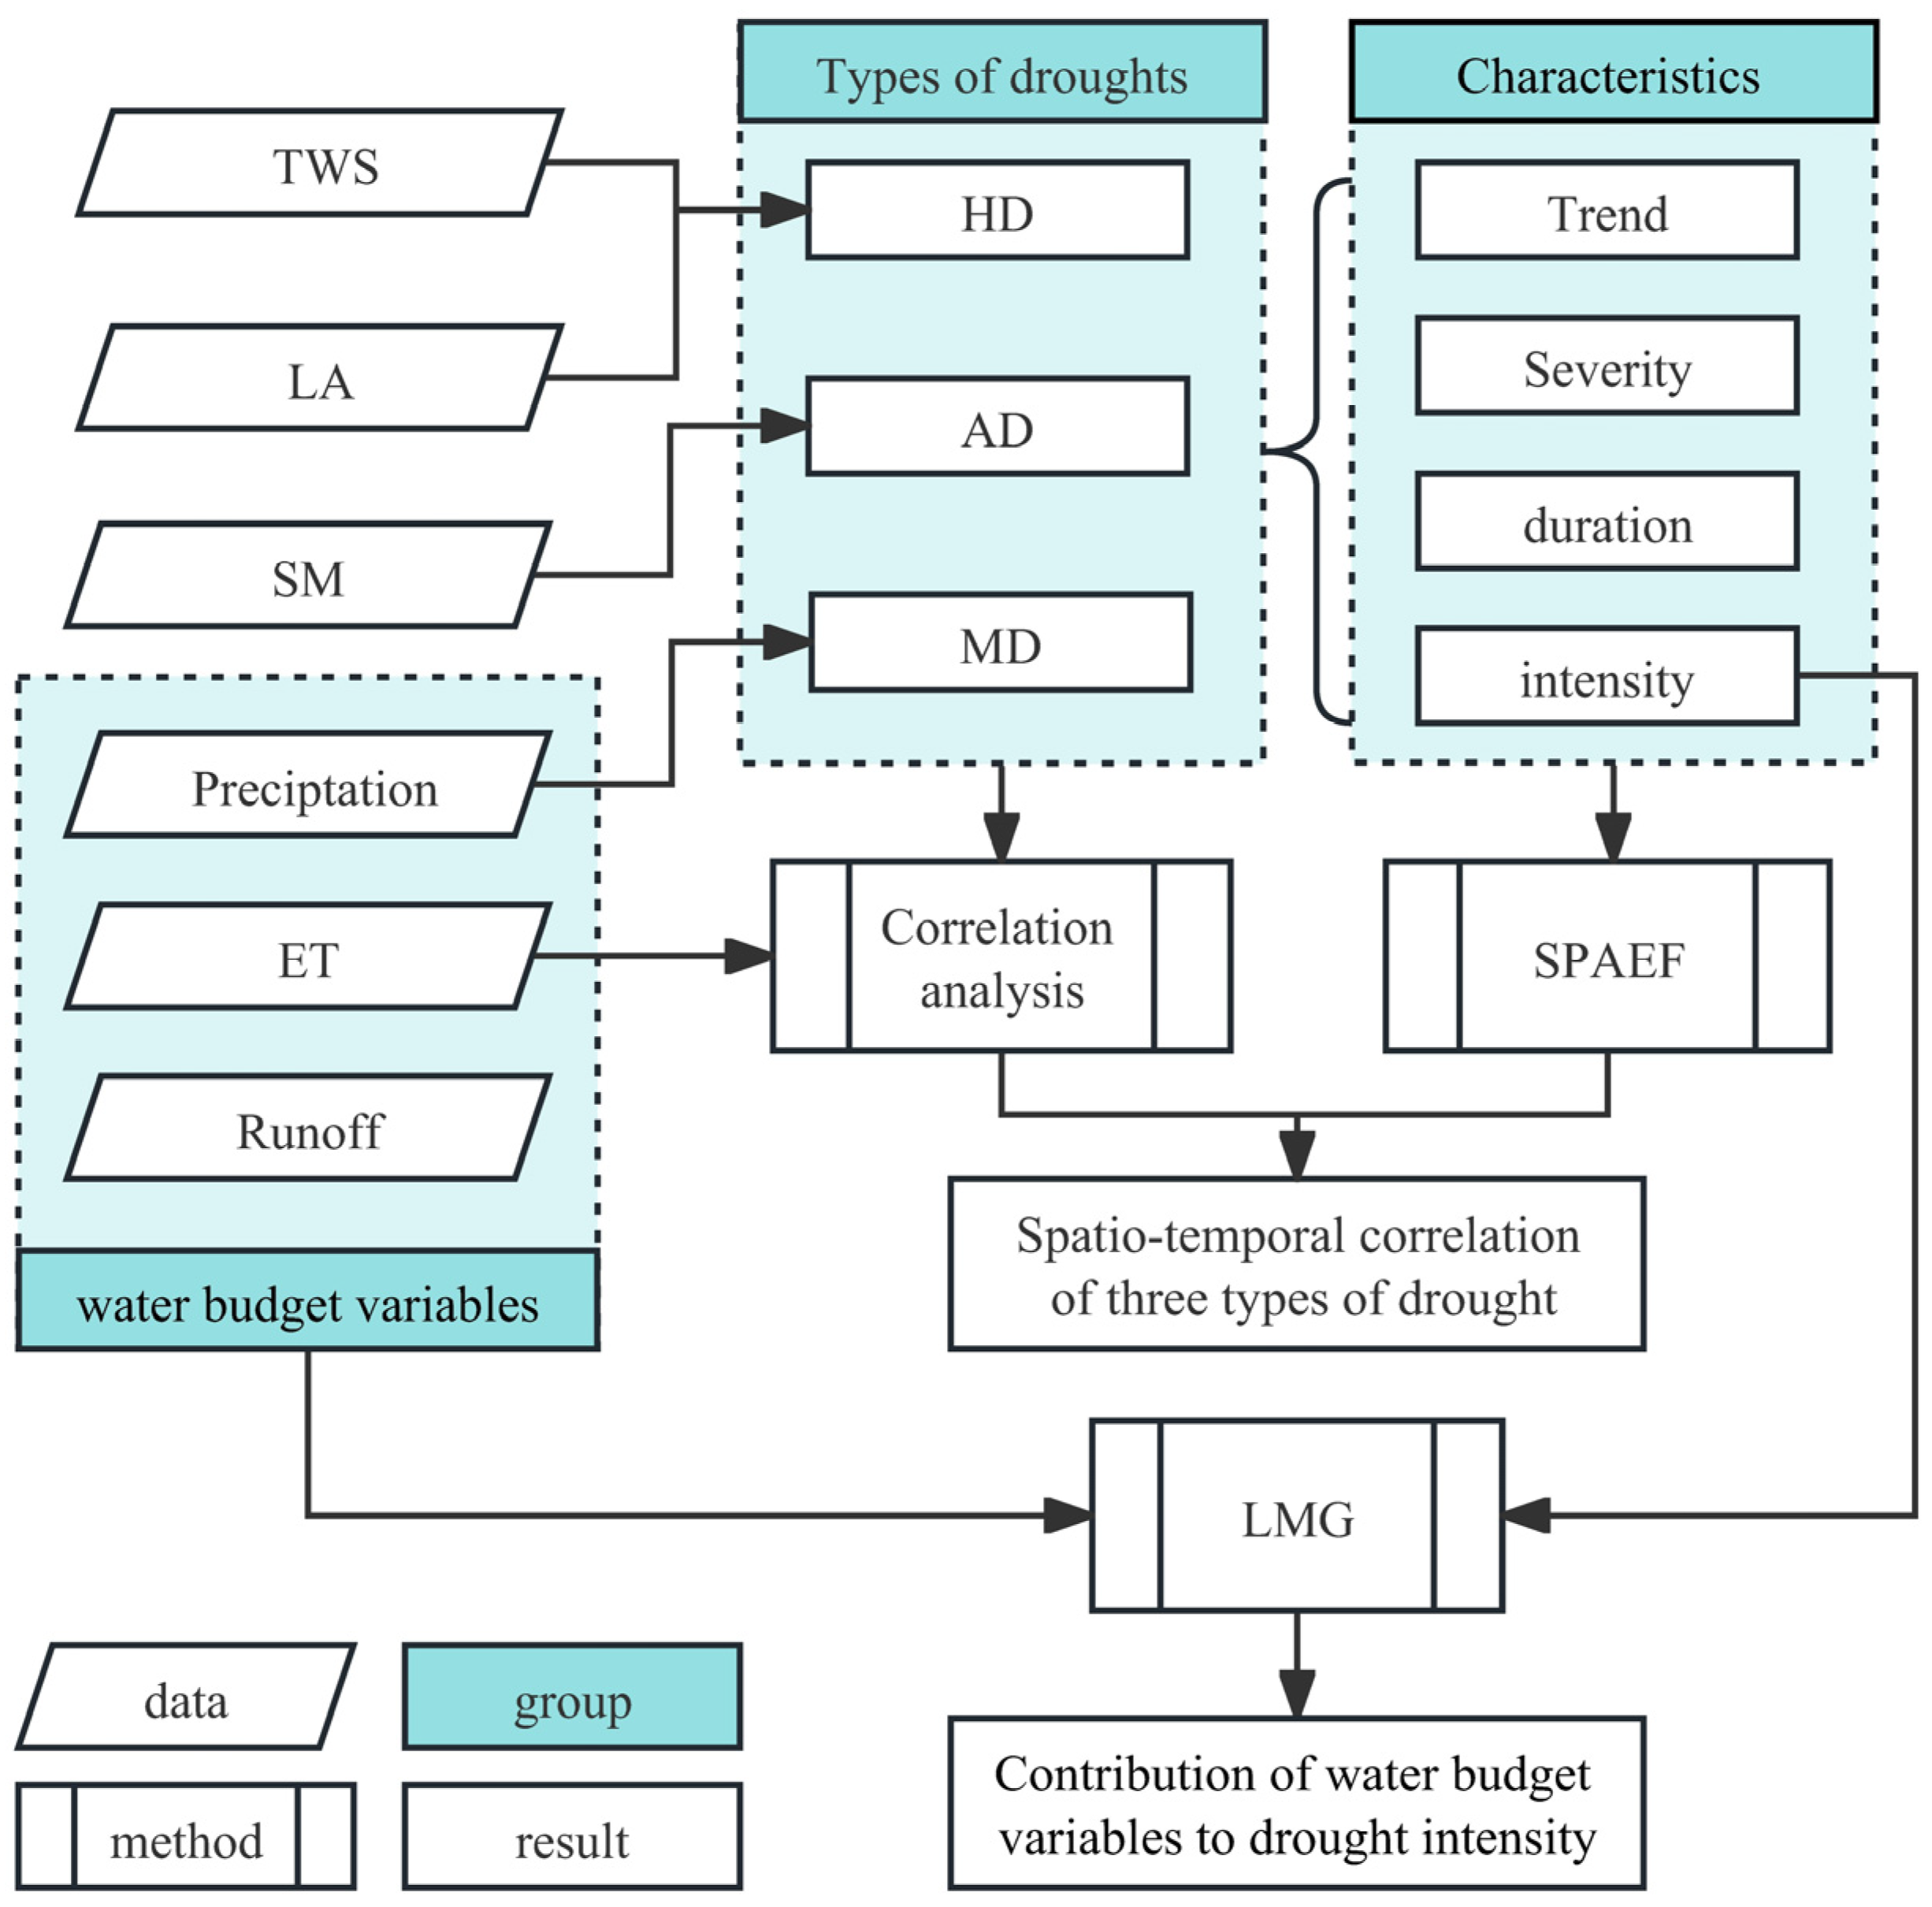
2.3. Methods
2.3.1. PT-DTsR Model
2.3.2. Drought Parameters
2.3.3. The Spatial Efficiency (SPAEF) Metric
2.3.4. Lindeman–Merenda–Gold Method
2.3.5. Wavelet Transform
3. Results
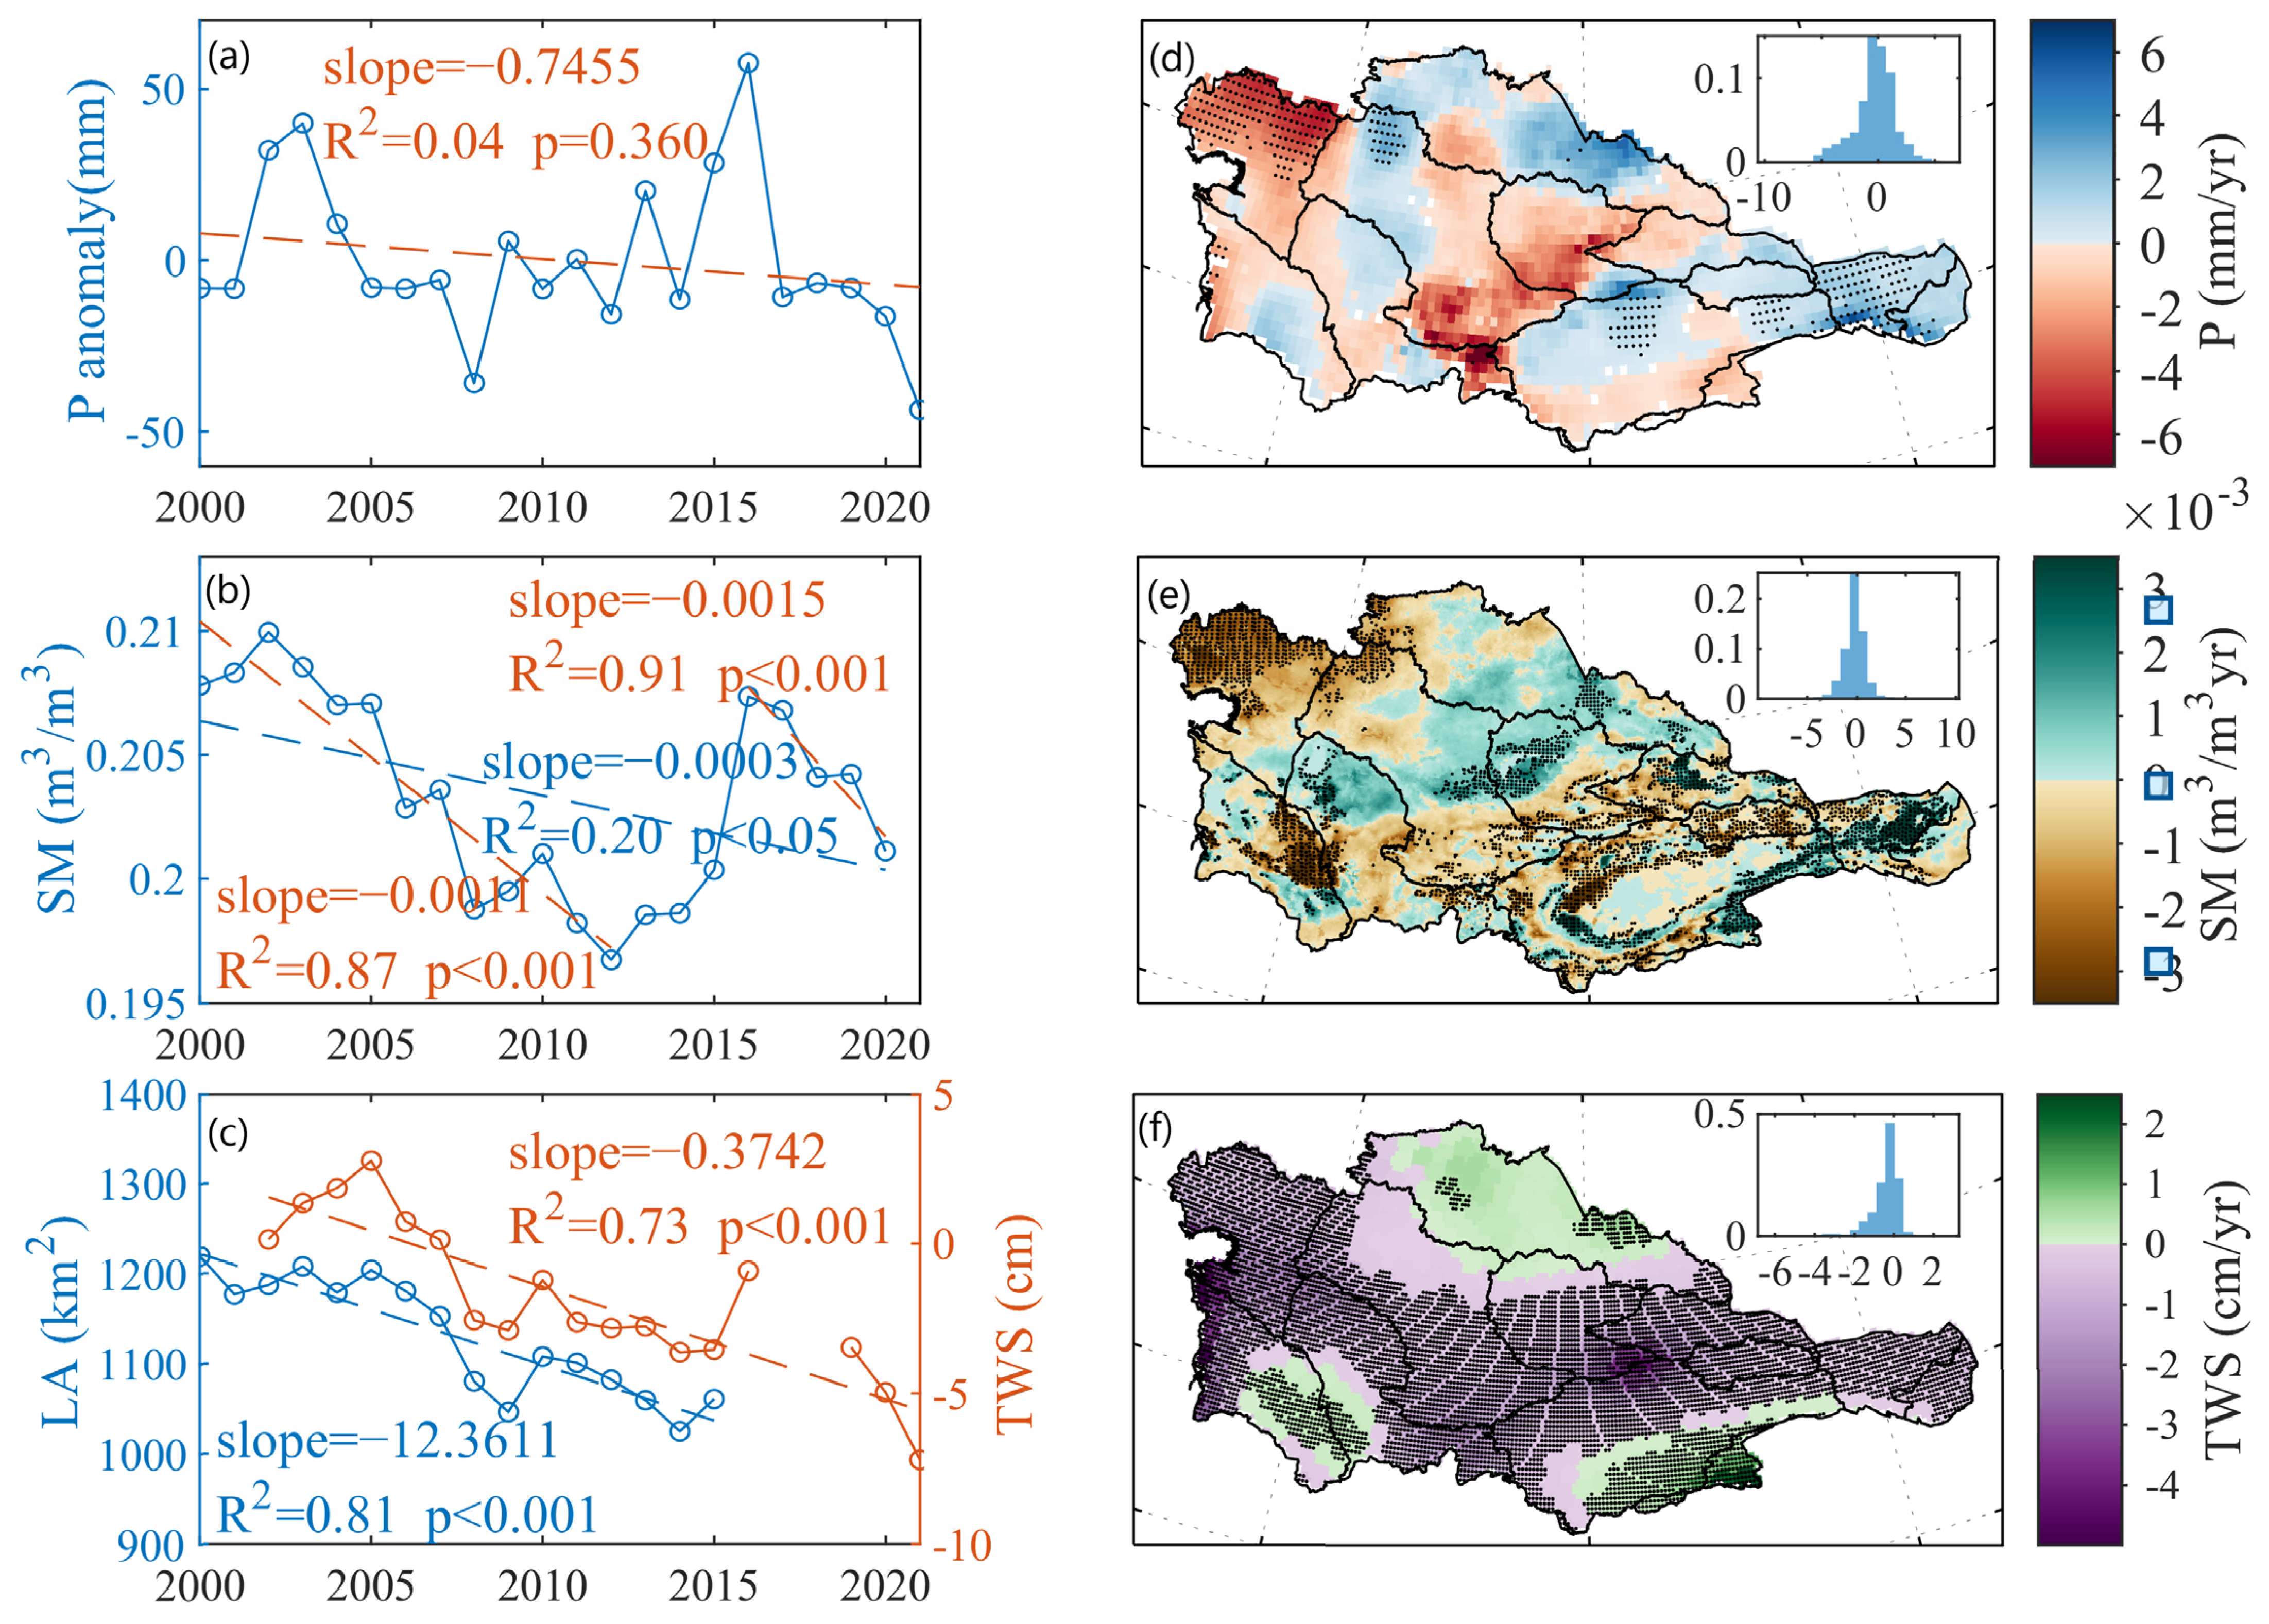
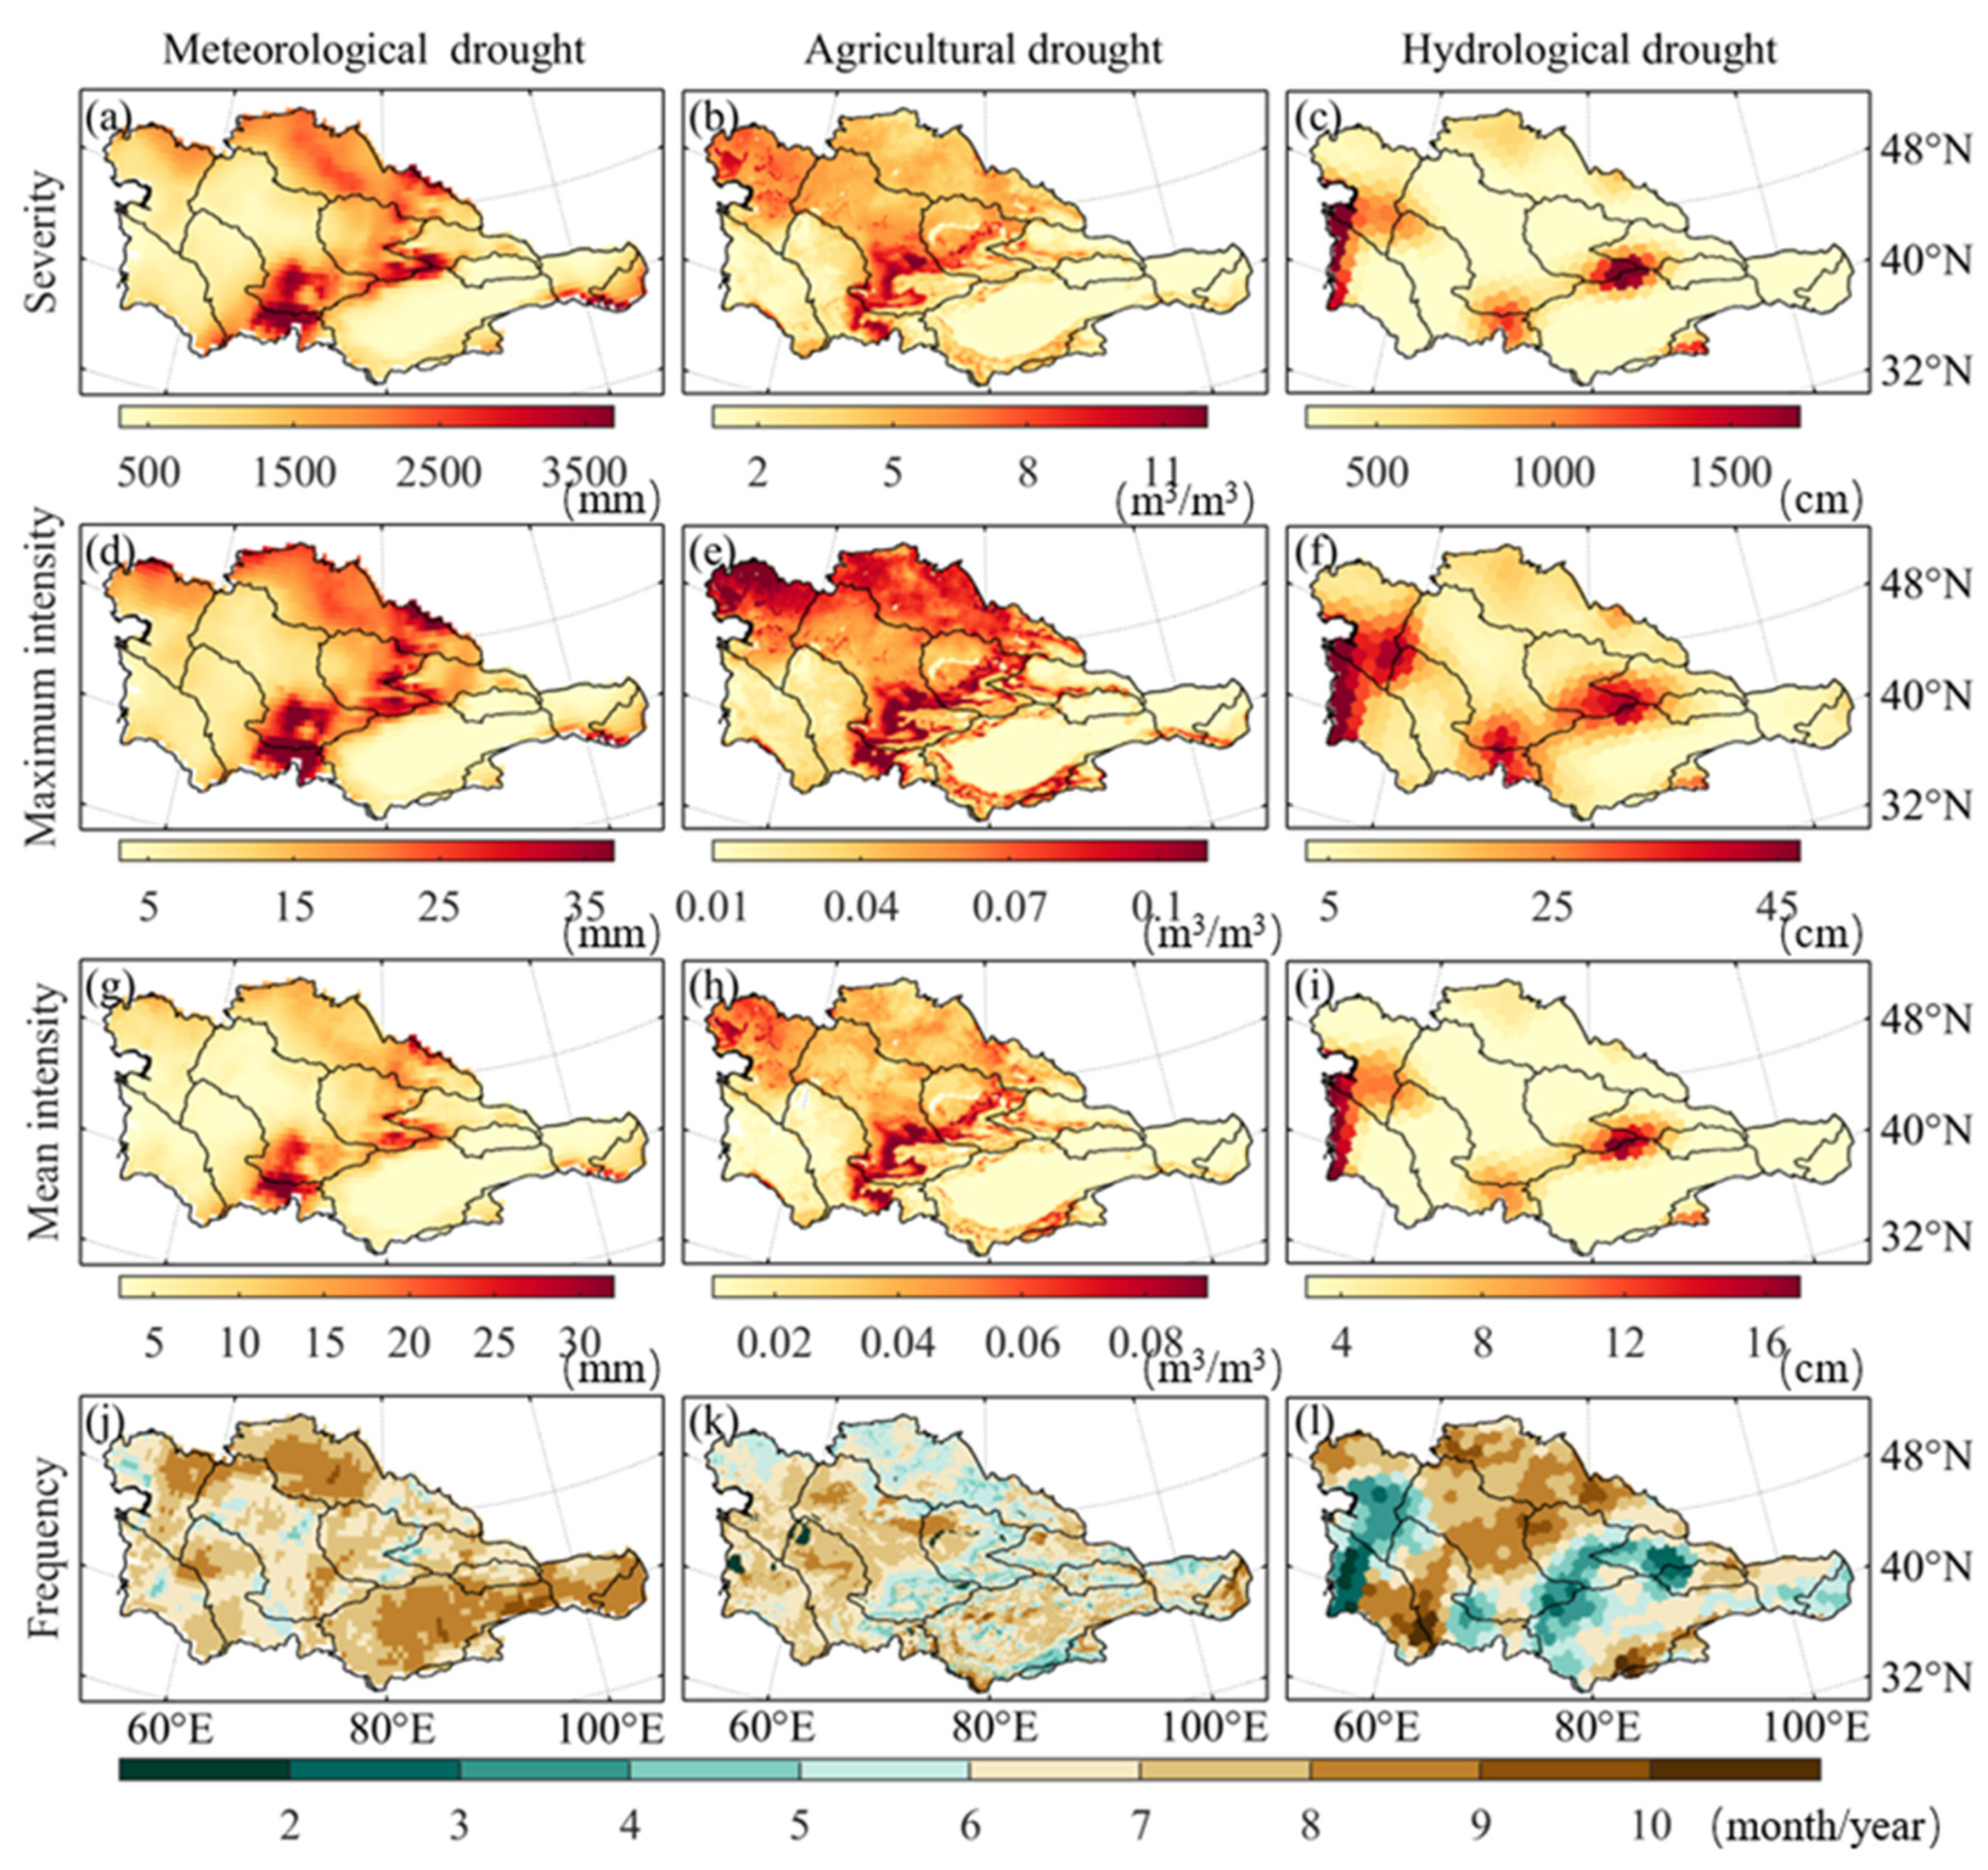
3.1. Drought Assessment in Central Asia
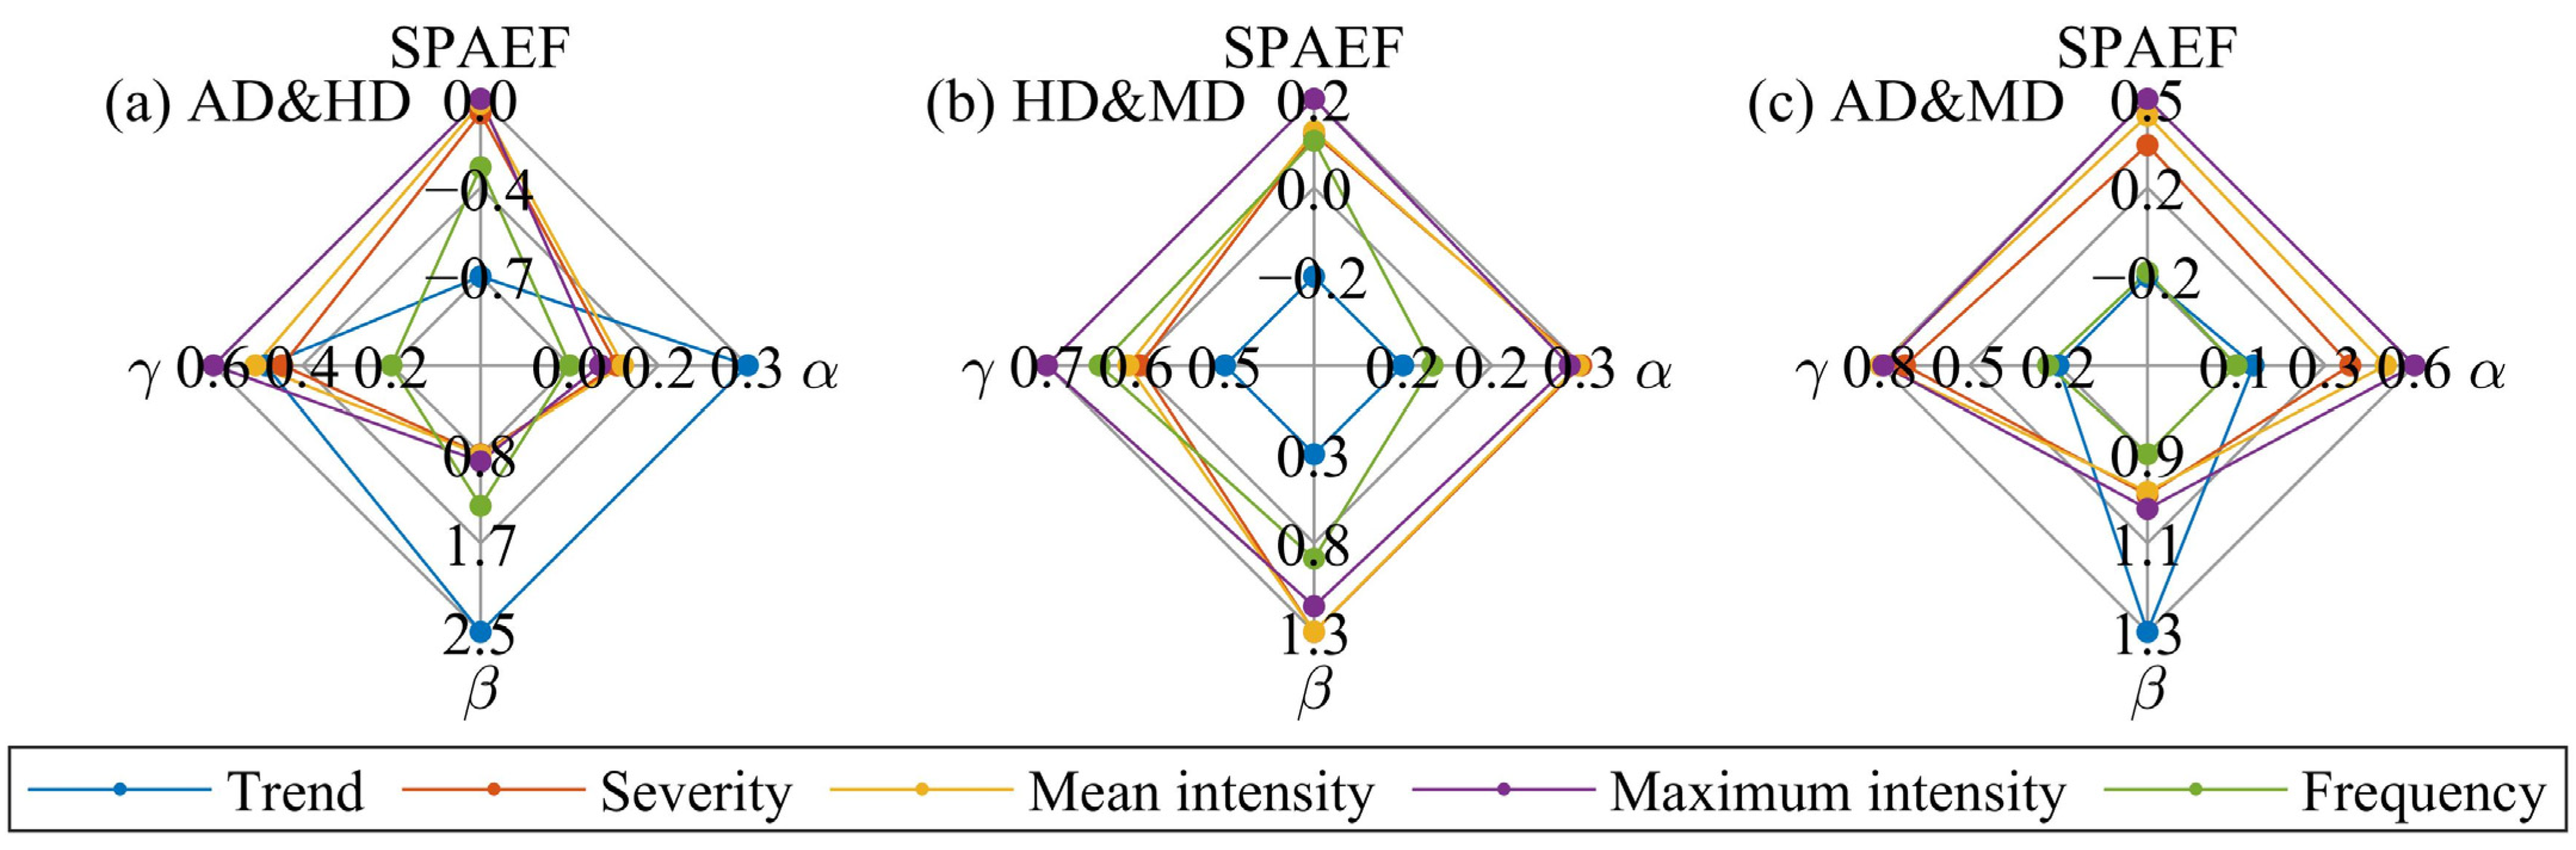
3.2. The Spatiotemporal Correlation of Various Types of Drought
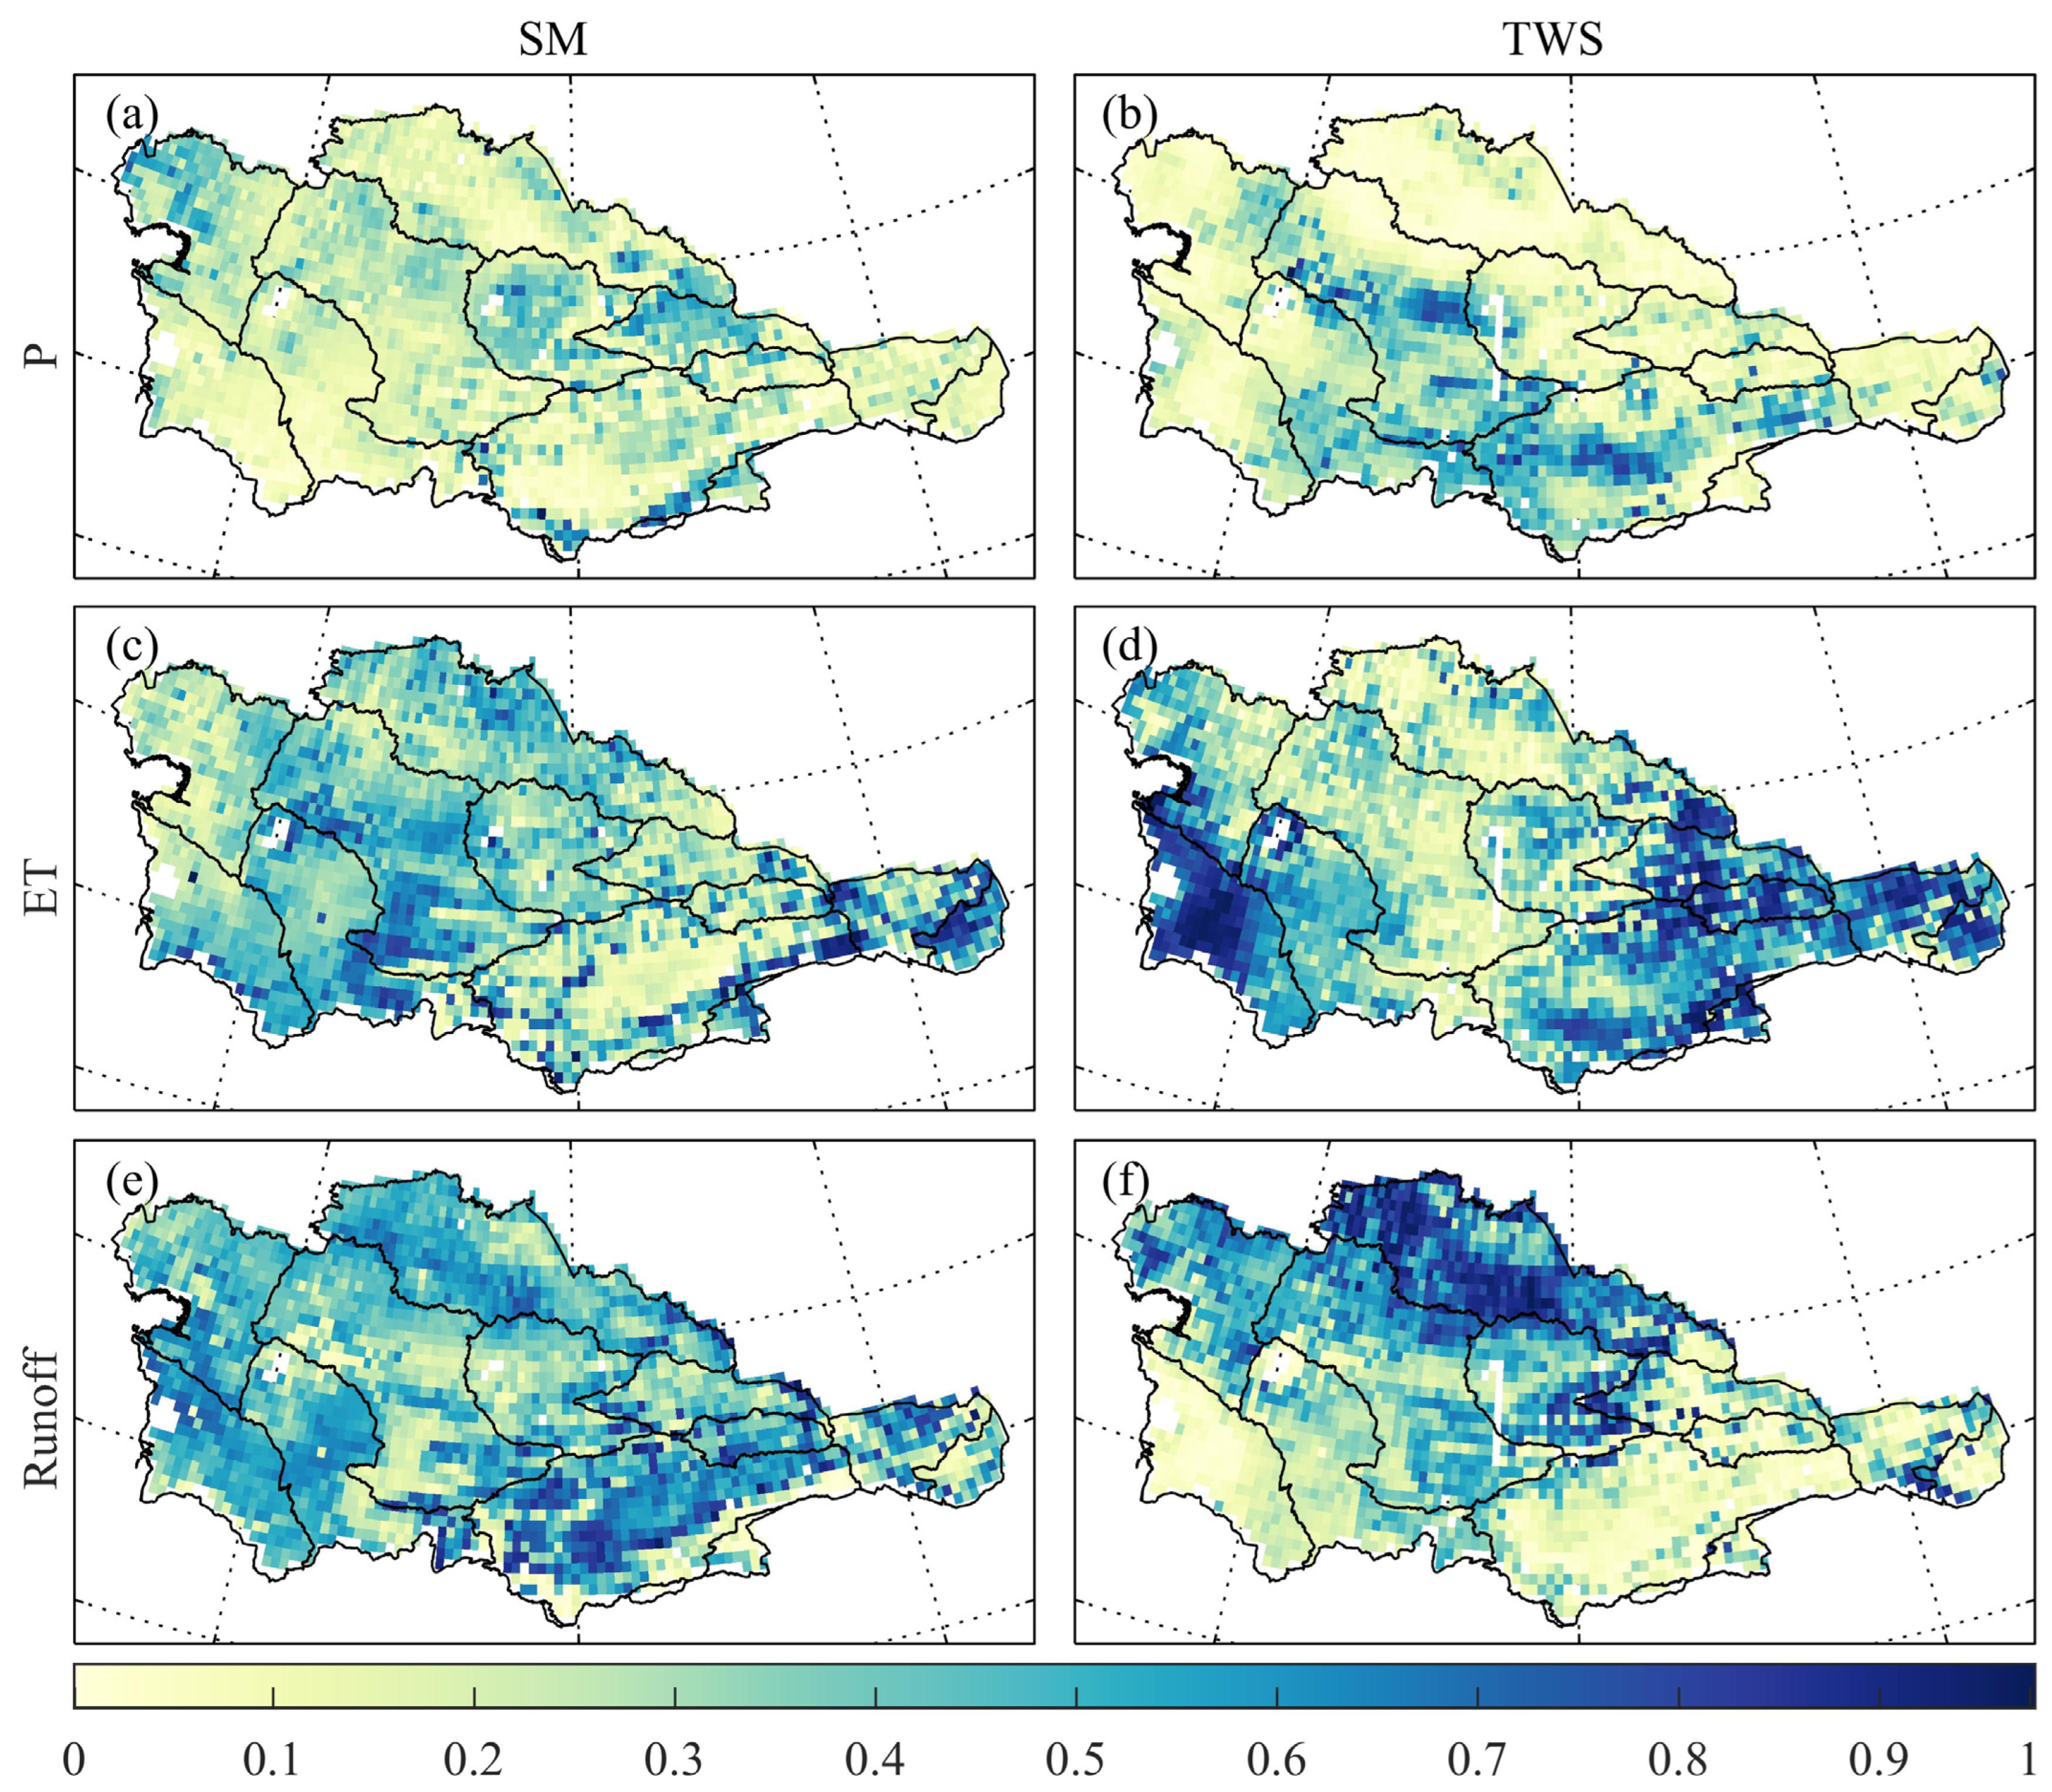
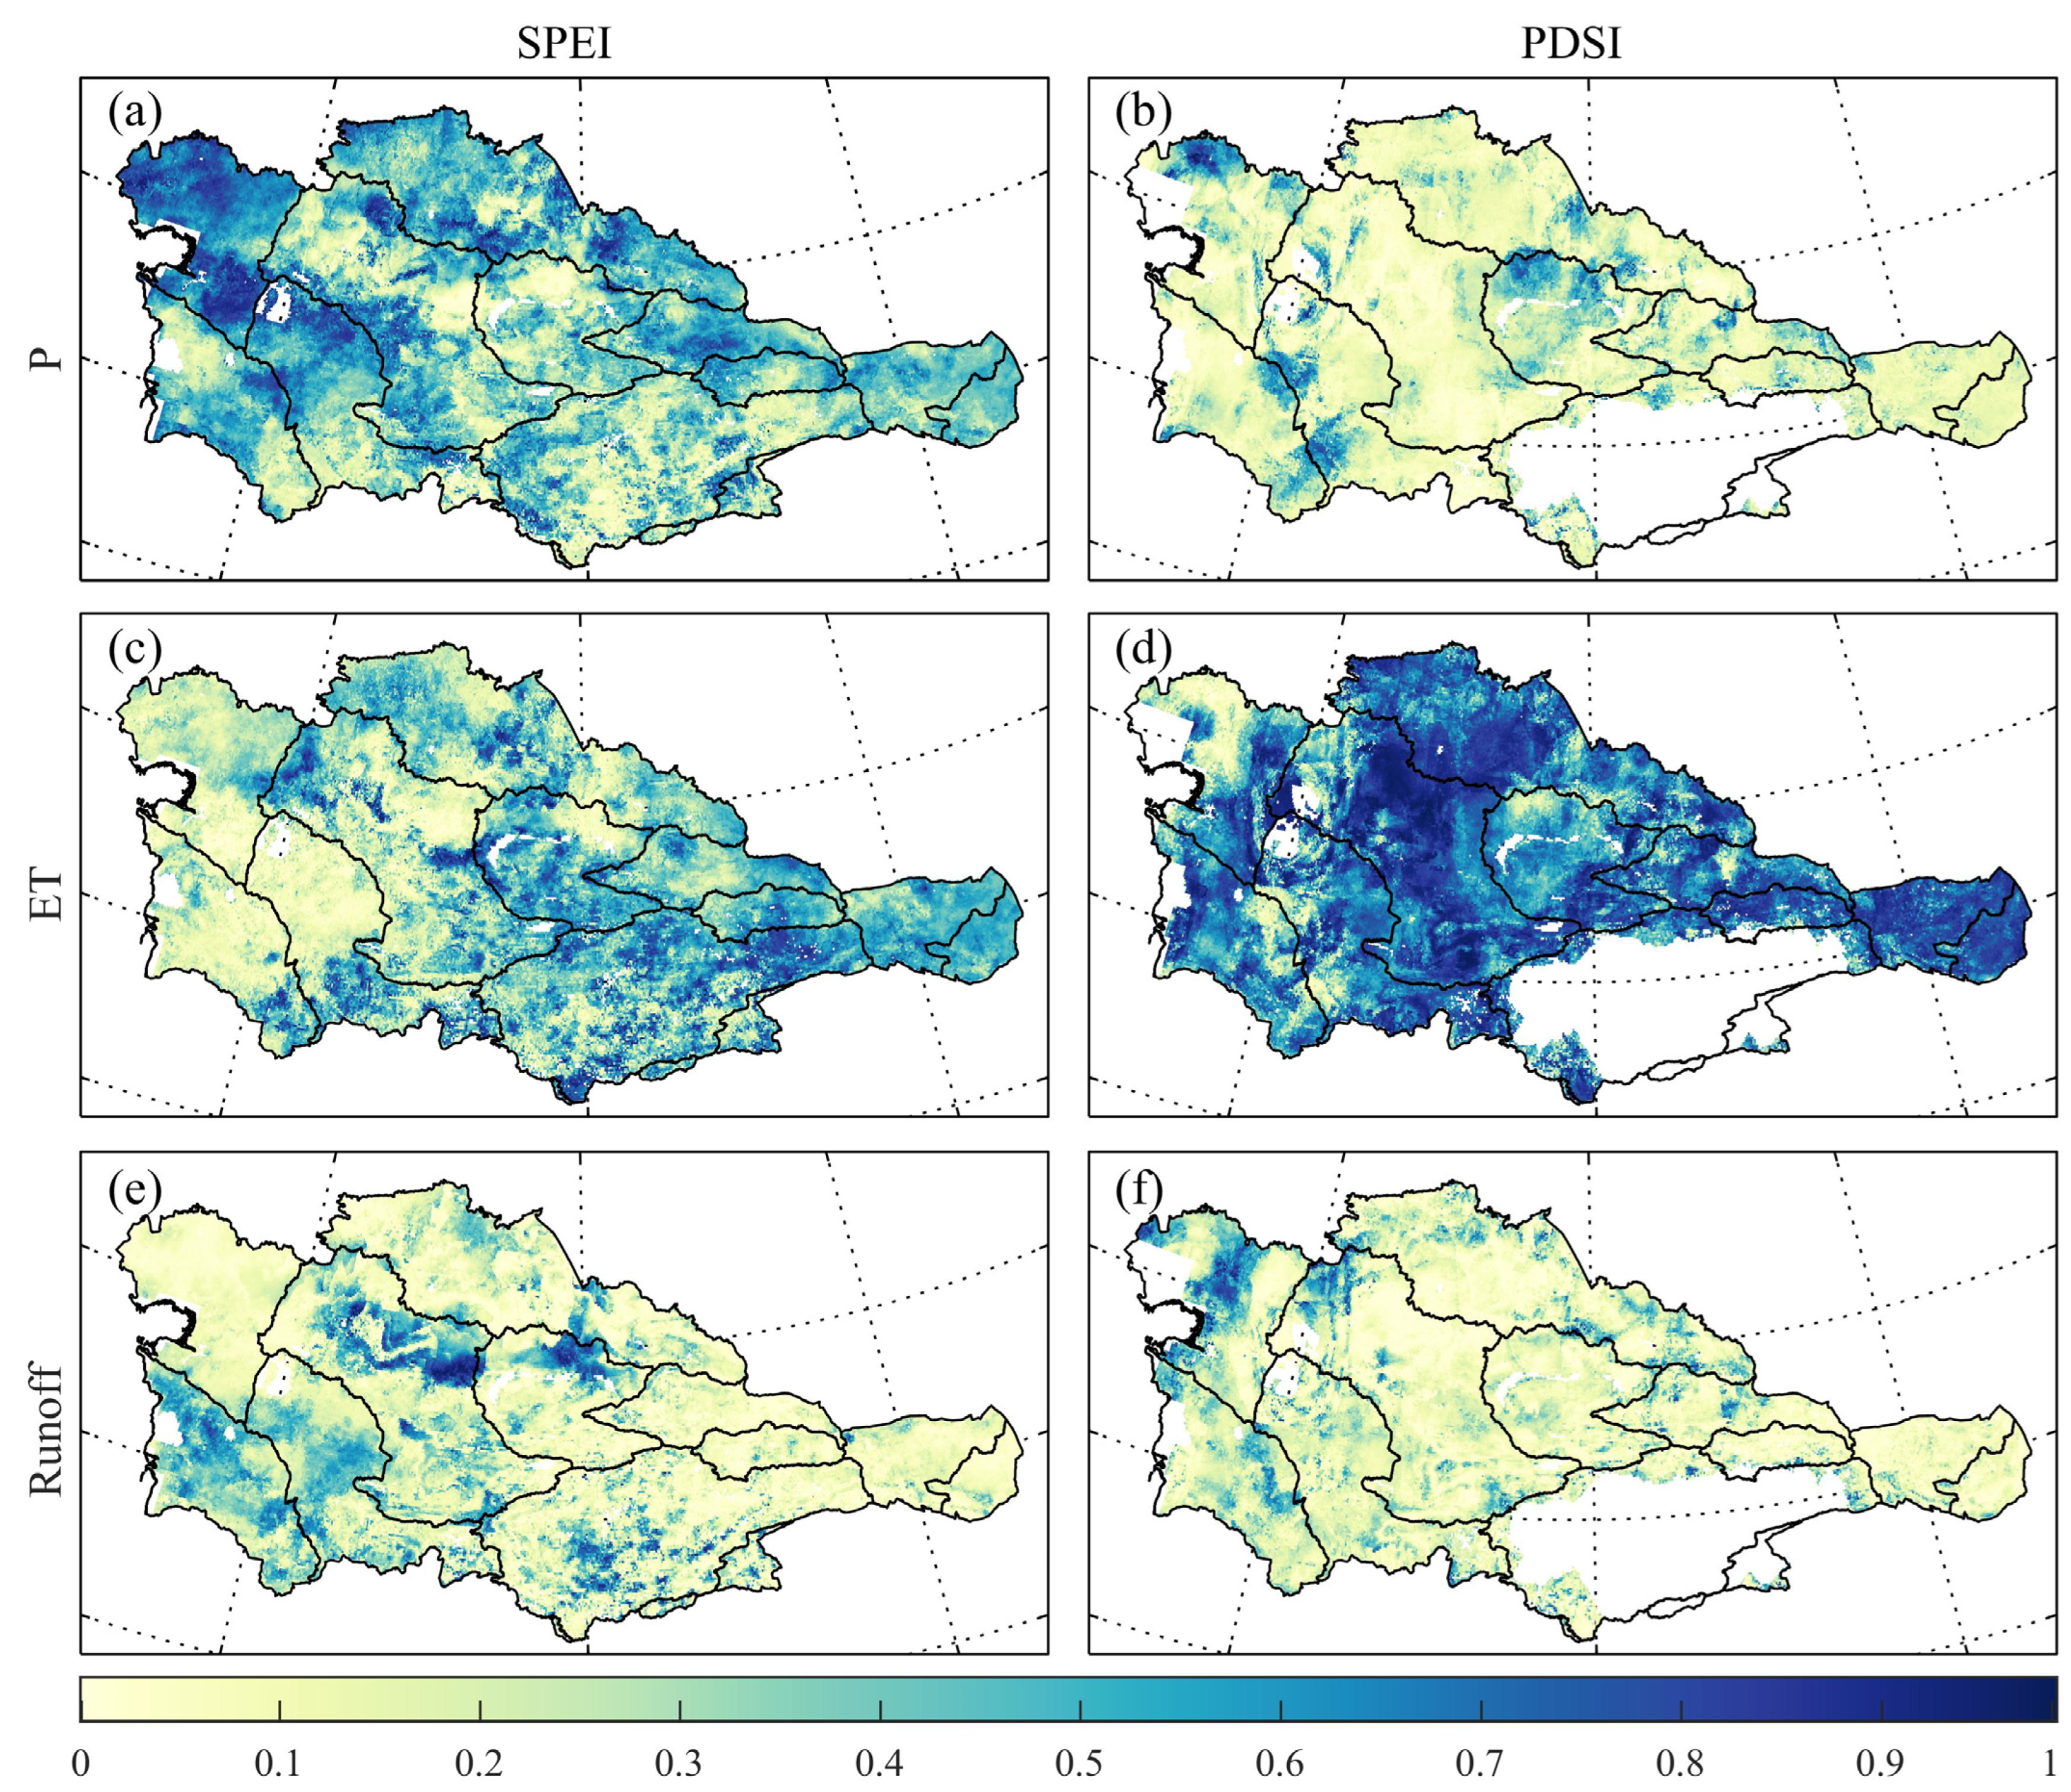
3.3. Contributions of Precipitation, ET, and Runoff to Drought Intensity
3.3.1. Contributions of Precipitation, ET, and Runoff to Agricultural Drought Intensity
3.3.2. Contributions of Precipitation, ET, and Runoff to Hydrological Drought Intensity
3.3.3. Contributions of Precipitation, ET, and Runoff to Meteorological Drought
4. Discussion
4.1. Comparison of Relative Contributions Based on Index and Indicator Methods
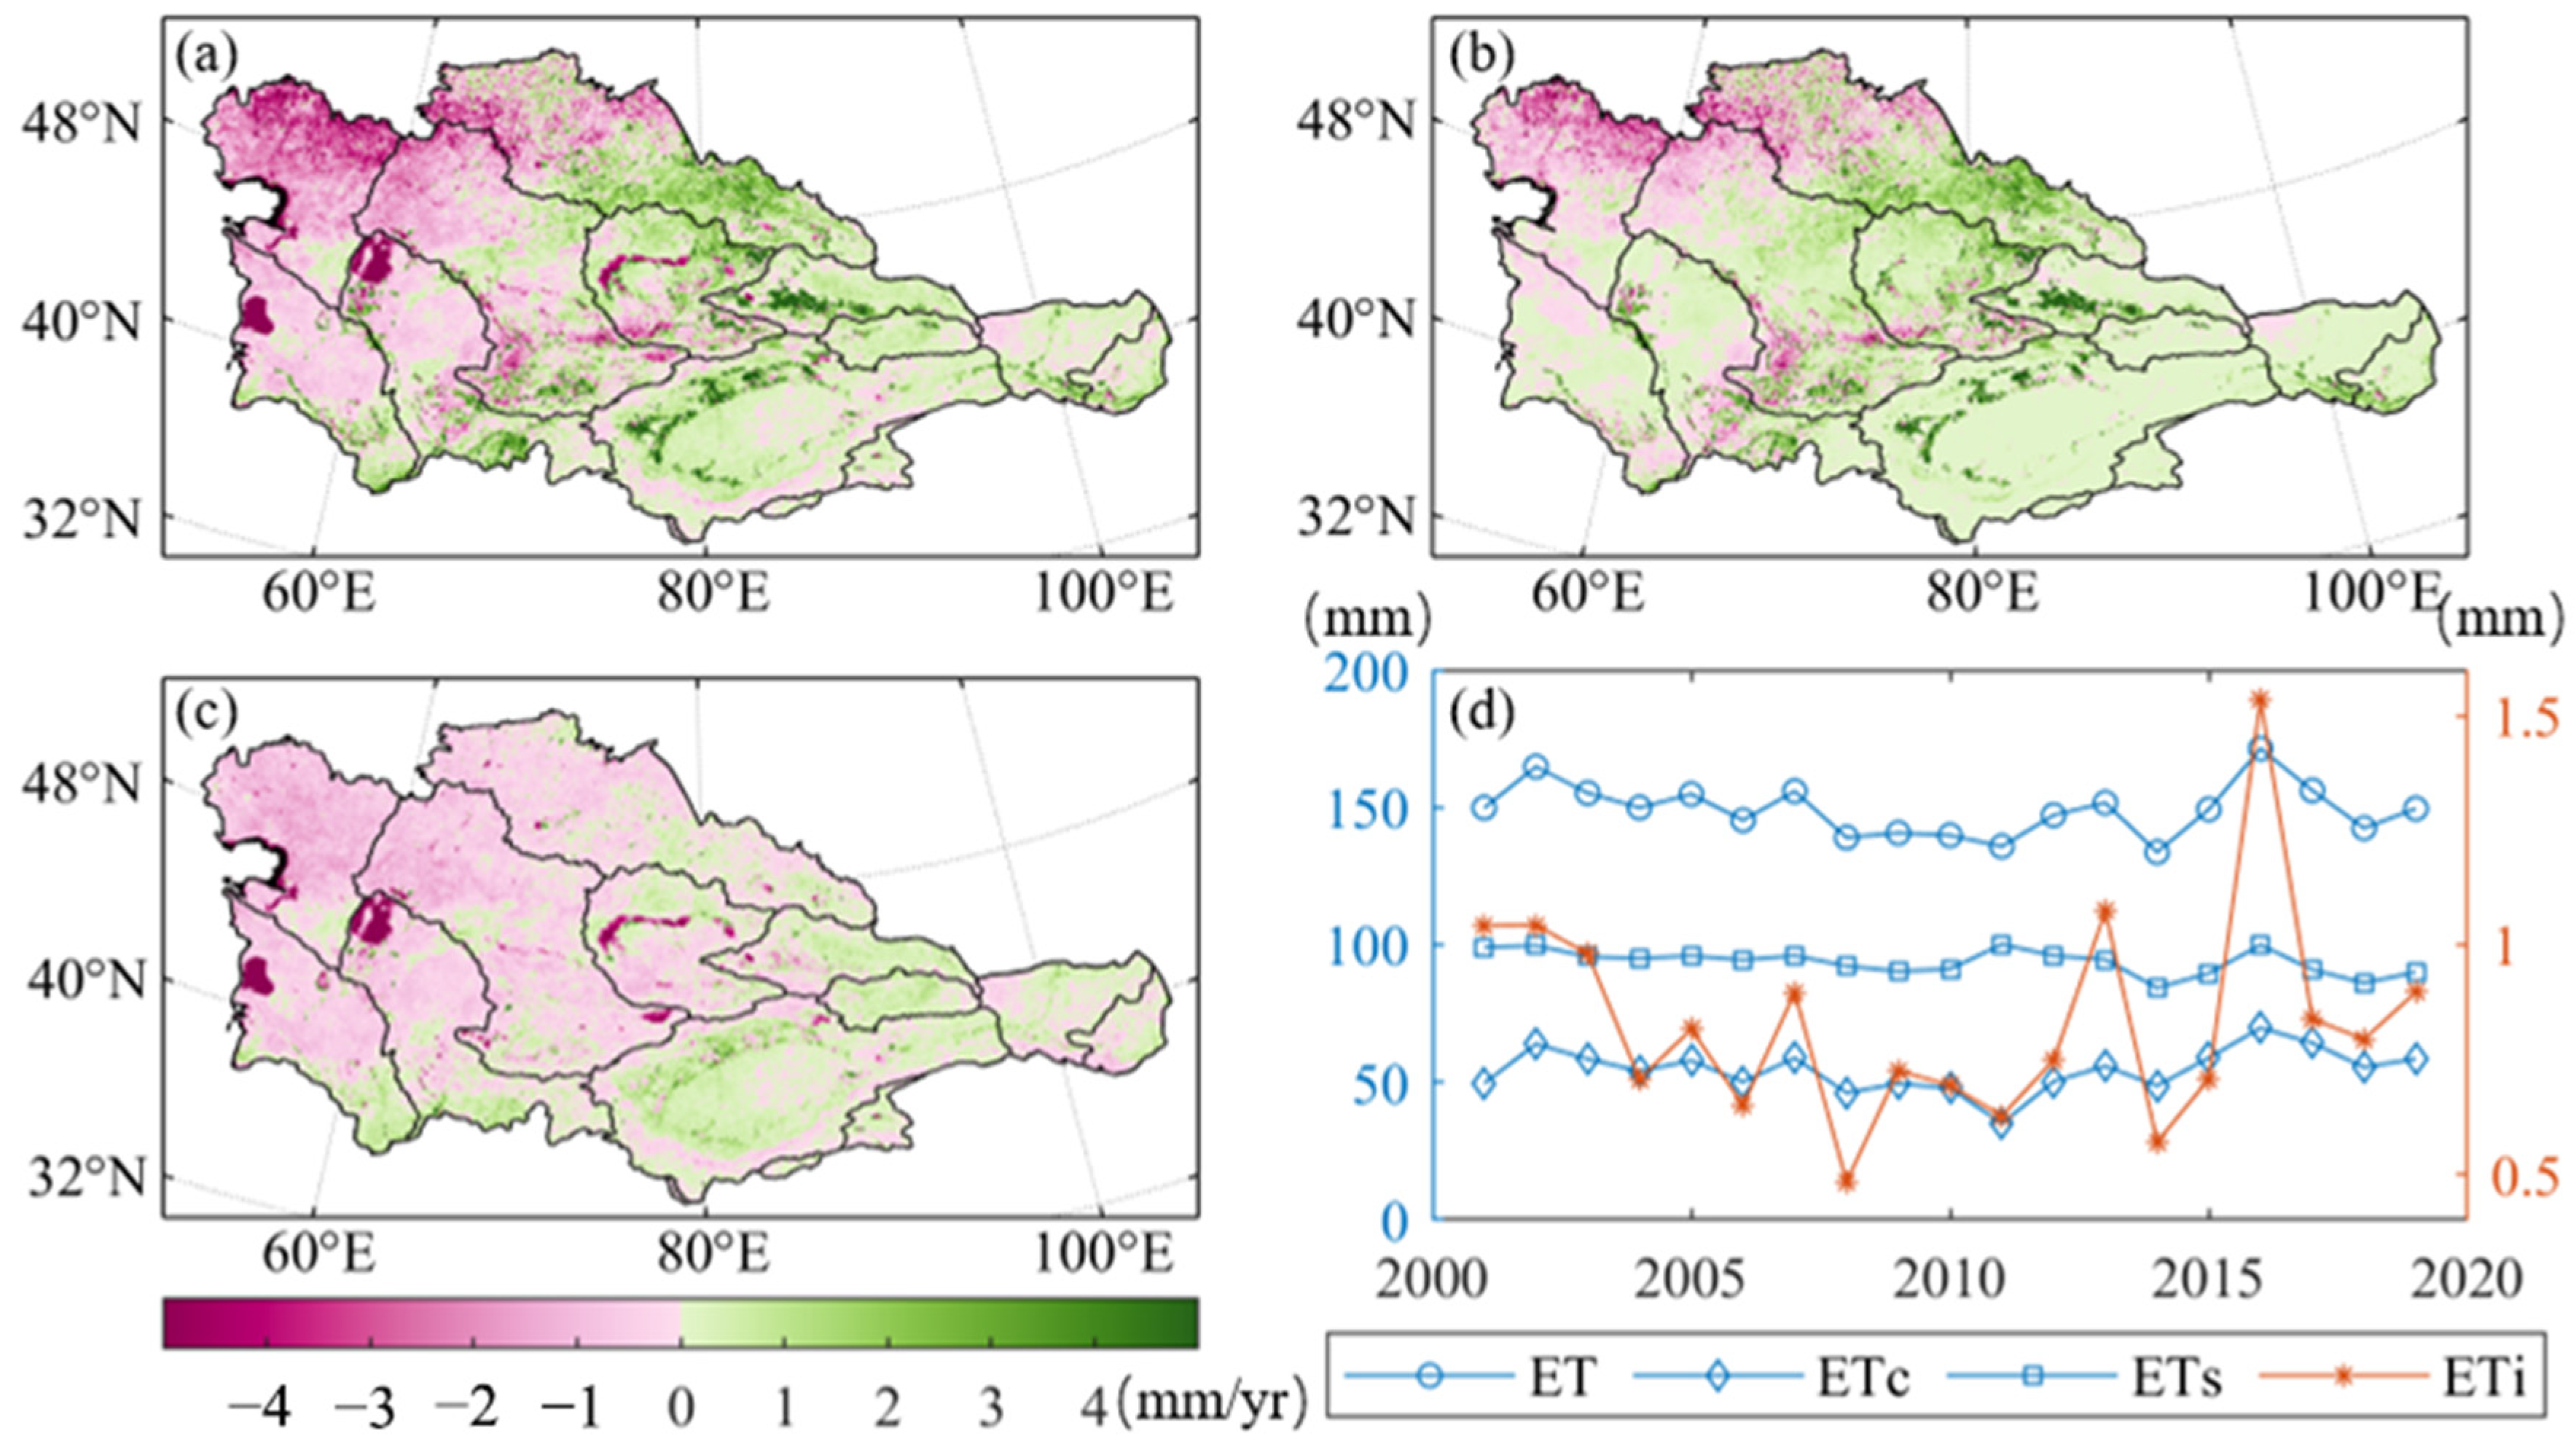
4.2. Driving Forces of ET Variation in Arid Region
4.3. Effects of Precipitation and Runoff (Water Income) on Drought
4.4. Interactions between Evapotranspiration, Precipitation, and Runoff
5. Conclusions
- (1)
- Drought has intensified in Central Asia. The trends observed in precipitation, SM, TWS, and total LA in this region were −0.75 mm·yr−1 (p = 0.36), −0.0003 m3·m−3 yr−1 (p < 0.05), −0.3742 cm·yr−1 (p < 0.001), and −12.3611 km2·yr−1 (p < 0.001), respectively. Severe droughts are typically characterized by short duration and high intensity.
- (2)
- Various types of drought display variations in both temporal correlation and spatial similarity. Only agricultural drought and hydrological drought demonstrate significant temporal correlation, while agricultural drought and meteorological drought show high spatial similarity.
- (3)
- Actual evapotranspiration played a dominant role in agricultural and hydrological drought in Central Asia, having relative contributions of 0.6438 and 0.5104 to agricultural and hydrological drought intensity, respectively.
Author Contributions
Funding
Data Availability Statement
Acknowledgments
Conflicts of Interest
Appendix A

| PRE | PET | GRACE | LAKE | SM | RO | ET | |
|---|---|---|---|---|---|---|---|
| CV | 10.73778 | 2.644813 | −145.721 | 5.808206 | 2.036123 | 14.80954 | 6.397844 |
| CI | [209.4703, 230.4125] | [1114.735, 1141.189] | [−3.03481, −0.48451] | [1094.199, 1164.093] | [0.201479, 0.205249] | [1.658742, 1.898547] | [145.2266, 154.192] |
| Mean | 219.9414 | 1127.962 | −1.75966 | 1129.146 | 0.203364 | 1.778645 | 149.7093 |
| Std | 23.61682 | 29.83249 | 2.564202 | 65.58312 | 0.004141 | 0.263409 | 9.578169 |
| Min | 176.405 | 1048.794 | −7.2091 | 1024.514 | 0.19674 | 1.29871 | 133.8691 |
| Max | 277.517 | 1190.727 | 2.758492 | 1219.309 | 0.209956 | 2.270297 | 171.5517 |
| Median | 211.9721 | 1128.332 | −2.59114 | 1130.043 | 0.203609 | 1.752532 | 149.8471 |
| Kurtosis | 3.343921 | 4.090735 | 2.544194 | 1.5013 | 1.579844 | 2.333386 | 2.788438 |
| Skewness | 0.655879 | −0.4297 | −0.06491 | −0.10801 | −0.00583 | 0.248407 | 0.351814 |
Appendix A.1. Contributions of Precipitation, Evapotranspiration, and Runoff to Soil Moisture and Terrestrial Water Storage
Appendix A.2. Spatiotemporal Variations in ET
References
- Mishra, A.K.; Singh, V.P. A review of drought concepts. J. Hydrol. 2010, 391, 202–216. [Google Scholar] [CrossRef]
- Trenberth, K.E.; Dai, A.; van der Schrier, G.; Jones, P.D.; Barichivich, J.; Briffa, K.R.; Sheffield, J. Global warming and changes in drought. Nat. Clim. Chang. 2013, 4, 17–22. [Google Scholar] [CrossRef]
- Vicente-Serrano, S.M.; Beguería, S.; López-Moreno, J.I. A Multiscalar Drought Index Sensitive to Global Warming: The Standardized Precipitation Evapotranspiration Index. J. Clim. 2010, 23, 1696–1718. [Google Scholar] [CrossRef]
- Trenberth, K.E.; Fasullo, J.T.; Shepherd, T.G. Attribution of climate extreme events. Nat. Clim. Chang. 2015, 5, 725–730. [Google Scholar] [CrossRef]
- Spinoni, J.; Naumann, G.; Carrao, H.; Barbosa, P.; Vogt, J. World drought frequency, duration, and severity for 1951-2010. Int. J. Climatol. 2014, 34, 2792–2804. [Google Scholar] [CrossRef]
- Piao, S.; Zhang, X.; Chen, A.; Liu, Q.; Lian, X.; Wang, X.; Peng, S.; Wu, X. The impacts of climate extremes on the terrestrial carbon cycle: A review. Sci. China Earth Sci. 2019, 62, 1551–1563. [Google Scholar] [CrossRef]
- Ault, T.R. On the essentials of drought in a changing climate. Science 2020, 368, 256–260. [Google Scholar] [CrossRef] [PubMed]
- Li, H.; Li, Z.; Chen, Y.; Xiang, Y.; Liu, Y.; Kayumba, P.M.; Li, X. Drylands face potential threat of robust drought in the CMIP6 SSPs scenarios. Environ. Res. Lett. 2021, 16, 114004. [Google Scholar] [CrossRef]
- Van Loon, A.F.; Laaha, G. Hydrological drought severity explained by climate and catchment characteristics. J. Hydrol. 2015, 526, 3–14. [Google Scholar] [CrossRef]
- Faiz, M.A.; Zhang, Y.; Tian, X.; Tian, J.; Zhang, X.; Ma, N.; Aryal, S. Drought index revisited to assess its response to vegetation in different agro-climatic zones. J. Hydrol. 2022, 614, 128543. [Google Scholar] [CrossRef]
- Van Loon, A.F. Hydrological drought explained. WIREs Water 2015, 2, 359–392. [Google Scholar] [CrossRef]
- Mukherjee, S.; Mishra, A.; Trenberth, K.E. Climate Change and Drought: A Perspective on Drought Indices. Curr. Clim. Chang. Rep. 2018, 4, 145–163. [Google Scholar] [CrossRef]
- Li, Z.; Chen, Y.; Fang, G.; Li, Y. Multivariate assessment and attribution of droughts in Central Asia. Sci. Rep. 2017, 7, 1316. [Google Scholar] [CrossRef] [PubMed]
- Teuling, A.J.; Van Loon, A.F.; Seneviratne, S.I.; Lehner, I.; Aubinet, M.; Heinesch, B.; Bernhofer, C.; Grünwald, T.; Prasse, H.; Spank, U. Evapotranspiration amplifies European summer drought. Geophys. Res. Lett. 2013, 40, 2071–2075. [Google Scholar] [CrossRef]
- Guo, H.; Bao, A.; Liu, T.; Jiapaer, G.; Ndayisaba, F.; Jiang, L.; Kurban, A.; De Maeyer, P. Spatial and temporal characteristics of droughts in Central Asia during 1966–2015. Sci. Total Environ. 2018, 624, 1523–1538. [Google Scholar] [CrossRef] [PubMed]
- Deng, H.; Yin, Y.; Han, X. Vulnerability of vegetation activities to drought in Central Asia. Environ. Res. Lett. 2020, 15, 084005. [Google Scholar] [CrossRef]
- Jiang, J.; Zhou, T. Agricultural drought over water-scarce Central Asia aggravated by internal climate variability. Nat. Geosci. 2023, 16, 154–161. [Google Scholar] [CrossRef]
- Li, Z.; Chen, Y.; Li, W.; Deng, H.; Fang, G. Potential impacts of climate change on vegetation dynamics in Central Asia. J. Geophys. Res. Atmos. 2015, 120, 12345–12356. [Google Scholar] [CrossRef]
- Chen, Y.; Li, W.; Deng, H.; Fang, G.; Li, Z. Changes in Central Asia’s Water Tower: Past, Present and Future. Sci. Rep. 2016, 6, 35458. [Google Scholar] [CrossRef]
- Arnell, N.W. Climate change and global water resources: SRES emissions and socio-economic scenarios. Glob. Environ. Chang. 2004, 14, 31–52. [Google Scholar] [CrossRef]
- Thomas, A.C.; Reager, J.T.; Famiglietti, J.S.; Rodell, M. A GRACE-based water storage deficit approach for hydrological drought characterization. Geophys. Res. Lett. 2014, 41, 1537–1545. [Google Scholar] [CrossRef]
- Dai, A. Increasing drought under global warming in observations and models. Nat. Clim. Chang. 2012, 3, 52–58. [Google Scholar] [CrossRef]
- Sheffield, J.; Wood, E.F.; Roderick, M.L. Little change in global drought over the past 60 years. Nature 2012, 491, 435–438. [Google Scholar] [CrossRef] [PubMed]
- Aksoy, H.; Cetin, M.; Eris, E.; Burgan, H.I.; Cavus, Y.; Yildirim, I.; Sivapalan, M. Critical drought intensity-duration-frequency curves based on total probability theorem-coupled frequency analysis. Hydrol. Sci. J. 2021, 66, 1337–1358. [Google Scholar] [CrossRef]
- Dai, A. Characteristics and trends in various forms of the Palmer Drought Severity Index during 1900–2008. J. Geophys. Res. 2011, 116, D12115. [Google Scholar] [CrossRef]
- Won, J.; Kim, S. Ecological Drought Condition Index to Monitor Vegetation Response to Meteorological Drought in Korean Peninsula. Remote Sens. 2023, 15, 337. [Google Scholar] [CrossRef]
- Iacobellis, S.F.; Steinemann, A.; Cayan, D.R. Developing and Evaluating Drought Indicators for Decision-Making. J. Hydrometeorol. 2015, 16, 1793–1803. [Google Scholar] [CrossRef]
- Vicente-Serrano, S.M.; Van der Schrier, G.; Beguería, S.; Azorin-Molina, C.; Lopez-Moreno, J.-I. Contribution of precipitation and reference evapotranspiration to drought indices under different climates. J. Hydrol. 2015, 526, 42–54. [Google Scholar] [CrossRef]
- Yang, M.; Mou, Y.; Meng, Y.; Liu, S.; Peng, C.; Zhou, X. Modeling the effects of precipitation and temperature patterns on agricultural drought in China from 1949 to 2015. Sci. Total Environ. 2020, 711, 135139. [Google Scholar] [CrossRef]
- Samaniego, L.; Thober, S.; Kumar, R.; Wanders, N.; Rakovec, O.; Pan, M.; Zink, M.; Sheffield, J.; Wood, E.F.; Marx, A. Anthropogenic warming exacerbates European soil moisture droughts. Nat. Clim. Chang. 2018, 8, 421–426. [Google Scholar] [CrossRef]
- Chen, F.-H.; Chen, J.-H.; Holmes, J.; Boomer, I.; Austin, P.; Gates, J.B.; Wang, N.-L.; Brooks, S.J.; Zhang, J.-W. Moisture changes over the last millennium in arid central Asia: A review, synthesis and comparison with monsoon region. Quat. Sci. Rev. 2010, 29, 1055–1068. [Google Scholar] [CrossRef]
- Harris, I.; Osborn, T.J.; Jones, P.; Lister, D. Version 4 of the CRU TS monthly high-resolution gridded multivariate climate dataset. Sci. Data 2020, 7, 109. [Google Scholar] [CrossRef] [PubMed]
- Beck, H.E.; Pan, M.; Miralles, D.G.; Reichle, R.H.; Dorigo, W.A.; Hahn, S.; Sheffield, J.; Karthikeyan, L.; Balsamo, G.; Parinussa, R.M.; et al. Evaluation of 18 satellite- and model-based soil moisture products using in situ measurements from 826 sensors. Hydrol. Earth Syst. Sci. 2021, 25, 17–40. [Google Scholar] [CrossRef]
- Khandelwal, A.; Karpatne, A.; Ravirathinam, P.; Ghosh, R.; Wei, Z.; Dugan, H.A.; Hanson, P.C.; Kumar, V. ReaLSAT, a global dataset of reservoir and lake surface area variations. Sci. Data 2022, 9, 1–12. [Google Scholar] [CrossRef]
- Yao, Y.; Liang, S.; Cheng, J.; Liu, S.; Fisher, J.B.; Zhang, X.; Jia, K.; Zhao, X.; Qin, Q.; Zhao, B.; et al. MODIS-driven estimation of terrestrial latent heat flux in China based on a modified Priestley–Taylor algorithm. Agric. For. Meteorol. 2013, 171–172, 187–202. [Google Scholar] [CrossRef]
- Hao, X.; Fan, X.; Zhao, Z.; Zhang, J. Spatiotemporal Patterns of Evapotranspiration in Central Asia from 2000 to 2020. Remote Sens. 2023, 15, 1150. [Google Scholar] [CrossRef]
- Yao, Y.; Liang, S.; Li, X.; Hong, Y.; Fisher, J.B.; Zhang, N.; Chen, J.; Cheng, J.; Zhao, S.; Zhang, X.; et al. Bayesian multimodel estimation of global terrestrial latent heat flux from eddy covariance, meteorological, and satellite observations. J. Geophys. Res. Atmos. 2014, 119, 4521–4545. [Google Scholar] [CrossRef]
- Vicente-Serrano, S.M.; Beguería, S.; López-Moreno, J.I.; Angulo, M.; El Kenawy, A. A New Global 0.5° Gridded Dataset (1901–2006) of a Multiscalar Drought Index: Comparison with Current Drought Index Datasets Based on the Palmer Drought Severity Index. J. Hydrometeorol. 2010, 11, 1033–1043. [Google Scholar] [CrossRef]
- Zhang, Z.; Ju, W.; Zhou, Y.; Li, X. Revisiting the cumulative effects of drought on global gross primary productivity based on new long-term series data (1982–2018). Glob. Chang. Biol. 2022, 28, 3620–3635. [Google Scholar] [CrossRef]
- Hulley, G.C.; Dousset, B.; Kahn, B.H. Rising Trends in Heatwave Metrics Across Southern California. Earths Future 2020, 8, e2020EF001480. [Google Scholar] [CrossRef]
- Fisher, J.B.; Tu, K.P.; Baldocchi, D.D. Global estimates of the land–atmosphere water flux based on monthly AVHRR and ISLSCP-II data, validated at 16 FLUXNET sites. Remote Sens. Environ. 2008, 112, 901–919. [Google Scholar] [CrossRef]
- Cao, M.; Wang, W.; Xing, W.; Wei, J.; Chen, X.; Li, J.; Shao, Q. Multiple sources of uncertainties in satellite retrieval of terrestrial actual evapotranspiration. J. Hydrol. 2021, 601, 126642. [Google Scholar] [CrossRef]
- van der Schrier, G.; Jones, P.D.; Briffa, K.R. The sensitivity of the PDSI to the Thornthwaite and Penman-Monteith parameterizations for potential evapotranspiration. J. Geophys. Res. 2011, 116. [Google Scholar] [CrossRef]
- Lloyd-Hughes, B. The impracticality of a universal drought definition. Theor. Appl. Climatol. 2013, 117, 607–611. [Google Scholar] [CrossRef]
- Demirel, M.C.; Mai, J.; Mendiguren, G.; Koch, J.; Samaniego, L.; Stisen, S. Combining satellite data and appropriate objective functions for improved spatial pattern performance of a distributed hydrologic model. Hydrol. Earth Syst. Sci. 2018, 22, 1299–1315. [Google Scholar] [CrossRef]
- Koch, J.; Demirel, M.C.; Stisen, S. The SPAtial EFficiency metric (SPAEF): Multiple-component evaluation of spatial patterns for optimization of hydrological models. Geosci. Model Dev. 2018, 11, 1873–1886. [Google Scholar] [CrossRef]
- Grömping, U. Relative Importance for Linear Regression inR: The Packagerelaimpo. J. Stat. Softw. 2006, 17, 1–27. [Google Scholar] [CrossRef]
- Fernández-Martínez, M.; Vicca, S.; Janssens, I.A.; Sardans, J.; Luyssaert, S.; Campioli, M.; Chapin Iii, F.S.; Ciais, P.; Malhi, Y.; Obersteiner, M.; et al. Nutrient availability as the key regulator of global forest carbon balance. Nat. Clim. Chang. 2014, 4, 471–476. [Google Scholar] [CrossRef]
- Yao, Y.; Wang, X.; Li, Y.; Wang, T.; Shen, M.; Du, M.; He, H.; Li, Y.; Luo, W.; Ma, M.; et al. Spatiotemporal pattern of gross primary productivity and its covariation with climate in China over the last thirty years. Glob. Chang. Biol. 2018, 24, 184–196. [Google Scholar] [CrossRef]
- Amantai, N.; Ding, J.; Ge, X.; Bao, Q. Variation characteristics of actual evapotranspiration and meteorological elements in the Ebinur Lake basin from 1960 to 2017. Acta Geogr. Sin. 2021, 76, 1177–1192. [Google Scholar] [CrossRef]
- Zhao, M.; Liu, Y.; Konings, A.G. Evapotranspiration frequently increases during droughts. Nat. Clim. Chang. 2022, 12, 1024–1030. [Google Scholar] [CrossRef]
- Save, H.; Bettadpur, S.; Tapley, B.D. High-resolution CSR GRACE RL05 mascons. J. Geophys. Res. Solid Earth 2016, 121, 7547–7569. [Google Scholar] [CrossRef]
- Svoboda, M.D.; Fuchs, B.A. Handbook of Drought Indicators and Indices; World Meteorological Organization: Geneva, Switzerland, 2016; Volume 2. [Google Scholar]
- Zhang, K.; Kimball, J.S.; Mu, Q.; Jones, L.A.; Goetz, S.J.; Running, S.W. Satellite based analysis of northern ET trends and associated changes in the regional water balance from 1983 to 2005. J. Hydrol. 2009, 379, 92–110. [Google Scholar] [CrossRef]
- Xu, H.; Lian, X.; Slette, I.J.; Yang, H.; Zhang, Y.; Chen, A.; Piao, S. Rising ecosystem water demand exacerbates the lengthening of tropical dry seasons. Nat. Commun. 2022, 13, 4093. [Google Scholar] [CrossRef] [PubMed]
- Hao, Z.; AghaKouchak, A. Multivariate Standardized Drought Index: A parametric multi-index model. Adv. Water Resour. 2013, 57, 12–18. [Google Scholar] [CrossRef]
- Kao, S.-C.; Govindaraju, R.S. A copula-based joint deficit index for droughts. J. Hydrol. 2010, 380, 121–134. [Google Scholar] [CrossRef]
- AghaKouchak, A.; Farahmand, A.; Melton, F.S.; Teixeira, J.; Anderson, M.C.; Wardlow, B.D.; Hain, C.R. Remote Sens. of drought: Progress, challenges and opportunities. Rev. Geophys. 2015, 53, 452–480. [Google Scholar] [CrossRef]
- Yang, X.; Wang, N.; Chen, A.A.; He, J.; Hua, T.; Qie, Y. Changes in area and water volume of the Aral Sea in the arid Central Asia over the period of 1960–2018 and their causes. Catena 2020, 191, 104566. [Google Scholar] [CrossRef]
- Chen, Y.; Li, W.; Fang, G. Changes of key hydrological elements and research progress of water cycle in the Tianshan Mountains, Central Asia. Arid. Land Geogr. 2022, 45, 1–8. [Google Scholar] [CrossRef]
- Chen, Y.; Li, Z.; Fan, Y.; Wang, H.; Deng, H. Progress and prospects of climate change impacts on hydrology in the arid region of northwest China. Environ. Res. 2015, 139, 11–19. [Google Scholar] [CrossRef]
- Wang, S.; Zhang, M.; Li, Z.; Wang, F.; Li, H.; Li, Y.; Huang, X. Glacier area variation and climate change in the Chinese Tianshan Mountains since 1960. J. Geogr. Sci. 2011, 21, 263–273. [Google Scholar] [CrossRef]
- Pritchard, H.D. Asia’s shrinking glaciers protect large populations from drought stress. Nature 2019, 569, 649–654. [Google Scholar] [CrossRef]
- Huntington, T.G. Evidence for intensification of the global water cycle: Review and synthesis. J. Hydrol. 2006, 319, 83–95. [Google Scholar] [CrossRef]


| Data | Description | Data Sources | Resolution | Unit | |
|---|---|---|---|---|---|
| Spatial | Temporal | ||||
| P | Precipitation | CRU | 0.5° × 0.5° | 1 month | mm |
| PET | Potential Evapotranspiration | CRU | 0.5° × 0.5° | 1 month | mm |
| ET | Actual Evapotranspiration | PT-DTsR | 1 km × 1 km | 16 days | mm |
| SM | Soil Moisture | ERA5_land | 0.1° × 0.1° | 1 month | m3 × m−3 |
| RO | Runoff | ERA5_land | 0.1° × 0.1° | 1 month | m |
| TWS | Terrestrial Water Storage | GRACE | 0.25° × 0.25° | 1 month | cm |
| LA | Lake Area | ReaLSat | 300 m × 300 m | 1 year | km2 |
| PDSI | Palmer Drought Severity Index | sc_PDSI | 2.5° × 2.5° | 1 month | |
| SPEI | Standardized Precipitation Evapotranspiration Index | 0.5° × 0.5° | 1 month | ||
Disclaimer/Publisher’s Note: The statements, opinions and data contained in all publications are solely those of the individual author(s) and contributor(s) and not of MDPI and/or the editor(s). MDPI and/or the editor(s) disclaim responsibility for any injury to people or property resulting from any ideas, methods, instructions or products referred to in the content. |
© 2023 by the authors. Licensee MDPI, Basel, Switzerland. This article is an open access article distributed under the terms and conditions of the Creative Commons Attribution (CC BY) license (https://creativecommons.org/licenses/by/4.0/).
Share and Cite
Zhao, Z.; Hao, X.; Fan, X.; Zhang, J.; Zhang, S.; Li, X. Actual Evapotranspiration Dominates Drought in Central Asia. Remote Sens. 2023, 15, 4557. https://doi.org/10.3390/rs15184557
Zhao Z, Hao X, Fan X, Zhang J, Zhang S, Li X. Actual Evapotranspiration Dominates Drought in Central Asia. Remote Sensing. 2023; 15(18):4557. https://doi.org/10.3390/rs15184557
Chicago/Turabian StyleZhao, Zhuoyi, Xingming Hao, Xue Fan, Jingjing Zhang, Sen Zhang, and Xuewei Li. 2023. "Actual Evapotranspiration Dominates Drought in Central Asia" Remote Sensing 15, no. 18: 4557. https://doi.org/10.3390/rs15184557
APA StyleZhao, Z., Hao, X., Fan, X., Zhang, J., Zhang, S., & Li, X. (2023). Actual Evapotranspiration Dominates Drought in Central Asia. Remote Sensing, 15(18), 4557. https://doi.org/10.3390/rs15184557