Article

The Identification and Analysis of Long-Range Aerosol Transport Pathways with Layered Cloud-Aerosol Lidar with Orthogonal Polarization Datasets from 2006 to 2016

1
Key Laboratory of Network Information System Technology (NIST), Institute of Electronics, Chinese Academy of Sciences, Beijing 100190, China
2
The Aerospace Information Research Institute, Chinese Academy of Sciences, Beijing 100094, China
3
Department of Earth System Science, Ministry of Education Key Laboratory for Earth System Modeling, Institute for Global Change Studies, Tsinghua University, Beijing 100084, China
4
Huayun Sounding Meteorology Technology Corporation, Beijing 100081, China
5
Jiangsu Collaborative Innovation Center of Atmospheric Environment and Equipment Technology (CICAEET), Nanjing University of Information Science & Technology, Nanjing 210044, China
6
China Meteorological Administration Xiong’an Atmospheric Boundary Layer Key Laboratory, Xiong’an 071000, China
*
Author to whom correspondence should be addressed.
Remote Sens. 2023, 15(18), 4537; https://doi.org/10.3390/rs15184537
Submission received: 5 July 2023 / Revised: 11 September 2023 / Accepted: 12 September 2023 / Published: 15 September 2023
(This article belongs to the Special Issue Aerosol and Atmospheric Correction)

Abstract

:
In this study, we used Cloud-Aerosol Lidar with Orthogonal Polarization (CALIOP) aerosol products acquired from 2006 to 2016 to identify global long-range aerosol transport pathways, including the trans-Atlantic, the trans-Pacific, and the trans-Arabian Sea pathways. Deep analyses were subsequently conducted focusing on two significant paths within the range of the trans-Pacific transport pathway, from which we generated a three-stage conceptual model mainly identifying aerosols from the Taklimakan Desert and aerosols from the North China Plain. The results show that in the first stage of the model, the dust or polluted-dust aerosols were emitted, raised, and mixed within the planetary boundary layer (PBL), characterized by high percentages (>70%) of aerosols in the PBL (AODPBL), while in the second stage, some aerosols were further raised into the free troposphere where the AODPBL percentages decreased to less than 40%, driven by vertical movements and turbulences; in the last stage, the aerosols gradually settled back to the surface layer due to gravity and wet deposition, inferred by increasing AODPBL percentages. We demonstrated that the proposed model is capable of characterizing different aerosol types and climate conditions on spatiotemporal scales, providing a straightforward and evident approach to exploring long-range aerosol transport pathways.

Graphical Abstract

1. Introduction

Atmospheric aerosols have important influences on human health, air quality, and climate change, mainly from natural and anthropogenic sources [1,2,3]. Natural sources include dust, sea salt, oceanic dimethyl sulfide (DMS), volcanoes, and secondary organic aerosols (SOAs) from volatile organic compounds (VOCs) [4,5,6]. Anthropogenic emissions are closely associated with industrialization and agricultural production [7] and significantly impact human health [2,8,9]. Most aerosols have short lifetimes (about a week) and have limited transport distances. Some aerosols, such as dust and persistent pollutants, that have longer lifetimes (probably a few weeks) make long-distance aerosol transport possible [10,11].
On the global scale, three long-range aerosol transport pathways have been widely explored and discussed, namely trans-Atlantic transport, trans-Pacific transport, and trans-Arabian transport [12,13,14,15,16]. These three pathways drive local aerosol emissions to have global influences. For example, the westward transport of Sahara Desert dust can reach the Atlantic Ocean and even Central America [17,18,19]. Dust emissions and transport in the Arabian Peninsula are vital to the climate of the Arabian Peninsula and the Arabian Sea [20]. Dust from the Taklimakan and Gobi deserts potentially influences Northern China, Mongolia, the Korean Peninsula, Japan, the northeastern Pacific Ocean, and the western coast of North America through activation and transport [11]. Among all these pathways, the trans-Pacific transport pathways are some of the most complicated due to their distinct sources, large spatial impacts, and dense populations along the pathways [21,22,23]. Therefore, we selected the trans-Pacific pathways for deep aerosol long-distance transport analysis in this study.
In East Asia, aerosol sources have enormous diversity and wide spatial distribution, mainly including dust emissions from the Taklimakan Desert and the Gobi Desert, pollutant emissions in Eastern China, and other large Asian cities [24,25,26]. Due to aerosol transport, these emissions would not just influence local or regional air quality but also have impacts in a much larger area [14]. Moreover, some transcontinental dust and pollutant aerosols have been found from East Asia to the western part of North America [27]. Compared with the trans-Atlantic and trans-Arabian Sea dust transport pathways, a mixture of dust and pollutants is the primary characteristic of trans-Pacific aerosol transport. They also have more profound impacts considering the large population density in this area. Therefore, studying and comparing the characteristics of dust and pollutant transport would be worthwhile. Previous works have seldom focused on multiple-source observation data [28,29].
In previous studies, atmospheric models were the primary approach for long-distance aerosol transport analyses. Models like the Weather Research and Forecasting coupled with the Community Multiscale Air Quality (WRF/CMAQ) model, the Weather Research and Forecasting model with chemistry (WRF-Chem) [30,31,32], the Spectral Radiation-Transport Model for Aerosol Species (SPRINTARS) [26,33,34], and the Goddard Chemistry Aerosol Radiation and Transport (GOCART) model were widely used in aerosol regional and long-distance transport analyses. However, model computation is time-consuming, especially as the simulation areas are usually large in these studies. Meanwhile, satellite observations provide direct descriptions for studying the vertical structure of aerosols and the characteristics of aerosol transport [25,35,36]. For example, trans-Pacific aerosol transport has been analyzed using CALIOP aerosol profile datasets [27]. The global trends in layered aerosol properties from CALIOP level-2 (L2) datasets were systematically analyzed using the PBLH values as vertical thresholds [35]. However, systematic and comprehensive analyses of the long-distance aerosol transport characteristics from direct 3-dimensional (3D) aerosol observations are rare [37]. In particular, discussions from the perspective of aerosol distributions within/out PBL along long-range transport pathways are subject to ongoing research.
This paper used CALIOP aerosol profiles to calculate layered data within the PBL and in the free troposphere. Globally, the characteristics of long-distance aerosol transport were determined from the layered aerosol data. Furthermore, using multiple datasets, a three-stage conceptual model was proposed and assessed with long-range transport pathways of Taklimakan Desert dust and North China Plain pollutants.
This paper is organized as follows. The experimental data sources and preprocessing methods are given in Section 2. The global long-range aerosol transport characteristics are presented in Section 3. Finally, Section 4 provides the conclusions and discussions.

2. Materials and Methods

2.1. CALIOP L3 Aerosol Observation Dataset

CALIOP, a nadir-view, two-wavelength (532 and 1064 nm), polarization-sensitive (at 532 nm) lidar instrument, is mounted on a sun-synchronous satellite, the Cloud-Aerosol Lidar and Infrared Pathfinder Satellite Observation (CALIPSO). The CALIOP L3 aerosol profile product of version 3.00 is used, which is aggregated from quality-assured daily L2 aerosol profiles at 532 nm. The CALIOP L3 dataset has global coverage (85°S to 85°N, 180°W to 180°E). Its horizontal resolution is 2° (latitude) × 5° (longitude), and the vertical resolution is 60 m, with an upper altitude limit of 12 km [38]. The CALIOP L3 data contain products under four atmosphere conditions, which are all-sky, cloud-free, cloudy-sky transparent, and cloudy-sky opaque. This study used the cloud-free product from June 2006 (initial observation time) to November 2016 for analysis. The CALIOP total-atmosphere AOD (AODTA) is calculated by integrating the vertical aerosol extinction profile,
AOD = E x c i × Δ h i ,
where Exci is the extinction coefficient of the ith layer, and Δ h i is the corresponding height difference. The AOD values in the PBL (AODPBL) and the free troposphere (AODFTL) are calculated using the same method. Furthermore, the ratios of the AODPBL values (denoted as R_AODPBL) can be calculated as in the equation below,
R _ A O D P B L = A O D P B L A O D T A .
At the same time, the ratios of the AODFTL values (denoted as R_AODFTL) can also be calculated. This study used the daytime CALIOP aerosol profile observations to represent aerosol vertical structures. In addition, aerosol types were used to understand 3-D aerosol distributions and emissions better. The CALIOP L3 product contains aerosol extinction profile data for different aerosol types (dust, smoke, and polluted dust). In particular, dust, smoke, and polluted-dust products were used to calculate global layered AOD values. Dust aerosol products were also used to calculate aerosol profiles along aerosol transport pathways from the source of the Taklimakan Desert, while polluted-dust aerosol products were used to calculate aerosol profiles along aerosol transport pathways from the source of the North China Plain. In this study, AODPBL, AODFTL, and AODTA values and corresponding ratios for dust and polluted dust were also processed using the same method.

2.2. PBLH Reanalysis Data

In this study, we used the Re-Analysis-Interim (ERA-Interim) reanalysis dataset provided by the European Centre for Medium-Range Weather Forecasts (ECMWF) [39]. Specifically, the ERA-Interim PBLH variable divides the bottom well-mixed planetary boundary layer from the top free troposphere layer. This product is available every three hours at 3:00, 6:00, 9:00, 12:00, 15:00, 18:00, 21:00, and 24:00 in Coordinated Universal Time (UTC). As the CALIPSO satellite crosses the equator at around 13:30 (local time) in the daytime, the ERA-Interim data closest to the CALIOP L3 aerosol product are used to ensure temporal consistency. The seasonal mean values of the global PBLH distributions are shown in Figure S1 in the Supplementary Information (SI). In order to match the horizontal resolution of the CALIOP L3 product, the ERA-Interim PBLH data were processed to the same horizontal resolution of 2° × 5° by calculating the arithmetic mean values of 2° × 5° grids.

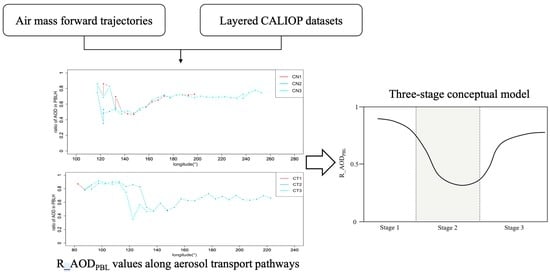
2.3. Air Mass Forward Trajectories

The Hybrid Single-Particle Lagrangian Integrated Trajectory (HYSPLIT-4) version 4 model provided by the Air Resources Laboratory (ARL) of the National Oceanic and Atmospheric Administration (NOAA) was utilized herein to calculate the air mass forward trajectories [26,40]. Furthermore, this study used 1° × 1° archived meteorological data from the Global Data Assimilation System (GDAS) of the National Center for Atmospheric Research (NCAR) as the driving meteorological input data. This study tested five configurations of 10, 11, 12, 13, and 14 days for air mass forward trajectory calculation, with 3987 trajectories for each condition from 2006 to 2016. Considering the representativeness of the air mass forward trajectories for guiding aerosol long-distance transport characteristics, 11-day air mass forward trajectories starting at 4:00 a.m. (UTC) were calculated to help better understand the aerosol long-distance transmission pathways [41,42]. With an adequate consideration of the spatial distribution of aerosols, the air mass forward trajectories of the Taklimakan Desert and North China Plain were calculated at (41°N, 88°E) and (38.85°N, 115.49°E) starting at 100 m AGL, 500 m AGL, and 1000 m AGL (Figure 1, Figures S2 and S3). A seasonal analysis of trajectory clusters starting at the heights of different proportions to PBLH was also conducted (Figures S4 and S5). The seasonal variations were not significant in terms of trajectory length and direction, and also the corresponding AODPBL along the trajectory clusters. Therefore, an annual analysis was performed in this study to investigate the long-term patterns of AODPBL distributions in different general transport paths.
The air mass forward trajectories were clustered together based on the wind direction and speed of the driving meteorological input data. Based on prior knowledge of the dominant transport regimes in the Taklimakan Desert and the North China Plain, the air mass forward trajectories were clustered into 3 clusters using a three-dimensional K-means method and the TrajStat software v1.2.2.6 [43]. After that, each trajectory was regarded as a string of points (X, Y, Z). The K-means method was performed by calculating and minimizing the distances among these trajectories using the following equation:
d 12 = i N X 1 i X 2 i 2 + Y 1 i Y 2 i 2 + Z 1 i Z 2 i 2 ,
where d12 denotes the Euclidean distance between trajectories (X1, Y1, Z1) and (X2, Y2, Z2). The number N is the number of points along the trajectory, which is 265 in this study. In the Taklimakan Desert, three representative air mass forward trajectories (CT1, CT2, and CT3) were used to help understand aerosol transport. The ratios of the air mass forward trajectories clustered into CT1, CT2, and CT3 were 26.5%, 23.3%, and 50.2% (starting at 100 m AGL), respectively. Similarly, the North China Plain’s representative air mass forward trajectories were CN1, CN2, and CN3, and the ratios of the air mass forward trajectories were 26.1%, 58.9%, and 15% (starting at 100 m AGL), respectively. The clustering results starting at 100, 500, and 1000 m AGL tended to be similar for air masses originating from the North China Plain and the Taklimakan Desert, and the transport distances increased with the increased in the starting level. Considering the limited differences in clustering results, we chose the data starting at 100 m AGL as the main result data. This study also counted the seasons to which the air mass trajectories of each cluster belonged, and the statistical results are shown in Tables S1 and S2. Furthermore, aerosol profiles along six air mass forward trajectory clusters from CALIOP L3 aerosol profiles were used to reflect the aerosol distribution patterns, since long-range pathways longer than 100 degrees were explored in this study.

3. Results

3.1. Aerosol Transport Pathway Identification

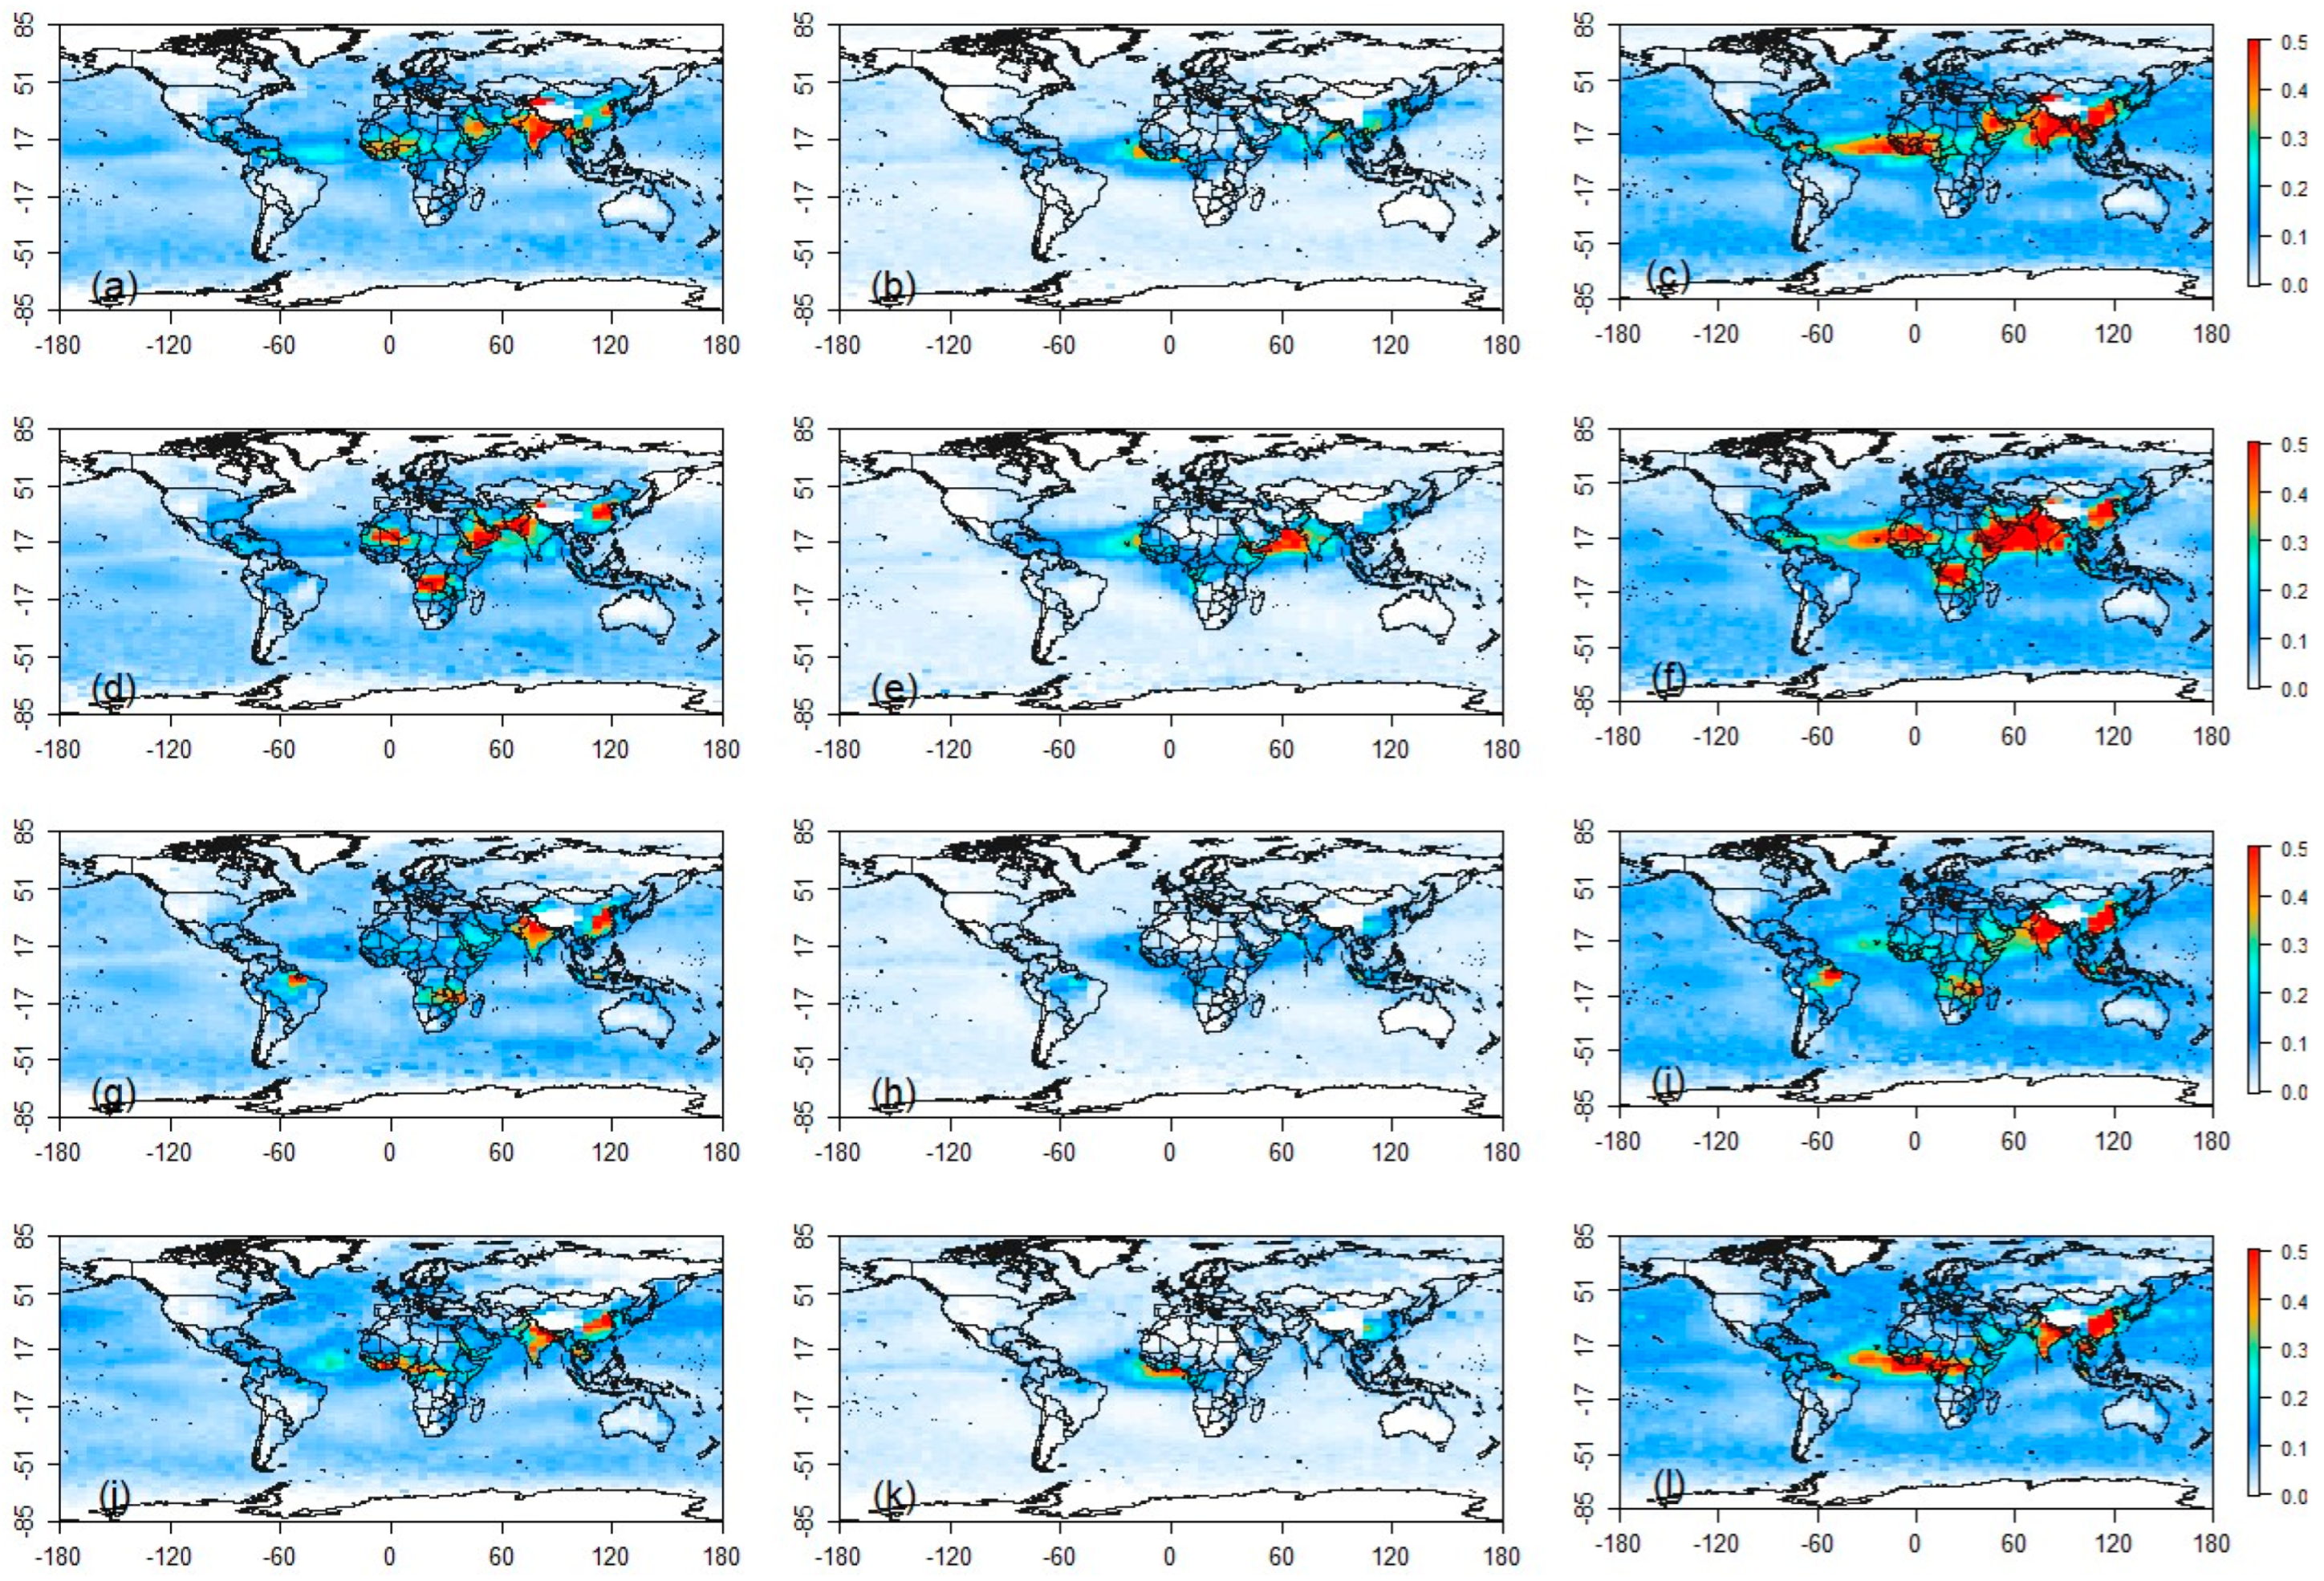
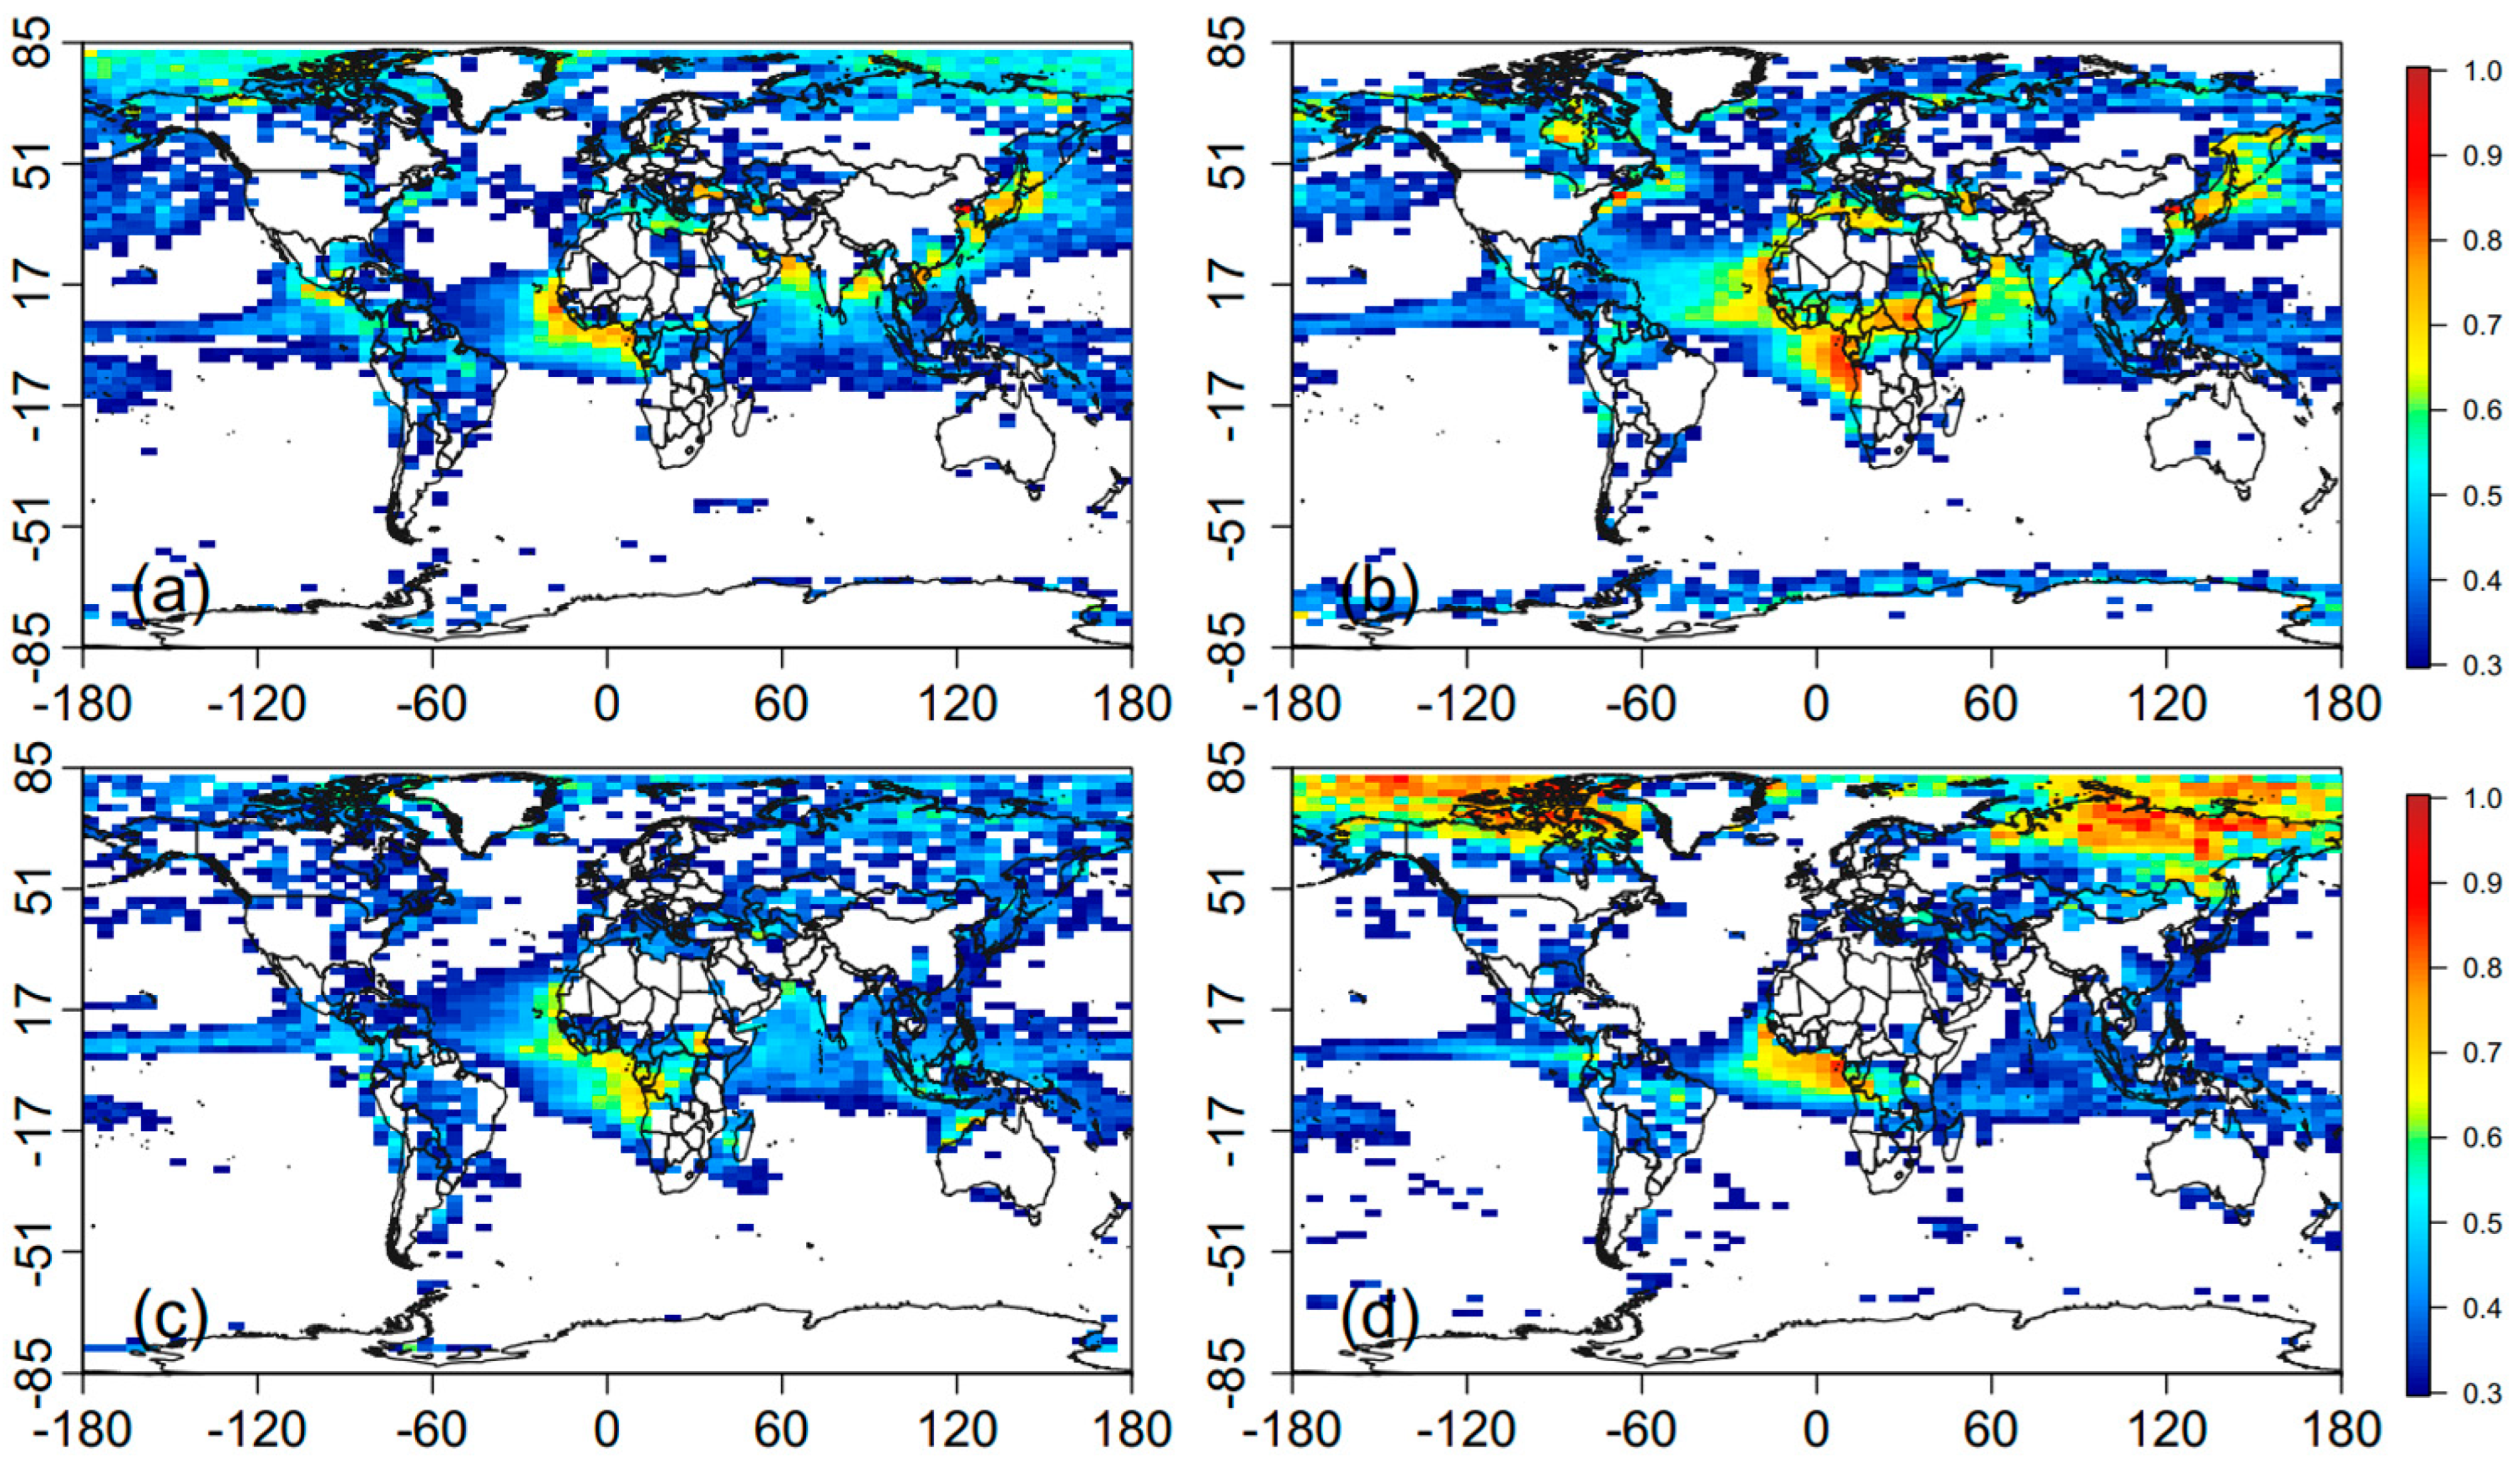
3.1.1. Generation of Global Distributions of High AOD Values

This study used CALIOP aerosol extinction datasets to help better understand the vertical aerosol structures. Based on Equation (1), the column-integrated AOD values in the different layers, i.e., in the PBL, the FTL, and the total atmosphere, were calculated from the raw CALIOP L3 data using the reanalysis PBLH values as the threshold altitudes. Furthermore, the ratios of the AODPBL and AODFTL values (denoted as R_AODPBL and R_AODFTL) were also calculated from the CALIOP L3 aerosol extinction datasets (Figure 2). AODPBL, AODFTL, AODTA, and the corresponding ratios were extracted along three North China pathways (CN1, CN2, and CN3) and three Taklimakan pathways (CT1, CT2, and CT3).
In general, high-AODTA regions occurred in Western Africa (WAF), the Arabian Peninsula, the Taklimakan Desert, Central Africa, India, and East Asia. However, AODPBL and AODFTL values exhibited different spatial patterns compared to those of AODTA. For example, due to intensive biomass burning, AODPBL values were higher in Central Africa and northern South America [36]. In East Asia, the AODTA values were high in the Taklimakan Desert and East Asia. The AODFTL values were also high in the North China Plain and the eastern coast of Asia (Figures S6 and S7). Aerosol transport may have occurred in these three regions, as reflected by these features. There were also apparent seasonal variations in the AODPBL values. For example, the AODPBL values were high in June–July–August (JJA) and September–October–November (SON) in Central Africa (Figure S8). In India, the AODPBL values were high all year round, especially in March–April–May (MAM), SON, and December–January–February (DJF).

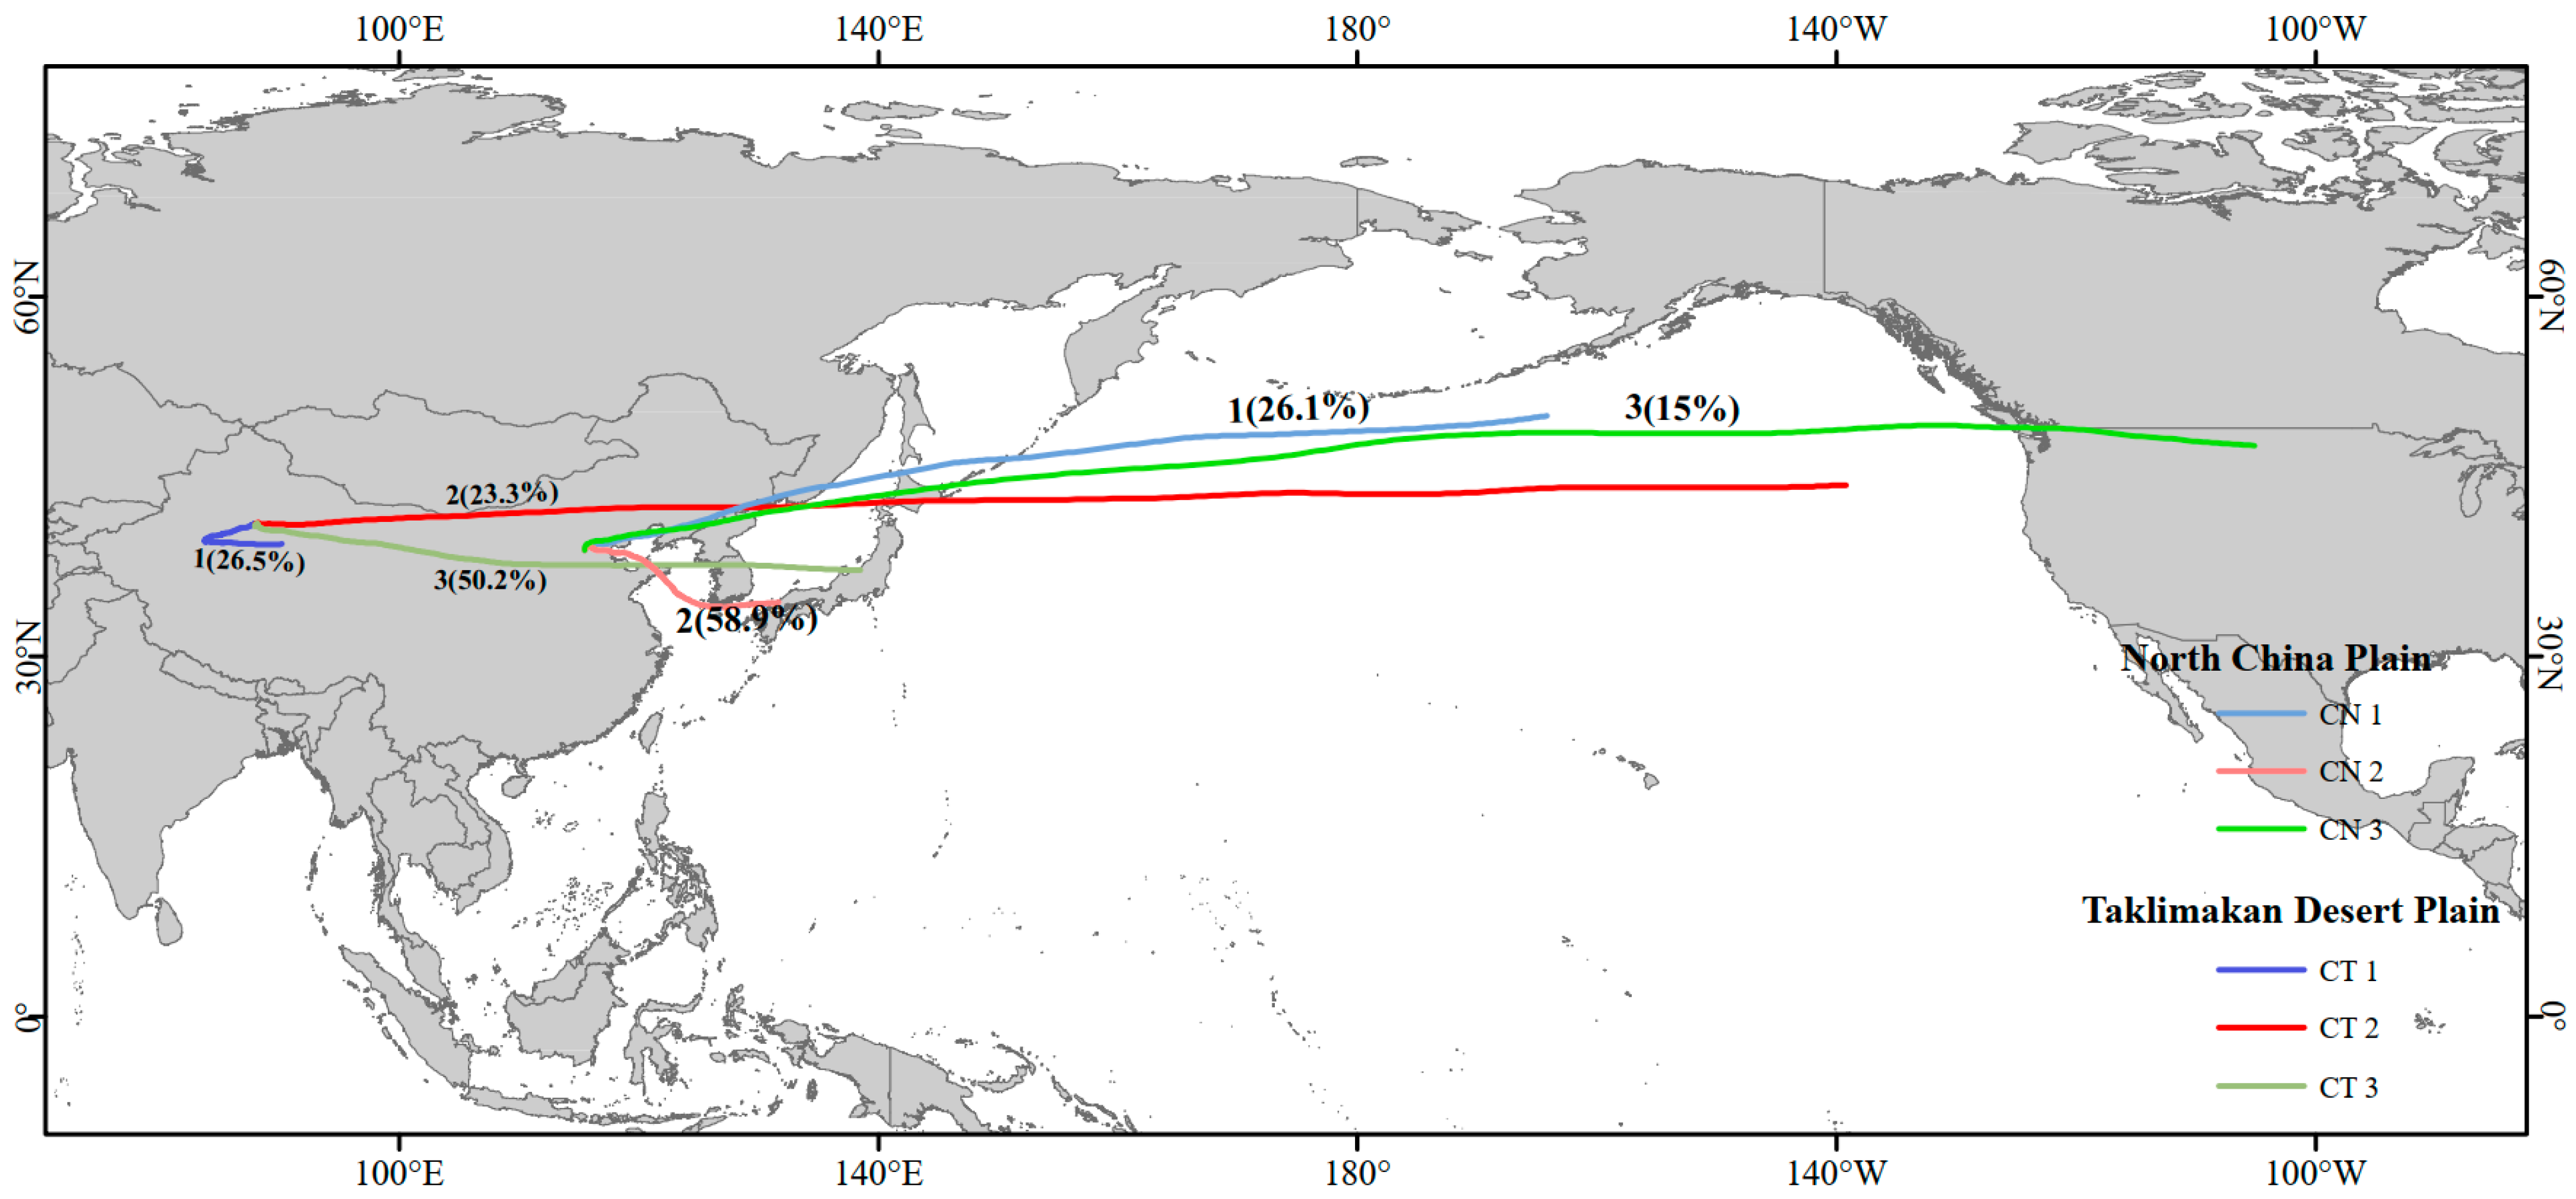
3.1.2. Identification of Global Aerosol Transport Pathways

Over the land, the R_AODPBL values were ~70%, with seasonal mean R_AODPBL values of 74.1% (MAM), 71.6% (JJA), 71.6% (SON), and 65.4% (DJF), respectively (Figure S9 and Table S3). The R_AODPBL values were significantly high in the plateau regions, such as the Rocky Mountains and the Tibetan areas, where the ratios were close to 100%. Comparatively, over the oceans, the mean R_AODPBL values were 71%, 71.3%, 73.1%, and 76.1% in MAM, JJA, SON, and DJF, respectively (Table S4). The R_AODPBL and R_AODFTL values can help better understand the transport patterns of aerosols.
It should be noted that the R_AODFTL values were significantly improved in regions such as the west coast of Central Africa, the west coast of Central America, and the Pacific Ocean near Northeast Asia. Considering that aerosol emissions in the ocean are low [4], elevated AODFTL values in these regions should be mainly caused by emissions in the nearby continental regions [44,45,46]. In the far oceanic areas, the R_AODFTL values gradually decreased, indicating that the aerosols settled back into the surface air. Based on the analysis of the R_AODPBL values, the WAF, the Arabian Peninsula, and East Asia could be the places where aerosol transport happens intensively and frequently. In addition, the high R_AODFTL values over Northeast Siberia and Canadian Archipelago and nearest parts of Arctic Ocean are likely to originate from Asian dust transport [11].
It is reasonable to assume that areas with greater R_AODFTL values could be pathways of higher possibilities of long-distance aerosol transport (Figure 3) [17,47]. Accordingly, three regions of the trans-Atlantic, trans-Arabian Sea, and trans-Pacific would be potential transport pathways. The aerosols in these three long-distance aerosol transport regions mainly come from the Sahara Desert, the Arabian Peninsula, and East Asia. Considering the complex emission sources and significant impacts in East Asia, deep analyses of aerosol transport processes were further conducted with comprehensive explanatory datasets.

3.2. Three-Stage Conceptual Model

3.2.1. Polluted Dust Aerosol Transport Pathway

Polluted-dust aerosol profiles along the air mass trajectory clusters CN1, CN2, and CN3 were used to explore the polluted-dust aerosol transport characteristics from the North China Plain. Long-range aerosol transport sourced from the North China Plain has trans-continental influences on aerosol distributions and air qualities along the pathways [12]. In the source areas of the North China Plain, the seasonal mean AODTA values were 0.396, 0.658, 0.618, and 0.487, respectively, in MAM, JJA, SON, and DJF, which are generally larger than those in other regions along aerosol transport pathways (Figure S10). Meanwhile, the R_AODPBL values were also large at 74.4% (MAM), 68.5% (JJA), 79.6% (SON), and 77.2% (DJF) (Figure 4), indicating strong local emission intensities as discussed previously. Along the three representative transport pathways of CN1, CN2, and CN3 (shown in Figure 1), CN2 was the shortest pathway representing regional transport relatively close to source regions. The aerosols from the North China Plain were brought to areas as far as Southern Japan. There were ~30% of CN2 air mass trajectories from JJA. The summary of the ratios of air mass trajectories from SON and DJF was 50.25%, which means over half of the trajectories were from these two seasons (Table S1). As for the transport characteristics, along the pathway CN2, most aerosols were concentrated in the PBLH in the source area, as the R_AODPBL values were almost 70% in this stage. Then, there wsa an apparent low-level interval with R_AODPBL values at ~120°E, especially in warm seasons of MAM and JJA (the lowest value was <20%). As for the reason, it means that in a coastal zone, aerosols starting in daytime PBL over land are highly likely to be transported further in the free atmosphere over the nearby sea. Also, the decrease can also be relative to the PBLH values over the Yellow Sea, which were lower than over land in warm seasons and vice versa in cold seasons. This means more air layers are involved in AODPBL over the Yellow Sea in cold seasons than in warm ones. However, the R_AODFTL values in this interval were even higher than the R_AODPBL values, while aerosol emissions from the coast zone were rare [7]. This strongly indicated transport effects within this area. As the pathway CN2 extended, the R_AODPBL and the AODPBL values exhibited increasing trends, and the pollutant aerosols settled back to the ground. At the same time, the changes in the PBLH values influenced by sea–land changes also had an impact on the R_AODPBL and the AODPBL values.
The CN1 and CN3 are both long-range across-Pacific pathways, and there were 53.4% and 52.3% of air mass trajectories of CN1 and CN3 from MAM and JJA, respectively (Table S1). The CN1 trajectories have long lengths of destination to the Eastern Pacific Ocean. The CN3 trajectories are even longer from the North China Plain and arriving at the Northwest United States. In both pathways, AODPBL ratios were mostly >70% in the first stage (Figure 5). In this stage, the simulated air particle heights were lower than the PBLH values in the source regions, and the air particle heights gradually rose above PBLH along with the trajectory (Figure 6). The AODPBL and AODTA values rapidly decreased as the air masses moved northeast (Figure S10). As the trajectory extended to the east, the aerosols gradually rose into the FTL by vertical air movements (Figure 6), leading to decreased R_AODPBL values from the North China Plain to around 140°E (Figure 4a,c). The lowest R_AODPBL values along CN1 were located in the northern part of Hokkaido, while the lowest R_AODPBL values along CN3 were in the southeastern part of South Korea, with ratios <40% in MAM and JJA. Since the emissions over the sea areas were quite low, high R_AODFTL values indicated there should be transport pathways in these regions. Specifically, the R_AODFTL values could reach 60% in MAM and JJA, while the values were around 30% in SON and DJF.
As the air masses moved further east, the aerosols began settling back into the surface boundary layer. At this stage, approximately 35% of the trajectories for both CN1 and CN3 were responsible for transporting the aerosols to lower layers (Figure 6b,d). The R_AODPBL values gradually reached up to around 70% in the areas over the Central and Eastern Pacific Oceans in both pathways of CN1 and CN3. The deposition would cause changes in ground-level air quality in remote regions, such as the northwestern part of the United States [13]. In this stage, seasonal differences in R_AODPBL values were small.
Based on the aforementioned analysis, we propose a conceptual model to describe a long-range transport pathway, which includes three stages based on layered aerosol distributions (Figure S11). In the first stage, the local aerosol emissions are first well mixed within the boundary layer with the improved AODPBL values over the source areas. Then, in the second stage, the aerosols are further elevated into the free troposphere, characterized by growing R_AODFTL values. This stage is crucial for a transport pathway as it determines the scale and areas that aerosols would be brought to. In the last stage, most dust and pollutant aerosols settle to the surface layer caused by gravity settling and wet deposition [48], characterized by elevated R_AODPBL values. As discussed before, the spatial scale of the three stages would be influenced by aerosol particle sizes, air mass movement speed, and terrain features. For example, the stages would have shorter spatial distances for larger-particle aerosols than that for finer-particle aerosols (Figures S6 and S7).

3.2.2. Dust Aerosol Transport Pathway

Similarly, duct aerosol profiles along the air mass trajectory clusters CN1, CN2, and CN3 were used to explore the duct aerosol transport characteristics from the Taklimakan Desert. Dust aerosol transport from the Taklimakan Desert Plain was also analyzed, considering its significant impact on air quality over very large areas. In the Taklimakan Desert Plain, seasonal mean R_AODPBL values were 87.0% (MAM), 95.7% (JJA), 77.5% (SON), and 55.2% (DJF) (Figure 7), and the R_AODPBL values were higher compared to those in the North China Plain on the seasonal scale, especially in MAM and JJA. The seasonal mean AODTA values were highest in MAM (0.573) and lowest in DJF (0.262), which is consistent with frequent dust storms occurring in East Asia [49,50].
Aerosol transport along CN1 mainly influences local air quality. There was 52.3% of air mass trajectories from SON and DJF (Table S2). In detail, the CT1 trajectories are short, indicating its localities for aerosol transport. The R_AODPBL values were almost >75% in MAM, JJA, and SON (Figure 7a). The aerosols rapidly settled to the surface, as indicated by the decreasing AODPBL values of CT1 (Figure S12).
The aerosol types in the Taklimakan Desert Plain and the North China Plain were dust- and pollutant-dominated, respectively, which would influence regional aerosol transport patterns. Along the long-distance transport pathways of CT2 and CT3, the air masses passed over East Asia and the Pacific Ocean. In total, 76% of the air mass trajectories of CT2 were from MAM and SON (38.9% from MAM and 37.1% from SON). At the same time, the contributions of air mass movement trajectories to CT3 in each season were relatively uniform (Table S2). The seasonal mean R_AODPBL values were significantly higher in MAM and JJA than those in SON and DJF, and dust activation in the former two seasons was frequent. In stage 1, aerosol transport pathways CT2 and CT3 extended from Northwestern China to Eastern China, whereas the aerosols in CN1 and CN3 were transported over East Asia. In this stage, the aerosols in CT2 were mostly distributed in the PBLH, with stable AODPBL ratios of over 75% in MAM, JJA, and SON. While the air mass advanced along CT2, the air particle heights exhibited a consistent linear increase, progressively surpassing the PBLH values, as depicted in Figure 8. This upward trend in air particle heights signifies that the aerosols were being transported into the free troposphere by the advancing air masses. The R_AODPBL values slowly increased in DJF along CT2 and CT3. In contrast to that, the AODPBL values along CN1 and CN3 decreased rapidly in stage 1 (Figure S10), and there was a significant second peak in the AODPBL values for CT2 and CT3 before the R_AODPBL values began to decrease (Figure S12). The second peak may be associated with a mixture of local aerosol emissions in Eastern China [43]. Lower peak values of CT2 than those of CT3 were because the aerosol emissions in the bypassing areas of CT3 were more severe than those of CT2. The CT2 trajectories passed over Northeastern China, while CT3 trajectories passed over the North China Plain. When the aerosols moved from stage 1 to stage 2, there were significant decreases in the R_AODPBL values along CT2 and CT3 (Figure 9).
In stage 2, the R_AODPBL values maintained stable values. Specifically, the R_AODPBL values were ~60% in SON and DJF, while the R_AODPBL values decreased to ~50% and even 20% in MAM and JJA. Thus, the R_AODFTL values of CT3 were significantly higher than the R_AODFTL values of CN1, CN3, and CT2, and higher ratios of aerosols of CT3 were transported into the free troposphere than those of CN1, CN3, and CT2. Furthermore, there was a small peak in the AODFTL values for CT2 after the second peak in the AODPBL values, probably due to rising aerosols into the FTL (Figure S12e,f).
In stage 3, the R_AODPBL values of CT2 gradually became similar along with the air mass movement on the seasonal scale. At this stage, as the air mass moved downward, the aerosols were also transported to lower atmospheric layers (Figure 8b). The R_AODPBL values were >60% over the Eastern Pacific Ocean, which may mean the aerosols were settled back into the PBL (Figure 9). Compared with CT2, the transport distance of CT3 was shorter. At the end of CT3, the R_AODPBL values were still less than 40% in MAM and JJA, and more than 60% of the aerosols were in the FTL. Therefore, the aerosols in the FTL at the end of CT3 continued to be transported farther distances.

4. Conclusions and Discussions

This study used 2006–2016 CALIOP layered aerosol data to explore long-distance aerosol transport pathways. In particular, three apparent long-distance aerosol transport pathways were identified on the global scale: the trans-Pacific transport pathway, the trans-Atlantic transport pathway, and the trans-Arabian Sea transport pathway. Different from aerosol transport from the Sahara Desert and the Arabian Peninsula, complex aerosols influence aerosol trans-Pacific transport. To better understand the long-distance aerosol transport characteristics, we selected two representative aerosol trans-Pacific transport pathways from the North China Plain and the Taklimakan Desert, and meanwhile, used layered AOD values within/out of the PBL and specific aerosol profiles along air mass trajectories to analyze long-distance aerosol transport from East Asia. The results show that the globally covered CALIOP L3 aerosol product and trajectory analyses on a daily timescale adequately identified the characteristics of long-distance aerosol transport from East Asia, eliminating the need for time-consuming model calculations. Additionally, the trajectory model, such as HYSPLIT, simulating air mass movement trajectories provided valuable guidance for aerosol long-distance transport pathways.
A three-stage conceptual aerosol transport model was proposed to explore long-distance aerosol transport characteristics. The aerosols were emitted, raised, and mainly distributed in the PBLH in the first stage. For polluted-dust aerosols, the R_AODPBL values were almost >70%. Then, the aerosols were further elevated into the free troposphere, and the R_AODPBL values decreased to <40%. In this stage, there was a significant decrease in the R_AODPBL values at around 120°–140°E. Finally, in the third stage, the aerosols settled back to the ground due to gravity. For dust aerosols, the R_AODPBL values were almost >75%, meaning that there was a higher ratio of aerosols concentrated in the PBLH compared with the polluted-dust aerosols in the first stage. In the second stage, the R_AODPBL values decreased to <50% and even 20%. The decrease was at around 130°–160°E. Last, the R_AODPBL values were >60% over the Eastern Pacific Ocean. This three-stage conceptual model can be used as a common tool for aerosol long-range transport analysis by describing the dominant features in an aerosol transport process. The method highlighted the factor of R_AODPBL as an important indicator in the long-range transport feature.
In terms of future work, quantitative studies will require improved spatial resolutions in observational and atmospheric data, such as aerosol optical depth (AOD) observations from the Aerosol Robotic Network (AERONET). Expanding on that, the trajectory model will be cross-validated and enhanced through integration with atmospheric models or deep-learning-based remote analysis. That is to say, a more comprehensive understanding of the physical and statistical aspects is essential for analyzing aerosol transport. At the same time, we can further evaluate the influences of aerosol emissions from the ocean for aerosol long-distance transport. Daily aerosol profiles can be brought in the future to precisely explore aerosol vertical structures along aerosol transport pathways and used as an important data source for quantitative analysis to make up for missing details in general aerosol transport patterns from monthly data. Moreover, the performance of the proposed three-stage aerosol conceptual model deserves further validation regarding the trans-Atlantic and trans-Arabian Sea pathways in future studies.

Supplementary Materials

The following supporting information can be downloaded at: https://www.mdpi.com/article/10.3390/rs15184537/s1. The following supporting information includes 12 figures and 4 tables. Figure S1: PBLH on the global scale; Figure S2: Eleven-day air mass forward trajectory clusters originating from the North China Plain and the Taklimakan Desert (starting at 500 m AGL); Figure S3: Eleven-day air mass forward trajectory clusters originating from the North China Plain and the Taklimakan Desert (starting at 1000 m AGL); Figure S4: Eleven-day air mass forward trajectory clusters originating from the North China Plain (a–d) and the Taklimakan Desert (e–h); Figure S5: AODPBL values of total aerosols along air mass forward trajectory clusters originating from the North China Plain (a–d), and AODPBL values of dust aerosols along air mass forward trajectory clusters originating from the Taklimakan Desert (e–h); Figure S6: Seasonal layered AOD values for dust; Figure S7: Seasonal layered AOD values for polluted dust; Figure S8: Seasonal layered AOD values for smoke aerosols; Figure S9: (a–d) R_AODPBL values and (e–h) R_AODFTL values in four seasons; Figure S10: (a,d,g) AODTA, (b,e,h) AODFTL, and (c,f,i) AODPBL along three long-distance aerosol transport pathways (CN1, CN2, and CN3) on a seasonal scale (from the North China Plain); Figure S11. Three-stage conceptual model depicting the changes in R_AODPBL in long-range aerosol transportation; Figure S12: (a,d,g) AODTA, (b,e,h) AODFTL, and (c,f,i) AODPBL along three long-distance aerosol transport pathways on a seasonal scale (from the Taklimakan Desert); Table S1: The ratios of air mass forward trajectories in each cluster on a seasonal scale (the North China Plain); Table S2: The ratios of air mass forward trajectories in each cluster on a seasonal scale (the Taklimakan Desert); Table S3: Summary of the R_AODPBL values over the land; Table S4: Summary of the R_AODPBL values over the ocean.

Author Contributions

Conceptualization, B.L. and L.W.; methodology, B.L. and L.W.; validation, L.W., W.W. and Y.H.; investigation, L.W. and J.Z.; data curation, J.Z.; writing—original draft preparation, L.W.; review and editing, B.L., W.W. and Y.H.; supervision, Z.G. and Y.B.; funding acquisition, W.W. All authors have read and agreed to the published version of the manuscript.

Funding

This research presented herein was performed in the framework of the China Postdoctoral Science Foundation, grant number 325025, and the Youth Innovation Promotion Association of Chinese Academy of Sciences, grant number 2023137. Parts of this paper were funded by the Science and Technology Key Project of China Huayun Group, grant number HYKJXMZ-202002.

Data Availability Statement

Publicly available datasets were analyzed in this study. CALIOP L3 aerosol data can be found here: [https://www.earthdata.nasa.gov/ (accessed on 11 September 2023)]. PBLH data can be found here: [https://www.ecmwf.int/ (accessed on 11 September 2023)]. Archived meteorological data can be found here: [https://ncar.ucar.edu/ (accessed on 11 September 2023)].

Acknowledgments

The authors are grateful to Kun Fu from the Aerospace Information Research Institute, Chinese Academy of Sciences (AIRCAS), who helped in coordinating raw CALIOP data.

Conflicts of Interest

The authors declare no conflict of interest.

References

  1. Chang, D.; Song, Y.; Liu, B. Visibility trends in six megacities in China 1973–2007. Atmos. Res. 2009, 94, 161–167. [Google Scholar] [CrossRef]
  2. Gao, M.; Saide, P.E.; Xin, J.; Wang, Y.; Liu, Z.; Wang, Y.; Wang, Z.; Pagowski, M.; Guttikunda, S.K.; Carmichael, G.R. Estimates of health impacts and radiative forcing in winter haze in eastern China through constraints of surface PM2.5 predictions. Environ. Sci. Technol. 2017, 51, 2178–2185. [Google Scholar] [CrossRef] [PubMed]
  3. Ding, X.; Kong, L.; Du, C.; Zhanzakova, A.; Wang, L.; Fu, H.; Chen, J.; Yang, X.; Cheng, T. Long-range and regional transported size-resolved atmospheric aerosols during summertime in urban Shanghai. Sci. Total Environ. 2017, 583, 334–343. [Google Scholar] [CrossRef]
  4. Stier, P.; Feichter, J.; Kinne, S.; Kloster, S.; Vignati, E.; Wilson, J.; Ganzeveld, L.; Tegen, I.; Werner, M.; Balkanski, Y.; et al. The aerosol-climate model ECHAM5-HAM. Atmos. Chem. Phys. 2005, 5, 1125–1156. [Google Scholar] [CrossRef]
  5. Carslaw, K.S.; Boucher, O.; Spracklen, D.V.; Mann, G.W.; Rae, J.G.L.; Woodward, S.; Kulmala, M. A review of natural aerosol interactions and feedbacks within the Earth system. Atmos. Chem. Phys. 2010, 10, 1701–1737. [Google Scholar] [CrossRef]
  6. Rap, A.; Scott, C.E.; Spracklen, D.V.; Bellouin, N.; Forster, P.M.; Carslaw, K.S.; Schmidt, A.; Mann, G. Natural aerosol direct and indirect radiative effects. Geophys. Res. Lett. 2013, 40, 3297–3301. [Google Scholar] [CrossRef]
  7. Dentener, F.; Kinne, S.; Bond, T.; Boucher, O.; Cofala, J.; Generoso, S.; Ginoux, P.; Gong, S.; Hoelzemann, J.J.; Ito, A.; et al. Emissions of primary aerosol and precursor gases in the years 2000 and 1750 prescribed data-sets for AeroCom. Atmos. Chem. Phys. 2006, 6, 4321–4344. [Google Scholar] [CrossRef]
  8. Fang, D.; Wang, Q.; Li, H.; Yu, Y.; Lu, Y.; Qian, X. Mortality effects assessment of ambient PM2.5 pollution in the 74 leading cities of China. Sci. Total Environ. 2016, 569–570, 1545–1552. [Google Scholar] [CrossRef]
  9. Pui, D.Y.H.; Chen, S.-C.; Zuo, Z. PM2.5 in China: Measurements, sources, visibility and health effects, and mitigation. Particuology 2014, 13, 1–26. [Google Scholar] [CrossRef]
  10. Yu, H.; Chin, M.; Bian, H.; Yuan, T.; Prospero, J.M.; Omar, A.H.; Remer, L.A.; Winker, D.M.; Yang, Y.; Zhang, Y.; et al. Quantification of trans-Atlantic dust transport from seven-year (2007–2013) record of CALIPSO lidar measurements. Remote Sens. Environ. 2015, 159, 232–249. [Google Scholar] [CrossRef]
  11. Yu, Y.; Kalashnikova, O.V.; Garay, M.J.; Notaro, M. Climatology in Asian dust activation and transport based on MISR satellite observations and trajectory analysis. Atmos. Chem. Phys. 2019, 1, 363–378. [Google Scholar] [CrossRef]
  12. Hadley, O.L.; Ramanathan, V.; Carmichael, G.R.; Tang, Y.; Corrigan, C.E.; Roberts, G.C.; Mauger, G.S. Trans-Pacific transport of black carbon and fine aerosols (D < 2.5 μm) into North America. J. Geophys. Res. 2007, 112, D05309. [Google Scholar]
  13. Hu, Z.; Zhao, C.; Huang, J.; Ruby, L.L.; Qian, Y.; Yu, H.; Huang, L.; Kalashnikova, O.V. Trans-Pacific transport and evolution of aerosols: Evaluation of quasi-global WRF-Chem simulation with multiple observations. Geosci. Model Dev. 2016, 9, 1725–1746. [Google Scholar] [CrossRef]
  14. Kim, D.; Chin, M.; Yu, H.; Pan, X.; Bian, H.; Tan, Q.; Kahn, R.A.; Tsigaridis, K.; Bauer, S.E.; Takemura, T. Asian and trans-Pacific Dust: A Multimodel and Multiremote Sensing Observation Analysis. J. Geophys. Res. Atmos. 2019, 124, 13534–13559. [Google Scholar] [CrossRef]
  15. Ali, P.; Joseph, P.; Arash, S. Geochemical Fingerprinting of Trans-Atlantic African Dust Based on Radiogenic Sr-Nd-Hf Isotopes and Rare Earth Element Anomalies. Geophys. Res. Abstr. 2015, 17, EGU2015-1328. [Google Scholar]
  16. Yu, H.; Remer, L.A.; Chin, M.; Bian, H.; Kleidman, R.G.; Diehl, T. A satellite-based assessment of transpacific transport of pollution aerosol. J. Geophys. Res. 2008, 113, D14S12. [Google Scholar] [CrossRef]
  17. Yu, H.; Tan, Q.; Chin, M.; Bian, H.; Kim, D.; Winker, D.M.; Levy, R.C.; Zhang, Z.; Remer, L.A.; Kahn, R.A.; et al. Estimates of African Dust Deposition Along the Trans-Atlantic Transit Using the Decadelong Record ofAerosol Measurements from CALIOP, MODIS, MISR, and IASI. J. Geophys. Res. Atmos. 2019, 124, 7975–7996. [Google Scholar] [CrossRef]
  18. Morris, V.; Clemente-Colón, P.; Nalli, N.R.; Joseph, E.; Armstrong, R.A.; Detrés, Y.; Goldberg, M.D.; Minnett, P.J.; Lumpkin, R. Measuring Trans-Atlantic aerosol transport from Africa. Eos Trans. Am. Geophys. Union 2011, 87, 565–571. [Google Scholar] [CrossRef]
  19. Chen, S.-P.; Lu, C.-H.; McQueen, J.; Lee, P. Application of satellite observations in con-junction with aerosol reanalysis to characterize long-range transport of African and Asian dust on air quality in the contiguous U.S. Atmos. Environ. 2018, 187, 174–195. [Google Scholar] [CrossRef]
  20. Shalaby, A.; Rappenglueck, B.; Eltahir, E.A.B. The climatology of dust aerosol over the arabian peninsula. Atmos. Chem. Phys. 2015, 15, 1523–1571. [Google Scholar]
  21. Rahn, K.A.; Borys, R.D.; Shaw, G.E. The Asian source of Arctic haze bands. Nature 1977, 268, 713–715. [Google Scholar] [CrossRef]
  22. Singh, P.; Dey, S. Crop burning and forest fires: Long-term effect on adolescent height in India. Atmos. Res. 2021, 65, 101244. [Google Scholar] [CrossRef]
  23. Sohail, M.T.; Ullah, S.; Majeed, M.T.; Usman, A.; Andlib, Z. The shadow economy in South Asia: Dynamic effects on clean energy consumption and environmental pollution. Environ. Sci. Pollut. Res. 2021, 28, 29265–29275. [Google Scholar] [CrossRef] [PubMed]
  24. Lyu, B.; Hu, Y.; Zhang, W.; Du, Y.; Luo, B.; Sun, X.; Sun, Z.; Deng, Z.; Wang, X.; Liu, J.; et al. Fusion Method Combining Ground-Level Observations with Chemical Transport Model Predictions Using an Ensemble Deep Learning Framework: Application in China to Estimate Spatiotemporally-Resolved PM2.5 Exposure Fields in 2014–2017. Environ. Sci. Technol. 2019, 53, 7306–7315. [Google Scholar] [CrossRef]
  25. Mehta, M.; Singh, N. Global trends of columnar and vertically distributed properties of aerosols with emphasis on dust, polluted dust and smoke—Inferences from 10-year long CALIOP observations. Remote Sens. Environ. 2018, 208, 120–132. [Google Scholar] [CrossRef]
  26. Uno, I.; Eguchi, K.; Yumimoto, K.; Takemura, T.; Shimizu, A.; Uematsu, M.; Liu, Z.; Wang, Z.; Hara, Y.; Sugimoto, N. Asian dust transported one full circuit around the globe. Nat. Geosci. 2009, 2, 557–560. [Google Scholar] [CrossRef]
  27. Yu, H.; Remer, L.A.; Chin, M.; Bian, H.; Tan, Q.; Yuan, T.; Zhang, Y. Aerosols from Overseas Rival Domestic Emissions over North America. Science 2012, 337, 566–569. [Google Scholar] [CrossRef]
  28. Zhong, H.; Huang, R.-J.; Lin, C.; Xu, W.; Duan, J.; Gu, Y.; Huang, W.; Ni, H.; Zhu, C.; You, Y.; et al. Measurement report: On the contribution of long-distance transport to the secondary aerosol formation and aging. Atmos. Chem. Phys. 2022, 22, 9513–9524. [Google Scholar] [CrossRef]
  29. Zhao, T.L.; Gong, S.L.; Zhang, X.Y.; Blanchet, J.-P.; McKendry, I.G.; Zhou, Z.J. A Simulated Climatology of Asian Dust Aerosol and Its Trans-Pacific Transport. Part I: Mean Climate and Validation. J. Clim. 2006, 19, 88–103. [Google Scholar] [CrossRef]
  30. Kanaya, Y.; Matsui, H.; Taketani, F.; Pan, X.; Komazaki, Y.; Wang, Z.; Chang, L.; Kang, D.; Choi, M.; Kim, S.-Y.; et al. Observed and Modeled Mass Concentrations of Organic Aerosols and PM2.5 at Three Remote Sites around the East China Sea: Roles of Chemical Aging. Aerosol Air Qual. Res. 2017, 17, 3091–3105. [Google Scholar] [CrossRef]
  31. Kanaya, Y.; Miyazaki, K.; Taketani, F.; Miyakawa, T.; Takashima, H.; Komazaki, Y.; Pan, X.; Kato, S.; Sudo, K.; Sekiya, T.; et al. Ozone and carbon monoxide observations over open oceans on R/V Mirai from 67°S to 75°N during 2012 to 2017: Testing global chemical reanalysis in terms of Arctic processes, low ozone levels at low latitudes, and pollution transport. Atmos. Chem. Phys. 2019, 19, 7233–7254. [Google Scholar] [CrossRef]
  32. Kanaya, Y.; Yamaji, K.; Miyakawa, T.; Taketani, F.; Zhu, C.; Choi, Y.; Komazaki, Y.; Ikeda, K.; Kondo, Y.; Klimont, Z. Rapid reduction in black carbon emissions from China: Evidence from 2009–2019 observations on Fukue Island, Japan. Atmos. Chem. Phys. 2020, 20, 6339–6356. [Google Scholar] [CrossRef]
  33. Eguchi, K.; Uno, I.; Yumimoto, K.; Takemura, T.; Shimizu, A.; Sugimoto, N.; Liu, Z. Trans-pacific dust transport: Integrated analysis of NASA/CALIPSO and a global aerosol transport model. Atmos. Chem. Phys. 2009, 9, 3137–3145. [Google Scholar] [CrossRef]
  34. Meng, L.; Yang, X.; Zhao, T.; He, Q.; Mamtimin, A.; Wang, M.; Huo, W.; Yang, F.; Zhou, C.; Pan, H. Simulated regional transport structures and budgets of dust aerosols during a typical springtime dust storm in the Tarim Basin, Northwest China. Atmos. Res. 2020, 238, 104892. [Google Scholar] [CrossRef]
  35. Bourgeois, Q.; Ekman, A.M.L.; Renard, J.-B.; Krejci, R.; Devasthale, A.; Bender, F.A.-M.; Riipinen, I.; Berthet, G.; Tackett, J.L. How much of the global aerosol optical depth is found in the boundary layer and free troposphere? Atmos. Chem. Phys. 2018, 18, 7709–7720. [Google Scholar] [CrossRef]
  36. Wang, L.; Lyu, B.; Bai, Y. Global aerosol vertical structure analysis by clustering gridded CALIOP aerosol profiles with fuzzy k-means. Sci. Total Environ. 2021, 761, 144076. [Google Scholar] [CrossRef] [PubMed]
  37. Shukurov, K.A.; Simonenkov, D.V.; Nevzorov, A.V.; Rashki, A.; Hamzeh, N.H.; Abdullaev, S.F.; Shukurova, L.M.; Chkhetiani, O.G. CALIOP-Based Evaluation of Dust Emissions and Long-Range Transport of the Dust from the Aral−Caspian Arid Region by 3D-Source Potential Impact (3D-SPI) Method. Remote Sens. 2023, 15, 2819. [Google Scholar] [CrossRef]
  38. Tackett, J.L.; Winker, D.M.; Getzewich, B.J.; Vaughan, M.A.; Young, S.A.; Kar, J. CALIPSO lidar level 3 aerosol profile product: Version 3 algorithm design. Atmos. Meas. Tech. 2018, 11, 4129–4152. [Google Scholar] [CrossRef]
  39. Dee, D.P.; Uppala, S.M.; Simmons, A.J.; Berrisford, P.; Poli, P.; Kobayashi, S.; Andrae, U.; Balmaseda, M.A.; Balsamo, G.; Bauer, P.; et al. The ERA-Interim reanalysis: Configuration and performance of the data assimilation system. Q. J. R. Meteorol. Soc. 2011, 137, 553–597. [Google Scholar] [CrossRef]
  40. Draxler, R.R.; Hess, G.D. An overview of the HYSPLIT 4 modeling system for trajectories, dispersion, and deposition. Aust. Meteorol. Mag. 1998, 47, 295–308. [Google Scholar]
  41. Lee, Y.H.; Chen, K.; Adams, P.J. Development of a global model of mineral dust aerosol microphysics. Atmos. Chem. Phys. 2009, 9, 2441–2458. [Google Scholar] [CrossRef]
  42. Miller, R.L.; Tegen, I.; Perlwitz, J. Surface radiative forcing by soil dust aerosols and the hydrologic cycle. J. Geophys. Res. 2004, 109, D04203. [Google Scholar] [CrossRef]
  43. Wang, L.; Lyu, B.; Bai, Y. Aerosol vertical profile variations with seasons, air mass movements and local PM2.5 levels in three large China cities. Atmos. Environ. 2020, 224, 117329. [Google Scholar] [CrossRef]
  44. Han, Y.; Fang, X.; Zhao, T.; Kang, S. Long range trans-Pacific transport and deposition of Asian dust aerosols. J. Environ. Sci. 2008, 20, 424–428. [Google Scholar] [CrossRef]
  45. Pease, P.P.; Tchakerian, V.P.; Tindale, N.W. Aerosols over the Arabian Sea: Geochemistry and source areas for aeolian desert dust. J. Arid. Environ. 1998, 39, 477–496. [Google Scholar] [CrossRef]
  46. Velasco-Merino, C.; Mateos, D.; Toledano, C.; Prospero, J.M.; Molinie, J.; Euphrasie-Clotilde, L.; González, R.; Cachorro, V.E.; Calle, A.; Frutos, A.M.d. Impact of long-range transport over the Atlantic Ocean on Saharan dust optical and microphysical properties based on AERONET data. Atmos. Chem. Phys. 2018, 18, 9411–9424. [Google Scholar] [CrossRef]
  47. Guo, J.; Lou, M.; Miao, Y.; Wang, Y.; Zeng, Z.; Liu, H.; He, J.; Xu, H.; Wang, F.; Min, M.; et al. Trans-Pacific transport of dust aerosols from East Asia: Insights gained from multiple observations and modeling. Environ. Pollut. 2017, 230, 1030–1039. [Google Scholar] [CrossRef]
  48. Guelle, W.; Balkanski, Y.J.; Schulz, M.; Dulac, F.; Monfray, P. Wet deposition in a global size-dependent aerosol transport model: 1. Comparison of a 1-year 210Pb simulation with ground measurements. J. Geophys. Res. Atmos. 1998, 103, 11429–11445. [Google Scholar] [CrossRef]
  49. Wang, Y.Q.; Zhang, X.Y.; Gong, S.L.; Zhou, C.H.; Hu, X.Q.; Liu, H.L.; Niu, T.; Yang, Y.Q. Surface observation of sand and dust storm in East Asia and its application in CUACE/Dust. Atmos. Chem. Phys. 2008, 8, 545–553. [Google Scholar] [CrossRef]
  50. Zhang, X.-X.; Sharratt, B.; Liu, L.-Y.; Wang, Z.-F.; Pan, X.-L.; Lei, J.-Q.; Wu, S.-X.; Huang, S.-Y.; Guo, Y.-H.; Li, J.; et al. East Asian dust storm in May 2017: Observations, modeling, and its influence on the Asia-Pacific region. Atmos. Chem. Phys. 2018, 18, 8353–8371. [Google Scholar] [CrossRef]
Figure 1. Eleven-day air mass forward trajectory clusters originating from the North China Plain and the Taklimakan Desert (starting at 100 m AGL).
Remotesensing 15 04537 g001
Figure 2. Seasonal layered AOD values for all aerosols. The four rows represent the four seasons: MAM, JJA, SON, and DJF. The three columns are for AODPBL, AODFTL, and AODTA. (a,d,g,j) mean the AODPBL values in MAM, JJA, SON, and DJF, respectively. (b,e,h,k) mean the AODFTL values in MAM, JJA, SON, and DJF, respectively. (c,f,i,l) represent the AODTA values in MAM, JJA, SON, and DJF, respectively.
Remotesensing 15 04537 g002
Figure 3. Regions with R_AODFTL values > 30% on the seasonal scale: (ad) R_AODFTL values in MAM, JJA, SON, and DJF.
Remotesensing 15 04537 g003
Figure 4. R_AODPBL values along three aerosol transport pathways (a) CN1, (b) CN2, and (c) CN3 on a seasonal scale (from the North China Plain).
Remotesensing 15 04537 g004
Figure 5. R_AODPBL values along three aerosol transport pathways on a multiannual scale (from the North China Plain).
Remotesensing 15 04537 g005
Figure 6. Comparison of air particle heights (100 m AGL, 500 m AGL, and 1000 m AGL) and PBLH values in (a) CN1 and (b) CN3. (a,c) The air particle heights of CN1 and CN3. (b,d) are the clusters of original air mass trajectories clustering to CN1 and CN3.
Remotesensing 15 04537 g006
Figure 7. R_AODPBL values along three aerosol transport pathways (a) CT1, (b) CT2, and (c) CT3 on the seasonal scale (from the Taklimakan Desert).
Remotesensing 15 04537 g007
Figure 8. Comparison of air particle heights (100 m AGL, 500 m AGL, and 1000 m AGL) and PBLH values in CT2. (a) The air particle heights of CN1 and CN3. (b) The clusters of original air mass trajectories clustering to CN1 and CN3.
Remotesensing 15 04537 g008
Figure 9. R_AODPBL values along three aerosol transport pathways on a multiannual scale (from the Taklimakan Desert).
Remotesensing 15 04537 g009
Disclaimer/Publisher’s Note: The statements, opinions and data contained in all publications are solely those of the individual author(s) and contributor(s) and not of MDPI and/or the editor(s). MDPI and/or the editor(s) disclaim responsibility for any injury to people or property resulting from any ideas, methods, instructions or products referred to in the content.

