Communication

Satellite-Based Distribution of Inverse Altitude Effect of Global Water Vapor Isotopes: Potential Influences on Isotopes in Climate Proxies

1
College of Geography and Environmental Science, Northwest Normal University, Lanzhou 730070, China
2
Key Laboratory of Resource Environment and Sustainable Development of Oasis of Gansu Province, Northwest Normal University, Lanzhou 730070, China
3
Laboratoire de Météorologie Dynamique, Institut Pierre-Simon Laplace, Centre National de la Recherche Scientifique IPSL, CNRS, Sorbonne Université, 75006 Paris, France
*
Author to whom correspondence should be addressed.
Remote Sens. 2023, 15(18), 4533; https://doi.org/10.3390/rs15184533
Submission received: 7 August 2023 / Revised: 12 September 2023 / Accepted: 13 September 2023 / Published: 14 September 2023
(This article belongs to the Section Atmospheric Remote Sensing)

Abstract

:
The widely-distributed altitude effect of stable isotopes in meteoric water, i.e., the negative correlation between stable hydrogen (or oxygen) isotope compositions and altitude, is the theoretical basis of isotope paleoaltimetry in climate proxies. However, as many recent local observations have indicated, the inverse altitude effect (IAE) in meteoric water does exist, and the regime controlling IAE is still unclear on a global scale. Based on a remote sensing product of the Infrared Atmospheric Sounding Interferometer (IASI), we examined the global frequency of IAE in water vapor isotopes, and the possible influences on isotopes in precipitation and climate proxies. According to the satellite-based δD values in water vapor at 2950 m and 4220 m above sea level, frequent IAEs are observed on a daily scale in North Africa, West and Central Asia, and North America, and IAEs are more likely to occur during the daytime than during the nighttime. We also converted water vapor δD to precipitation δD via equilibrium fractionation and then analyzed the potential presence of IAE in precipitation, which is more associated with climate proxies, and found that the spatial and temporal patterns of water vapor can be transferred to the precipitation. In addition, different thresholds of δD difference were also tested to understand the impact of random errors. The potential uncertainty of the changing isotope and altitude gradient should be considered in paleo-altitude reconstructions.

1. Introduction

The reconstructed altitude of the world’s highlands has the potential to improve our understanding of plate dynamics [1,2], core–mantle interactions [3,4], the Earth’s geophysical structure [5] and climate dynamics [6]. However, it is always challenging to directly measure the altitude of the Earth’s surface in the past or accurately estimate it using proxies [7,8,9]. The negative correlation between stable water isotopes (δ18O or δD) in meteoric water and the altitudes at which precipitation occurs, also known as the altitude effect (AE) of water isotopes, provides a quantitative tool in paleo-altitude reconstructions using climate proxies [10,11,12]. The altitude effect is associated with the orographic uplifting and condensation of air masses, as well as the rainout of heavy isotopes as precipitation continues.
Although many observations have confirmed the phenomenon of the altitude effect [13], counterexamples do exist and are sometimes termed the inverse altitude effect (IAE) [14,15]. There is currently a great deal of controversy regarding the spatial and temporal distribution of the IAE and the mechanism by which it occurs. The processes that weaken the altitude–oxygen isotope relationship have been well described [16,17,18,19,20]. Usually, IAE is considered to be caused by some local atmospheric processes [14,21]. Jing et al. [15] analyzed the mean difference in water vapor isotopes at various atmospheric layers, and highlighted the transport of isotopically enriched water vapor for the regions with the IAE. The synoptic processes related to precipitation usually continue for only a few days, and the seasonal or annual mean may ignore the potential existence of IAE on a finer temporal scale. The global spatial and temporal variability in the IAE on a daily or diurnal basis is still unclear.
Because of the sample availability of meteoric water (i.e., precipitation) along an altitude gradient, especially at high altitudes, the understanding of factors controlling the IAE is usually constrained by in situ observations. Water vapor, as a prerequisite substance for precipitation, contains continuous atmospheric information on spatial and temporal dimensions, which is usually better at describing the atmospheric factor of the IAE than precipitation [22,23,24]. More importantly, the atmospheric water vapor can be globally examined using remote sensing methods, and large-scale patterns of water vapor isotopes can be acquired on a fine time–frequency. In contrast, the global distribution of precipitation isotopes is not available from the satellite measurements. Regarding the application of remote sensing technology, the water vapor isotope observation provides an opportunity to quantify the presence of the IAE on larger spatial scales. Compared to previous sensors of water vapor isotopes, especially the Tropospheric Emission Spectrometer (TES) [25,26,27,28], the Infrared Atmospheric Sounding Interferometer (IASI) provides more recent observations [29,30,31]. In particular, the twice-a-day sampling rate is important to capture the diurnal variability of variations in δD in free air [32,33,34].
In this paper, we examine the daily and diurnal frequency of the IAE in the atmospheric water vapor at different altitudes (2950 m and 4220 m) from 60°S to 60°N using IASI. We aim to reveal the spatial distribution and seasonal variations in the IAE of water vapor isotopes on the daily and diurnal scales, and discuss the potential impact of IAEs on stable isotope paleoaltimetry from the perspective of water vapor to precipitation.

2. Materials and Methods

2.1. Materials

We used the water vapor δD value on a diurnal basis (twice a day, i.e., daytime and nighttime) from a regular 1° × 1° re-gridded MUSICA IASI water isotopologue pair dataset (a posteriori processing version 2) [34,35,36] in order to acquire the atmospheric vertical profiles (2950 m and 4220 m) from 60°S to 60°N during 2015–2020. The δD error and air temperature data were also provided in the database. Daily averages were obtained by averaging individual observations for daytime and nighttime, and monthly averages were obtained from the daily averages.
The IASI comprises a Fourier-transform spectrometer attached to the MetOp platform [37], which has high-quality spectra with a resolution of 0.5 cm−1 and relatively low radiometric noise [25,38,39]. As a successor to the widely used TES, which is employed for water vapor isotope measurements, IASI with frequent sampling (twice a day globally) has been used in many isotopic applications [26,27,28,29,32,33,34,40].

2.2. Methods

2.2.1. Determination of IAE Frequency

The IAE phenomenon can be determined by the difference in δD in the water vapor between the two atmospheric levels, the upper (4220 m) minus the lower (2950 m). Theoretically, at a grid point in which the difference is positive, it means that δD in the water vapor increases with altitude, that is, the IAE occurs. To remove the random errors in the measurements, here a threshold of δD difference is needed to identify the IAE, and the difference within the threshold can be ignored. We calculated the mean errors of δD for the 2950 m (10.15‰) and 4220 m (11.57‰) levels used in this study, and then used 20‰ as the threshold of δD difference, which is generally consistent with the sum of the mean errors for the two levels. The proportion of the IAE on valid days without missing days, i.e., the IAE frequency, is used to reflect the spatial and temporal distribution of the IAE in water vapor. To understand the influence of the threshold we used, we also tested another two thresholds of 0‰ (the random error was not considered) and 10‰ (generally consistent with the δD error for one layer).

2.2.2. Simulated Precipitation Isotopes

When the isotopes of cloud–base precipitation follow the equilibrium fractionation with the ambient water vapor, the isotope fractionation can be expressed as follows:
Rzp–eq = Rzvα,
or
δ z p e q 1000 + 1 = 1 α δ z v 1000 + 1 ,
where δzp–eq (and Rzp–eq) are the precipitation isotope values in a delta notation (and isotope ratio) of the cloud base, δzv (and Rzv) are the corresponding water vapor isotope values in a delta notation (and isotope ratio), and α is the equilibrium fractionation factor that depends on temperature [41]:
10 3 ln 2 α +     1158.8 T 3 10 9 1620.1 T 2 10 6 + 794.84 T 10 3 161.04 + 2.9992 × 10 9 T 3
where T is the temperature in K.

3. Results

3.1. Annual Characteristics of IAE in Water Vapor

Here, we averaged the δD values during the daytime and nighttime from 2015 to 2020 to obtain a daily data series, and then averaged the daily data to acquire the annual δD. Usually, the water vapor depletes in D and 18O as the altitude increases [42]. According to the spatial distribution of δD at different heights (Figure 1), the height of 2950 m (Figure 1a) is more isotopically enriched than the height of 4220 m (Figure 1b), indicating the altitude effect of isotopes on a large scale. From a spatial perspective, δD in water vapor is usually more enriched at low latitudes, especially within 20°N and 20°S, with the most enriched area occurring in Africa. This spatial pattern of water vapor isotopes is generally consistent with our previous understanding of global precipitation isoscapes [43]. Figure 1c shows the average δD difference in water vapor, which is based on the distribution of the two layers. Generally, in the tropical regions, the water vapor isotopes at different layers are close, especially in the Amazons and the Malay Archipelago; this corresponds to strong convection and atmospheric mixing.
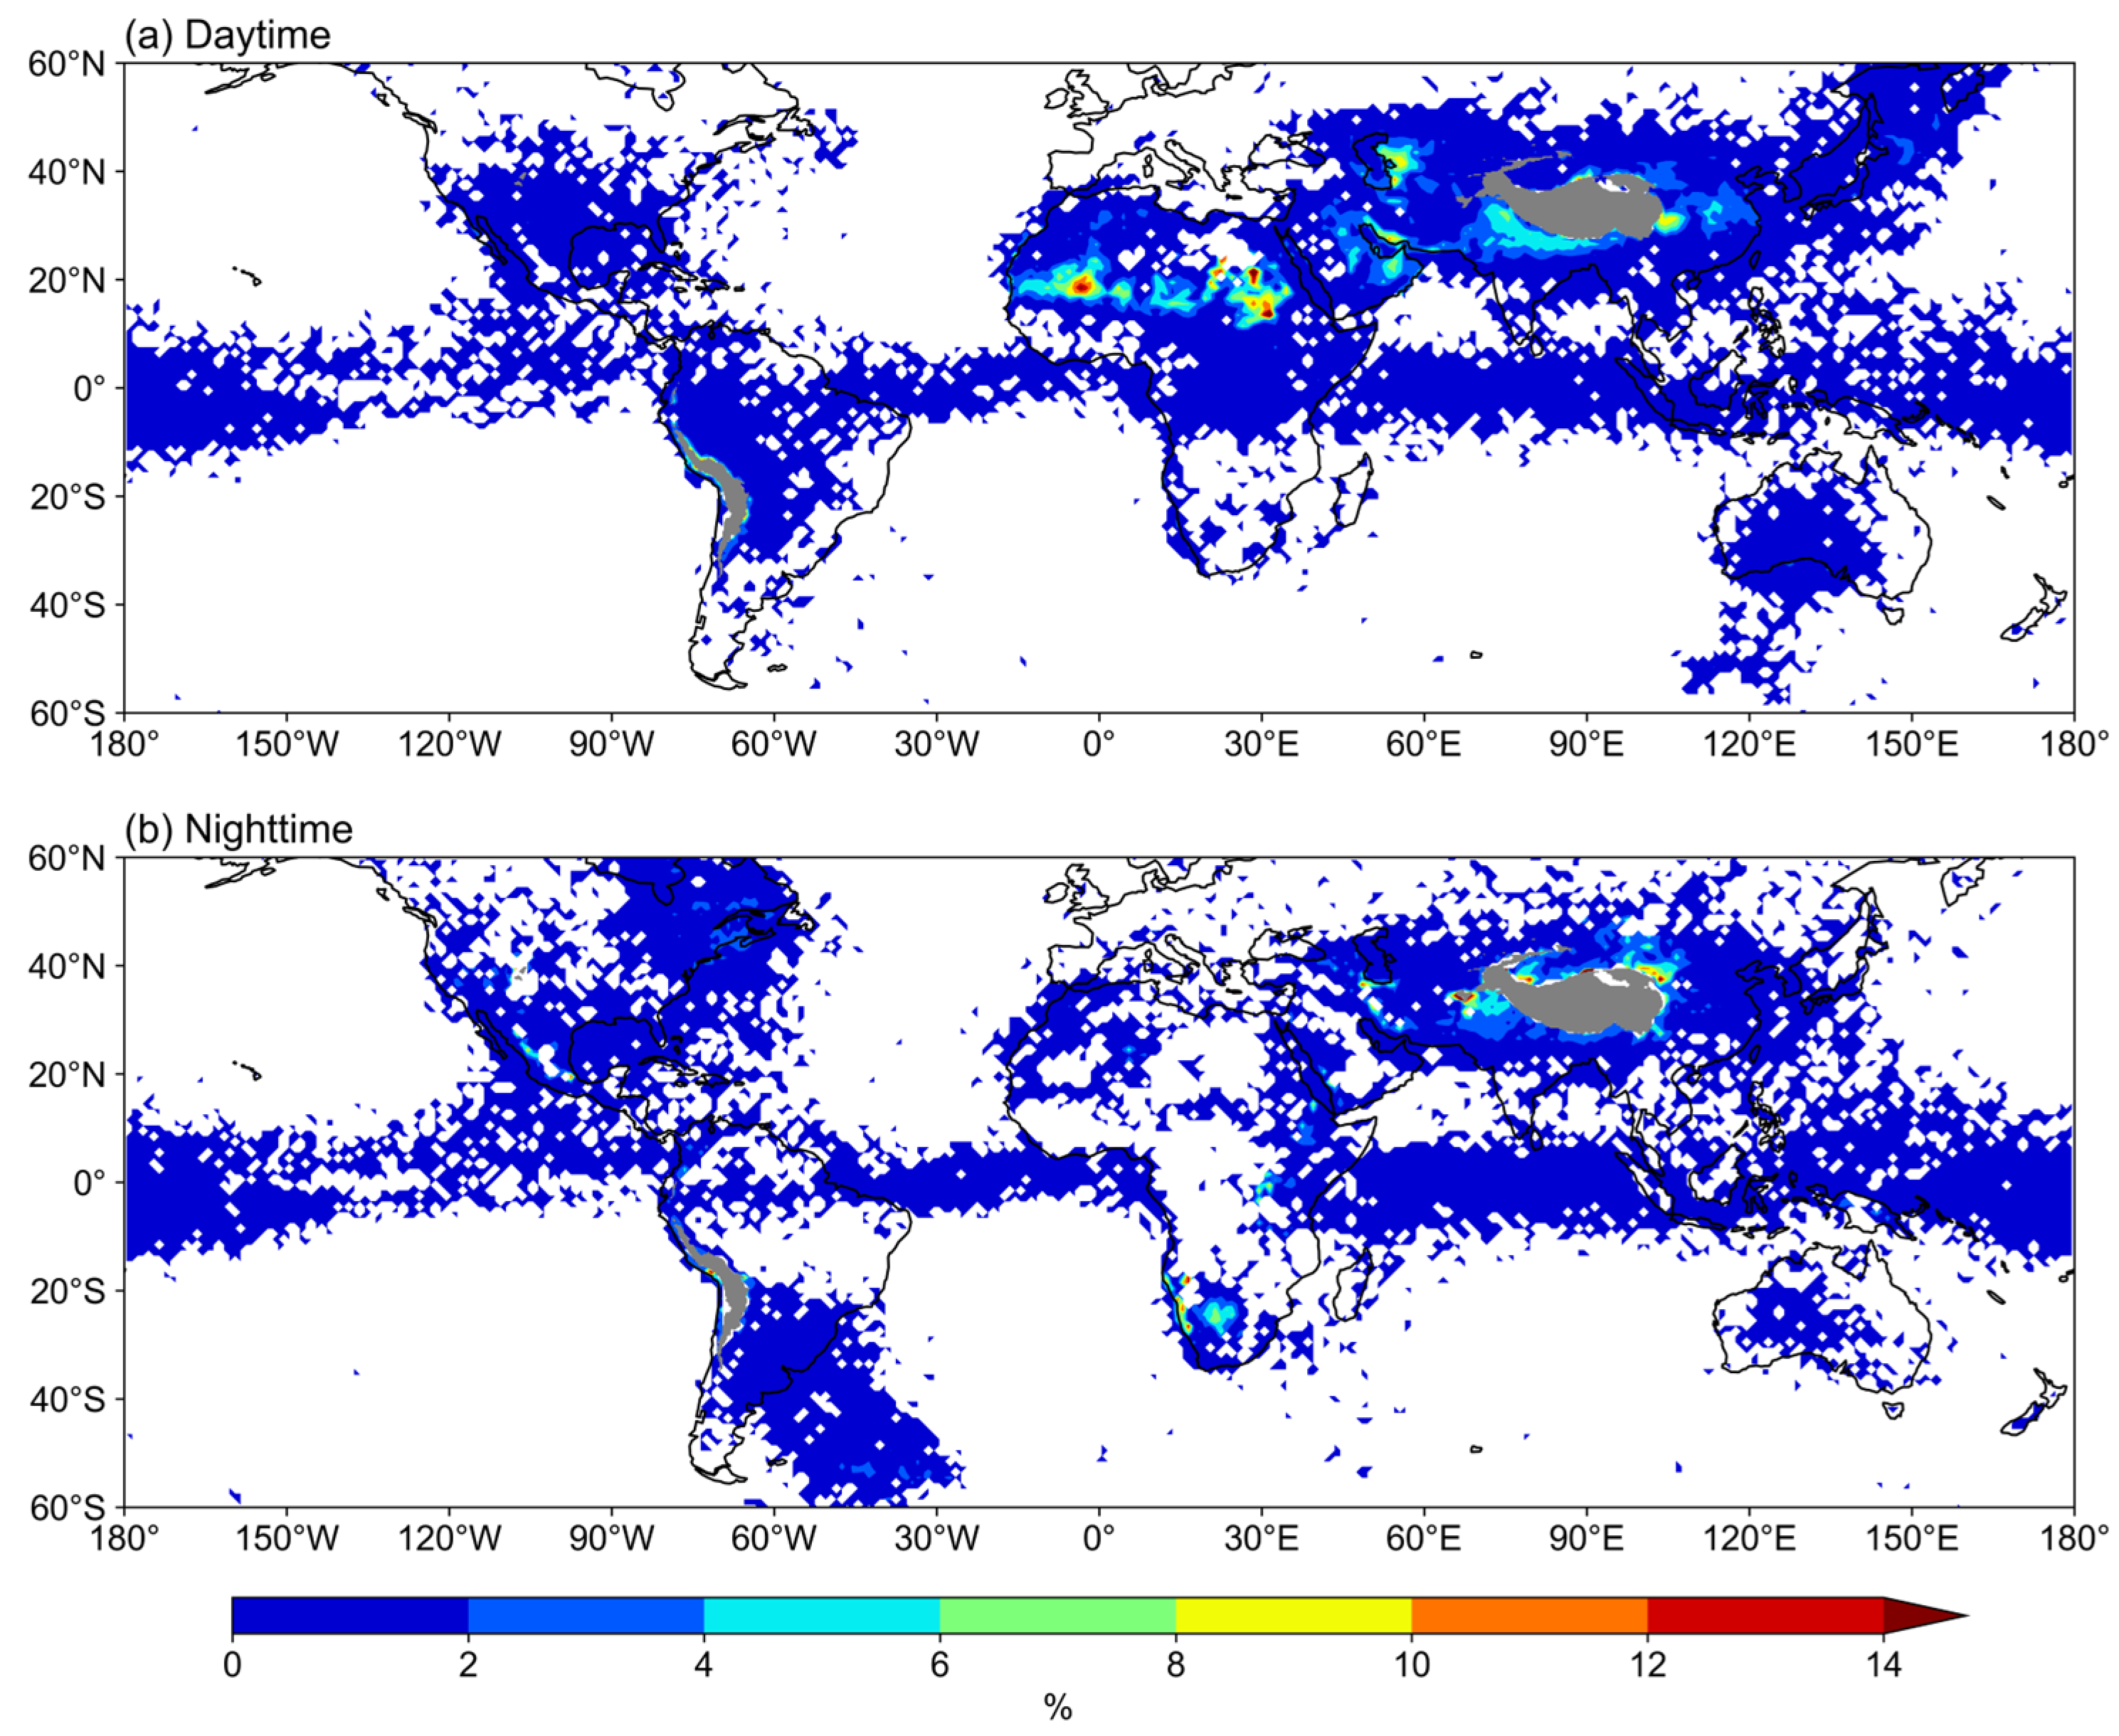
Compared to the annual mean of δD difference (Figure 1c), determining the frequency of IAE days in valid days, as shown in Figure 2, is more effective when aiming to examine the existence of the IAE. The results showed that the IAE was common on the daily scale, with a major concentration in North Africa, West and Central Asia, and North America, which is also consistent with previous studies using other satellite products [15]. In addition, we calculated the frequency of IAE days for the daytime and nighttime separately (Figure 3), and found that the IAE was more likely to occur during the daytime than during the nighttime. It is clear that the frequency of IAE days in valid days offers more information about the IAE than the difference between the two adjacent layers of δD on seasonal or annual scales, because the averages ignore the variability in the short-term presence of the IAE on a synoptic scale.

3.2. Seasonal Characteristics of IAE in Water Vapor

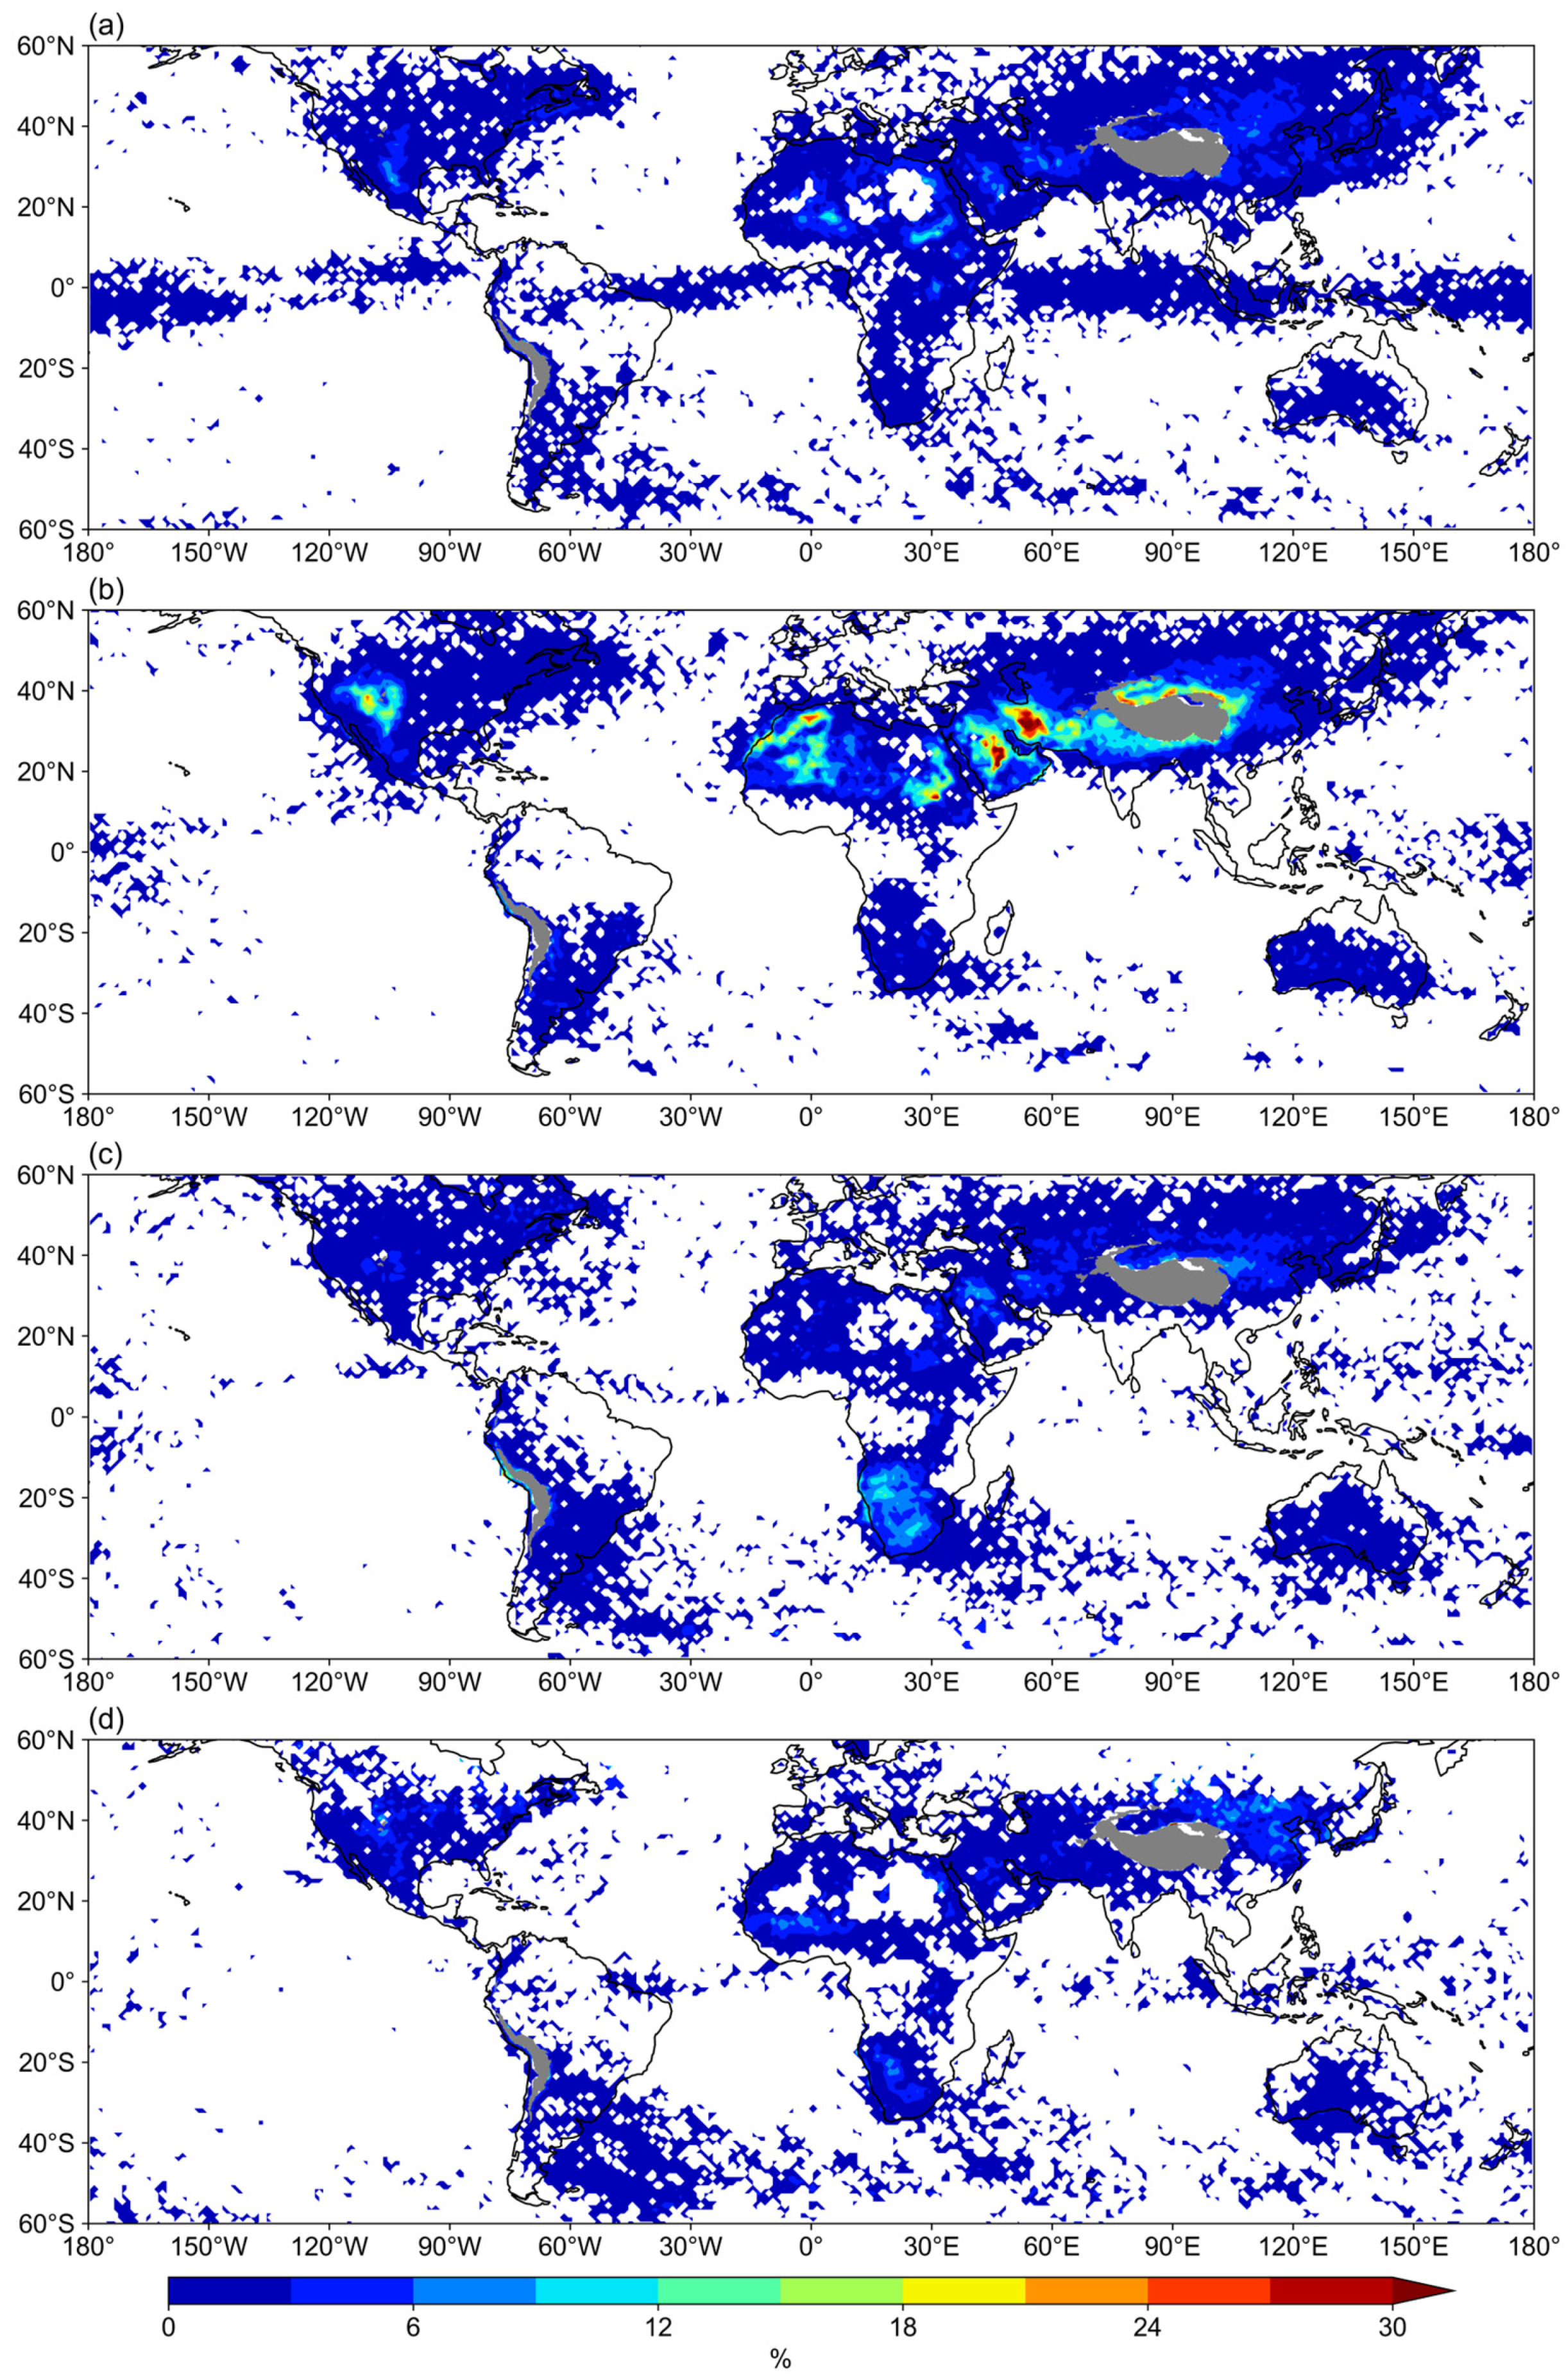
Here, we focus on the frequency of IAE days in valid days for each season (Figure 4). The seasonal IAE is widely distributed, although there are obvious seasonal differences. The IAE in JJA is the most frequent, with a maximum frequency of more than 30%, and occurring mainly from North Africa to West and Central Asia, as well as North America. Compared to JJA, with warm conditions in the northern hemisphere, other seasons usually experience a less frequent IAE.
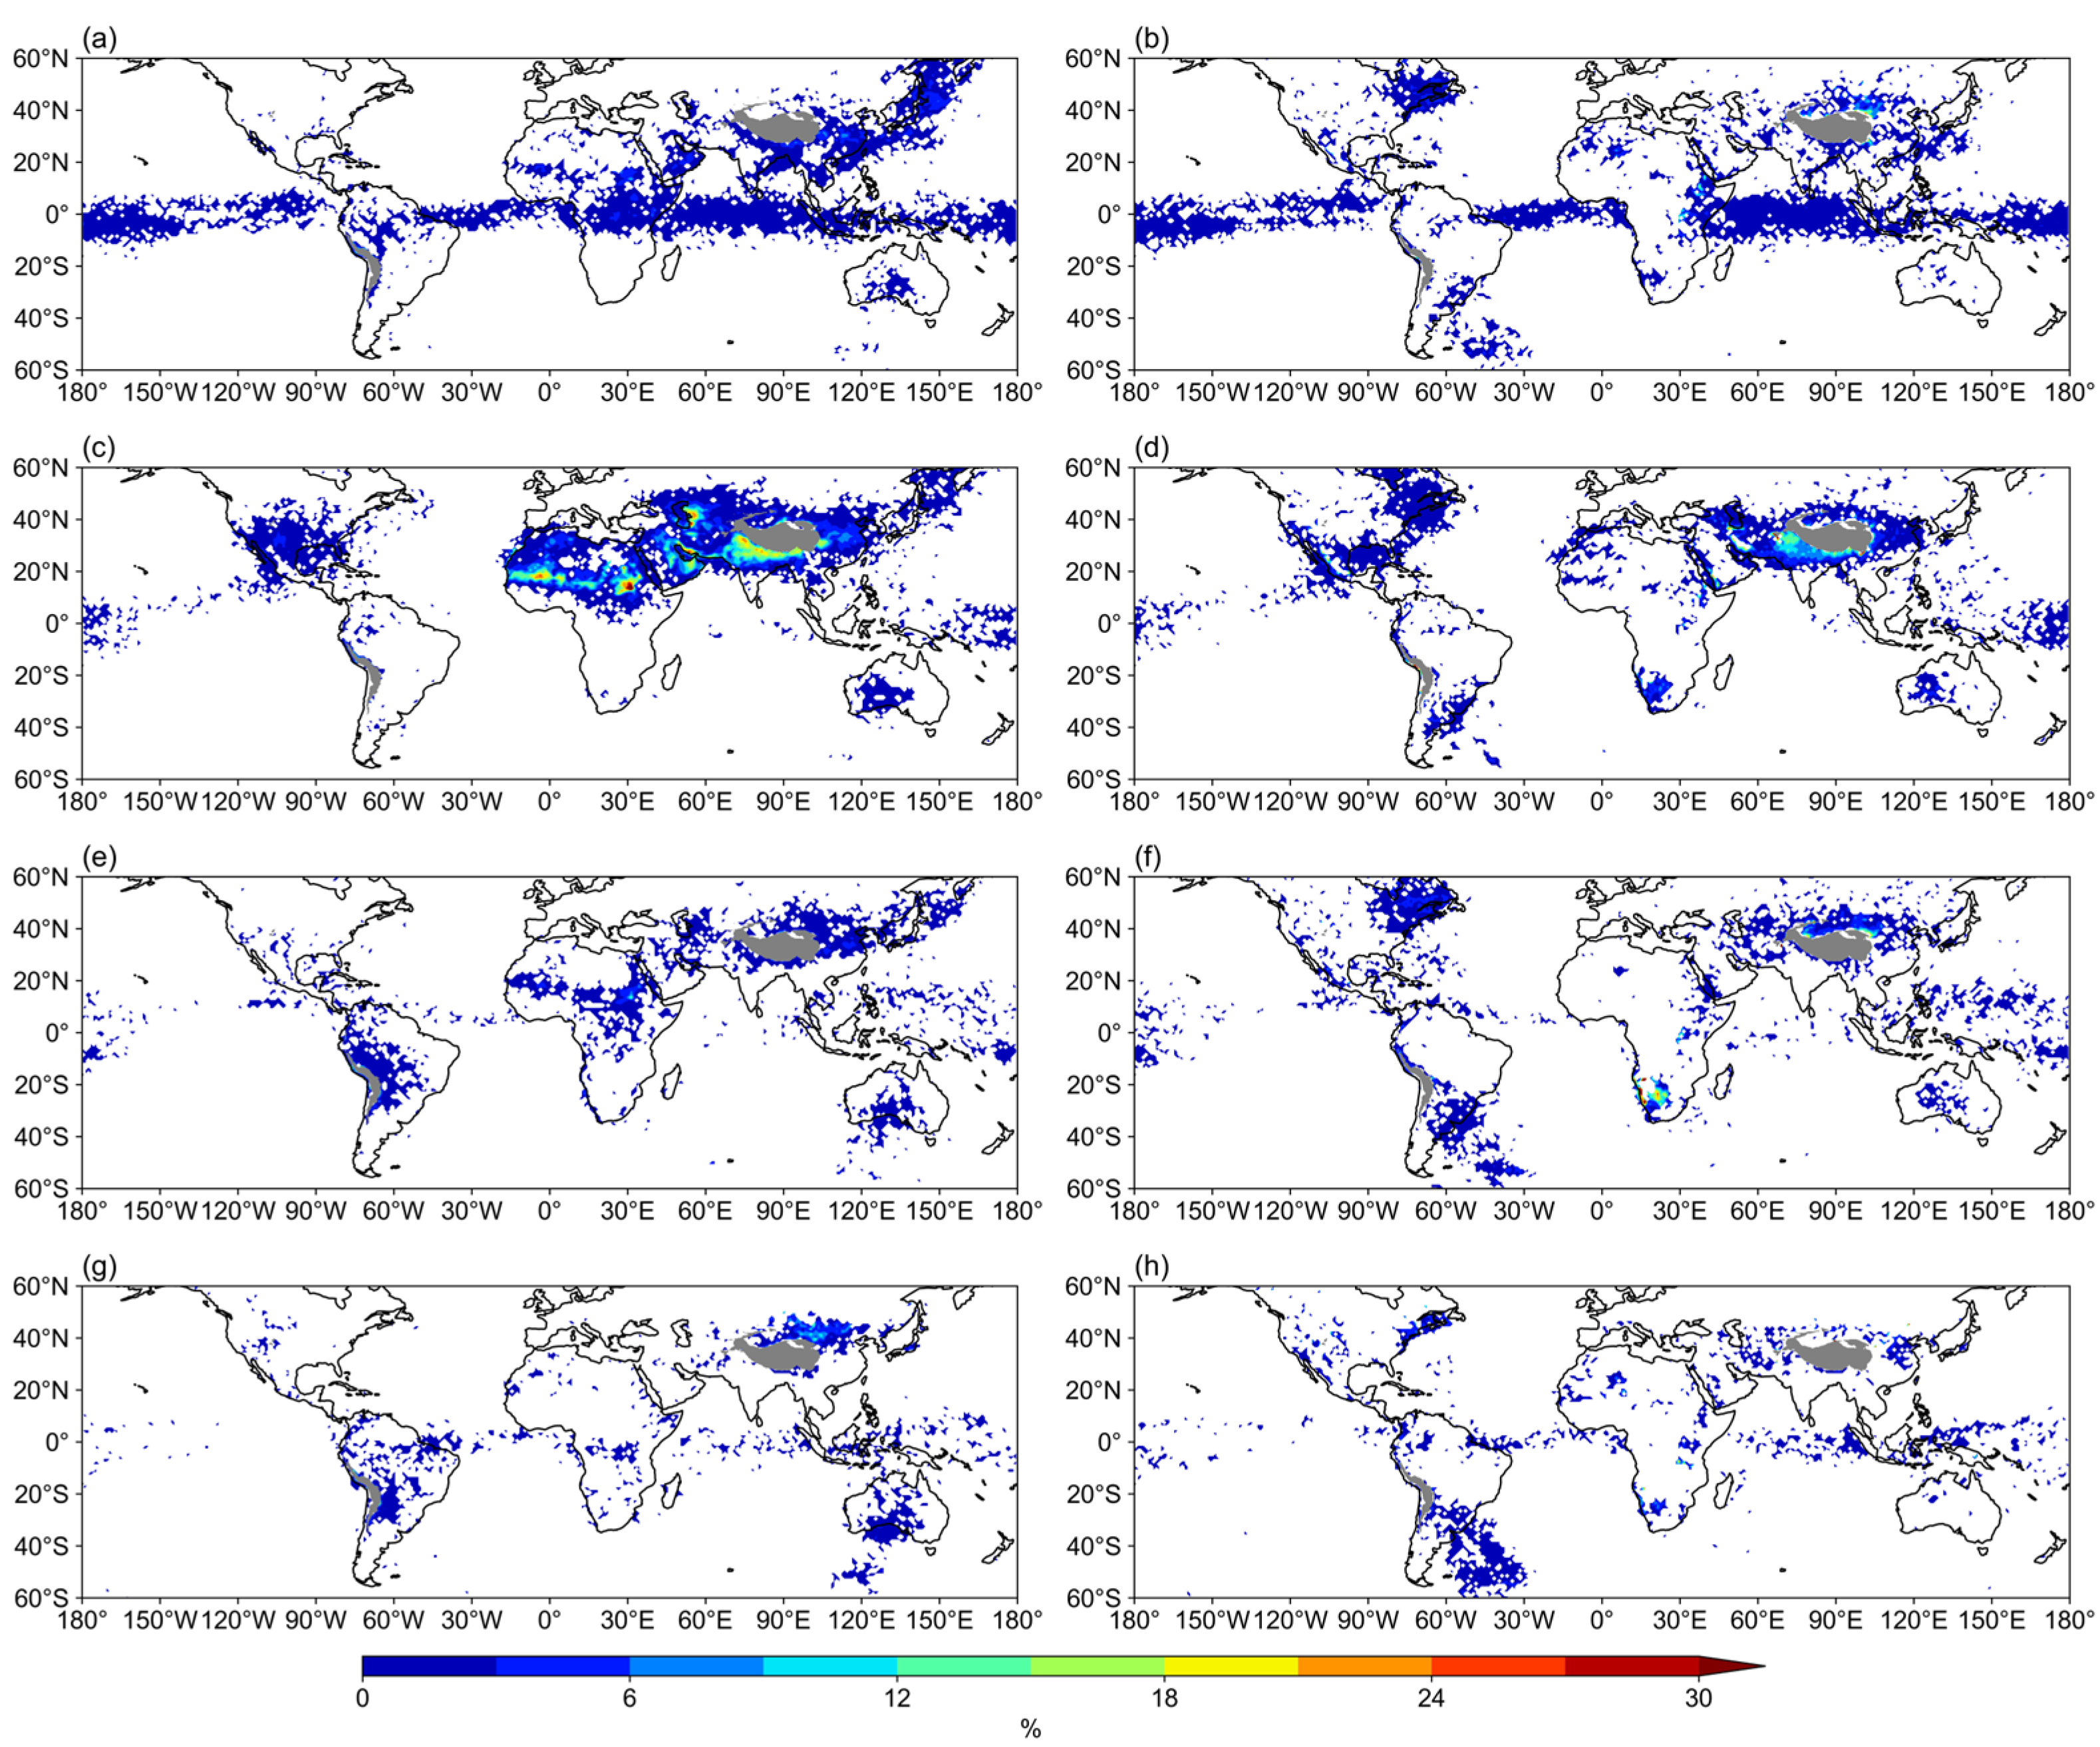
The daytime and nighttime data are provided in Figure 5. The IAE is widely spread in the daytime, involving parts of North Africa and Asia, and the frequency of the IAE during the daytime is as high as 30% or more in many areas. In contrast, the frequency of the IAE during the nighttime is much lower, and the area of occurrence is smaller, which means that the daytime contributes more to the IAE throughout the year. Overall, the IAE occurs more frequently during the daytime for each season, and the frequency of the IAE is usually higher in JJA than in other seasons.

4. Discussion

4.1. Impact of Errors on IAE

The instrument error of the satellite sensor may have impacted the results when analyzing the spatial and temporal variability in the IAE on a global scale. This is because the positive sign of the difference in δD may have been incorporated with random errors in the measurements to some degree. Lacour et al. [34] found that the difference between the TES and IASA δD has a standard deviation of 40–45‰. In this paper, we calculated the mean δD errors of 10.15‰ and 11.57‰ for the heights of 2950 m and 4220 m, respectively; the sum of the two is 21.72‰. Then, we chose a threshold of 20‰, so that the IAE occurs when the δD of the height of 4220 m minus the δD of 2950 m is greater than 20‰. As the findings were consistent with the spatial distribution found in previous works using other satellites [15], this method of thresholding was determined to be suitable for this study.
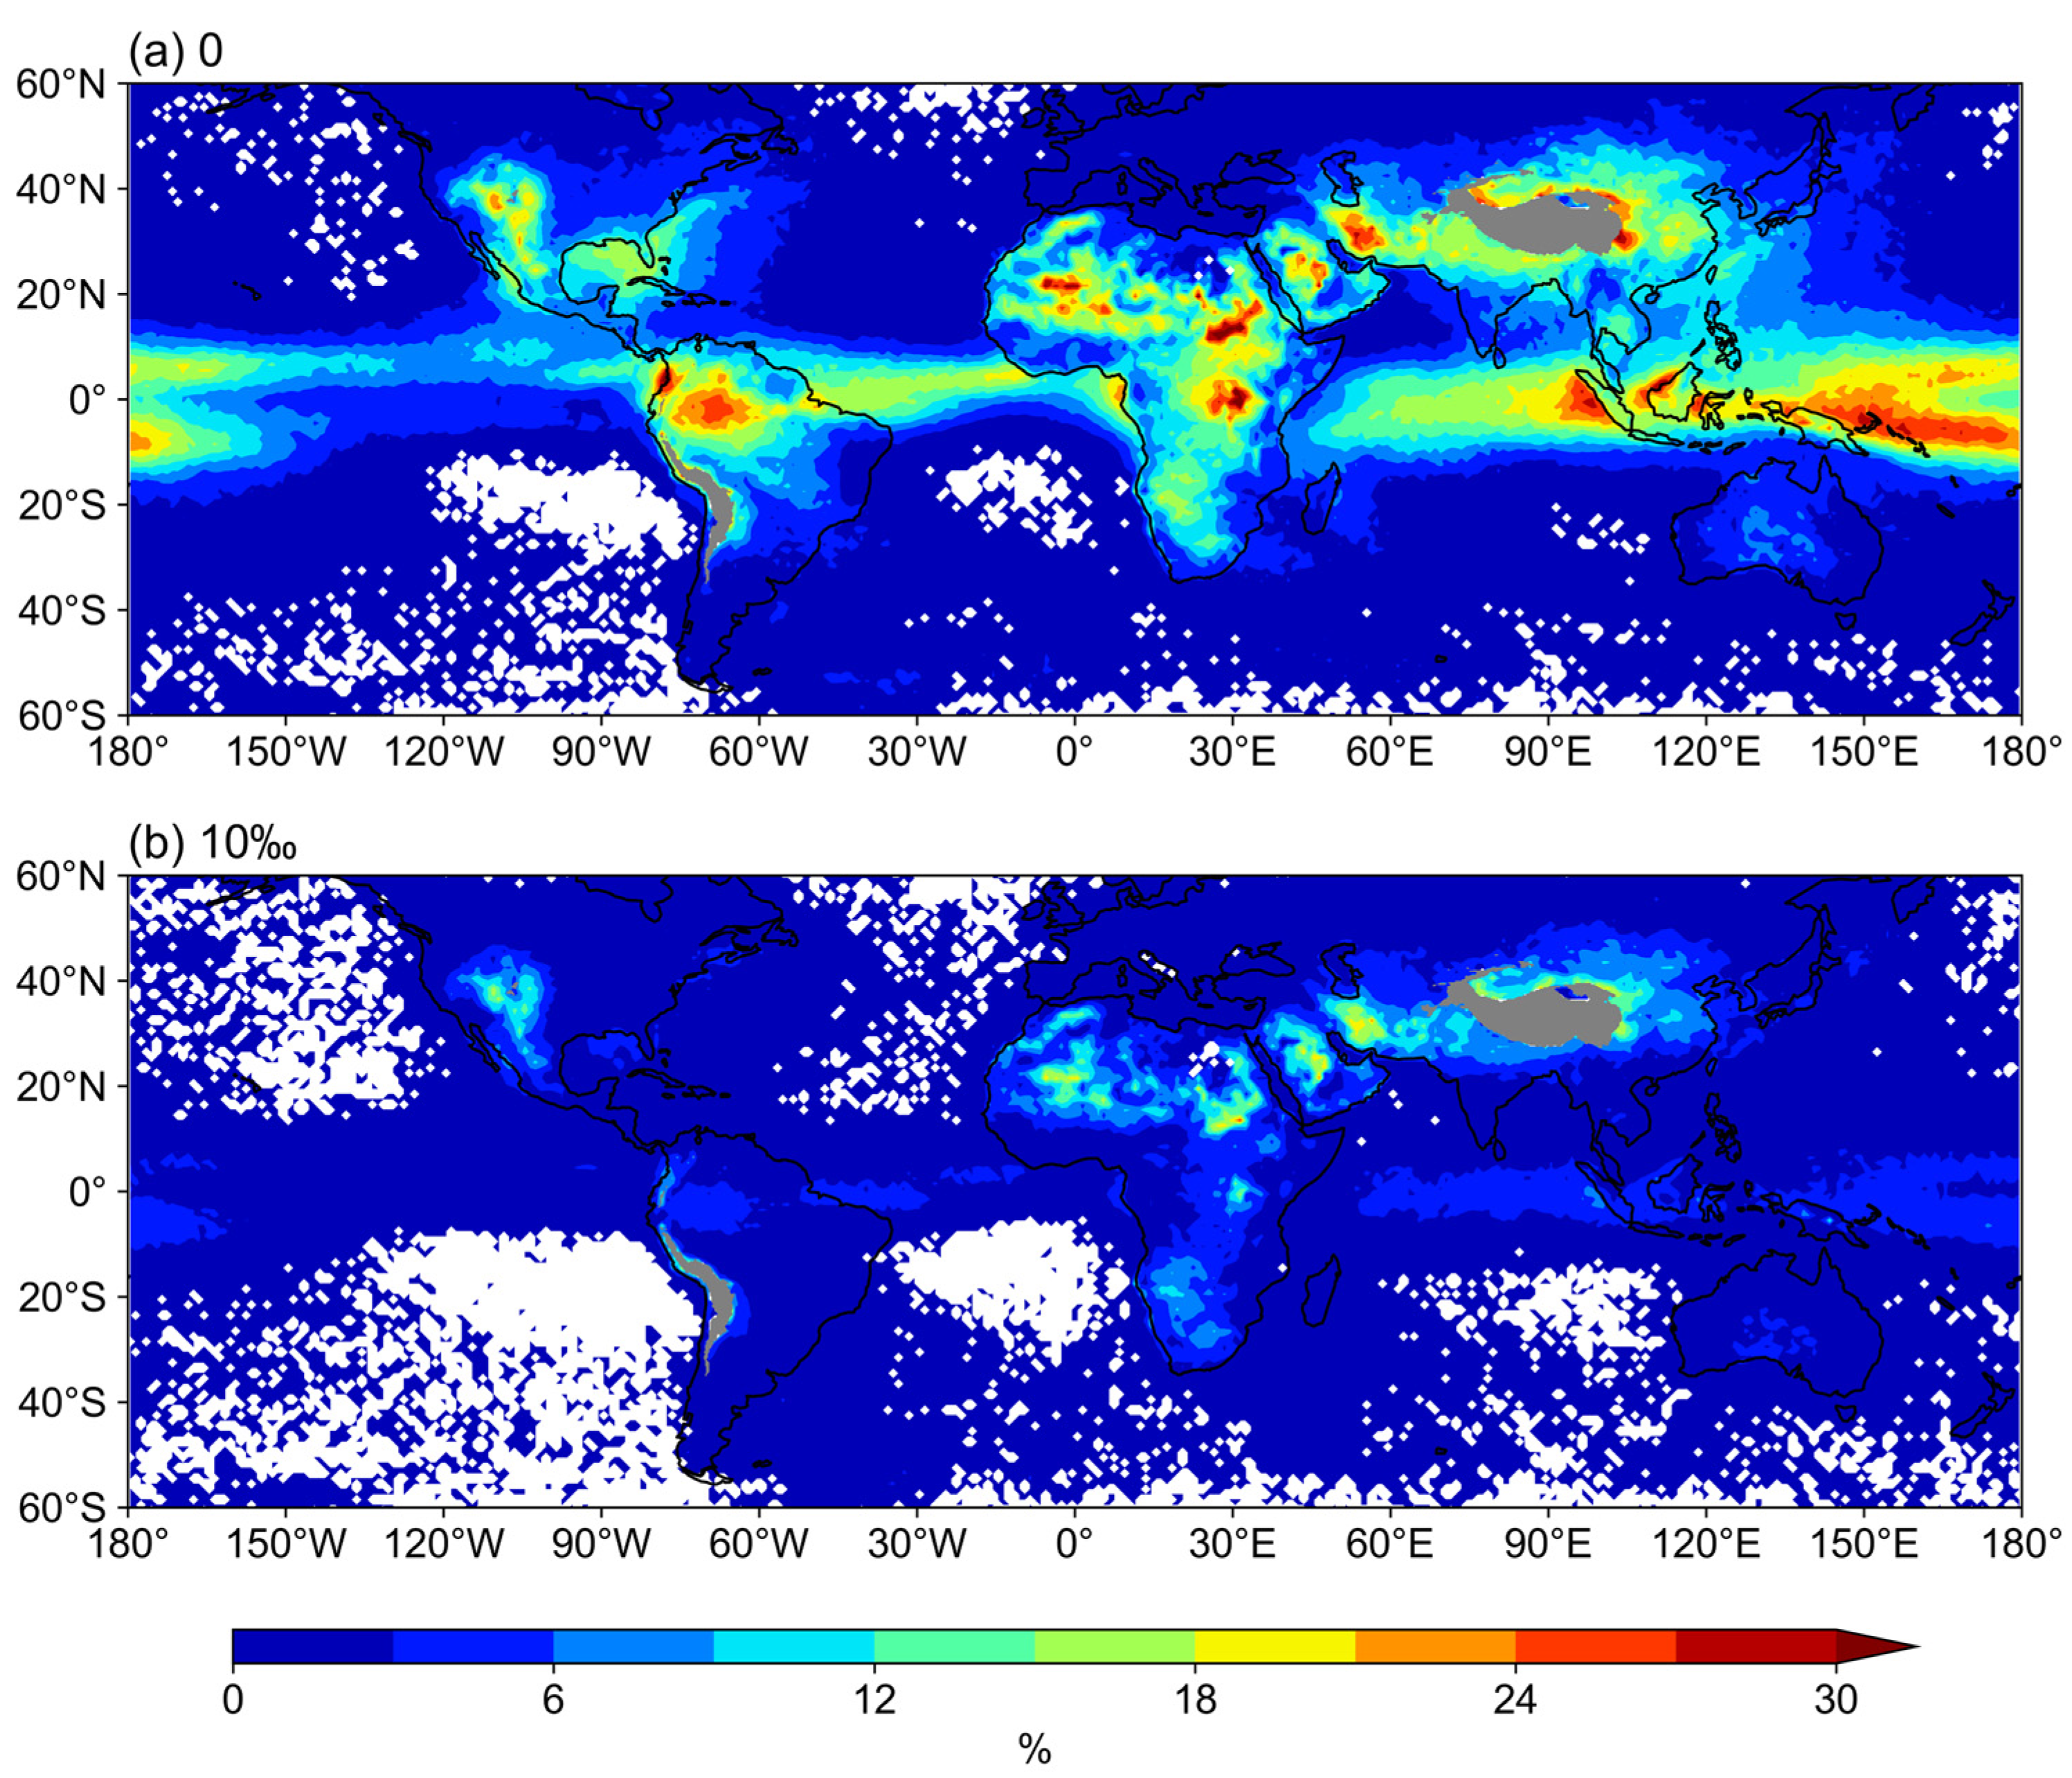
We also tested the distribution of the IAE when 0‰ (Figure 6a) and 10‰ (Figure 6b) were used as the thresholds. Generally, the regions with a high frequency of the IAE in valid days were the same, as mentioned in the above sections. However, when the threshold was set as 0‰, the equatorial area from 10° S to 10° N also showed some relatively high values, indicating the high uncertainty of the satellite in low latitudes. According to the seasonal distributions (Supplementary Figures S1 and S2), the results were also similar to the text above. Generally, the smaller the threshold, the more extensive the IAE appeared. However, the high threshold may have ignored some weak differences in the isotopes in the water vapor, and thus more precise measurements and validation will be needed in the future.
In addition to this, the IASI retrieval may have suffered from very wide (vertically orientated) mean kernels, but the data used in this paper were interpolated at a fixed atmospheric altitude, and the distance between the two strata was large enough that the mean kernels did not overlap.

4.2. Implications of Isotope Paleoaltimetry

As water vapor is a prerequisite substance for precipitation, the water vapor isotope composition directly affects the precipitation isotope composition. If the isotopic composition of the precipitation at the bottom of clouds follows equilibrium fractionation with ambient water vapor, we can estimate the precipitation isotopes at different heights. In this paper, we use the IASI-derived δD and temperature data at different heights to calculate the isotopic values of precipitation through equilibrium fractionation (Figure 7). The seasonal distribution of the IAE of precipitation shows that the IAE exists in all seasons with a wider spatial domain in JJA. The precipitation IAE is more widely distributed than the water vapor IAE, indicating that the IAE in water vapor can be transferred to the IAE in precipitation. Compared to the reported IAE cases in precipitation [15], the potential spatial distribution of the IAE in this study is generally wide. Logically, the observed IAE should be in the mountainous area with a surface altitude gradient, so the theoretical distribution should be verified to the actual topography.
It should be noted that this is only a theoretical calculation considering equilibrium fractionation, and that the actual fractionation in the air may be more complex. Besides the moisture transport on a large scale, the local controlling cannot be ignored. The local factors of below-cloud evaporation and moisture recycling may also modify the altitude effect. For example, when the below-cloud evaporation is enhanced in arid high mountains [44], as in some plateaus in the Northwest Qinghai–Tibet Plateau, the IAE is likely to occur; when the recycling moisture is relatively strong, with isotopically depleted water sources at a low altitude, or relatively strong, with enriched water sources at a high altitude [21], this may also promote the IAE in mountainous regions. The system that sees water vapor turn to precipitation provides an additional perspective from which to understand atmospheric processes.
The climate proxies of stable water isotopes are usually associated with precipitation, with spatial and temporal discontinuity, and the environmental information obtained from precipitation is assumed to be kept in tree rings, speleothems, ice cores and other proxies. Under a changing climate, precipitation extremes have been widely enhanced [45], and there has been an increase in the role of short-time strong precipitation, especially in arid conditions. Here, we showed the frequency of IAE days, instead of the annual or seasonal average IAE strength, which is more informative regarding the synoptic scales of precipitation. Regarding the implication of short-term atmospheric activities, especially the effect of precipitation extremes on isotope paleoaltimetry, the potential uncertainty of changing isotope and altitude gradients should be considered.

5. Conclusions

In this paper, we examined the frequency of the IAE in water vapor using the Interferometer for Atmospheric Sounding in the Troposphere Infrared (IASI), and analyzed the potential impact of the IAE on precipitation at a global scale. Comparing the averages, the frequency of the IAE provided more synoptic information about the IAE, and the spatial distribution was found to be large, especially in North America and from North Africa to Central Asia. Both the diurnal and seasonal variability in the IAE days were examined, and this phenomenon was more pronounced in the daytime and JJA. The spatial and temporal patterns of the IAE of water vapor were found to be associated with strong convection activity in warm periods, i.e., the daytime and summer. In addition, we analyzed the effect of different thresholds on the IAE, demonstrating that the smaller the threshold, the more widespread the occurrence of the IAE. Finally, we converted water vapor δD to precipitation δD via equilibrium fractionation and then examined the potential presence of the IAE in precipitation. The seasonal distribution of the IAE of precipitation showed that the IAE exists in all seasons, with a wider spatial domain in JJA. The precipitation IAE is more widely distributed than the water vapor IAE, indicating that the IAE in water vapor can be transferred to the IAE in precipitation. The potential uncertainty of the changing isotope and altitude gradient should be considered in paleo-altitude reconstructions.

Supplementary Materials

The following supporting information can be downloaded at: https://www.mdpi.com/article/10.3390/rs15184533/s1, Figure S1: Spatial distribution of frequency of IAE days in valid days with threshold 0‰ for each season (a) MAM, (b) JJA, (c) SON, and (d) DJF) during 2015–2020, Figure S2: Spatial distribution of frequency of IAE days in valid days with a threshold 10‰ for each season (a) MAM, (b) JJA, (c) SON, and (d) DJF) during 2015–2020.

Author Contributions

Conceptualization, S.W.; methodology, S.W.; software, G.Y.; validation, Y.Q., H.L. and S.W.; formal analysis, G.Y.; investigation, H.L.; resources, S.W.; data curation, G.Y.; writing—original draft preparation, G.Y.; writing—review and editing, S.W. and Y.X.; visualization, G.Y.; supervision, S.W.; project administration, S.W. and M.Z.; funding acquisition, S.W. All authors have read and agreed to the published version of the manuscript.

Funding

This research was funded by the National Natural Science Foundation of China (No. 41971034 and 42261008) and the Foundation for Distinguished Young Scholars of Gansu Province (20JR10RA112).

Data Availability Statement

The IASI data is available at https://dx.doi.org/10.35097/495.

Acknowledgments

We thank Christopher J. Diekmann, Matthias Schneider and Benjamin Ertl (Karlsruhe Institute of Technology) for providing the satellite-based isotope data.

Conflicts of Interest

The authors declare no conflict of interest.

References

  1. Brenner, A.; Fu, R.; Evans, D.; Smirnov, A.; Trubko, R.; Rose, I. Paleomagnetic evidence for modern-like plate motion velocities at 3.2 Ga. Sci. Adv. 2020, 6, eaaz8670. [Google Scholar] [CrossRef] [PubMed]
  2. Lippert, P.; Zhao, X.; Coe, R.; Lo, C. Palaeomagnetism and 40Ar/39Ar geochronology of upper Palaeogene volcanic rocks from central Tibet: Implications for the central Asia inclination anomaly, the palaeolatitude of Tibet and post-50 Ma shortening within Asia. Geophys. J. Int. 2011, 184, 131–161. [Google Scholar] [CrossRef]
  3. Li, J.; Song, X. Tearing of Indian mantle lithosphere from high-resolution seismic images and its implications for lithosphere coupling in southern Tibet. Proc. Natl. Acad. Sci. USA 2018, 115, 8296–8300. [Google Scholar] [CrossRef] [PubMed]
  4. Xiong, Z.; Liu, X.; Ding, L.; Farnsworth, A.; Spicer, R.; Xu, Q.; Valdes, P.; He, S.; Zeng, D.; Wang, C.; et al. The rise and demise of the Paleogene central Tibetan valley. Sci. Adv. 2022, 8, eabj0944. [Google Scholar] [CrossRef] [PubMed]
  5. Jellinek, A.; Lenardic, A.; Pierrehumbert, R. Ice, fire, or fizzle: The climate footprint of Earth’s supercontinental cycles. Geochem. Geophys. Geosyst. 2020, 21, e2019GC008464. [Google Scholar] [CrossRef]
  6. Farnsworth, A.; Lunt, D.; Robinson, S.; Valdes, P.; Roberts, W.; Clift, P.; Markwick, P.; Su, T.; Wrobel, N.; Bragg, F.; et al. Past East Asian monsoon evolution controlled by paleogeography, not CO2. Sci. Adv. 2019, 5, eaax1697. [Google Scholar] [CrossRef]
  7. Farnsworth, A.; Valdes, P.; Spicer, R.; Ding, L.; Witkowski, C.; Lauretano, V.; Su, T.; Li, S.; Li, S.; Zhou, Z. Paleoclimate model-derived thermal lapse rates: Towards increasing precision in paleoaltimetry studies. Earth Planet. Sci. Lett. 2021, 564, 116903. [Google Scholar] [CrossRef]
  8. Meyer, H. A review of paleotemperature–lapse rate methods for estimating paleoelevation from fossil floras. Rev. Mineral. Geochem. 2007, 66, 155–171. [Google Scholar] [CrossRef]
  9. Spicer, R.; Su, T.; Valdes, P.; Farnsworth, A.; Wu, F.; Shi, G.; Spicer, T.; Zhou, Z. The topographic evolution of the Tibetan region as revealed by palaeontology. Palaeobio. Palaeoenv. 2021, 101, 213–243. [Google Scholar] [CrossRef]
  10. Botsyun, S.; Sepulchre, P.; Donnadieu, Y.; Risi, C.; Licht, A.; Rugenstein, J. Revised paleoaltimetry data show low Tibetan Plateau elevation during the Eocene. Science 2019, 363, eaaq1436. [Google Scholar] [CrossRef]
  11. Dar, T.; Rai, N.; Bhat, M.A.; Kumar, S.; Jahan, A. Surface water isoscape modeling in the Himalayan region: An alternative for moisture source investigation, hydrograph separation, and paleolatitude estimation. Water Resour. Res. 2023, 59, e2022WR033572. [Google Scholar] [CrossRef]
  12. Farnsworth, A.; Valdes, P.; Ding, L.; Spicer, R.; Li, S.; Su, T.; Li, S.; Witkowski, C.; Xiong, Z. Limits of oxygen isotope palaeoaltimetry in Tibet. Earth Planet. Sci. Lett. 2023, 606, 118040. [Google Scholar] [CrossRef]
  13. Tripti, M.; Lambs, L.; Moussa, I.; Corenblit, D. Evidence of elevation effect on stable isotopes of water along highlands of a humid tropical mountain belt (Western Ghats, India) experiencing monsoonal climate. J. Hydrol. 2019, 573, 469–485. [Google Scholar] [CrossRef]
  14. Jiao, Y.; Liu, C.; Gao, X.; Xu, Q.; Ding, Y.; Liu, Z. Impacts of moisture sources on the isotopic inverse altitude effect and amount of precipitation in the Hani Rice Terraces region of the Ailao Mountains. Sci. Total Environ. 2019, 687, 470–478. [Google Scholar] [CrossRef]
  15. Jing, Z.; Yu, W.; Lewis, S.; Thompson, L.; Xu, J.; Zhang, J.; Xu, B.; Wu, G.; Ma, Y.; Wang, Y.; et al. Inverse altitude effect disputes the theoretical foundation of stable isotope paleoaltimetry. Nat. Commun. 2022, 13, 4371. [Google Scholar] [CrossRef]
  16. Deng, T.; Ding, L. Paleoaltimetry reconstructions of the Tibetan Plateau: Progress and contradictions. Natl. Sci. Rev. 2015, 2, 417–437. [Google Scholar] [CrossRef]
  17. Hoke, G. Geochronology transforms our view of how Tibet’s southeast margin evolved. Geology 2018, 46, 95–96. [Google Scholar] [CrossRef]
  18. Moore, M.; Kuang, Z.; Blossey, P. A moisture budget perspective of the amount effect. Geophys. Res. Lett. 2014, 41, 1329–1335. [Google Scholar] [CrossRef]
  19. Shen, H.; Poulsen, C. Precipitation δ18O on the Himalaya–Tibet orogeny and its relationship to surface elevation. Clim. Past 2019, 15, 169–187. [Google Scholar] [CrossRef]
  20. Spicer, R.; Su, T.; Valdes, P.; Farnsworth, A.; Wu, F.; Shi, G.; Spicer, T.; Zhou, Z. Why ‘the uplift of the Tibetan Plateau’ is a myth. Natl. Sci. Rev. 2021, 8, nwaa091. [Google Scholar] [CrossRef]
  21. Kong, Y.; Pang, Z. A positive altitude gradient of isotopes in the precipitation over the Tianshan Mountains: Effects of moisture recycling and sub-cloud evaporation. J. Hydrol. 2016, 542, 222–230. [Google Scholar] [CrossRef]
  22. Sodemann, H.; Aemisegger, F.; Pfahl, S.; Bitter, M.; Corsmeier, U.; Feuerle, T.; Graf, P.; Hankers, R.; Hsiao, G.; Schulz, H.; et al. The stable isotopic composition of water vapor above Corsica during the HyMeX SOP1 campaign: Insight into vertical mixing processes from lower-tropospheric survey flights. Atmos. Chem. Phys. 2017, 17, 6125–6151. [Google Scholar] [CrossRef]
  23. Galewsky, J. Using stable isotopes in water vapor to diagnose relationships between lower-tropospheric stability, mixing, and low-cloud cover near the island of Hawaii. Geophys. Res. Lett. 2018, 45, 297–305. [Google Scholar] [CrossRef]
  24. Thurnherr, I.; Kozachek, A.; Graf, P.; Weng, Y.; Bolshiyanov, D.; Landwehr, S.; Pfahl, S.; Schmale, J.; Sodemann, H.; Steen-Larsen, H.; et al. Meridional and vertical variations of the water vapor isotopic composition in the marine boundary layer over the Atlantic and Southern Ocean. Atmos. Chem. Phys. 2020, 20, 5811–5835. [Google Scholar] [CrossRef]
  25. Worden, J.; Bowman, K.; Noone, D.; Beer, R.; Clough, S.; Eldering, A.; Fisher, B.; Goldman, A.; Gunson, M.; Herman, R.; et al. Tropospheric Emission Spectrometer observations of the tropospheric HDO/H2O ratio: Estimation approach and characterization. J. Geophys. Res. 2006, 111, D16309. [Google Scholar] [CrossRef]
  26. Worden, J.; Noone, D.; Bowman, K. Importance of rain evaporation and continental convection in the tropical water cycle. Nature 2007, 445, 528–532. [Google Scholar] [CrossRef] [PubMed]
  27. Risi, C.; Bony, S.; Vimeux, F.; Frankenberg, C.; Noone, D.; Worden, J. Understanding the Sahelian water budget through the isotopic composition of water vapor and precipitation. J. Geophys. Res. Atmos. 2010, 115, D24110. [Google Scholar] [CrossRef]
  28. Risi, C.; Landais, A.; Winkler, R.; Vimeux, F. Can we determine what controls the spatiotemporal distribution of d-excess and 17O-excess in precipitation using the LMDZ general circulation model? Clim. Past 2013, 9, 2173–2193. [Google Scholar] [CrossRef]
  29. Lacour, J.; Flamant, C.; Risi, C.; Clerbaux, C.; Coheur, P. Importance of the Saharan heat low in controlling the North Atlantic free tropospheric humidity budget deduced from IASI δD observations. Atmos. Chem. Phys. 2017, 17, 9645–9663. [Google Scholar] [CrossRef]
  30. Lacour, J.; Risi, C.; Worden, J.; Clerbaux, C.; Coheur, P. Importance of depth and intensity of convection on the isotopic composition of water vapor as seen from IASI and TES δD observations. Earth Planet. Sci. Lett. 2018, 481, 387–394. [Google Scholar] [CrossRef]
  31. Toride, K.; Yoshimura, K.; Tada, M.; Diekmann, C.; Ertl, B.; Khosrawi, F.; Schneider, M. Potential of mid-tropospheric water vapor isotopes to improve large-scale circulation and weather predictability. Geophys. Res. Lett. 2021, 48, e2020GL091698. [Google Scholar] [CrossRef]
  32. Bonne, J.; Steen-Larsen, H.; Risi, C.; Werner, M.; Sodemann, H.; Lacour, J.; Fettweis, X.; Cesana, G.; Delmotte, M.; Cattani, O.; et al. The summer 2012 Greenland heat wave: In situ and remote sensing observations of water vapor isotopic composition during an atmospheric river event. J. Geophys. Res. Atmos. 2015, 120, 2970–2989. [Google Scholar] [CrossRef]
  33. Tuinenburg, O.; Risi, C.; Lacour, J.; Schneider, M.; Wiegele, A.; Worden, J.; Kurita, N.; Duvel, J.; Deutscher, N.; Bony, S.; et al. Moist processes during MJO events as diagnosed from water isotopic measurements from the IASI satellite. J. Geophys. Res. Atmos. 2015, 120, 10619–10636. [Google Scholar] [CrossRef]
  34. Lacour, J.; Clarisse, L.; Worden, J.; Schneider, M.; Barthlott, S.; Hase, F.; Risi, C.; Clerbaux, C.; Hurtmans, D.; Coheur, P. Cross-validation of IASI/MetOp derived tropospheric δD with TES and ground-based FTIR observations. Atmos. Meas. Tech. 2015, 8, 1447–1466. [Google Scholar] [CrossRef]
  35. Diekmann, C.; Schneider, M.; Ertl, B.; Hase, F.; Garcia, O.; Khosrawi, F.; Sepulveda, E.; Knippertz, P.; Braesicke, P. The global and multi-annual MUSICA IASI {H2O, δD} pair dataset. Earth Syst. Sci. Data 2021, 13, 5273–5292. [Google Scholar] [CrossRef]
  36. Lacour, J.; Risi, C.; Clarisse, L.; Bony, S.; Hurtmans, D.; Clerbaux, C.; Coheur, P. Mid-tropospheric δD observations from IASI/MetOp at high spatial and temporal resolution. Atmos. Chem. Phys. 2012, 12, 10817–10832. [Google Scholar] [CrossRef]
  37. Clerbaux, C.; Boynard, A.; Clarisse, L.; George, M.; Hadji-Lazaro, J.; Herbin, H.; Hurtmans, D.; Pommier, M.; Razavi, A.; Turquety, S.; et al. Monitoring of atmospheric composition using the thermal infrared IASI/MetOp sounder. Atmos. Chem. Phys. 2009, 9, 6041–6054. [Google Scholar] [CrossRef]
  38. Diekmann, C.J.; Schneider, M.; Ertl, B. Regular 1° × 1° Re-Gridded MUSICA IASI Water Isotopologue Pair Dataset (a Posteriori Processing Version 2); Institute of Meteorology and Climate Research, Atmospheric Trace Gases and Remote Sensing (IMK-ASF), Karlsruhe Institute of Technology (KIT): Karlsruhe, Germany, 2021. [Google Scholar] [CrossRef]
  39. Schneider, M.; Hase, F.; Blumenstock, T. Ground-based remote sensing of HDO/H2O ratio profiles: Introduction and validation of an innovative retrieval approach, Atmos. Chem. Phys. 2006, 6, 4705–4722. [Google Scholar] [CrossRef]
  40. Schneider, M.; González, Y.; Dyroff, C.; Christner, E.; Wiegele, A.; Barthlott, S.; García, O.; Sepúlveda, E.; Hase, F.; Andrey, J.; et al. Empirical validation and proof of added value of MUSICA’s tropospheric δD remote sensing products. Atmos. Meas. Tech. 2015, 8, 483–503. [Google Scholar] [CrossRef]
  41. Horita, J.; Wesolowski, D. Liquid-vapor fractionation of oxygen and hydrogen isotopes of water from the freezing to the critical temperature. Geochim. Cosmochim. Acta 1994, 58, 3425–3437. [Google Scholar] [CrossRef]
  42. Araguás-Araguás, L.; Froehlich, K.; Rozanski, K. Deuterium and oxygen-18 isotope composition of precipitation and atmospheric moisture. Hydrol. Process. 2000, 14, 1341–1355. [Google Scholar] [CrossRef]
  43. Bowen, G.; Wilkinson, B. Spatial distribution of δ18O in meteoric precipitation. Geology 2002, 30, 315–318. [Google Scholar] [CrossRef]
  44. Wang, L.; Wang, S.; Zhang, M.; Duan, L.; Xia, Y. An hourly-scale assessment of sub-cloud evaporation effect on precipitation isotopes in a rainshadow oasis of northwest China. Atmos. Res. 2022, 274, 106202. [Google Scholar] [CrossRef]
  45. Yin, J.; Guo, S.; Wang, J.; Chen, J.; Zhang, Q.; Gu, L.; Yang, Y.; Tian, J.; Xiong, L.; Zhang, Y. Thermodynamic driving mechanisms for the formation of global precipitation extremes and ecohydrological effects. Sci. China Earth Sci. 2023, 66, 92–110. [Google Scholar] [CrossRef]
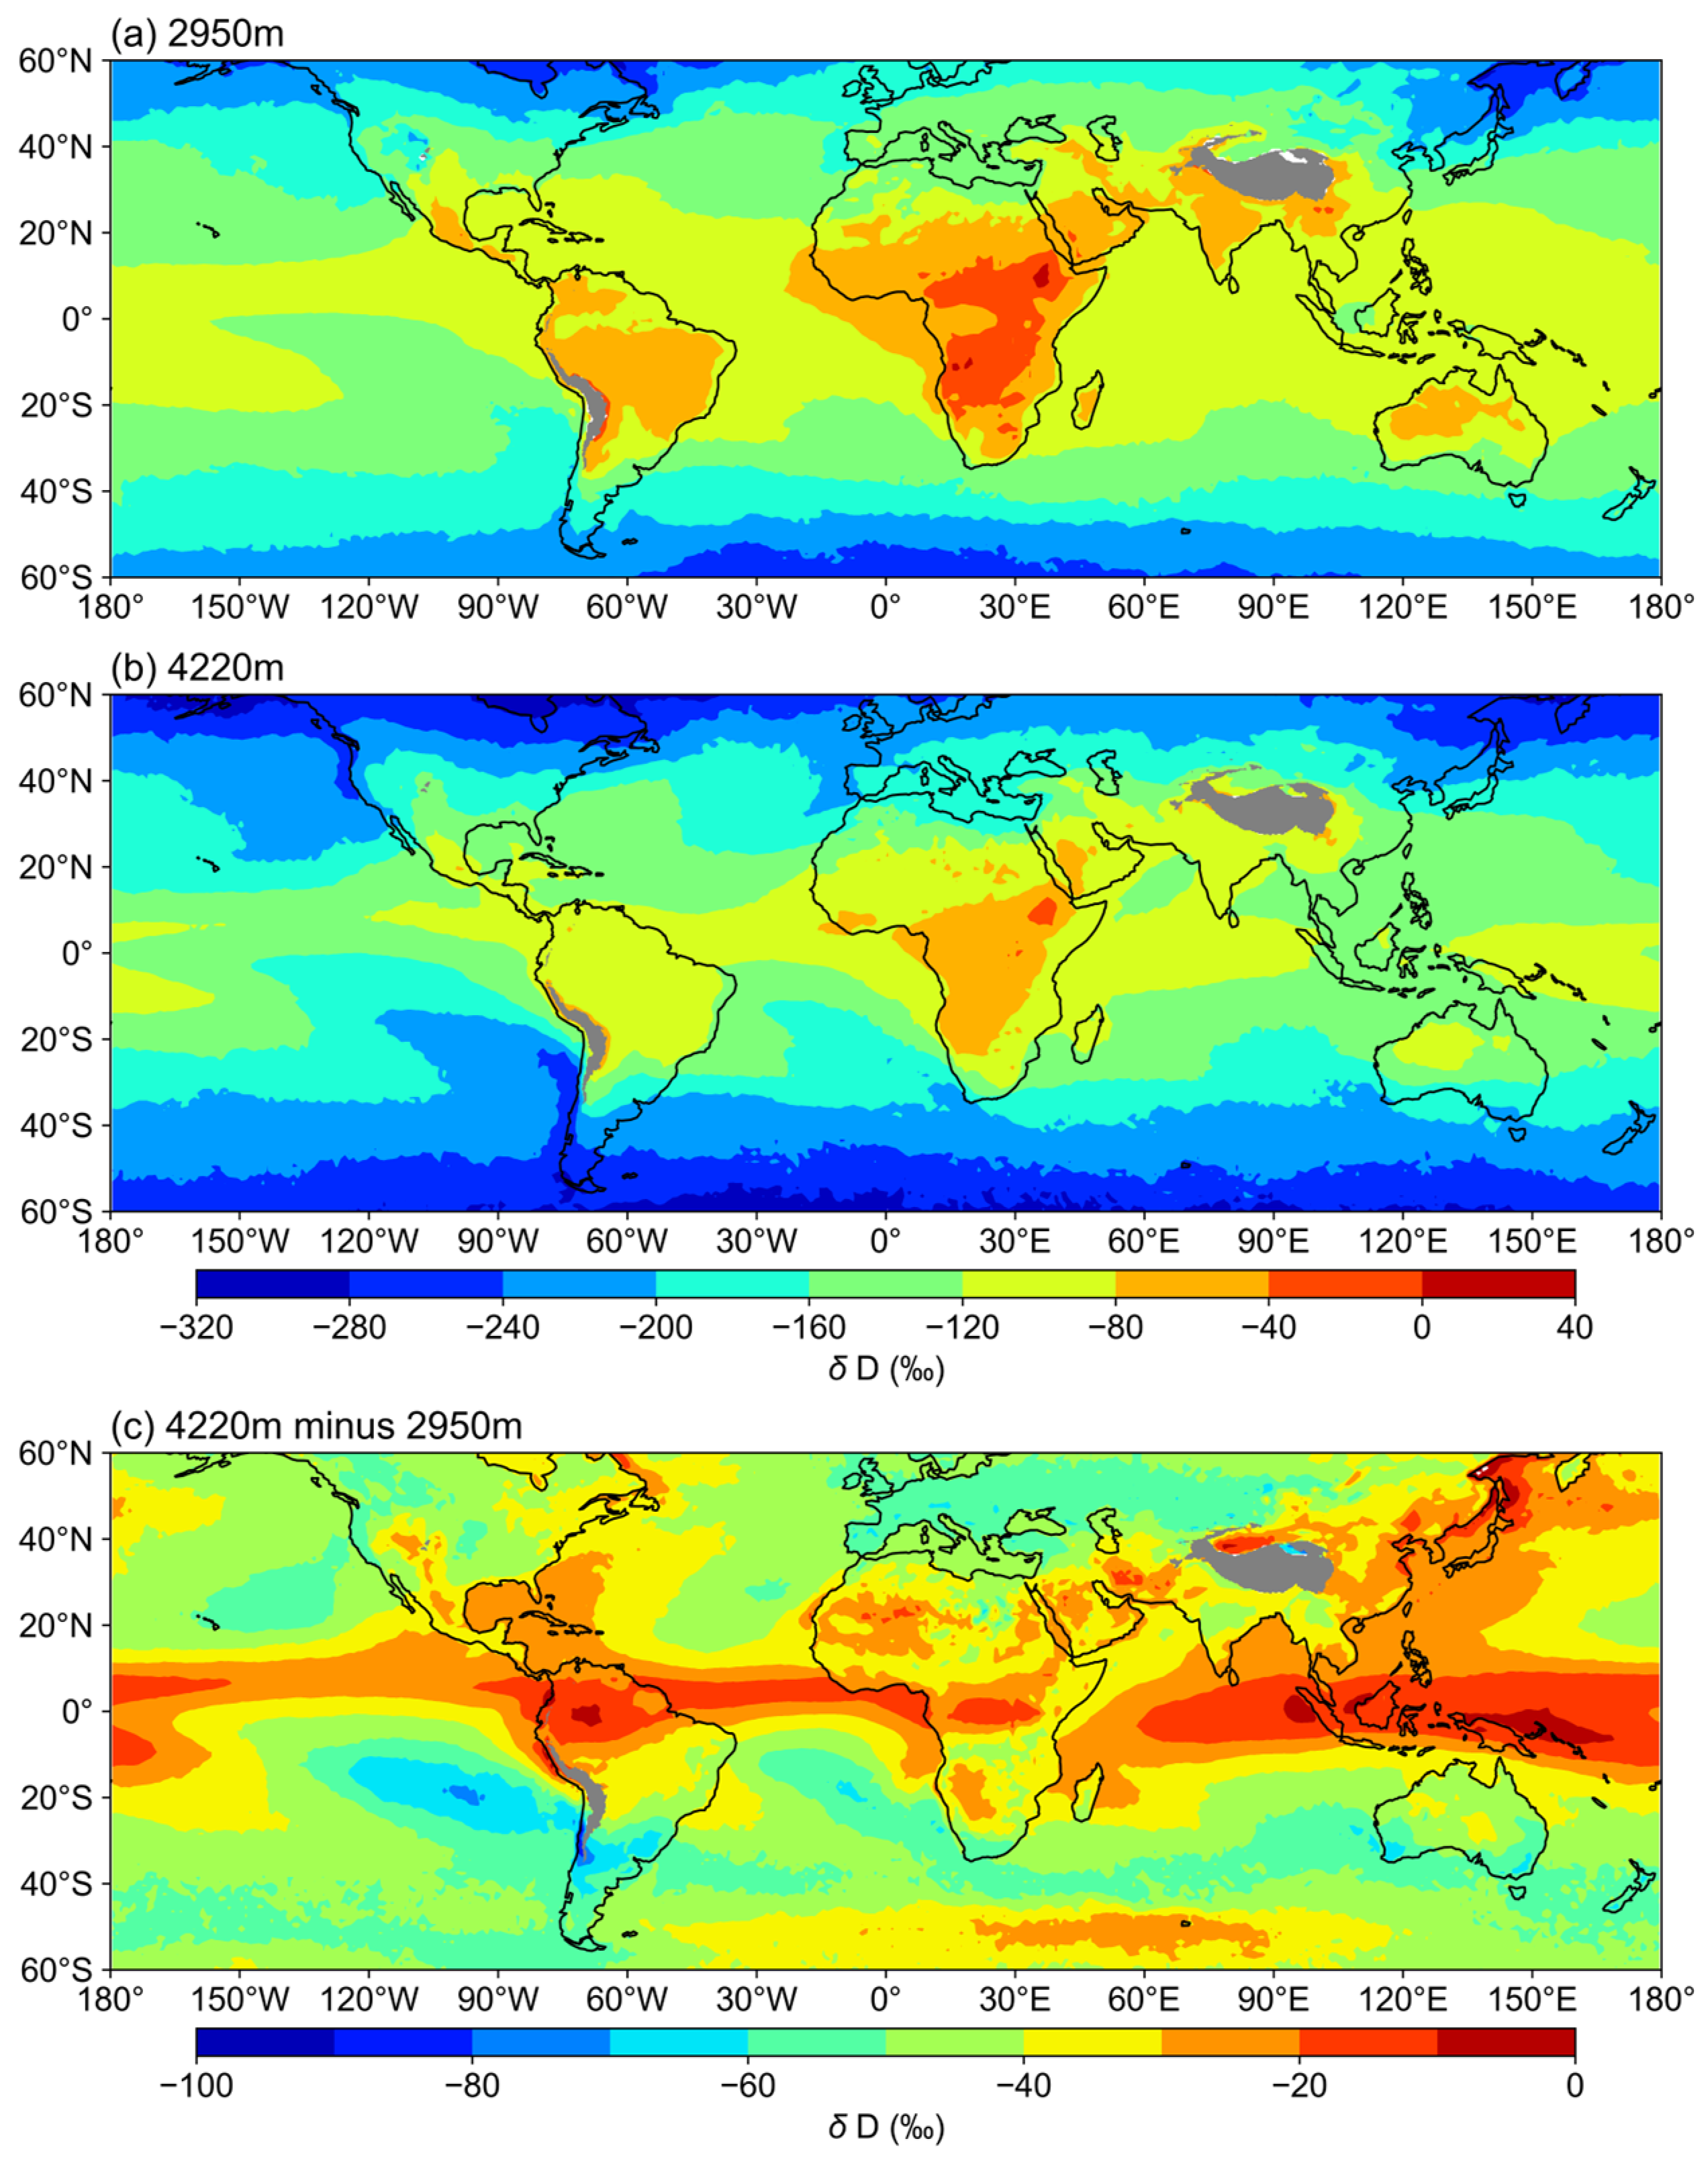
Figure 1. Spatial distribution of average δD in water vapor at 2950 m (a) and 4220 m (b), as well as the difference (c) during 2015–2020. Shaded areas denote altitudes higher than 2950 m.
Remotesensing 15 04533 g001
Figure 2. Annual spatial distribution of frequency of IAE days in valid days during 2015–2020. Shaded areas denote altitudes higher than 2950 m.
Remotesensing 15 04533 g002
Figure 3. Annual spatial distribution of frequency of IAE days in valid days during daytime (a) and nighttime, (b) during 2015–2020. Shaded areas denote altitudes higher than 2950 m.
Remotesensing 15 04533 g003
Figure 4. Spatial distributions of frequency of IAE days in valid days for each season ((a) MAM, (b) JJA, (c) SON, and (d) DJF) during 2015–2020.
Remotesensing 15 04533 g004
Figure 5. Spatial distributions of frequency of IAE days in valid days for each season ((a,b) MAM, (c,d) JJA, (e,f) SON, (g,h) DJF) during daytime (left) and nighttime (right), during 2015–2020.
Remotesensing 15 04533 g005
Figure 6. Annual spatial distribution of the frequency of IAE days in valid days for different thresholds of 0‰ (a) and 10‰ (b) during 2015–2020. Shaded areas indicate elevations higher than 2950 m.
Remotesensing 15 04533 g006
Figure 7. Spatial distribution of precipitation δD difference for each season ((a) MAM, (b) JJA, (c) SON, and (d) DJF) during 2015–2020.
Remotesensing 15 04533 g007
Disclaimer/Publisher’s Note: The statements, opinions and data contained in all publications are solely those of the individual author(s) and contributor(s) and not of MDPI and/or the editor(s). MDPI and/or the editor(s) disclaim responsibility for any injury to people or property resulting from any ideas, methods, instructions or products referred to in the content.