Article

Combined Retrievals of Turbidity from Sentinel-2A/B and Landsat-8/9 in the Taihu Lake through Machine Learning

1
Key Laboratory of Infrared System Detection and Imaging Technologies, Shanghai Institute of Technical Physics, Chinese Academy of Sciences, Shanghai 200083, China
2
University of Chinese Academy of Sciences, Beijing 100049, China
3
Shanghai Academy of Environmental Sciences, Shanghai 200233, China
4
Shanghai Environment Monitoring Center, Shanghai 200235, China
*
Author to whom correspondence should be addressed.
Remote Sens. 2023, 15(17), 4333; https://doi.org/10.3390/rs15174333
Submission received: 25 July 2023 / Revised: 27 August 2023 / Accepted: 29 August 2023 / Published: 2 September 2023

Abstract

:
Lakes play a crucial role in the earth’s ecosystems and human activities. While turbidity is not a direct biochemical indicator of lake water quality, it is relatively easy to measure and indicates trophic status and lake health. Although ocean color satellites have been widely used to monitor water color parameters, their coarse spatial resolution makes it hard to capture the fine spatial variability of turbidity in lakes. The combination of Sentinel-2 and Landsat provides an opportunity to monitor lake turbidity with high spatial and temporal resolution. This study aims to generate consistent turbidity products in Taihu Lake from 2018 to 2022 using the Multispectral Instrument (MSI) on board Sentinel-2A/B and the Operational Land Imager (OLI) on board Landsat-8/9. We first tested the performance of three atmospheric correction methods to retrieve consistent reflectance from MSI and OLI images. We found that the Rayleigh correction and a subtraction of the SWIR band from Rayleigh-corrected reflectance can generate the most consistent reflectance (the coefficient of determination (R2) > 0.84, the mean absolution percentage error (MAPE) < 7%, the median error (ME) < 0.0035, and slope > 0.92). Machine learning models outperformed an existing semi-analytical retrieval algorithm in retrieving turbidity (MSI: R2 = 0.92, MAPE = 18.78%, and OLI: R2 = 0.93, MAPE = 16.20%). The consistency of turbidity from the same-day MSI and OLI images was also satisfactory (N = 3110 and MAPE = 26.48%). The distribution of turbidity exhibited obvious spatial and seasonal variability in Taihu Lake from 2018 to 2022. The results show the potential of MSI and OLI when combined to monitor inland lake water quality.

1. Introduction

Lakes are widely distributed on the earth’s surface and are critical for the survival and development of human society. Lakes not only provide valuable freshwater resources but also have various ecological and environmental functions [1]. However, human activities and climate change have caused serious water quality problems in numerous lakes throughout the world, which directly affect human well-being [2]. For this reason, monitoring lake water quality parameters has important socioeconomic significance. Turbidity is closely associated with the nutritional status and primary productivity of the water body [3]. As an optical scattering indicator of water turbidity, turbidity is measured by detecting the scattering intensity of water and used as a rough indicator of fine suspended matter in water [4]. Although turbidity is one of the simplest measures of optical characteristics and pollution degree of a water body, traditional field sampling methods are difficult to capture the overall spatial and temporal changes of lake turbidity due to a limited number of points. In comparison, satellite observation has been widely used to provide long-term and large-scale water quality monitoring [5].
Generally, ocean color satellites, such as the Sea-Viewing Wide Field-of-View Sensor (SeaWiFS), Moderate Resolution Imaging Spectroradiometer (MODIS), and Medium Resolution Imaging Spectrometer (MERIS), have been successfully employed to analyze the turbidity distribution in coastal waters and inland lakes [6,7,8]. However, the coarse spatial resolution (250–1000 m) of ocean color instruments limits their use at small scales due to their insufficient ability to capture spatial details in turbidity. While moderate spatial resolution missions (10–100 m) were initially designed primarily for land applications, some researchers have carried out research using them to monitor the turbidity of water. For example, Goodin et al. [9] found that the SPOT-HRV2 red band has a good correlation with turbidity and mapped turbidity in the Tuttle Creek Reservoir in Kansas, USA. Bustamante et al. [10] predicted water turbidity from Landsat band 3 using generalized additive models. Zhou et al. [11] used a long-time series of Landsat images to retrieve urban water turbidity and analyze factors driving turbidity changes. Rodríguez-López et al. [12] combined in situ measurement of Secchi disk depth with Landsat images to develop empirical turbidity models in Araucanian lakes.
Recently, the new generation of sensors with several enhancements, such as the Multispectral Instrument (MSI) on board Sentinel-2A/B and the Operational Land Imager (OLI) on board Landsat-8/9, have become appealing instruments for inland water monitoring [13,14]. The OLI has nine spectral bands in the visible, near-infrared (NIR), and shortwave infrared (SWIR) with a spatial resolution of 30 m. While the revisit period of Landsat-8 is 16 days, it was improved to 8 days when Landsat-9 became operational in 2021. Compared to the OLI, the MSI has three additional red-edge bands, a spatial resolution of 10–60 m, and a 5-day revisit time. Although the OLI and MSI have finer spatial resolution than ocean color sensors, their low temporal resolution makes it challenging to frequently monitor quickly changing inland lakes.
Recent publications have demonstrated the capability of combining the MSI and OLI data for water quality parameter monitoring. MSI and OLI have similar spatial resolution and radiometric performances, and their combination can improve the revisit time to 2–3 days, which is comparable to the Ocean and Land Color Instrument (OLCI) on board Sentinel-3 and MODIS. For example, Ciancia et al. [15] trained and validated a Sentinel-2A MSI-based total suspended matter (TSM) model, then generated a MSI-OLI merged model by calibrating OLI data. Benjamin et al. [16] mapped water clarity in some lakes through harmonized images from Landsat-8 and Sentinel-2. Pahlevan et al. [17] assessed extensive Landsat-8 and Sentinel-2A/B aquatic products, including the top-of-atmosphere (TOA) reflectance, the remote-sensing reflectance ( R r s ), and water quality parameters. Nonetheless, several challenges remain in combing multiple moderate spatial resolution satellite missions to generate consistent turbidity products in inland lakes.
A mass of related research and field observation data has proved that the visible and near-infrared reflectance are elevated with increasing turbidity [18,19,20]. The accuracy of turbidity retrievals depends on the performance of atmospheric correction (AC) methods to recover R r s from at-sensor measurements. However, the common AC methods are not yet available for optically complex inland waters, and few attempts have been made to evaluate the performance of several specialized AC methods [21,22,23]. Thus, AC is one of the biggest challenges in creating consistent MSI-OLI turbidity products in inland waters. A second major challenge is to develop a specialized algorithm to retrieve turbidity in inland lakes from MSI and OLI Level-2 data. The number of MSI and OLI near-simultaneous nadir overpasses (n-SNO) is insufficient considering cloud coverage, which requires that the field data used for MSI and OLI modeling, respectively, be long-term stable. However, in inland lakes, the use of platforms for stationary water quality measurements is still incipient [24]. Regarding the estimation algorithm of turbidity, most models are empirical and rely on a strong correlation between turbidity and derived reflectance [25]. In fact, turbidity is often influenced by several matters such as chlorophyll-a (Chl-a), TSM, and colored dissolved organic matter (CDOM), so the relationship between turbidity and reflectance is not obvious when the optical or biochemical properties of water change [26]. Due to their good data mining capabilities, machine learning algorithms provide an alternative way to describe the nonlinear relationship between objective and feature variables.
The goal of this article is to generate consistent turbidity products in Taihu Lake in China from 2018 to 2022 using Sentinel-2A/B and Landsat-8/9. To achieve this goal, we began by calculating the agreement of reflectance derived from MSI and OLI to evaluate the performance of three AC methods. We then trained and calibrated machine learning models for retrieving turbidity using MSI and OLI datasets, respectively. Finally, we assessed the consistency of turbidity products and mapped turbidity in Taihu Lake from MSI and OLI images from 2018 to 2022. The overarching methodological framework is shown in Figure 1. Specifically, this study is innovative in the following three aspects:
(1)
Testing the performance of three aquatic AC methods to retrieve consistent reflectance products;
(2)
Developing a machine learning model for turbidity retrieval in Taihu Lake;
(3)
Proposing a method for evaluating the consistency of MSI and OLI products in inland water bodies.

2. Materials and Methods

2.1. Study Area

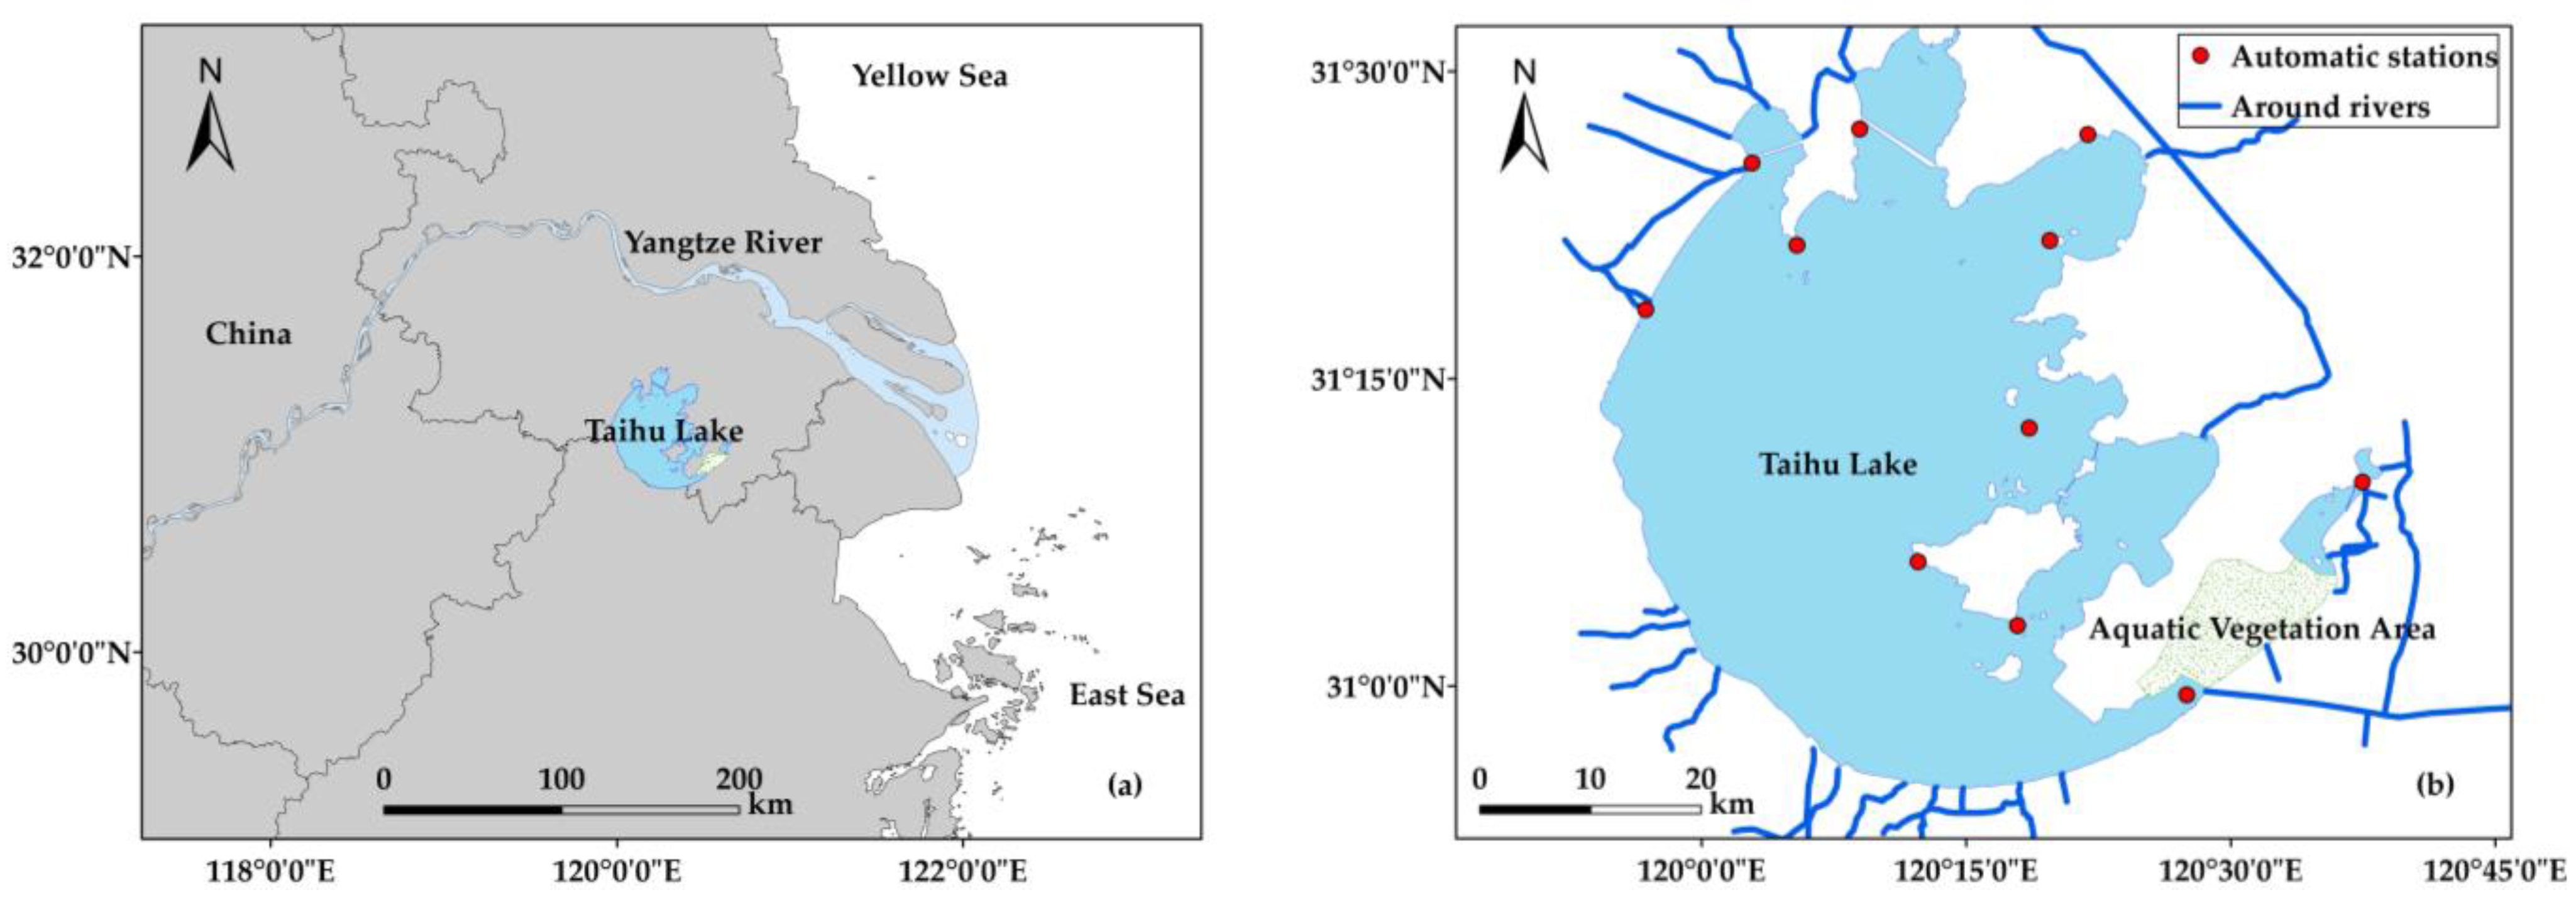
Taihu Lake is located in the Lower Reaches of the Yangtze River and is the third largest freshwater lake in China with a water surface area of 2338 km2 (between 30°55′–31°33′N and 119°52′–120°36′E, Figure 2). The lake’s average water depth is 1.9 m, and its maximum water depth is 3 m [27]. At present, the maximum length of Taihu Lake is 68 km, the average width is 35.7 km, and the total length of the shoreline is more than 393 km. The rapid economic development of the cities around Taihu Lake has led to the deterioration of water quality, which has an adverse impact on people’s drinking water. Although the government has taken some measures to improve water quality, algal blooms are still frequently observed [28]. Taihu Lake is characterized by varying turbidity due to inputs from rivers and sediment resuspension [29]. In this study, East Taihu is masked due to aquatic vegetation coverage.

2.2. Field Data

The turbidity data coincident with satellite overpasses was collected from the daily measurement data of automatic water quality monitoring stations in Taihu Lake. In this study, 11 stations distributed throughout the lake were considered (Figure 2). In each station, turbidity was measured by nephelometry [30]. The unit of measurement is nephelometric turbidity units (NTU). Specifically, a water sample is collected into the sample pool by the pump and mixed with a 400 NTU standard turbidity solution. The standard solution was prepared by mixing C 6 H 12 N 4 , N 2 H 6 S O 4 , and distilled water. A beam of light from an LED light with a wavelength of 860 nm passes through the sample pool. The intensity of scattered light is measured by a sensor positioned perpendicular to the emitted light. The turbidity of the water sample has a certain proportional relationship with the intensity of scattered light.

2.3. Satellite Data Acquisition and Processing

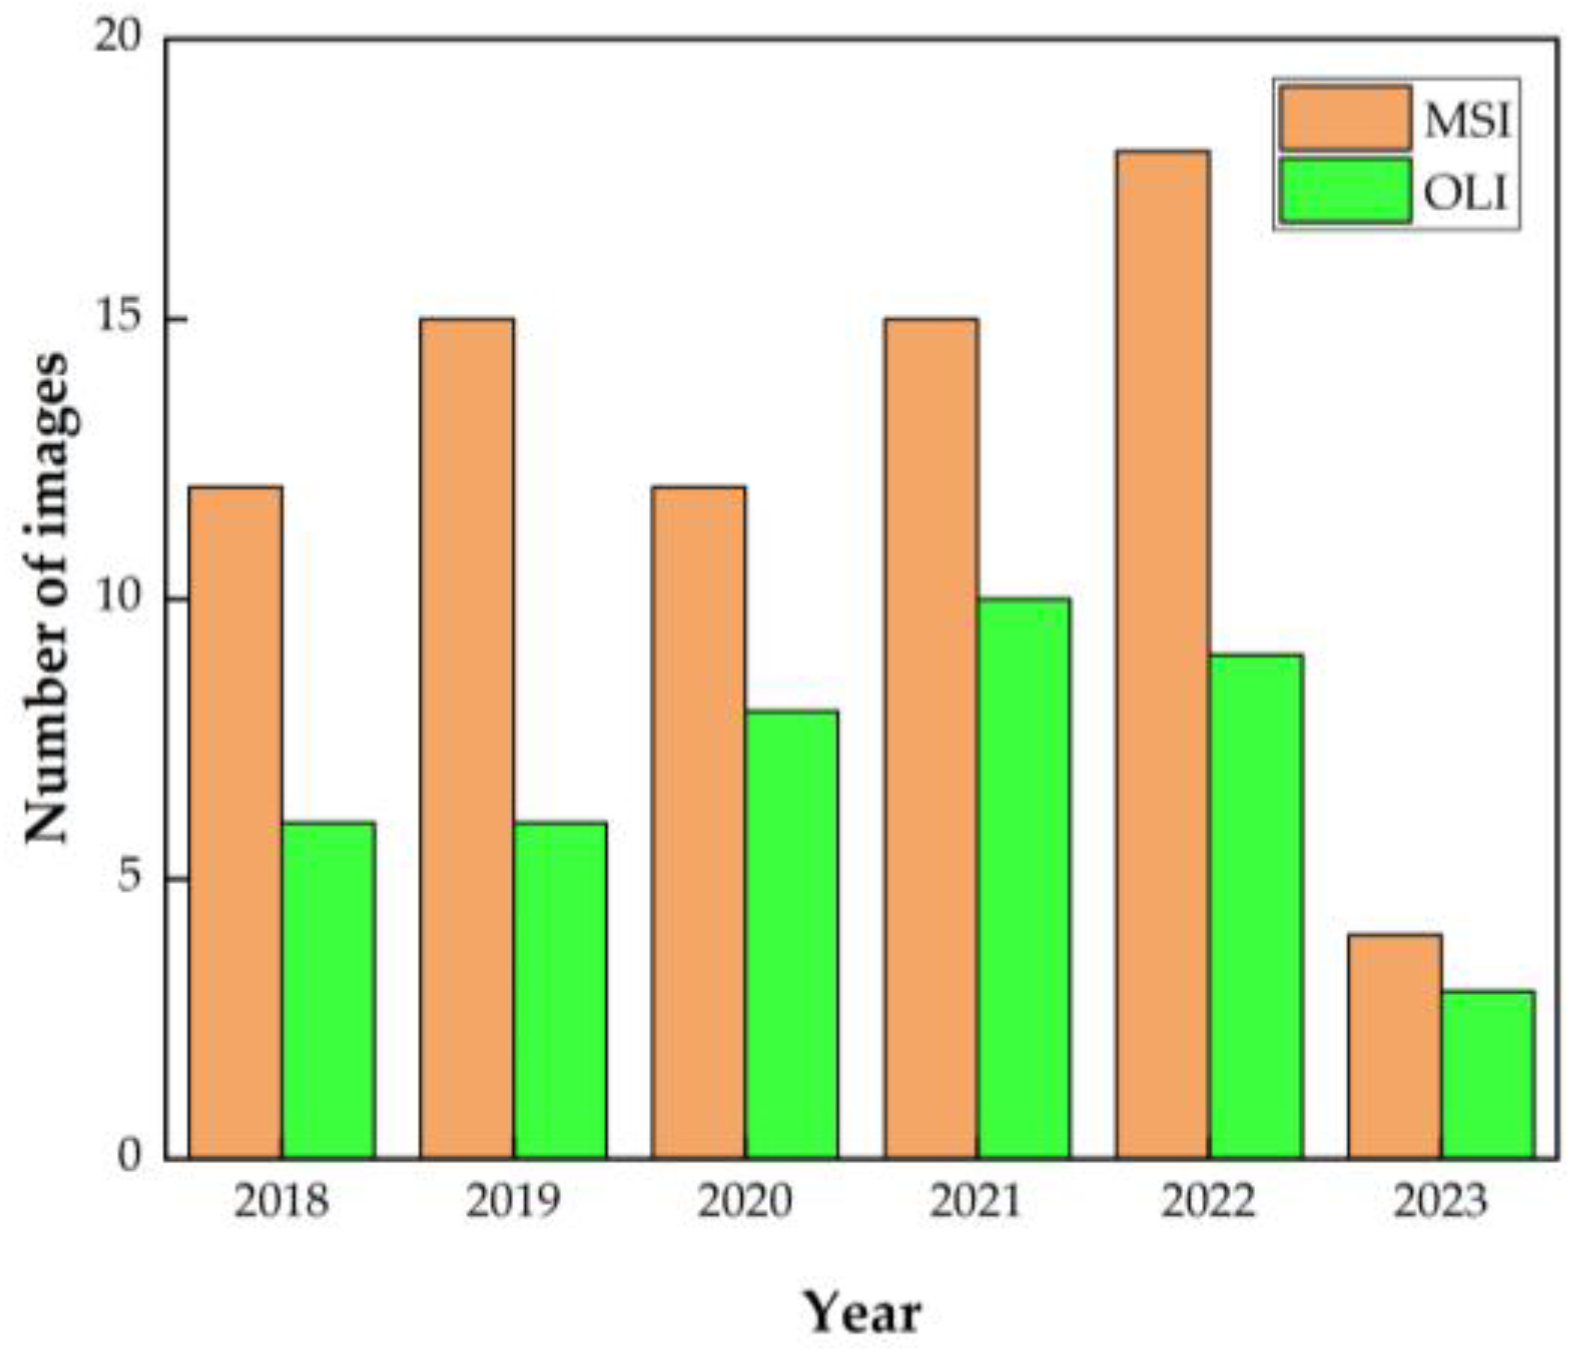
All available Level-1C Sentinel-2A/B and Level-1T Landsat-8/9 images from 2018 to January 2023 in Taihu Lake were downloaded from the Copernicus Open Access Hub (https://scihub.copernicus.eu/ accessed on 1 February 2023) and the United States Geological Survey (https://earthexploer.usgs.gov/ accessed on 1 February 2023), respectively(Figure 3). Details of MSI and OLI are given in Table 1. Ultimately, 76 MSI and 42 OLI data scenes with less than 30% cloud cover were obtained. Note that all images are TOA products. In this study, we tested three mature AC methods: the Case-2 Regional Coast Color (C2RCC) processor, the Dark Spectrum Fitting (DSF) algorithm, and Rayleigh Correction.
The C2RCC processor is based on neural networks and relies on a large database of simulated water-leaving reflectance and related TOA radiance [31]. We used C2RCC on the Sentinel Applications Platform (SNAP, version 9.0) software and set the salinity to 12 PSU. The DSF algorithm assumes that the atmosphere is homogeneous and estimates atmospheric path reflectance from the lowest TOA reflectance of multiple targets in all bands [32]. This algorithm has been integrated into the ACOLITE software, and the version we used is 20210802. The outputs of the C2RCC processor and the DSF algorithm were both R r s (sr−1). Rayleigh correction has been validated as an alternative AC method for application in inland waters in various studies [33,34,35]. Rayleigh correction is also available on the ACOLITE software. The outputs of the Rayleigh correction were Rayleigh-corrected reflectance ( R r c , dimensionless) instead of R r s . After correcting the absorption of water vapor and ozone as well as Rayleigh scattering, based on the assumption that the signals in the SWIR are dominated by aerosol signals, all R r c between visible and NIR are subtracted by R r c _ s w i r to get R r c [36]. We call this sample the aerosol correction of R r c the Rayleigh-SWIR.

2.4. Satellite Data to In Situ Match-Ups

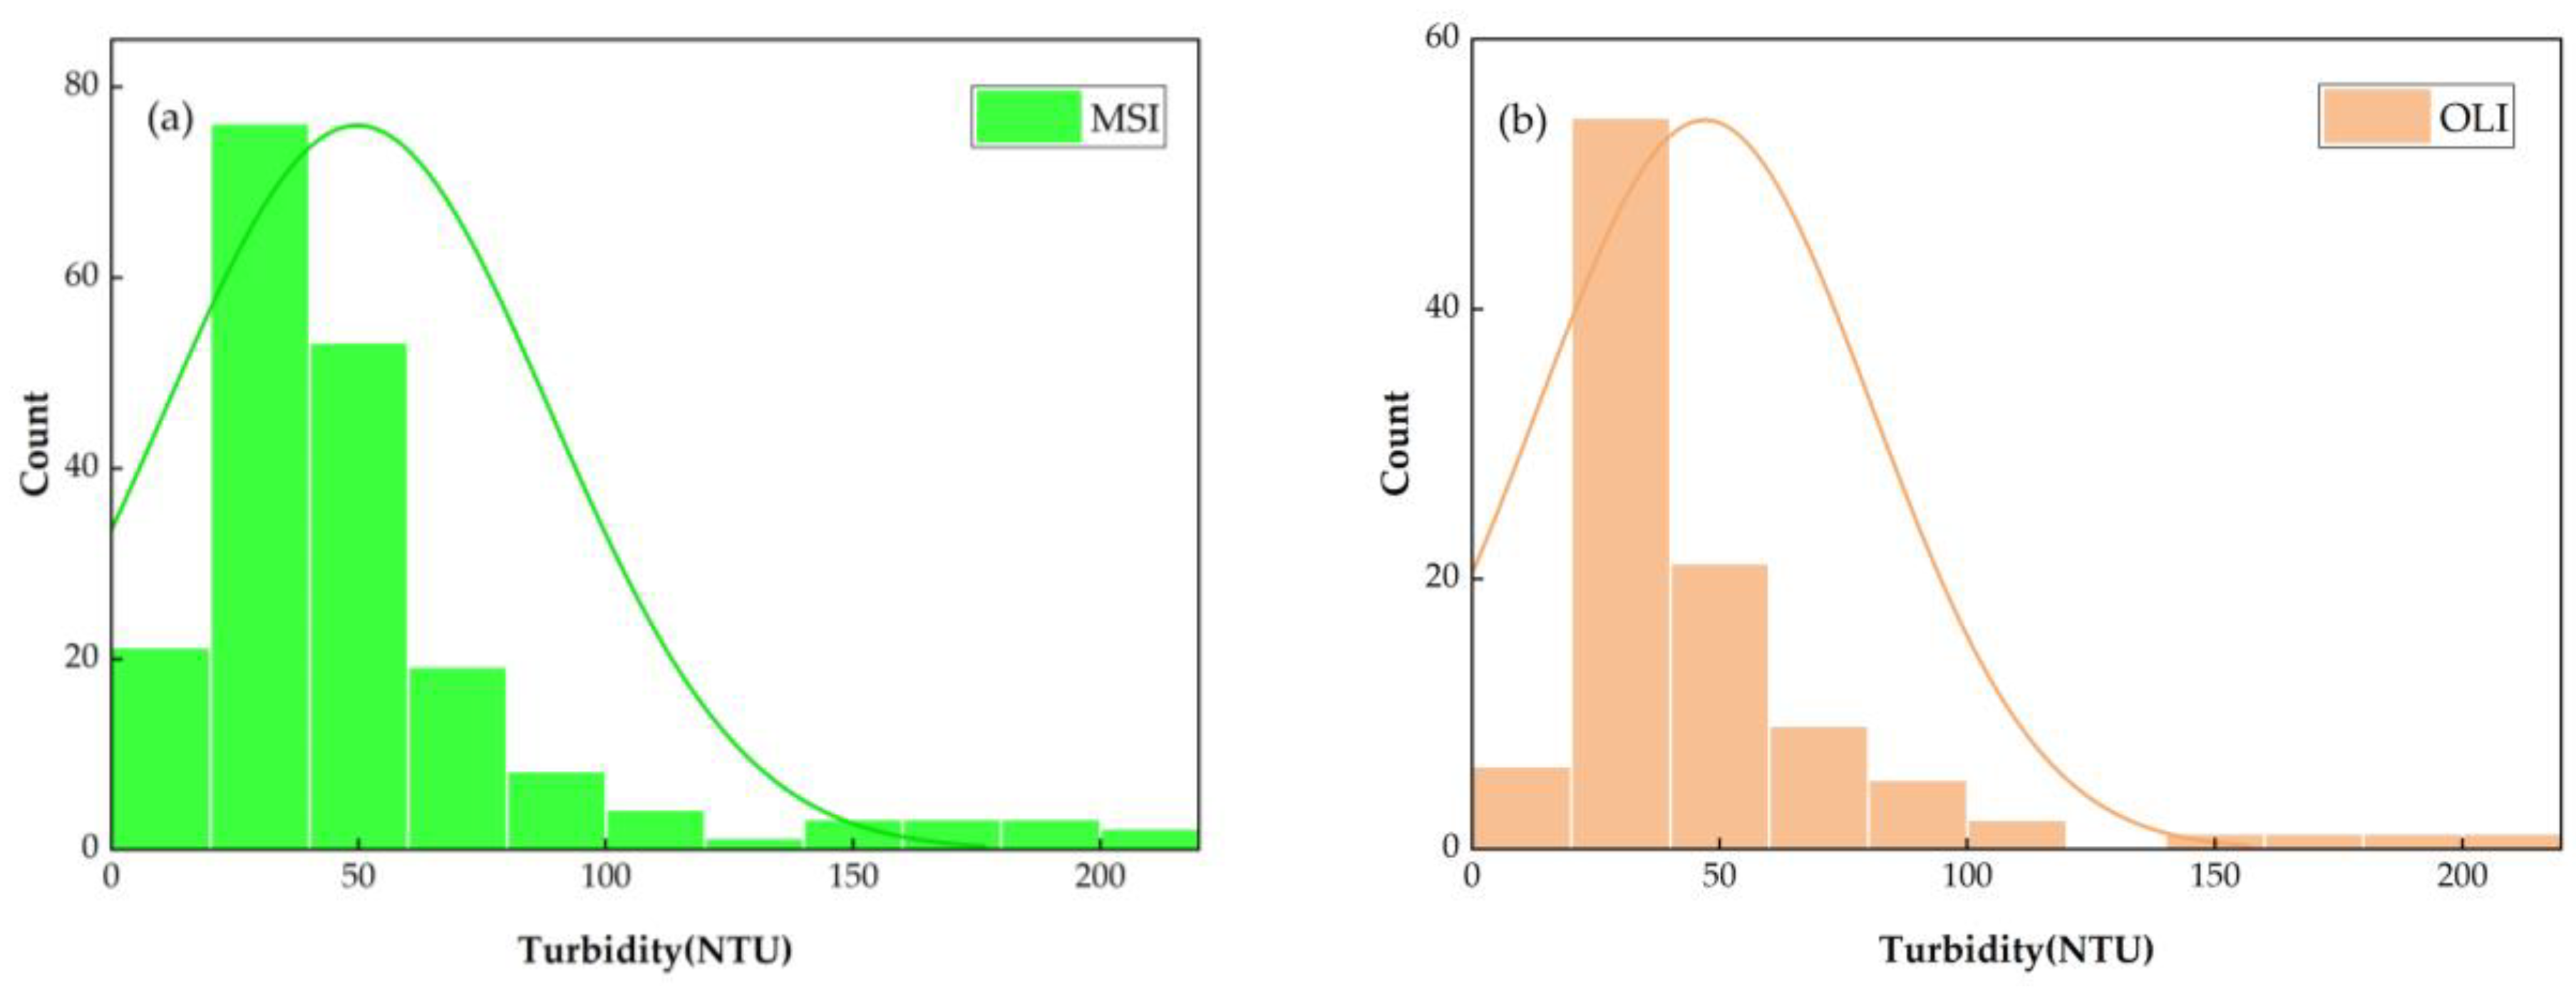
In general, match-ups between satellite and field data used a time window of ±3 h [37]. The overpass times for MSI and OLI at Taihu Lake are 10:35 a.m. and 10:30 a.m. Each water quality monitoring station measures turbidity at 4:00 a.m., 12:00 a.m., and 20:00 p.m., respectively. We collected field measurements at 12:00 a.m., which satisfied a time difference of <3 h. Moreover, we excluded the measurements when the stations were covered by clouds, shadows, and algae blooms. The value of turbidity greater than 300 NTU was also excluded because high turbidity was rare. Spatial windows (3 × 3 pixels) centered on stations were applied to extract the mean value of images as match-ups. A total of 193 MSI match-ups and 101 OLI match-ups were obtained to train and validate turbidity retrieval models. Table 2 and Figure 4 show the descriptive statistics and distributions of match-ups.

2.5. Retrieval Model Development

Dogliotti et al. [38] constructed a single-band semi-analytical turbidity retrieval algorithm using 645 nm and 895 nm bands. The algorithm is suitable for turbidity retrieval in the range of 1–1000 Formazin Nephelometric Units (FNU) in coastal and estuarine waters. Both NTU and FNU use Formazin’s primary standard and can be converted to each other. However, turbid lakes have more complicated optical properties than coastal and estuarine waters, resulting in difficulty retrieving turbidity using a single band [39].
In recent years, machine learning has been used to estimate water quality parameters from multi-bands [40,41,42]. In this study, we test three machine learning models using reflectance as inputs: eXtreme Gradient Boosting (XGBoost) [43], support vector regression (SVR) [44], and random forest (RF) [45]. SVR can solve the non-linear problems in low-dimensional feature space by seeking a linear function in high-dimensional feature space. RF establishes multiple decision trees and outputs the average predicted value for each tree. XGBoost predicts the sum of scores in multiple regression trees [46].
The inputs to the models for MSI and OLI were nine and five spectral bands from visible to NIR, respectively. We separated all match-ups into two subsets: 70% MSI (n = 135) and OLI (n = 70) samples were used to train models, and the remaining 30% MSI (n = 58) and OLI (n = 31) samples were used to test the performance of models. The hyperparameters of each model were determined by cross-validation grid search in Scikit-Learn of Python.

2.6. Intercomparisons at n-SNO

The similar overpass time of Sentinel-2A/B and Landsat-8/9 at the same location allows us to assess the consistency of the intercomparisons at n-SNO events [47]. We performed the consistency assessment for reflectance and turbidity products, and the reflectance intercomparisons were carried out for the MSI and OLI’s similar spectral bands. Due to similarities in atmospheric and aquatic conditions, we could choose the optimal AC method according to the consistency of the image-derived reflectance and address the input differences in turbidity retrieval. The comparison between synchronous MSI and OLI image-derived turbidity determines whether they can generate combined turbidity products in Taihu Lake.
A total of 7 n-SNO events in all of the scenes we acquired. In order to minimize uncertainties in the intercomparisons, we first generated random points with 1 km intervals in Taihu Lake, so that each scene has 468 points. Then the MSI data were resampled to 30 m for consistency with the OLI data. The values of reflectance and turbidity were taken from 3 × 3 spatial windows centered on random points.

2.7. Performance Metrics

Common metrics such as the coefficient of determination ( R 2 ), mean absolution percentage error (MAPE), and root mean square error (RMSE) (Equations (1)–(3)) were used to access the performance of models and the consistency of aquatic products [48].
R 2 = 1 i = 1 n ( y i x i ) 2 i = 1 n ( x i x ¯ ) 2 ,
MAPE = 1 n i = 1 n | y i x i | x i × 100 % ,
RMSE = i = 1 n ( y i x i ) 2 n ,
where n is the number of points. For the performance evaluation, x i and y i are the retrieved values and measured values, respectively; for the consistency analyses, x i and y i are the MSI and OLI image-derived values, respectively. We also used the median error (ME) and slope (Equations (4) and (5)) to access consistency in MSI and OLI products due to the presence of outliers and noise [49].
ME = M e d i a n ( y i x i ) ,
Slope = y i 1 x i .

3. Results

3.1. Performance of AC Algorithms

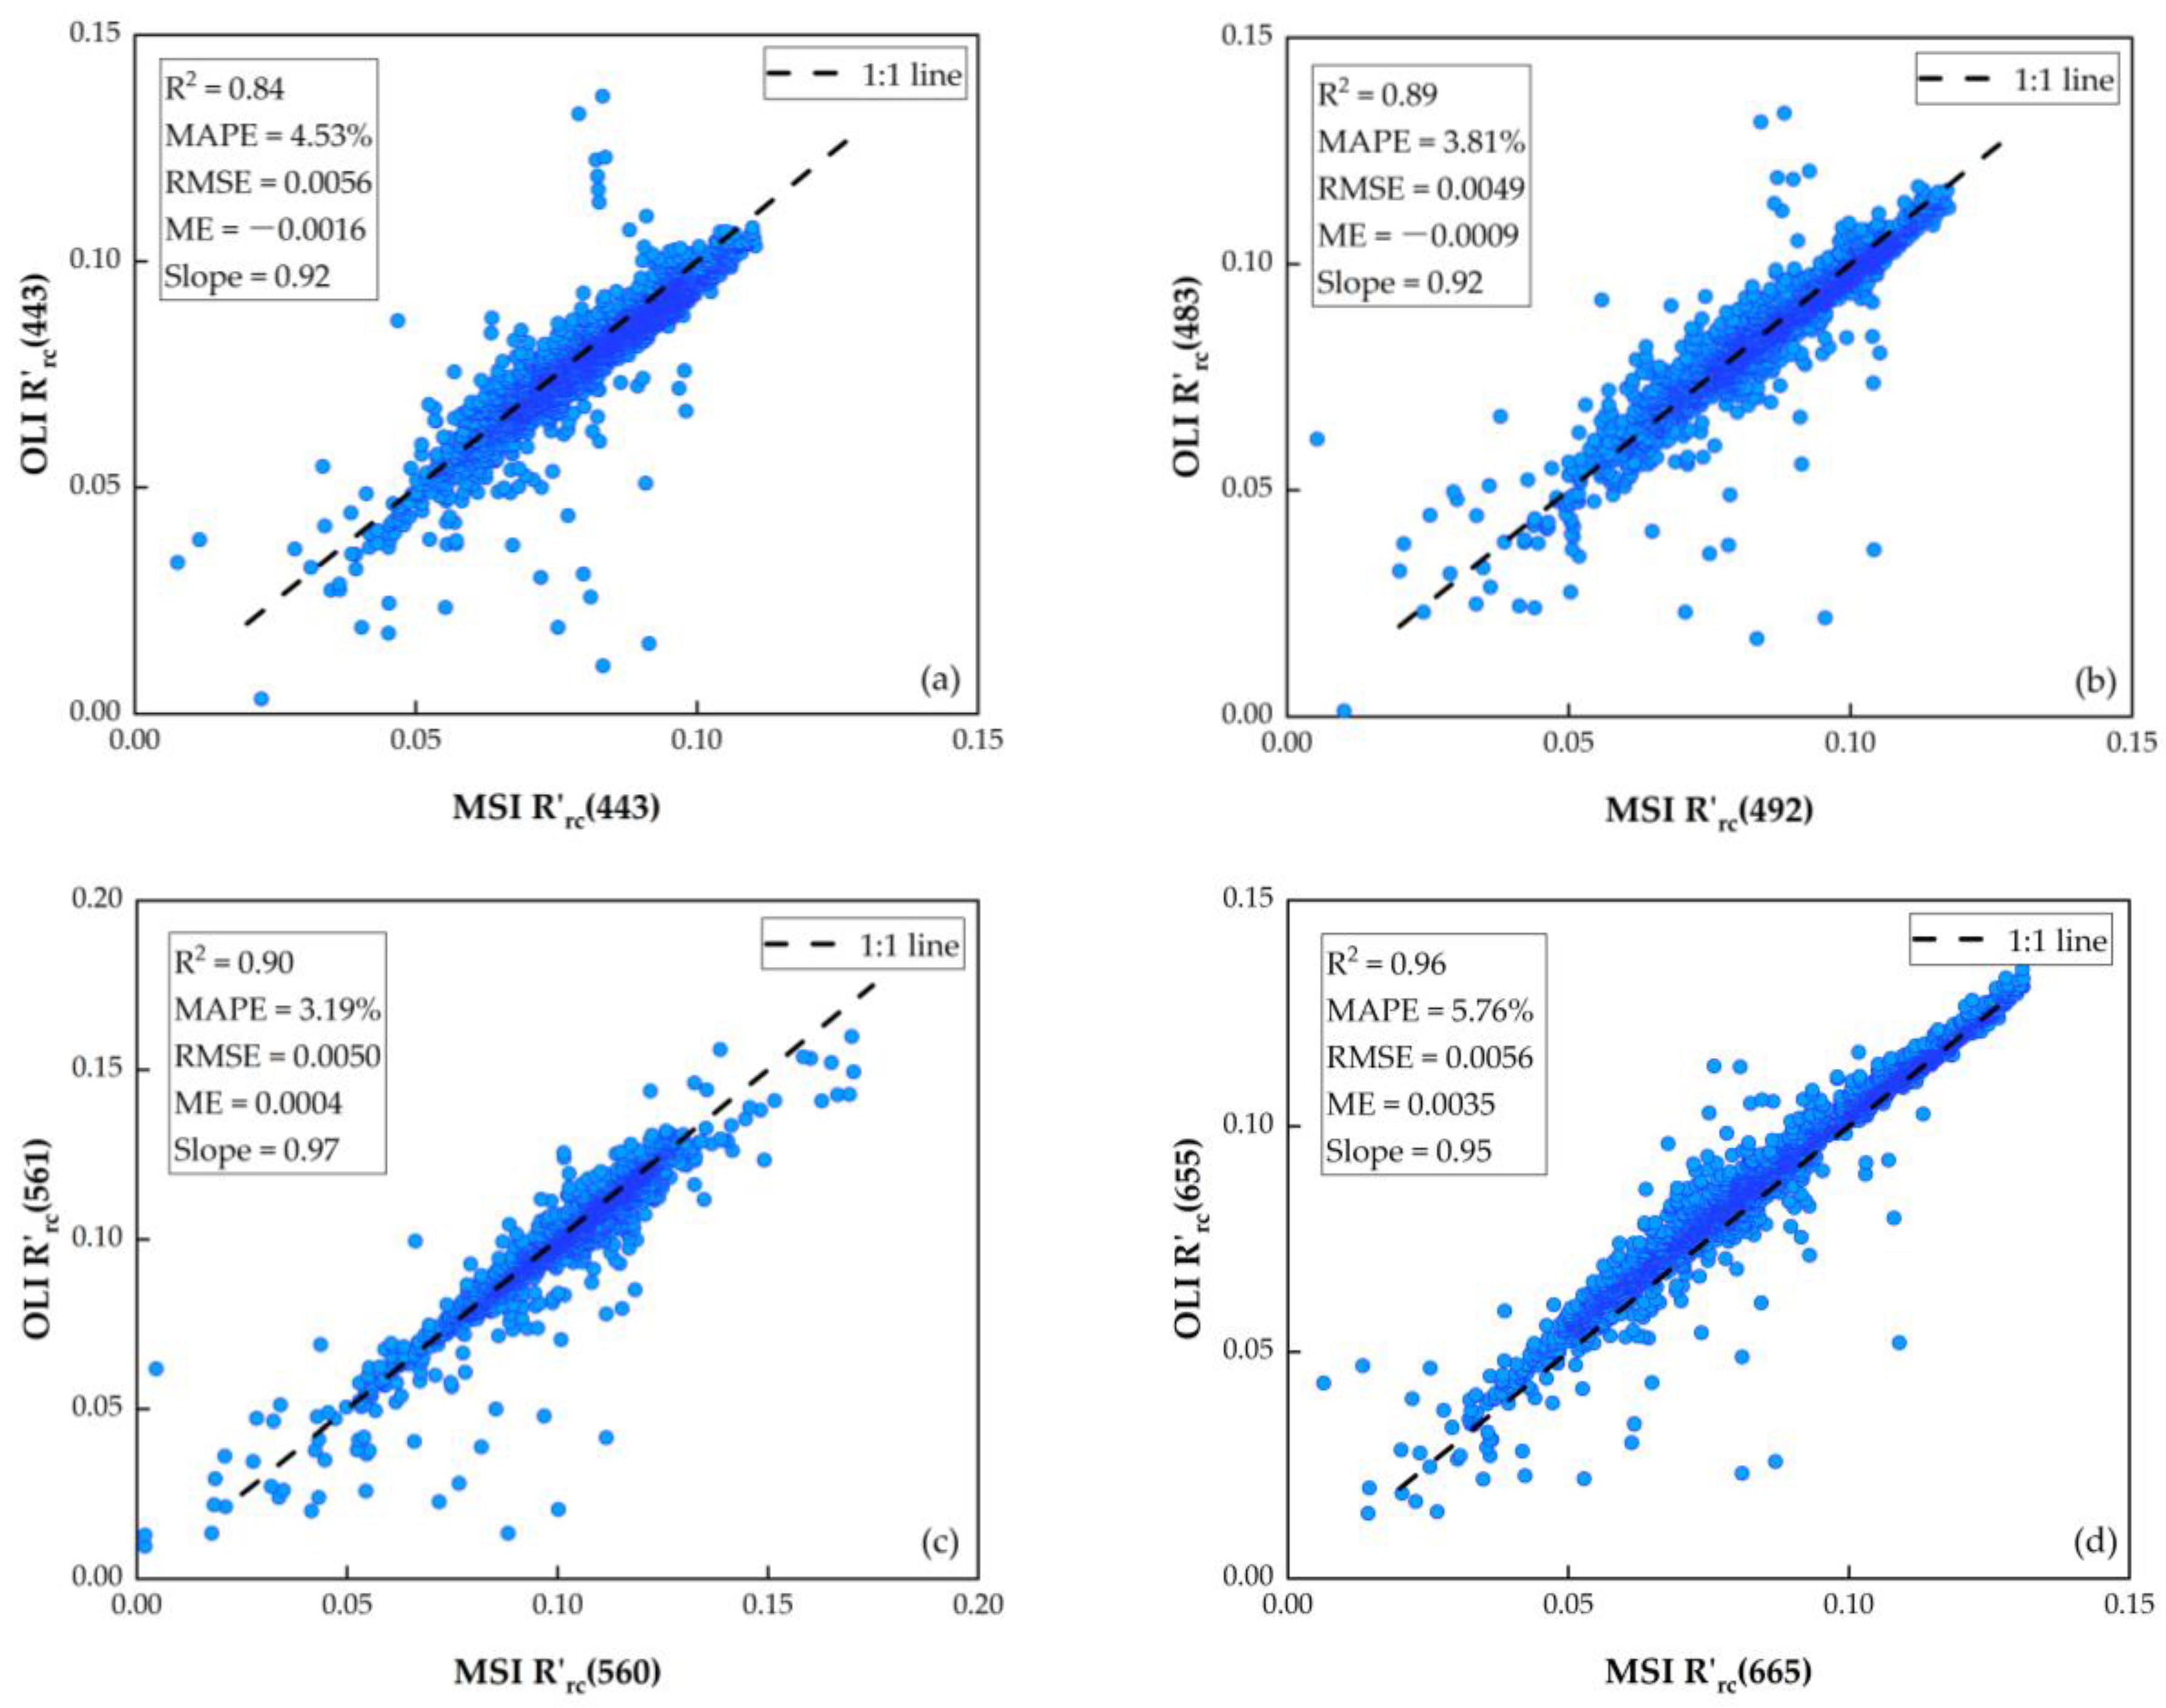
The statistical metrics for intercomparisons of R r s after DSF and C2RCC as well as R r c after Rayleigh-SWIR are summarized in Table 3. Since the ranges of reflectance estimated by the three AC methods are different, RMSE cannot be used as a metric of consistency assessment but can represent the performance in different bands. With the values of R2, MAPE, ME, and slope, it is possible to evaluate the performance of each AC method based on the consistency of reflectance products. Overall, different AC methods performed differently on various bands, and all AC methods performed worst in NIR bands.
Among the three AC methods, the consistency of R r c derived from MSI and OLI images by Rayleigh-SWIR performance was better than R r s derived by DSF and C2RCC, particularly in the band of 865 nm. All the visible and NIR bands of MSI and OLI intercomparisons, R r c indicate relative consistency (R2 > 0.84, MAPE < 7%, ME < 0.0035, and Slope > 0.92). R r s derived by C2RCC presented the worst consistency (average MAPE = 45.76%), possibly due to C2RCC underestimated R r s of turbid water.
The scatterplots show good consistency between the MSI-derived R r c through the Rayleigh-SWIR method and the corresponding OLI-derived values (Figure 5). Most intercomparisons are evenly distributed around line 1:1. However, R r c greater than 0.06 at 865 nm depicted a large deviation, which is possibly related to slight algal blooms. In particular, R r c (665) and R r c (655) agree to within <6%, which is extremely beneficial for generating consistent turbidity products, as the red band contributes the most to turbidity retrieval.

3.2. Performance of Algorithms in Turbidity Retrieval

The mean values of R r c of MSI and OLI bands for turbidity at different values are shown in Figure 6. Overall, the average R r c was proportional to turbidity, and the signals from turbidity changes were well captured by MSI- and OLI-derived R r c through the Rayleigh-SWIR method. Each R r c at MSI and OLI visible bands had significant correlations with turbidity, and the difference of R r c gradually reduced at the NIR bands. The R r c curve shape was similar in each turbidity range, and the peak of the curse was at 560 nm.
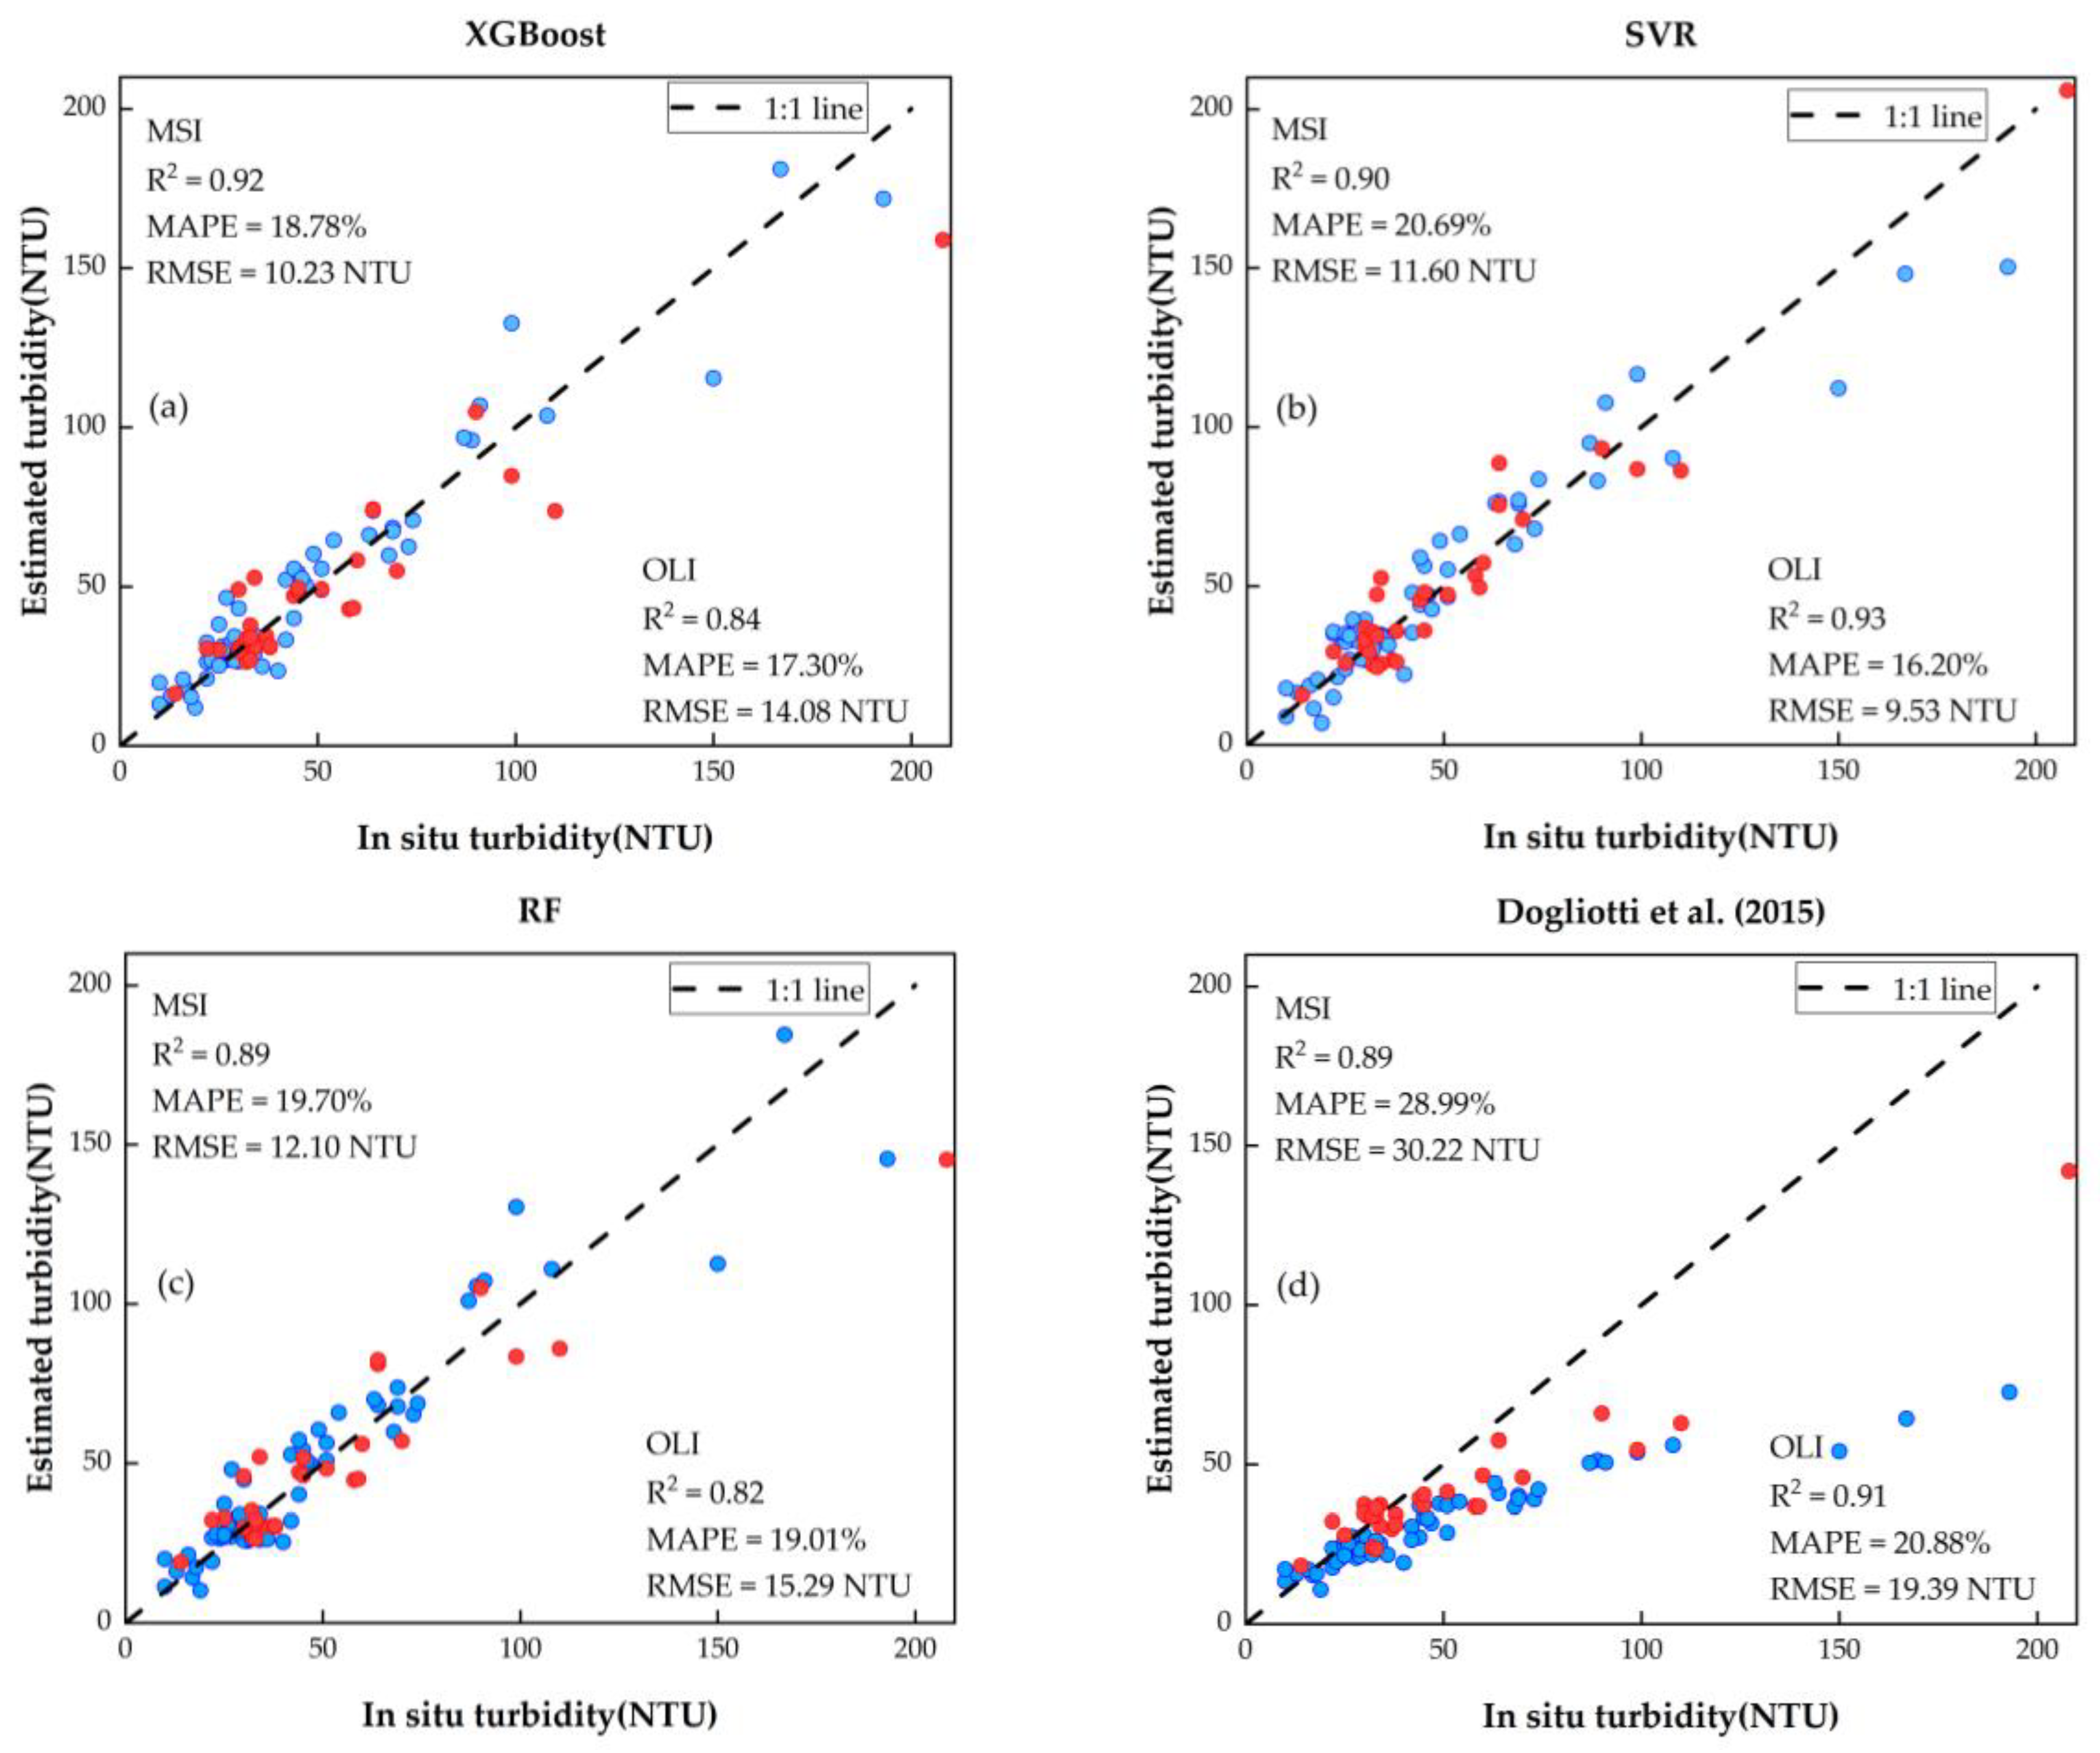
According to the statistical metrics calculated on the validation data, XGBoost, SVR, and RF had similar performance for turbidity retrievals, although RF had a slightly worse performance (Figure 7a–c). Machine learning models outperformed the semi-analytical algorithm built by Dogliotti et al. (Figure 7d) from R r c , particularly for high turbidity values. Among them, XGBoost had the best performance for MSI (R2 = 0.92, MAPE = 18.78%, RMSE = 10.23 NTU), and SVR had the best performance for OLI (R2 = 0.93, MAPE = 16.20%, RMSE = 9.53 NTU).

3.3. Comparison of Turbidity Products between MSI and OLI

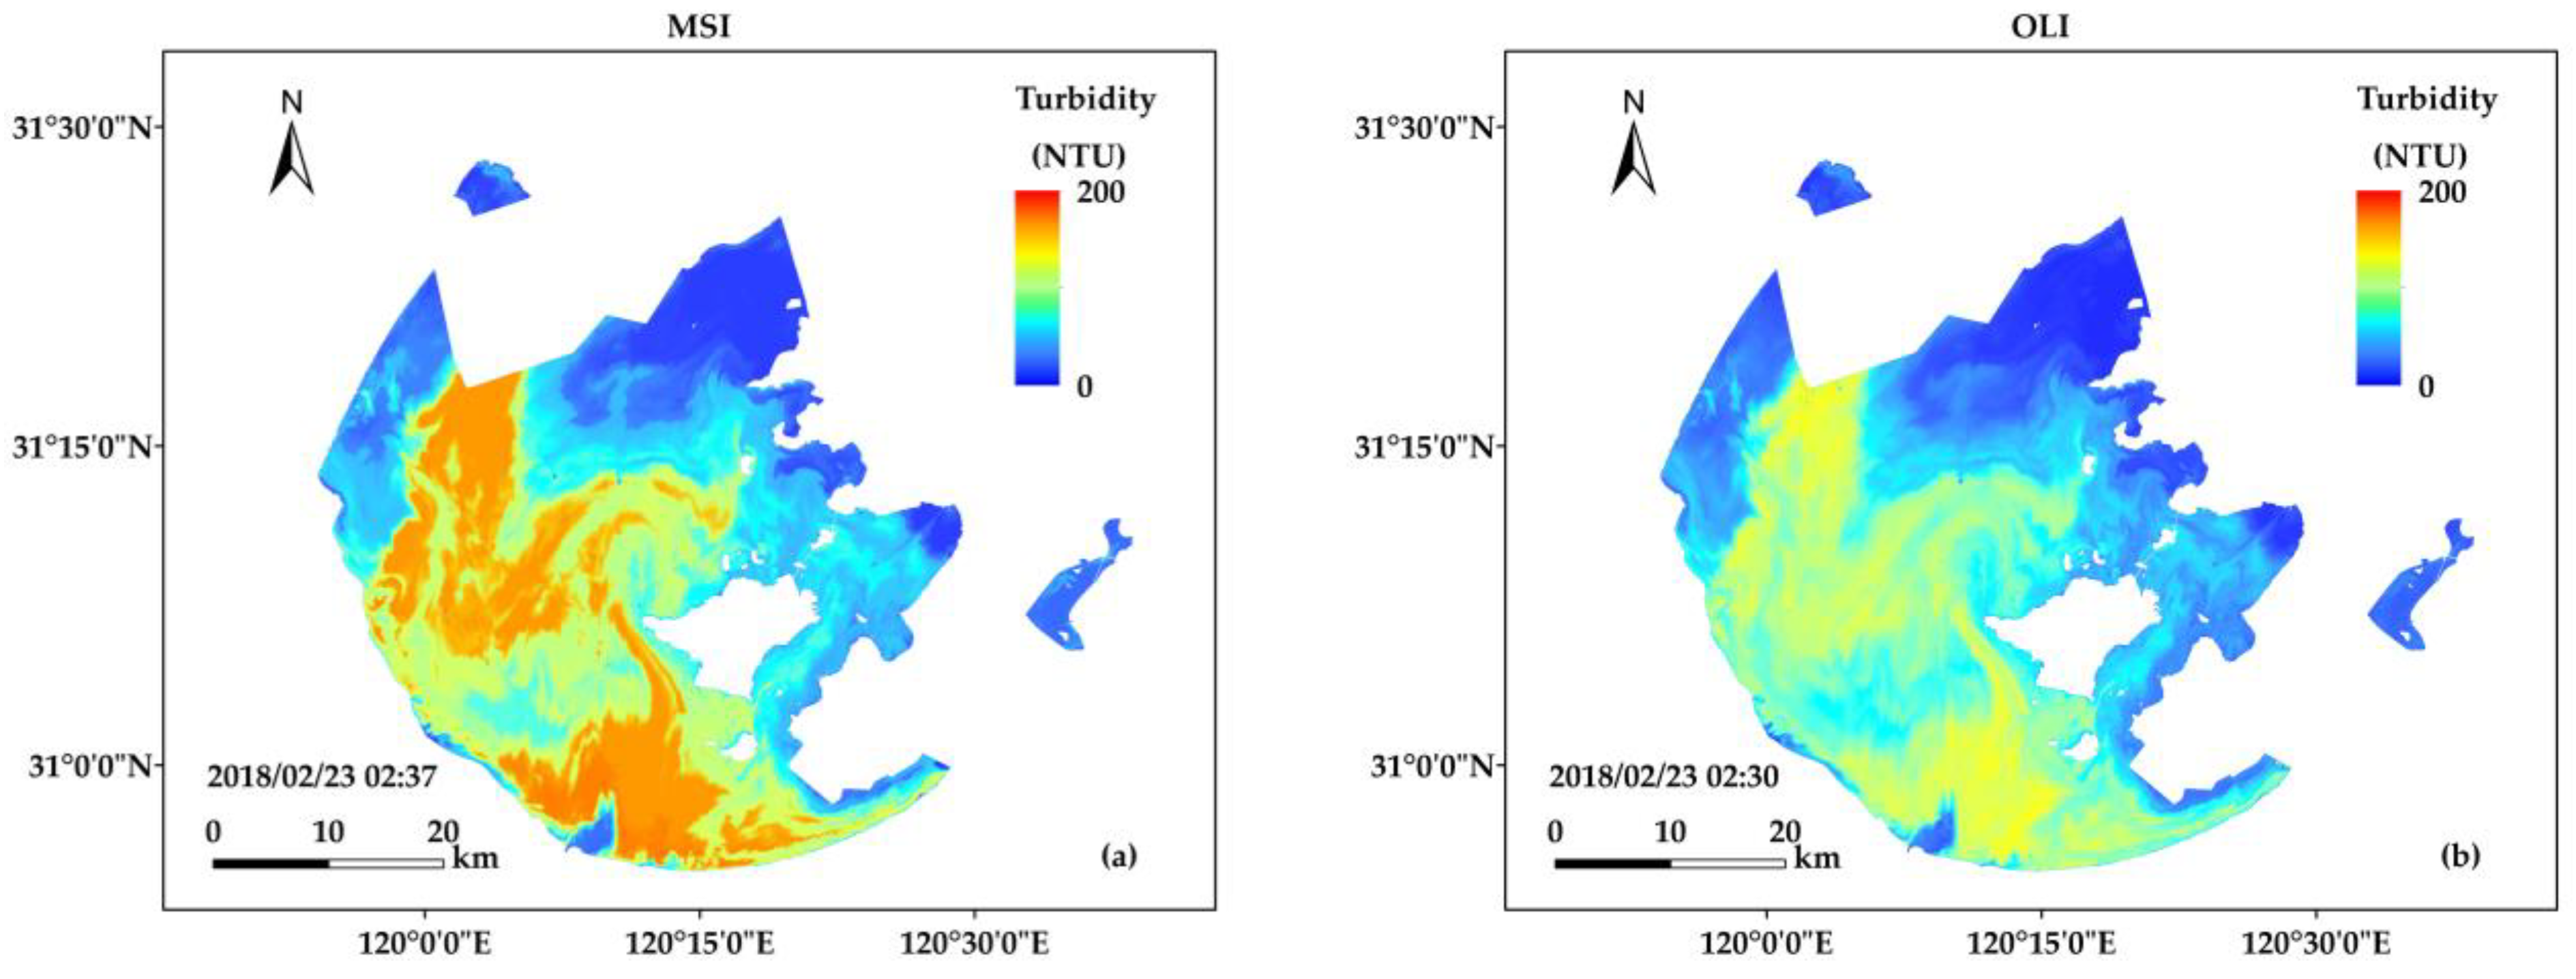
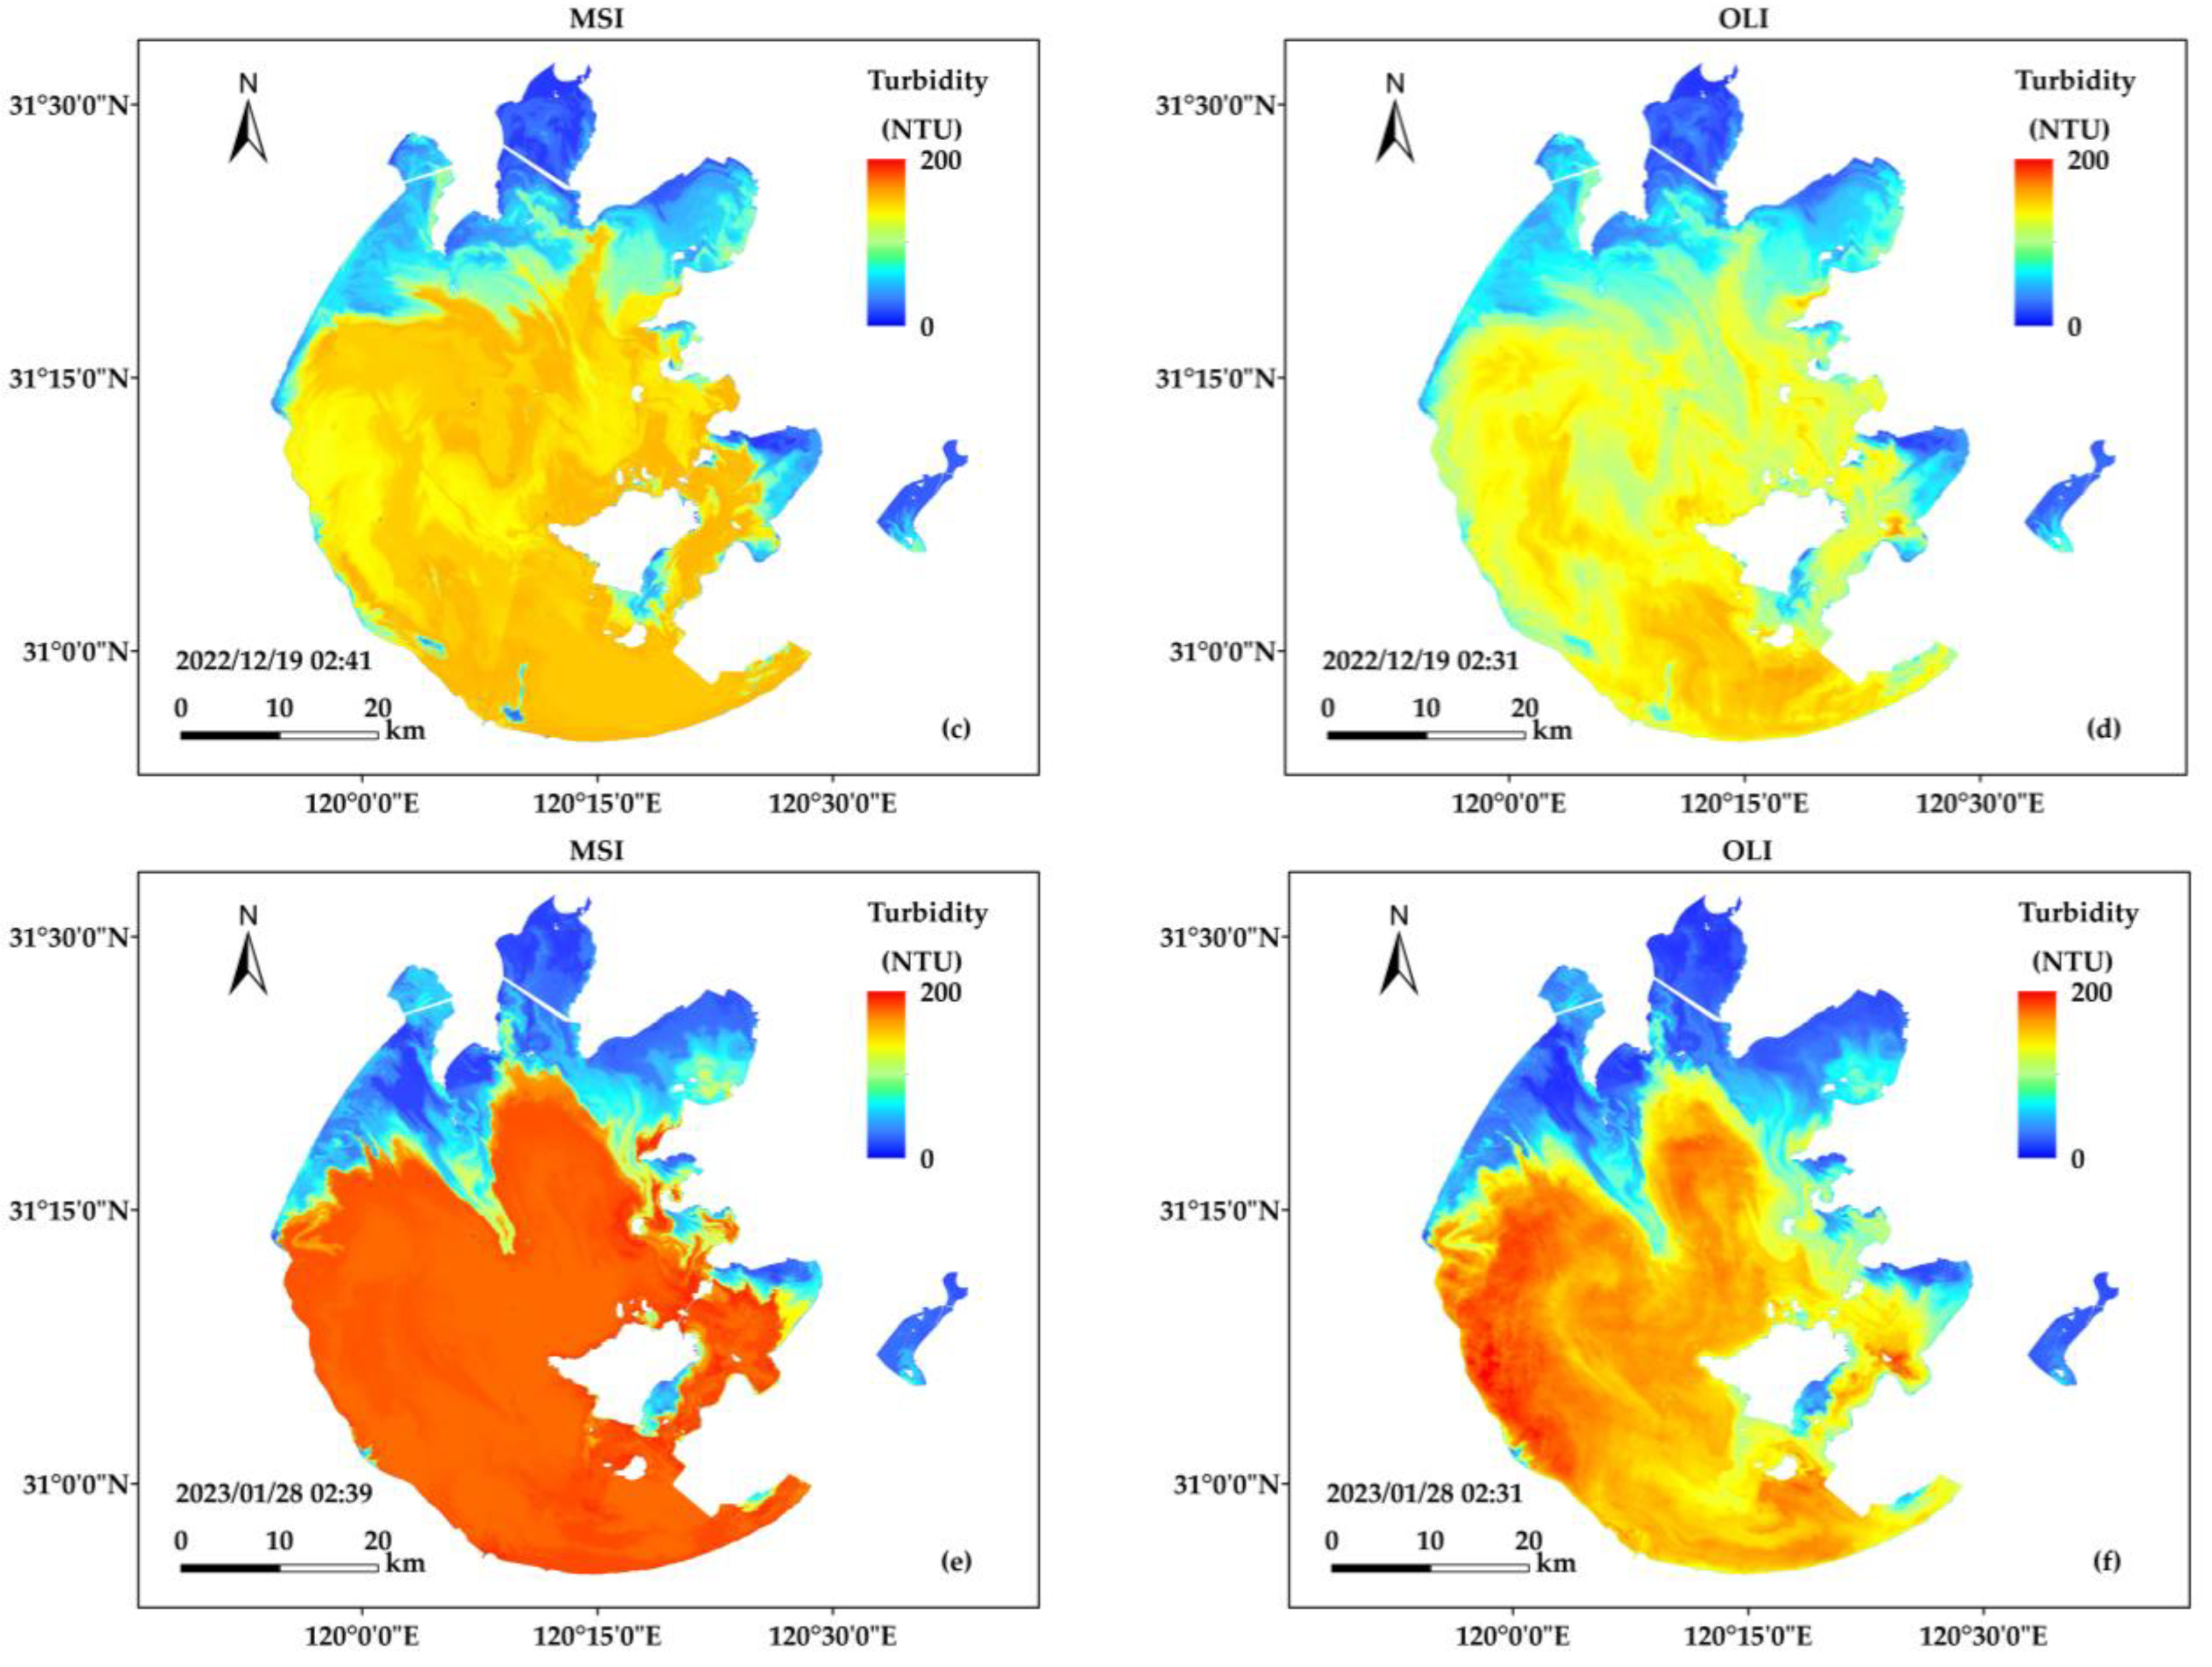
Examples of turbidity distributions from the same-day MSI and OLI images were mapped in Figure 8. The range of the color bar was retained consistently for a better comparison. XGBoost-derived turbidity from MSI R r c exhibited consistent spatial distributions with SVR-derived turbidity from synchronous OLI R r c in Taihu Lake. MSI-derived turbidity was highly consistent with OLI-derived turbidity in clean lake water, such as in the north and east of Taihu Lake. However, MSI-derived turbidity was slightly higher than OLI-derived turbidity in turbid lake water, such as in the south and west of Taihu Lake.
For all n-SNO of MSI and OLI images, the difference between intercomparisons of MSI- and OLI-derived turbidity was relatively small (R2 = 0.88, MAPE = 26.48%, RMSE = 34.45 NTU, ME = 15.7 NTU, Slope = 0.68). The scatterplots (Figure 9) show that MSI- and OLI-derived turbidity (<75 NTU) were evenly distributed along the 1:1 line. Despite MSI-derived turbidity being higher than OLI-derived turbidity (>75 NTU), they still maintain a certain correlation.

4. Discussion

4.1. Strengths and Limitations of AC

Ideally, in situ R r s should be used to test the performance of different AC methods. However, it is difficult to collect sufficient in situ data to test the ability of AC methods to estimate accurate and consistent reflectance. The Rayleigh-SWIR method outperformed other methods in deriving consistent reflectance products from MSI and OLI images in Taihu Lake. The errors of AC generally come from aerosol corrections, while R r c has been proven accurate without an aerosol correction [50]. Aerosol correction of R r c is the subtraction of the SWIR band from R r c ( λ ) , which does not change the spectral shape of R r c . DSF algorithm needs dark pixels to identify aerosol models. For Taihu Lake, located in the urban agglomeration, insufficient dark pixels may lead to the failure of aerosol correction [51]. The accuracy of C2RCC is influenced by the input of the model, such as bio-optical parameters, and several studies have also reported the inadequacy of the C2RCC algorithm in retrieving R r s in highly turbid water [52].
However, SWIR signals over water are influenced by nearby land pixels and underwater vegetation, resulting in negative retrieval of R r c in nearshore and shallow water. In addition, the subtraction of SWIR from all bands ignores the spatial and spectral variability of the aerosol, so R r c may retain residual aerosol signals or overcorrect the aerosol signals [53].

4.2. Sources of Uncertainty

Although the consistency of MSI- and OLI-derived turbidity indicated that MSI and OLI can combine to generate turbidity time series in Taihu Lake, the difference in the calibrated results is still 26%. First, the MSI and OLI’s similar bands have different spectral specifications and radiometric performances [54]. For example, the MSI and OLI red channels have significant differences in center wavelength and spectral responses, and new instruments always have a better Signal-to-Noise Ratio than the older ones. Since we did not calibrate the original TOA reflectance, this instrument-induced deviation is about 1–3% and will translate to further products [55]. In addition, MSI- and OLI-derived R r c using the Rayleigh-SWIR method had an average 4.7% difference, which would translate into retrieval model development and turbidity retrieval.
Machine learning models had good performance for turbidity retrievals from MSI and OLI in the optically complex Taihu Lake. Although the changes in turbidity are closely related to spectral bands, the complex water composition of inland water makes turbidity retrieval challenging. Machine learning algorithms can capture non-linearities between all bands and turbidity in the presence of residual atmospheric signals [56]. However, the applicability of machine learning models depends on the range of input data [57]. MSI and OLI match-ups are insufficient in high turbidity, which results in uncertainties. In particular, the performance of the OLI model decreases with the increase in turbidity due to fewer match-ups. In addition, although the match-ups were collected from MSI and OLI images in all seasons, the rainy summer climate in the lower reaches of the Yangtze River made images in the summer insufficient. Finally, precipitation and wind can cause rapid changes in water quality [58], and the uncertainty between field measurements and image-derived increased the deviation of turbidity products between MSI and OLI.

4.3. Time-Series Analyses

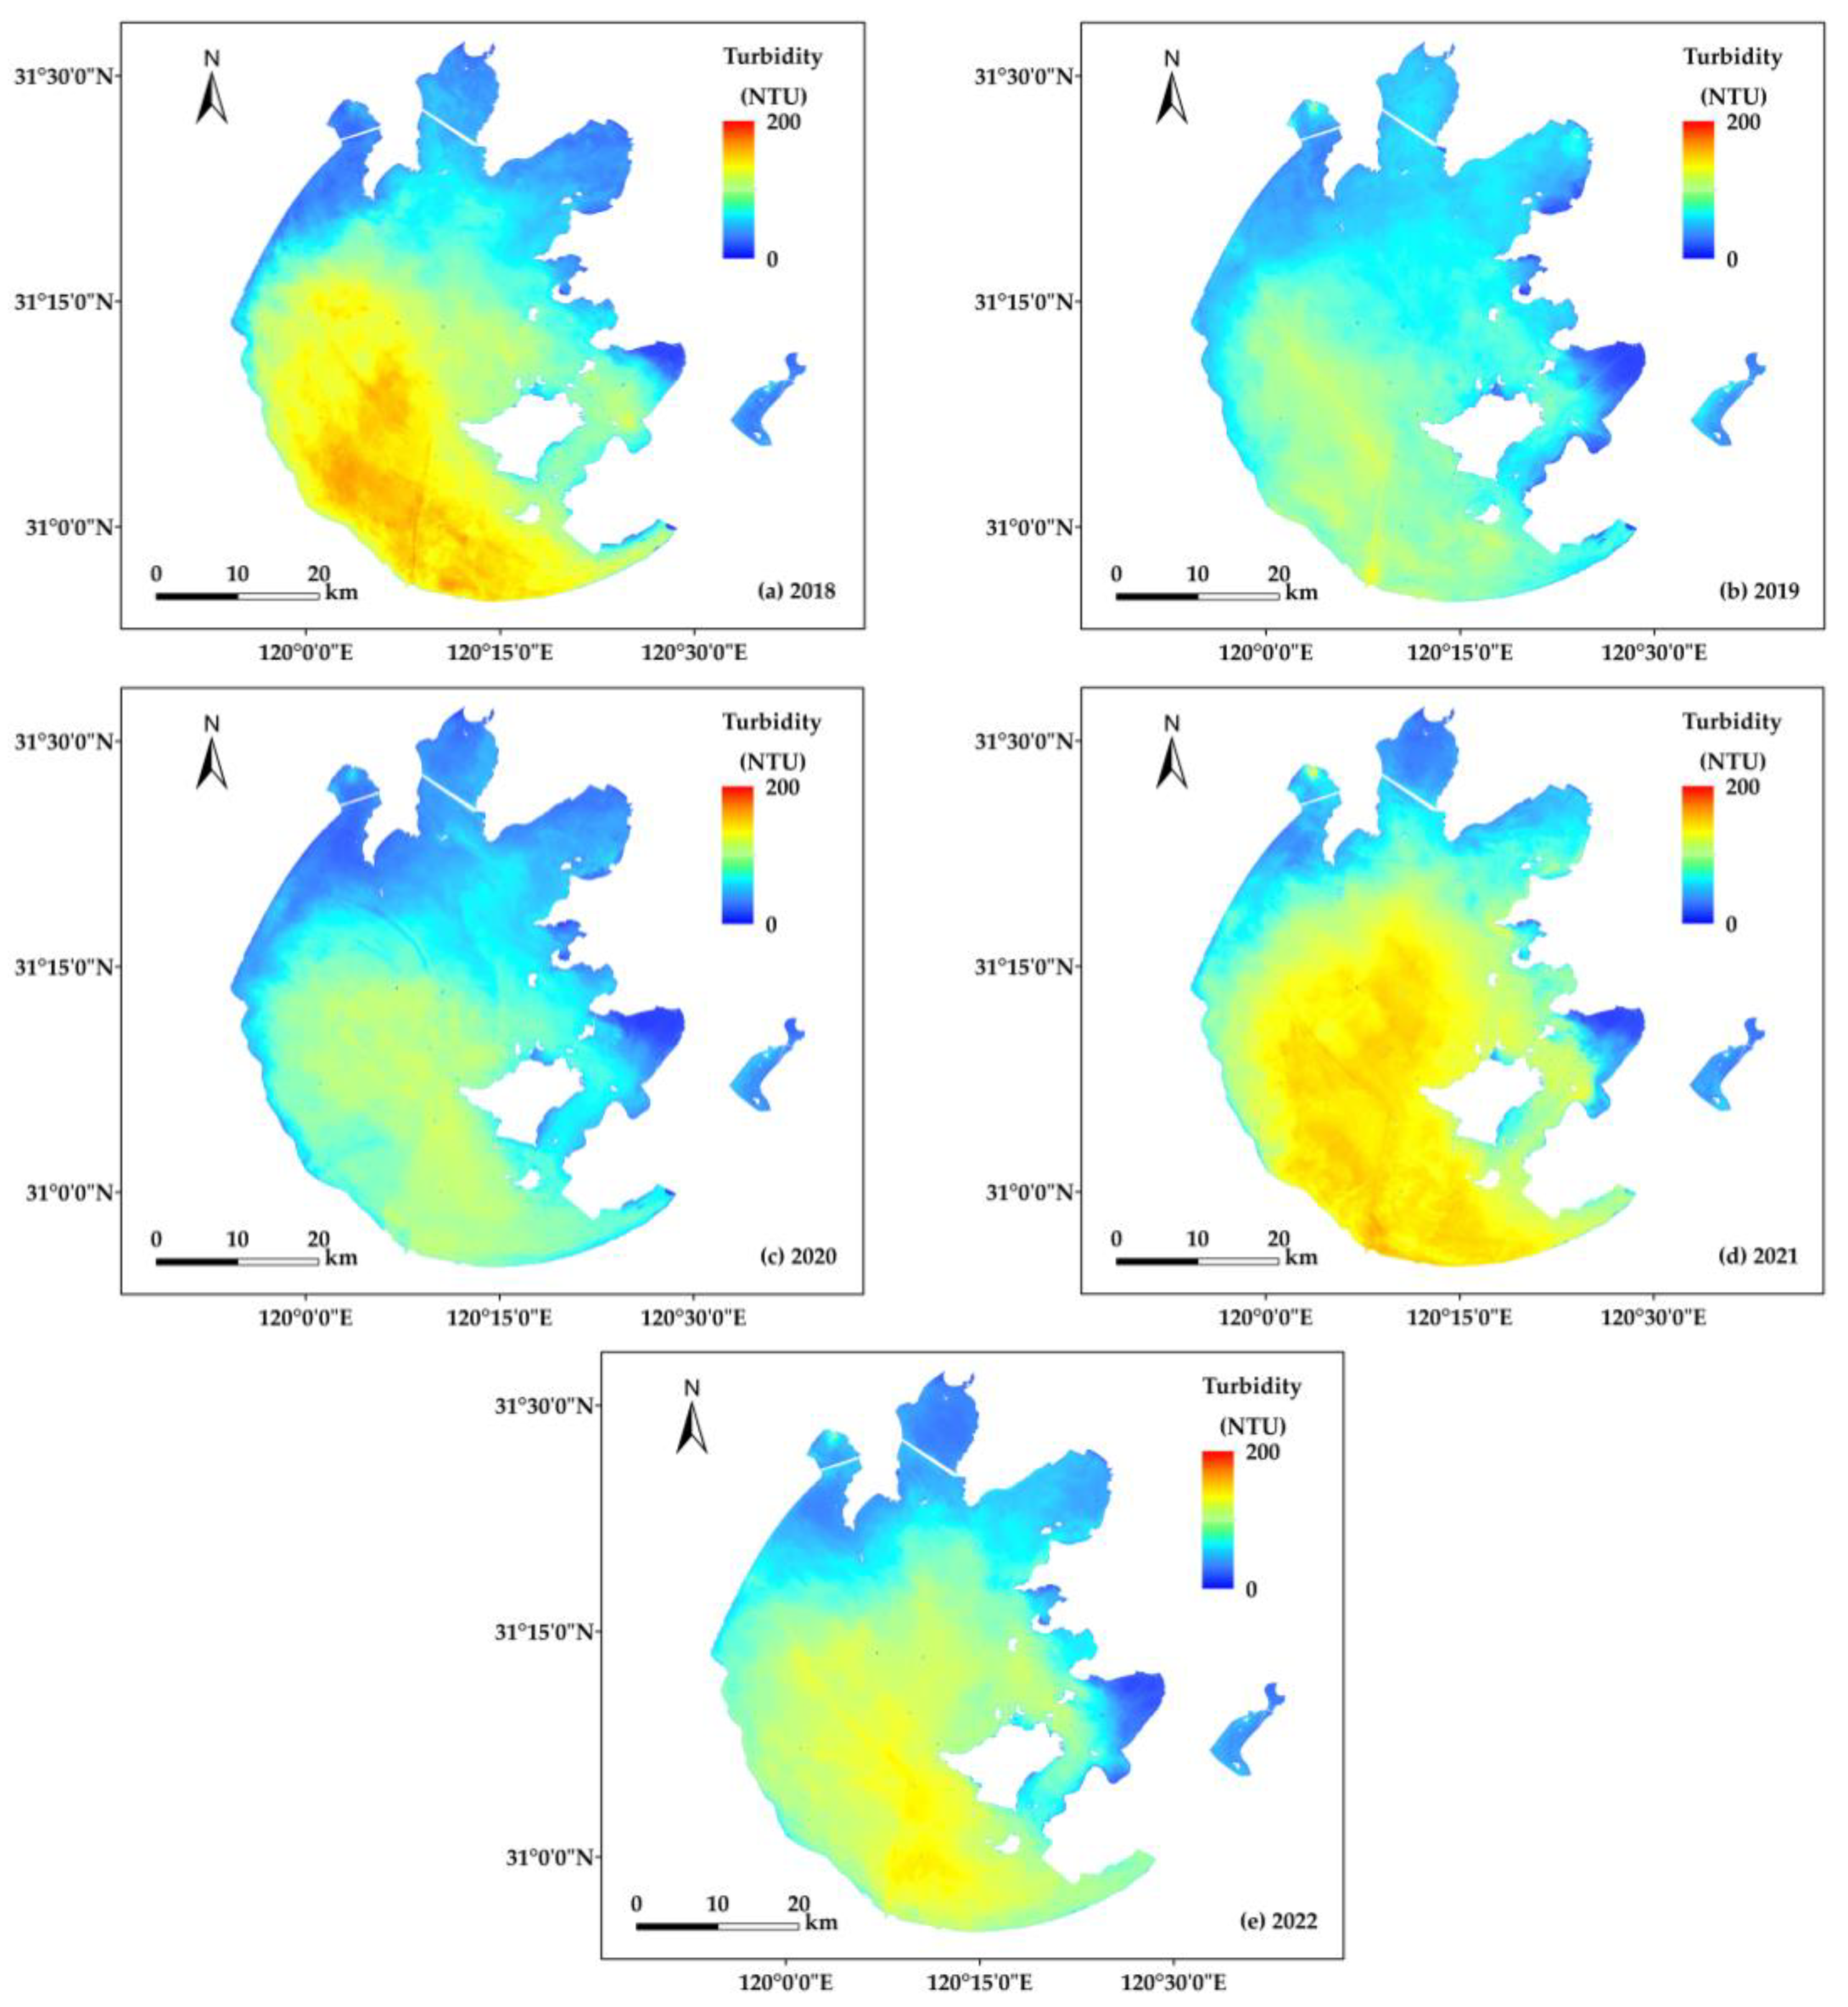
The annual mean turbidity from MSI and OLI images is shown in Figure 10. MSI images were resampled to 30 m to compute the mean turbidity with OLI images. The distribution of turbidity exhibited obvious spatial and interannual changes in Taihu Lake from 2018 to 2022. Five bays in the north and east of Taihu Lake had lower turbidity, and the turbidity of the open area in the north and west of Taihu Lake was high (mean turbidity above 100 NTU). This was mainly due to the resuspension of sediment by wind in open areas [59]. Among the five bays, the turbidity values of the two eastern bays were the lowest (mean turbidity below 30 NTU), and the mean turbidity values of the three northern bays ranged from 50 to 100 NTU. Similar to the results of Yin et al. [27], Secchi disk depth ( Z s d ) was low in the open area and high in the five bays, which also confirms the high correlation between turbidity and Z s d .
The interannual changes in turbidity in different sub-regions of the lake varied. The turbidity trend in the open area varied greatly from year to year. The turbidity of the five bays is basically about 50 NTU. In contrast, turbidity in open areas peaked in 2018 and 2021, with both mean turbidities of 150 NTU. Yin et al. [27] also indicated that Z s d showed fluctuations over time. We need more available images from past years to summarize turbidity trends in open areas.
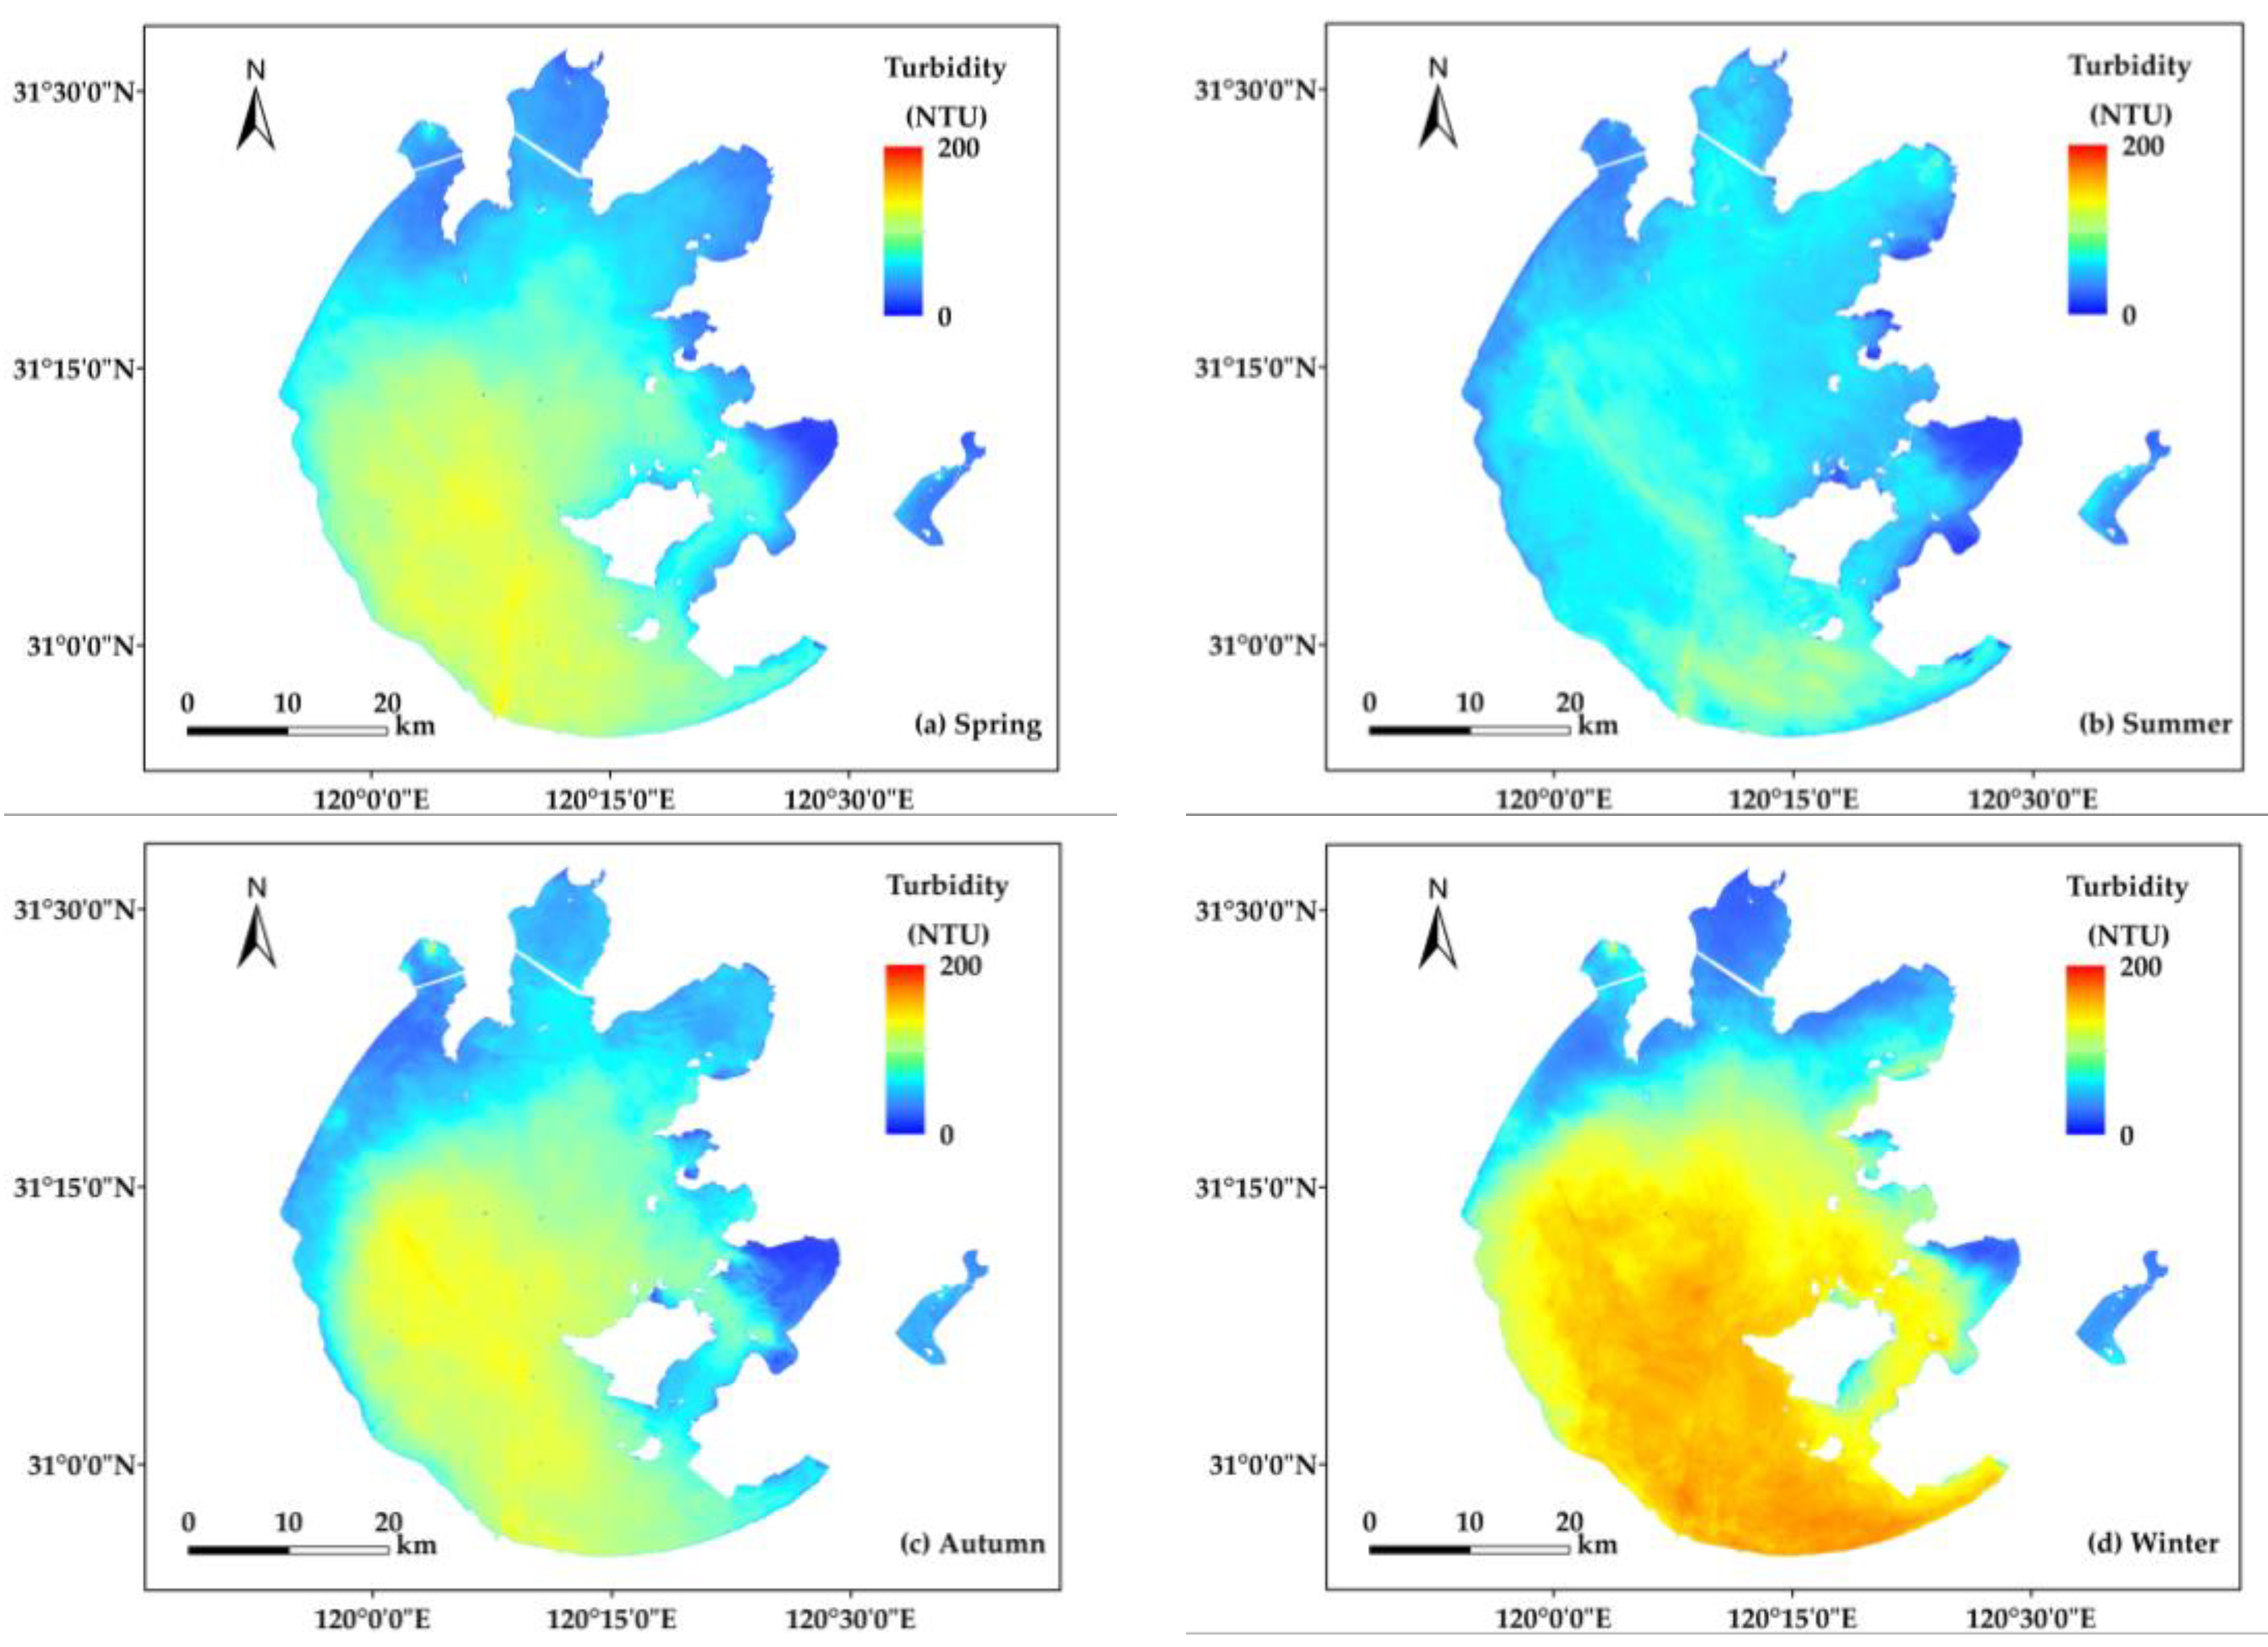
Moreover, the distributions of seasonal mean turbidity were also mapped in Figure 11, with winter mean turbidity included in the available images for 2023. The distribution of turbidity exhibited obvious seasonal characteristics in Taihu Lake. Turbidity was highest in the winter and lowest in the summer. Observations used in statistics for seasonal averages of turbidity included more than 20 images, indicating that seasonal mean turbidity can reflect the actual trends of turbidity.
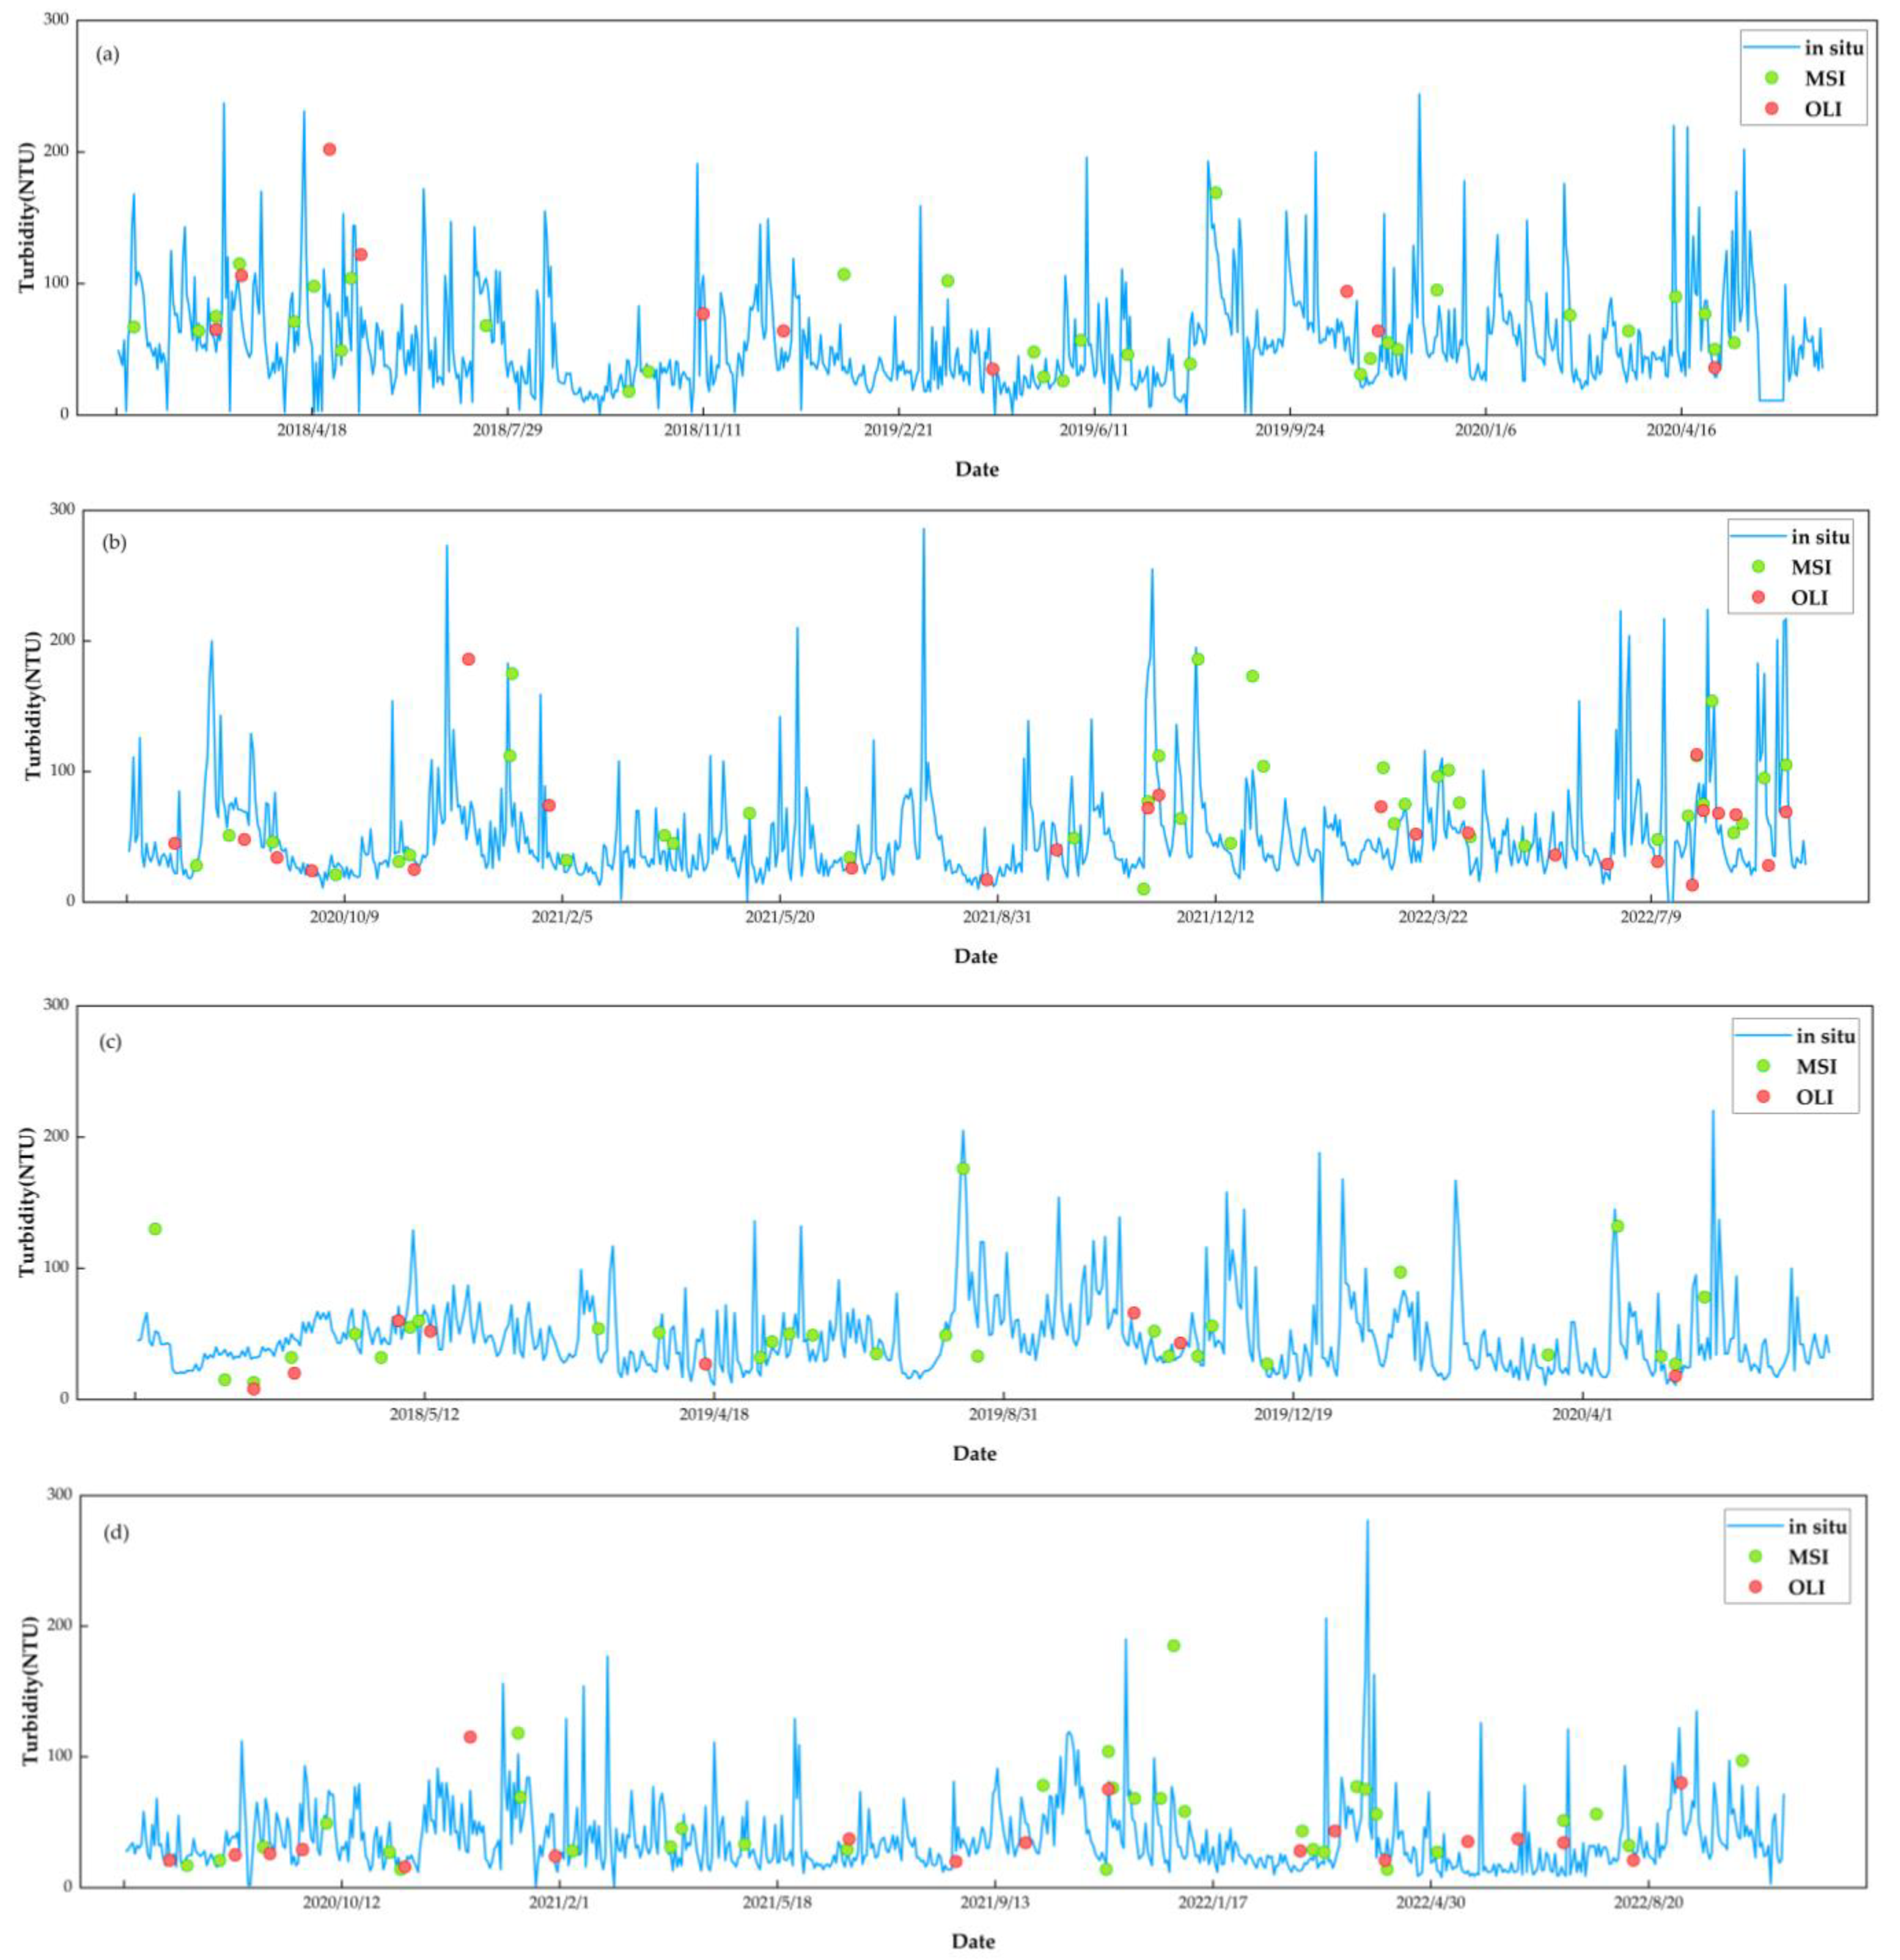
Daily in situ and MSI- and OLI-derived turbidity time series at one of the stations in Taihu Lake from 2018 to 2023 are illustrated in Figure 12. This station is located in the center of the lake and has the most complete daily in situ observations. In situ data also indicated that turbidity in winter was higher than in other seasons at the central lake. MSI- and OLI-derived turbidity had a consistent temporal trend with in situ turbidity. Although image-derived turbidity still deviated from in situ turbidity, the combination of MSI and OLI increased the number of available observations of dynamical inland lakes. In addition, the time series of the other two stations are illustrated in Figure A1.

5. Conclusions

In this study, we generated consistent turbidity products in Taihu Lake from 2018 to 2022 using Sentinel-2A/B MSI and Landsat-8/9 OLI. We tested the performance of three aquatic AC methods to retrieve consistent reflectance products. The R r c derived from MSI and OLI images by Rayleigh-SWIR were most consistent. Machine learning models outperformed an existing semi-analytical retrieval algorithm, where XGboost and SVR had the best performance for MSI and OLI turbidity retrievals, respectively. Machine learning models were selected to retrieve turbidity from MSI and OLI R r c images. The consistency of turbidity retrievals was validated with the intercomparisons from the same-day MSI and OLI images. Finally, we generate the annual and seasonal mean turbidity from all MSI and OLI images. The time series indicated that MSI and OLI had high potential for combining to monitor lake water quality.
However, some uncertainties in our study should be resolved in the future. Firstly, Rayleigh-SWIR is not a perfect AC method; the low signal-to-noise ratios of MSI and OLI in SWIR bands affect the accuracy of correcting aerosol signals. Methods for estimating aerosol signals in R r c need some improvement. Then, we need more MSI and OLI images of other inland lakes to verify the generality of the process and more in situ turbidity data to reduce the differences between models in high turbidity.

Author Contributions

Conceptualization, C.G. and Y.H.; methodology, Z.Y. and L.L.; formal analysis, Z.Y. and Z.L.; resources, C.G. and Y.H.; data curation, L.D. and E.W.; writing—original draft preparation, Z.Y.; writing—review and editing, Z.Y. and H.H. All authors have read and agreed to the published version of the manuscript.

Funding

This research was funded by Shanghai 2021 “Science and Technology Innovation Action Plan” Social Development Science and Technology Research Project (21DZ1202500), the Jiangsu Provincial Water Conservancy Science and Technology Project (No. 2020068), and the Science and Technology Project of Shanghai Municipal Water Bureau (Shanghai Branch 2021-10, Shanghai Branch 2018-07).

Data Availability Statement

Not applicable.

Acknowledgments

We are also thankful to all anonymous reviewers for their constructive comments provided on the study.

Conflicts of Interest

The authors declare no conflict of interest.

Appendix A

Figure A1. Time-series of in situ and MSI- and OLI-derived turbidity for two stations from 2018 to 2023 in Taihu Lake. (a,b) map a station in the open area of the lake, (c,d) map a station in the bay of the lake.
Remotesensing 15 04333 g0a1

References

  1. Adrian, R.; O’Reilly, C.M.; Zagarese, H.; Baines, S.B.; Hessen, D.O.; Keller, W.; Livingstone, D.M.; Sommaruga, R.; Straile, D.; Van Donk, E.; et al. Lakes as sentinels of climate change. Limnol. Oceanogr. 2009, 54, 2283–2297. [Google Scholar] [PubMed]
  2. Jane, S.F.; Hansen, G.J.A.; Kraemer, B.M.; Leavitt, P.R.; Mincer, J.L.; North, R.L.; Pilla, R.M.; Stetler, J.T.; Williamson, C.E.; Woolway, R.I.; et al. Widespread deoxygenation of temperate lakes. Nature 2021, 594, 66–70. [Google Scholar] [PubMed]
  3. Ma, Y.; Song, K.; Wen, Z.; Liu, G.; Shang, Y.; Lyu, L.; Du, J.; Yang, Q.; Li, S.; Tao, H.; et al. Remote Sensing of Turbidity for Lakes in Northeast China Using Sentinel-2 Images with Machine Learning Algorithms. IEEE J. Sel. Top. Appl. Earth Obs. Remote Sens. 2021, 14, 9132–9146. [Google Scholar]
  4. Lee, Z.; Shang, S.; Hu, C.; Du, K.; Weidemann, A.; Hou, W.; Lin, J.; Lin, G. Secchi disk depth: A new theory and mechanistic model for underwater visibility. Remote Sens. Environ. 2015, 169, 139–149. [Google Scholar]
  5. Shi, K.; Zhang, Y.; Zhu, G.; Liu, X.; Zhou, Y.; Xu, H.; Qin, B.; Liu, G.; Li, Y. Long-term remote monitoring of total suspended matter concentration in Lake Taihu using 250m MODIS-Aqua data. Remote Sens. Environ. 2015, 164, 43–56. [Google Scholar]
  6. Nechad, B.; Ruddick, K.G.; Neukermans, G. Calibration and validation of a generic multisensor algorithm for mapping of turbidity in coastal waters. Proc. SPIE 2009, 7473, 74730H. [Google Scholar]
  7. Hou, X.; Feng, L.; Duan, H.; Chen, X.; Sun, D.; Shi, K. Fifteen-year monitoring of the turbidity dynamics in large lakes and reservoirs in the middle and lower basin of the Yangtze River, China. Remote Sens. Environ. 2017, 190, 107–121. [Google Scholar]
  8. Potes, M.; Costa, M.J.; Salgado, R. Satellite remote sensing of water turbidity in Alqueva reservoir and implications on lake modelling. Hydrol. Earth Syst. Sci. 2012, 16, 1623–1633. [Google Scholar]
  9. Goodin, D.G.; Harrington, J.A., Jr.; Nellis, M.D.; Rundquist, D.C. Mapping reservoir turbidity patterns using SPOT-HRV data. Geovarto Int. 1996, 11, 71–78. [Google Scholar]
  10. Bustamante, J.; Pacios, F.; Díaz-Delgado, R.; Aragonés, D. Predictive models of turbidity and water depth in the Doñana marshes using Landsat TM and ETM+ images. J. Environ. Manag. 2009, 90, 2219–2225. [Google Scholar]
  11. Zhou, Q.; Wang, J.; Tian, L.; Feng, L.; Li, J.; Xing, Q. Remotely sensed water turbidity dynamics and its potential driving factors in Wuhan, an urbanizing city of China. J. Hydrol. 2021, 593, 125893. [Google Scholar]
  12. Rodríguez-López, L.; Duran-Llacer, I.; González-Rodríguez, L.; Cardenas, R.; Urrutia, R. Retrieving Water Turbidity in Araucanian Lakes (South-Central Chile) Based on Multispectral Landsat Imagery. Remote Sens. 2021, 13, 3133. [Google Scholar]
  13. He, Y.; Jin, S.; Shang, W. Water Quality Variability and Related Factors along the Yangtze River Using Landsat-8. Remote Sens. 2021, 13, 2241. [Google Scholar]
  14. Gao, Z.; Shen, Q.; Wang, X.; Peng, H.; Yao, Y.; Wang, M.; Wang, L.; Wang, R.; Shi, J.; Shi, D.; et al. Spatiotemporal Distribution of Total Suspended Matter Concentration in Changdang Lake Based on In Situ Hyperspectral Data and Sentinel-2 Images. Remote Sens. 2021, 13, 4230. [Google Scholar]
  15. Ciancia, E.; Campanelli, A.; Lacava, T.; Palombo, A.; Pascucci, S.; Pergola, N.; Pignatti, S.; Satriano, V.; Tramutoli, V. Modeling and Multi-Temporal Characterization of Total Suspended Matter by the Combined Use of Sentinel 2-MSI and Landsat 8-OLI Data: The Pertusillo Lake Case Study (Italy). Remote Sens. 2020, 12, 2147. [Google Scholar]
  16. Page, B.P.; Olmanson, L.G.; Mishra, D.R. A harmonized image processing workflow using Sentinel-2/MSI and Landsat-8/OLI for mapping water clarity in optically variable lake systems. Remote Sens. Environ. 2019, 231, 111284. [Google Scholar]
  17. Pahlevan, N.; Chittimalli, S.K.; Balasubramanian, S.V.; Vellucci, V. Sentinel-2/Landsat-8 product consistency and implications for monitoring aquatic systems. Remote Sens. Environ. 2019, 220, 19–29. [Google Scholar]
  18. Novoa, S.; Doxaran, D.; Ody, A.; Vanhellemont, Q.; Lafon, V.; Lubac, B.; Gernez, P. Atmospheric Corrections and Multi-Conditional Algorithm for Multi-Sensor Remote Sensing of Suspended Particulate Matter in Low-to-High Turbidity Levels Coastal Waters. Remote Sens. 2017, 9, 61. [Google Scholar]
  19. Warren, M.A.; Simis, S.G.H.; Selmes, N. Complementary water quality observations from high and medium resolution Sentinel sensors by aligning chlorophyll-a and turbidity algorithms. Remote Sens. Environ. 2021, 265, 112651. [Google Scholar] [PubMed]
  20. Caballero, I.; Stumpf, R.P.; Meredith, A. Preliminary Assessment of Turbidity and Chlorophyll Impact on Bathymetry Derived from Sentinel-2A and Sentinel-3A Satellites in South Florida. Remote Sens. 2019, 11, 645. [Google Scholar]
  21. Wang, D.; Ma, R.; Xue, K.; Loiselle, S.A. The Assessment of Landsat-8 OLI Atmospheric Correction Algorithms for Inland Waters. Remote Sens. 2019, 11, 169. [Google Scholar] [CrossRef]
  22. Warren, M.A.; Simis, S.G.H.; Martinez-Vicente, V.; Poser, K.; Bresciani, M.; Alikas, K.; Spyrakos, E.; Giardino, C.; Ansper, A. Assessment of atmospheric correction algorithms for the Sentinel-2A MultiSpectral Imager over coastal and inland waters. Remote Sens. Environ. 2019, 225, 267–289. [Google Scholar] [CrossRef]
  23. Zhang, M.; Hu, C. Evaluation of Remote Sensing Reflectance Derived From the Sentinel-2 Multispectral Instrument Observations Using POLYMER Atmospheric Correction. IEEE Trans. Geosci. Remote Sens. 2020, 58, 5764–5771. [Google Scholar] [CrossRef]
  24. Kuhn, C.; Valerio, A.M.; Ward, N.; Loken, L.; Sawakuchi, H.O.; Kampel, M.; Richey, J.; Stadler, P.; Crawford, J.; Striegl, R.; et al. Performance of Landsat-8 and Sentinel-2 surface reflectance products for river remote sensing retrievals of chlorophyll-a and turbidity. Remote Sens. Environ. 2019, 224, 104–118. [Google Scholar] [CrossRef]
  25. Cao, Z.; Ma, R.; Liu, M.; Duan, H.; Xiao, Q.; Xue, K.; Shen, M. Harmonized Chlorophyll-a Retrievals in Inland Lakes From Landsat-8/9 and Sentinel 2A/B Virtual Constellation Through Machine Learning. IEEE Trans. Geosci. Remote Sens. 2022, 60, 1–16. [Google Scholar] [CrossRef]
  26. Güttler, F.N.; Niculescu, S.; Gohin, F. Turbidity retrieval and monitoring of Danube Delta waters using multi-sensor optical remote sensing data: An integrated view from the delta plain lakes to the western—Northwestern Black Sea coastal zone. Remote Sens. Environ. 2013, 132, 86–101. [Google Scholar] [CrossRef]
  27. Yin, Z.; Li, J.; Liu, Y.; Xie, Y.; Zhang, F.; Wang, S.; Sun, X.; Zhang, B. Water clarity changes in Lake Taihu over 36 years based on Landsat TM and OLI observations. Int. J. Appl. Earth Obs. 2021, 102, 102457. [Google Scholar] [CrossRef]
  28. Lyu, H.; Yang, Z.; Shi, L.; Li, Y.; Guo, H.; Zhong, S.; Miao, S.; Bi, S.; Li, Y. A Novel Algorithm to Estimate Phytoplankton Carbon Concentration in Inland Lakes Using Sentinel-3 OLCI Images. IEEE Trans. Geosci. Remote Sens. 2020, 58, 6512–6523. [Google Scholar] [CrossRef]
  29. Liu, D.; Yu, S.; Xiao, Q.; Qi, T.; Duan, H. Satellite estimation of dissolved organic carbon in eutrophic Lake Taihu, China. Remote Sens. Environ. 2021, 264, 112572. [Google Scholar] [CrossRef]
  30. Telesnicki, G.J.; Goldberg, W.M. Comparison of turbidity measurement by nephelometry and transmissometry and its relevance to water quality standards. B Mar. Sci. 1995, 57, 540–547. [Google Scholar]
  31. Brockmann, C.; Doerffer, R.; Peters, M.; Kerstin, S.; Embacher, S.; Ruescas, A. Evolution of the C2RCC neural network for Sentinel 2 and 3 for the retrieval of ocean colour products in normal and extreme optically complex waters. In Proceedings of the Living Planet Symposium 2016, Prague, Czech Republic, 9–13 May 2016; pp. 9–13. [Google Scholar]
  32. Vanhellemont, Q.; Ruddick, K. Atmospheric correction of metre-scale optical satellite data for inland and coastal water applications. Remote Sens. Environ. 2018, 216, 586–597. [Google Scholar] [CrossRef]
  33. Duan, H.; Feng, L.; Ma, R.; Zhang, Y.; Loiselle, S.A. Variability of particulate organic carbon in inland waters observed from MODIS Aqua imagery. Environ. Res. 2014, 9, 084011. [Google Scholar] [CrossRef]
  34. Feng, L.; Hu, C.; Han, X.; Chen, X.; Qi, L. Long-Term Distribution Patterns of Chlorophyll-a Concentration in China’s Largest Freshwater Lake: MERIS Full-Resolution Observations with a Practical Approach. Remote Sens. 2015, 7, 275–299. [Google Scholar] [CrossRef]
  35. Zhang, Y.; Ma, R.; Duan, H.; Loiselle, S.; Zhang, M.; Xu, J. A novel MODIS algorithm to estimate chlorophyll a concentration in eutrophic turbid lakes. Ecol. Ind. 2016, 69, 138–151. [Google Scholar] [CrossRef]
  36. Feng, L.; Hou, X.; Li, J.; Zheng, Y. Exploring the potential of Rayleigh-corrected reflectance in coastal and inland water applications: A simple aerosol correction method and its merits. ISPRS J. Photogramm. Remote Sens. 2018, 146, 52–64. [Google Scholar] [CrossRef]
  37. Bailey, S.W.; Werdell, P.J. A multi-sensor approach for the on-orbit validation of ocean color satellite data products. Remote Sens. Environ. 2006, 102, 12–23. [Google Scholar] [CrossRef]
  38. Dogliotti, A.I.; Ruddick, K.G.; Nechad, B.; Doxaran, D.; Knaeps, E. A single algorithm to retrieve turbidity from remotely-sensed data in all coastal and estuarine waters. Remote Sens. Environ. 2015, 156, 157–168. [Google Scholar] [CrossRef]
  39. Cao, Z.; Ma, R.; Duan, H.; Pahlevan, N.; Melack, J.; Shen, M.; Xue, K. A machine learning approach to estimate chlorophyll-a from Landsat-8 measurements in inland lakes. Remote Sens. Environ. 2020, 248, 111974. [Google Scholar] [CrossRef]
  40. Shi, J.; Shen, Q.; Yao, Y.; Li, J.; Chen, F.; Wang, R.; Xu, W.; Gao, Z.; Wang, L.; Zhou, Y. Estimation of Chlorophyll-a Concen-trations in Small Water Bodies: Comparison of Fused Gaofen-6 and Sentinel-2 Sensors. Remote Sens. 2022, 14, 229. [Google Scholar] [CrossRef]
  41. Hafeez, S.; Wong, M.S.; Ho, H.C.; Nazeer, M.; Nichol, J.E.; Abbas, S.; Tang, D.; Lee, K.-H.; Pun, L. Comparison of Machine Learning Algorithms for Retrieval of Water Quality Indicators in Case-II Waters: A Case Study of Hong Kong. Remote Sens. 2019, 11, 617. [Google Scholar] [CrossRef]
  42. Guo, H.; Huang, J.J.; Chen, B.; Guo, X.; Singh, V.P. A Machine Learning-Based Strategy for Estimating Non-Optically Active Water Quality Parameters Using Sentinel-2 Imagery. Int. J. Remote Sens. 2020, 42, 1841–1866. [Google Scholar] [CrossRef]
  43. Chen, T.; Guestrin, C. XGBoost: A Scalable Tree Boosting System. In Proceedings of the KDD’16: 22nd ACM SIGKDD Inter-national Conference on Knowledge Discovery and Data Mining, New York, NY, USA, 13–17 August 2016; pp. 785–794. [Google Scholar]
  44. Mountrakis, G.; Im, J.; Ogole, C. Support vector machines in remote sensing: A review. ISPRS J. Photogramm. Remote Sens. 2011, 66, 247–259. [Google Scholar] [CrossRef]
  45. Huangfu, K.; Li, J.; Zhang, X.; Zhang, J.; Cui, H.; Sun, Q. Remote Estimation of Water Quality Parameters of Medium- and Small-Sized Inland Rivers Using Sentinel-2 Imagery. Water 2020, 12, 3124. [Google Scholar] [CrossRef]
  46. Yang, Z.; Gong, C.; Ji, T.; Hu, Y.; Li, L. Water Quality Retrieval from ZY1-02D Hyperspectral Imagery in Urban Water Bodies and Comparison with Sentinel-2. Remote Sens. 2022, 14, 5029. [Google Scholar] [CrossRef]
  47. Hafeez, S.; Wong, M.S.; Abbas, S.; Asim, M. Evaluating Landsat-8 and Sentinel-2 Data Consistency for High Spatiotemporal Inland and Coastal Water Quality Monitoring. Remote Sens. 2022, 14, 3155. [Google Scholar] [CrossRef]
  48. Seegers, B.N.; Stumpf, R.P.; Schaeffer, B.; Loftin, K.A.; Werdell, P.J. Performance metrics for the assessment of satellite data products: An ocean color case study. Opt. Express 2018, 26, 7404–7422. [Google Scholar] [CrossRef]
  49. Pahlevan, N.; Smith, B.; Alikas, K.; Anstee, J.; Barbosa, C.; Binding, C.; Bresciani, M.; Cremella, B.; Giardino, C.; Gurlin, D.; et al. Simultaneous retrieval of selected optical water quality indicators from Landsat-8, Sentinel-2, and Sentinel-3. Remote Sens. Environ. 2022, 270, 112860. [Google Scholar] [CrossRef]
  50. Cao, Z.; Ma, R.; Pahlevan, N.; Liu, M.; Melack, J.M.; Duan, H.; Xue, K.; Shen, M. Evaluating and optimizing VIIRS retrievals of chlorophyll-a and suspended particulate matter in turbid lakes using a machine learning approach. IEEE Trans. Geosci. Remote Sens. 2022, 60, 1–17. [Google Scholar] [CrossRef]
  51. Vanhellemont, Q.; Ruddick, K. Turbid wakes associated with offshore wind turbines observed with Landsat 8. Remote Sens. Environ. 2014, 145, 105–115. [Google Scholar] [CrossRef]
  52. Sent, G.; Biguino, B.; Favareto, L.; Cruz, J.; Sá, C.; Dogliotti, A.I.; Palma, C.; Brotas, V.; Brito, A.C. Deriving Water Quality Parameters Using Sentinel-2 Imagery: A Case Study in the Sado Estuary, Portugal. Remote Sens. 2021, 13, 1043. [Google Scholar] [CrossRef]
  53. Feng, L.; Hu, C. Land adjacency effects on MODIS Aqua top-of-atmosphere radiance in the shortwave infrared: Statistical assessment and correction. J. Geophys. Res. 2017, 122, 4802–4818. [Google Scholar] [CrossRef]
  54. Buma, W.G.; Lee, S.-I. Evaluation of Sentinel-2 and Landsat 8 Images for Estimating Chlorophyll-a Concentrations in Lake Chad, Africa. Remote Sens. 2020, 12, 2437. [Google Scholar] [CrossRef]
  55. Pahlevan, N.; Smith, B.; Binding, C.; O’Donnell, D.M. Spectral band adjustments for remote sensing reflectance spectra in coastal/inland waters. Opt. Express 2017, 25, 28650–28667. [Google Scholar] [CrossRef]
  56. Hu, C.; Feng, L.; Guan, Q. A Machine Learning Approach to Estimate Surface Chlorophyll a Concentrations in Global Oceans From Satellite Measurements. IEEE Trans. Geosci. Remote Sens. 2021, 59, 4590–4607. [Google Scholar] [CrossRef]
  57. Pahlevan, N.; Smith, B.; Schalles, J.; Binding, C.; Cao, Z.; Ma, R.; Alikas, K.; Kangro, K.; Gurlin, D.; Nguyen, H.; et al. Seamless retrievals of chlorophyll-a from Sentinel-2 (MSI) and Sentinel-3 (OLCI) in inland and coastal waters: A machine-learning approach. Remote Sens. Environ. 2020, 240, 111604. [Google Scholar] [CrossRef]
  58. Xu, G.; Li, P.; Lu, K.; Tantai, Z.; Zhang, J.; Ren, Z.; Wang, X.; Yu, K.; Shi, P.; Cheng, Y. Seasonal changes in water quality and its main influencing factors in the Dan River basin. CATENA 2018, 173, 131–140. [Google Scholar] [CrossRef]
  59. Feng, L.; Hou, X.; Zheng, Y. Monitoring and understanding the water transparency changes of fifty large lakes on the Yangtze Plain based on long-term MODIS observations. Remote Sens. Environ. 2019, 221, 675–686. [Google Scholar] [CrossRef]
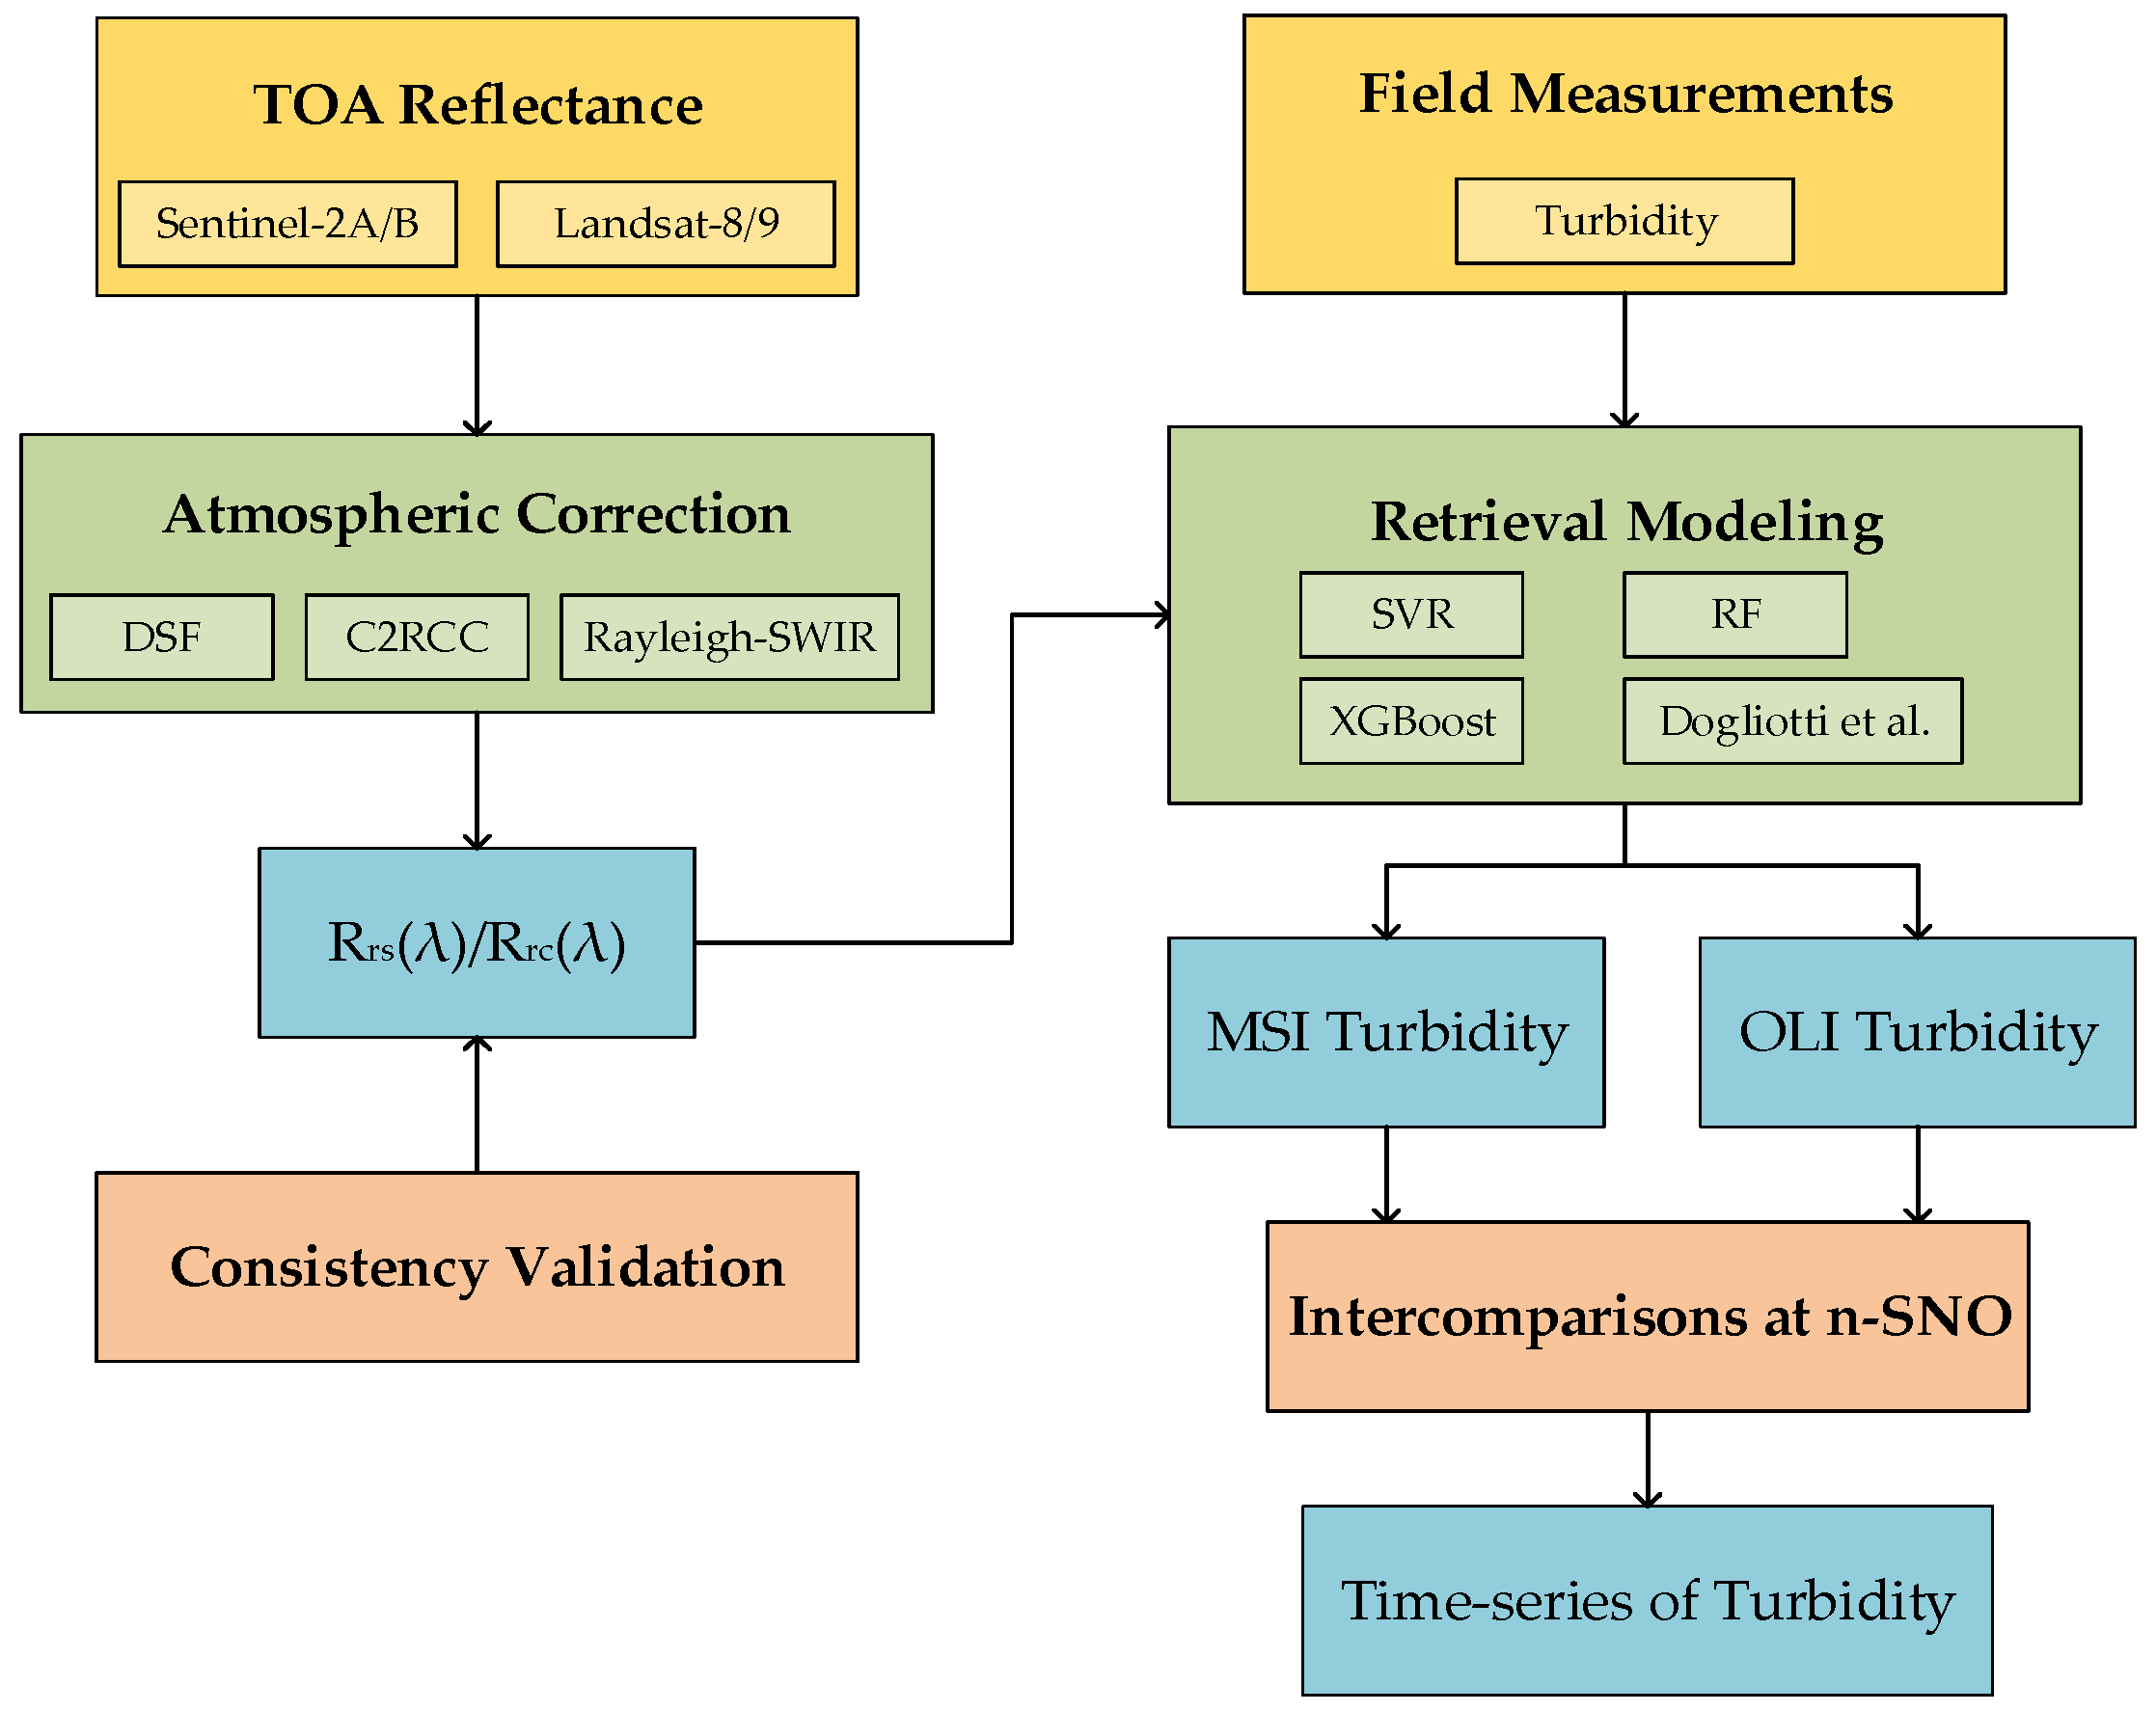
Figure 1. Flow chart of this study, yellow rectangles represent the input, green rectangles represent the model, blue rectangles represent the output, and orange rectangles represent the validation.
Remotesensing 15 04333 g001
Figure 2. Location of Taihu Lake in Eastern China (a) and 11 automatic water quality stations (b).
Remotesensing 15 04333 g002
Figure 3. Temporal distributions of the MSI and OLI images from 2018 to 2023.
Remotesensing 15 04333 g003
Figure 4. Distributions of MSI-matched turbidity (a) and OLI-matched turbidity (b) in this study.
Remotesensing 15 04333 g004
Figure 5. The intercomparisons (n = 3260) of R r c products from MSI and OLI at n-SNO, (ae) represent the comparison of five similar bands of MSI and OLI, respectively.
Remotesensing 15 04333 g005aRemotesensing 15 04333 g005b
Figure 6. Average R r c at MSI (a) and OLI (b) bands in different turbidity ranges.
Remotesensing 15 04333 g006
Figure 7. Performance evaluation of turbidity retrieval using XGBoost (a), SVR (b), RF (c), and Dogliotti et al. (d). Blue circles represent MSI, and red circles represent OLI.
Remotesensing 15 04333 g007
Figure 8. Comparison of the same-day MSI and OLI images derived turbidity. Part of the images on 23 February 2018 were masked due to cloud cover. (a,b) are comparisons on 23 February 2018, (c,d) are comparisons on 19 December 2022, and (e,f) are comparisons on 28 January 2023.
Remotesensing 15 04333 g008aRemotesensing 15 04333 g008b
Figure 9. Intercomparisons (n = 3110) of turbidity products from MSI and OLI at n-SNO.
Remotesensing 15 04333 g009
Figure 10. Mean turbidity distributions derived from MSI and OLI images in Taihu Lake from 2018 to 2022 (ae).
Remotesensing 15 04333 g010
Figure 11. Seasonal mean turbidity in the spring (a), summer (b), autumn (c), and winter (d) in Taihu Lake from 2018 to 2023.
Remotesensing 15 04333 g011
Figure 12. Time-series of in situ and MSI- and OLI-derived turbidity for one station from 2018 to 2023 in Taihu Lake. The date of (a) is from 1 January 2018 to 30 June 2020 and the date of (b) is from 1 July 2020 to 28 February 2023.
Remotesensing 15 04333 g012aRemotesensing 15 04333 g012b
Table 1. Band setting and SNRs of Sentinel-2A/B MSI and Landsat-8/9 OLI.
Sentinel-2A/B MSILandsat-8/9 OLI
Center Wavelength (nm)Resolution (m)Signal-to-Noise RatioCenter Wavelength (nm)Resolution (m)Signal-to-Noise Ratio
443/44260136744330332
493/4921020648230381
560/5591023556130256
66510218655/65430134
70420243
741/74020212
783/78020220
83310213
865/864201558653092
2202/21862016522013040
Table 2. Statistics of turbidity from eleven stations matched with satellites. Std denotes the standard deviation.
SensorNumberTurbidity (NTU)
RangeMeanStd
MSI1936–2165039
OLI1018–2084734
Table 3. Statistical metrics for MSI-OLI intercomparisons of reflectance after AC.
DSF
Central Wavelength (nm)443492/483560/561665/655865
R20.650.690.490.790.61
MAPE20.47%13.38%12.37%20.47%81.70%
RMSE (sr−1)0.00460.00430.00550.00540.0069
ME (sr−1)0.00190.00140.00260.00360.0022
Slope1.100.980.720.910.86
C2RCC
Central Wavelength (nm)443492/483560/561665/655865
R20.840.830.750.760.77
MAPE22.58%27.78%50.49%57.43%70.50%
RMSE (sr−1)0.00140.00210.00550.00440.0010
ME (sr−1)−0.0005−0.0011−0.0033−0.0017−0.0007
Slope0.880.810.550.600.47
Rayleigh-SWIR
Central Wavelength (nm)443492/483560/561665/655865
R20.840.890.900.960.88
MAPE4.53%3.81%3.19%5.76%6.19%
RMSE0.00560.00490.00500.00560.0052
ME−0.00160.00090.00040.0035−3 × 10⁻⁵
Slope0.920.920.970.950.98
Disclaimer/Publisher’s Note: The statements, opinions and data contained in all publications are solely those of the individual author(s) and contributor(s) and not of MDPI and/or the editor(s). MDPI and/or the editor(s) disclaim responsibility for any injury to people or property resulting from any ideas, methods, instructions or products referred to in the content.