Article

A Signal Model Based on the Space–Time Coding Array and a Novel Imaging Method Based on the Hybrid Correlation Algorithm for F-SCAN SAR

1
School of Electronics and Information Engineering, Beihang University, Beijing 100191, China
2
Shanghai Institute of Satellite Engineering, Shanghai 201100, China
*
Author to whom correspondence should be addressed.
Remote Sens. 2023, 15(17), 4276; https://doi.org/10.3390/rs15174276
Submission received: 26 July 2023 / Revised: 28 August 2023 / Accepted: 28 August 2023 / Published: 31 August 2023

Abstract

:
The F-SCAN principle is a better alternative to the scan-on-receive technique (SCORE) based on digital beamforming (DBF), which can avoid low gain caused by a conventional broad beam in the case of a wide swath. In F-SCAN SAR, a pencil beam scans the entire target area from far to near, providing high energy independent of the position and ensuring a low range ambiguity-to-signal ratio (RASR). Moreover, echo compression can be achieved via appropriate system parameter configuration, significantly shortening the receive window and reducing the amount of data. A wider range swath can, therefore, be achieved. However, for this novel F-SCAN SAR working mode, signal modeling and imaging processing are key issues that needed to be addressed. In this paper, the far-field synthetic antenna pattern of the space–time coding array (STCA) is first derived and analyzed, based on which the signal modeling of the F-SCAN SAR is carried out. Then, according to the signal model and echo characteristics, a novel imaging processing method based on the hybrid correlation algorithm is presented for the F-SCAN SAR. First, the dechirp operation is performed to compensate for the quadratic phase of the range time. The range compressed result is obtained after a range Fourier transform, where different range targets are successfully separated and range aliasing is avoided. Then, the modified azimuth reference function is correlated with the echo at each range cell to complete range cell migration correction (RCMC) and azimuth compensation. The received signal parameters and the Doppler parameters of each range cell are derived to update the azimuth reference function. Finally, accurate focused results are obtained in the range-frequency, azimuth-time domain. The simulation results indicate that the signal model based on the STCA can satisfy the requirements of the F-SCAN principle, and the proposed imaging algorithm can complete the precise focusing processing of the F-SCAN SAR echo.

Graphical Abstract

1. Introduction

Synthetic Aperture Radar (SAR) is a tool for earth observation with unique advantages. Its imaging process is independent of sunlight and weather conditions, and it has a certain ability to penetrate ground objects [1,2]. High-resolution and wide-swath (HRWS) imaging is an important research direction for SAR. A wider swath means that a larger area is covered in the across track direction on a single satellite pass, and more objects are illuminated by a broad beam. A reduced revisit time is also achieved, which is conducive to improving observation efficiency and realizing real-time observation. In conventional SAR, the elevation beamwidth is broadened to cover a wider area by reducing the antenna size, but this also results in low transmitted power that is insufficient to separate the useful information from the noise. The large amount of data generated by the wide swath also puts pressure on the transmission link and real-time data processing. A multiple elevation beam (MEB) SAR [3,4], based on the phased array, has been developed to achieve a wide swath. However, it suffers from blind zones and severe range ambiguity due to the discontinuity between multiple static beams. The scan-on-receive (SCORE) technique, based on digital beamforming (DBF) [5,6,7,8,9,10,11,12], is more flexible, but has higher hardware complexity and channel performance requirements.
The F-SCAN principle [13,14] is a recently proposed analog beamforming technology that realizes echo compression and reduces the amount of data by using the frequency scanning effect, making it easier to achieve a wide swath. Unlike conventional SAR, which illuminates the entire target area simultaneously with a broad beam in the range direction, the F-SCAN SAR transmits a pencil beam to scan from the far end of the swath to the near end during the pulse duration. Compared to MEB or SCORE, which also transmit a wide beam, a higher signal-to-noise ratio (SNR) can be obtained and the peak power requirement can be alleviated. Furthermore, the range ambiguity-to-signal ratio (RASR) can be effectively reduced [15]. Liu et al. propose that range–frequency bandpass filters can effectively isolate range ambiguities introduced by pencil beam scanning, and they provide well-considered waveform design criteria [16]. If the pulse duration is equal to the difference between the two-way travel time of signals from the far end and the near end of the swath, echoes from all positions of the swath will reach the radar simultaneously [13,14]. Echo compression is achieved. The receive window, shorter than the pulse duration, is sufficient to receive all echoes. A comparison of the time–frequency diagrams in stripmap and the F-SCAN SAR is presented in [17], highlighting the advantage of receive window length reduction caused by echo compression: decreasing the data volume. The F-SCAN principle, with numerous unique advantages, has promising developments [18,19,20,21].
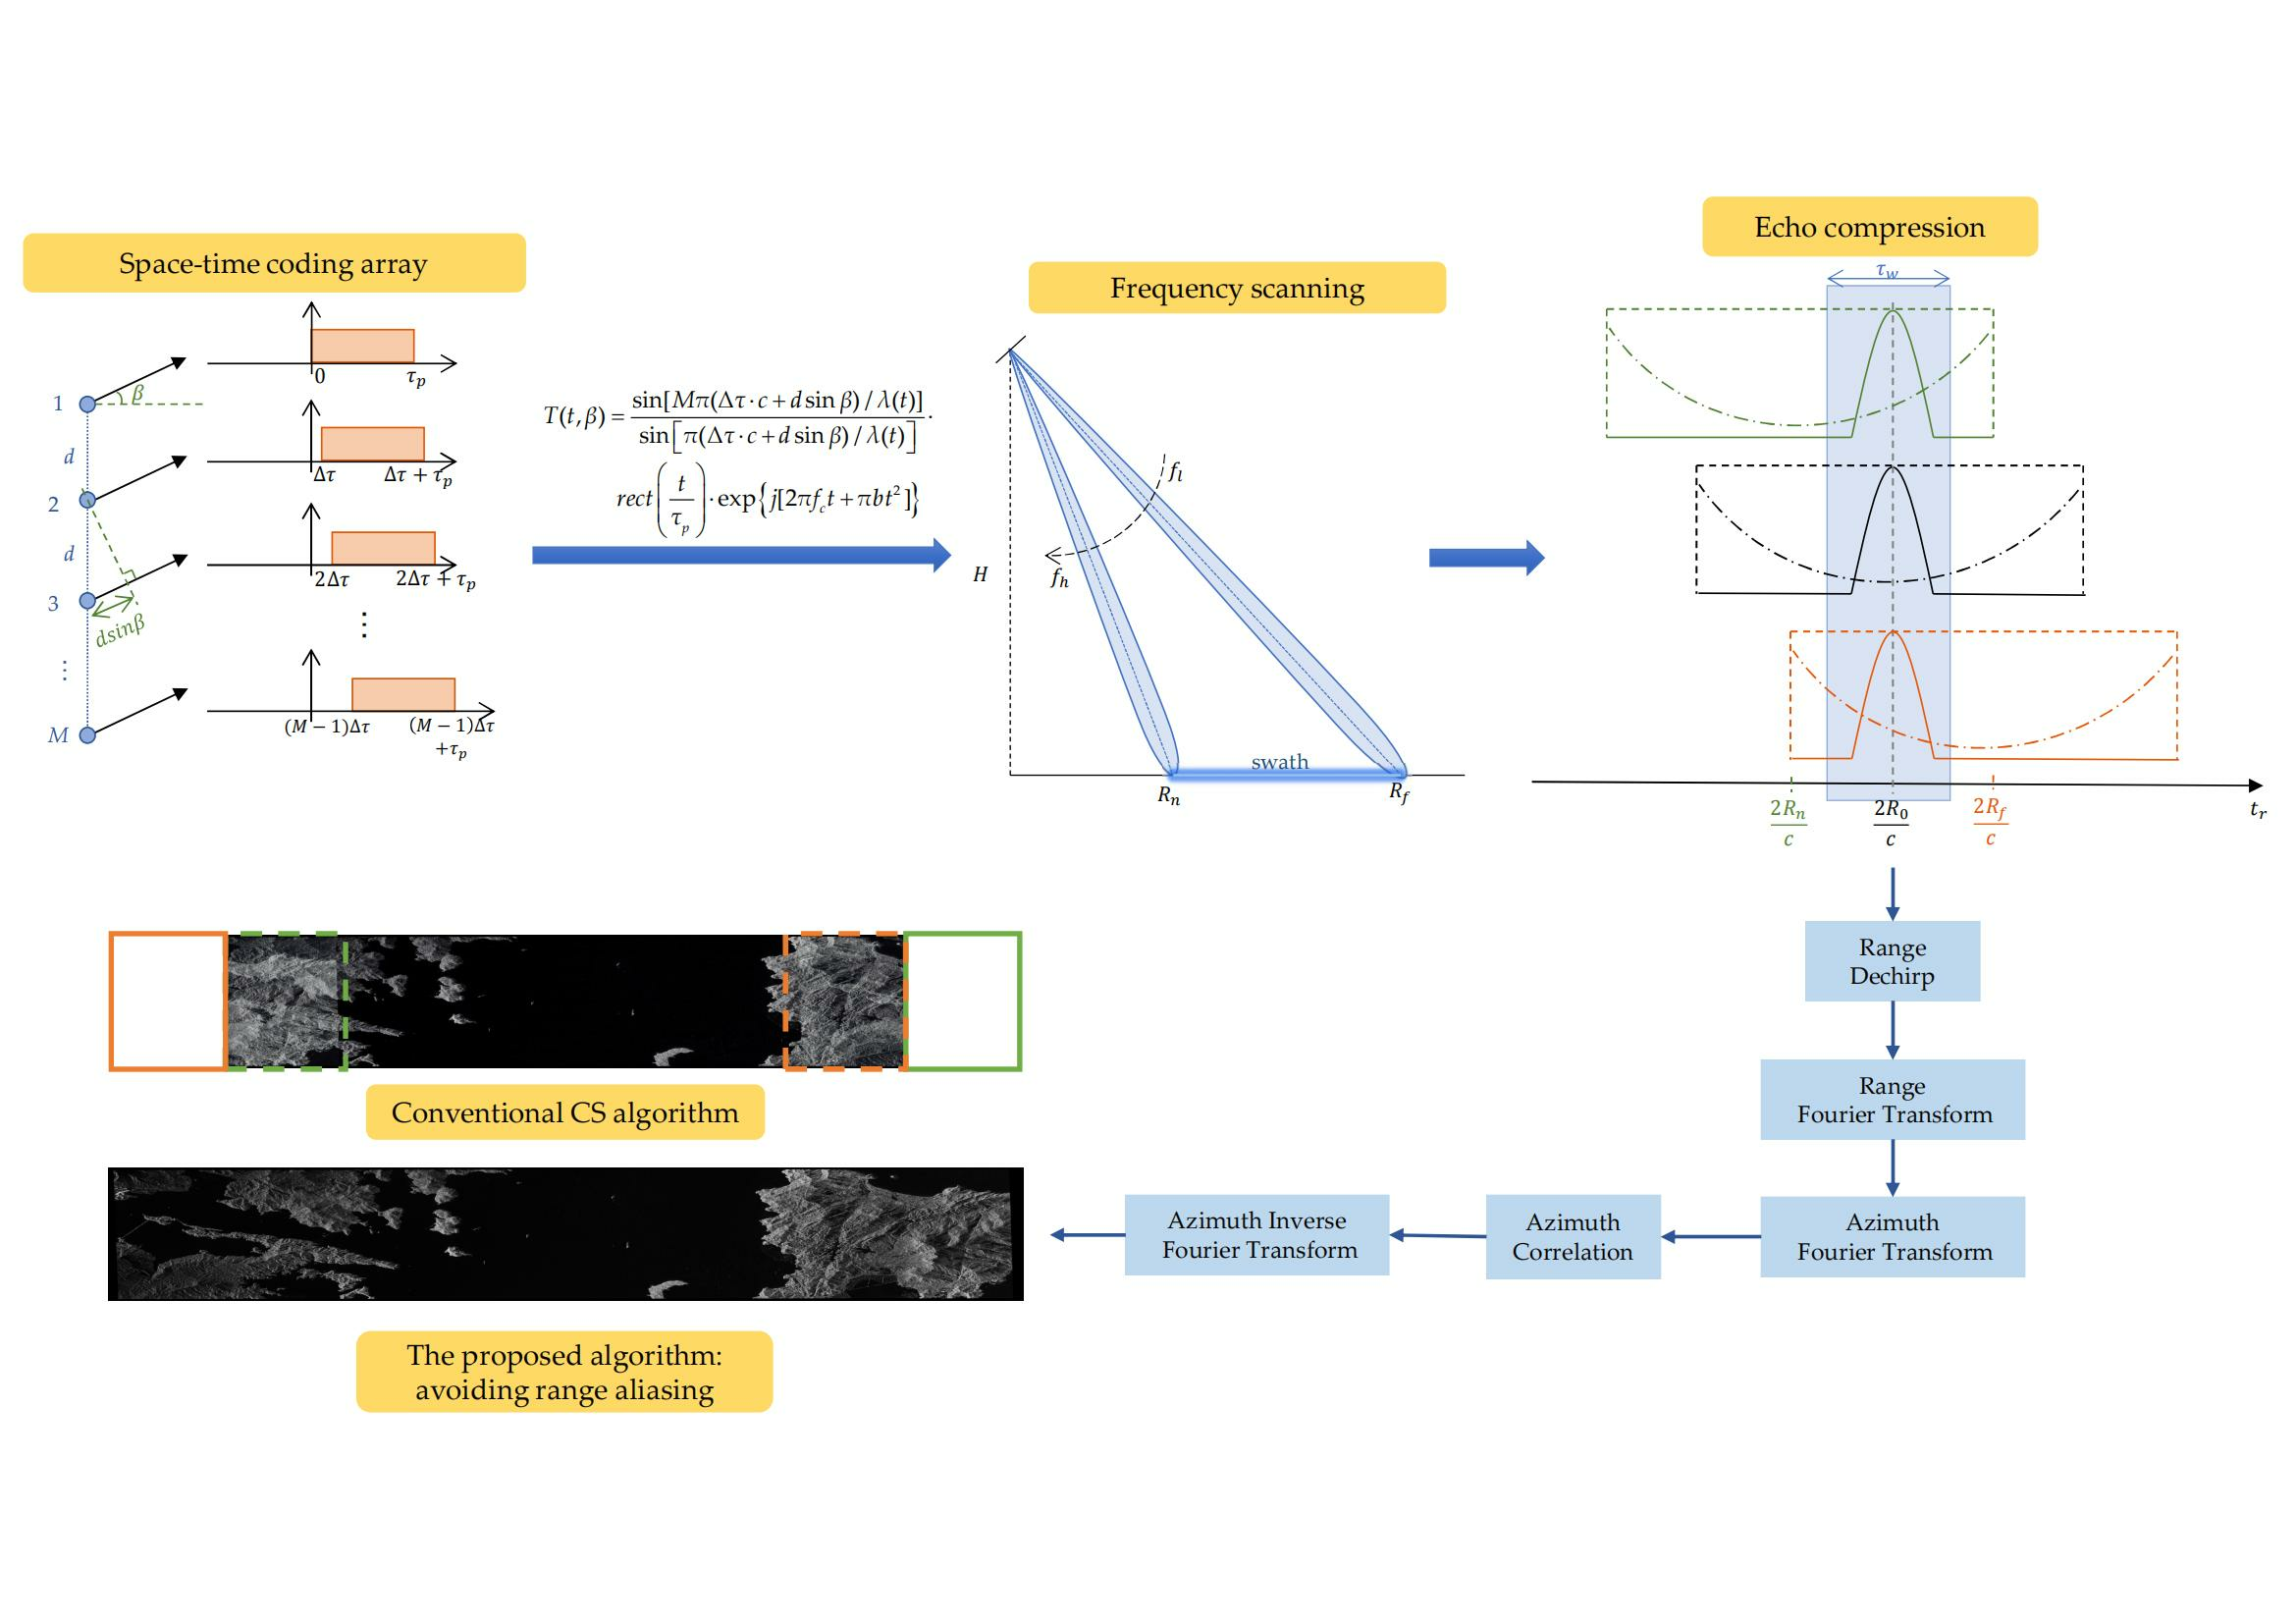
In order to realize the application of the F-SCAN SAR system, it is necessary to construct a transmitted signal model with frequency scanning capability. The waveform diverse array is a novel technology that can achieve flexible control of the transmitted beam direction by modulating the carrier frequency, transmitted time, or waveform coding for each channel [22,23]. Among them, the time diverse array achieves full airspace coverage with only one waveform by introducing a very small-time delay between the adjacent array elements. In [
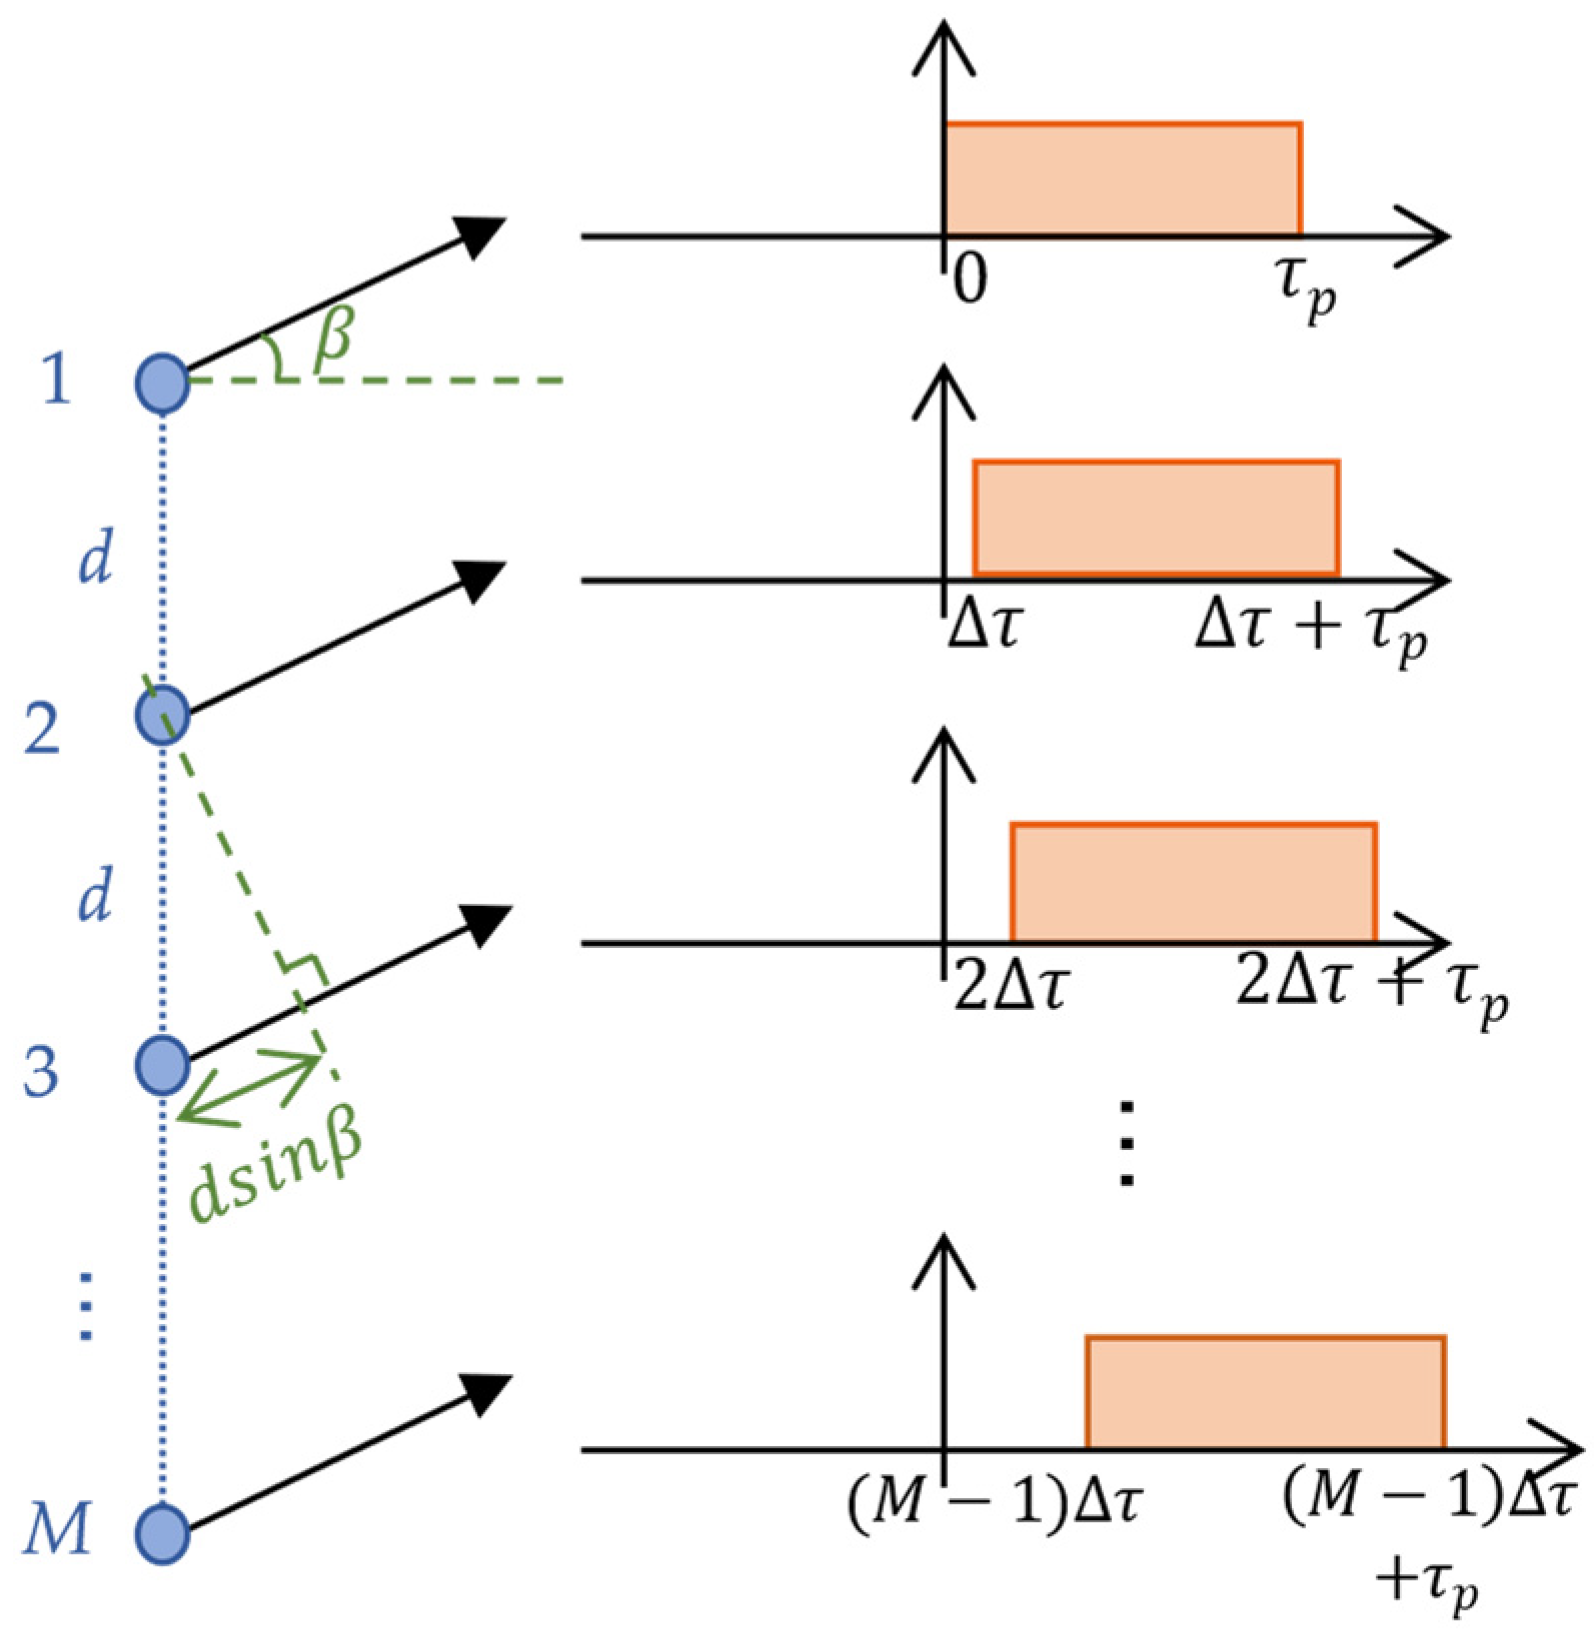
24], an F-SCAN acquisition mode is designed using true time delay lines and phase shifters. It can be noted that the time diverse array can be applied to the frequency scanning mode. Babur et al. propose the space–time coding array (STCA) to fulfill the time diversity and combine it with the MIMO radar [25,26,27]. The simulation results verify that the transmitted beam of the STCA has a beam scanning effect and tunable angular coverage capability, and constant high gain of the coverage area can be further achieved. It is a technically simple way to meet the beam requirements of the F-SCAN SAR. In this paper, the STCA is utilized to transmit linear frequency modulation signals to realize the frequency scanning effect of the F-SCAN SAR system. However, the beam scanning effect will lead to the failure of the traditional signal model, which is attributed to the different center frequencies and wavelengths of the received signals from targets at different range cells. In order to establish the signal model of the F-SCAN SAR system, it is necessary to construct the far-field synthetic antenna pattern of the transmitted signals and analyze the characteristics of the received signals from different range targets.
The unique characteristics of the F-SCAN SAR echo pose some problems for imaging processing. Echo compression causes echoes from different range targets to overlap at the receiver. Inadequate range time causes focused results to be aliased in the range direction. Few data processing methods for F-SCAN SAR have been presented up to now. The data processing in [24] is concerned with removing spectral distortions, ensuring that the impulse response function (IRF) is constant across the swath. The modified Omega-K algorithm is used to process the raw data in [16]. To avoid range aliasing, bandpass filtering and range IDFT processing must be employed for each range cell, significantly increasing the computational burden and processing time. Some applications of the frequency scanning technique in the azimuth direction are proposed by them, which have a high reference value for improving the azimuth dimension performance [28,29].
In this paper, a transmitted signal model that can realize the frequency scanning effect is first constructed. With each STCA channel transmitting the same chirp signal at different times, the synthetic antenna pattern in the far field is derived. On this basis, the construction of the F-SCAN SAR signal model is completed. According to the signal model and echo characteristics, a novel efficient imaging method based on the hybrid correlation algorithm [30,31,32] is proposed to address the issues introduced by elevation beam scanning. First, a dechirp operation is conducted on the raw data in the range-time domain, followed by a range Fourier transform to obtain the range compressed result without aliasing. The applicable azimuth reference function is then developed, which is updated with the range frequency. The approach for calculating the signal instantaneous parameters and matching the Doppler parameters at a certain slant range is provided. The data is correlated with the function at each range sampling cell to straighten the curved target trajectory and to implement azimuth matched filtering. Finally, well focused results are obtained in the range-frequency, azimuth-time domain. The simulation results verify the validity of the proposed theory.
The remainder of this paper is organized as follows. The description of the beam operation in the F-SCAN SAR and the analysis of the unique system characteristics caused by frequency scanning are presented in Section 2. In Section 3, the far-field synthetic antenna pattern of the STCA is derived, and the F-SCAN SAR echo model is established and analyzed on this foundation. An F-SCAN SAR imaging processing method based on the hybrid correlation algorithm is proposed in Section 4, including how to obtain signal instantaneous parameters and matched Doppler parameters. In Section 5, the simulation experiments are carried out to validate the proposed theoretical content. A discussion about the computational complexity of the imaging algorithm is presented in Section 6. In Section 7, conclusions are drawn.

2. System Characteristics of the F-SCAN SAR

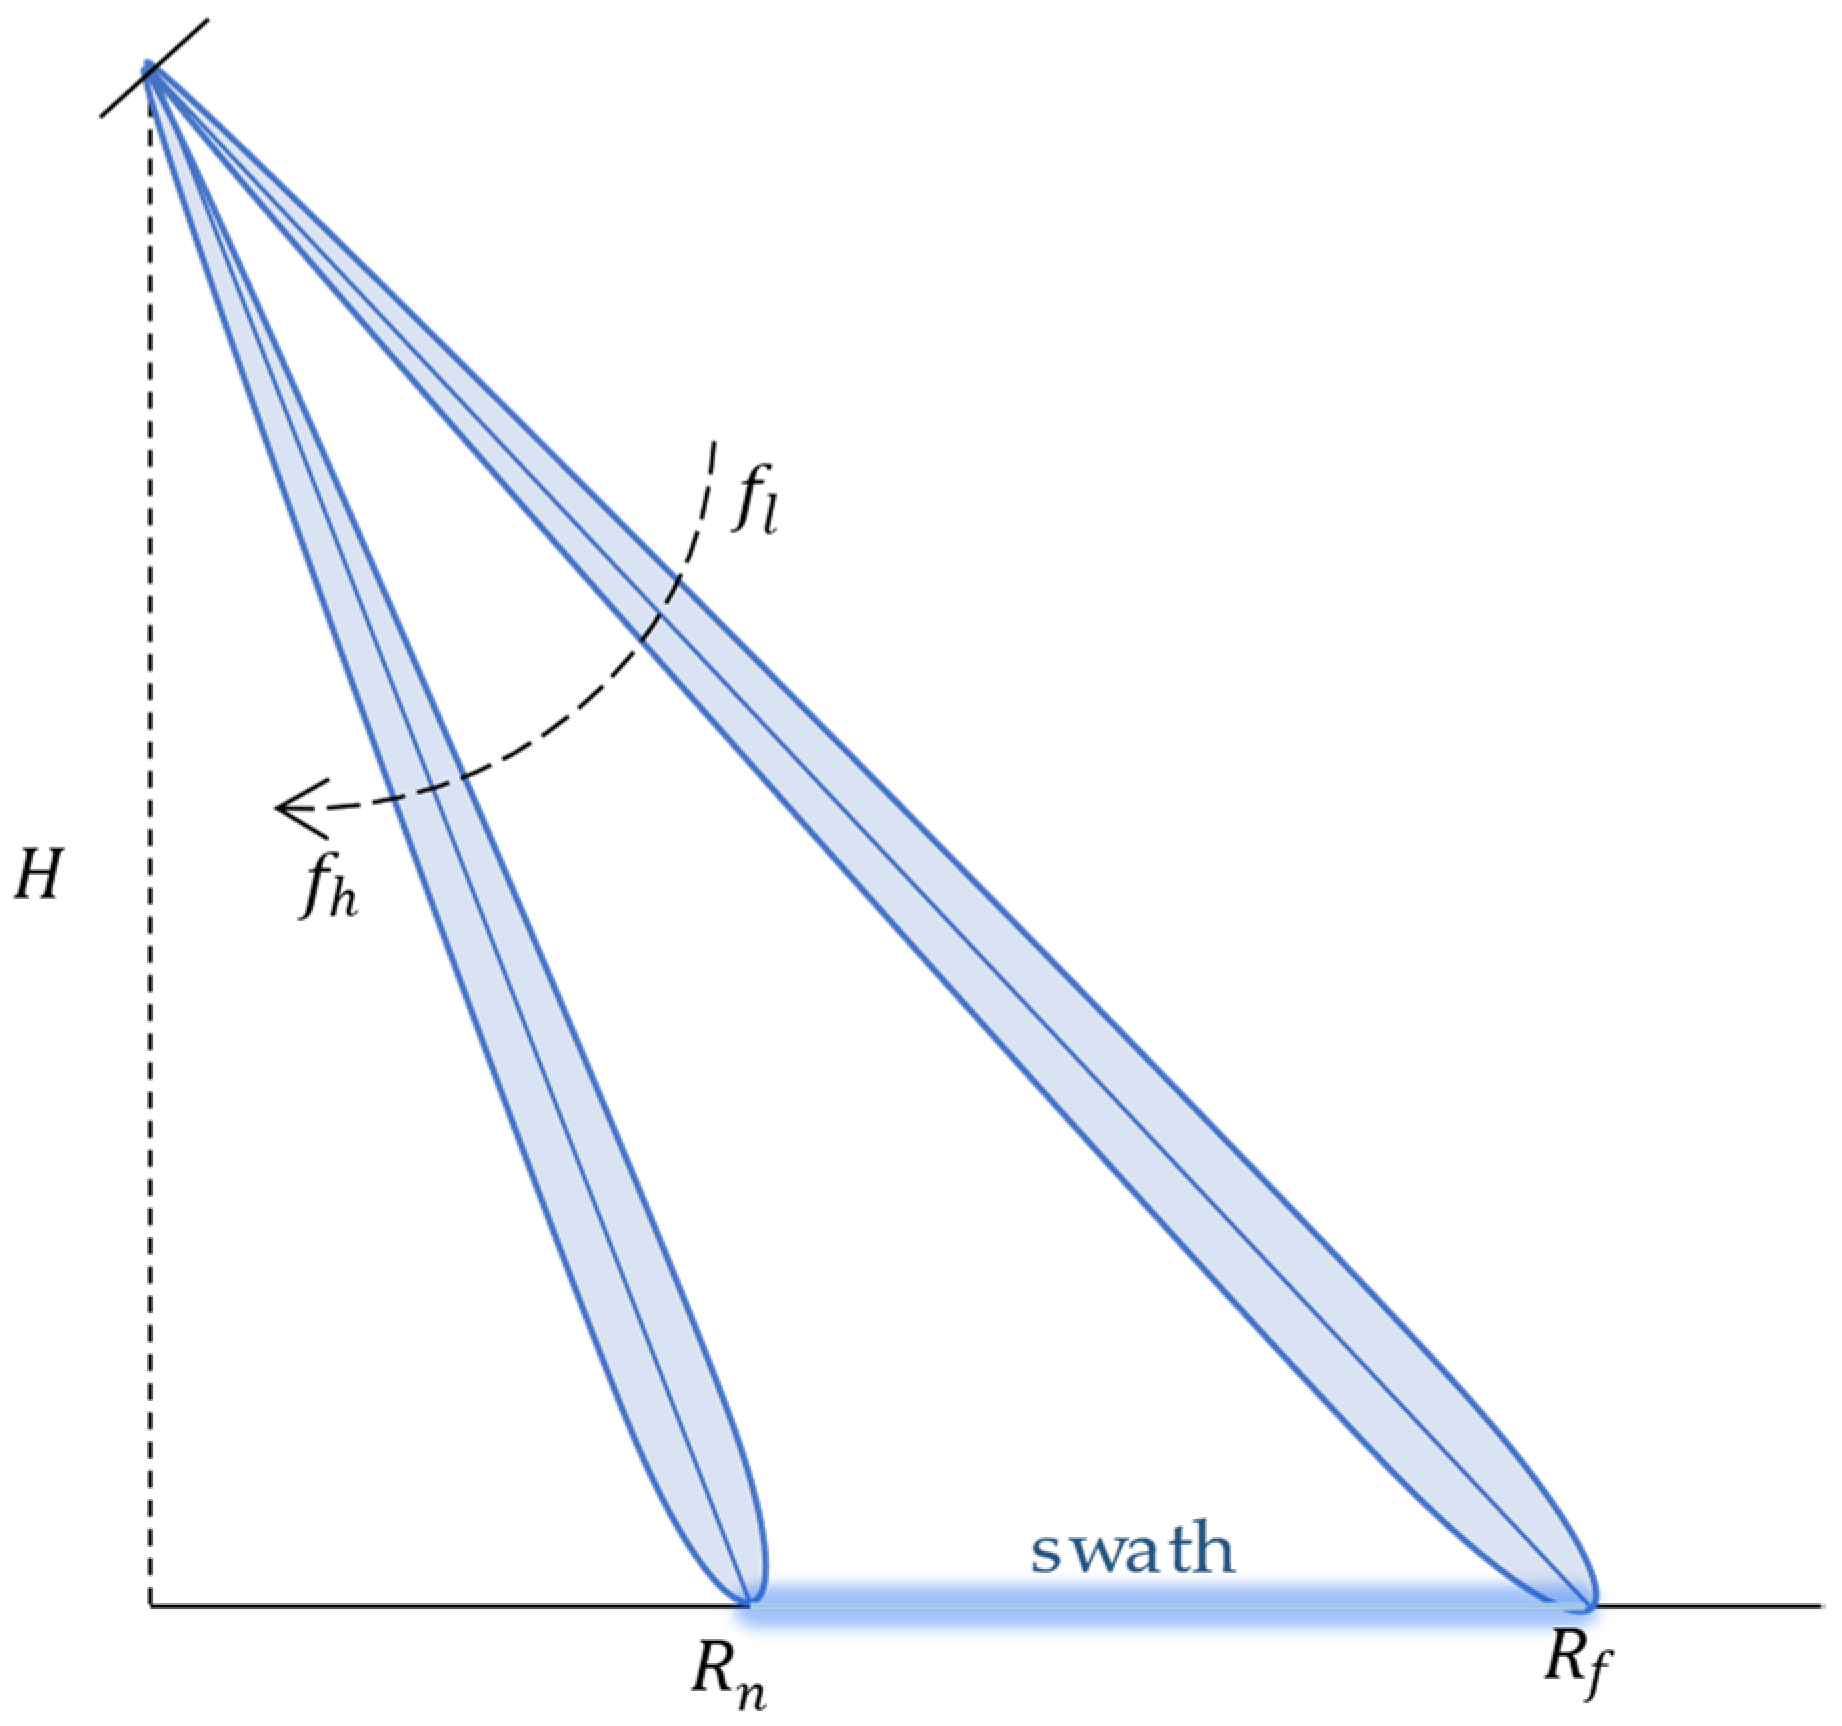
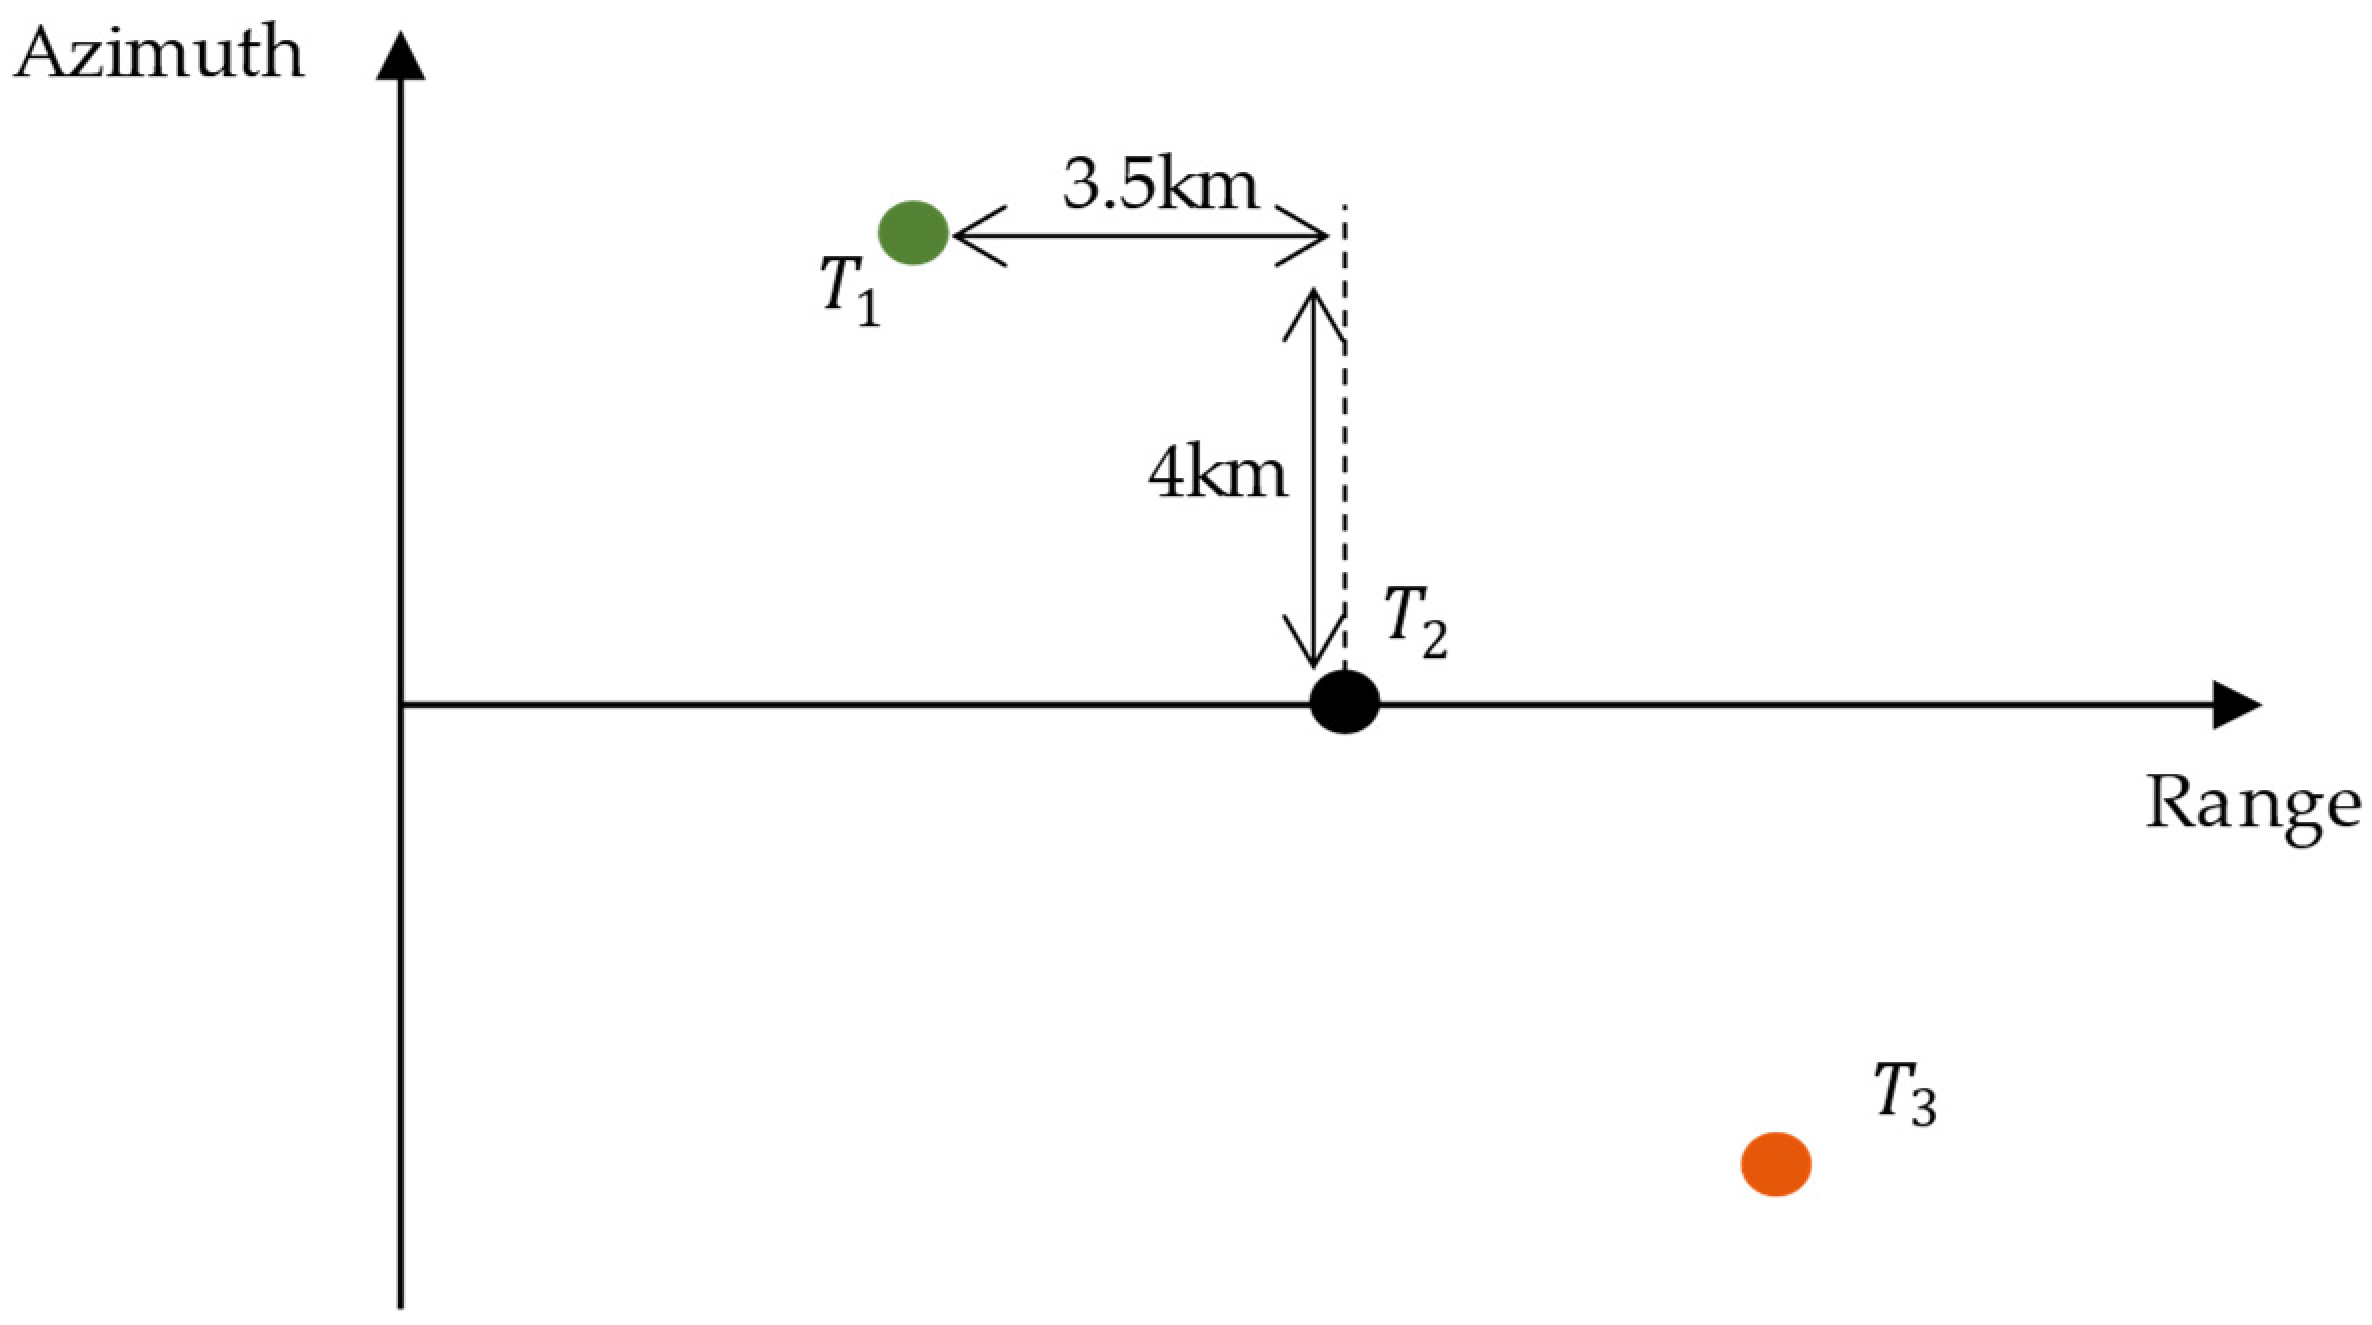
The combination of a frequency scanning antenna and chirp waveform allows the beam pointing to vary with the signal’s frequency, thereby controlling the available coverage. In F-SCAN SAR, a pencil beam is used in the range direction, and the beam control mode is shown in Figure 1. At the beginning of the pulse transmission, the signal’s instantaneous frequency is at its lowest and the beam is pointing to the far edge of the range swath. At the end of the pulse transmission, the beam with the highest instantaneous frequency points towards the near edge of the swath. This means that the pencil beam scans from the far range to the near range as the frequency of the up-chirp signal increases.
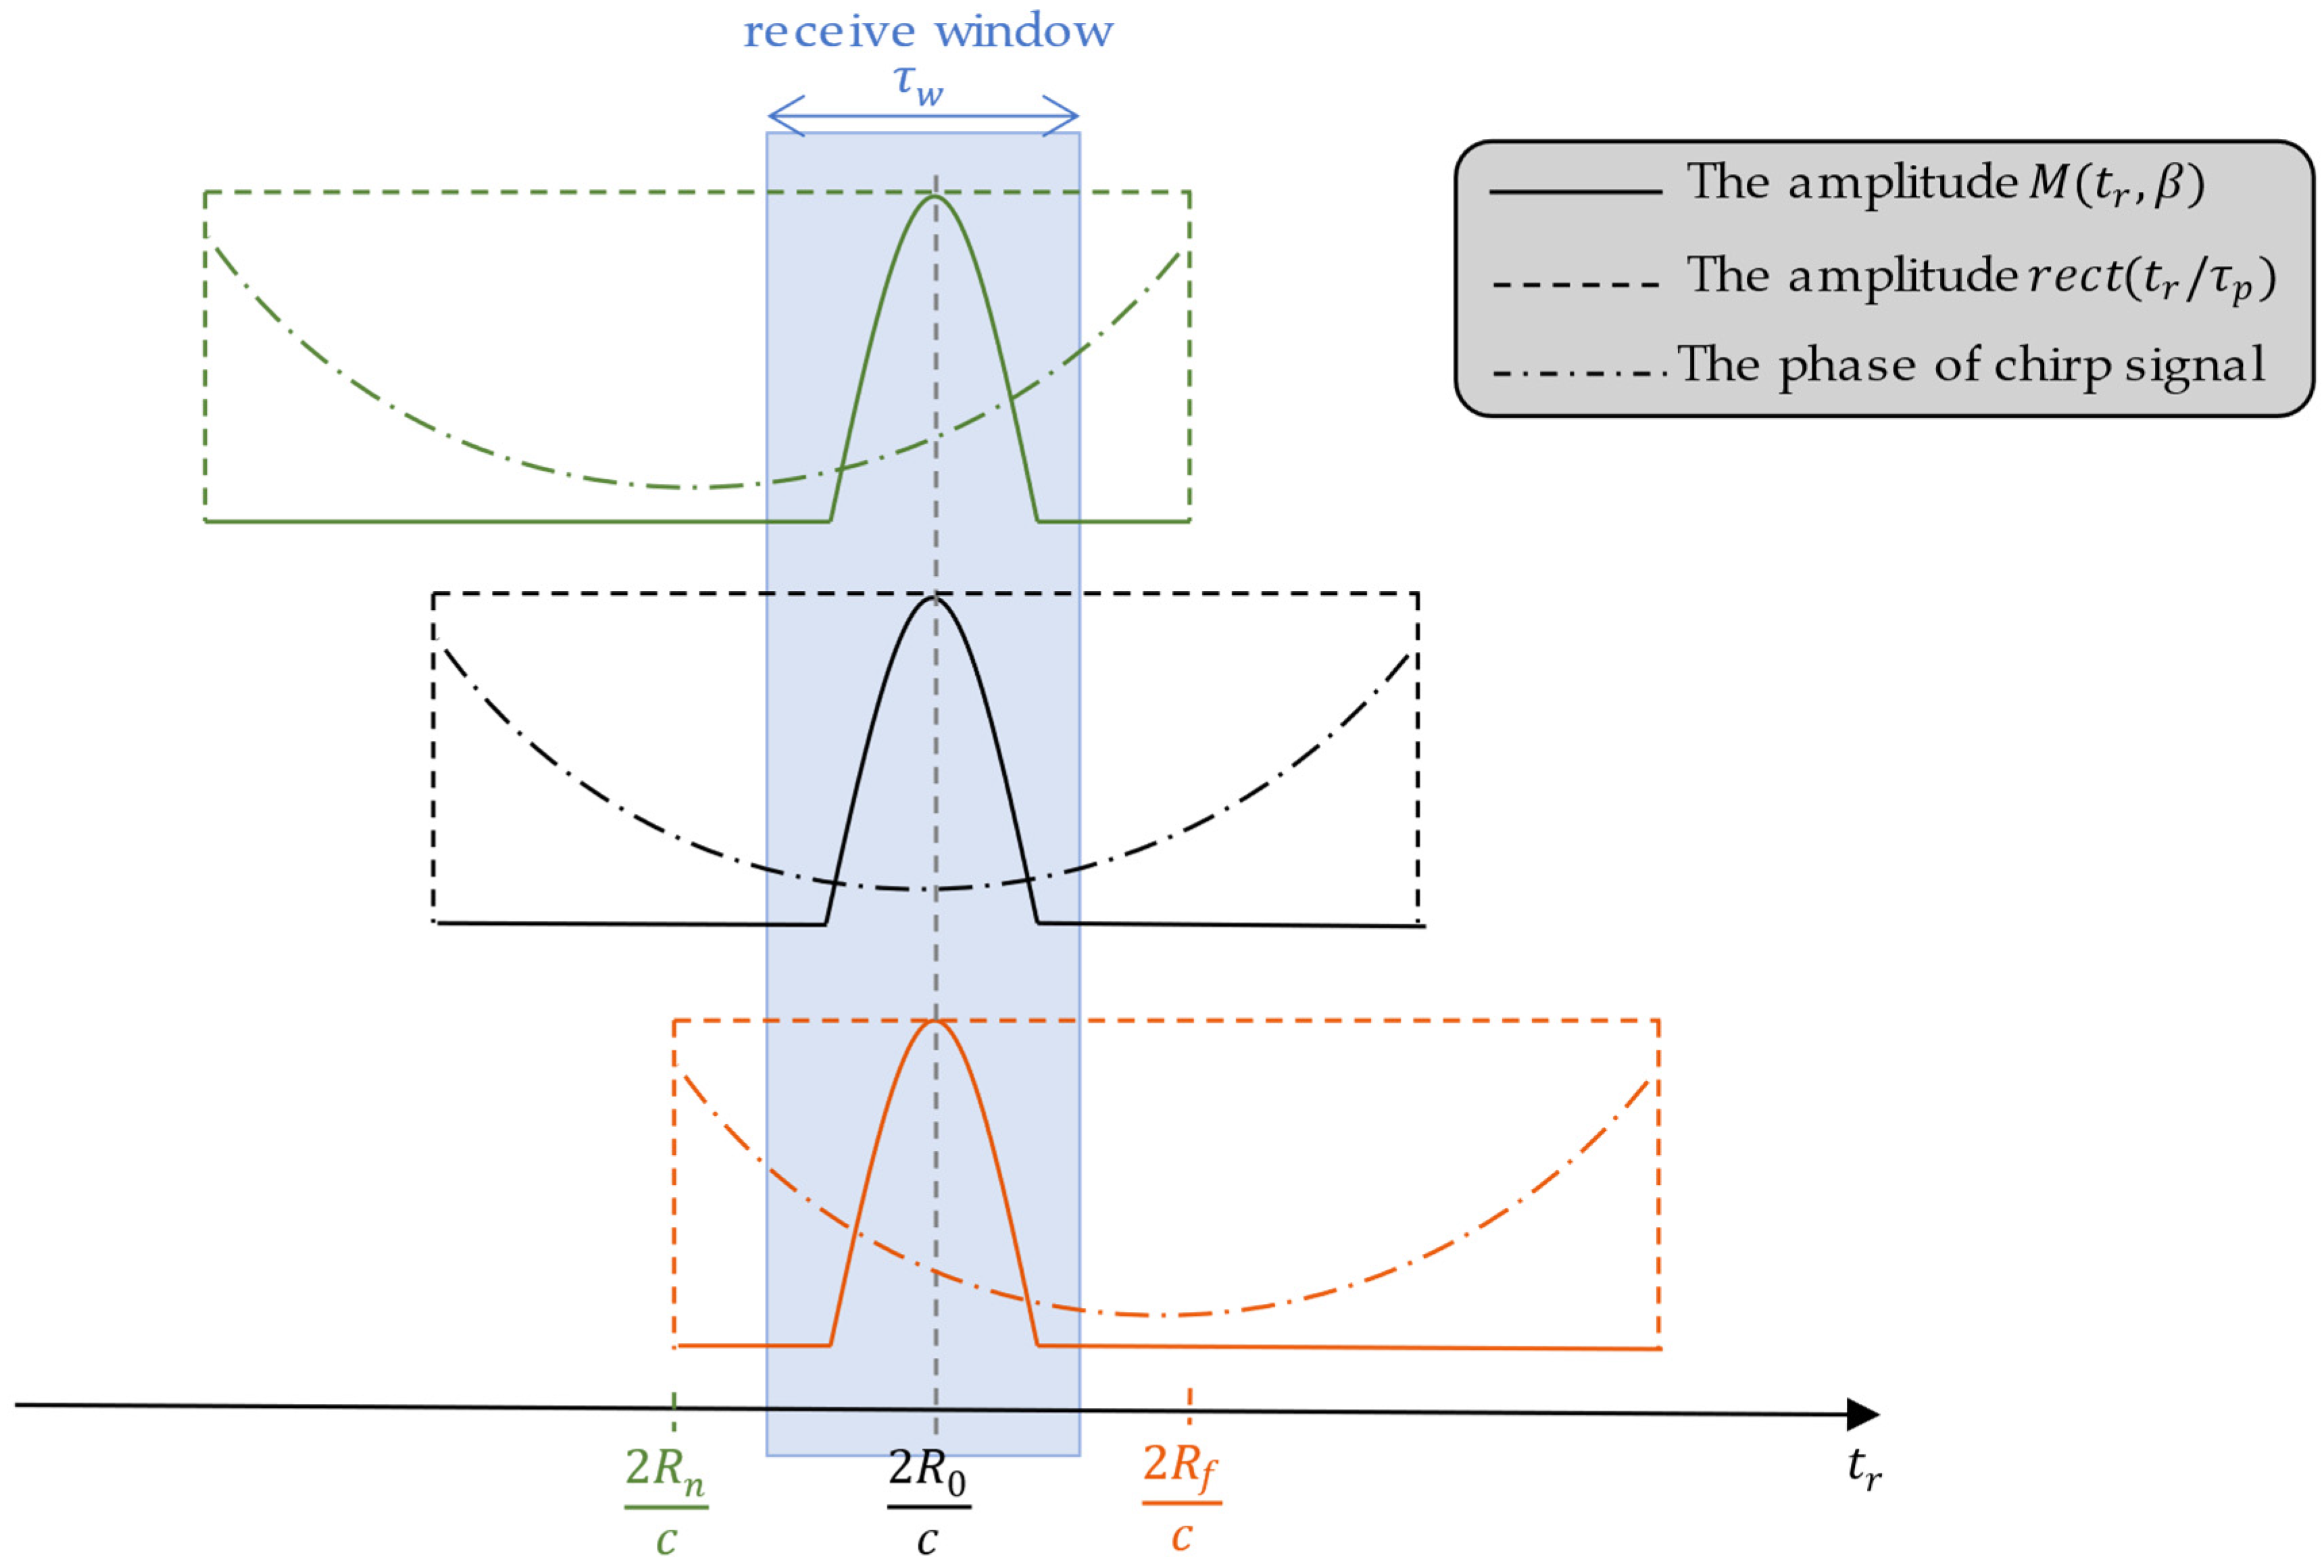
It is well known that a conventional SAR transmits a wide beam in the elevation plane to illuminate different directions across the entire range swath simultaneously. The echoes generated at the far end and near end of the swath are received by the radar at different times, as the unequal distances between the radar and different targets result in unequal travel times. In the case of a wide swath, there is a greater requirement for the length of the receive window. In the F-SCAN SAR, where the pencil beam scans from far to near, the signal pointing to the far end is transmitted earlier than the signal pointing to the near end. The following is relevant, when the transmitted pulse duration satisfies the following condition:
τ p = 2 R f R n c
where R f is the slant range of the farthest end of the swath, R n is the slant range of the nearest end, and c is the propagation velocity of the electromagnetic wave. The earlier transmission caused by beam scanning just compensates for the longer propagation time of the far-range signals, resulting in all the echoes from the different range targets arriving at the receiver at almost the same time. In contrast to the dispersion of echoes in a conventional SAR, all the echoes in the F-SCAN SAR can overlap at the same position and can be effectively compressed. This allows the length of the receive window to be set as the duration that one target is illuminated by the main lobe of the pencil beam. In pencil beam scans from far to near during the pulse transmission period, the time each target is illuminated is much shorter than the pulse duration. The amount of data being recorded and stored can be greatly reduced by making the sampling window shorter than τ p .
Targets at various range cells on the swath only experience a portion of the whole chirp signal during beam scanning, hence the effective bandwidth of the echo is smaller than the overall bandwidth of the transmitted signal. The relationship between the two is as follows:
B e = B t θ 3 d B θ 3 d B + α f α n
where B e is the effective bandwidth of the echo, B t is the total bandwidth of the transmitted chirp signal, θ 3 d B is the 3-dB width of the pencil beam, and α f and α n are the look angles at the far end and near end of the swath, respectively. The reduced effective bandwidth results in poorer resolution in the range direction, so it is necessary to transmit a broadband chirp signal or increase the width of the pencil beam to improve the resolution. In addition, Doppler parameters can no longer be calculated at a single wavelength because different range targets receive different sections of the transmitted chirp signal, resulting in varying center frequencies and wavelengths for different target echoes.
The high-gain pencil beam is used in the F-SCAN SAR to observe the entire target area, which produces a more uniform energy distribution than the wide beam used in conventional SAR and a higher SNR regardless of the position of the swath. Echo compression reduces the amount of data and enables a wider range swath. There is great development potential for the F-SCAN principle, which offers various special advantages. Due to the unique beam scanning in the F-SCAN SAR, the following problems need to be addressed: how to implement the beam scanning described in the F-SCAN principle and establish a signal model; and how to distinguish echoes compressed together from different range targets and avoid range aliasing to implement the imaging processing of the F-SCAN SAR.

3. Signal Modeling of the F-SCAN SAR

3.1. Modeling of the F-SCAN SAR Transmitted Signal

The space–time coding array automatically realizes beam scanning in space by transmitting the same waveform with a small relative delay from each array element, thus providing a consistent high gain over the available coverage area [25]. In this section, considering that each sensor of the STCA transmits the chirp signal that is commonly used in SAR systems, the synthetic antenna pattern is derived, which varies with the signal frequency and the direction. The mathematical relationship between the synthetic beam pointing angle and time is given in the next section, facilitating the subsequent matching of the signal parameters and imaging processing in the F-SCAN SAR.
A schematic diagram of the space–time coding array and its transmitted signals is presented in Figure 2. Each array element transmits exactly the same signal waveform s t , and there is a transmission delay Δ τ between the adjacent channels. Taking the first array element as a reference, the signal transmitted by the mth array element can be expressed as follows:
s m ( t ) = s t m 1 Δ τ
In this paper, the STCA is considered as a uniform linear array (ULA) with M elements, where M is an odd number. The spacing between adjacent elements is d . Take the middle array element with serial number M + 1 / 2 as the reference and assume that its transmission time is 0, so the time delay of the mth channel will be m M + 1 / 2 Δ τ . The chirp signal is transmitted by each channel, and its expression is:
c p ( t ) = r e c t t / τ p exp j 2 π f c t + π b t 2
where τ p represents the transmitted pulse duration, f c represents the center frequency, B t represents the total bandwidth of the transmitted chirp signal and the chirp rate b = B t / τ p .
Sensors in a ULA are evenly distributed at different positions in space. In the far field with an angle of β , there is a travel time difference of d sin β / c between the signals from the adjacent sensors. Still using the middle sensor as the reference, the travel time delay in the mth sensor is m M + 1 / 2 d sin β / c . For a far-field target at angle β , the spatially synthetic signal in the STCA array with M array elements is:
T ( t , β ) = m = 1 M c p ( t ) δ t m M + 1 2 Δ τ δ t m M + 1 2 d sin β c
where δ t denotes the impulse function, and “ ” denotes convolution.
The transmission delay Δ τ is much smaller than the pulse duration τ p , so the amplitudes of the chirp signals can be approximately considered to be aligned. Sorting out the phase can obtain:
T ( t , β ) = r e c t t τ p exp j [ 2 π f c t + π b t 2 ] m = 1 M exp j 2 π f c + b t m M + 1 2 Δ τ + d sin β c + j π b m M + 1 2 2 Δ τ + d sin β c 2 = c p t M ( t , β )
It can be seen that the synthetic signal is the product of the basic chirp signal c p t and M t , β , which is the modulation effect of the STCA in the far field, and its expression is:
M ( t , β ) = m = 1 M exp j 2 π f c + b t m M + 1 2 Δ τ + d sin β c + j π b m M + 1 2 2 Δ τ + d sin β c 2
It can be equivalent to the following expression after Fourier transform, convolution, summation of the series, and other operations. The detailed derivation is provided in Appendix A.
M ( t , β ) = sin [ M π ( Δ τ c + d sin β ) / λ ( t ) ] sin π ( Δ τ c + d sin β ) / λ ( t )
where the instantaneous wavelength is λ ( t ) = c f c + b t . As can be seen, the derivation yields a phase of 0, and the amplitude determines the shape and pointing angle of the beam.
In summary, the far-field synthetic signal in direction β obtained by transmitting the chirp waveform from each STCA sensor is as follows:
T ( t , β ) = c p ( t ) M ( t , β ) = r e c t t τ p sin [ M π ( Δ τ c + d sin β ) / λ ( t ) ] sin π ( Δ τ c + d sin β ) / λ ( t ) exp j [ 2 π f c t + π b t 2 ]
As the time and signal frequency change, the far-field modulation pattern M t , β produced by the STCA will have peaks at different angles. The beam coverage area can be controlled by adjusting the STCA parameters, such as the number of sensors, the relative time offset, and the spacing between adjacent sensors. Combined with the adjustment of the chirp signal parameters, so that the pulse duration is equal to the difference between the two-way propagation time of the signals from the far end and the near end of the beam scanning area, the echo compression described in the F-SCAN principle can be realized.

3.2. Modeling and Analysis of the F-SCAN SAR Echo

The transmitted signal of the F-SCAN SAR is shown in Equation (9). When the pencil beam illuminates the ground point target with slant range R b , a part of the backscattered signal is collected by the SAR system, forming the echo corresponding to the target. According to the mathematical model of the SAR echo response proposed in [30], after two-way propagation and the modulation of the target scattering coefficient σ and the azimuth beam pattern W a , the echo for the F-SCAN SAR can be expressed as:
s e c h o ( t r , t a ) = σ W a ( t a ) T ( t r 2 R ( t a ; R b ) / c , β ) = σ W a ( t a ) r e c t t r 2 R ( t a ; R b ) / c τ p M t r 2 R ( t a ; R b ) c , β exp j 2 π f c t r 2 R ( t a ; R b ) c + π b t r 2 R ( t a ; R b ) c 2
where t r denotes fast time, t a denotes slow time, and R t a ; R b denotes the instantaneous distance between the radar and the point target.
The echo data is then processed by the radar receiver to obtain the demodulated baseband signal:
s e c h o ( t r , t a ) = σ W a ( t a ) r e c t t r 2 R ( t a ; R b ) / c τ p M t r 2 R ( t a ; R b ) c , β exp j 4 π f c R ( t a ; R b ) c exp j π b t r 2 R ( t a ; R b ) c 2
The radar transmits the chirp signal for a duration of τ p . But the ground target only receives high energy when it is illuminated by the main lobe of the pencil beam due to the modulation of M t , β . The rest of the time it is illuminated by the sidelobes and receives relatively low energy. As the pencil beam scans from far to near, targets at the far end are illuminated by the main lobe and reflect high energy earlier, while targets at the near end receive high energy and reflect it later. The high amplitude portions of all the target echoes will reach the radar simultaneously if the beam scanning duration is equal to the difference between the signal propagation delays of the near-range and the far-range targets, that is, echo compression. The receive window needs to be opened near the center of the reference target echo, whose length is only the time when a target is illuminated by the main lobe, as shown In Figure 3. It can be seen that the phases of the target echoes from different range targets are different.

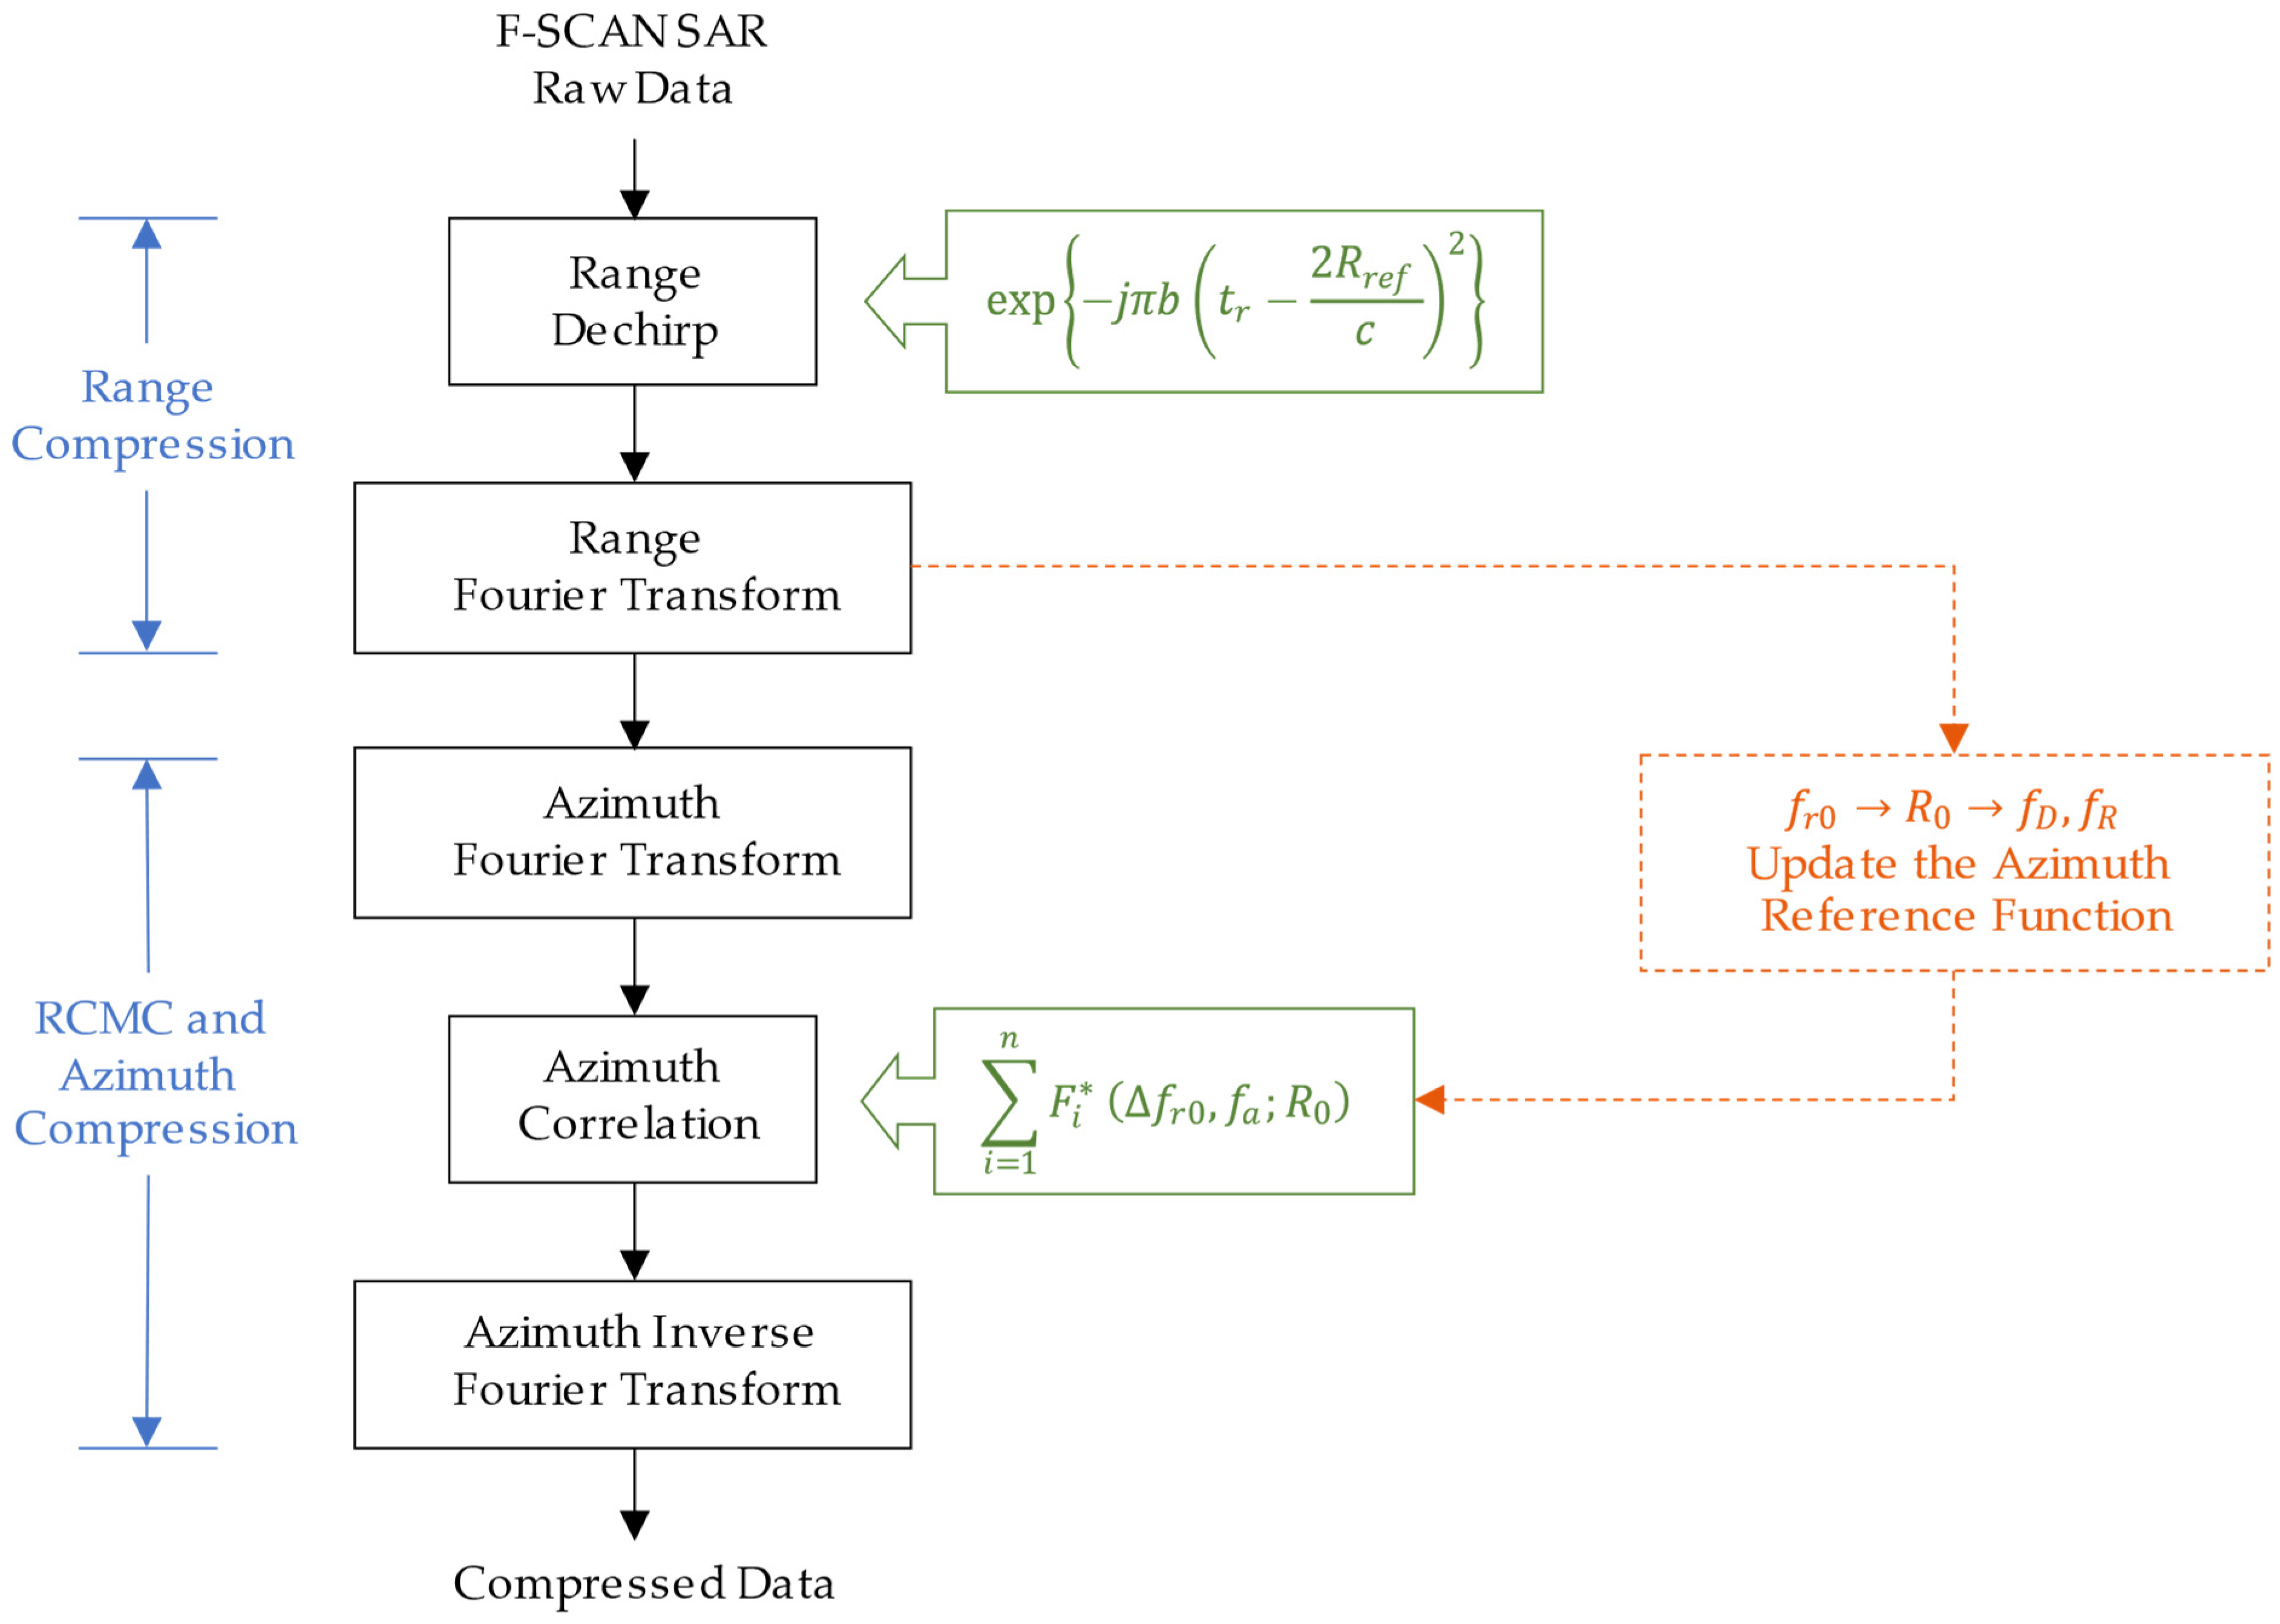
4. Imaging Processing for the F-SCAN SAR

4.1. The Novel Imaging Method Based on the Hybrid Correlation Algorithm

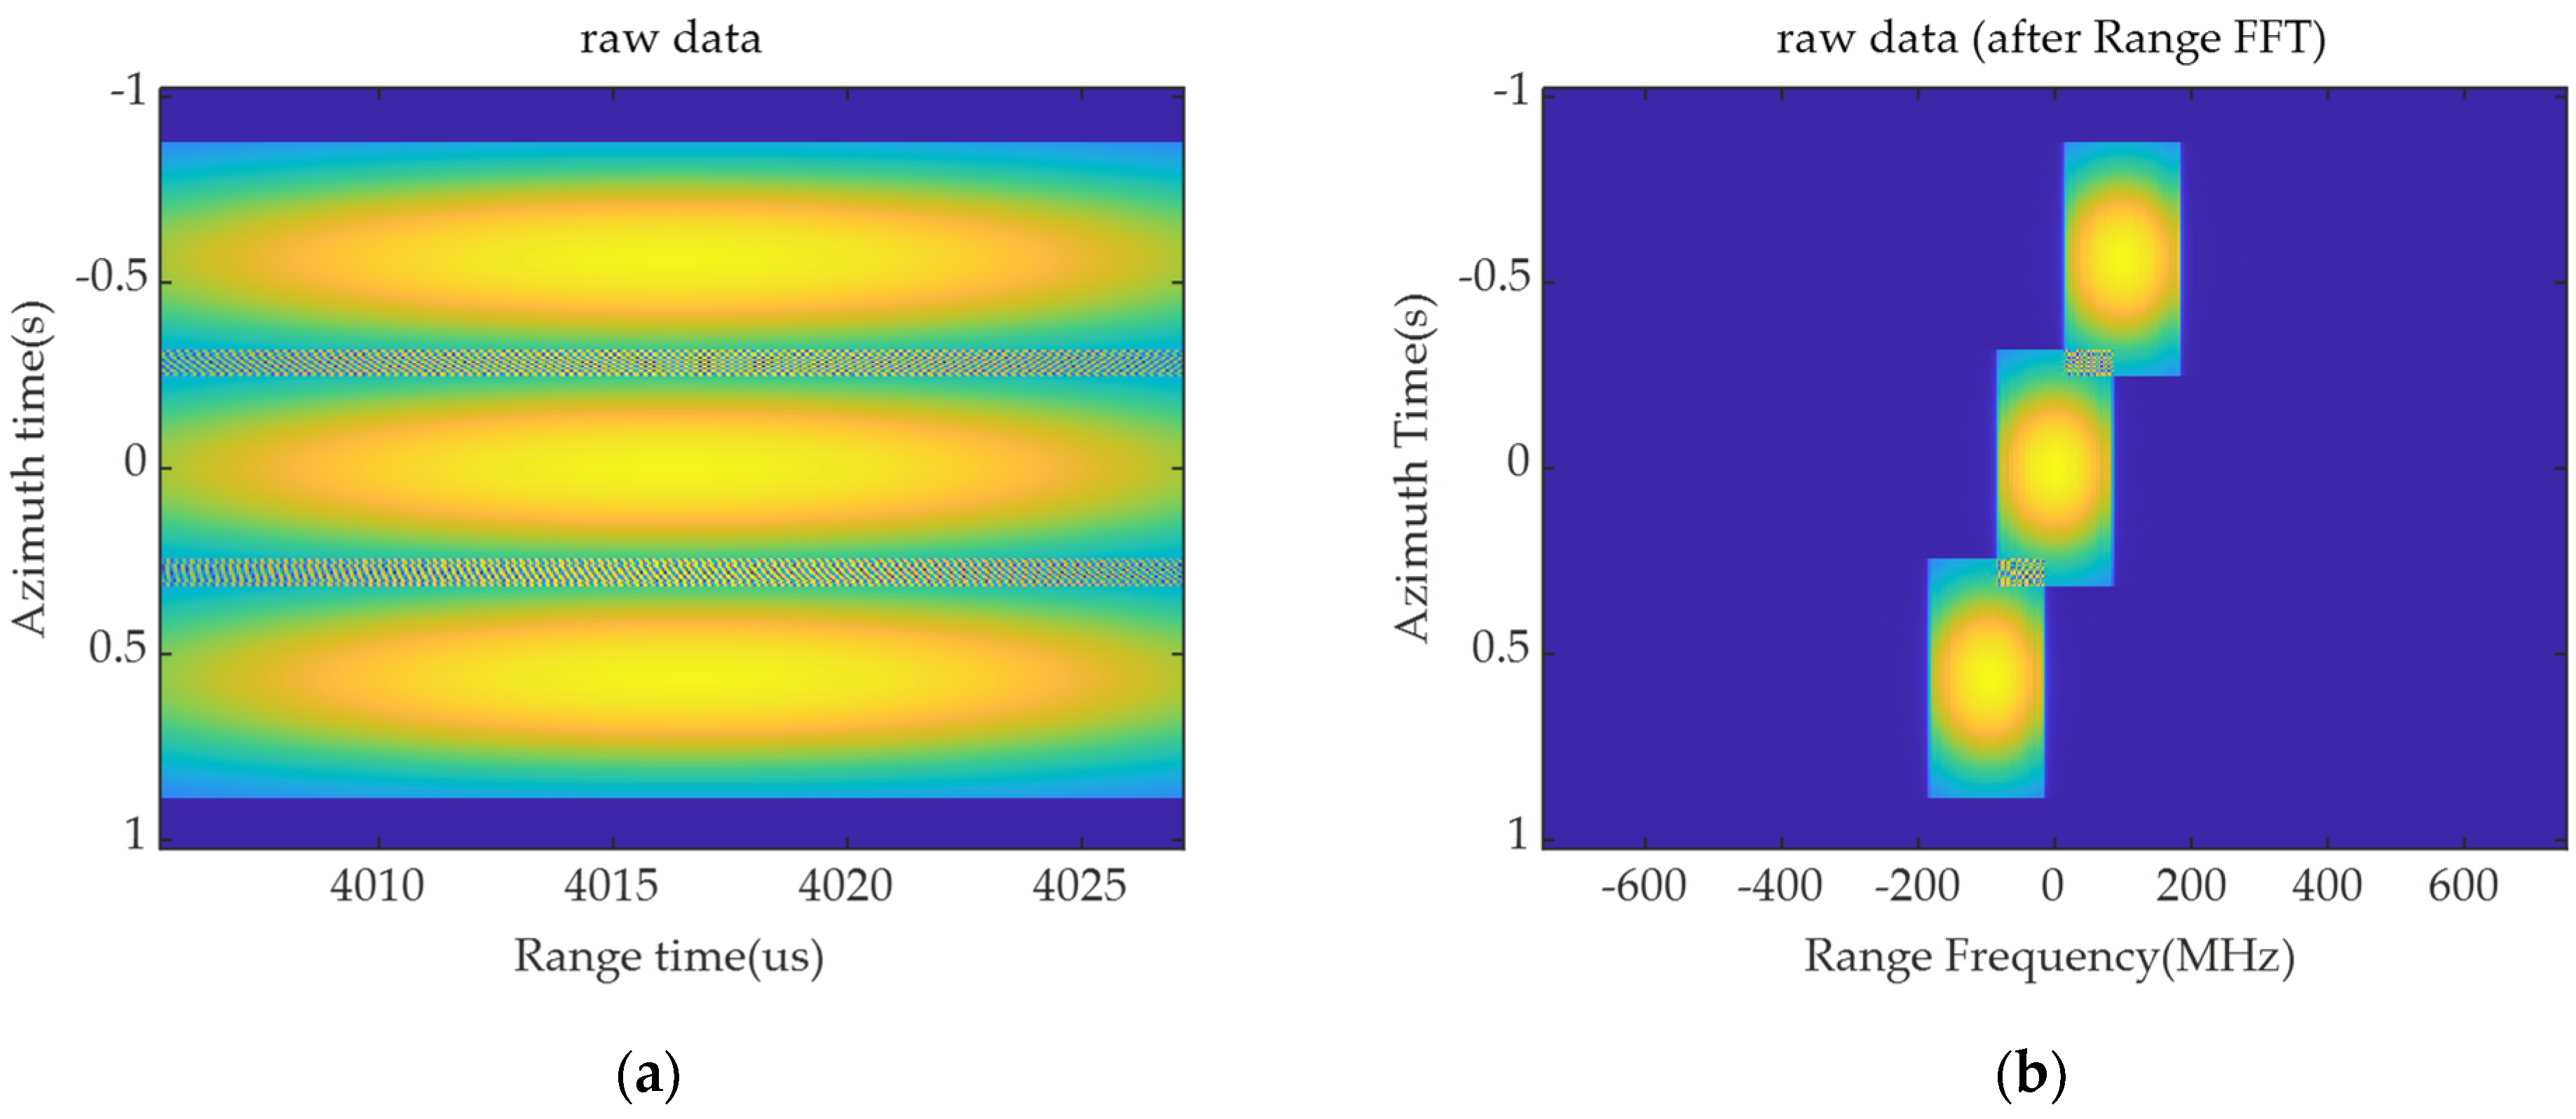
The F-SCAN SAR realizes echo compression using the frequency scanning effect in the range direction, resulting in a shorter receive window. How to recover the relative positions of the echoes from different range targets and how to avoid range aliasing caused by the extremely short length of the receive window are key issues in imaging processing.
The pencil beam scans from far to near as the frequency of the chirp signal increases, which results in targets at different positions experiencing various phases and unequal center frequencies. Conventional range processing involves transforming the raw data into the frequency domain and multiplying it by a uniform matched filter directly. For F-SCAN SAR data, different phases cause echoes from various range cells to shift to various positions in the spectrum, which cannot be processed uniformly. Contrary to conventional SAR data, F-SCAN SAR data from different range targets are aligned in the range-time domain. First, the dechirp operation is performed in the time domain by multiplication with a uniform quadratic function along the range dimension, and the expression of the reference quadratic function is as follows:
g r t r = exp j π b t r 2 c R r e f 2
where R r e f is the slant range of the reference target when illuminated by the beam center.
The signal data after multiplication is:
s s d e c h i r p ( t r , t a ) = σ W a ( t a ) r e c t t r 2 R ( t a ; R b ) / c τ p M t r 2 R ( t a ; R b ) c , β exp j 4 π f c R ( t a ; R b ) c exp j 4 π b c R ( t a ; R b ) R r e f t r exp j 4 π b c 2 R ( t a ; R b ) R r e f R ( t a ; R b ) + R r e f
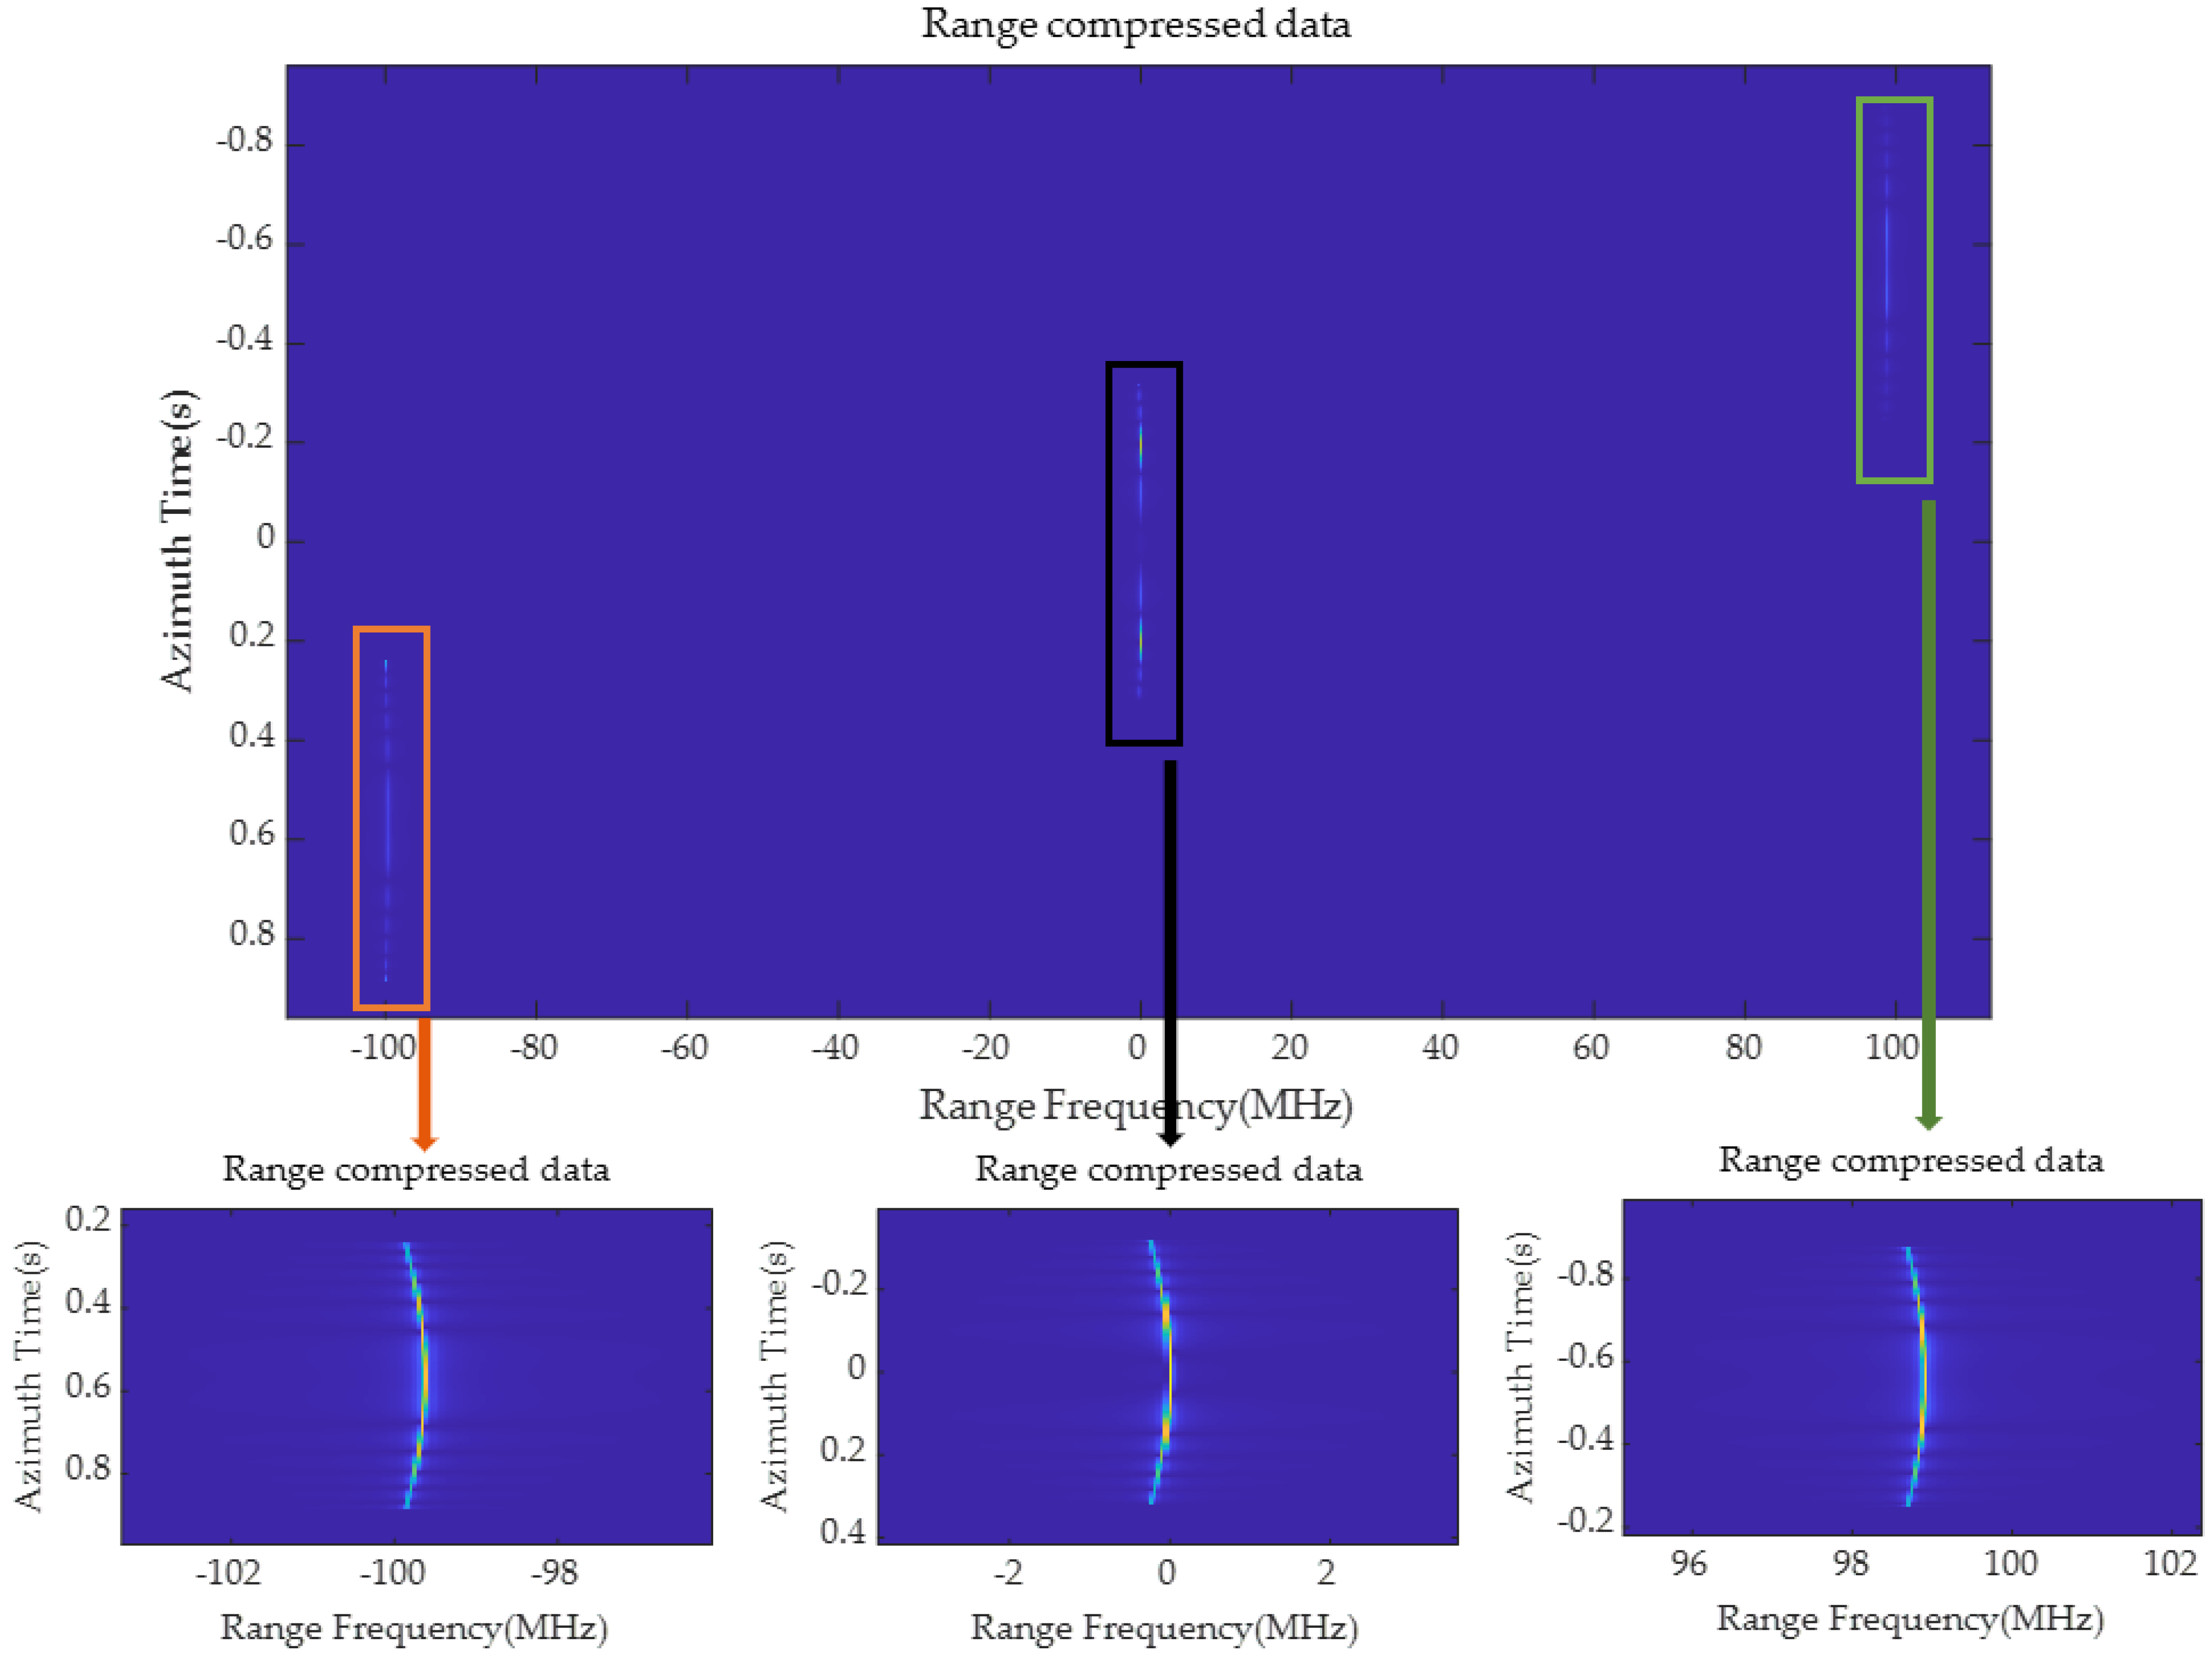
Range compression is accomplished by performing a range Fourier transform on the signal data after the dechirp operation. Echoes from different range cells have linear terms with unequal slopes, corresponding to different shifts in the frequency domain. Therefore, after the range Fourier transform, echoes are focused at various positions on the range–frequency axis. The compressed echoes are successfully distinguished. Additionally, there is a large enough bandwidth in the frequency domain to avoid range aliasing. The signal data in the range-frequency domain is:
s S ( f r , t a ) = σ W a ( t a ) F r ( f r ) exp j 4 π f c R ( t a ; R b ) c exp j Φ t a ; R b
where Φ t a ; R b is the additional phase obtained during the range dechirp operation, and F r ( f r ) is the range envelope. Their expressions are, respectively:
Φ t a ; R b = 4 π b c 2 R ( t a ; R b ) R r e f R ( t a ; R b ) + R r e f
F r ( f r ) = sin π τ w f r + 2 b c R ( t a ; R b ) R r e f π τ w f r + 2 b c R ( t a ; R b ) R r e f M f f r , β
where τ w is the length of the receive window, M f is the result of the range Fourier transform of M , which can be simply considered as a window function, and the instantaneous slant range R ( t a ; R b ) can be divided into two parts:
R ( t a ; R b ) = R b + Δ R ( t a ; R b )
where R b is the distance between the radar and the point target when it is illuminated by the beam center, and Δ R ( t a ; R b ) represents the variation in the distance at other azimuth moments.
Combining the expressions in Equations (16) and (17), it can be seen that the echo from the slant range R b will be focused on the range frequency Δ f r ( t a ; R b ) at the azimuth time t a , and the expression is:
Δ f r ( t a ; R b ) = 2 b c R b R r e f 2 b c Δ R ( t a ; R b )
The first item determines the actual focused position of the target in the range-frequency domain when the azimuth time is equal to 0. The second item reflects that there is a slight shift at other azimuth moments. So, the target trajectory after range compression is a curve, which is called the range cell migration (RCM).
Range compression has been performed in the previous process, so the next step is to straighten the curved target trajectory and complete azimuth compensation to achieve a two-dimensional focus.
Sampling the signal data in the range dimension. Assuming that a target echo with a slant range R 0 is focused at the range frequency f r 0 , its two-dimensional azimuth reference function can be expressed as follows:
h a f r , t a ; R 0 = i = 1 n f i ( f r , t a ; R 0 ) δ f r Δ f r 0
where n is the number of range sampling units spanned by a curved target trajectory, and Δ f r 0 is the frequency difference between the sampling point and the reference range frequency f r 0 . The azimuth response function expression at the ith range sampling point is as follows:
f i ( f r , t a ; R 0 ) = W a ( t a ) sin π τ w Δ f r 0 Δ f r ( t a ; R 0 ) π τ w Δ f r 0 Δ f r ( t a ; R 0 ) exp j 4 π f c R ( t a ; R 0 ) c
According to the hybrid correlation algorithm proposed in [30], correlating the echo data after range sampling with the azimuth reference function results in the reconstructed image lines:
l ( f r 0 , t a ) = s S x + f r 0 , y + t a h a * x , y ; R 0 d x d y = s S x + f r 0 , y + t a i = 1 n f i * ( x , y ; R 0 ) δ x Δ f r 0 d x d y = i = 1 n s S x + f r 0 , y + t a δ x Δ f r 0 f i * ( x , y ; R 0 ) d x d y = i = 1 n s S Δ f r 0 + f r 0 , y + t a f i * ( Δ f r 0 , y ; R 0 ) d y = i = 1 n s S f r 0 + Δ f r 0 , t a t a f i * ( Δ f r 0 , t a ; R 0 )
Converting the above formula into the azimuth-frequency domain gives the following expression:
L ( f r 0 , f a ) = i = 1 n S S f r 0 + Δ f r 0 , f a F i * ( Δ f r 0 , f a ; R 0 )
where L ( f r 0 , f a ) , S S f r 0 + Δ f r 0 , f a , and F i ( Δ f r 0 , f a ; R 0 ) represent the azimuth Fourier transforms of l ( f r 0 , t a ) , s S f r 0 + Δ f r 0 , t a , and f i ( Δ f r 0 , t a ; R 0 ) , respectively. In the two-dimensional frequency domain, multiplying the echo data by the conjugate of the azimuth reference function, and then summing the data in the range dimension gives a straight target trajectory without a quadratic phase. Performing an azimuth Fourier transform on the reconstructed image lines gives the focused result in the range-frequency, azimuth-time domain.
The dechirp operation and Fourier transform in the range direction complete the range focus and recover the relative positions of the compressed echoes. The following correlation summation completes the range cell migration correction (RCMC) and azimuth compensation of the signal data, where the azimuth reference function must be updated with the range gate. The method of obtaining the signal parameters and Doppler parameters at each range cell is provided later. The general flow of the novel imaging method for processing the F-SCAN SAR data is shown in Figure 4.

4.2. Analysis of the Doppler Parameters

During observing the ground with SAR, the Doppler frequency histories of the targets at different range cells are various. Therefore, their Doppler centroid frequencies and Doppler frequency modulation (FM) rates are unequal. In the echo simulation of spaceborne SAR, the Doppler parameters are calculated as follows:
f D = 2 λ d R t d t t = 0 = 2 V s t R λ R
f R = 2 λ d 2 R t d t 2 t = 0 = 2 λ V s t V s t R + A s t R R V s t R 2 R 3
where f D and f R are the Doppler centroid frequency and Doppler FM rate, respectively. R , V s t , and A s t are relative vectors of the position, velocity, and acceleration from the ground target to the radar when the target is illuminated by the beam center. R = R . And λ is the center wavelength of the transmitted chirp signal.
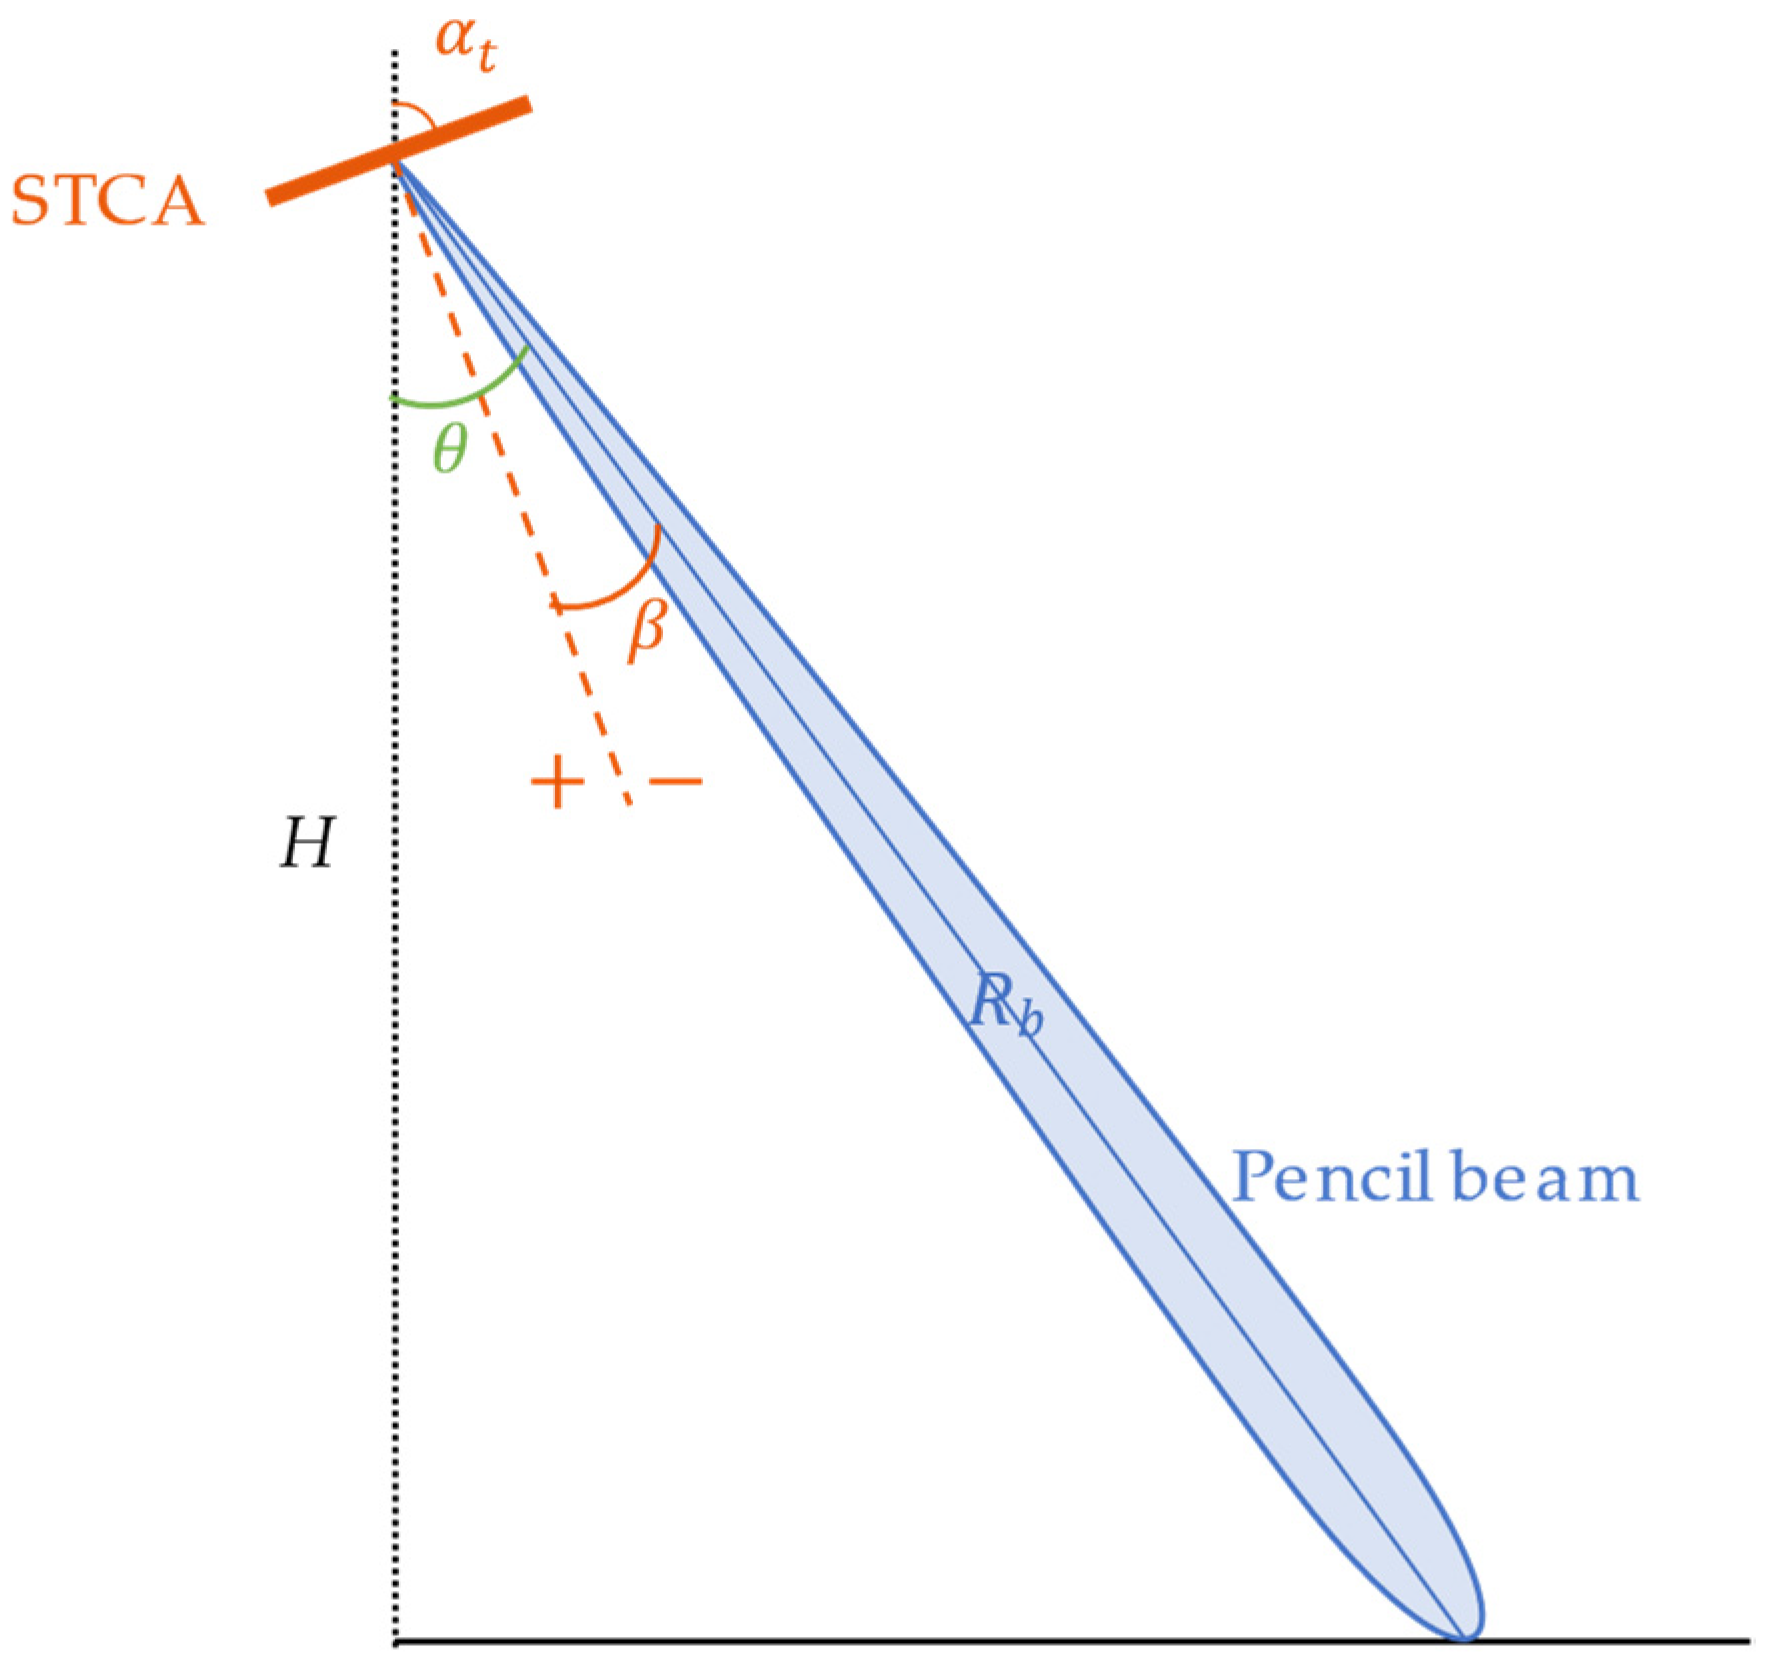
During a pulse transmission of the F-SCAN SAR, the pencil beam scans from the far end to the near end, and the bandwidth of the transmitted signal is quite large. The center parameters of the received signals from the targets at different range cells are various. As a result, the Doppler parameters should be calculated using the actual instantaneous wavelength of the received signals from each target, rather than using the center wavelength λ of the transmitted signal. The actual center frequency and instantaneous wavelength of the received signal can be obtained from the relationship between the pencil beam pointing angle and the time. It is the modulation pattern of the STCA that determines the instantaneous beam direction, and its expression is shown in Equation (8).
When:
π ( Δ τ c + d sin β ) / λ ( t ) = ε π
where ε is an integer, the amplitude function reaches its maximum value and the antenna pattern reaches its peak here. The relationship between the beam pointing angle β and the time t can be obtained by substituting the expression of λ t into Equation (25) and deducing the outcome. The pencil beam scans to angle β after a period of time t :
t = ε b Δ τ + d sin β c f c b
The integer ε can be evaluated by the following expression, where r o u n d indicates to obtain the nearest integer:
ε = r o u n d Δ τ + d sin β c f c
The STCA is placed as depicted in Figure 5, where α t is the antenna tilt angle. Assuming that the synthetic beam pointing angle is positive on the left side of the array normal and negative on the right side, the look angle θ of the pencil beam is related to angle β , as follows:
θ = π 2 α t β
Combining Equations (26) and (28) yields that a point target with the look angle of θ b is illuminated by the pencil beam at time t b :
t b = ε b Δ τ + d sin π / 2 α t θ b c f c b
According to the law that the chirp signal frequency varies linearly with time, the center frequency f b and wavelength λ b of the target are:
f b = ε Δ τ + d sin π / 2 α t θ b c
λ b = c / f b = Δ τ c + d sin π / 2 α t θ b ε
Based on the geometric relationship between the spaceborne SAR and the Earth, it is easy to determine the slant range R b of the target from the look angle θ b . To sum up, in the echo simulation of the F-SCAN SAR, the Doppler parameters f D , f R at the range gate R b need to be calculated with the instantaneous wavelength λ b obtained from Equation (31).
The azimuth reference function used in RCMC and azimuth compression processes involves the instantaneous slant range R t a ; R b , which is approximated as follows:
R ( t a ; R b ) = R b 2 + V r 2 t a 2 2 R b V r cos φ r t a +
It is necessary to acquire the effective radar velocity V r and effective squint angle φ r based on the Doppler parameters of each range gate. The relationship among them is as follows:
V r = λ b f D 2 2 + λ b f R R b 2
φ r = arccos λ b f D 2 V r
It should be noted that the F-SCAN SAR data is imaged in the range-frequency domain in this paper, which leads to a certain conversion relationship between the focused position of the signal and the actual slant range of the target. It is necessary to find the matched Doppler parameters according to the range frequency of the focused position. According to Equation (18), after range compression, the position f r 0 of the signal on the range spectrum has the following relationship with the slant range R 0 :
f r 0 = 2 b c R 0 R r e f
In other words, the signal focused at the range frequency f r 0 is actually the echo of the target with slant range R 0 . In the azimuth correlation operation, the slant range of the target must be determined from its actual focused position on the range spectrum to obtain the matched Doppler parameters of this range gate, and then update the azimuth reference function along the range–frequency axis.

5. Simulations and Results

5.1. Transmitted Signal Based on the STCA

Simulation experiments are performed to verify the spatial scanning effect of the proposed transmitted signal model, including the relationship between the pencil beam pointing angle and time, and the far-field synthetic antenna pattern in some directions. Table 1 shows the parameters of the STCA and the reference chirp signal utilized in the simulation.
The antenna patterns synthesized at angles −1°, 0°, and 1° are shown in Figure 6a–c, respectively. It can be seen that the point target in the direction of angle −1° is illuminated by the pencil beam and receives high energy earlier, followed by the targets at angles 0° and 1° in turn.
The relationship between the pencil beam pointing angle and time is given in Figure 7, where the beam direction varies approximately linearly with time. It is well known that the frequency of the chirp signal changes linearly with time, which allows for the frequency scanning effect described in the F-SCAN principle.

5.2. Echo Compression and Imaging Results for the Point Targets

To verify the feasibility of echo compression and the effectiveness of the proposed imaging algorithm, F-SCAN SAR echoes from point targets at different range cells are obtained through a simulation experiment to analyze the echo compression effect. Then, the raw data is processed with the proposed imaging algorithm and the focused result is presented. The parameters of the STCA and transmitted signal are the same as in Table 1. The radar system parameters are displayed in Table 2.
The layout of point targets T 1 , T 2 , and T 3 in the ground scene are depicted in Figure 8, where they are located at different range gates.
The echoes received by the radar from point targets T 1 , T 2 , and T 3 are given in Figure 9. From Figure 9a, it can be seen that their amplitude peaks are aligned at the same range time, indicating that echoes from a certain azimuth direction can reach the receiver almost simultaneously, which means echo compression occurs and verifies Figure 3. In Figure 9b, the echo spectra from different range targets are at different range positions because the pencil beams pointing in different directions have various center frequencies. Each point target receives only a portion of the total transmitted signal, so the bandwidth of an echo is smaller than the entire transmitted bandwidth.
Perform a dechirp operation on the raw data and then perform the range Fourier transform to obtain the range compressed data, as shown in Figure 10. It should be noted that the residual linear phase of the echo after the dechirp operation makes the signal shift in the range-frequency domain, which is opposite to the actual position, so the focused result is mirrored about the range direction. The partial magnification of the image shows that the target trajectory obtained by the range compression is a curve and the RCMC is necessary.
The focused image after RCMC and azimuth compression is obtained by the correlation operation between the echo data and the azimuth reference function, which is updated with the slant range. The results obtained by extracting the partial data centered on the focal points and expanding by a factor of 16 are shown in Figure 11. The evaluation results for the focused targets are listed in Table 3. It can be seen that three targets are well focused and their 2-D contours are standard. The range profiles and azimuth profiles are consistent with the theoretical results, and the peak sidelobe ratio (PSLR) is less than −13 dB. There are slight distortions in the azimuth profiles in Figure 11, which are caused by a slight mismatch in the Doppler parameters in hybrid correlation processing in the range-frequency domain. Moreover, it can be observed from Table 3 that the deterioration of the impulse response width (IRW) is less than 2.5% in the range direction, and less than 1.2% in the azimuth direction. The simulation results for the range compressed data and focused data show that the proposed algorithm is effective; it can separate the compressed echo and realize the focus of the point targets at different range cells.

5.3. Imaging Results for the Surface Target

Echo simulation and imaging processing of the distributed target are performed to further validate the effectiveness of the proposed algorithm. The real SAR image acquired by the GF-3 satellite in China is used for the surface target scattering characteristics. The red rectangular area in Figure 12 is selected for echo simulation. For real SAR systems, the scattering coefficients of the scattering elements in the scene are complex numbers containing amplitudes and random phases. Therefore, random noise is added to simulate the real echo data in the simulation experiment of the distributed target, which can also avoid the variation in the signal amplitude caused by the interference phenomenon in the imaging results. The addition of noise is implemented by adding random phases of 0 , 2 π to all the scattering elements in the scene. The echo of the F-SCAN SAR is obtained. The raw data is processed with the conventional chirp scaling (CS) algorithm [33] and the proposed algorithm, respectively. The imaging results are shown in Figure 13. The result in Figure 13a exhibits aliasing as a result of inadequate range time, where signals within the green solid rectangle are folded into the green dashed area, and signals within the orange solid rectangle are aliased into the orange dashed area. The aliasing effect causes certain targets to focus on incorrect positions and overlap with other targets, preventing accurate observation. The novel algorithm proposed in this paper successfully avoids this problem, as shown in Figure 13b, and there is a large enough bandwidth in the range-frequency domain to deal with a wider swath.

6. Discussion

In this paper, the proposed imaging algorithm successfully separates the compressed target echoes and avoids range aliasing. The range focused result is obtained directly by performing a dechirp operation and a range Fourier transform on raw data, which is easy to operate and does not require spectrum splicing or bandpass filtering. The computational complexities of the proposed algorithm and the modified Omega-K algorithm in the paper [16] can be summarized by Equations (36) and (37), respectively:
K + 1 N r N a + 1 2 N a N r log 2 N r + K 2 + 1 N r N a log 2 N a
1 2 N a N r log 2 N r + K + 1 N r N a + 1 2 N r + M N B P F N a log 2 N a + 1 2 M N a N B P F log 2 N B P F
where N a and N r are the numbers of the azimuth and range sampling points, respectively, K is the length of the interpolation kernel, N B P F is the length of the range-frequency bandpass filter, and M is the number of range cells of interest in the modified Omega-K algorithm. With the number of samples in Table 4, it can be calculated that the total computational burden of the proposed algorithm is 3.80 × 10 10 , and that of the modified Omega-K algorithm is 1.38 × 10 13 . The computational efficiency of the proposed algorithm is 362 times higher than that of the modified Omega-K algorithm, and it significantly improves the data processing speed.

7. Conclusions

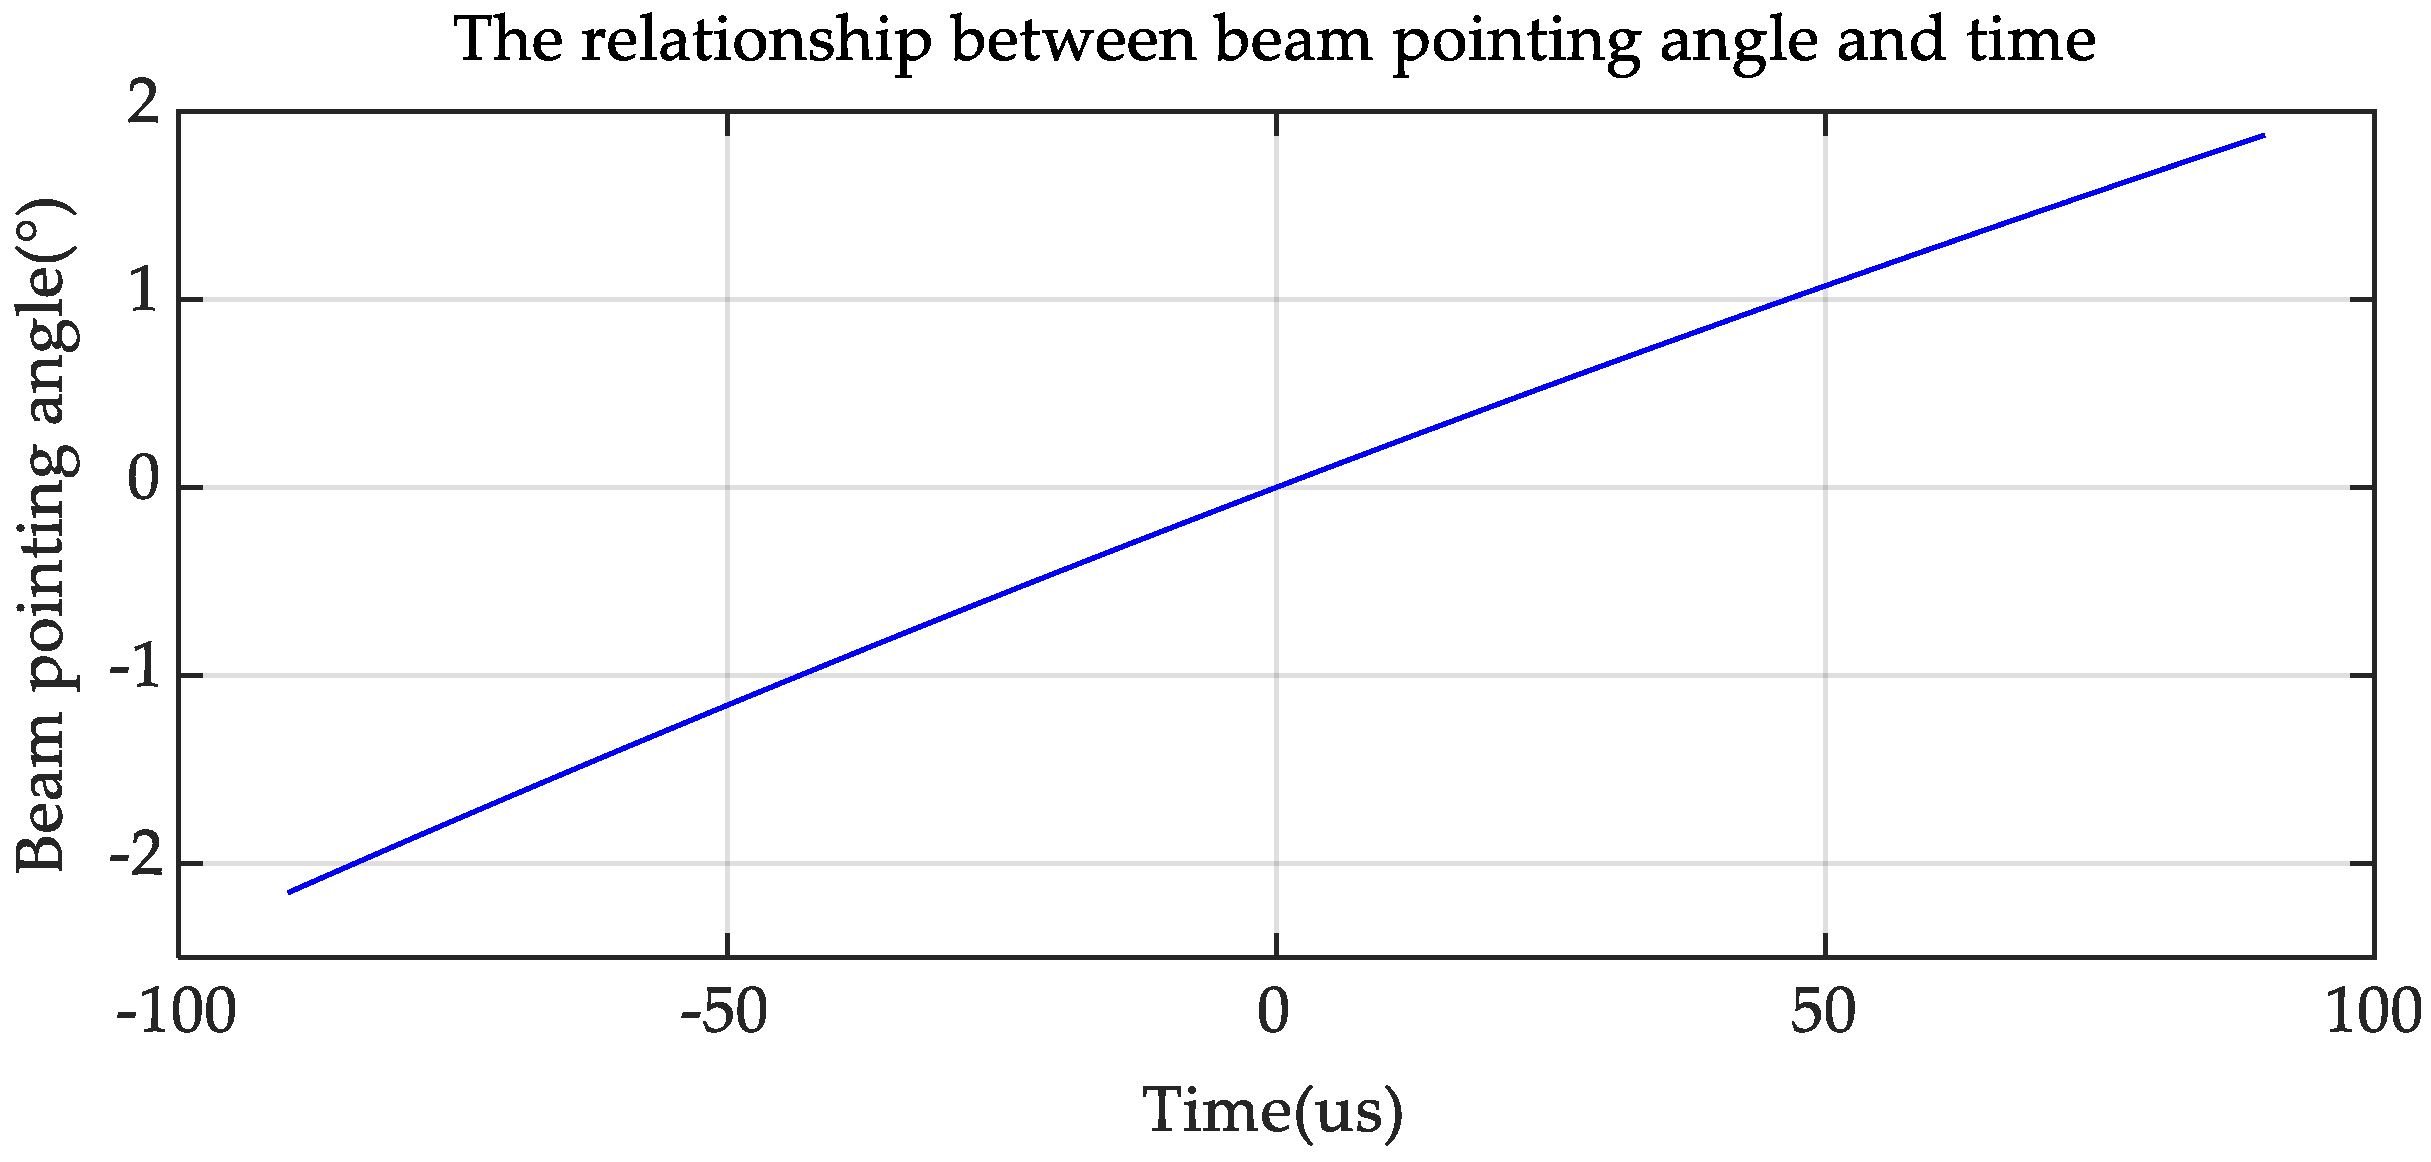
In this paper, the far-field synthetic antenna pattern model formed by combining the space–time coding array with an up-chirp signal is constructed and used as the transmitted signal in the F-SCAN SAR to achieve the frequency scanning effect. Each channel in the STCA transmits an identical linear up-chirp waveform with a fixed transmission delay. The mathematical model of the synthetic signal in a certain direction is derived. The synthetic signal magnitudes in several directions are displayed in the simulation results, which verifies the scanning effect of the synthetic beam. A plot of the beam pointing angle versus time is presented, which is approximately linear.
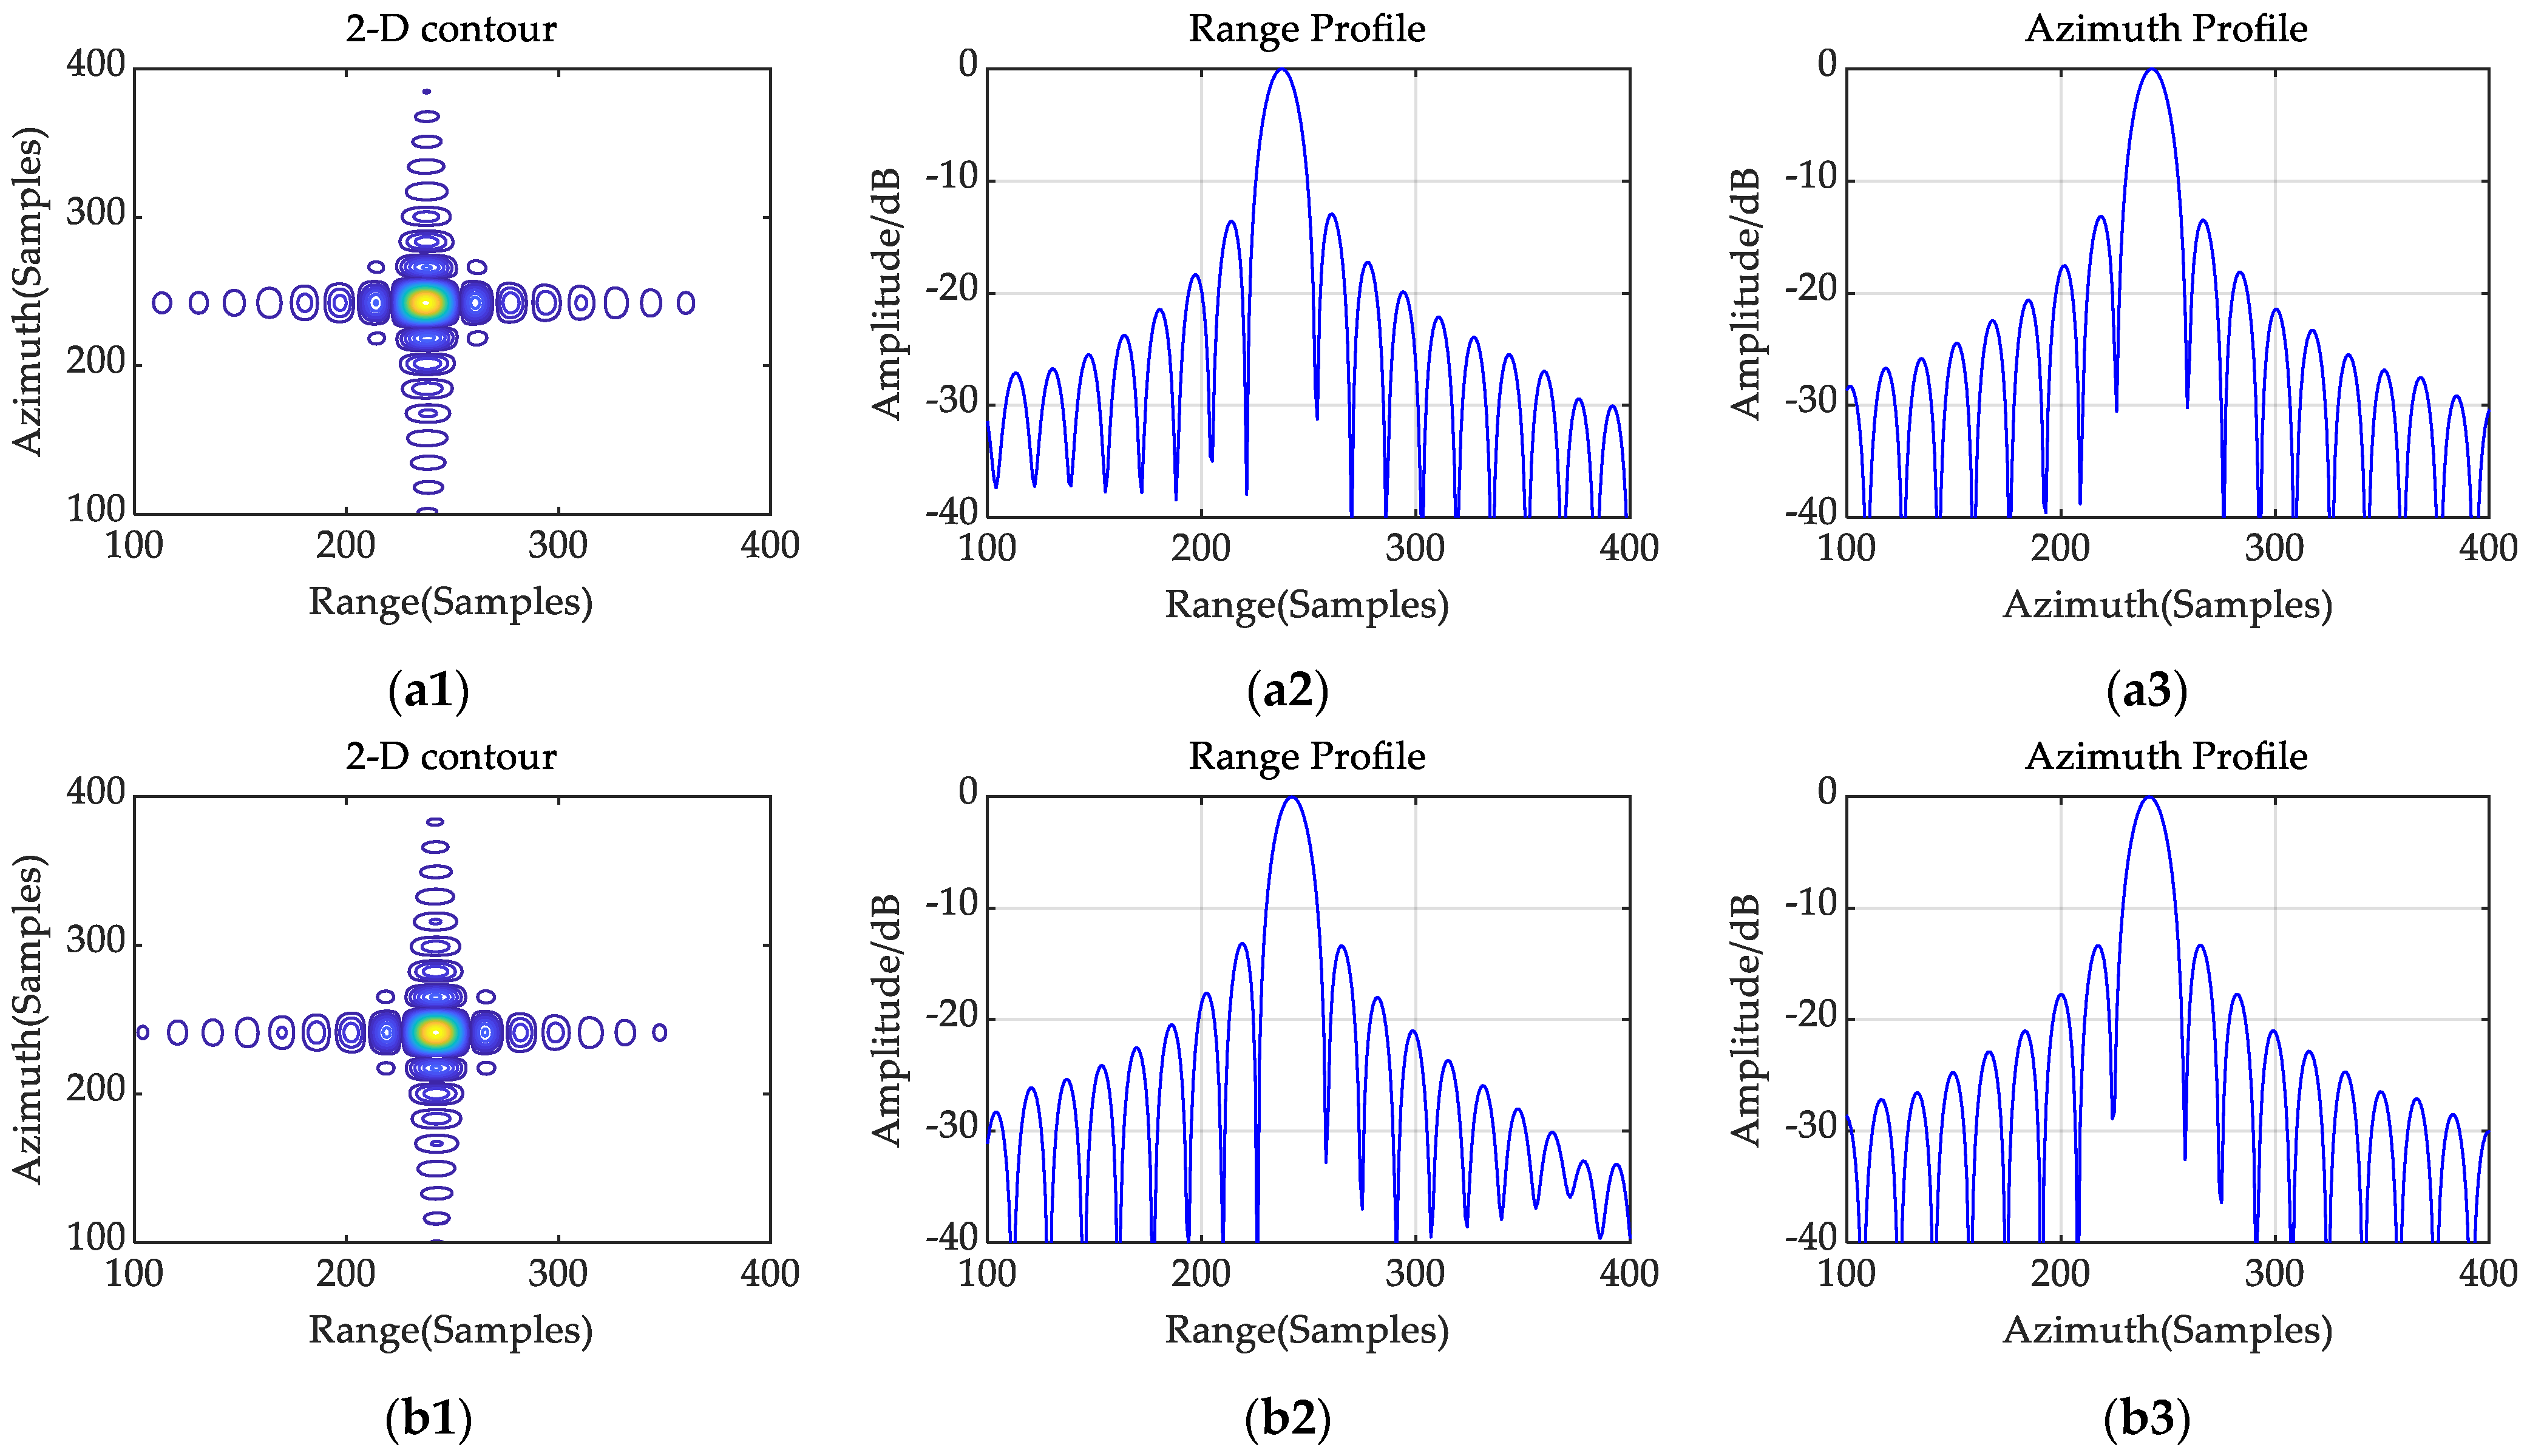
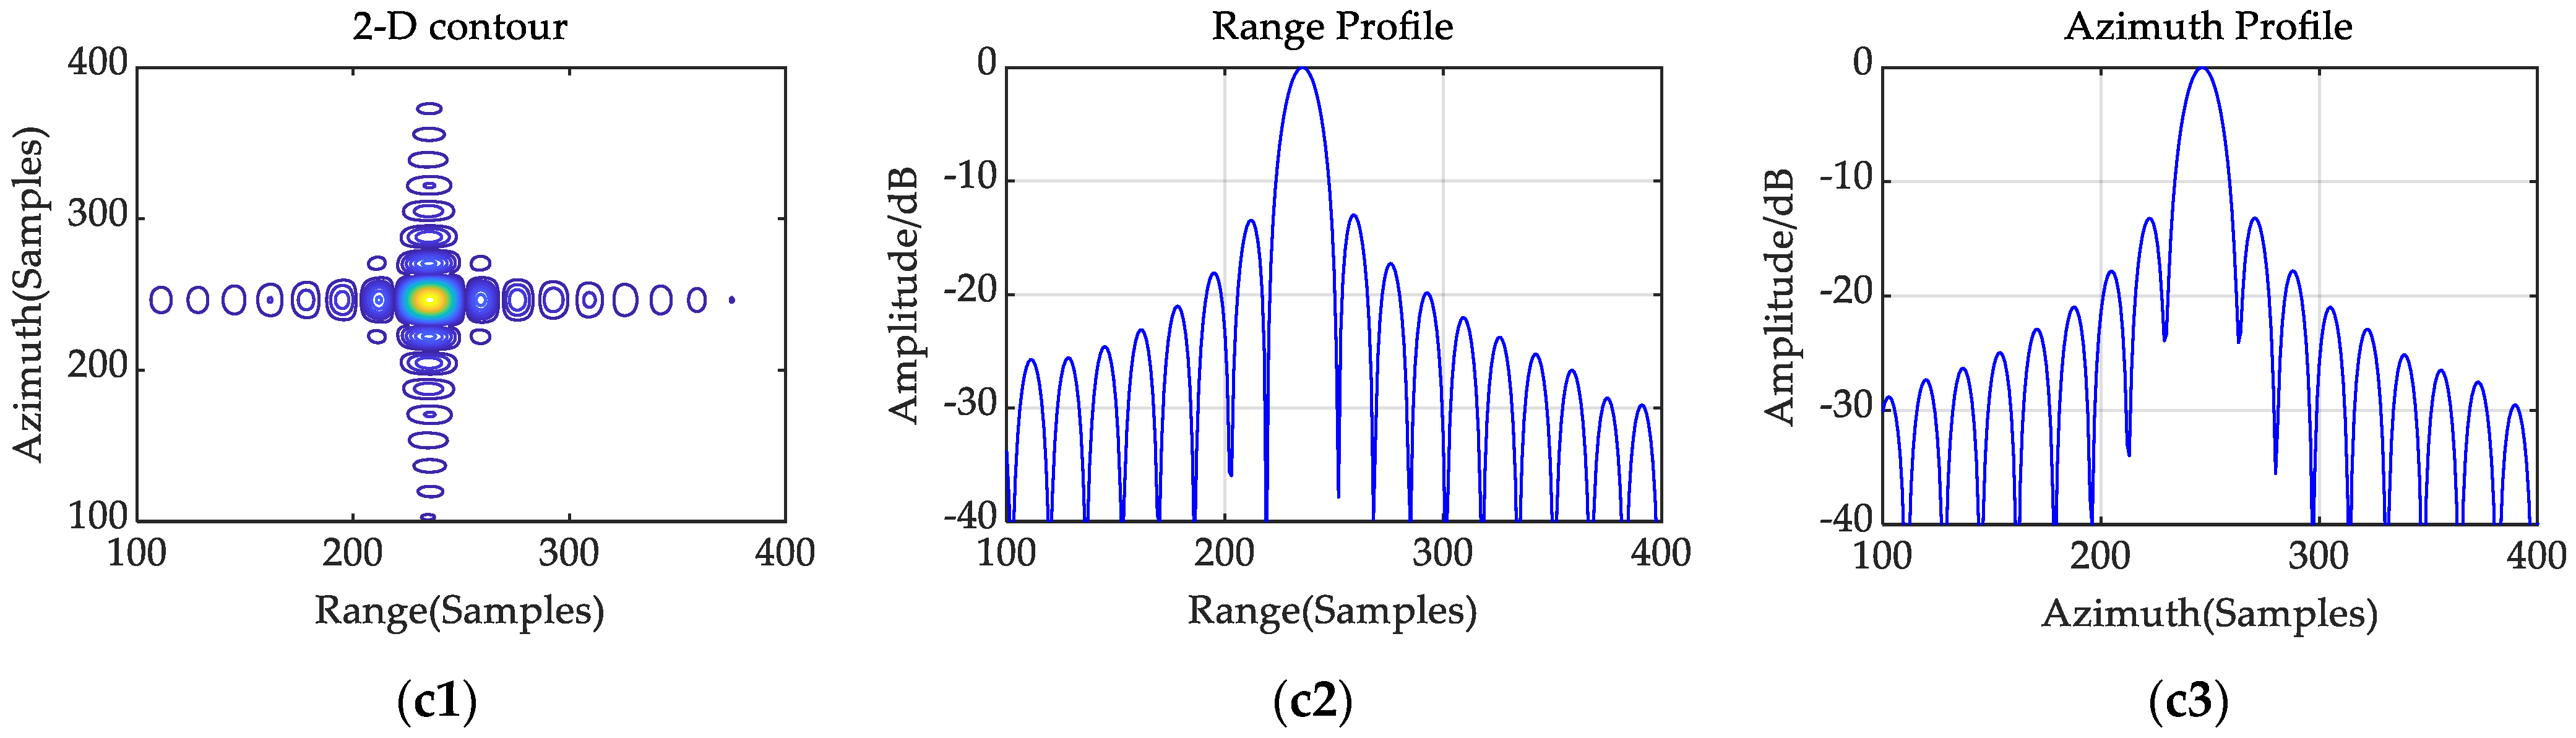
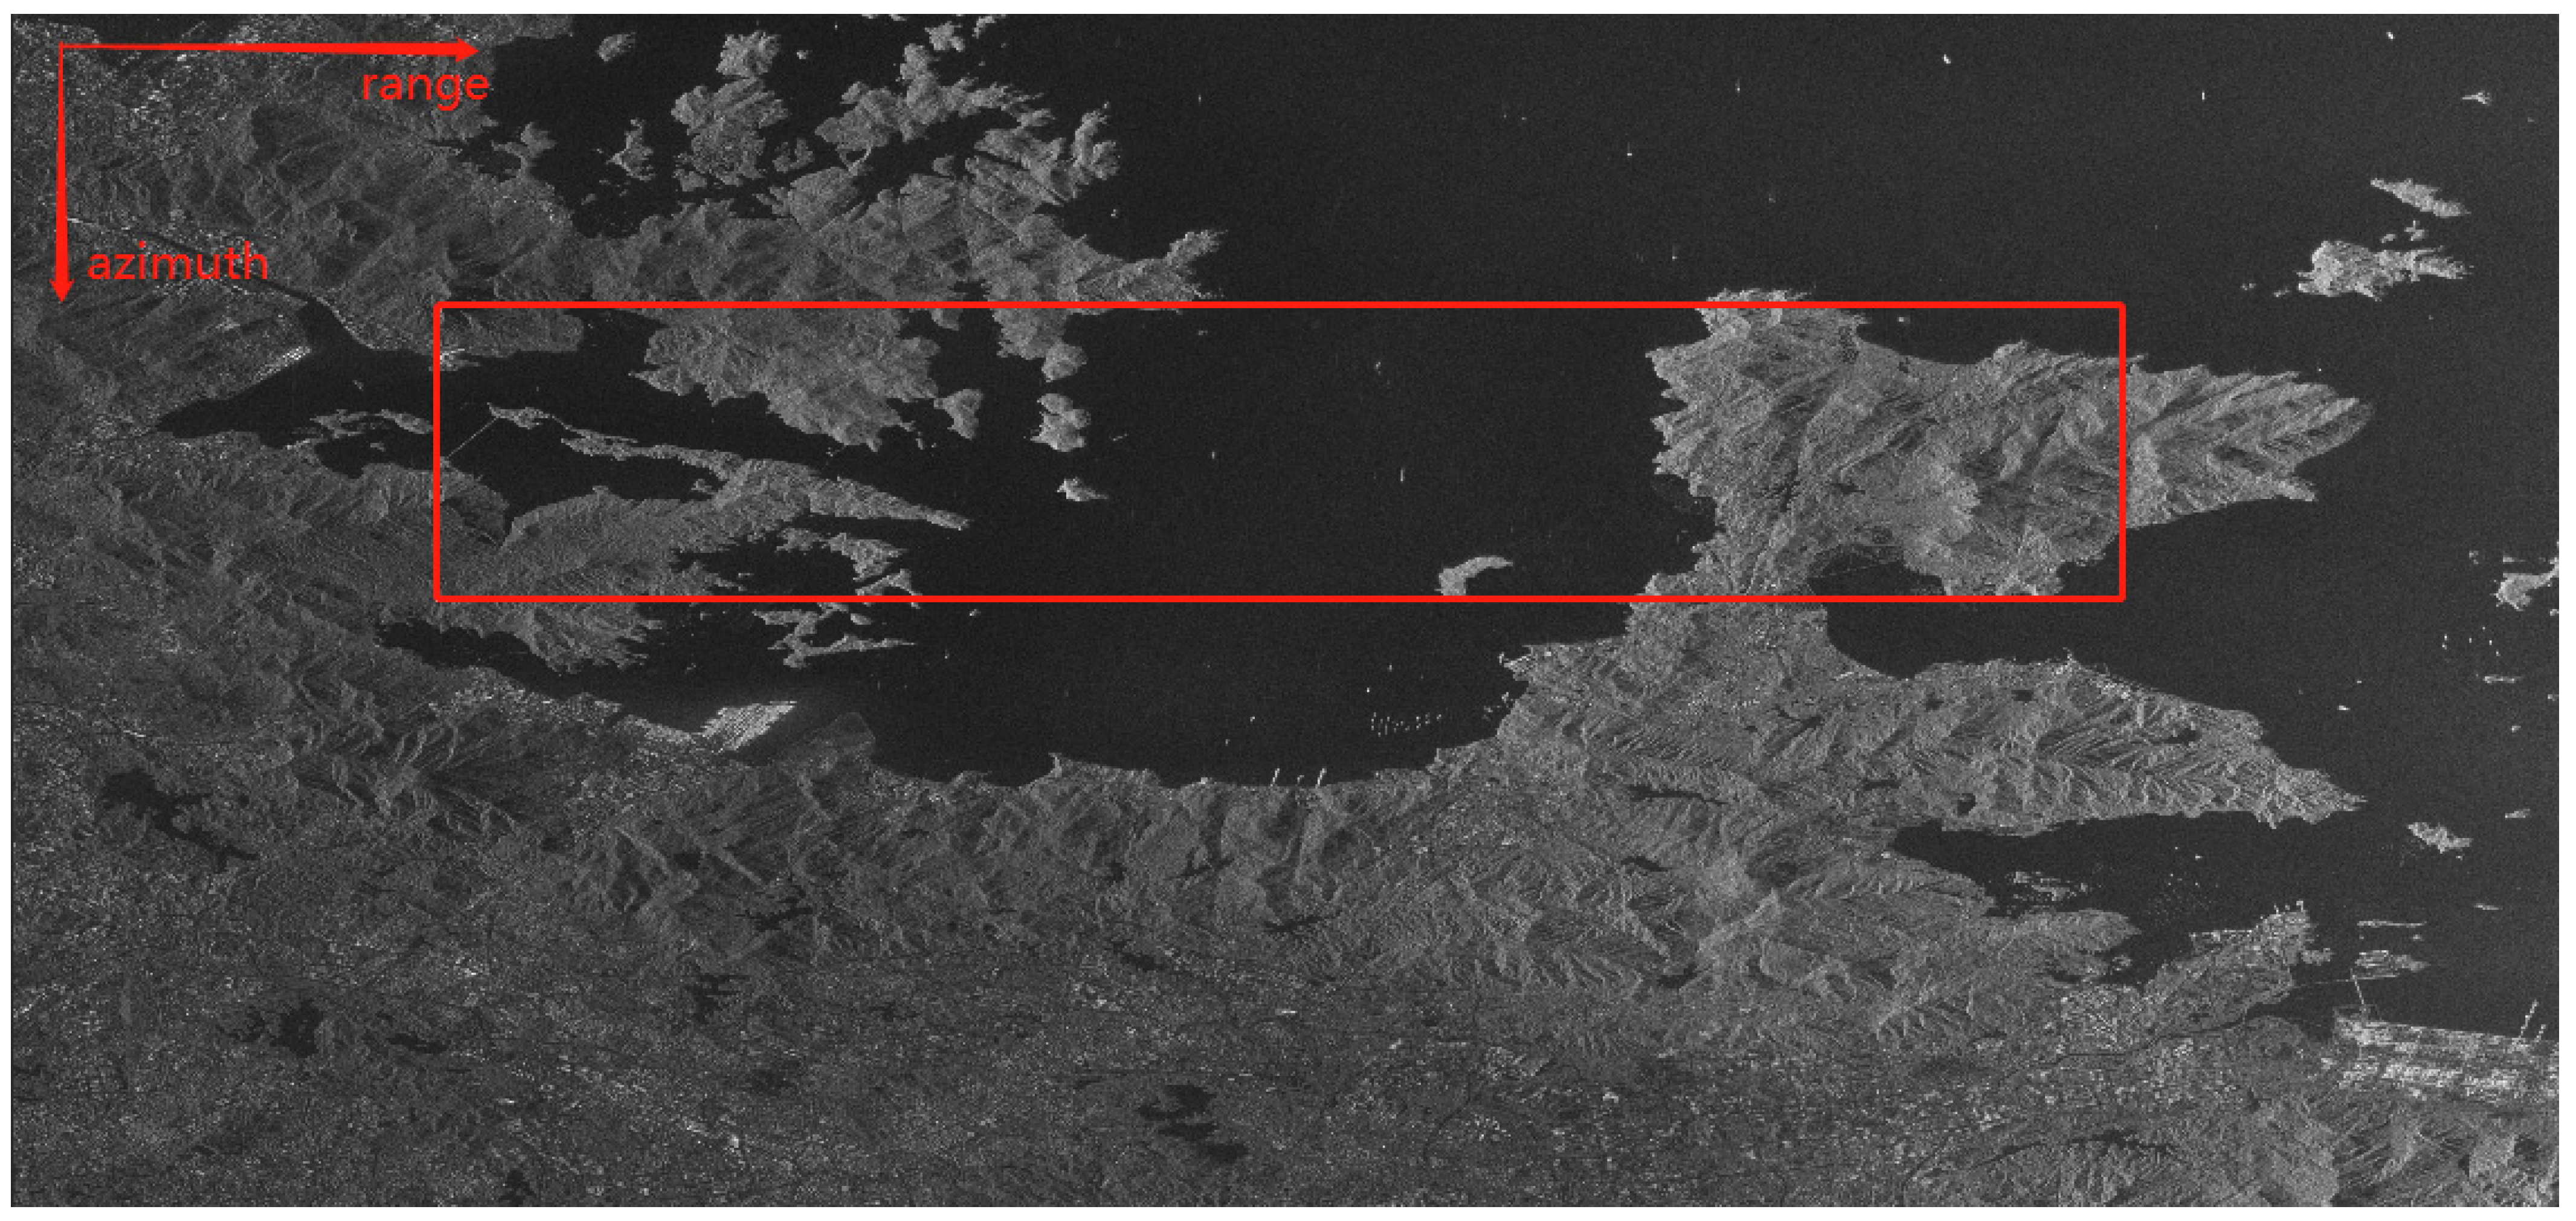
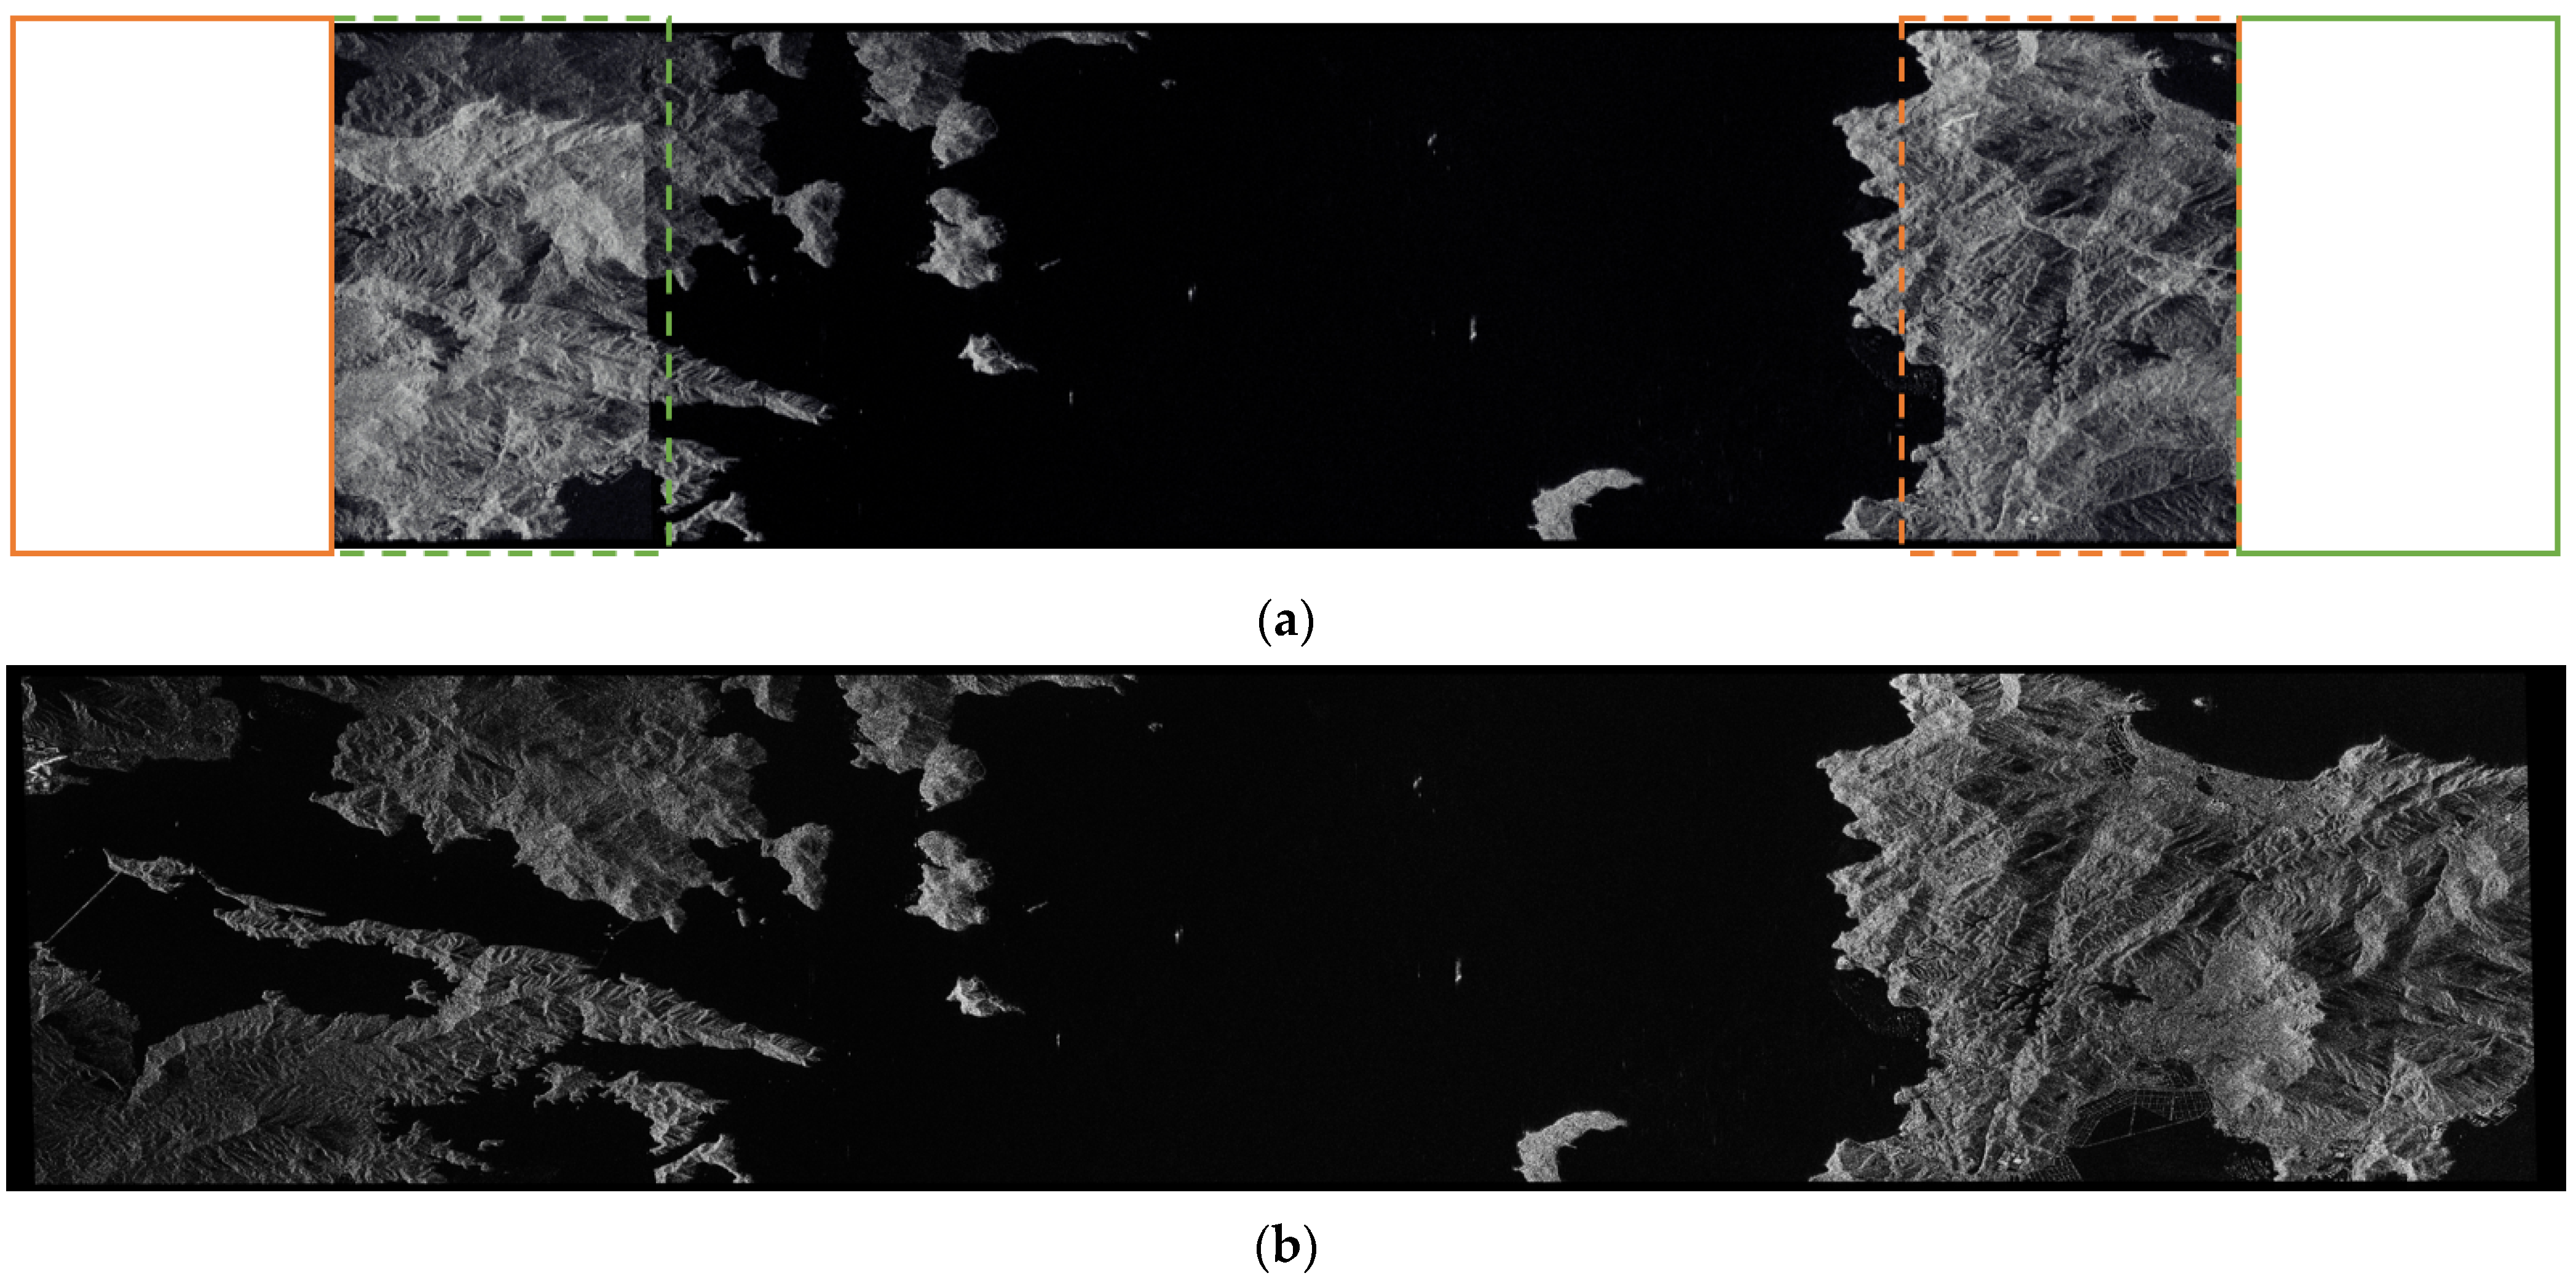
Combined with the established transmitted signal, the mathematical model of the F-SCAN SAR echo is derived. The positions and phases of the compressed echoes from different range cells are then analyzed. An imaging algorithm based on the hybrid correlation algorithm is proposed to process the F-SCAN SAR data. The raw data is first processed by a dechirp operation. Then, the range Fourier transform is performed to obtain the range focused result, in which the compressed echoes are successfully separated due to the residual linear phase in the range-time domain and target aliasing is avoided due to the sufficiently large range sampling frequency. Then, the applicable azimuth reference function is constructed to correlate with the echo data, implementing RCMC and azimuth compression. The azimuth reference function must be updated with the range sampling unit. The mathematical relationship between the beam pointing angle and time is established to obtain the instantaneous wavelength of the received signal from the target with a given slant range. The method for obtaining matched Doppler parameters is given, where the actual slant range is calculated according to the focused position of the point target in the range-frequency domain. The simulation results suggest that echoes from various slant ranges reach the receiver at the same range time, implying that the proposed transmitted signal model can achieve echo compression with reasonably chosen system parameters. The range compressed result and the analysis of the focused results verify that the proposed imaging algorithm can recover the relative positions of the signals from different range targets and achieve a precise focus on the point targets. Focused results on the surface target demonstrate that the proposed algorithm can effectively avoid range aliasing. The focused image is the result of a mirror image of the range direction.

Author Contributions

Conceptualization, P.W.; methodology, P.W. and Y.L.; software, Y.L.; validation, Y.L., Y.G., T.H. and R.B.; formal analysis, Y.L.; investigation, P.W. and Y.L.; resources, Y.L.; data curation, Y.L.; writing—original draft preparation, Y.L.; writing—review and editing, P.W., Y.G., Z.M. and L.C.; visualization, Y.L.; supervision, P.W.; project administration, P.W.; funding acquisition, P.W. All authors have read and agreed to the published version of the manuscript.

Funding

This research was funded by the National Natural Science Foundation of China (NNSFC) under Grant No. U2241202 and the Innovation Fund Project of Shanghai Aerospace Science and Technology (SAST) under Grant No. SAST2021-045.

Data Availability Statement

Not applicable.

Acknowledgments

We thank the anonymous reviewers for their comments towards improving this manuscript.

Conflicts of Interest

The authors declare no conflict of interest.

Appendix A

The derivation process from (7) to (8) is given below.
According to the sifting property of an impulse, (7) can be converted into:
M ( t , β ) = m = 1 M g ( m M + 1 2 ) = m = 1 M + g ( x ) δ x m M + 1 2 d x
where:
g ( x ) = exp j 2 π f c + b t x Δ τ + d sin β c + j π b x 2 Δ τ + d sin β c 2
Let y = f c + b t Δ τ + d sin β c , then M t , β can be rewritten as:
M ( t , β ) = m = 1 M δ x m M + 1 2 exp j π b Δ τ + d sin β c 2 x 2 e j 2 π x y d x
The integration of the outer corresponds to the Fourier transform, where x represents time, and y represents frequency. According to the property of the Fourier transform, the multiplication in one domain is equivalent to convolution in another. The above expression is equal to:
M ( t , β ) = m = 1 M δ x m M + 1 2 e j 2 π x y d x exp j π b Δ τ + d sin β c 2 x 2 e j 2 π x y d x
The above two Fourier transforms can be solved separately by using the shifting the property and the principle of stationary phase (POSP). The result is:
M ( t , β ) = m = 1 M e j 2 π m M + 1 2 y e j π y 2 b Δ τ + d sin β c 2
Summing the series at the first term gives:
M ( t , β ) = sin π M y sin π y e j π y 2 / b Δ τ + d sin β c 2
The convolution is calculated by means of continuous function integration, and the following can be obtained:
M ( t , β ) = sin M π x sin π x e j π ( y x ) 2 / b Δ τ + d sin β c 2 d x
In this formula, the phase varies slowly near the stationary point x = y = f c + b t Δ τ + d sin β c , but it varies rapidly at other positions, and the amplitude is slowly varying relative to the phase, allowing the integral to be solved using the POSP. The phase part obtained is exactly 0, and the final expression is:
M ( t , β ) = sin [ M π ( Δ τ c + d sin β ) / λ ( t ) ] sin π ( Δ τ c + d sin β ) / λ ( t )
where the instantaneous wavelength is λ ( t ) = c f c + b t .

References

  1. Sherwin, C.W.; Ruina, J.P.; Rawcliffe, R.D. Some Early Developments in Synthetic Aperture Radar Systems. IRE Trans. Mil. Electron. 1962, MIL–6, 111–115. [Google Scholar] [CrossRef]
  2. Moreira, A.; Prats-Iraola, P.; Younis, M.; Krieger, G.; Hajnsek, I.; Papathanassiou, K.P. A Tutorial on Synthetic Aperture Radar. IEEE Geosci. Remote Sens. Mag. 2013, 1, 6–43. [Google Scholar] [CrossRef]
  3. Currie, A.; Brown, M.A. Wide-Swath SAR. IEE Proc. F Radar Signal Process. 1992, 139, 122–135. [Google Scholar] [CrossRef]
  4. Gebert, N.; Fois, F.; Helière, F.; Lin, C.-C.; Arcioni, M. Multi-Channel SAR: Relaxing the Minimum Antenna Area Constraint. In Proceedings of the 2011 12th International Radar Symposium (IRS), Leipzig, Germany, 7–9 September 2011; IEEE: New York, NY, USA; pp. 53–58. [Google Scholar]
  5. Younis, M.; Wiesbeck, W. SAR with Digital Beamforming on Receive Only. In Proceedings of the IEEE 1999 International Geoscience and Remote Sensing Symposium. IGARSS’99 (Cat. No. 99CH36293), Hamburg, Germany, 28 June–2 July 1999; IEEE: New York, NY, USA; Volume 3, pp. 1773–1775. [Google Scholar]
  6. Younis, M.; Fischer, C.; Wiesbeck, W. Digital Beamforming in SAR Systems. IEEE Trans. Geosci. Remote Sens. 2003, 41, 1735–1739. [Google Scholar] [CrossRef]
  7. Süß, M.; Grafmüller, B.; Zahn, R. A Novel High Resolution, Wide Swath SAR System. In Proceedings of the IEEE 2001 International Geoscience and Remote Sensing Symposium (Cat. No. 01CH37217), Sydney, NSW, Australia, 9–13 July 2001; Volume 3, pp. 1013–1015. [Google Scholar]
  8. Krieger, G.; Moreira, A. Potential of Digital Beamforming in Bi-and Multistatic SAR. In Proceedings of the 2003 IEEE International Geoscience and Remote Sensing Symposium. Proceedings (IEEE Cat. No. 03CH37477), Toulouse, France, 21–25 July 2003; IEEE: New York, NY, USA; Volume 1, pp. 527–529. [Google Scholar]
  9. Gebert, N.; Krieger, G.; Moreira, A. Digital Beamforming for HRWS-SAR Imaging: System Design, Performance and Optimization Strategies. In Proceedings of the 2006 IEEE International Symposium on Geoscience and Remote Sensing, Denver, CO, USA, 31 July–4 August 2006; IEEE: New York, NY, USA; pp. 1836–1839. [Google Scholar]
  10. Krieger, G.; Gebert, N.; Moreira, A. Multidimensional Waveform Encoding: A New Digital Beamforming Technique for Synthetic Aperture Radar Remote Sensing. IEEE Trans. Geosci. Remote Sens. 2007, 46, 31–46. [Google Scholar] [CrossRef]
  11. Krieger, G.; Gebert, N.; Younis, M.; Moreira, A. Advanced Synthetic Aperture Radar Based on Digital Beamforming and Waveform Diversity. In Proceedings of the 2008 IEEE Radar Conference, Rome, Italy, 26–30 May 2008; IEEE: New York, NY, USA; pp. 1–6. [Google Scholar]
  12. Bordoni, F.; Younis, M.; Varona, E.M.; Krieger, G. Adaptive Scan-on-Receive Based on Spatial Spectral Estimation for High-Resolution, Wide-Swath Synthetic Aperture Radar. In Proceedings of the 2009 IEEE International Geoscience and Remote Sensing Symposium, Cape Town, South Africa, 12–17 July 2009; IEEE: New York, NY, USA; Volume 1, p. I-64. [Google Scholar]
  13. Roemer, C. Introduction to a New Wide Area SAR Mode Using the F-SCAN Principle. In Proceedings of the 2017 IEEE International Geoscience and Remote Sensing Symposium (IGARSS), Fort Worth, TX, USA, 23–28 July 2017; IEEE: New York, NY, USA; pp. 3844–3847. [Google Scholar]
  14. Roemer, C.; Gierlich, R.; Marquez-Martinez, J.; Notter, M. Frequency Scanning Applied to Wide Area SAR Imaging. In Proceedings of the EUSAR 2018, 12th European Conference on Synthetic Aperture Radar, VDE, Aachen, Germany, 4–7 June 2018; pp. 1–5. [Google Scholar]
  15. Liu, Y.; Cui, L.; Wang, P.; Guo, Y. A Rasr Analysis Method Based on F-Scan Sar. In Proceedings of the IGARSS 2022-2022 IEEE International Geoscience and Remote Sensing Symposium, Kuala Lumpur, Malaysia, 17–22 July 2022; IEEE: New York, NY, USA; pp. 2043–2046. [Google Scholar]
  16. Nan, L.; Gai, G.; Shiyang, T.; Linrang, Z. Signal Modeling and Analysis for Elevation Frequency Scanning HRWS SAR. IEEE Trans. Geosci. Remote Sens. 2020, 58, 6434–6450. [Google Scholar] [CrossRef]
  17. Scheiber, R.; Martone, M.; Gollin, N. Chirp Selection and Data Compression for Spaceborne Wide-Swath SAR in FScan-Mode. In Proceedings of the EUSAR 2021, 13th European Conference on Synthetic Aperture Radar, VDE, Online, 29 March–1 April 2021; pp. 1–6. [Google Scholar]
  18. Janoth, J.; Jochum, M.; Petrat, L.; Knigge, T. High Resolution Wide Swath—The Next Generation X-Band Mission. In Proceedings of the IGARSS 2019–2019 IEEE International Geoscience and Remote Sensing Symposium, Yokohama, Japan, 28 July–2 August 2019; pp. 3535–3537. [Google Scholar]
  19. Moreira, A.; Zink, M.; Bartusch, M.; Nuncio Quiroz, A.E.; Stettner, S. German Spaceborne SAR Missions. In Proceedings of the 2021 IEEE Radar Conference (RadarConf21), Atlanta, GA, USA, 7–14 May 2021; pp. 1–6. [Google Scholar]
  20. Zhou, Y.; Liu, H.; Ma, F.; Pan, Z.; Zhang, F. A Sidelobe-Aware Small Ship Detection Network for Synthetic Aperture Radar Imagery. IEEE Trans. Geosci. Remote Sens. 2023, 61, 1–16. [Google Scholar] [CrossRef]
  21. Ma, F.; Sun, X.; Zhang, F.; Zhou, Y.; Li, H.-C. What Catch Your Attention in SAR Images: Saliency Detection Based on Soft-Superpixel Lacunarity Cue. IEEE Trans. Geosci. Remote Sens. 2023, 61, 1–17. [Google Scholar] [CrossRef]
  22. Nehorai, A.; Gini, F.; Greco, M.S.; Suppappola, A.P.; Rangaswamy, M. Introduction to the Issue on Adaptive Waveform Design for Agile Sensing and Communication. IEEE J. Sel. Top. Signal Process. 2007, 1, 2–5. [Google Scholar] [CrossRef]
  23. Shengqi, Z.H.U.; Kun, Y.U.; Jingwei, X.U.; Lan, L.A.N.; Ximin, L.I. Research Progress and Prospect for the Noval Waveform Diverse Array Radar. J. Radars 2021, 10, 795–810. [Google Scholar]
  24. Guccione, P.; Mapelli, D.; Giudici, D.; Persico, A.R. Design of F-SCAN Acquisition Mode for Synthetic Aperture Radar. Remote Sens. 2022, 14, 5283. [Google Scholar] [CrossRef]
  25. Babur, G.; Aubry, P.; Le Chevalier, F. Space-Time Radar Waveforms: Circulating Codes. J. Electr. Comput. Eng. 2013, 2013, 809691. [Google Scholar] [CrossRef]
  26. Babur, G.; Aubry, P.; Le Chevalier, F. Space-Time Codes for Active Antenna Systems: Comparative Performance Analysis. In Proceedings of the IET International Radar Conference 2013, Xi’an, China, 14–16 April 2013. [Google Scholar]
  27. Babur, G.; Aubry, P.; Chevalier, F.L. Simple Transmit Diversity Technique for Phased Array Radar. IET Radar Sonar Navig. 2016, 10, 1046–1056. [Google Scholar] [CrossRef]
  28. Nan, L.; Linrang, Z. Intrapulse Azimuth Frequency Scanning-Based 2-D Scanning SAR for HRWS Imaging. IEEE Trans. Geosci. Remote Sens. 2021, 59, 9382–9396. [Google Scholar] [CrossRef]
  29. Nan, L.; Xuyang, W.; Ruyue, D.; Linrang, Z. Intrapulse Continuous Azimuth Frequency Scanning-Based Spotlight SAR. IEEE Trans. Geosci. Remote Sens. 2022, 60, 1–13. [Google Scholar] [CrossRef]
  30. Wu, C.; Liu, K.Y.; Jin, M. Modeling and a Correlation Algorithm for Spaceborne SAR Signals. IEEE Trans. Aerosp. Electron. Syst. 1982, AES-18, 563–575. [Google Scholar] [CrossRef]
  31. Cumming, I.G.; Wong, F.H. Digital Processing of Synthetic Aperture Radar Data: Algorithms and Implementation; Artech House Print on Demand: Boston, MA, USA, 2005. [Google Scholar]
  32. Wang, P.; Liu, W.; Chen, J.; Niu, M.; Yang, W. A High-Order Imaging Algorithm for High-Resolution Spaceborne SAR Based on a Modified Equivalent Squint Range Model. IEEE Trans. Geosci. Remote Sens. 2015, 53, 1225–1235. [Google Scholar] [CrossRef]
  33. Raney, R.K.; Runge, H.; Bamler, R.; Cumming, I.G.; Wong, F.H. Precision SAR Processing Using Chirp Scaling. IEEE Trans. Geosci. Remote Sens. 1994, 32, 786–799. [Google Scholar] [CrossRef]
Figure 1. Beam scanning in the elevation plane.
Remotesensing 15 04276 g001
Figure 2. The model of the space–time coding array and transmitted signals.
Remotesensing 15 04276 g002
Figure 3. Radar’s receive window and complete echoes from far, middle, and near range targets on the swath. (1) The green signal represents the echo from the near-range target, which is illuminated by the pencil beam at a later moment, but its propagation delay is shorter due to the shorter slant range R n ; (2) the orange signal represents the echo from the far-range target, which is illuminated earlier by the pencil beam, but has a longer delay due to the longer slant range R f ; (3) the black signal is the echo from the middle reference target with slant range R 0 , which is a compromise between the previous two.
Remotesensing 15 04276 g003
Figure 4. The imaging processing flowchart for F-SCAN SAR.
Remotesensing 15 04276 g004
Figure 5. The placement of the STCA and the relationship between some angles.
Remotesensing 15 04276 g005
Figure 6. Synthetic antenna patterns in different directions.
Remotesensing 15 04276 g006
Figure 7. Pencil beam pointing angle versus time.
Remotesensing 15 04276 g007
Figure 8. Ground scene layout of the targets.
Remotesensing 15 04276 g008
Figure 9. The magnitude of the F-SCAN SAR echoes from point targets T 1 , T 2 , and T 3 . (a) Echoes in the two-dimensional time domain. (b) Echoes in the range-frequency, azimuth-time domain.
Remotesensing 15 04276 g009
Figure 10. Range compressed data and the partial magnifications of the target trajectories.
Remotesensing 15 04276 g010
Figure 11. Two-dimensional contour, range profile, and azimuth profile of the focused results. (a1a3) The results for the point target T 1 . (b1b3) The results of the point target T 2 . (c1c3) The results of point target T 3 . The results have been oversampled by a factor of 16 to show more details.
Remotesensing 15 04276 g011aRemotesensing 15 04276 g011b
Figure 12. The SAR image acquired by the GF-3 satellite.
Remotesensing 15 04276 g012
Figure 13. Imaging results for the simulated echo. (a) The result from the conventional chirp scaling algorithm. (b) The result from the proposed algorithm (after flipping left and right).
Remotesensing 15 04276 g013
Table 1. Simulation parameters of the STCA and chirp signal.
ParameterValue
Number of sensors51
Relative time offset (ns)−0.1
Spacing between adjacent sensors (m)0.06
Pulse duration (us)180
Center frequency (GHz)10
Chirp bandwidth (MHz)1400
Table 2. Radar system parameters.
ParameterValue
Orbit height (km)514
Antenna tilt angle (°)60
Observation modeStripmap
Azimuth antenna (m)4
Pulse repetition frequency (Hz)4000
Range antennathe STCA
Range sampling frequency (MHz)1500
The length of the receive window (us)22
Table 3. The evaluation results for the point targets.
Target IDRangeAzimuth
ρ r (m) ρ r , t (m) 1PSLR(dB)ISLR(dB) ρ a (m) ρ a , t (m) 2PSLR(dB)ISLR(dB)
T 1 1.5961.565−13.018−9.8101.6361.641−13.144−10.002
T 2 1.5841.565−13.143−10.0101.6421.641−13.285−10.000
T 3 1.6051.565−13.007−9.6361.6631.641−13.097−9.953
1  ρ r , t represents the theoretical ground range resolution, and ρ r , t = 0.886 c 2 b τ w sin η . 2  ρ a , t represents the theoretical azimuth resolution.
Table 4. Parameter configuration.
Parameter N a N r K N B P F M
Value819232,76816409632,768
Disclaimer/Publisher’s Note: The statements, opinions and data contained in all publications are solely those of the individual author(s) and contributor(s) and not of MDPI and/or the editor(s). MDPI and/or the editor(s) disclaim responsibility for any injury to people or property resulting from any ideas, methods, instructions or products referred to in the content.

