1. Introduction
Land cover refers to the natural formation and human-induced coverage conditions on Earth’s surface and includes both vegetation and various artificial coverings and modifications. Land cover is a comprehensive reflection of natural processes and human activities [
1]. As land cover is closely related to global climate change, biodiversity, material cycles, regional resources, and the human living environment [
2,
3,
4,
5,
6], land cover data have attracted great attention from researchers [
7].
The traditional method of acquiring land cover information through land surveys and field investigations has been used for many years; however, it is expensive, time-consuming, and limited in terms of spatial scale. Rapid advancements in Earth observation satellites and computer technology have revolutionized remote sensing, offering a crucial technical approach to acquiring comprehensive information on large-scale land cover distribution and changes [
8,
9,
10]. Researchers worldwide have utilized image processing technology to interpret and analyze remote sensing images, resulting in diverse land cover products at varying spatial resolutions. For instance, the United States Geological Survey developed the global 1 km resolution land cover dataset IGBP-DISCover [
11], Boston University researchers developed the 500 m resolution MODIS global land cover data [
12], the European Space Agency (ESA) produced the 300 m resolution ESA-CCI dataset [
13,
14], Copernicus Global Land Service developed the 100 m resolution CGLS_LC100 [
15], the National Geomatics Center of China has produced the 30 m resolution GlobeLand30 series datasets [
16], and Google recently developed the Dynamic World land cover map, which provides near real-time global coverage at a 10 m resolution [
17]. The aforementioned land-cover data products enable large-scale studies of the environment, hydrological cycle, and global change; however, it is important to note that the majority of land cover products primarily rely on remote sensing images as their data sources. Therefore, the adoption of diverse satellite sensors, classification systems, and methods may lead to varying degrees of difference in describing actual surface conditions [
18], leading to users facing various uncertainties when choosing these data [
19]. While 10 m resolution data requires more computing resources and processing time when covering a wide area, 30 m resolution data have the characteristics of high resolution and relatively simple data acquisition, processing, and storage, which are sufficient to provide the information necessary for the study of large-scale land cover changes. Therefore, there is a crucial need to assess the precision and suitability of diverse global land cover data products with a 30 m resolution.
In recent years, several studies have appraised the precision of various land cover data products in diverse study areas. Song et al. [
20,
21] examined the spatial distribution and classification accuracy of various land cover data products within China and found notable misclassification and confusion in the data for the southwestern region. Armel et al. [
22] analyzed the coherence of four land cover products (GLC2000, GLOBCOVE, MODIS, and ECOCLIMAP) in Africa, and found that the consistency ranged from 56% to 69% and that their accuracy was affected by factors such as image time and classification method. Additionally, Dai et al. [
23] used the maximum area upscaling method to study the consistency of products (GlobCover2005, GlobeLand30, MODIS2000, GLC2000, and GlobCover2009) in South America, and found that forest types had the highest consistency and lowest degree of confusion. Giri et al. [
24] compared the global consistency of MODIS and Global Land Cover 2000 data products and found that although both had high overall consistency, they showed low consistency for more refined cover types. In terms of evaluation methods, Xu et al. [
25] employed approaches such as similarity, confusion, and spatial consistency analyses to assess the accuracy of visual interpretation data and GlobCover2009 and GlobeLand30 land-cover datasets. The analysis indicated a consistent alignment of land-cover compositions across the three datasets, with the bare land type showing the highest consistency. Kang et al. [
26] conducted an evaluation of the accuracy of ESRI, ESA, and FROM-GLC products using the GLCVSS validation sample set, Geo-Wiki global validation sample dataset, and validation points obtained through visual interpretation. To compare the accuracy of various land cover datasets, researchers commonly rely on two prevailing methods: (1) the direct evaluation method, which quantitatively assesses accuracy based on a universal validation dataset, and (2) the indirect evaluation method, which compares specific indicators of different land cover data products to analyze their consistency. Differences among products in space cannot be observed using only a direct evaluation method; however, overall or individual types of accuracy values cannot be obtained directly using only indirect evaluation methods. Therefore, it is necessary to combine direct and indirect evaluation methods to comprehensively evaluate the quality of land cover data products.
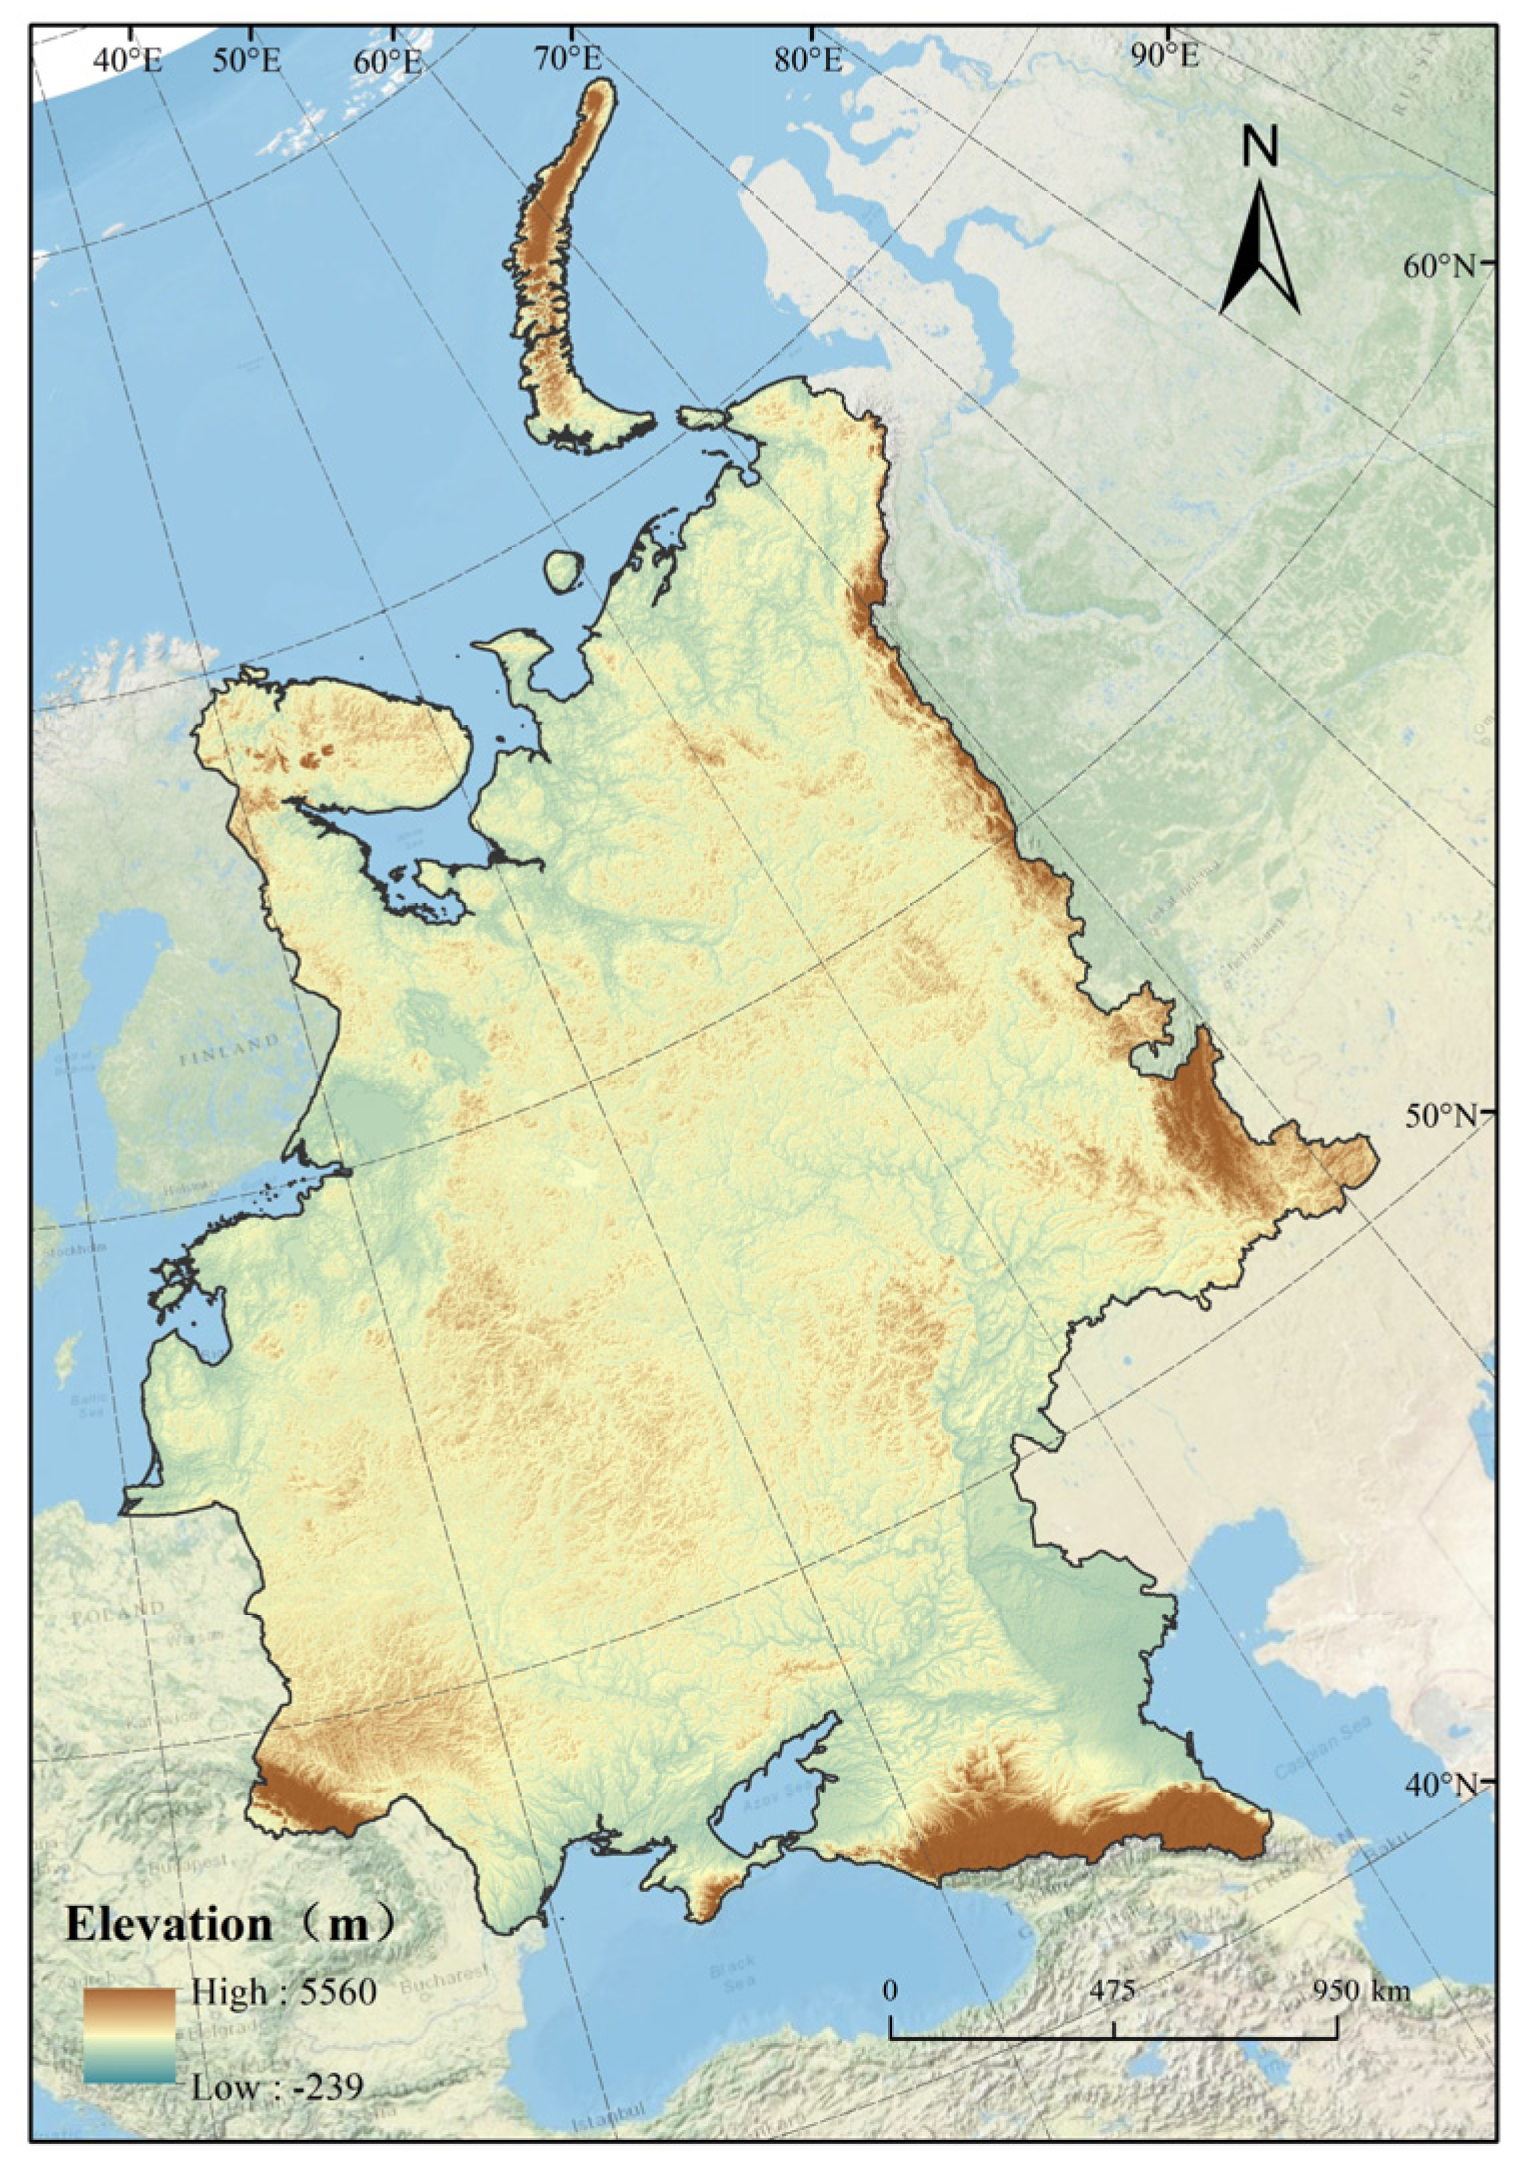
As the second-largest plain and an important agricultural region in the world, the East European Plain has a wide range of land cover types and a complex spatial distribution. Land-cover change has a substantial impact on the ecological environment and socioeconomic development. In this study, we conducted a comparative analysis of consistency and accuracy evaluation of three 30 m resolution land-cover data products (FROM_GLC, GlobeLand30, and GLC_FCS30) from different sources in this area. The results enable a visual assessment of global land cover products’ accuracy, provide effective suggestions for the applicability and adaptation range of these data to the East European Plain, and serve as a reference for consistency analysis methods in other regions.
4. Results
4.1. Similarity of Land Cover Components
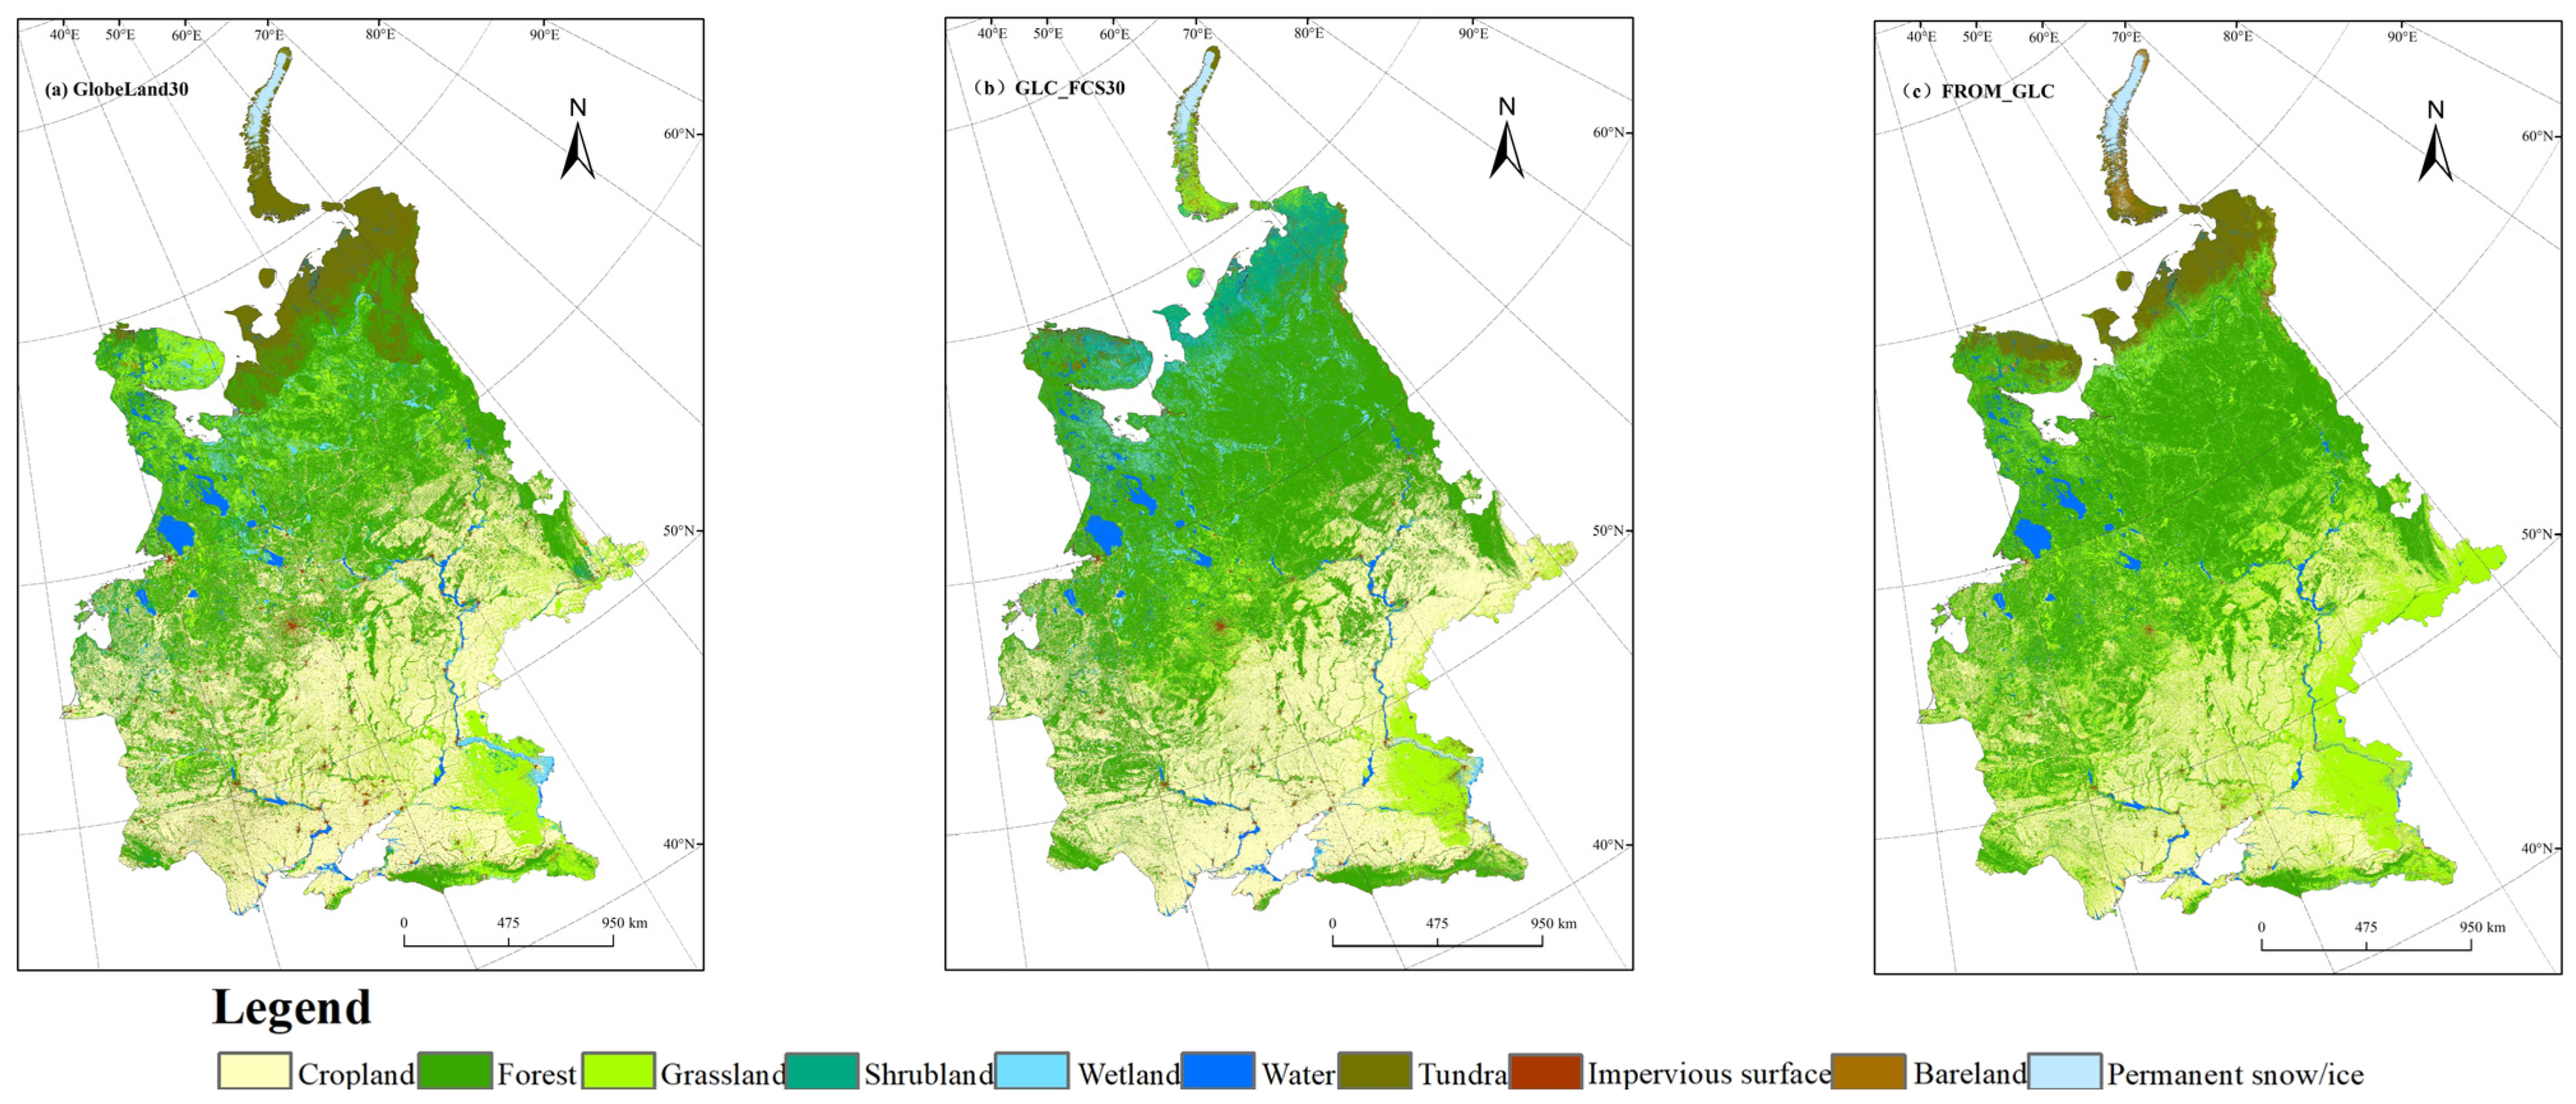
Figure 4 shows the land-cover component proportions of the three land-cover datasets for the East European Plain. Overall, the three data products described the actual land cover of the Eastern European Plain as follows: forest, grassland, and cropland as the main types; water, tundra, wetland, and impervious surfaces as secondary types; and smaller areas of bare land, shrubland, and permanent ice/snow. However, the three data products differed in terms of consistency for certain land-cover types. FROM_GLC, GlobeLand30, and GLC-FCS30 data showed better consistency for water, permanent ice/snow, croplands, and forests; for example, the areas of water were 3.06%, 2.86%, and 2.99%, and those of permanent ice and snow were 0.50%, 0.48%, and 0.68%, respectively. Good consistency was observed for tundra, grasslands, and bare land; for example, the grassland areas were 14.78%, 8.86%, and 27.65%. However, the consistency was poor for impervious surfaces, wetlands, and shrublands, especially in the shrubland category, accounting for 4.27% of the region in the GLC-FCS30 data, compared to only 0.97% and 0.05% in the FROM_GLC and GlobeLand30 data, respectively.
The area correlation coefficients between any two land cover data products were calculated based on the area statistics of each class component, and the correlation coefficients between each pair were >0.85, as shown in
Table 3. GlobeLand30 and GLC-FCS30 had the highest correlation coefficient of 0.964, whereas GLC-FCS30 and FROM_GLC had the lowest correlation coefficient of 0.860.
4.2. Degree of Confusion of Different Land Types
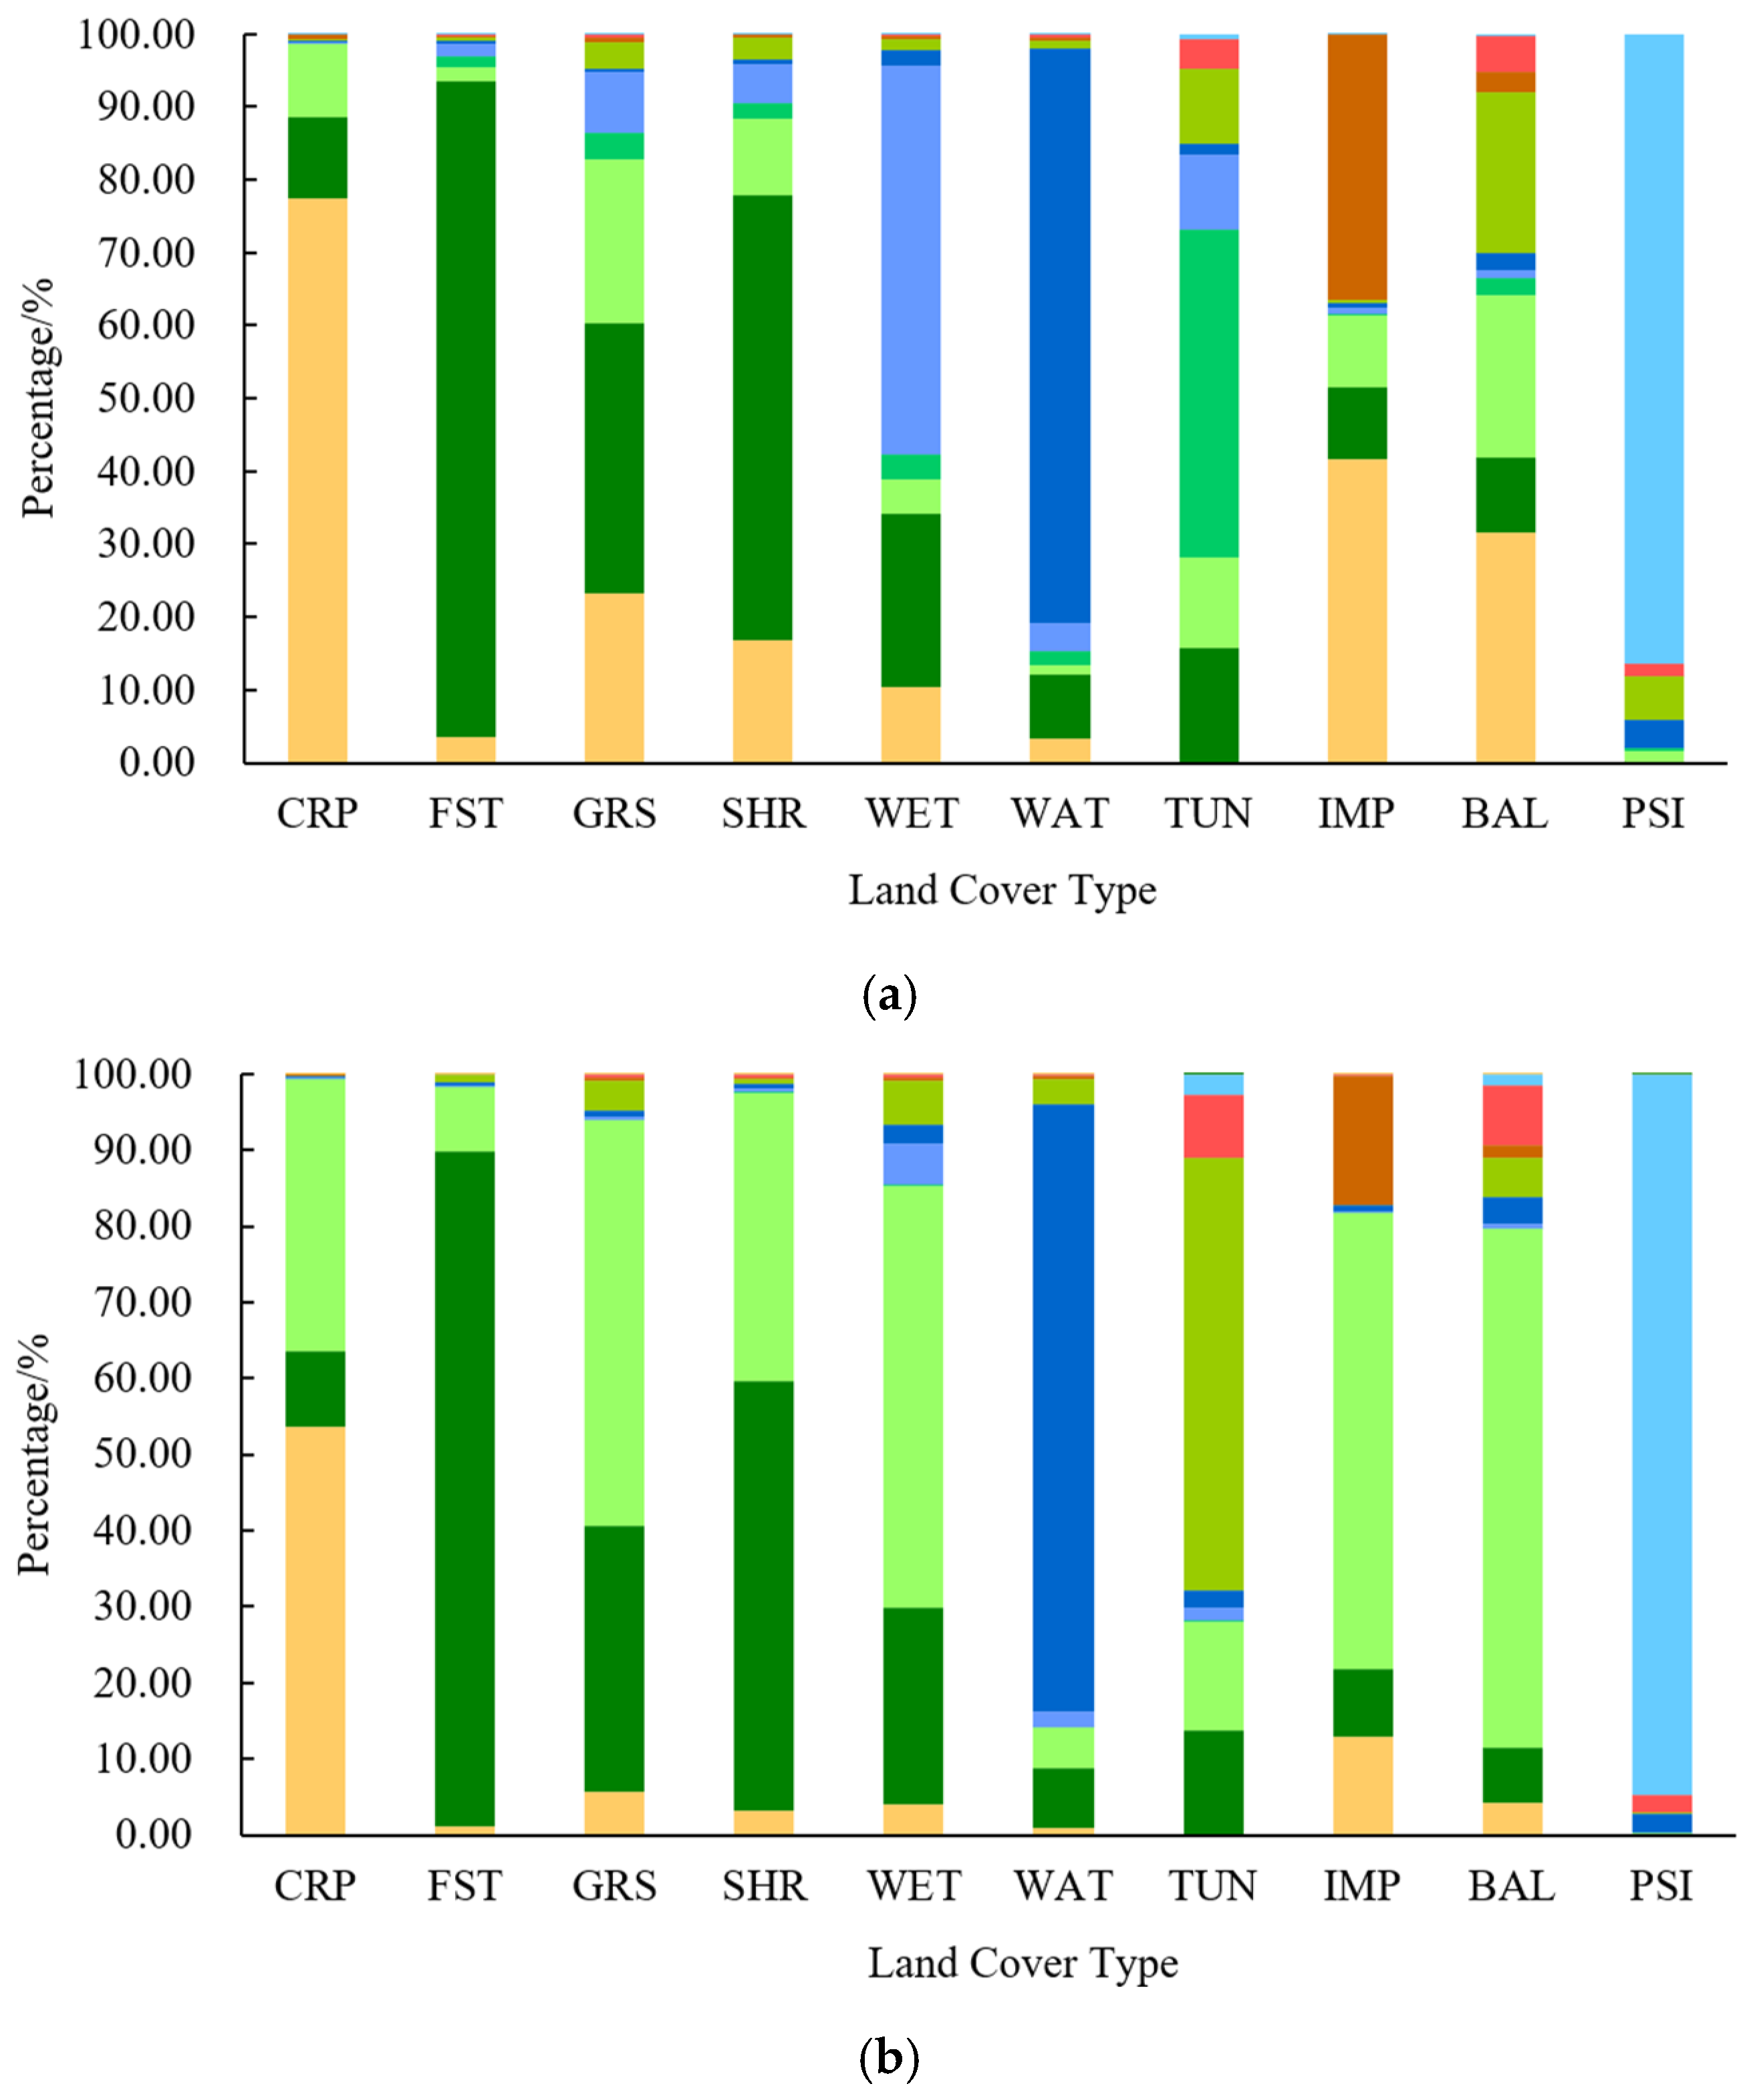
The three land-cover data products were combined in pairs to obtain confusion regarding the different land types, as depicted in
Figure 5. The confusion degrees of forest, permanent snow/ice, water, and cropland types were low, and the confusion degree of forest in all three combinations was <12%. In addition, the degree of confusion of permanent ice/snow in the GlobeLand30/FROM_GLC and GLC-FCS30/FROM_GLC combinations was <6%. The lowest degree of confusion was found in the GLC-FCS30/FROM_GLC combination for water (6.49%) and in the GlobeLand30/ GLC-FCS30 combination for cropland (22.49%). The degree of confusion of shrubland, bare land, and impervious surfaces was relatively high, particularly for shrubland, whose degree of confusion in the GlobeLand30/FR-OM_GLC and GLC-FCS30/FROM_GLC combinations was as high as 99.87% and 99.64%, respectively. The confusion degree of bare land in both the GlobeLand30/GLC-FCS30 and GlobeLand30/FROM_GLC combinations was higher than 92%, and the degree of confusion of the impervious surface in both the GlobeLand30/GLC-FCS30 and FCS30/FROM_GLC combinations was higher than 64%.
In particular, a substantial difference in the degree of confusion between grassland and tundra types was observed for each combination, with grassland having the lowest confusion degree of 24.4% in the GLC-FCS30/FROM_GLC combination and the highest confusion degree of 77.56% in the GlobeLand30/ GLC-FCS30 combination. Tundra had the lowest degree of confusion (43.27%) in the GlobeLand30/FROM_GLC combination and the highest degree of confusion (89.83%) in the GlobeLand30/ GLC-FCS30 combination. The wetland showed a low degree of confusion in one group and a high degree of confusion in the other two groups, with the lowest degree of confusion (46.64%) in the GlobeLand30/ GLC-FCS30 combination and a high degree (>93%) in the other two combinations.
4.3. Spatial Consistency
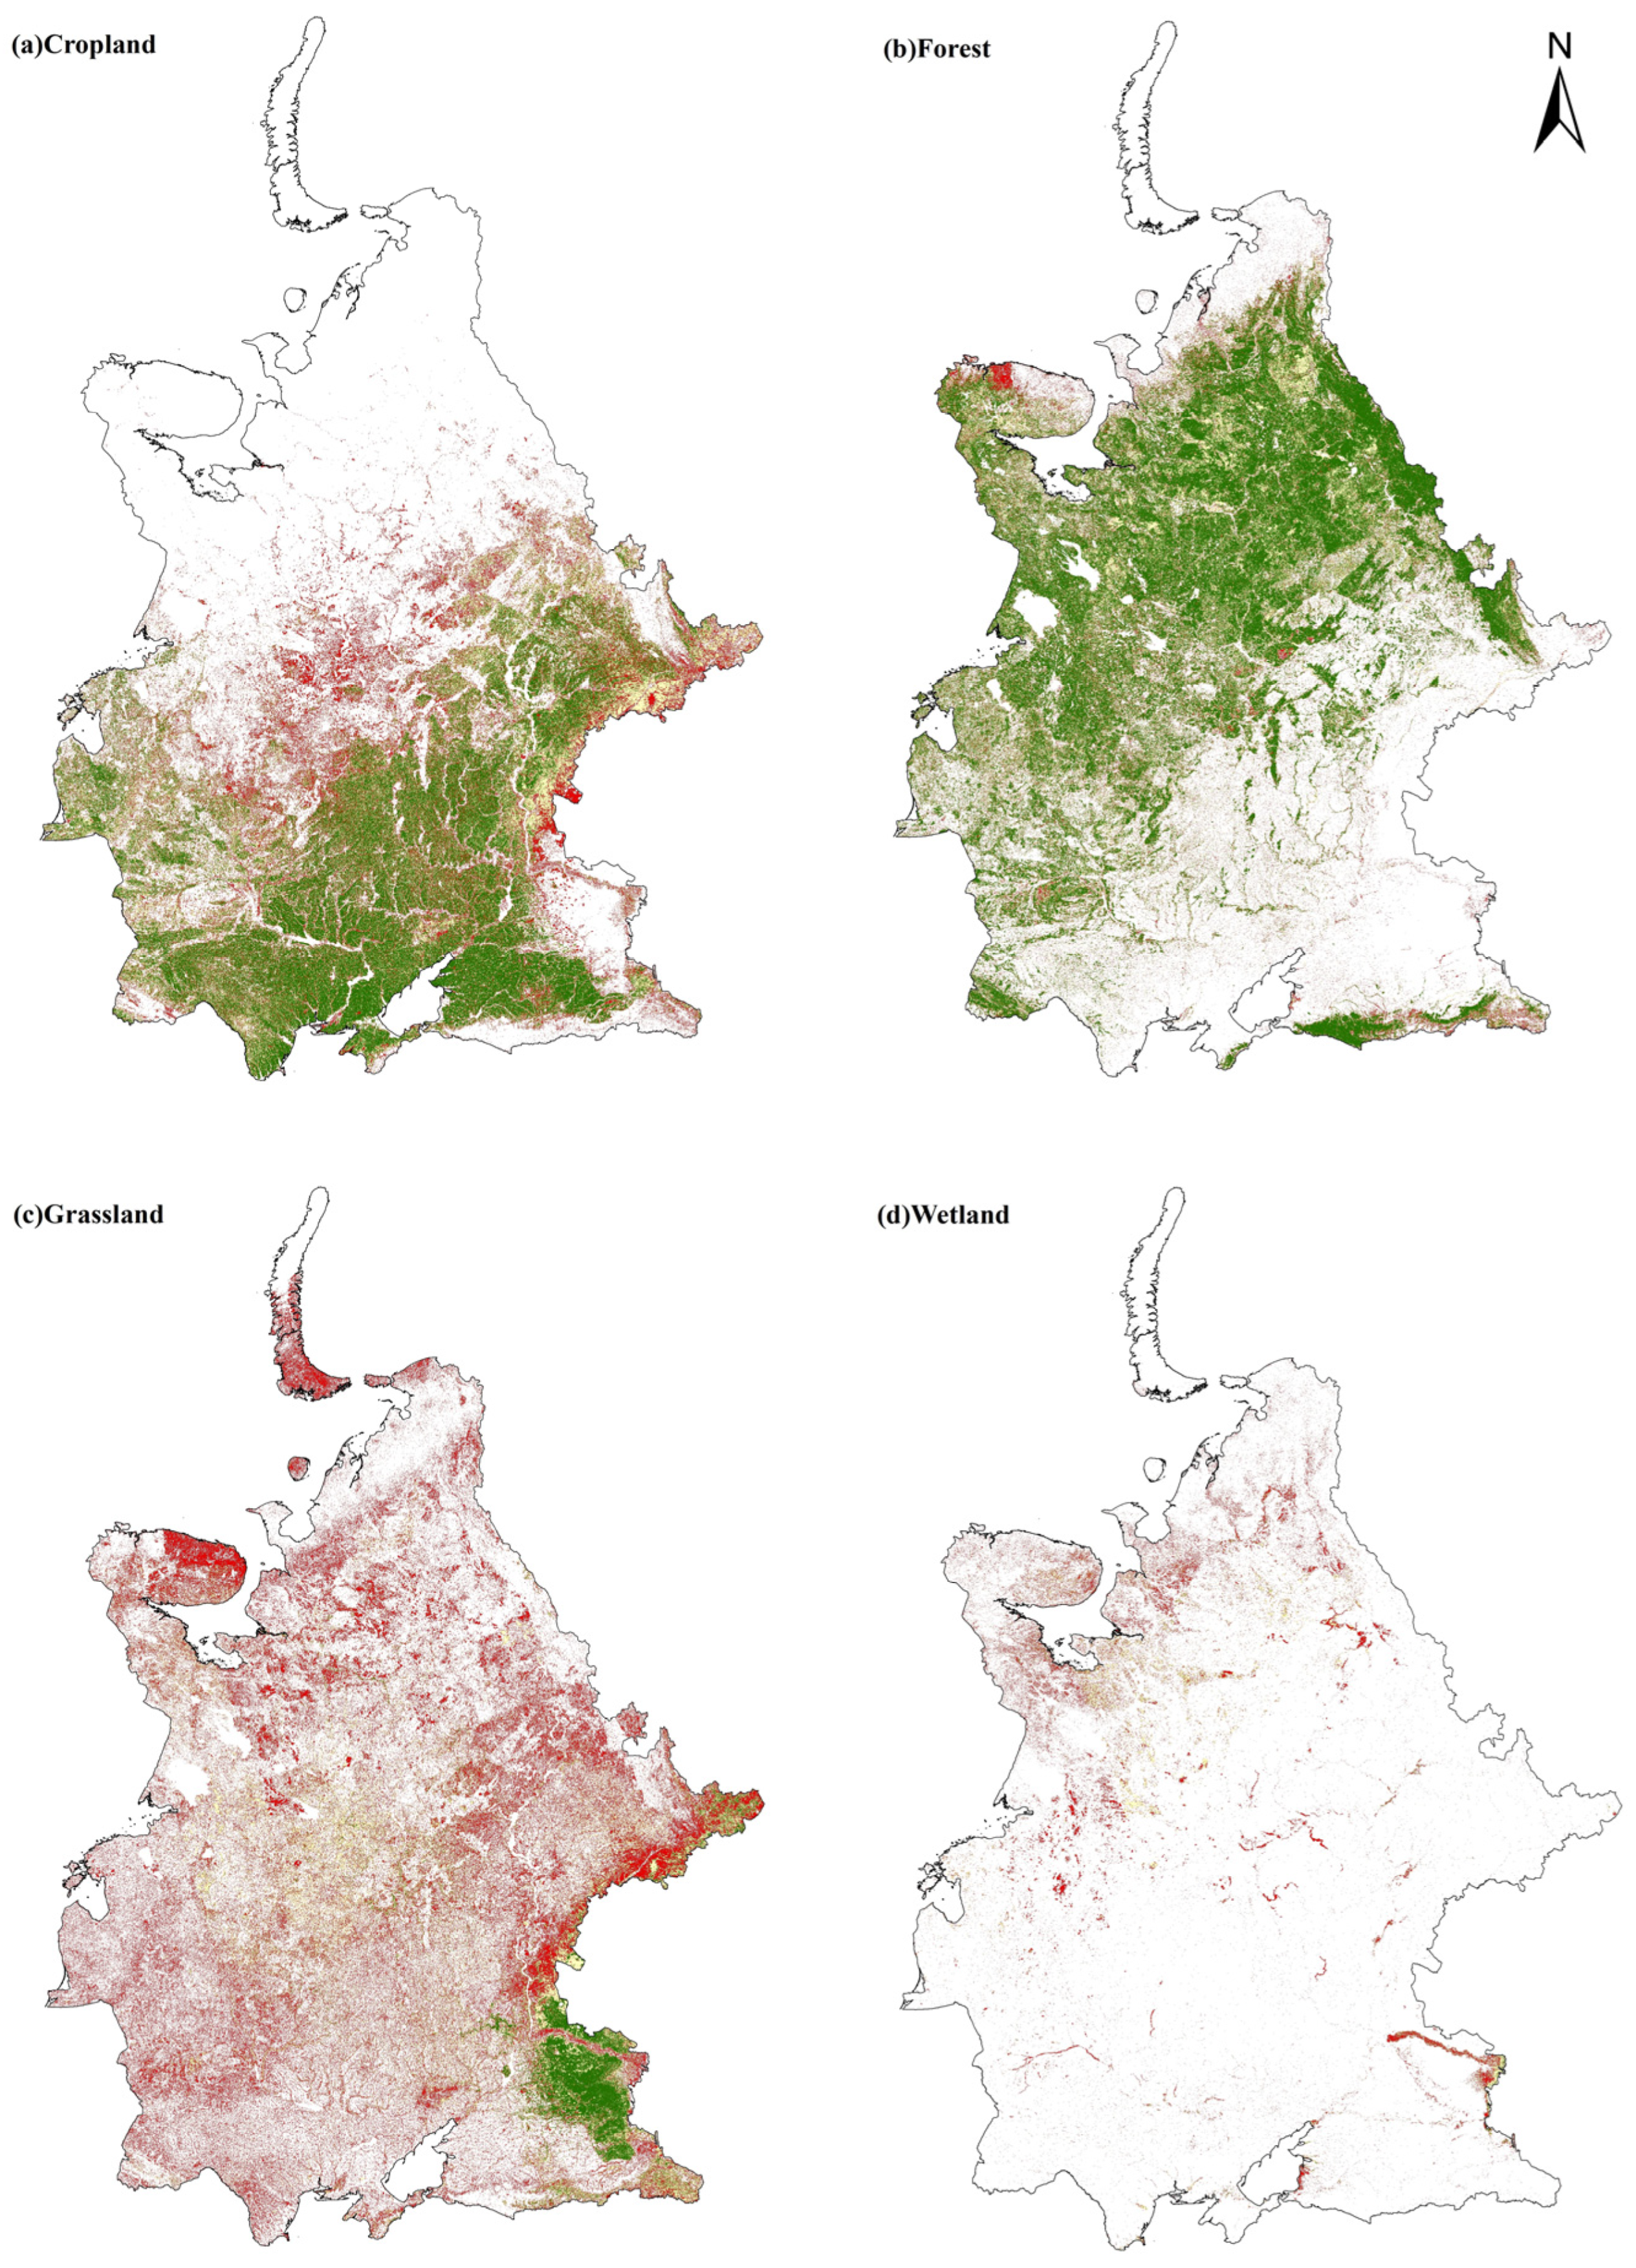
Figure 6 demonstrates the spatial distribution characteristics of six prominent land cover types within the study area, selected for comparative analysis on an image-by-image basis. The green, yellow, and red areas represent high, moderate, and low consistency across the three data products, respectively. The spatial consistency of cropland, forest, and water was good, whereas that of grassland, wetland, and tundra was poor, with less than 10% of the pixels classified as the same type across the three land cover data products.
Specifically, the distribution of croplands (
Figure 6a) was predominantly concentrated in the south-central region of the Eastern European Plain, which is located in a high-latitude northern region with few croplands. Concentrated in regions such as the northern Black Sea, Dnieper River Basin, and Don River Basin, areas with high consistency were observed, where all three data products simultaneously identified the land-cover type as cropland, with the identified area accounting for 43.40% of the total croplands on the plains. Medium- and low-consistency areas were concentrated in the Volga River, Ural River, and Caspian Sea Basins. Two or fewer data products simultaneously identified these areas as croplands, accounting for 26.44% and 30.16% of the total cropland areas of the plains, respectively. Forests (
Figure 6b) were mainly distributed in the southern mountainous, northern lowland, and central hilly areas of the Eastern European Plain. Concentrated in regions such as the Carpathians, Ural Mountains, Kama River Basin, and Baltic Sea coast, the high-consistency areas encompassed approximately 61.57% of the total forested area within the plains. The areas of low consistency were concentrated in the northwestern section of the Kola Peninsula and accounted for only 13.92% of the total forest on the plain. The spatial distribution of water (
Figure 6e) was generally consistent with the important lake waters and rivers of the Eastern European Plain. Concentrated around Lake Onega, Lake Ladoga, Dnieper, Don, and Volga rivers, the high-consistency areas accounted for 63.76% of the total area of water in the plain, whereas the medium- and low-consistency areas accounted for 12.29% and 23.95% of the total water area on the plain, respectively.
Grasslands (
Figure 6c) are widely distributed across all regions of the Eastern European Plain. The high-consistency areas were concentrated south of the Volga River basin and west of the Caspian Sea basin, comprising approximately 8.42% of the total grassland area across the entire plain, while most other areas, such as the Kola Peninsula and the Ural Lake basin, were identified as grasslands by only one or two data products. Low-consistency areas encompassed a significant portion, approximately 67.77%, of the total grassland area across the entire plain. The distribution of wetlands (
Figure 6d) predominantly extended across the northern wet regions of the Eastern European Plain and along the Baltic Sea coast. The high-consistency area for this land cover type constituted a relatively small portion, accounting for only 1.81% of the total plain wetland area, whereas the low-consistency area was concentrated in the Volga River Basin and the northern plain, accounting for 73.27% of the total wetland area across the plain. The distribution of tundra (
Figure 6f) primarily extends to the northernmost regions of the Eastern European Plain near the Arctic Circle and high-altitude areas. The medium-altitude areas were concentrated in the northern coastal areas of the plains near the Barents and Kara Seas, which occupied 47.50% of the total tundra area in the plains. The low-altitude regions were concentrated in the Kola Peninsula, Yuzhny Island, and Berchora River Basin, which occupied 48.31% of the total tundra area of the plains.
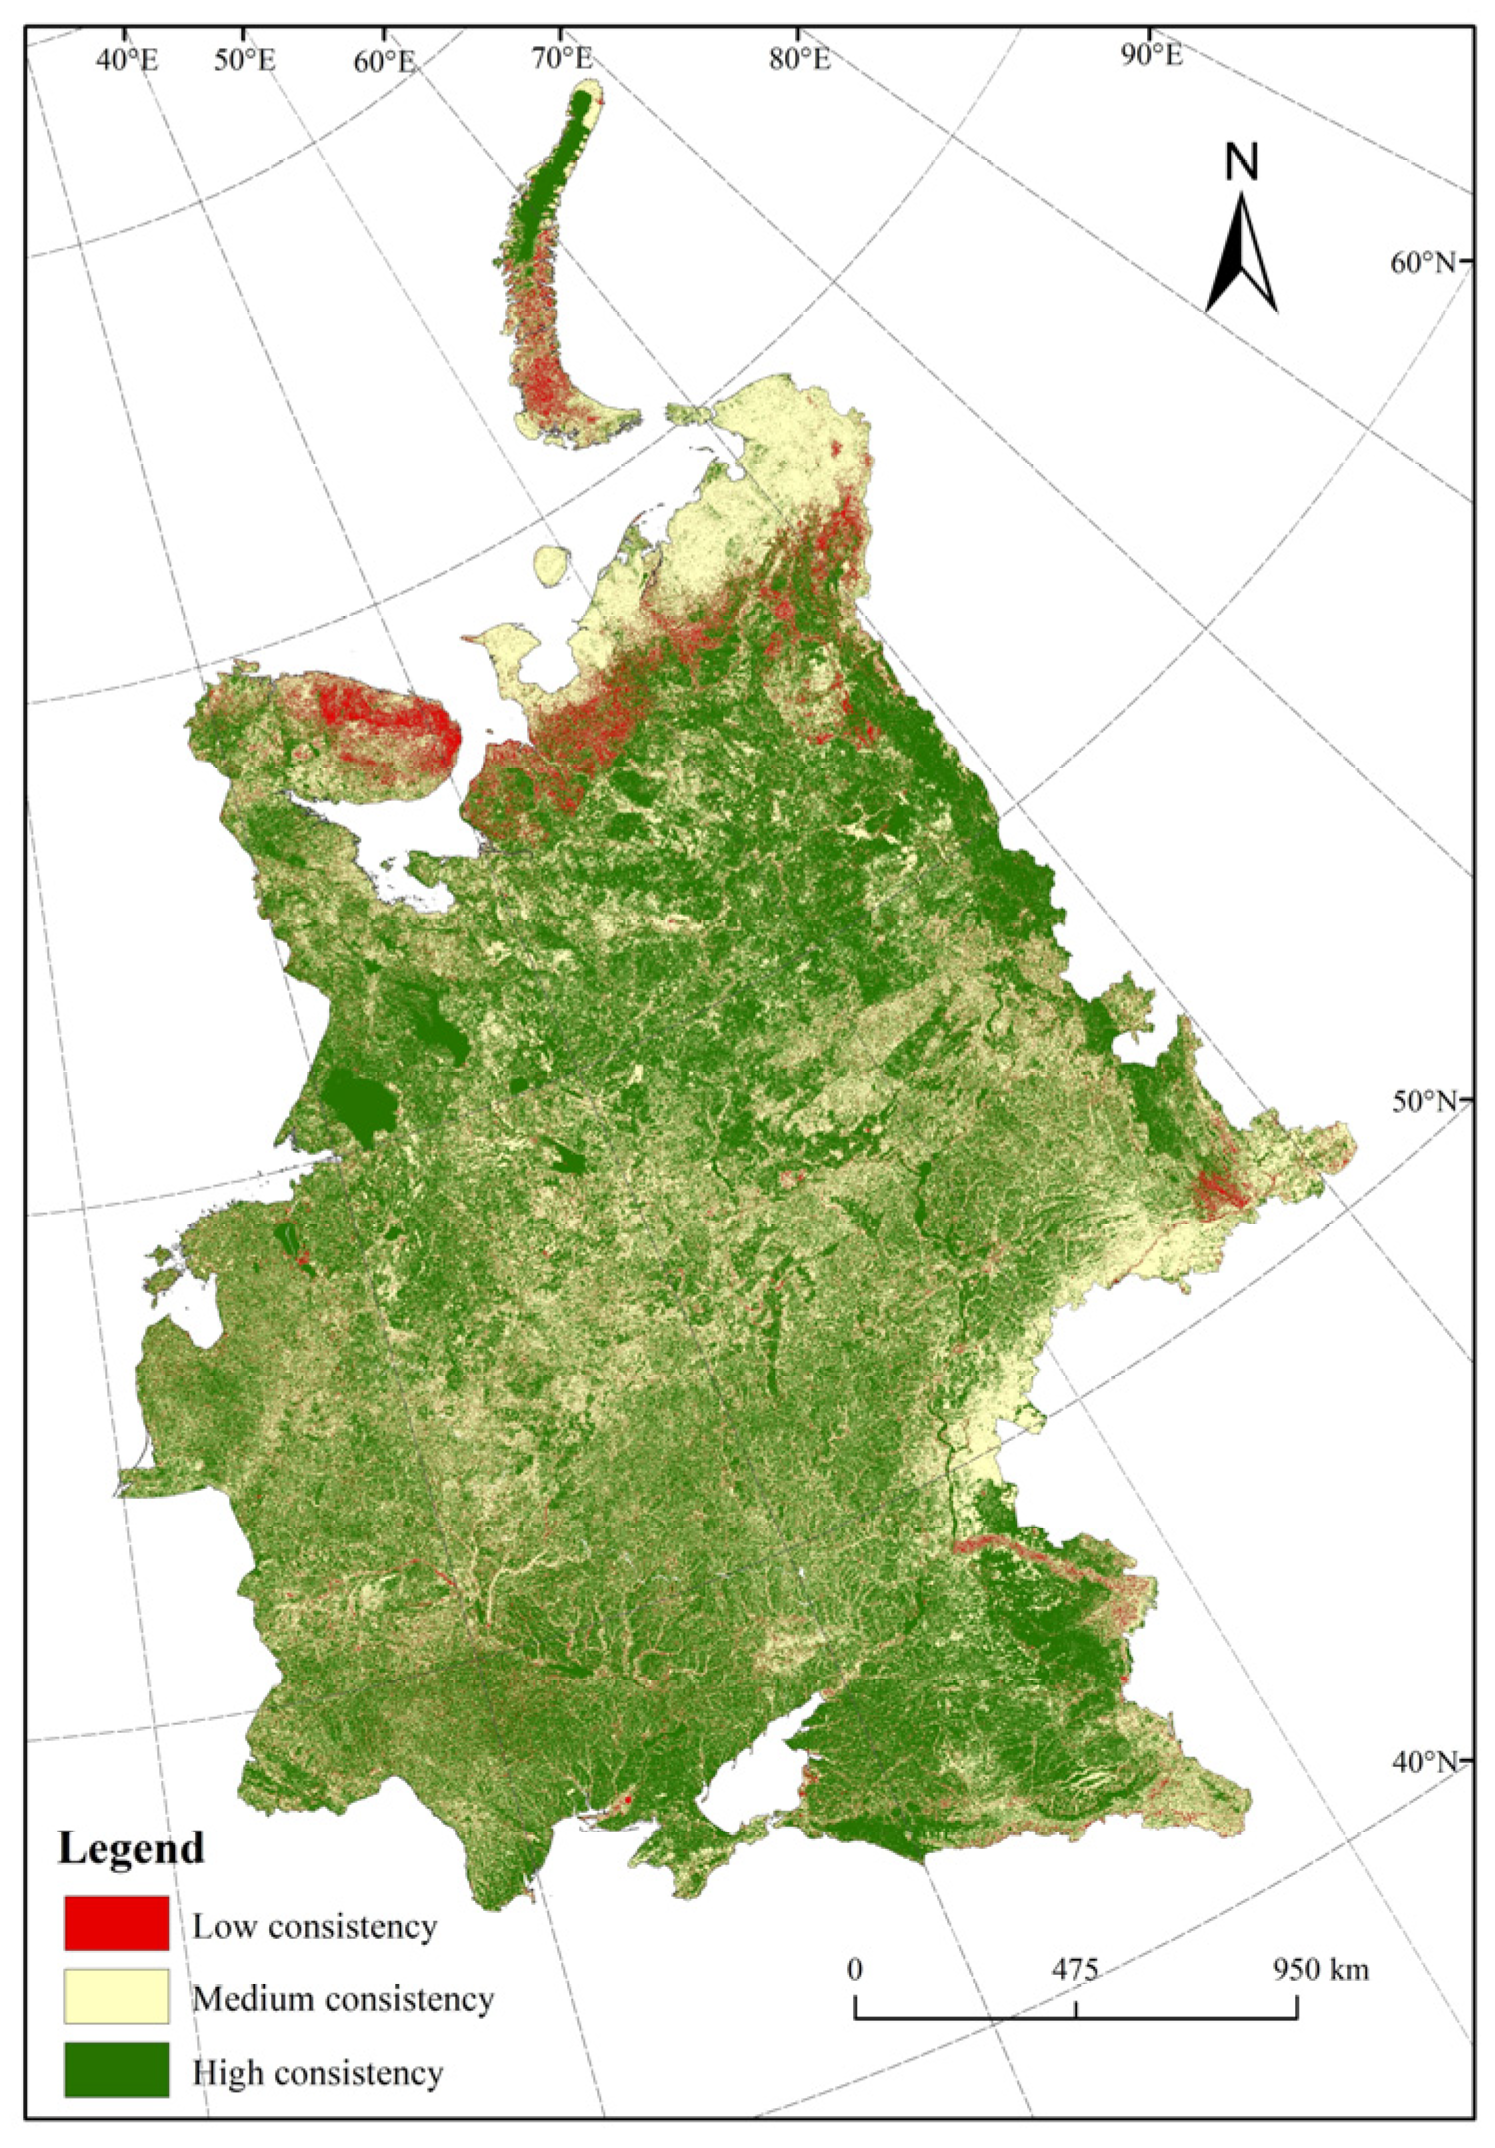
Based on the spatially consistent distribution of the aforementioned land cover types, a global statistical analysis of the three data products was conducted for the East European Plain study area, as shown in
Figure 7. Concentrated primarily in notable regions including Lake Onega, Lake Ladoga, the Caspian Sea, the Ural Mountains, and Severny Island, the high-consistency area accounted for 54.13% of the total plain area. The medium-consistency area encompassed 38.18% of the total plain area, was predominantly situated in the northern coastal areas of the plain near the Barents and Kara seas, the Dnieper River Basin, and the Middle Volga River Basin. Primarily concentrated in regions such as the Kola Peninsula, Yuzhny Island, Berchora, Ural, and the southern Volga River basins, the low-consistency area constituted 7.69% of the total plain area. Therefore, if considered at a 65% confidence level (i.e., two or more of the three land cover data products simultaneously identify image elements as being of the same type), 92.31% of the land in the East European Plain has a high level of credibility, whereas the remaining 7.69% of the land cover types are uncertain.
4.4. Data Product Accuracy
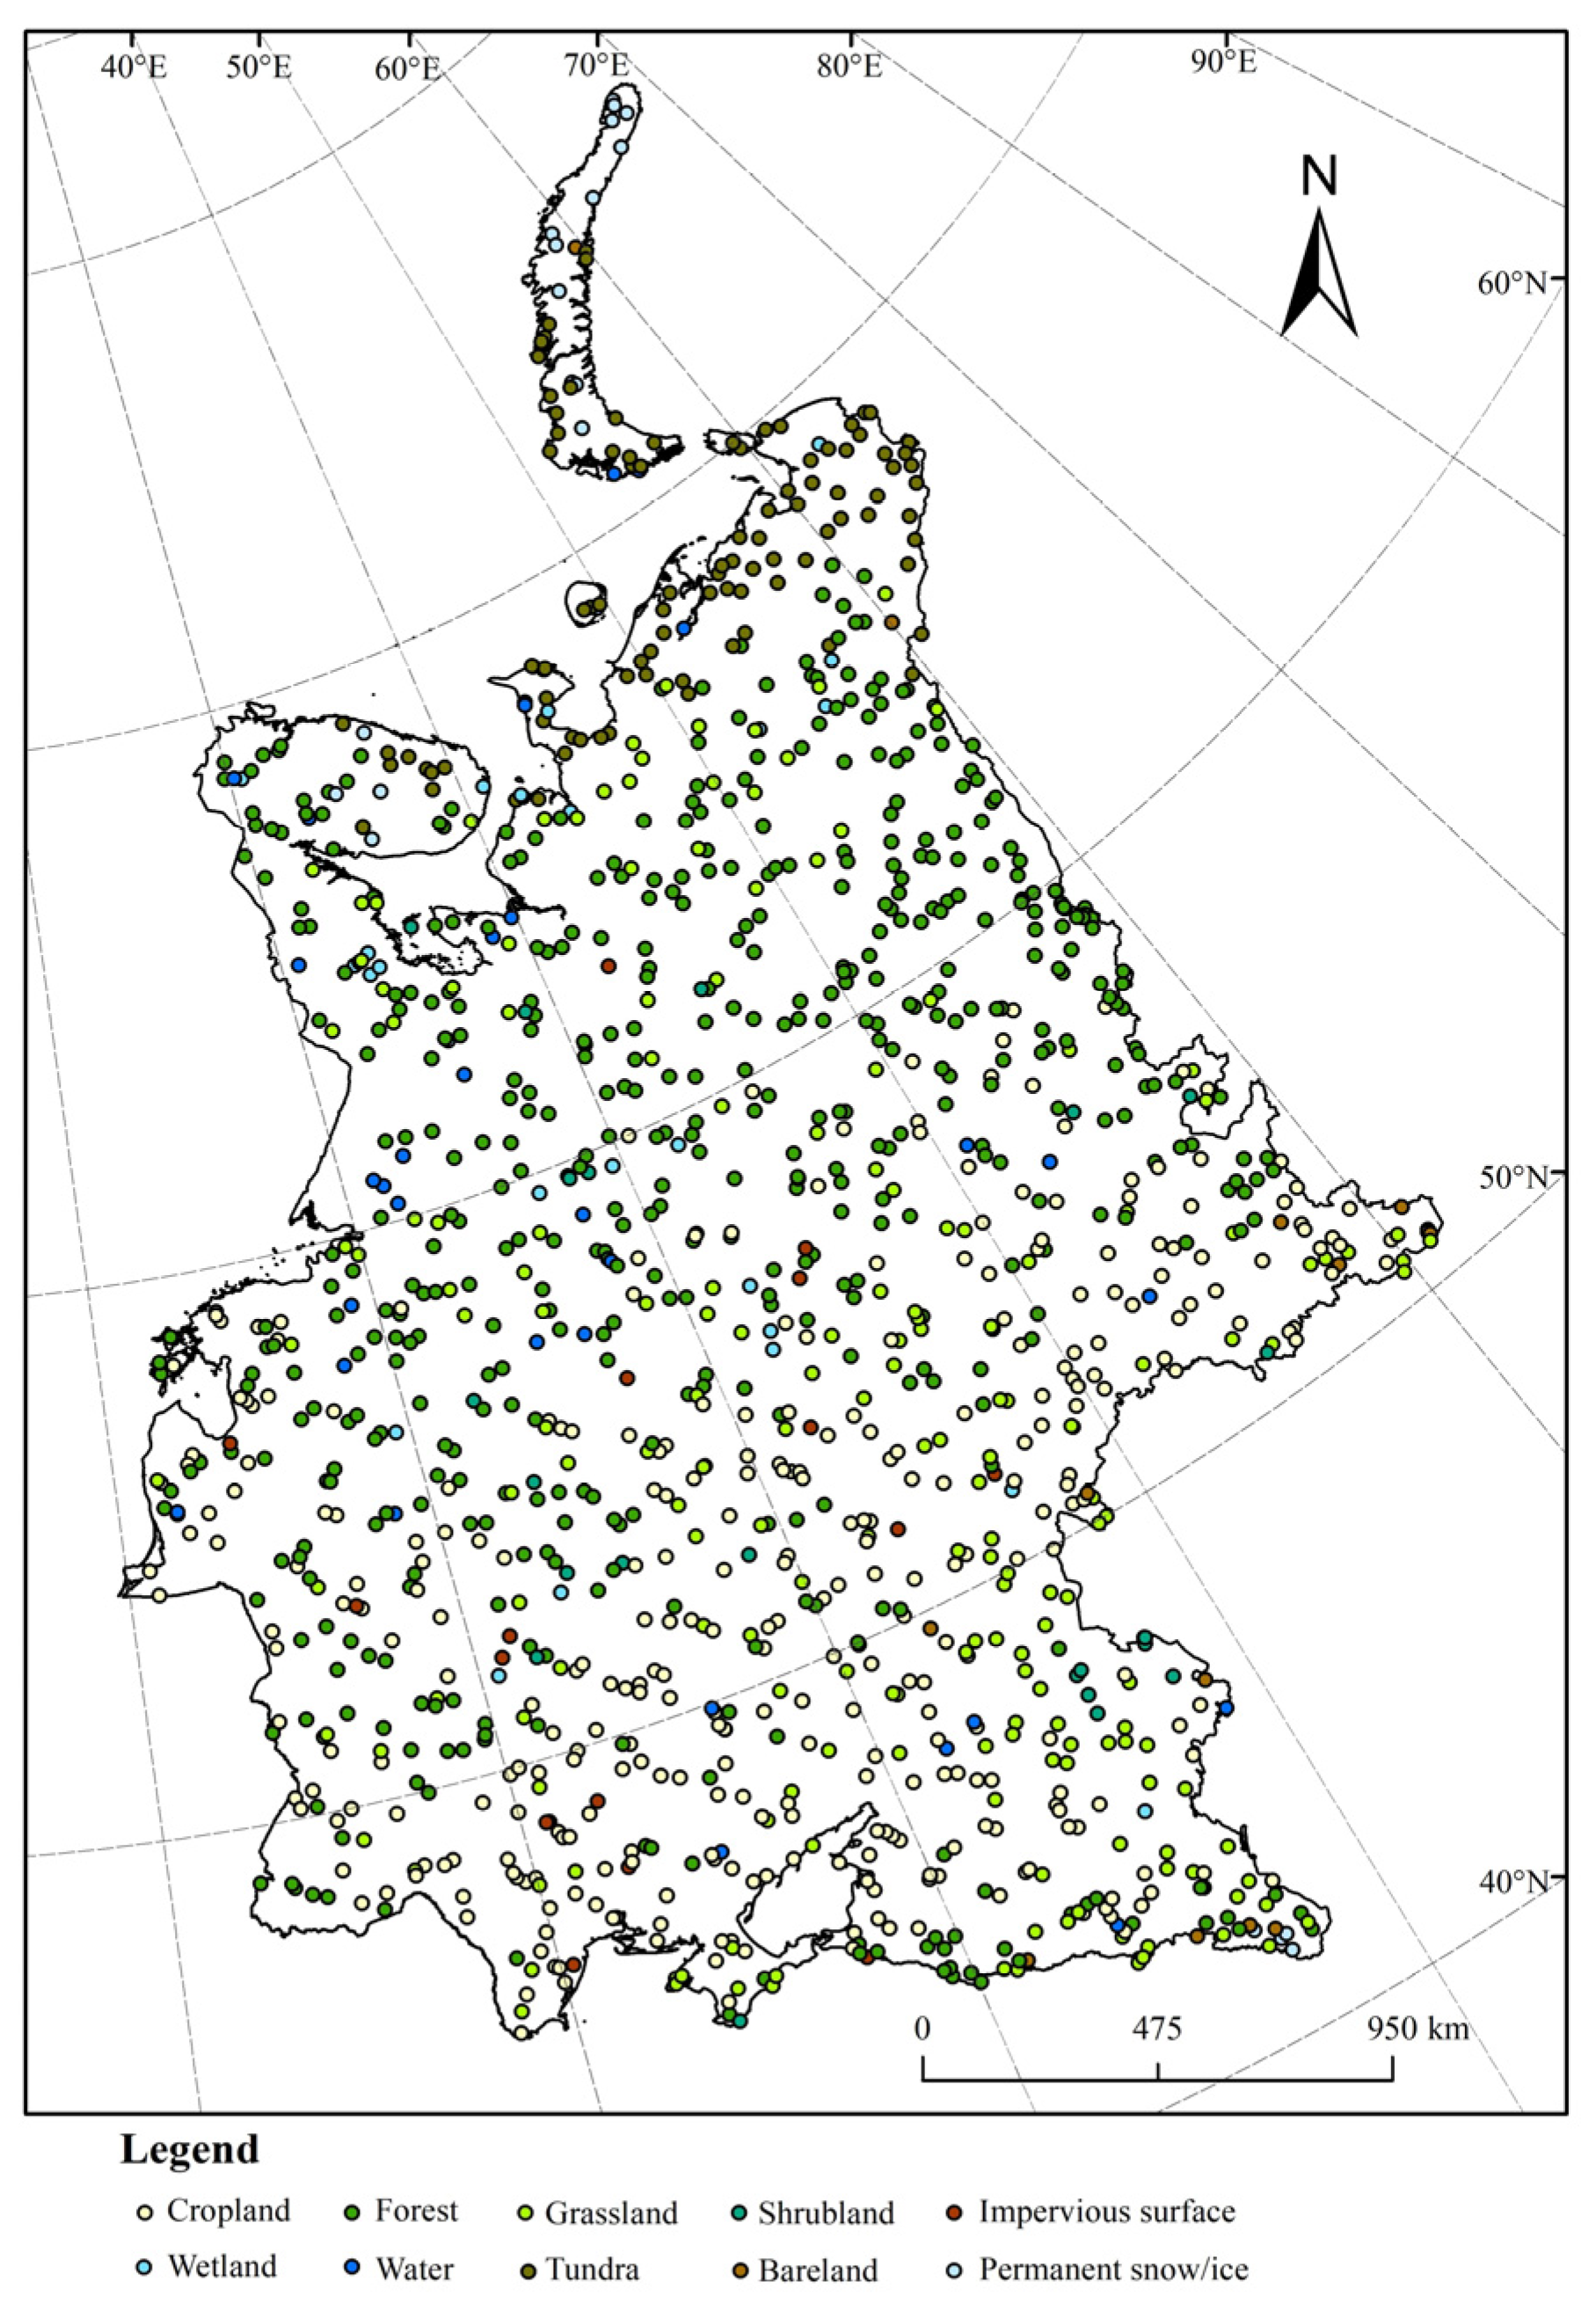
Using the GLCVSS_v1 validation dataset, the PA, UA, OA, and kappa coefficient accuracy metrics were computed for the three land cover data products, and the results are shown in
Table 4. The FROM_GLC data product exhibited the highest OA and kappa coefficients, with values of 73.96% and 0.6492, respectively. It was followed by the GlobeLand30 data product, which achieved an OA of 69.80% and a kappa coefficient of 0.5967. Conversely, the GLC_FCS30 data product demonstrated the lowest OA and kappa coefficients at 67.29% and 0.5524, respectively.
Divergence in the accuracy of the three data products was observed when assessing specific land cover types. For the forest, water, grassland, and tundra types, the FROM_GLC data product showed the best accuracy, with producer and user accuracies ranking at or near the top among the three products. For example, in the tundra type, the FROM_GLC data product achieved an accuracy exceeding 80%, whereas in the grassland type, the user accuracy of the FROM_GLC product was 40.63%, which was the lowest, compared to 42.06% and 41.16% for the GLC_FCS30 and GlobeLand30 data products, respectively; the difference was not significant. Furthermore, the FROM_GLC data product exhibited a notably higher producer accuracy of 80.12% compared to the other two products. The GlobeLand30 data product had the highest accuracy for wetland and impervious surface types. For example, producer and user accuracies of 26.92% and 20.59%, respectively, for wetlands were the highest among the three products. For croplands, the GlobeLand30 and GLC_FCS30 data products generally performed comparably in terms of producer and user accuracies, and both had significantly higher producer accuracies than the FROM_GLC product (64.01%) did. For the shrub and bare land types, the accuracy of all three data products fell below the desired level, with the GlobeLand30 and FROM_GLC products slightly outperforming each other. For permanent ice/snow, although the GLC_FCS30 product performed well in terms of user accuracy, its producer accuracy of 35% was low compared to 60% of the FROM_GLC data product.
5. Discussion
5.1. Methods for Assessing the Accuracy of Land Cover Data Products
Four methods were used to evaluate the accuracy of the land coverage data products comprehensively, each with its own advantages and disadvantages. Component similarity enables the assessment of overall category consistency among data products by comparing the area proportions of the categories; however, it cannot provide detailed information on misclassification. The confusion of types can be used to calculate the number of misclassifications or confusion rates and to assess the level of confusion among different categories in data products; however, it cannot provide detailed spatial information. Spatial consistency can be used to evaluate the consistency and continuity of data products in a spatial distribution; however, it cannot be used to directly provide indicators of classification accuracy and has a limited capacity for the quantitative evaluation of misclassifications. Accuracy evaluation can provide indicators of classification accuracy and precision, reflecting the classification status of each category in detail. However, because this method focuses only on comparing the classification results with the actual situation, it cannot evaluate the overall spatial consistency and continuity.
In the evaluation process, component similarity and type confusion degree methods can be used first to compare the consistency and confusion of overall categories, and then combined with spatial consistency methods to evaluate the spatial distribution characteristics of data products. These three methods are collectively referred to as the indirect evaluation methods. Finally, the classification accuracy and misclassification can be analyzed in detail using an accuracy evaluation method based on a confusion matrix, which is called the direct evaluation method. Therefore, comprehensive utilization of the evaluation scheme of indirect and direct evaluation methods can enable a more comprehensive and reliable evaluation of the accuracy of land cover data products.
5.2. Reasons for Differences among Data Products
The use of different development processes by various research teams can result in differences between data products. An essential aspect of these processes is the development of a land cover classification system that comprises classification types and their definitions. Among the data products used in this study, GlobeLand30 and FROM_GLC used ten classification types, whereas GLC_FCS30 used 29. Cross-validation of the three data products necessitates the unification of their classification types. The process of converting more detailed land cover types to unified classification types will result in a loss of detail when describing land cover characteristics. An instance of semantic overlap within the GLC_FCS30 data products can be observed in the sparse vegetation category, which shares similarities with both the grassland and tundra categories. This can result in errors during category merging, leading to inconsistencies in the performances of the two categories for different products. Furthermore, because the three data products were based on the characteristics of global land cover information, their analyses and applications in local areas were inevitably affected.
Classification methods and strategies are key components of the development process and affect the consistency of the three products. The GlobeLand30 data product employs a hierarchical classification approach known as “pixel–object–knowledge”, which utilizes pixel classification, object filtering, and interaction verification techniques. This methodology enables the individual classification of each land cover type followed by comprehensive analysis. However, this classification method increases the production cycles and costs. The FROM_GLC and GLC_FCS30 data products both use the random forest classification method, a stable and effective approach widely recognized for developing land cover data products [
39,
40]. However, the FROM_GLC product also uses multiple data sources, such as ground observation data, DEMs, and expert knowledge, and combines machine-learning algorithms with manual verification methods. In this study, this product was found to be more advantageous than the other two datasets. Simultaneously, the results showed that major confusion exists between similar spectral categories of shrubland, grassland, and bare land. These land types are not only difficult to distinguish for machine learning algorithms but also for human annotators who perform visual interpretation.
The spatial distribution and quality of the verified samples affect the evaluation results of the product. Reasonably selecting samples with a uniform distribution can better capture land-cover changes in the study area. Uneven sample distributions may lead to an inaccurate assessment of certain areas or specific land types, and the quality of samples directly affects the accuracy of the evaluation results. Although the land-cover verification sample dataset used in this study was individually verified and corrected using Google Earth, the discrepancy between the years of the samples and data product being validated may lead to bias in the evaluation results.
The above reasons can also lead to differences between data products in a certain type. For example, wetlands are located at the intersection of land and water, with moist soil and partially surface water, making it difficult to distinguish them from water when classifying land cover. During the development of the GlobeLand30 data product, a single-type classification strategy was adopted within each classification unit, followed by integration. In the order of classification extraction, water and wetland were ranked first and second, respectively. This classification method effectively reduces the confusion between wetland and water and improves the classification accuracy of easily confused types like wetland. The FROM_GLC data product introduces time-series data with short, repeated observation periods to increase information on water abundance periods and vegetation phenological periods, resulting in good accuracy when extracting water and forest. The GLC_FCS30 data product divides sparse vegetation types into grassland and tundra types, misclassification occurs due to semantic overlap, resulting in low accuracy for this product in the two types. Additionally, multiple factors such as training data, data preprocessing techniques, and expertise of different research teams collectively influence the differences between data products.
5.3. Application of Land Cover Data Products
The classification errors of land cover data product categories can provide a reference for users to select data for different fields of application [
41]. For example, the FROM_GLC data product exhibited the highest accuracy for forests (>85%), tundra (>80%), and water (>70%), making it suitable for studies related to forest resource assessment, hydrology, and tundra. The GlobeLand30 and GLC_FCS30 data products showed comparable accuracy for cropland types; however, the GLC_FCS30 product may be more suitable for agricultural research owing to the larger number of categories related to croplands and a more detailed classification. The GlobeLand30, GLC_FCS30, and FROM_GLC data products showed good accuracy for impervious surfaces, permanent ice/snow, and grassland types, respectively, and can be applied in fields such as construction land expansion, ice/snow change, and grass production. The accuracy of the bare land, shrubland, and wetland data in the three data products was poor (<30%), rendering them less suitable for studies focused on these specific land cover types due to their limited precision. Therefore, the FROM_GLC data product with the highest overall accuracy (73.96%) was the best choice for conducting a comprehensive analysis of the land cover in the East European Plain.
Because the accuracy of land-cover data products is influenced by spatial scales, spatial resolutions, biomes, and human settlements, suitable land-cover data products should be selected by considering specific application requirements and accuracy-influencing factors.
5.4. Suggestions for Future Development of Land Cover Data Products
An important factor affecting land-cover data products is the differentiation between different product categories and inconsistencies in classification schemes [
42]. For global land-cover data products, the type characteristics were described based on a macro-summarization of global land classes. For applications in different countries and regions, a targeted conversion of the classification system that can simultaneously produce pixels with mixed characteristics is required. The lack of an accurate threshold definition results in the misclassification of land-cover types, which introduces uncertainty into the converted products. Therefore, a detailed and complete classification system must be developed for product development and specific applications, within a unified standard framework. Moreover, when releasing land-cover data products, different institutions or teams should publish the detailed development process of the data products so that users can combine their needs for accuracy enhancement and reasonable use of the original data.
The findings of this study highlight the potential for enhancing the accuracy of land-cover products through fusion methods, and it becomes possible to capitalize on the strengths exhibited by the FROM_GLC data product in accurately classifying forest, grassland, water, and tundra types. For example, it can be combined with the GLC_FCS30 data product because the latter has good accuracy for cropland and permanent ice/snow land-cover types. For the confusing types identified during the research, the introduction of auxiliary data other than the data source can improve accuracy in the final data product. For instance, the introduction of regional vegetation phenotypes and topographic data can help reduce errors caused by shrubland, grassland, and bare-land types with similar spectral characteristics, or areas with interspersed shrubland, grassland, and forest distribution. Synthetic-aperture radar remote-sensing images can effectively reduce cloud cover effects and identify water in the understory of vegetation [
43], which can be used to collect more image information and improve wetland classification accuracy. Additionally, nightlight data (LIDAR) can be used to extract built-up land [
44]. Therefore, for future development of land-cover data products, it is important to focus on regions characterized by significant spatial heterogeneity, introduce auxiliary data, and effectively use multisource data fusion to obtain more comprehensive and reliable land-cover information.
Sample collection plays a crucial role in the development of land-cover products. Different institutions and teams have conducted several studies on this aspect and obtained high-precision sample points in their respective study areas. However, sample collection is more difficult in areas with complex topography, harsh environments, and high landscape heterogeneity, and few channels currently exist for obtaining or sharing data. Therefore, for future international cooperation, software can be developed for sample collection and a website can be established to upload and share sample data so that volunteers worldwide can crowdsource data [
45], enrich the sample database, and improve the efficiency and accuracy of global land cover research.
6. Conclusions
In this study, to assess the suitability of widely used global land-cover data products in the Eastern European Plain, provide references for selecting appropriate data products for relevant research, and provide suggestions for further improving the accuracy of data products, we conducted a consistency analysis and accuracy evaluation of three land-cover data products. This study found that the three products generally provided consistent descriptions of land-cover types in the East European Plain. A strong correlation was observed between the areas of the different product types, with a correlation coefficient exceeding 0.85. The highly consistent areas of the three products represented 54.13% of the total area of the East European Plain, and were mainly concentrated in areas such as Lake Onega, the Ural Mountains, and Severny Island. Similarly, low-consistency areas accounted for 7.69% of the total area and were mainly concentrated in areas such as Yuzhny Island, Kola Peninsula, and the Pechora River Basin. A comparison revealed that the three products exhibited high consistency in identifying forest, cropland, water, and permanent ice/snow types but lower consistency in identifying shrubs, wetlands, and bare land. The accuracy evaluation results using the GLCVSS_V1 validation dataset showed that the FROM_GLC land-cover data product (73.96%) was the most accurate, followed by GlobeLand30 (69.80%) and GLC_FCS30 (67.29%). Various products have different advantages in the study of land-cover types. The FROM_GLC dataset is suitable for studying forests, tundra, water, and the overall land cover in the region. The GLC_FCS30 dataset was found to be most suitable for agricultural research. However, all three data products showed poor accuracy for shrublands, bare lands, and wetlands, rendering them unsuitable for relevant research. The differences between products arise from the differences in classification systems, algorithms, and data correction. In the future, it will be necessary to utilize the advantages of different products for data fusion, focusing on areas with high heterogeneity and easily confused types to improve the accuracy, reliability, and practicality of land cover data products. Furthermore, the combined indirect and direct evaluation methods used in this study for land-cover data quality assessment can provide a reference for comparative assessments in other regions.
