Article

Reconstructing 42 Years (1979–2020) of Great Lakes Surface Temperature through a Deep Learning Approach

1
Department of Civil, Environmental and Geospatial Engineering, Michigan Technological University, Houghton, MI 49931, USA
2
Great Lakes Research Center, Michigan Technological University, Houghton, MI 49931, USA
3
College of Forest Resources and Environmental Science, Michigan Technological University, Houghton, MI 49931, USA
4
NOAA Great Lakes Environmental Research Laboratory, Ann Arbor, MI 48108, USA
5
Department of Computer Science, Michigan Technological University, Houghton, MI 49931, USA
6
Environmental Science Division, Argonne National Laboratory, Lemont, IL 60439, USA
*
Author to whom correspondence should be addressed.
Remote Sens. 2023, 15(17), 4253; https://doi.org/10.3390/rs15174253
Submission received: 1 June 2023 / Revised: 22 August 2023 / Accepted: 25 August 2023 / Published: 30 August 2023

Abstract

:
Accurate estimates for the lake surface temperature (LST) of the Great Lakes are critical to understanding the regional climate. Dedicated lake models of various complexity have been used to simulate LST but they suffer from noticeable biases and can be computationally expensive. Additionally, the available historical LST datasets are limited by either short temporal coverage (<30 years) or lower spatial resolution (0.25° × 0.25°). Therefore, in this study, we employed a deep learning model based on Long Short-Term Memory (LSTM) neural networks to produce a daily LST dataset for the Great Lakes that spans an unparalleled 42 years (1979–2020) at a spatial resolution of ~1 km. In our dataset, the Great Lakes are represented by ~33,000 unstructured grid points and the LSTM training incorporated the information from each grid point. The LSTM was trained with seven meteorological variables from reanalysis data as feature variables and the LST from a historical satellite-derived dataset as the target variable. The LSTM was able to capture the spatial heterogeneity of LST in the Great Lakes well and exhibited high correlation (≥0.92) and low bias (limited to ±1.5 °C) for the temporal evolution of LST during the training (1995–2020) and testing (1979–1994) periods.

1. Introduction

The Laurentian Great Lakes—Superior, Michigan, Huron, Erie, and Ontario—form the largest unfrozen surface freshwater system in the world. With a collective surface area of around 244,000 sq. km, roughly equal to that of the United Kingdom, the Great Lakes contain 84% of North America’s surface freshwater [1]. The Great Lakes are also sometimes referred to as inland seas as they exhibit many sea-like characteristics, such as distant horizons, great depths, and rolling waves.
Given their sheer size and the open water’s larger thermal inertia, lower surface friction and albedo than the surrounding watershed, the Great Lakes exert a significant influence on the regional climate [2,3,4]. Lake surface temperature (LST) in particular plays a key role in defining the regional climate through various lake–atmosphere interactions [5,6,7]. For example, during the cold season, the LST affects the magnitude of lake-effect snowfall by influencing moisture transfer from the warmer lake surface to the cooler overlying atmosphere. The spatial variability in LST, in particular, has also been shown to affect lake-effect snowfall through changes in the surface wind convergence and local vertical motions [8]. During the warm seasons, the cooler lake surface relative to the overlying air promotes atmospheric stability resulting in diminished cloud cover and increased surface downward shortwave radiation flux [4]. Great Lakes LST also plays an important role in the spatial distribution of the convective summer precipitation over the Great Lakes region [6]. The evaporation of the Great Lakes, a significant component in the Great Lakes water balance and associated water level variation, is also a function of LST [9,10]. Furthermore, in the nearshore regions of the Great Lakes, the difference in LST and land temperature creates a sharp water–land gradient in the temperature and density of near-surface air, resulting in a strong lake breeze circulation [11]. Therefore, an accurate historical record of the Great Lakes LST is crucial for understanding the Great Lakes climate and weather events.
The need for an accurate LST estimate is made even more pressing by the fact that Regional Climate Models (RCMs) encompassing the Great Lakes require accurate LST as the overlake surface boundary condition to accurately calculate the complex lake–atmosphere dynamics of the Great Lakes [6,7,12,13]. For example, Wang et al. [6] demonstrated the sensitivity of the climate to LST by showing that two different LST datasets, when used as overlake surface boundary conditions, resulted in a significantly different simulation for the summer precipitation over the Great Lakes region through differences in the moisture transport and convective environment. Hence, from a modeling standpoint, an accurate dataset for the Great Lakes LST is vital to serve as a boundary condition for climate simulations.
Globally, multiple studies have made efforts to synthesize various sources of LST to produce a comprehensive LST dataset on a global scale [14] and on sub-global scales such as for the lakes located in Europe [15], United States (US) [16], France [17], Tibetan Plateau [18,19], North Slave region [20], Alpine region [21] and sub-Alpine region [22]. The objective for creating these datasets was to offer the scientific community an alternative, extensive, and reliable LST dataset that could be used for multiple purposes such as enhancing the understanding of lake limnology and weather events, evaluating the effects of climate change, and validating models [14,16]. Some datasets were exclusively derived from satellite onboard sensors such as the Advanced Very High Resolution Radiometer (AVHRR), which was used to derive the LST for European lakes [15,21] and Tibetan Plateau lakes [18]; while other datasets used a combination of satellite and in situ measurements, such as the global LST dataset produced by Sharma et al. [14] which provides LST for 291 lakes during 1985–2009.
However, as of this writing, the historical LST of the Great Lakes has a limited observation record. A widely used historical LST dataset for the Great Lakes is the satellite-based Great Lakes Surface Environmental Analysis (GLSEA) from the National Oceanic and Atmospheric Administration (NOAA) Great Lakes Environmental Research Laboratory (GLERL) [23]. With a horizontal spatial resolution of ~1.3 km, it is considered to be one of the most accurate available gridded datasets for the Great Lakes and has been used for lake heatwave analysis [24], model validation [7,25], and overlake surface boundary conditions by several Great Lakes studies [6,8,12]. However, GLSEA only dates back to 1995 and with fewer than three decades of data available, it is not ideally long enough to aid climate simulations or LST analysis at a climatic timescale that spans at least several decades or even centuries. For example, it is not long enough to calculate the climate normal of LST. A climate normal is a baseline value used to assess climate variability and, as recommended by the World Meteorological Organization (WMO), is calculated as the 30-year average of a variable’s observation. The Optimum Interpolation Sea Surface Temperature dataset version 2.1 (OISST) [26] from NOAA is another gridded dataset that contains the LST for the Great Lakes. OISST is a global sea surface temperature (SST) dataset and compared to GLSEA, it covers a longer period: 1982 to present. OISST combines a wide range of SST measurements, including in situ SST measurements from ships and buoys from the International Comprehensive Ocean–Atmosphere Datasets Release 3.0.2 (ICOADS R3.0.2) [27] and Argo floats [28], as well as remotely sensed AVHRR observations from Pathfinder v5.0, Pathfinder v5.1, and the US Navy [29], which are later bias-corrected using ship, buoy, and Argo float observations. OISST provides daily LST of the Great Lakes, but its global scope limits its data to a much coarser horizontal spatial resolution (0.25° × 0.25°), while also suffering from noticeable LST biases across the Great Lakes [30]. The European Centre for Medium-Range Weather Forecasts atmospheric reanalysis of the global climate, version 5 (ERA5) [31] also provides a gridded estimate for the Great Lakes LST but suffers from significant cold (warm) biases during pre-2014 winter (summer) due to erroneous treatment of data [6,32]. Furthermore, the Great Lakes have a scarce deployment of buoys, with nine moored buoys from the National Buoy Data Center (NDBC) deployed within the Great Lakes. These moored buoys have intermittent observation records as far back as 1979 but, by nature, only provide LST at a few deployed locations, which is insufficient to create a spatial map of the LST. Thus, an accurate historical estimate of the Great Lakes LST that spatially covers the lakes at a high spatial resolution and has a longer temporal coverage of over 30 years is greatly needed by the Great Lakes scientific community.
Hydrodynamic and climate modeling communities have made continuous efforts to address the lack of a long-term, high-resolution Great Lakes LST dataset by generating simulated LST data. From simple extrapolation of ocean surface temperature [33] to widely used one-dimensional (1D) lake models, such as the freshwater lake model FLake [34], to more recent and more accurate three-dimensional (3D) hydrodynamic lake models [7,12,35], representations of the Great Lakes within RCMs have been constantly improving over the years. However, 1D lake models suffer from significant LST biases which have been extensively discussed in past studies [12,13]. 3D lake models, although an improvement upon the 1D models, are computationally expensive and require significant efforts to implement within the RCM framework. Therefore, an approach that can effectively and efficiently reconstruct the long-term LST at a high spatial resolution is highly desired.
In recent years, in parallel with the advancement of complex physics-based hydrodynamic modeling, deep learning, which is a specialized subset of machine learning (ML) that is based on neural networks, has become an attractive alternative to estimate the SST and LST in both marine and freshwater systems [16,36,37,38,39,40,41,42,43,44,45,46,47,48,49,50,51]. Deep learning models based on Multi-layer Perceptron Neural Network (MLPNN), Physics-Guided Recurrent Neural Networks (PGRNN), Long Short-Term Memory (LSTM), Gated Recurrent Unit (GRU), and Transformer have all been used to predict the LST in various locations around the world such as Poland [37,48], US [16,38,39,49], China [51], and Turkey [47]. For instance, by introducing a PGRNN model that incorporated physical laws into an LSTM, Jia et al. [39] focused on Lake Mendota in the US and demonstrated that training the PGRNN model with seven meteorological variables resulted in superior LST prediction performance compared to a physics-based model. On a larger scale, Willard et al. [16] produced a daily LST dataset for 185,549 lakes located within the US using deep learning. More specifically, Willard et al. [16] adapted an LSTM that was trained using static lake-specific variables (location, elevation, and surface area) and dynamic lake-specific variables (air temperature, wind speed, and radiation) to produce daily LST during 1980–2020 for lakes bigger than 40,000 m2 within the conterminous US. It should be noted that Willard et al. [16]’s dataset does not provide LST for the Great Lakes, likely due to the difficulty in capturing the spatial LST variability of such a large system. Deep learning techniques, especially the ones that consist of LSTM, which is adept at learning long-term dependencies in a time-series, have also been widely used to predict SSTs in the East China Sea [42,43], Korean Sea [46], Indian Ocean [44,45], and the tropical Pacific Ocean region [50].
While deep learning has been extensively used in various regions around the world, its implementation in the context of the Great Lakes remains relatively underdeveloped within the scientific community. One important reason for this underdevelopment is the fact that the Great Lakes exhibit sea-like characteristics and strong inter-lake and intra-lake LST variabilities. Only a small number of studies have employed deep learning or other ML techniques in the context of the Great Lakes. These studies utilized techniques such as LSTM, Extreme Gradient Boosting (XGBoost), and MLPNN to simulate streamflow [52], waves [53,54], and pollutant concentrations [55] within the Great Lakes. In regard to LST, Xue et al. [56] showed that an LSTM model, trained on just 14 sampling locations per lake, can effectively and efficiently reproduce the spatiotemporal evolution of the entire Great Lakes LST. Their LSTM model was trained using seven meteorological features from global reanalysis data and LST from GLSEA, showcasing the potential of LSTM to generate a comprehensive LST dataset specific to the Great Lakes.
Therefore, in this study, we employed a deep learning model based on the LSTM neural network to reconstruct a daily gridded LST dataset for the Great Lakes that spans from 1979 to 2020. Our new LST dataset, which is available at an open-access data repository [57], has a high spatial resolution (~1 km) and dates back 16 years prior to the oldest GLSEA record. It, therefore, supplements the current datasets and gives the Great Lakes scientific community a unique and viable alternate source of LST for overlake surface boundary condition in RCMs, lake model validations, and a long-term spatiotemporal LST analysis.
The remainder of this paper is organized as follows: Section 2 gives an overview of the study area, the Great Lakes, and elaborates on the methodology used to predict the LST using the LSTM model as well as the development, training, and validation of the LSTM model. Section 3 presents the comparison between the LSTM-predicted LST and the LST from currently available datasets. Section 4 delves into a comprehensive discussion that highlights the significance of the present study, explores uncertainties associated with LST datasets, and discusses potential areas for future improvements. Finally, Section 5 provides a summary and concluding remarks.

2. Materials and Methods

2.1. Study Area

Spanning approximately 16° of longitude and 7.5° of latitude, the Great Lakes lie along the eastern US–Canada border and consist of five interconnected lakes. Each of the lakes is characterized by distinct geomorphological features (Figure 1) and thermal structures [7,58]. The northernmost lake is Lake Superior; it is also the largest lake by volume, surface area, and average depth among the five Great Lakes. At an elevation of 183 m, Lake Superior contains 12,232 km3 of water, which is greater than the combined volume of the remaining four lakes. Lake Superior has an average depth of 149 m and a maximum depth of 406 m. The water from Lake Superior is drained through the St. Mary’s River into Lake Huron, which is the third-largest lake by volume. Lake Huron is hydraulically connected to Lake Michigan, the second-largest lake by volume, by the Straits of Mackinac. This connection results in the two lakes maintaining a shared water level. The water from Lake Huron ends up in Lake Erie, which is the southernmost and the shallowest lake with an average depth of a mere 19 m. As such, Lake Erie is the smallest lake by volume, containing just 483 km3 of water. Lake Erie’s water exits via the Niagara River, dropping about 50 m as it cascades over Niagara Falls and enters the last lake, Lake Ontario. Although it is the smallest lake by surface area, Lake Ontario is the second-deepest lake by average depth and is the fourth largest by volume. Lake Ontario is drained by the St. Lawrence River, which flows into the Atlantic Ocean. The physical features of the Great Lakes are summarized in Table 1.

2.2. Methodology

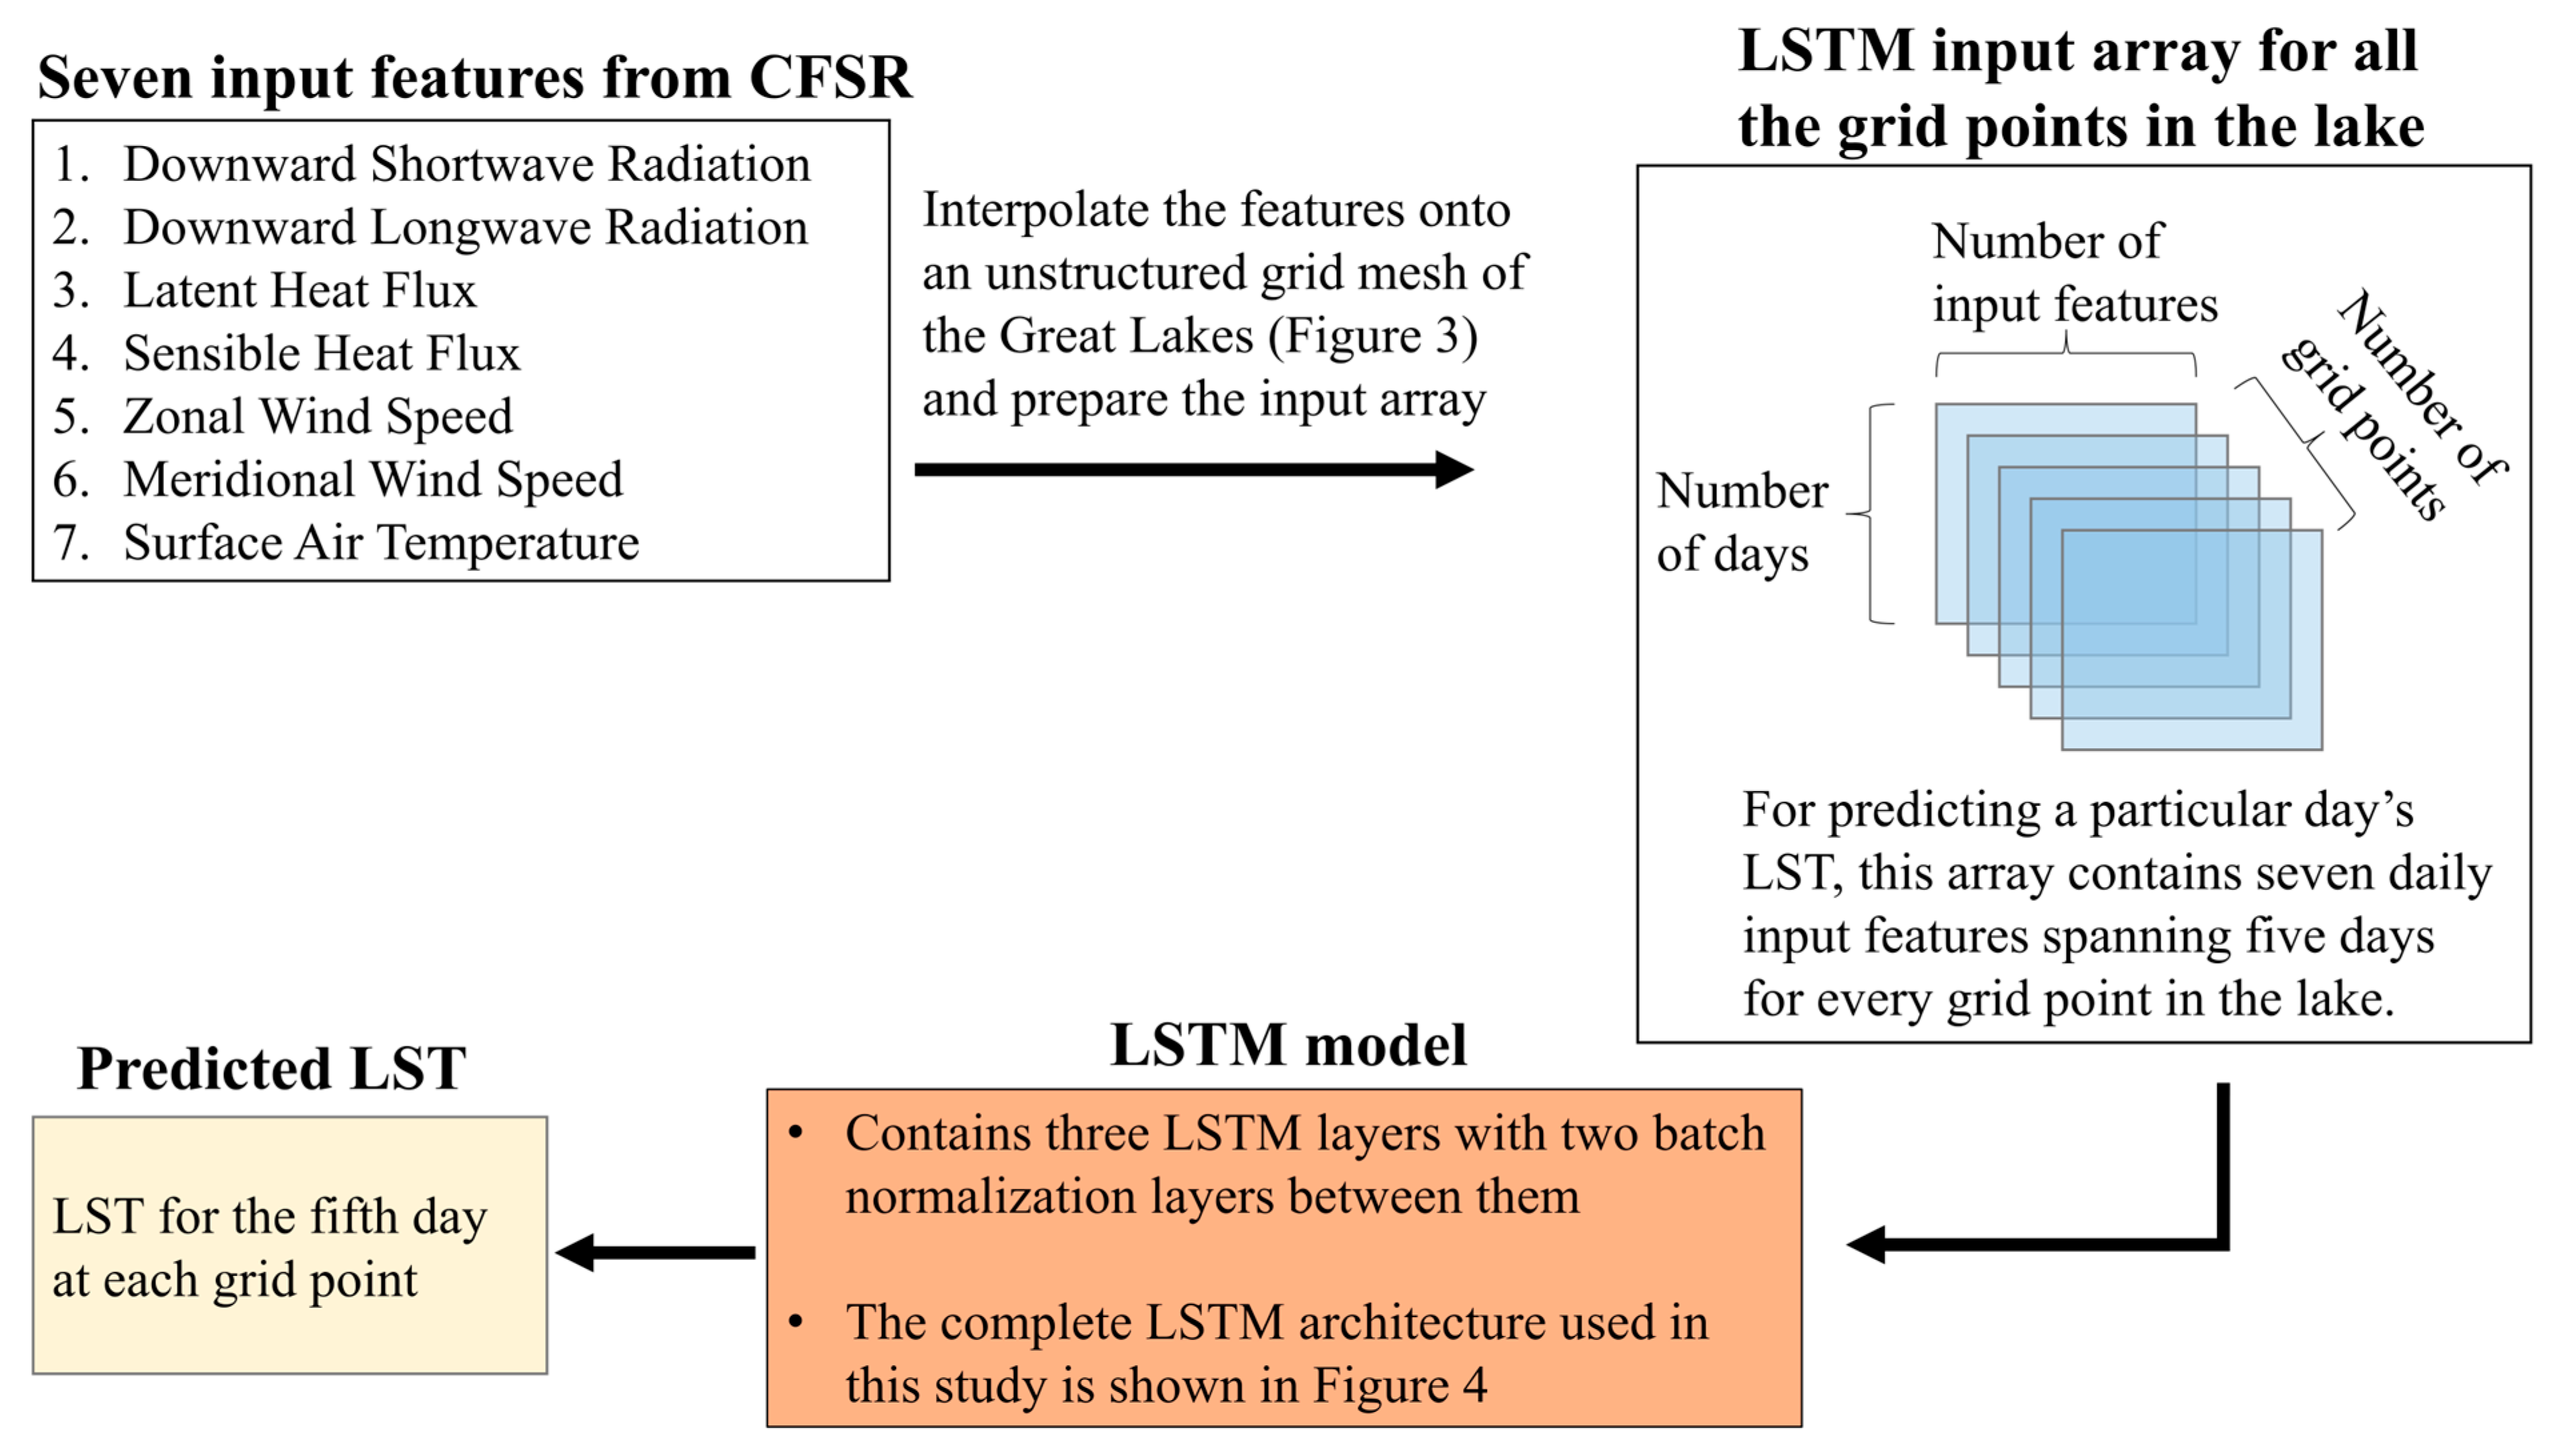
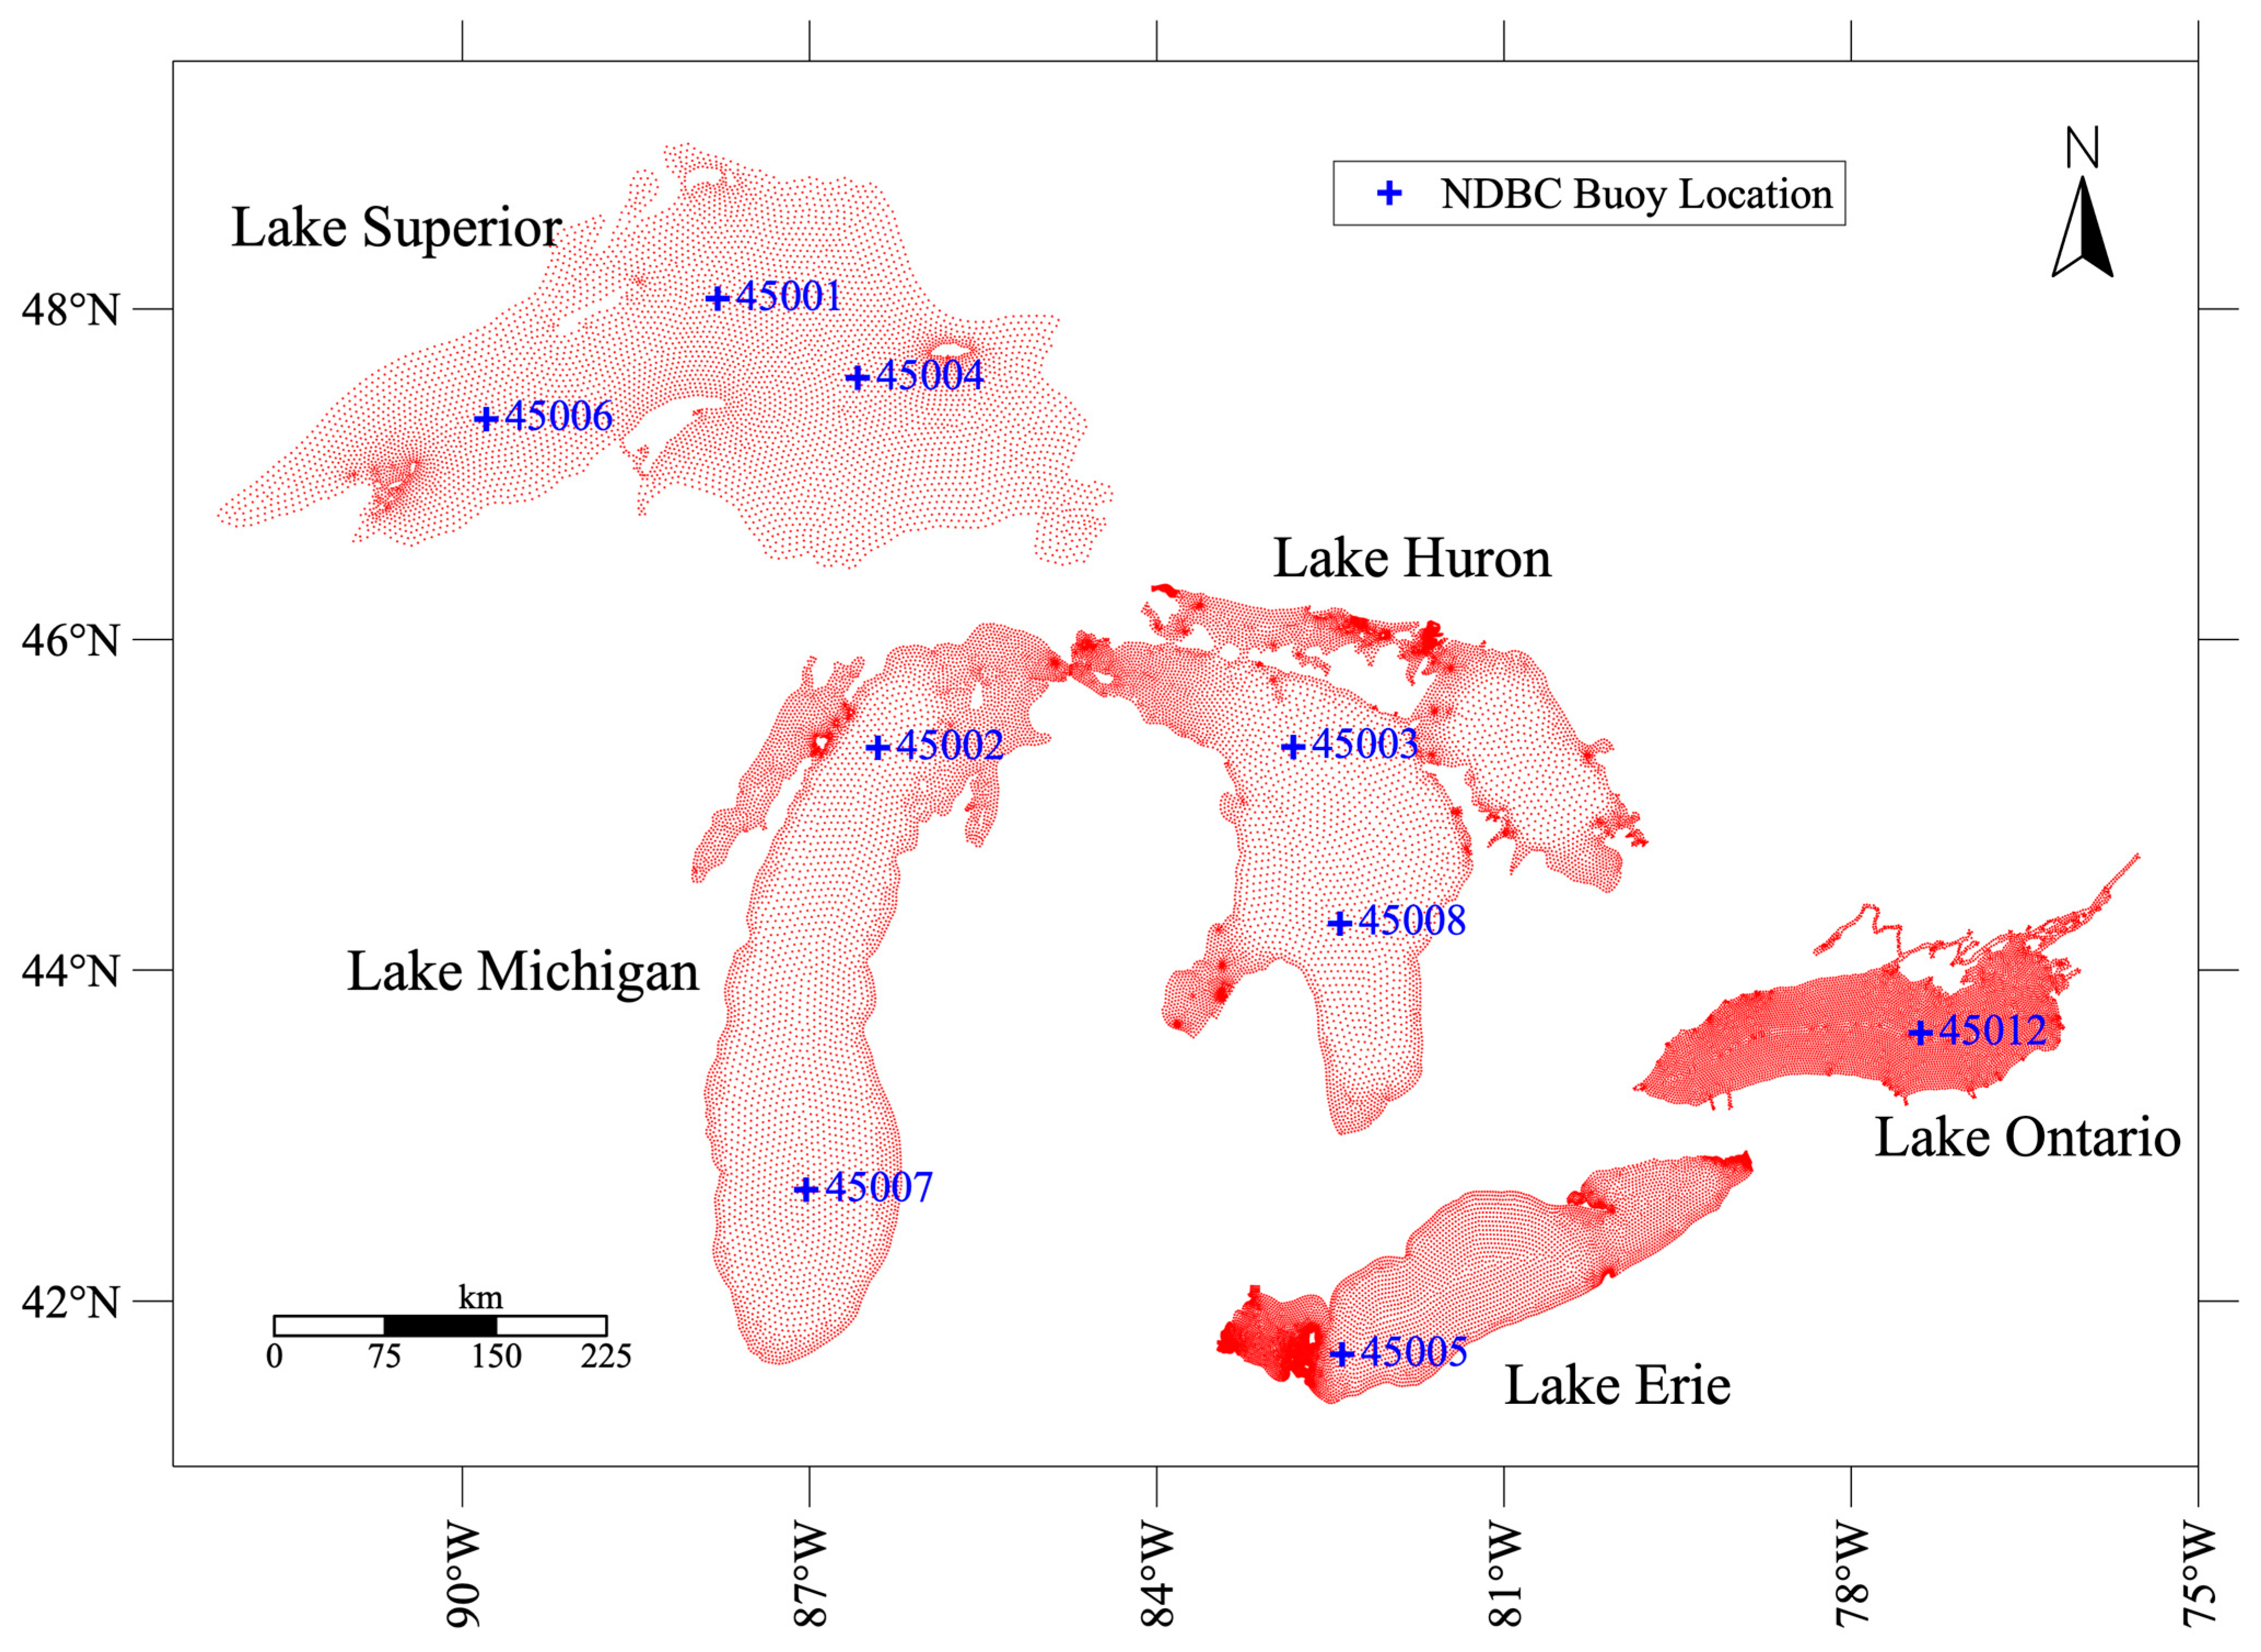
The schematic in Figure 2 presents an overview of the methodology used in this study to reconstruct the LST of the Great Lakes. Seven meteorological variables from the Climate Forecast System Reanalysis (CFSR) [59] are used as input features to predict the LST of the Great Lakes. The input features include downward shortwave radiation, downward longwave radiation, latent heat flux, sensible heat flux, surface air temperature, zonal wind speed, and meridional wind speed. These features are interpolated onto an unstructured grid mesh (~33,000 grid points) that spatially cover the Great Lakes accurately by closely following the coastline at ~1 km resolution (Figure 3). Once interpolated, the input features at every grid point for five historical days are fed into an LSTM for training and predicting the LST for the 5th day at every grid point. In other words, to predict the LST on the 5th day, the seven input features on the 1st, 2nd, 3rd, 4th, and 5th days are used as inputs. For this study, we trained and validated five separate LSTM models, one for each Great Lake. Each LSTM model is trained using all the grid points of that particular lake and contains three LSTM layers with 32, 16, and 8 neurons in each layer.
The LSTM models are trained and validated for the 1995–2020 time period since this is the period for which we have the CFSR meteorological variables as input features and the GLSEA LST as the target variable. After training and validation, the LSTM models are used to reconstruct the LST for 1995–2020 and, more importantly, for 1979–1994 since this is the period for which we only have the CFSR meteorological variables and lack any high-resolution gridded LST dataset for the Great Lakes. As such, by predicting the 1979–1994 LST, we produce an alternative high-resolution Great Lakes LST dataset that spans an unprecedented duration of 1979–2020.
The architecture of the LSTM model used in this study is described in detail in Section 2.2.1, followed by a description of the data preprocessing in Section 2.2.2, which also details the datasets used for obtaining the input features and the target variable for training and validation. Section 2.2.3 provides the performance of the LSTM models of each lake during training and validation through loss curves and various performance metrics.

2.2.1. LSTM Architecture

LSTM neural networks are a type of Recurrent Neural Network (RNN) that can learn both long-term and short-term dependencies in time series data [60]. Individual LSTM cells use a gated architecture to control the flow of information and memory through the LSTM network. A single LSTM cell consists of three fully connected blocks. In the first block, called the forget gate, the input feature and the previous short-term memory are used to erase a fraction of the previous long-term memory. In the next block, called the input gate, a potential long-term memory is calculated, and a fraction of it is added to the remaining long-term memory from the forget gate to obtain the new long-term memory. In the final block, called the output gate, a potential short-term memory is calculated from the new long-term state, and a fraction of it is passed on to the next LSTM cell as the new short-term memory.
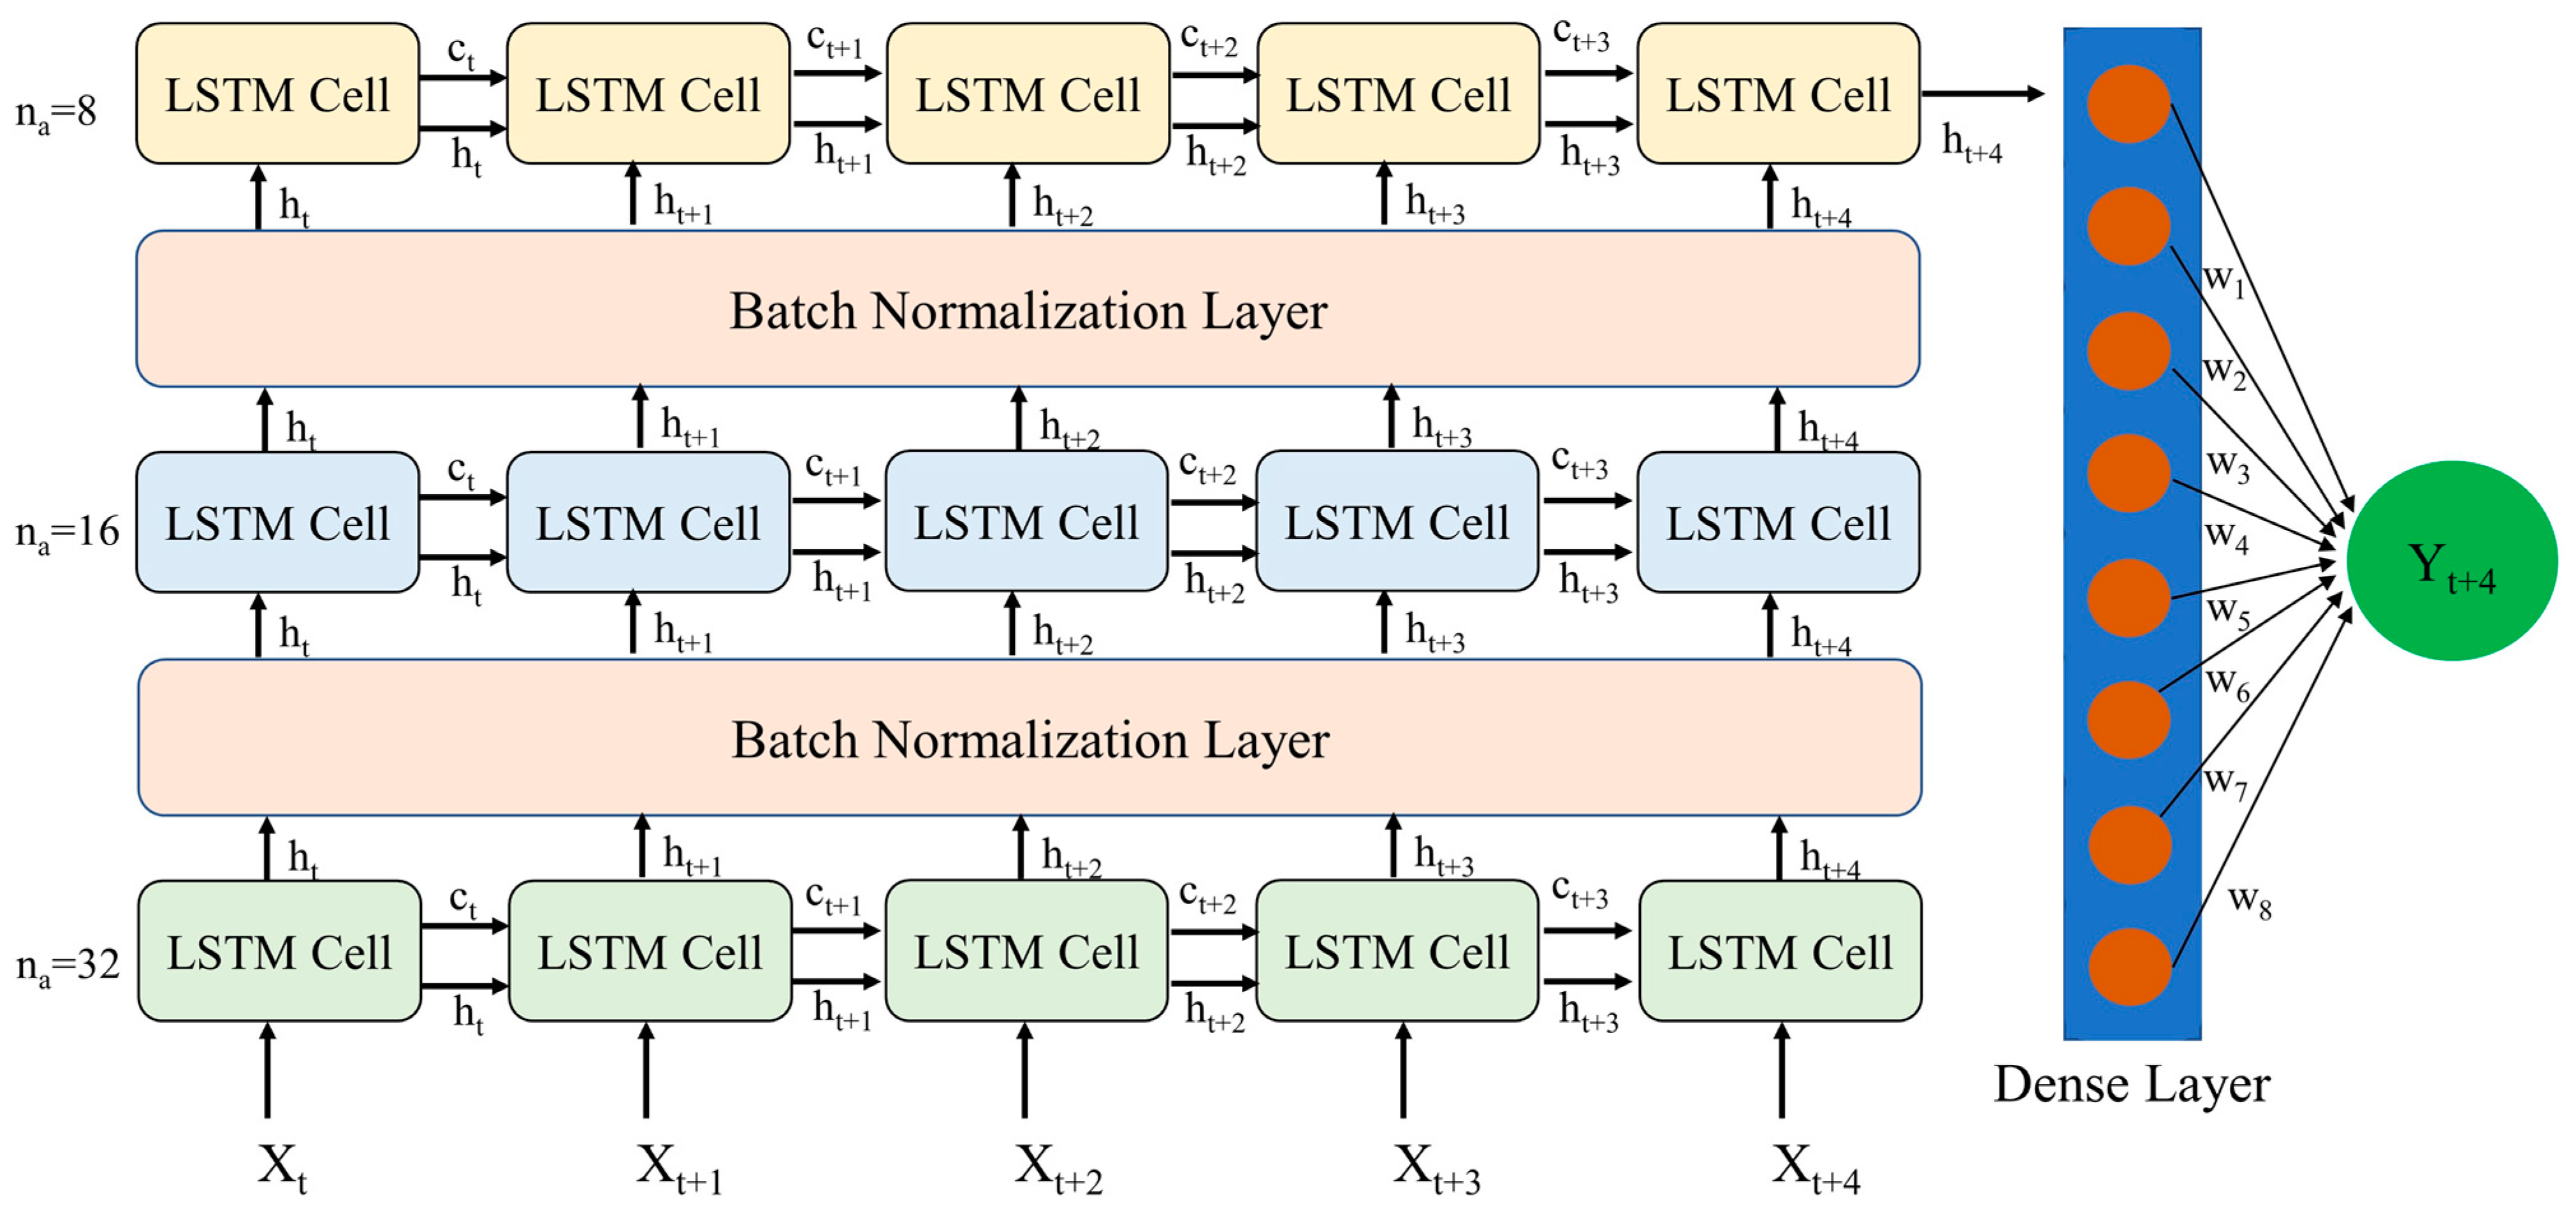
The LSTM model used for this study (Figure 4) consists of three LSTM layers with two batch normalization layers between them and one dense layer at the end to produce the output in the desired shape. Our LSTM model takes five days of historical feature data and outputs the target variable for the fifth day. The input feature data are fed into the first LSTM layer, which has 32 neurons. The output from this LSTM layer is fed into the first batch normalization layer to produce the normalized input for the second LSTM layer, which has 16 neurons. The output from the second LSTM layer is then fed into the second batch normalization layer. The third LSTM layer has eight neurons and takes the input from the second batch normalization layer. The output from the third LSTM layer is finally fed into a dense layer to produce the estimated target variable.
The hyperparameters for the LSTM model (Table 2), such as the number of LSTM layers and number of activation units, are the same as those used in Xue et al. [56]. These optimal values of hyperparameters were chosen by Xue et al. [56] through trial and error with cross-validation using 17 years (1995–2011) of data from 14 monitoring locations within each Great Lake. In addition to the three LSTM layers, two dropout layers, with a dropout rate of 0.2, are added after the first and second LSTM layers to avoid model overfitting. The Adam optimizer and the mean-square-error (MSE) loss function are used to train the LSTM models.

2.2.2. Data Preprocessing

The LSTM model was trained and validated for the time period of 1995–2020, and the seven gridded daily meteorological variables from CFSR (Figure 2) were used as the input features. Additionally, as mentioned before, the main objective of this paper is to produce a high-resolution gridded LST dataset that covers a time period preceding 1995 as this is the period for which there is an absence of high-resolution gridded LST data for the Great Lakes. So, we utilized the seven gridded daily meteorological variables from CFSR for 1979 to 1994 as input features to predict the LST preceding 1995. CFSR dates back to 1979, but more specifically, the data from 1979 to 2010 were obtained from CFSR, while the data from 2011 to 2020 were obtained from CFSR’s upgraded extension named the Climate Forecast System version 2 (CFSv2) [61]. However, for simplicity, both datasets are hereafter referred to as CFSR. CFSR is a global reanalysis data and uses a coupled atmosphere-land-ocean-sea ice model along with the assimilation of satellite radiance to produce gridded atmospheric states [59]. CFSR utilizes various models including the National Centers for Environmental Prediction (NCEP) Global Forecast System (GFS) and the Geophysical Fluid Dynamics Laboratory (GFDL) Modular Ocean Model along with the Global Data Assimilation System (GDAS), Global Land Data Assimilation System (GLDAS), and Global Ocean Data Assimilation System (GODAS) for data assimilation. CFSR assimilates radiance from a multitude of sources such as the Television and Infrared Observation Satellite (TIROS) Operational Vertical Sounder (TOVS) onboard nine polar-orbiting NOAA satellites. CFSR archives its meteorological variables in GRIB format, which stands for “General Regularly distributed Information in Binary form”. GRIB is a WMO standard format for archiving meteorological gridded data. CFSR has been successfully used to drive hydrodynamic models [62], numerical wave models [63], as well as train deep learning models [56] for the Great Lakes.
The target variable for our LSTM is LST. The gridded daily LST from the GLSEA dataset for 1995 to 2020 was used for the LSTM model training and validation. As previously stated, GLSEA is developed by NOAA GLERL and is considered to be one of most accurate, high-resolution gridded LST datasets for the Great Lakes with a horizontal spatial resolution of 1.3 km; however, it only dates back to 1995. GLSEA is based on satellite imageries from the NOAA AVHRR aboard NOAA’s polar orbiting satellites and the Visible Infrared Imaging Radiometer Suites onboard the Suomi National Polar-Orbiting Partnership spacecraft (VIIRS S-NPP) and the NOAA-20 satellite (VIIRS NOAA-20). GLSEA updates the LST data daily with information from cloud-free portions of the previous days’ satellite imagery using a 20-day window (±10 days) and in the absence of any satellite imagery, a smoothing algorithm is applied to generate a continuous evolution of the LST [23]. GLSEA archives its LST data in NetCDF (Network Common Data Form) format which, like GRIB, is a widely used format for efficiently storing multidimensional scientific variables.
As CFSR and GLSEA have different horizontal spatial resolutions, prior to training the LSTM model, the two datasets were interpolated onto unstructured grids that spatially cover the Great Lakes more accurately (Figure 3). With a total of ~33,000 grid points, the horizontal spatial resolution varies from 1–2 km near the coast to 2–4 km offshore. The unstructured nature of the grids provides an accurate geographic fitting of the coastline of the Great Lakes, and the higher nearshore resolution allows the LSTM model to capture the significant LST gradients that occur near the shoreline due to shallower depths.
It should be noted that prior to model training, the training data were also standardized to have zero mean and unit variance. Such standardization is crucial for deep learning models, as this ensures all the input features and the target variable are on the same scale. Additionally, the mean and variance of the training data were used to standardize the validation dataset (discussed in Section 2.2.3) as well as the 1979–1994 testing dataset (discussed in Section 3.2).

2.2.3. LSTM Training and Validation

The LSTM was developed using the Keras Application Programming Interface (API) within the TensorFlow open source platform [64] while the data analysis and plots presented in this paper were produced using MATLAB. Five separate LSTM models were trained and validated, one for each Great Lake. LST from GLSEA and the meteorological variables from CFSR for the 1995–2020 period were split into training and validation datasets using an 80:20 ratio. Table 3 shows the number of training and validation samples used for each lake.
During validation, the trained model is fed input features from the validation dataset, which is a dataset that the model has not been trained on. Then, the performance of the LSTM on the training and validation datasets is compared against each other to ensure the model does not suffer from overfitting or underfitting. A model is considered to suffer from overfitting when it has good performance on the training dataset, but poor performance or generalization on the validation dataset. On the other hand, a model is considered to suffer from underfitting when it has poor performance on both the training and validation datasets. A well-trained model must perform well on both the training and validation datasets.
Figure 5 shows the performance of the LSTM, quantified by the MSE loss function, on the training and validation datasets against epoch for each lake. An epoch is the number of times the learning algorithm works through the entire training dataset; ideally, the loss function should decrease with increasing epochs because the model is optimizing with increased training. This decrease in loss function is clearly seen in Figure 5 for each lake. For both the training and validation datasets, the loss function decreases sharply in the initial epochs, and then the model reaches an optimized state (when the epoch is ~100). More importantly, the loss curves for both datasets follow each other closely, indicating that the model does not suffer from overfitting or underfitting.
In addition to the loss curve in Figure 5, Table 4 presents a more detailed accuracy assessment of the LSTM’s performance during validation. The absolute error has a mean of less than or close to 1 °C for all the lakes. Also, the median of absolute error is slightly smaller than the mean, implying that most errors are less than the mean. The LSTM model does not suffer from extremely large errors, as it also has a low mean of squared error (≤2 °C2) for each lake, with a maximum value of 2.07 °C2 in Lake Ontario. Finally, the R2 score for the model is greater than 0.95, indicating that the LSTM is capable of explaining the variance in the LST extremely well.

3. Results

3.1. LSTM Prediction for 1995–2020 (Training Period)

Once the validation was performed, the LSTM models with the optimized hyperparameters were used to reconstruct the LSTs in the five Great Lakes for the period of 1979–2020. For the training period (1995–2020), LST predictions from LSTM are evaluated against the GLSEA dataset by focusing on two important LST characteristics of the Great Lakes: temporal evolution of the lake-wide average LST and seasonal spatial pattern of LST. Figure 6 presents the daily climatology of the lake-wide average LST for 1995–2020 from LSTM and GLSEA for each lake. LSTM captures the evolution of daily climatology extremely well, with high daily correlation (>0.99), low annual mean bias (from −0.25 °C to +0.03 °C), and low root-mean-square-error (RMSE) (from 0.24 °C to 0.62 °C). The LST peaks during summer were captured very well by LSTM, albeit with a persistent small cold bias across all lakes, particularly in Lake Superior and Lake Huron. Along with the daily climatology, LSTM also accurately captures the range in interannual variability of daily lake-wide average LST, as indicated by the enveloping lines in Figure 6.
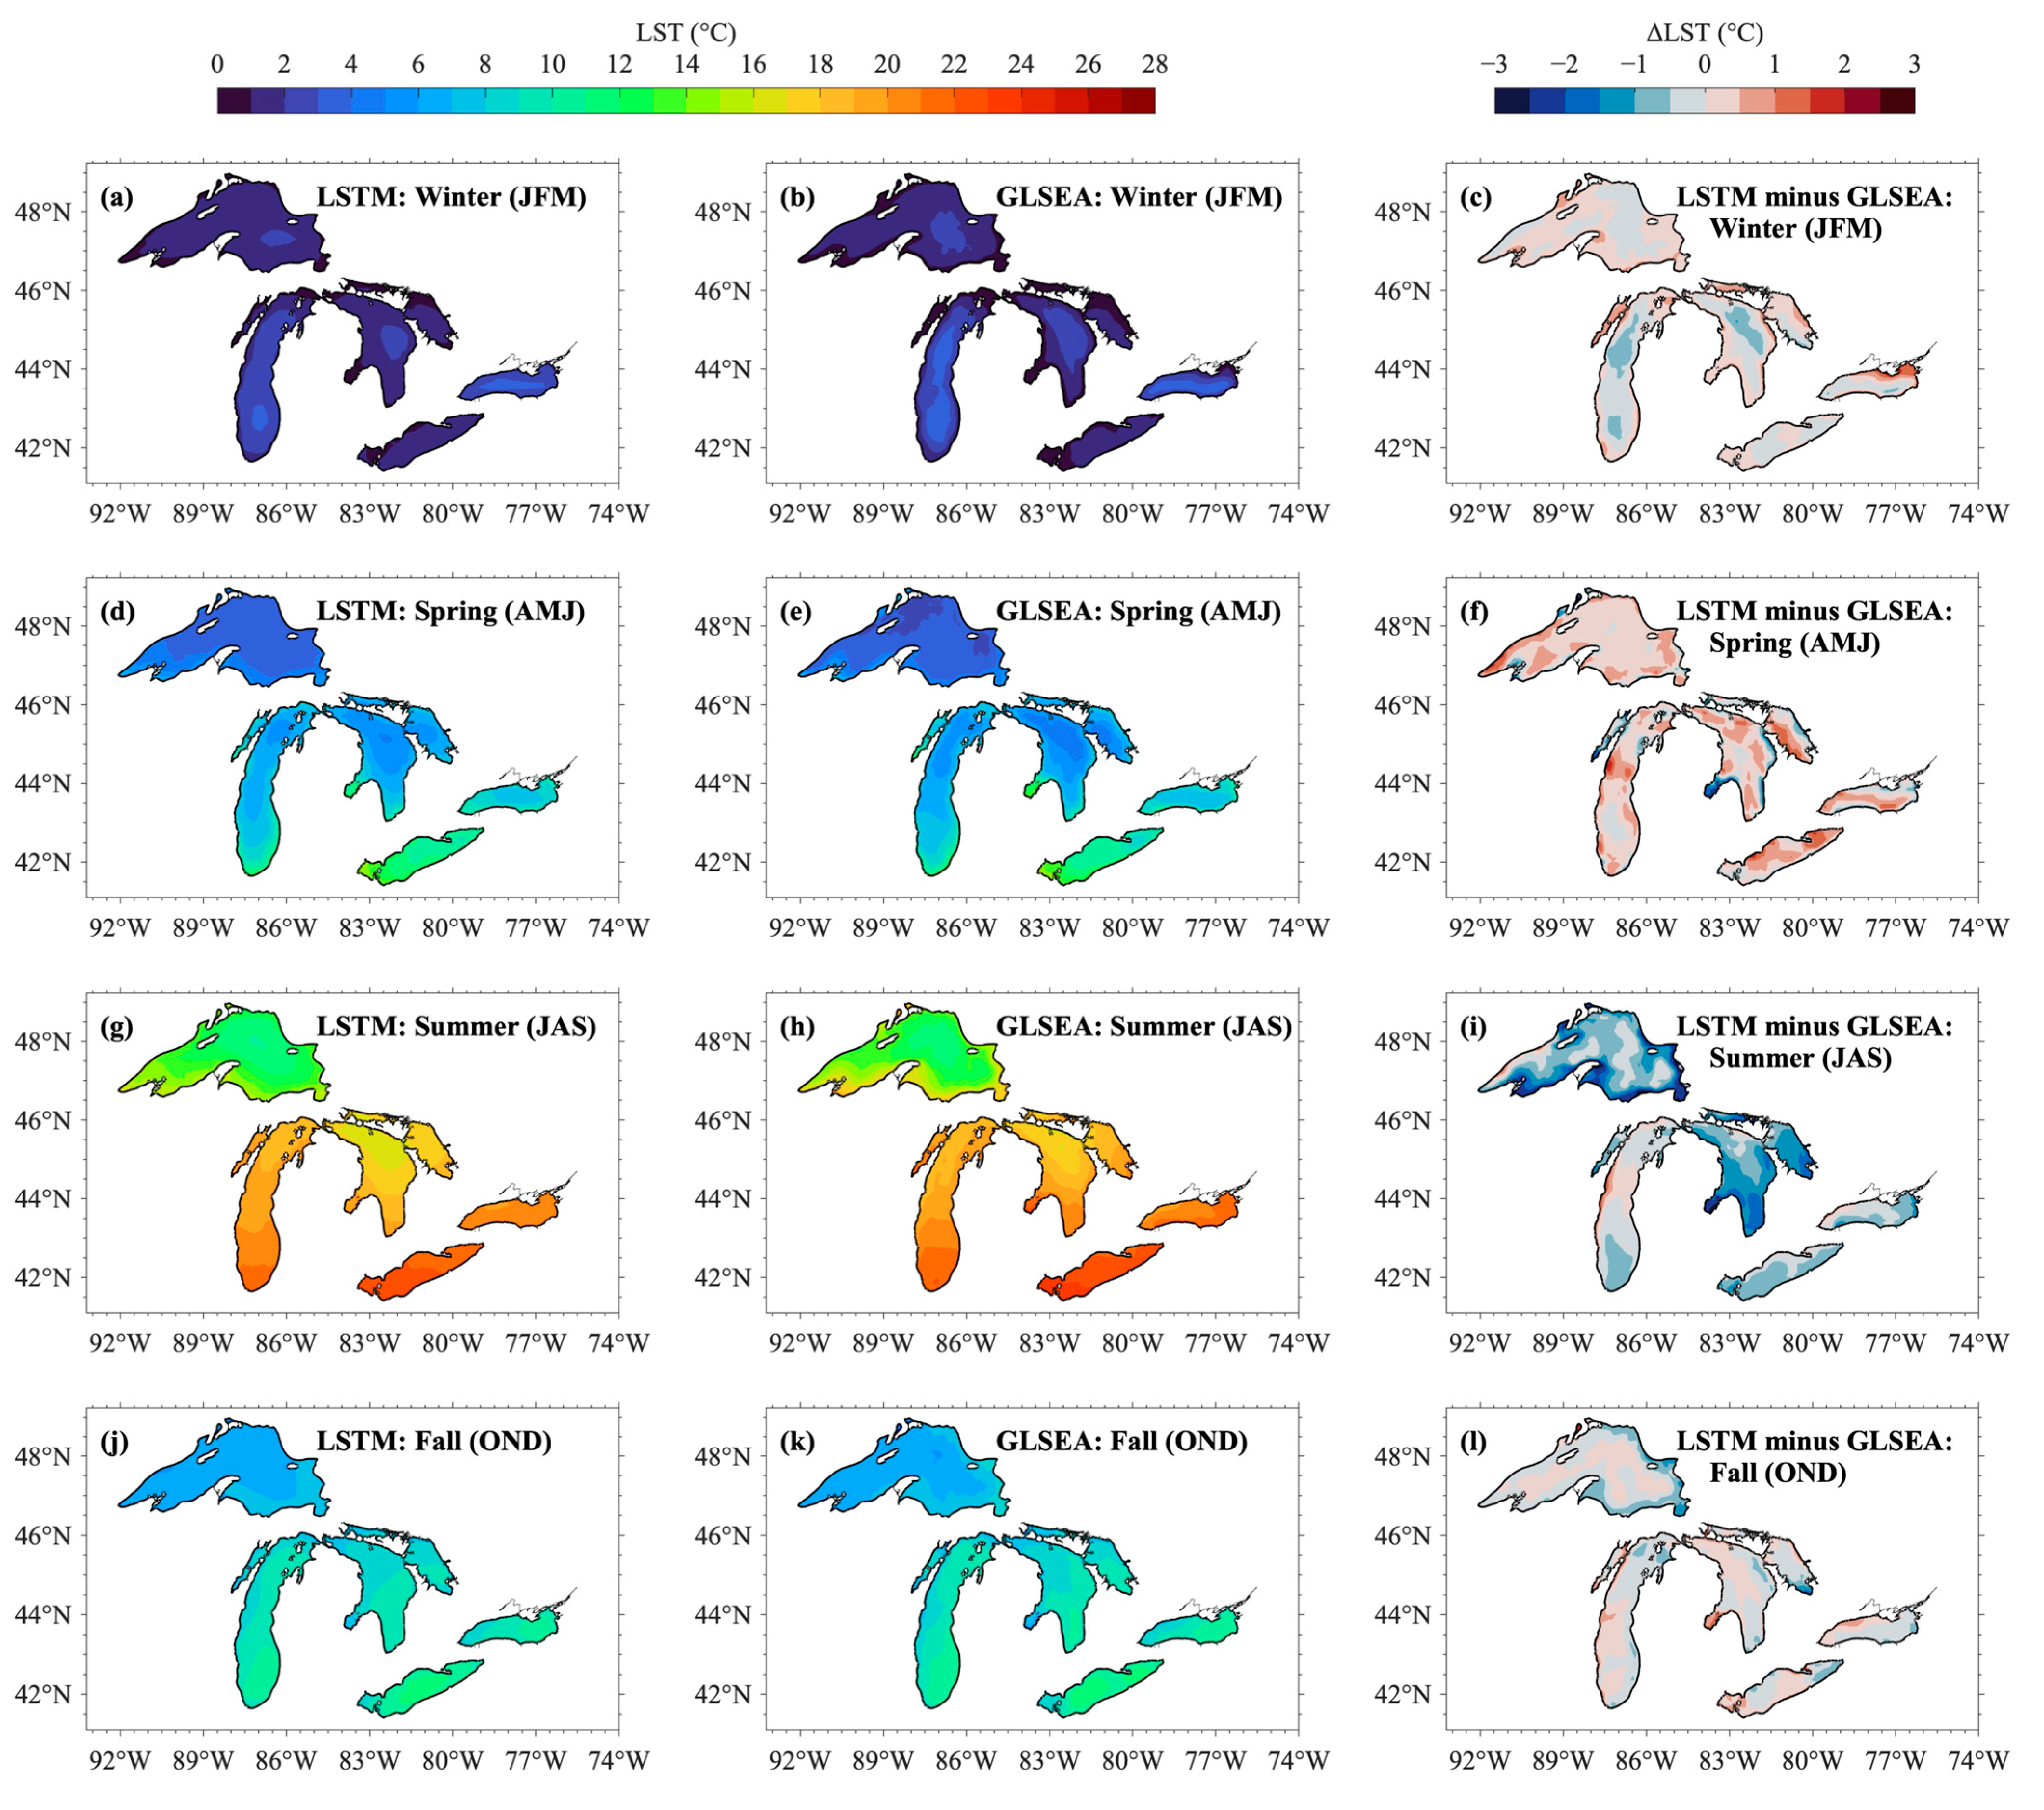
Figure 7 compares the spatial seasonal climatology of LST averaged for 1995–2020. As the Great Lakes span approximately 7.5° of latitude, they exhibit a distinct meridional LST gradient. Particularly during the summer, the northernmost lake, Lake Superior, maintains the coolest temperature, while the southernmost and shallowest lake, Lake Erie, maintains the warmest temperature. LSTM is able to capture this inter-lake LST variability and is in close agreement with GLSEA. The spatial heterogeneity of LST within each lake is also well captured by LSTM. For example, the warmer central basin of Lake Superior during winter and the meridional gradient in Lake Michigan and Huron are well reproduced by LSTM. Similarly, the colder nearshore regions during the winter are captured by LSTM in each lake. The LST biases are mostly limited to only ±2 °C with the exception of the summer biases in Lake Superior, where there is a distinct nearshore cold bias of ~2–3 °C. Similar to Figure 6, Figure 7 also provides evidence for the cold bias that occurs across all lakes during the summer.
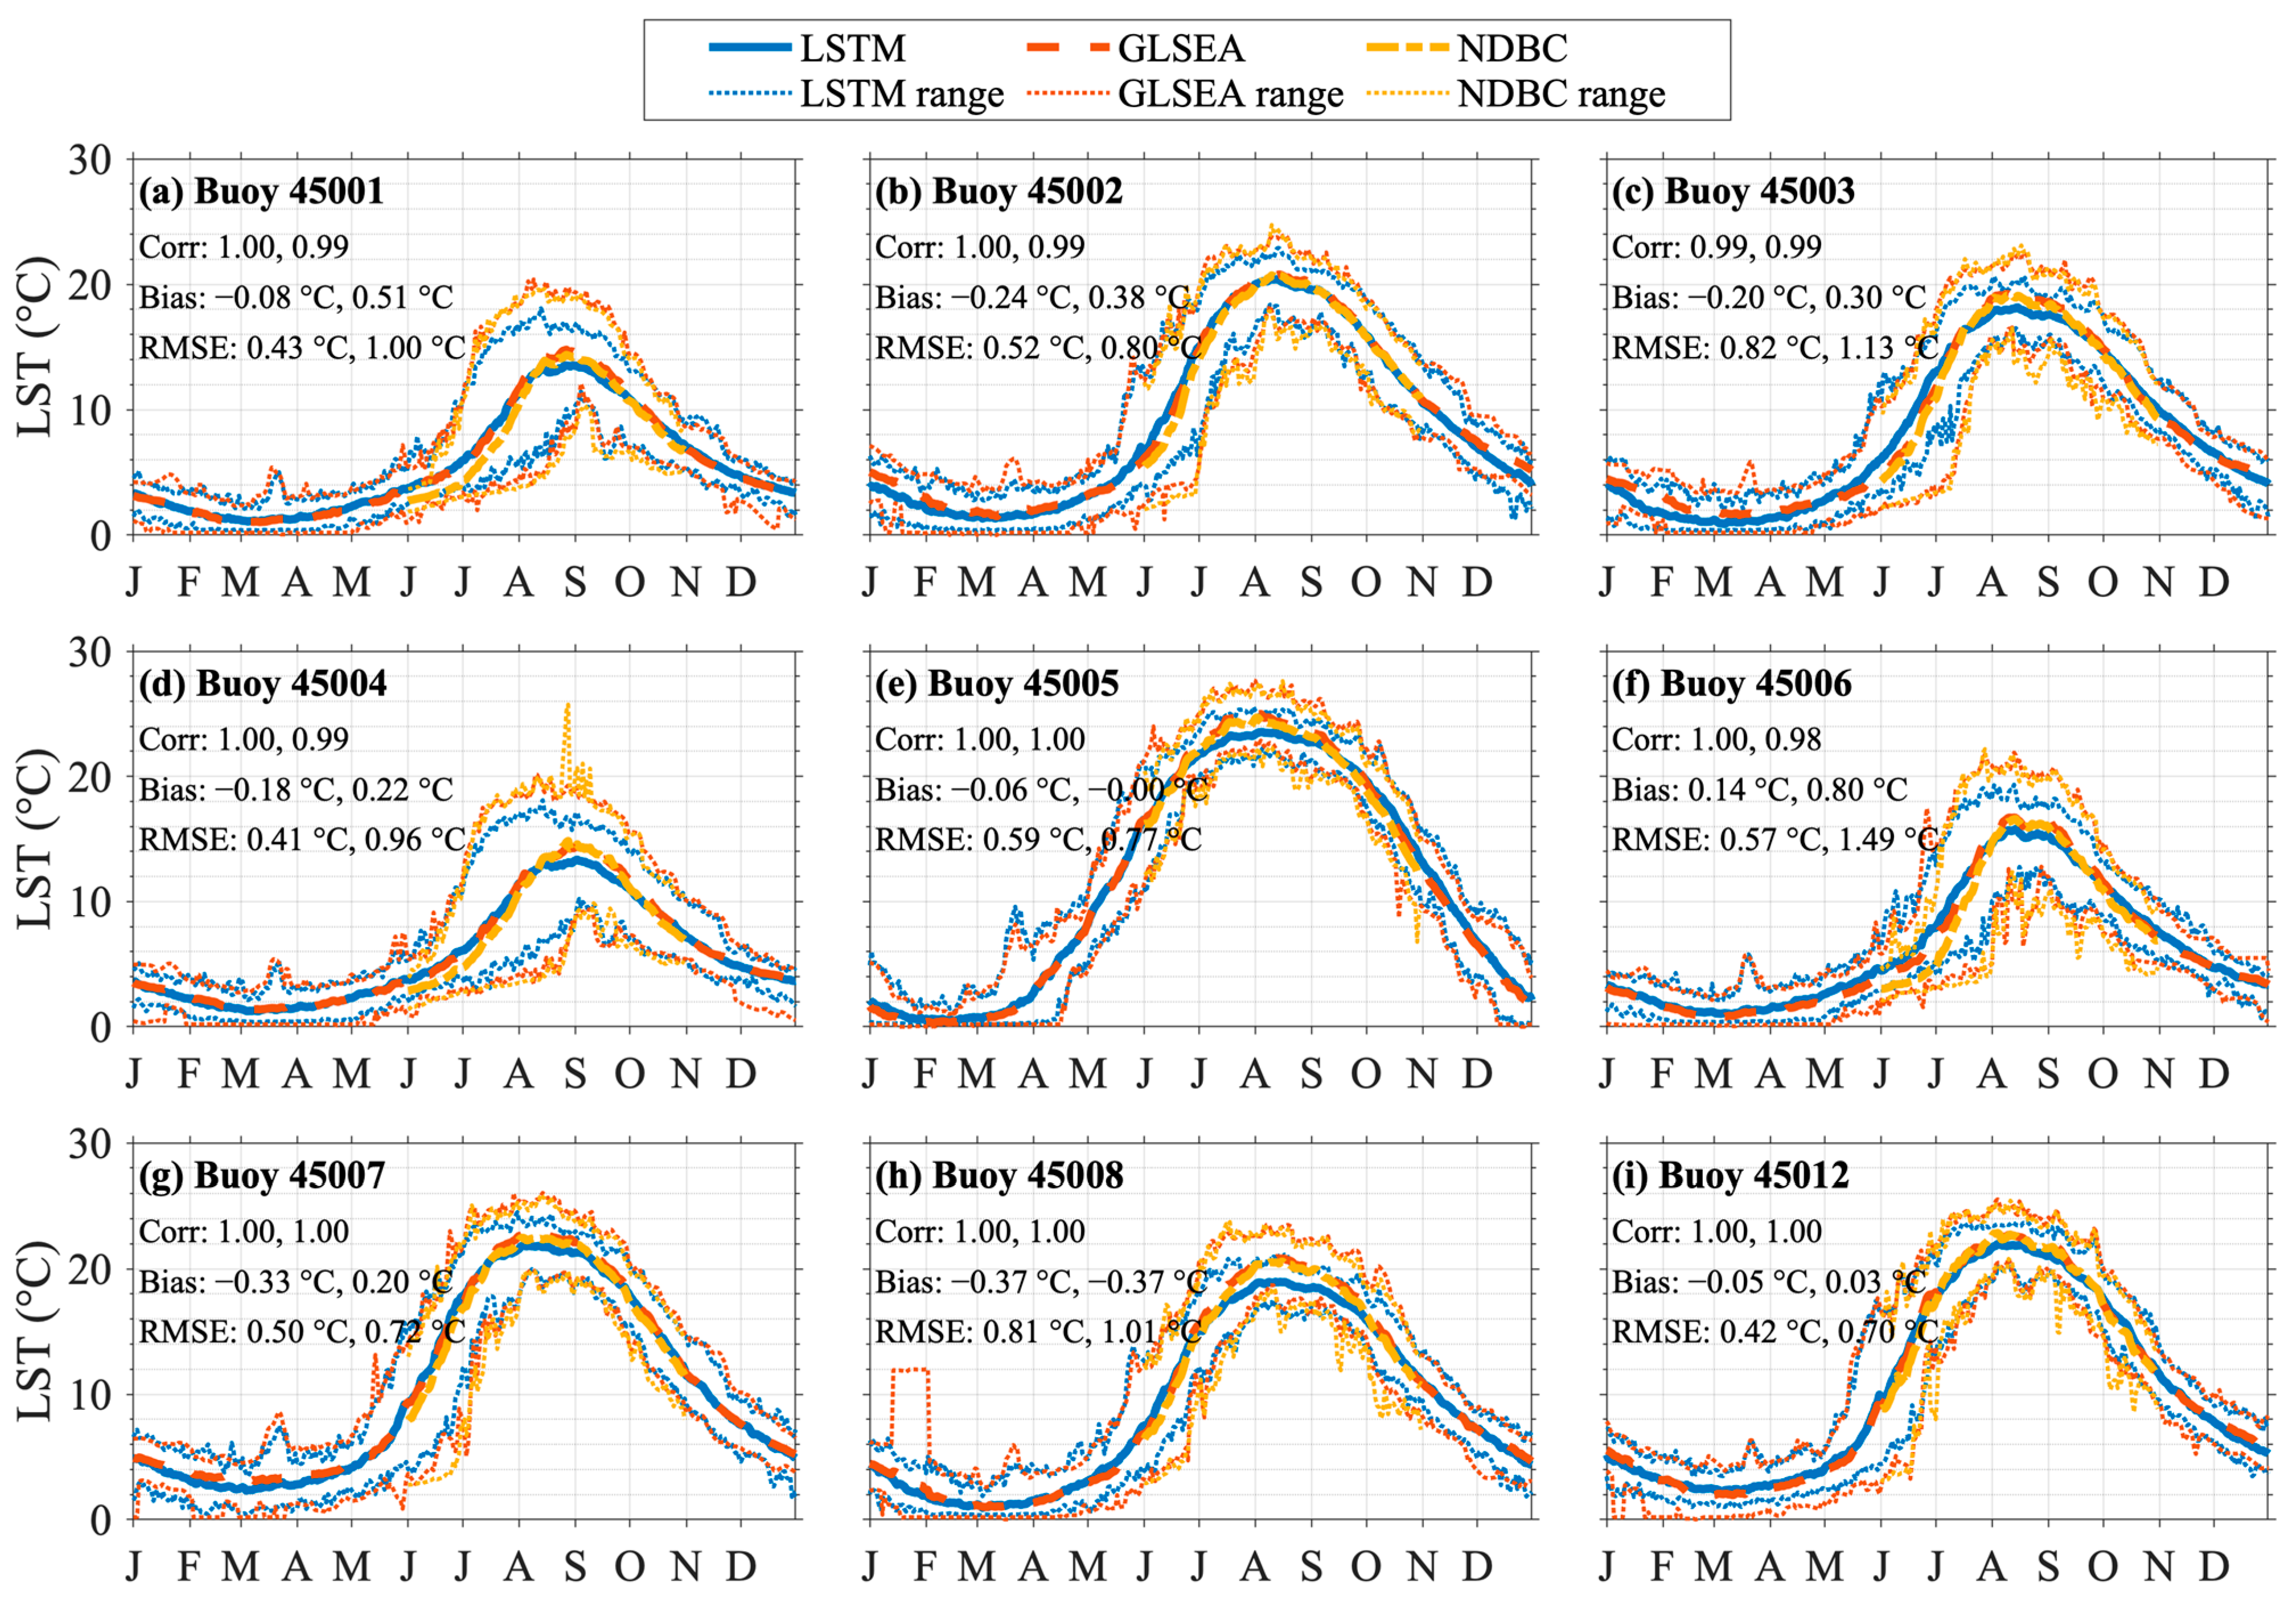
In addition to the lake-wide average LST, the LSTM-predicted LST is also examined at nine NDBC buoy locations against GLSEA and the in situ NDBC buoy measurements (Figure 8 and Figure 9). The buoys are deployed across the Great Lakes (Figure 3) and can be considered as ground-truth for LST. The buoys are only deployed during the ice-free seasons to prevent ice-induced damages, so buoy observations have been narrowed to June–October. As shown in Figure 8, similar to the lake-wide average LST comparisons, the daily LST climatology for 1995–2020 from LSTM at each buoy location follows both the GLSEA and buoy observations closely. The cold bias during the summer peak, observed for lake-wide average LST, is also visible at some buoy locations and the upper range of the summer peaks are underestimated for some locations. However, in general, the LSTM captures the climatology and the interannual variability well. This ability of LSTM to reproduce LST at specific locations within each lake is particularly impressive as there is no spatial averaging to mask biases. Also, note that at the location of Buoy 45008, the GLSEA dataset has an anomalously warm LST of ~12 °C during January 2004, leading to a very high upper limit for January (Figure 8h). Such a warm temperature is unrealistic and is very likely an artifact of data processing. While LSTM is trained using GLSEA, this extreme warm bias of GLSEA is well-handled by LSTM in its learning processes so that LSTM’s performance does not suffer from extreme biases in the training data, and thus highlighting the LSTM’s robustness to produce a more consistent LST dataset. Overall, the LSTM-predicted LST has a high daily correlation (≥0.98), low annual mean bias (from −0.37 °C to +0.80 °C), and low RMSE (from 0.70 °C to 1.49 °C) when compared to the buoy observations.
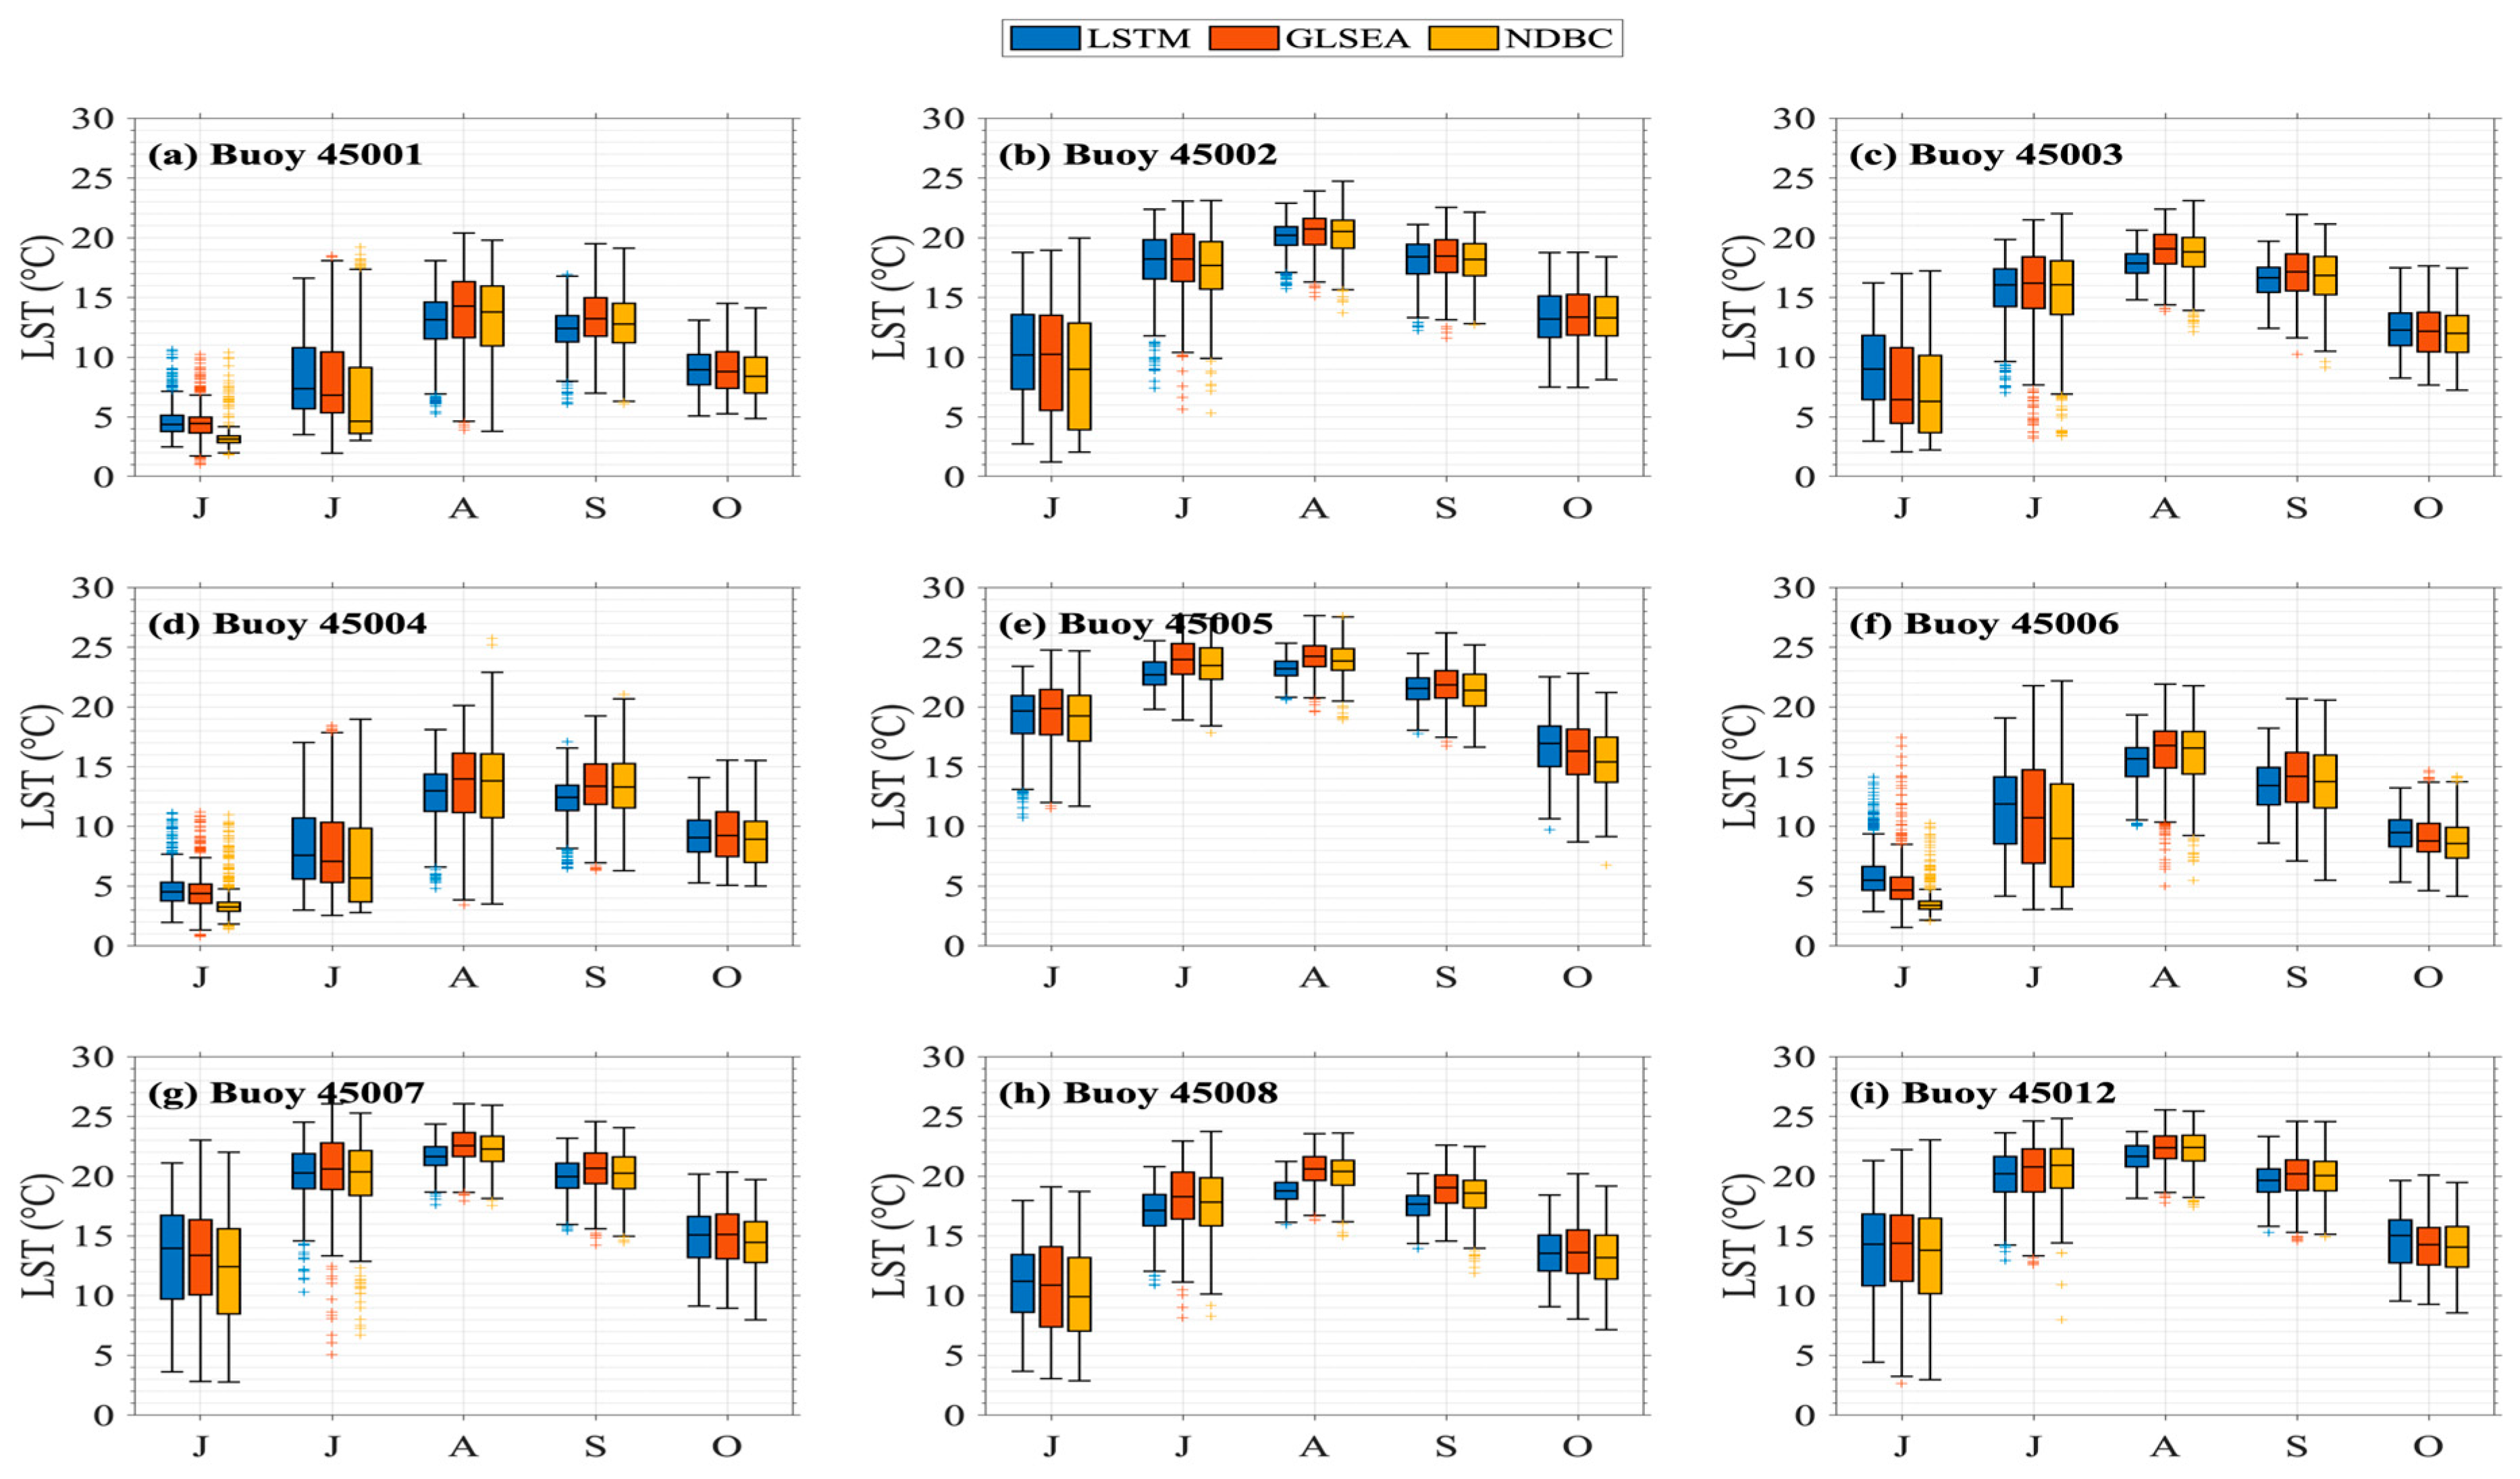
The distribution of daily LST at each buoy location from LSTM is also compared against GLSEA and buoy observations through box plots in Figure 9. The LSTM has a good statistical agreement with both GLSEA and buoy observations as the median, first quartile, and third quartile values are well captured by the LSTM. The maximum and minimum values are also well reproduced by the LSTM. Differences between LSTM and buoy observations in some months are likely due to biases in the GLSEA training data. For example, during June for the buoys in Lake Superior, the LSTs from the LSTM and the GLSEA agree with each other very well, but both have a similar ~1.5 °C of warm bias for the median LST against buoy observations. This finding shows that differences between datasets are not uncommon, as no datasets are devoid of errors, which also reinforces our motivation behind providing an alternative LST dataset for the Great Lakes using deep learning.
The above correlation, bias, and RMSE statistics are calculated using the 1995–2020 daily climatology for clearer visualization and provide insights into the seasonal performance of LSTM. However, we acknowledge the importance of validating the LSTM’s performance on a continuous, non-averaged time series spanning the entire training period. Therefore, we also assess the performance statistics of LSTM against GLSEA and NDBC buoys calculated using a continuous time series as shown in Table 5. When considering a full-length time series, the LSTM-predicted LSTs maintain a high correlation (≥0.96), low mean bias (from −0.39 °C to +0.65 °C), and low RMSE (from 0.52 °C to 1.81 °C).

3.2. LSTM Prediction for 1979–1994 (Testing Period)

From Section 3.1, it is now evident that LSTM is able to capture the spatiotemporal evolution of the Great Lakes LST well from 1995 to 2020. As the primary objective of this study is to reconstruct a high-resolution LST dataset that extends back to 1979, in this section, we present and assess the LSTM-predicted LST for the years 1979 to 1994. Evaluating its performance for the 1979–1994 testing dataset (which is new and unseen data for the LSTM) provides us with an unbiased assessment of LSTM. As GLSEA has no data prior to 1995, we evaluate the LSTM-predicted LST during the testing period against OISST and observations from the nine NDBC buoys.
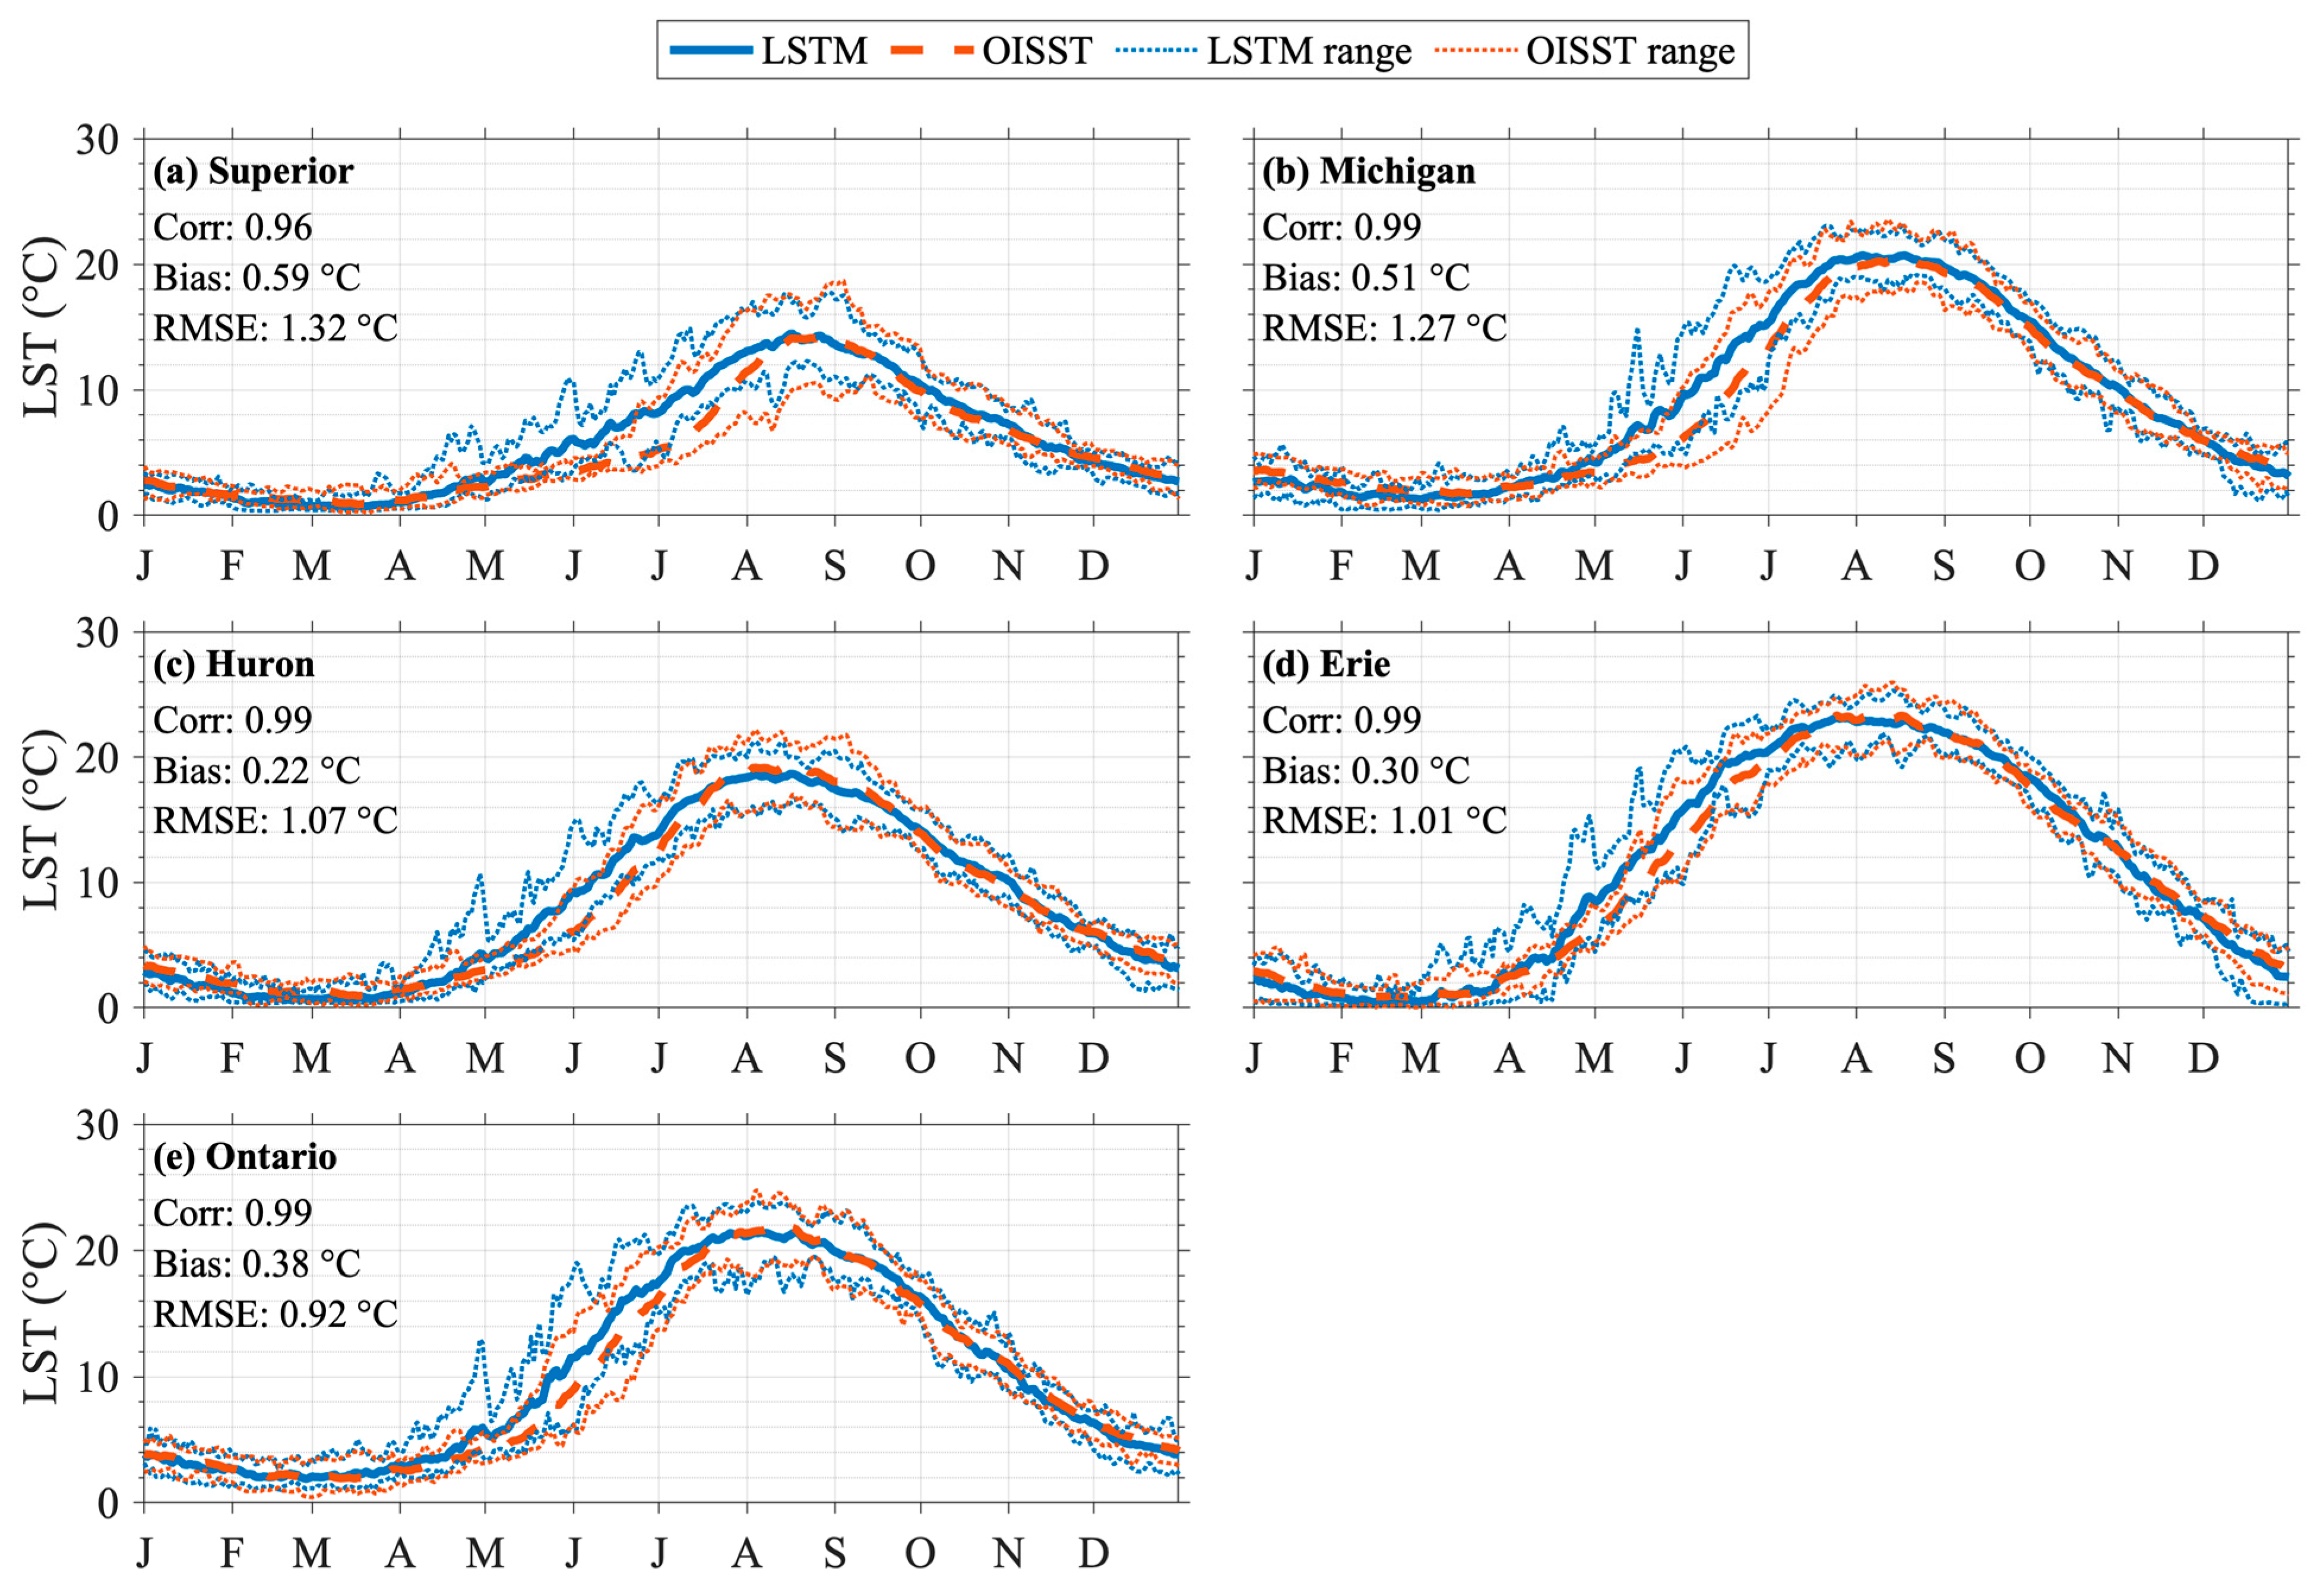
Figure 10 presents the daily climatology of the lake-wide average LST for 1982–1994 from LSTM and OISST for each lake. LSTM agrees well with OISST and has a high daily correlation (≥0.96), low annual mean bias (from +0.22 °C to +0.59 °C), and low RMSE (from 0.92 °C to 1.32 °C). Contrary to the LSTM’s moderate cold biases against GLSEA for the summer peaks during the training period, LSTM captures the summer peaks from OISST during the testing period remarkably well. However, the most noticeable discrepancy between the LST from the LSTM and OISST is the LSTM’s constant ~2 °C warmer LST during May and June, when the lakes are transitioning from winter to summer. Other than that, along with the daily climatology, LSTM also accurately captures the range in interannual variability of daily lake-wide average LST.
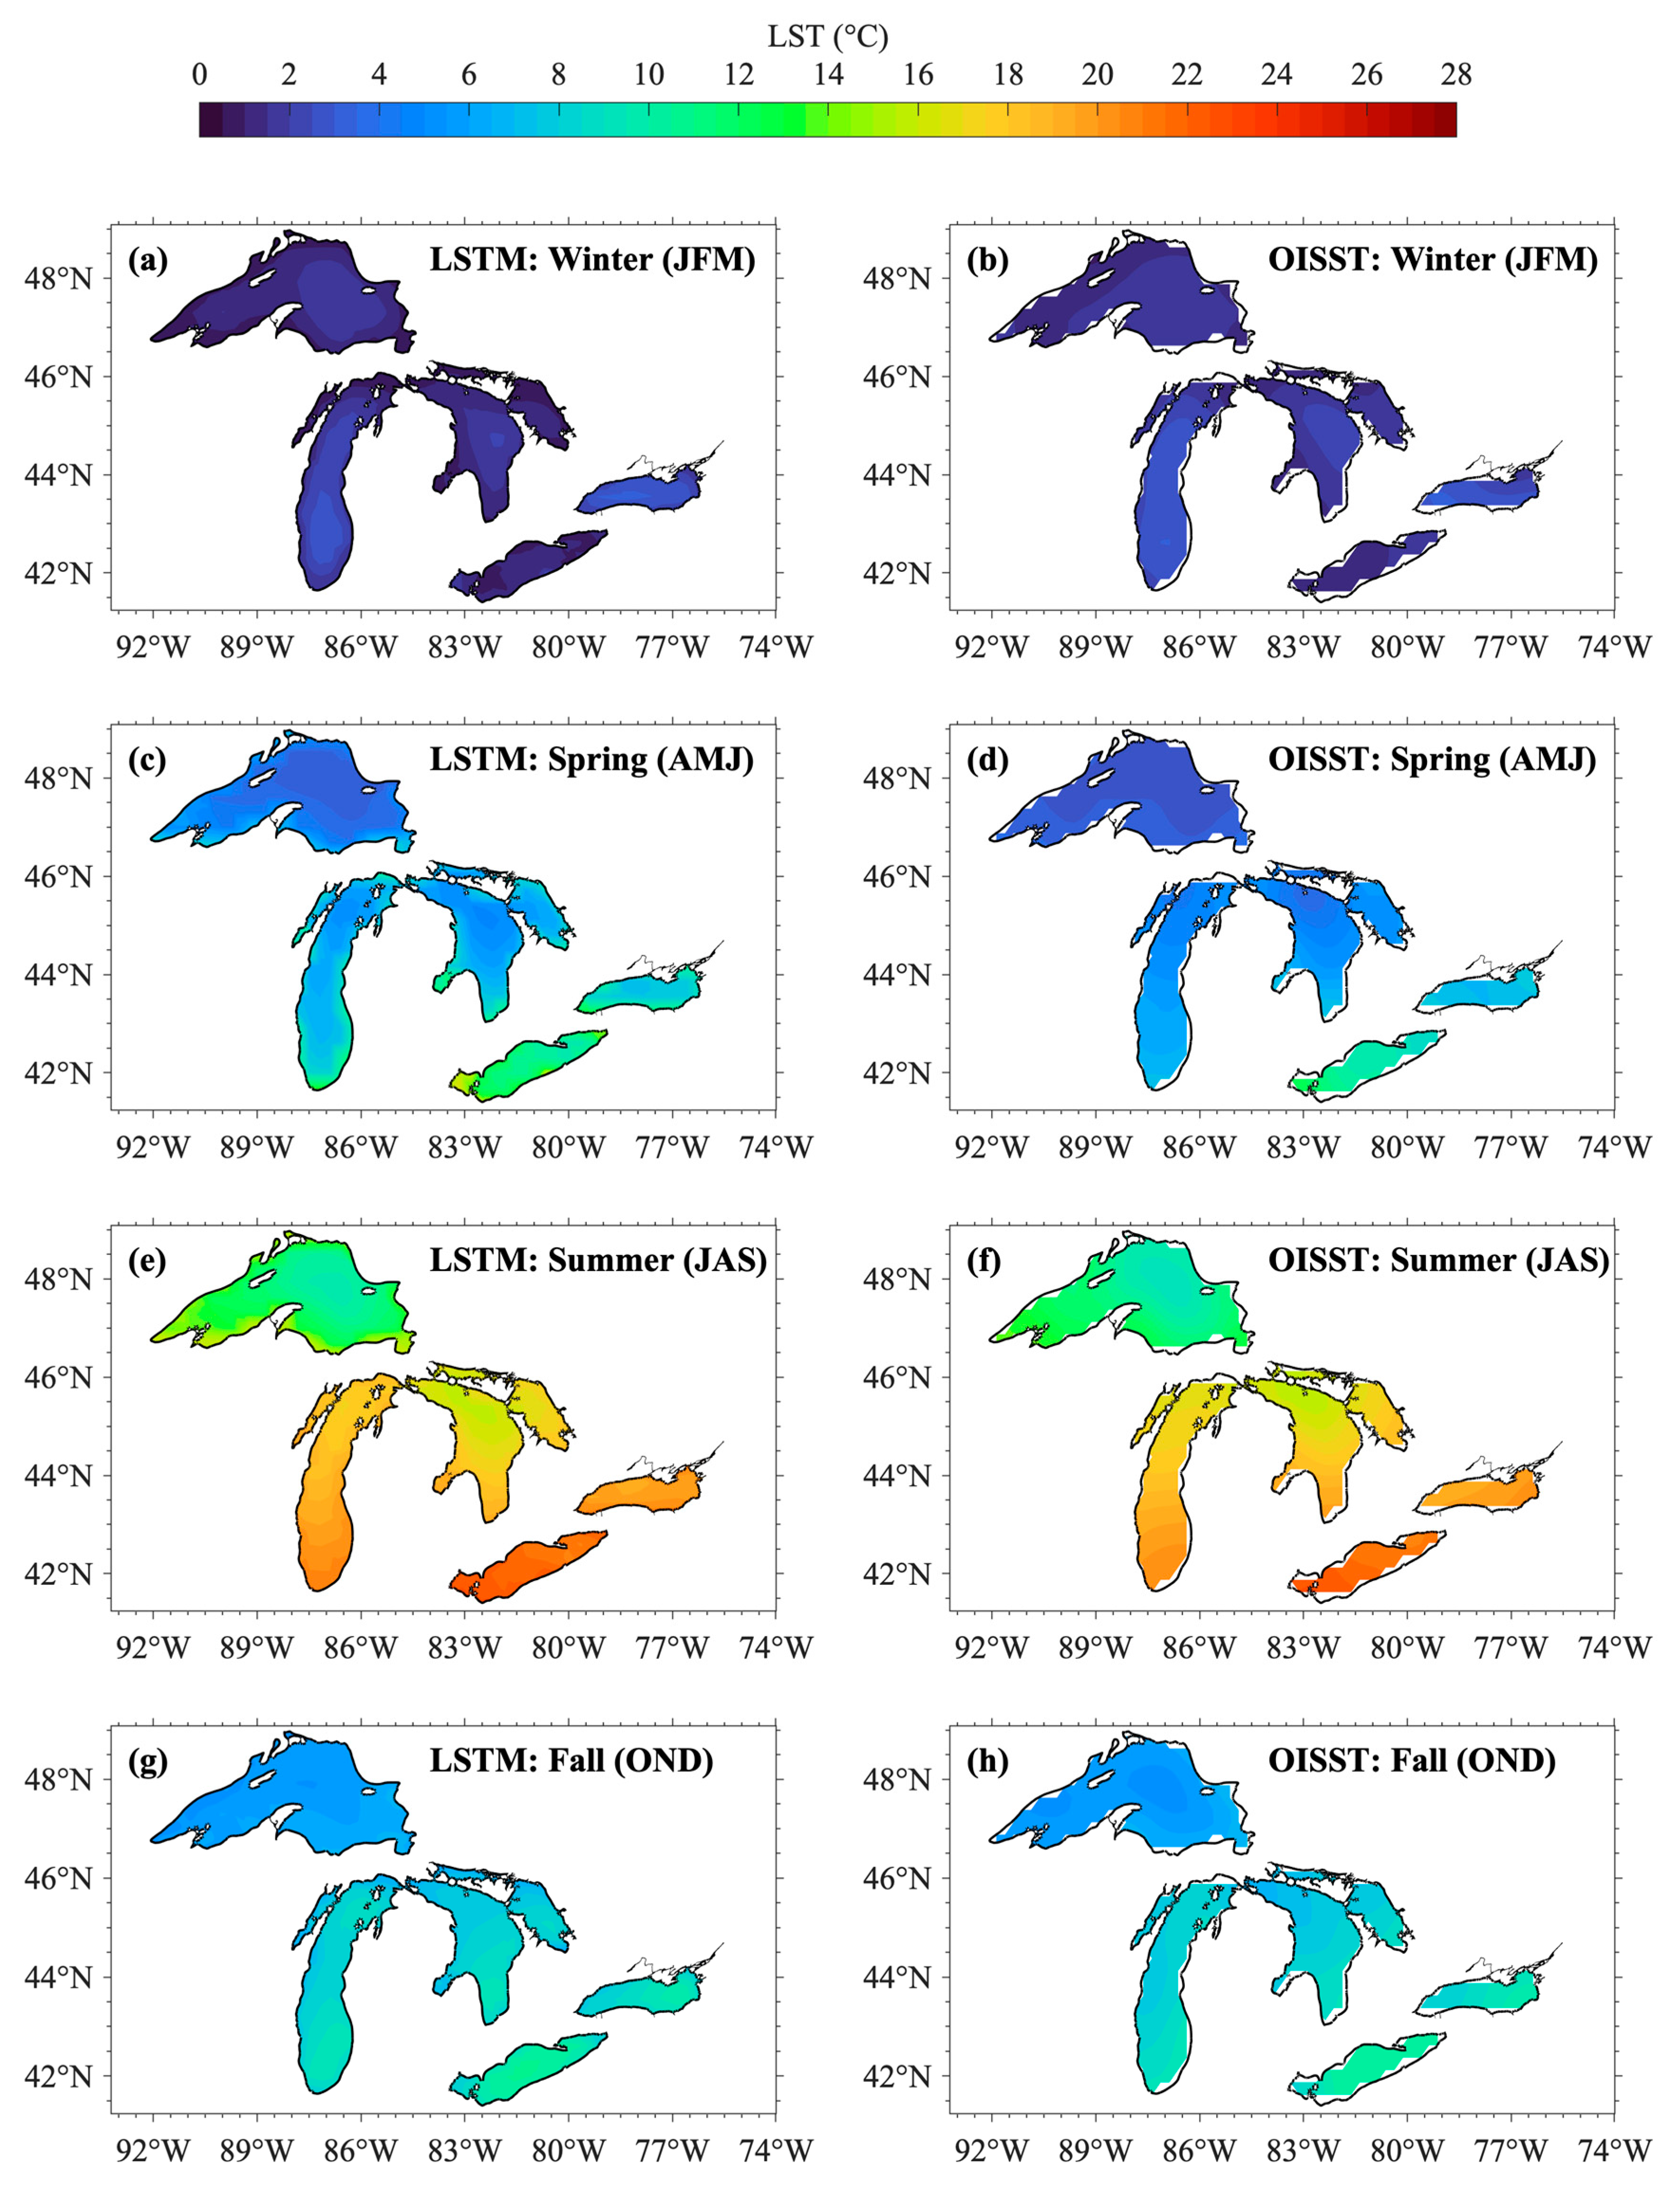
Figure 11 compares the LSTM’s spatial seasonal climatology of LST averaged for 1982–1994 against OISST. It is evident from Figure 11 that, due to its coarse resolution, OISST does not closely track the shoreline of the Great Lakes, resulting in insufficient coverage near the Great Lakes shoreline. Nevertheless, OISST is still a valuable dataset to assess the LSTM’s spatial LST prediction. The spatial heterogeneity during 1982–1994 is consistent with the heterogeneity seen for the training period shown in Figure 7. The LSTM effectively mirrors the unique meridional temperature gradient for the warmer seasons, with Lake Superior exhibiting noticeably cooler temperatures than Lake Erie. Additionally, LSTM effectively replicates the pronounced meridional gradient within Lake Michigan and the comparatively uniform warm summer temperature in the shallowest lake, Lake Erie. Unlike OISST, LSTM also successfully captures the phenomenon where coastal waters tend to be warmer than the deeper offshore waters during spring and summer. For example, in Lake Superior and Michigan, LSTM predicts warmer spring and summer waters in their respective coastal regions.
It is important to note that the LSTM’s warm spring bias for the lake-wide average observed in Figure 10 is partially due to limited nearshore LST coverage in OISST. Nearshore water during spring tends to be warmer than offshore water as seen in both LSTM and GLSEA in Figure 7 and Figure 11, particularly for Lake Michigan, where the difference can be almost 6 °C. OISST is unable to capture this offshore-to-nearshore gradient in LST due to its coarse resolution and thus produces a much cooler lake-wide average LST than LSTM. Such limitations due to coarse resolution also reinforce our motivation behind producing an alternative high-resolution LST dataset for the Great Lakes.
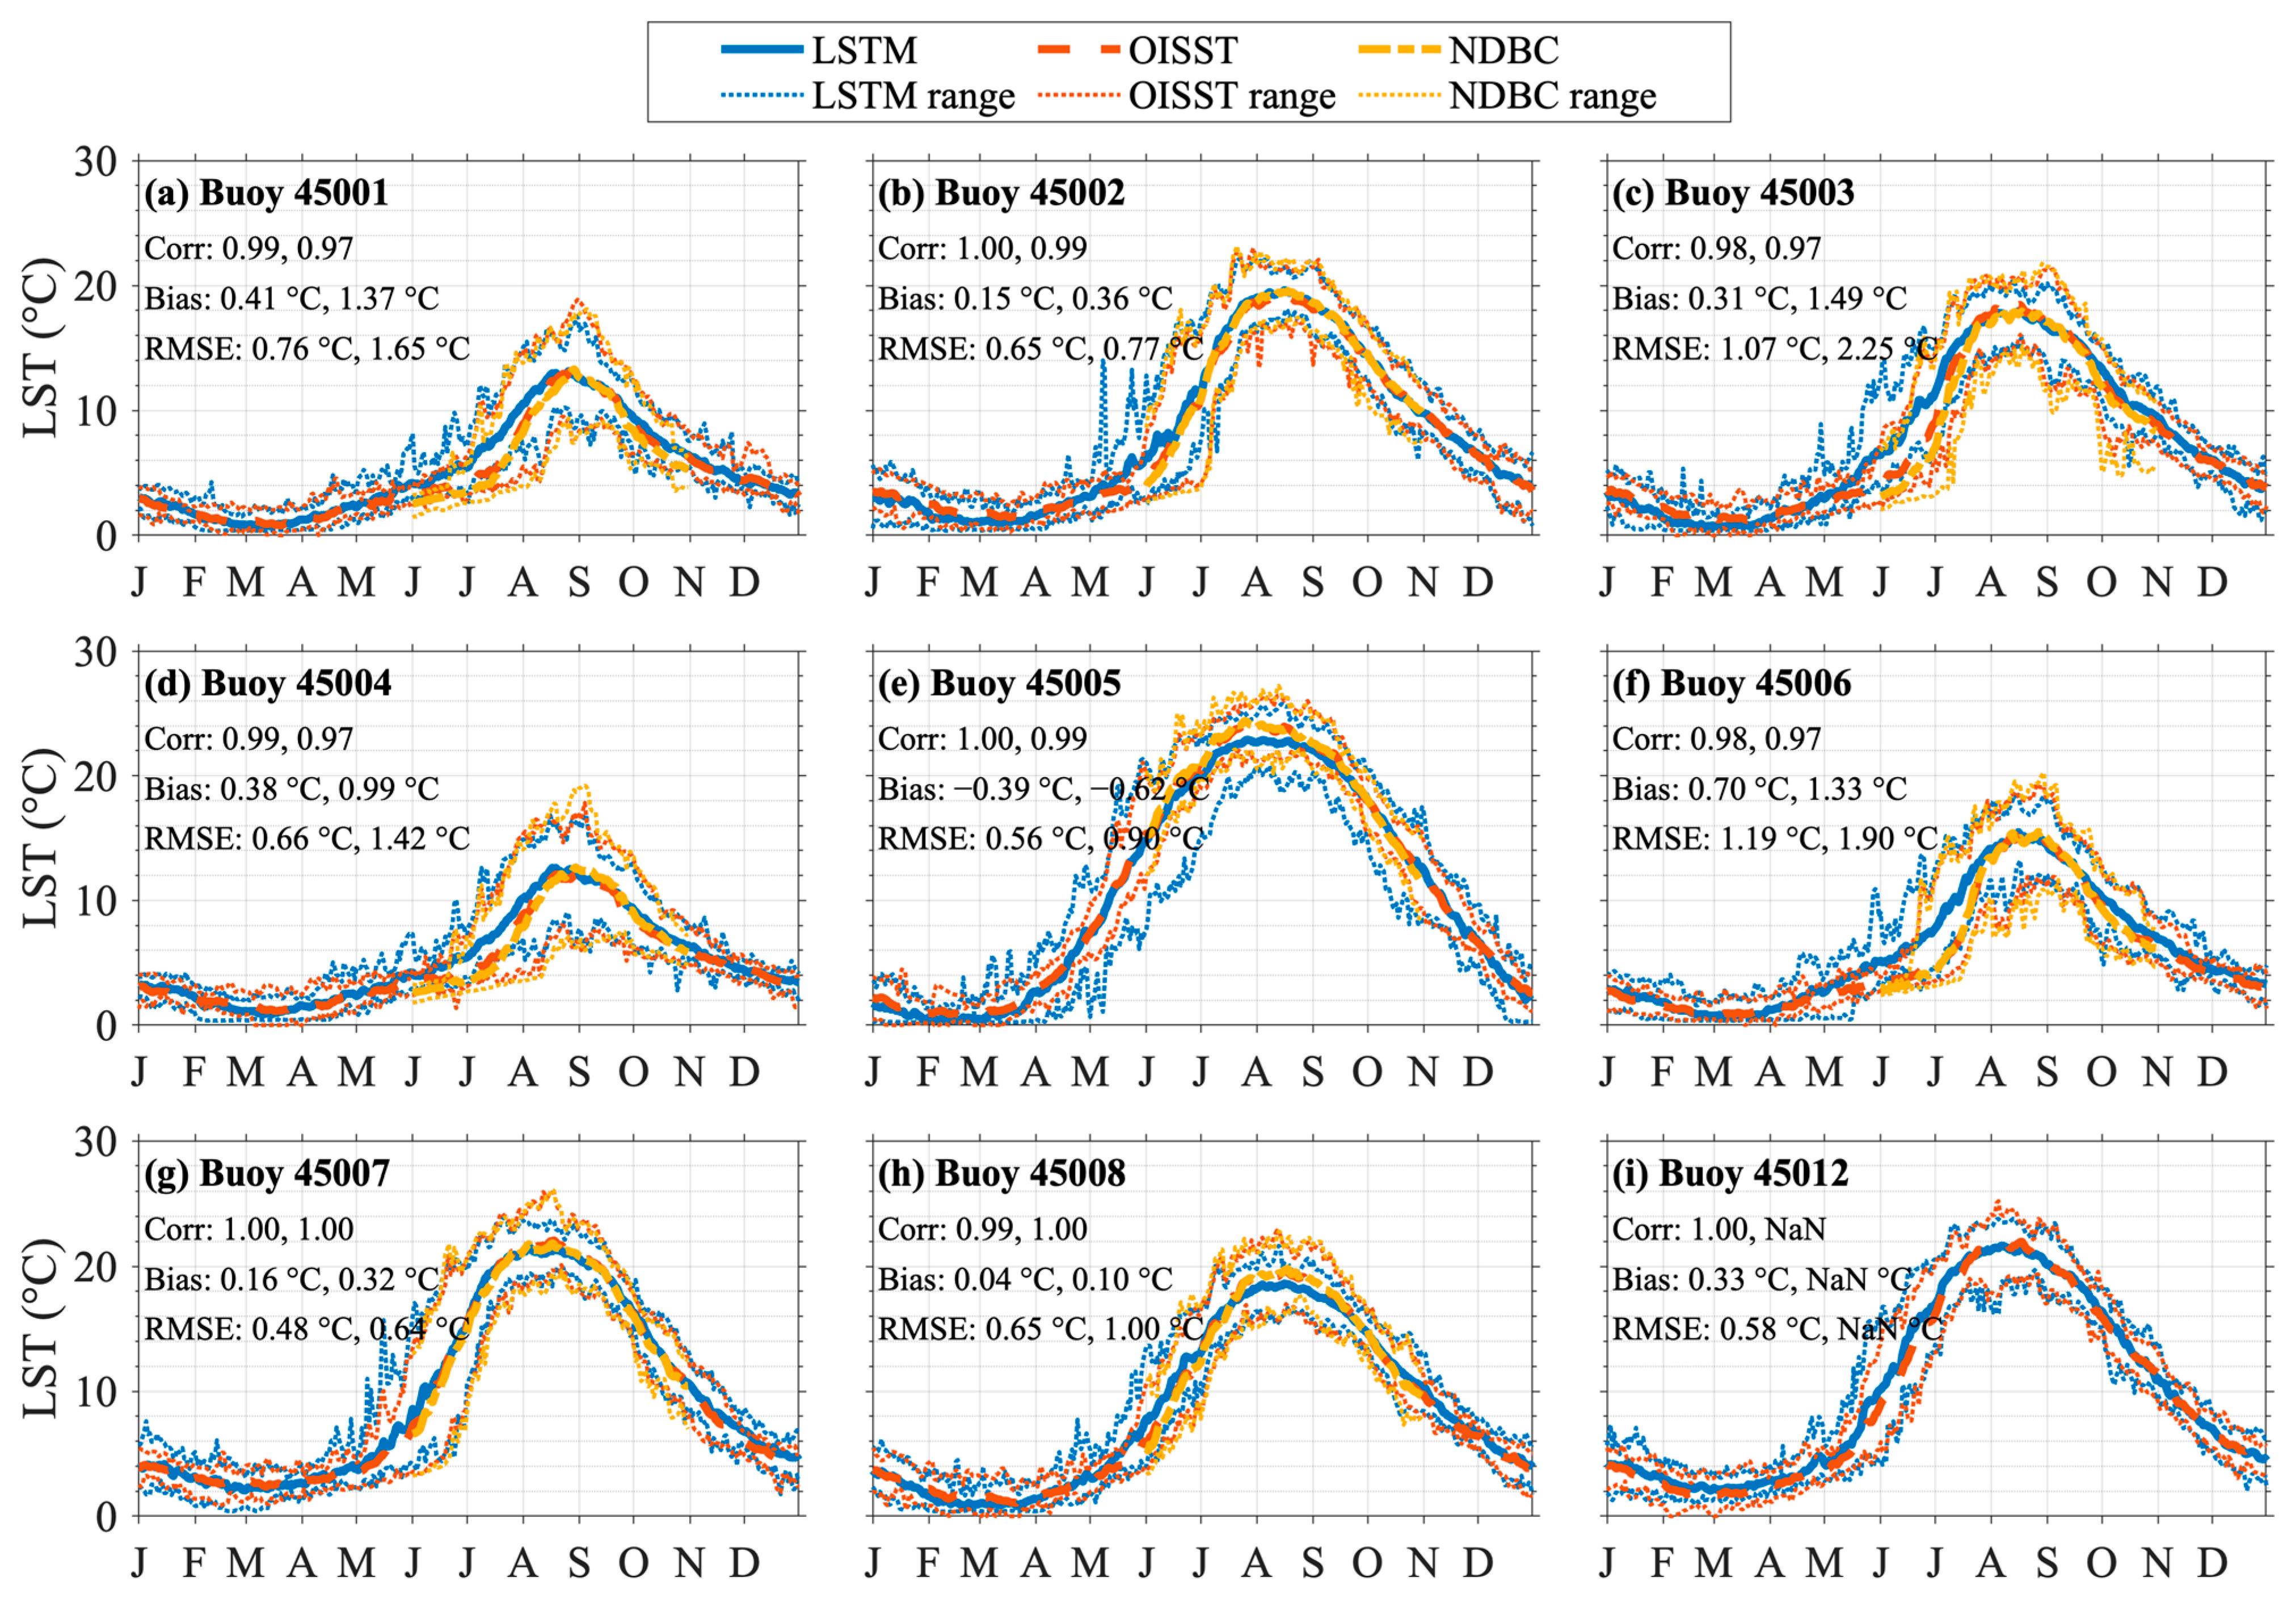
Figure 12 presents the daily climatology of LST at buoy locations from LSTM, OISST, and buoys. Similar to the training period, the LSTM model once again effectively captures the evolution of daily climatology from buoys with high daily correlation (>0.97), low annual mean bias (from −0.62 °C to +1.49 °C), and low RMSE (from 0.64 °C to 2.25 °C). The peak summer LST is reproduced by the LSTM at all nine buoy locations, although there are some warm biases during spring and early summer at the four buoys located in Lake Superior and Lake Huron (Figure 12a,c,d,f). In the remaining five buoy locations, the LSTM closely tracks the OISST and buoy LST, including the interannual variability as evidenced by the enveloping lines. The statistical distribution of the LST at the buoy locations from LSTM also agrees well with those from OISST and buoys (Figure 13). LSTM successfully captures the monthly evolution of the median, the interquartile range, and the outliers. For example, at Buoy 45007 located in the southern basin of Lake Michigan, the evolution of the median LST from ~10 °C in June to ~20 °C in July–September to ~13 °C in October is tracked extremely well by LSTM. Both OISST and LSTM, however, suggest a higher June–July median LST than the buoys located in Lake Superior and Huron by ~1–4 °C. It should be noted that Buoy 45012 in Lake Ontario only has observation data from 2002; so the LSTM’s performance could not be evaluated at its location.
Similar to Table 5, the performance statistics of LSTM against OISST and NDBC buoys calculated using a continuous time series prior to 1995 are shown in Table 6. A continuous time series analysis still results in a high correlation (≥0.92), low mean bias (from −0.40 °C to +1.42 °C), and low RMSE (from 0.95 °C to 2.66 °C). More importantly, while it is not feasible to directly compare our LSTM’s performance with previous studies due to differences in deep learning techniques and study area, a brief look at the deep learning performance in earlier research suggests that our LSTM’s performance is admirable. For example, the LSTM used by Willard et al. [16] to reconstruct the LST in lakes across the US (excluding the Great Lakes) had a RMSE of 1.61 °C and the Process Guided Deep Learning (PGDL) modeling framework in Read et al. [49], which utilized LSTM to predict the LST in lakes within Wisconsin and Minnesota, had a RMSE of 1.65 °C. Similarly, the MLPNN used by Heddam et al. [37] to predict the surface temperature of lakes in Poland had a RMSE of around 1.7 °C. These RMSEs from previous studies are mostly larger than the RMSE of our LSTM model mentioned in Table 5 and Table 6. The higher spatial resolution of our LSTM-predicted LST across the expansive region of the Great Lakes further highlights the impressive performance of our LSTM model.

3.3. LSTM Prediction for the Change in LST Due to the 1997–1998 LST Regime Shift

During 1997–1998, a decadal regime shift occurred in the Great Lakes LST, leading to a noticeable increase in LST, particularly for the summer LST of Lake Superior [65,66]. Studies have highlighted multiple triggers behind this regime shift including a shift in the Pacific Decadal Oscillation towards its negative phase [66] and a warm 1997–1998 winter coinciding with a strong 1997–1998 El Niño episode [66,67,68]. The regime shift resulted in the transition of the Great Lakes from a persistent cold state to a persistent warmer state; causing decreased ice cover, increased evaporation, and increased LST [66]. For example, Lake Superior’s mean summer LST for 1998–2012 has been shown to be 2.5 °C higher than the 1982–1997 mean [65].
In this section, we examine the variation in the LSTM-predicted LST due to the 1997–1998 regime shift and determine its agreement with existing datasets. Given its coverage of 42 years, it is crucial to evaluate the performance of our LSTM-predicted LST in capturing important climatic signals, and the 1997–1998 regime shift presents an opportunity for such evaluation.
Figure 14 compares the LSTM’s predicted change in LST due to the 1997–1998 regime shift with that of GLSEA, OISST, and NDBC buoys. Given GLSEA data are only available from 1995, the panels in the first three rows of Figure 14 present the LST change between the 1995–1997 climatology average and the 1998–2020 climatology average from LSTM, GLSEA, and OISST. The panels in the last two rows present the LST change between the 1982–1997 climatology average and 1998–2020 climatology average from LSTM and OISST. Regardless of the comparison time periods, LSTM captures the increase in LST fairly well. Compared to other seasons, winter has a relatively muted increase in LST with lake-wide average LST increasing by less than 1 °C in all lakes, and this minor winter increase is reproduced by LSTM. Lakes except Lake Superior exhibited their most pronounced LST increases during the spring and this is particularly evident in Figure 14b,f,j. Lake Superior, on the other hand, experienced its biggest LST increase during the summer. LSTM is able to capture this seasonal distinction among lakes well. However, the magnitude of the LST increase predicted by LSTM is slightly smaller than the increase from GLSEA, OISST, and buoys, particularly for Lake Superior. GLSEA and OISST show an increase of 2.5 °C and 2.8 °C, respectively, while LSTM predicts an increase of 1.9 °C when comparing the lake-wide average summer LST of Lake Superior for 1998–2020 and 1995–1997. In contrast to OISST, the LSTM also predicts some decreases along the shoreline for Lake Superior when comparing the mean spring LST for 1998–2020 and 1982–1997 (Figure 14n,r). Such lower predicted increases in LST likely stem from the LSTM’s summer cold bias during the training period (Figure 6a) as well as the warm spring bias during the testing period (Figure 10a).
It is important to remember that the LSTM model was trained on the GLSEA dataset. Therefore, differences between LSTM-predicted LST and OISST are expected, given the notable discrepancies between the GLSEA and OISST datasets. For example, by comparing Figure 14e and Figure 14i, it is apparent that GLSEA shows a more substantial LST increase than OISST for winter in Lake Superior. GLSEA shows an increase of 0.6 °C while OISST shows an increase of 0.1 °C when comparing the lake-wide average winter LST of Lake Superior for 1998–2020 and 1995–1997. GLSEA also shows a lower LST increase than OISST for summer LST in Lake Michigan. OISST shows an increase of 1.8 °C while GLSEA shows a lower increase of 1.2 °C when comparing the lake-wide average summer LST of Lake Michigan for 1998–2020 and 1995–1997.

4. Discussion

4.1. Necessity for an Extended High-Resolution LST Dataset for the Great Lakes

The new LST dataset created in this study could have a significant impact on regional climate modeling. A recent study by Wang et al. [6] compared the impact of using the GLSEA LST (high-resolution, but available only from 1995) and the ERA5 reanalysis LST (low-resolution, but with multi-decadal coverage) as over-lake surface boundary conditions on atmospheric summer simulations over the Great Lakes region. They found that differences in LST between the GLSEA and ERA5 datasets exert local-scale influences on atmospheric temperature and moisture. While more importantly, differences in LST between the two datasets significantly impacted convective environment and precipitation processes over a much larger spatial scale. Specifically, an increase in LST by a margin of 1–3 °C (varying by lakes) elevated the near-surface air temperature over Lake Superior and Lake Erie by 1.93 °C and 0.97 °C, respectively. The increased LST also boosted evaporation over the lakes, by rates of 0.23 and 1.1 mm per day. In addition, a warmer LST reduced mesoscale convective precipitation upstream of the Great Lakes region and also amplified isolated deep convective precipitation and non-convective precipitation downstream of the Great Lakes region. These changes are linked to the enhanced local instability and the augmented moisture transport associated with the LST difference. The study verified the consistency of these impacts across several simulated summer seasons, demonstrating that they were at least double the model’s internal variability.
Our LSTM-predicted LST will also be essential to atmospheric winter simulations over the Great Lakes region due to its representation of the spatial variations of LST. Shi and Xue [8] emphasized the sensitivity of atmospheric winter simulations to LST variation within the overlake surface boundary conditions. They showed that, compared to prescribing a uniform LST as the overlake surface boundary condition, incorporating the GLSEA’s spatial LST variations of approximately 1–3 °C within the overlake surface boundary condition can lead to a 5–30% increase in the simulated winter lake-effect precipitation. Their inclusion of spatial LST variations also resulted in an increase in the simulated mean winter snow water equivalent by 3–15% and ultimately a better simulation of lake-effect snowstorms in the Great Lakes region. As our LSTM-predicted LST dataset is comparable to the GLSEA dataset and covers a much longer time period, we expect it to be crucial to the atmospheric modeling communities for long-term atmospheric simulations over the Great Lakes.
In addition to aiding regional climate modeling, a high-resolution LST dataset spanning an extensive temporal range is crucial for examining the ecological shifts taking place in the Great Lakes due to climate change. LST change is a vital indicator of climate change and has been widely used as an explanatory variable to study and predict the fish distribution within the Great Lakes region [69,70,71,72,73]. For example, parasitic sea lampreys in Lake Superior, which are an invasive species, have been documented growing larger in size due to the warming of the lake which extended their hosts’ growing season [74]. Likewise, studies have shown the northward migration of warm-water fishes due to the warming of the lakes by rates of up to 17.5 km per decade over the past three decades within the Great Lakes region [73]. Even minor changes in a lake’s thermal characteristics can trigger significant changes in the growth rate and abundance of phytoplankton and zooplankton within the lakes [75,76,77,78]. Therefore, a high-resolution LST dataset that spans a relatively longer time frame, like the one presented in this study, would be beneficial to such ecological investigations as well.

4.2. Uncertainty in Training LST (GLSEA) Data

GLSEA is widely recognized as one of the best Great Lakes LST datasets, but it is not exempt from uncertainties, especially during cloudy days when satellite imagery is compromised. GLSEA employs a cloud mask to generate cloud-free satellite images and applies an interpolation technique over a 20-day window to update the LST values. When cloud-free images are not available, GLSEA resorts to a smoothing algorithm to update the LST values. This smoothing results in diminished accuracy and potential oversight of sudden LST changes occurring during extended cloudy days. The Great Lakes, acting as a perpetual moisture source, notably contribute to enhanced cloud cover during winter [4]. Schwab et al. [23] noted that, during the winter and early spring season, some areas of the lakes do not have new imagery for as long as 30 to 40 days due to high cloud cover. Therefore, given that the accuracy of the LSTM-predicted LST dataset is dependent on the accuracy of the training LST dataset, which is GLSEA in this study, it is vital to be aware of such uncertainties in GLSEA and proactively address them in future studies. This is particularly important during the winter and spring seasons, when cloud cover is prevalent, and the retrieval of buoys to prevent ice-induced damages necessitates more robust observations.
While our study has shown that the LSTM-predicted LST dataset is comparable to GLSEA, future studies can potentially leverage the recently released Advanced Clear-Sky Processor for Oceans (ACSPO) GLSEA dataset (ACSPO GLSEA) [79] as a new training dataset to circumvent the uncertainties of GLSEA. ACSPO GLSEA is a Great Lakes LST dataset that is based on the ACSPO Level 3 Super Collated (L3S) temperature data from Low Earth Orbit (LEO) satellite sensors. It should be noted that ACSPO GLSEA only has LST data starting from 2006, which reduces the training samples. Furthermore, in contrast to GLSEA, ACSPO GLSEA does not include the historic regime shift in LST that occurred in 1997–1998. The absence of such events within the training dataset may limit the training and performance of deep learning models.

4.3. Future Model Improvements

Future studies can consider incorporating a second deep learning technique, such as convolutional neural networks (CNNs), into the model framework to improve the model performance and mitigate the limitations of LSTM. In our current architecture, LST is predicted at each grid point using the input features at the same grid point. This does not consider the spatial relationship of input features between grid points and potentially contributes to some of the distinct isolated patches of LST biases seen in Figure 7. Therefore, a hybrid CNN-LSTM model [80] can be developed where a CNN first learns the spatial relationship of the input features and then passes it on to the LSTM for learning the temporal relationship. This approach would also allow us to directly use satellite imagery as training data.
Additionally, in a recent publication by Hao et al. [51] in 2023, a novel deep learning model called Attention-GRU was introduced. By training the model with satellite-derived LST and a multitude of meteorological data, Attention-GRU was shown to predict the LST time series of China’s largest inland lake, Qinghai Lake, better than seven baseline models, which included a physicalstatistics based model, Air2water [81] and deep learning models such as LSTM, Transformer, and GRU. While their model only predicted the summer lake-wide average LST and did not predict a spatial map of LST, their approach and the improvements of Attention-GRU over LSTM are nonetheless noteworthy in the context of improving the application of deep learning models in the Great Lakes region.
Future studies should also consider incorporating OISST for model training. As seen in Figure 12 and Figure 14, OISST is closer to NDBC buoy observations and GLSEA than LSTM in terms of reproducing the daily climatology and lake warming due to the regime shift. Therefore, despite having a lower resolution than GLSEA, OISST would be a valuable training dataset, especially since it has gridded LST for a longer time period. It should be noted that a straightforward combination of GLSEA and OISST would not be appropriate to create the new training dataset. Instead, a potential approach could be to use ensemble learning. Under such an approach, one deep learning model is trained using GLSEA, while a second deep learning model is trained using OISST. Subsequently, their predictions are combined in a manner that minimizes error and enhances prediction performance.

5. Conclusions

In this paper, we present a new gridded LST dataset for the Great Lakes that was reconstructed using an LSTM neural network. Our new dataset spans 42 years (1979–2020), offering a much longer temporal coverage than GLSEA, the most commonly used gridded LST dataset for the Great Lakes. Additionally, our dataset utilizes a fine unstructured spatial grid mesh of ~1 km horizontal resolution to cover the Great Lakes. While Xue et al. [56] were the first to study the application of a deep learning technique such as LSTM to predict the spatiotemporal distribution of the Great Lakes LST, our study, by building upon their work and training the LSTM on a bigger dataset, is the first to use deep learning to reconstruct the Great Lakes LST on such an unprecedented spatiotemporal scale.
The LSTM-predicted LST closely follows the GLSEA and buoy data for the training period, 1995–2020, and also aligns with the OISST and buoy data for the testing period, 1979–1994. The LSTM captures both the spatial and temporal evolution of LST, albeit with some minor cold and warm biases. In addition, our data also capture climate signals from the 1997–1998 LST regime shift, which had coincided with a strong El Niño. Our study highlights the strengths and limitations of different observation-based datasets and presents an alternative dataset based on LSTM. This new dataset offers expansive temporal coverage like the OISST and buoy observations while maintaining the high spatial resolution and accuracy of GLSEA. It serves as a viable alternative to the existing datasets and aids the Great Lakes scientific community in climatic spatiotemporal LST analysis and long-term regional climate modeling. Future work to supplement this study involves incorporating a new training LST dataset, exploring the combination of two deep-learning techniques such as CNN and LSTM, and utilizing ensemble learning techniques to take advantage of multiple training datasets.

Author Contributions

Conceptualization, P.X. and M.B.K.; methodology, P.X. and T.L.; software, P.X. and T.L.; validation, M.B.K., C.H.; formal analysis, M.B.K. and T.L.; investigation, M.B.K. and T.L.; resources, P.X.; data curation, M.B.K., T.L. and C.H.; writing—original draft preparation, M.B.K. and P.X.; writing—review and editing, M.B.K., T.L., D.T., T.C.H. and P.X.; visualization, M.B.K.; supervision, P.X.; project administration, P.X.; funding acquisition, P.X. All authors have read and agreed to the published version of the manuscript.

Funding

This research was funded by the Great Lakes Restoration Initiative, through the University of Michigan Cooperative Institute for Great Lakes Research (CIGLR) cooperative agreement with the National Oceanic and Atmospheric Administration (NA17OAR4320152). The study was partly supported by Cooperative Agreement No. G21AC10141 from the United States Geological Survey. This study was also supported by the National Aeronautics and Space Administration, Grant 80NSSC17K0287 and the COMPASS-GLM, a multi-institutional project supported by the U.S. Department of Energy, Office of Science, Office of Biological and Environmental Research as part of the Regional and Global Modeling and Analysis (RGMA) program, Multi-sector Dynamics Modeling (MSD) program, and Earth System Model Development (ESMD) program.

Data Availability Statement

The LSTM model code presented in this study is openly available in GitHub at: https://github.com/FiND-Tao/lake-surface-temperature (accessed on 10 May 2023). The LSTM-predicted LST presented in this study for the Great Lakes from 1979–2020 is openly available in Zenodo at: https://doi.org/10.5281/zenodo.7995786 (accessed on 1 June 2023). Publicly available datasets were used in this study. CFSR data can be found here: https://climatedataguide.ucar.edu/climate-data/climate-forecast-system-reanalysis-cfsr (accessed on 20 November 2022). GLSEA data can be found here: https://coastwatch.glerl.noaa.gov/glsea/ (accessed on 11 February 2023). NDBC buoy data can be found here: https://www.ndbc.noaa.gov/ (accessed on 9 February 2023). OISST data can be found here: https://www.ncei.noaa.gov/products/optimum-interpolation-sst (accessed on 10 July 2023).

Conflicts of Interest

The authors declare no conflict of interest.

References

  1. U.S. Environmental Protection Agency (EPA); Government of Canada. The Great Lakes: An Environmental Atlas and Resource Book, 3rd ed.; Fuller, K., Shear, H., Eds.; EPA: Chicago, IL, USA, 1995.
  2. Changnon, S.A., Jr.; Jones, D.M.A. Review of the influences of the Great Lakes on weather. Water Resour. Res. 1972, 8, 360–371. [Google Scholar] [CrossRef]
  3. Scott, R.W.; Huff, F.A. Impacts of the Great Lakes on Regional Climate Conditions. J. Great Lakes Res. 1996, 22, 845–863. [Google Scholar] [CrossRef]
  4. Notaro, M.; Holman, K.; Zarrin, A.; Fluck, E.; Vavrus, S.; Bennington, V. Influence of the Laurentian Great Lakes on Regional Climate. J. Clim. 2013, 26, 789–804. [Google Scholar] [CrossRef]
  5. Notaro, M.; Zhong, Y.; Xue, P.; Peters-Lidard, C.; Cruz, C.; Kemp, E.; Kristovich, D.; Kulie, M.; Wang, J.; Huang, C.; et al. Cold Season Performance of the NU-WRF Regional Climate Model in the Great Lakes Region. J. Hydrometeorol. 2021, 22, 2423–2454. [Google Scholar] [CrossRef]
  6. Wang, J.; Xue, P.; Pringle, W.; Yang, Z.; Qian, Y. Impacts of Lake Surface Temperature on the Summer Climate over the Great Lakes Region. J. Geophys. Res. Atmos. 2022, 127, e2021JD036231. [Google Scholar] [CrossRef]
  7. Xue, P.; Ye, X.; Pal, J.S.; Chu, P.Y.; Kayastha, M.B.; Huang, C. Climate projections over the Great Lakes Region: Using two-way coupling of a regional climate model with a 3-D lake model. Geosci. Model Dev. 2022, 15, 4425–4446. [Google Scholar] [CrossRef]
  8. Shi, Q.; Xue, P. Impact of Lake Surface Temperature Variations on Lake Effect Snow over the Great Lakes Region. J. Geophys. Res. Atmos. 2019, 124, 12553–12567. [Google Scholar] [CrossRef]
  9. Gronewold, A.D.; Do, H.X.; Mei, Y.; Stow, C.A. A tug-of-war within the hydrologic cycle of a continental freshwater basin. Geophys. Res. Lett. 2021, 48, e2020GL090374. [Google Scholar] [CrossRef]
  10. Kayastha, M.B.; Ye, X.; Huang, C.; Xue, P. Future rise of the Great Lakes water levels under climate change. J. Hydrol. 2022, 612, 128205. [Google Scholar] [CrossRef]
  11. Wagner, T.J.; Czarnetzki, A.C.; Christiansen, M.; Pierce, R.B.; Stanier, C.O.; Dickens, A.F.; Eloranta, E.W. Observations of the Development and Vertical Structure of the Lake-Breeze Circulation during the 2017 Lake Michigan Ozone Study. J. Atmos. Sci. 2022, 79, 1005–1020. [Google Scholar] [CrossRef]
  12. Xue, P.; Pal, J.S.; Ye, X.; Lenters, J.D.; Huang, C.; Chu, P.Y. Improving the Simulation of Large Lakes in Regional Climate Modeling: Two-Way Lake–Atmosphere Coupling with a 3D Hydrodynamic Model of the Great Lakes. J. Clim. 2017, 30, 1605–1627. [Google Scholar] [CrossRef]
  13. Bennington, V.; Notaro, M.; Holman, K.D. Improving Climate Sensitivity of Deep Lakes within a Regional Climate Model and Its Impact on Simulated Climate. J. Clim. 2014, 27, 2886–2911. [Google Scholar] [CrossRef]
  14. Sharma, S.; Gray, D.K.; Read, J.S.; O’reilly, C.M.; Schneider, P.; Qudrat, A.; Gries, C.; Stefanoff, S.; Hampton, S.E.; Hook, S. A global database of lake surface temperatures collected by in situ and satellite methods from 1985–2009. Sci. Data 2015, 2, 150008. [Google Scholar] [CrossRef] [PubMed]
  15. Lieberherr, G.; Wunderle, S. Lake Surface Water Temperature Derived from 35 Years of AVHRR Sensor Data for European Lakes. Remote Sens. 2018, 10, 990. [Google Scholar] [CrossRef]
  16. Willard, J.D.; Read, J.S.; Topp, S.; Hansen, G.J.A.; Kumar, V. Daily surface temperatures for 185,549 lakes in the conterminous United States estimated using deep learning (1980–2020). Limnol. Oceanogr. Lett. 2022, 7, 287–301. [Google Scholar] [CrossRef]
  17. Prats, J.; Reynaud, N.; Rebière, D.; Peroux, T.; Tormos, T.; Danis, P.-A. LakeSST: Lake Skin Surface Temperature in French inland water bodies for 1999–2016 from Landsat archives. Earth Syst. Sci. Data 2018, 10, 727–743. [Google Scholar] [CrossRef]
  18. Liu, B.; Wan, W.; Xie, H.; Li, H.; Zhu, S.; Zhang, G.; Wen, L.; Hong, Y. A long-term dataset of lake surface water temperature over the Tibetan Plateau derived from AVHRR 1981–2015. Sci. Data 2019, 6, 48. [Google Scholar] [CrossRef]
  19. Guo, L.; Zheng, H.; Wu, Y.; Fan, L.; Wen, M.; Li, J.; Zhang, F.; Zhu, L.; Zhang, B. An integrated dataset of daily lake surface water temperature over the Tibetan Plateau. Earth Syst. Sci. Data 2022, 14, 3411–3422. [Google Scholar] [CrossRef]
  20. Attiah, G.; Kheyrollah Pour, H.; Scott, K.A. Lake Surface Temperature Dataset in the North Slave Region Retrieved from Landsat Satellite Series–1984 to 2021. Earth Syst. Sci. Data Discuss. 2022, 2022, 1–37. [Google Scholar]
  21. Riffler, M.; Lieberherr, G.; Wunderle, S. Lake surface water temperatures of European Alpine lakes (1989–2013) based on the Advanced Very High Resolution Radiometer (AVHRR) 1 km data set. Earth Syst. Sci. Data 2015, 7, 1–17. [Google Scholar] [CrossRef]
  22. Pareeth, S.; Salmaso, N.; Adrian, R.; Neteler, M. Homogenised daily lake surface water temperature data generated from multiple satellite sensors: A long-term case study of a large sub-Alpine lake. Sci. Rep. 2016, 6, 31251. [Google Scholar] [CrossRef]
  23. Schwab, D.J.; Leshkevich, G.A.; Muhr, G.C. Automated Mapping of Surface Water Temperature in the Great Lakes. J. Great Lakes Res. 1999, 25, 468–481. [Google Scholar] [CrossRef]
  24. Woolway, R.I.; Anderson, E.J.; Albergel, C. Rapidly expanding lake heatwaves under climate change. Environ. Res. Lett. 2021, 16, 094013. [Google Scholar] [CrossRef]
  25. Notaro, M.; Bennington, V.; Lofgren, B. Dynamical Downscaling–Based Projections of Great Lakes Water Levels. J. Clim. 2015, 28, 9721–9745. [Google Scholar] [CrossRef]
  26. Huang, B.; Liu, C.; Banzon, V.; Freeman, E.; Graham, G.; Hankins, B.; Smith, T.; Zhang, H.-M. Improvements of the Daily Optimum Interpolation Sea Surface Temperature (DOISST) Version 2.1. J. Clim. 2021, 34, 2923–2939. [Google Scholar] [CrossRef]
  27. Freeman, E.; Woodruff, S.D.; Worley, S.J.; Lubker, S.J.; Kent, E.C.; Angel, W.E.; Berry, D.I.; Brohan, P.; Eastman, R.; Gates, L.; et al. ICOADS Release 3.0: A major update to the historical marine climate record. Int. J. Climatol. 2017, 37, 2211–2232. [Google Scholar] [CrossRef]
  28. Wong, A.P.S.; Wijffels, S.E.; Riser, S.C.; Pouliquen, S.; Hosoda, S.; Roemmich, D.; Gilson, J.; Johnson, G.C.; Martini, K.; Murphy, D.J.; et al. Argo Data 1999–2019: Two Million Temperature-Salinity Profiles and Subsurface Velocity Observations From a Global Array of Profiling Floats. Front. Mar. Sci. 2020, 7, 700. [Google Scholar] [CrossRef]
  29. Banzon, V.; Smith, T.M.; Chin, T.M.; Liu, C.; Hankins, W. A long-term record of blended satellite and in situ sea-surface temperature for climate monitoring, modeling and environmental studies. Earth Syst. Sci. Data 2016, 8, 165–176. [Google Scholar] [CrossRef]
  30. Zhong, Y.; Notaro, M.; Vavrus, S.J. Spatially variable warming of the Laurentian Great Lakes: An interaction of bathymetry and climate. Clim. Dyn. 2019, 52, 5833–5848. [Google Scholar] [CrossRef]
  31. Hersbach, H.; Bell, B.; Berrisford, P.; Biavati, G.; Horányi, A.; Muñoz Sabater, J.; Nicolas, J.; Peubey, C.; Radu, R.; Rozum, I.; et al. ERA5 hourly data on single levels from 1940 to present. In Copernicus Climate Change Service (C3S) Climate Data Store (CDS); Copernicus: Göttingen, Germany, 2023. [Google Scholar] [CrossRef]
  32. Simmons, A.; Hersbach, H.; Muñoz-Sabater, J.; Nicolas, J.; Vamborg, F.; Berrisford, P.; de Rosnay, P.; Willett, K.; Woollen, J. Low Frequency Variability and Trends in Surface Air Temperature and Humidity from ERA5 and Other Datasets; European Centre for Medium-Range Weather Forecasts: Reading, UK, 2021. [Google Scholar]
  33. Bryan, A.M.; Steiner, A.L.; Posselt, D.J. Regional modeling of surface-atmosphere interactions and their impact on Great Lakes hydroclimate. J. Geophys. Res. Atmos. 2015, 120, 1044–1064. [Google Scholar] [CrossRef]
  34. Mironov, D. Parameterization of Lakes in Numerical Weather Prediction: Description of a Lake Model; DWD: Offenbach, Germany, 2008. [Google Scholar]
  35. Sun, L.; Liang, X.-Z.; Xia, M. Developing the Coupled CWRF-FVCOM Modeling System to Understand and Predict Atmosphere-Watershed Interactions over the Great Lakes Region. J. Adv. Model. Earth Syst. 2020, 12, e2020MS002319. [Google Scholar] [CrossRef]
  36. Yousefi, A.; Toffolon, M. Critical factors for the use of machine learning to predict lake surface water temperature. J. Hydrol. 2022, 606, 127418. [Google Scholar] [CrossRef]
  37. Heddam, S.; Ptak, M.; Zhu, S. Modelling of daily lake surface water temperature from air temperature: Extremely randomized trees (ERT) versus Air2Water, MARS, M5Tree, RF and MLPNN. J. Hydrol. 2020, 588, 125130. [Google Scholar] [CrossRef]
  38. Jia, X.; Willard, J.; Karpatne, A.; Read, J.; Zwart, J.; Steinbach, M.; Kumar, V. Physics guided RNNs for modeling dynamical systems: A case study in simulating lake temperature profiles. In Proceedings of the 2019 SIAM International Conference on Data Mining, Calgery, AB, Canada, 2–4 May 2019; pp. 558–566. [Google Scholar]
  39. Jia, X.; Willard, J.; Karpatne, A.; Read, J.S.; Zwart, J.A.; Steinbach, M.; Kumar, V. Physics-guided machine learning for scientific discovery: An application in simulating lake temperature profiles. ACM/IMS Trans. Data Sci. 2021, 2, 1–26. [Google Scholar] [CrossRef]
  40. Liu, W.-C.; Chen, W.-B. Prediction of water temperature in a subtropical subalpine lake using an artificial neural network and three-dimensional circulation models. Comput. Geosci. 2012, 45, 13–25. [Google Scholar] [CrossRef]
  41. Quan, Q.; Hao, Z.; Xifeng, H.; Jingchun, L. Research on water temperature prediction based on improved support vector regression. Neural Comput. Appl. 2022, 34, 8501–8510. [Google Scholar] [CrossRef]
  42. Xiao, C.; Chen, N.; Hu, C.; Wang, K.; Xu, Z.; Cai, Y.; Xu, L.; Chen, Z.; Gong, J. A spatiotemporal deep learning model for sea surface temperature field prediction using time-series satellite data. Environ. Model. Softw. 2019, 120, 104502. [Google Scholar] [CrossRef]
  43. Hou, S.; Li, W.; Liu, T.; Zhou, S.; Guan, J.; Qin, R.; Wang, Z. D2CL: A dense dilated convolutional LSTM model for sea surface temperature prediction. IEEE J. Sel. Top. Appl. Earth Obs. Remote Sens. 2021, 14, 12514–12523. [Google Scholar] [CrossRef]
  44. Usharani, B. ILF-LSTM: Enhanced loss function in LSTM to predict the sea surface temperature. Soft Comput. 2022, 27, 1–13. [Google Scholar] [CrossRef]
  45. Pravallika, M.S.; Vasavi, S.; Vighneshwar, S. Prediction of temperature anomaly in Indian Ocean based on autoregressive long short-term memory neural network. Neural Comput. Appl. 2022, 34, 7537–7545. [Google Scholar] [CrossRef]
  46. Choi, H.-M.; Kim, M.-K.; Yang, H. Deep-learning model for sea surface temperature prediction near the Korean Peninsula. Deep. Sea Res. Part II Top. Stud. Oceanogr. 2023, 208, 105262. [Google Scholar] [CrossRef]
  47. Sener, E.; Terzi, O.; Sener, S.; Kucukkara, R. Modeling of water temperature based on GIS and ANN techniques: Case study of Lake Egirdir (Turkey). Ekoloji 2012, 21, 44–52. [Google Scholar] [CrossRef]
  48. Zhu, S.; Ptak, M.; Choiński, A.; Wu, S. Exploring and quantifying the impact of climate change on surface water temperature of a high mountain lake in Central Europe. Environ. Monit. Assess. 2020, 192, 7. [Google Scholar] [CrossRef]
  49. Read, J.S.; Jia, X.; Willard, J.; Appling, A.P.; Zwart, J.A.; Oliver, S.K.; Karpatne, A.; Hansen, G.J.A.; Hanson, P.C.; Watkins, W.; et al. Process-Guided Deep Learning Predictions of Lake Water Temperature. Water Resour. Res. 2019, 55, 9173–9190. [Google Scholar] [CrossRef]
  50. Liu, X.; Wilson, T.; Tan, P.-N.; Luo, L. Hierarchical LSTM framework for long-term sea surface temperature forecasting. In Proceedings of the 2019 IEEE International Conference on Data Science and Advanced Analytics (DSAA), Washington, DC, USA, 5–8 October 2019; pp. 41–50. [Google Scholar]
  51. Hao, Z.; Li, W.; Wu, J.; Zhang, S.; Hu, S. A Novel Deep Learning Model for Mining Nonlinear Dynamics in Lake Surface Water Temperature Prediction. Remote Sens. 2023, 15, 900. [Google Scholar] [CrossRef]
  52. Mai, J.; Shen, H.; Tolson, B.A.; Gaborit, É.; Arsenault, R.; Craig, J.R.; Fortin, V.; Fry, L.M.; Gauch, M.; Klotz, D.; et al. The Great Lakes Runoff Intercomparison Project Phase 4: The Great Lakes (GRIP-GL). Hydrol. Earth Syst. Sci. 2022, 26, 3537–3572. [Google Scholar] [CrossRef]
  53. Feng, X.; Ma, G.; Su, S.-F.; Huang, C.; Boswell, M.K.; Xue, P. A multi-layer perceptron approach for accelerated wave forecasting in Lake Michigan. Ocean. Eng. 2020, 211, 107526. [Google Scholar] [CrossRef]
  54. Hu, H.; van der Westhuysen, A.J.; Chu, P.; Fujisaki-Manome, A. Predicting Lake Erie wave heights and periods using XGBoost and LSTM. Ocean. Model. 2021, 164, 101832. [Google Scholar] [CrossRef]
  55. Wu, C.; Li, B.; Xiong, N. An Effective Machine Learning Scheme to Analyze and Predict the Concentration of Persistent Pollutants in the Great Lakes. IEEE Access 2021, 9, 52252–52265. [Google Scholar] [CrossRef]
  56. Xue, P.; Wagh, A.; Ma, G.; Wang, Y.; Yang, Y.; Liu, T.; Huang, C. Integrating Deep Learning and Hydrodynamic Modeling to Improve the Great Lakes Forecast. Remote Sens. 2022, 14, 2640. [Google Scholar] [CrossRef]
  57. Kayastha, M.B.; Liu, T.; Titze, D.; Havens, T.C.; Huang, C.; Xue, P. Great Lakes Lake Surface Temperature for 1979–2020 Derived From LSTM; Zenodo: Genève, Switzerland, 2023. [Google Scholar] [CrossRef]
  58. Bai, X.; Wang, J.; Schwab, D.J.; Yang, Y.; Luo, L.; Leshkevich, G.A.; Liu, S. Modeling 1993–2008 climatology of seasonal general circulation and thermal structure in the Great Lakes using FVCOM. Ocean. Model. 2013, 65, 40–63. [Google Scholar] [CrossRef]
  59. Saha, S.; Moorthi, S.; Pan, H.-L.; Wu, X.; Wang, J.; Nadiga, S.; Tripp, P.; Kistler, R.; Woollen, J.; Behringer, D.; et al. The NCEP Climate Forecast System Reanalysis. Bull. Am. Meteorol. Soc. 2010, 91, 1015–1058. [Google Scholar] [CrossRef]
  60. Hochreiter, S.; Schmidhuber, J. Long short-term memory. Neural Comput. 1997, 9, 1735–1780. [Google Scholar] [CrossRef]
  61. Saha, S.; Moorthi, S.; Wu, X.; Wang, J.; Nadiga, S.; Tripp, P.; Behringer, D.; Hou, Y.-T.; Chuang, H.-y.; Iredell, M.; et al. The NCEP Climate Forecast System Version 2. J. Clim. 2014, 27, 2185–2208. [Google Scholar] [CrossRef]
  62. Xue, P.; Schwab, D.J.; Hu, S. An investigation of the thermal response to meteorological forcing in a hydrodynamic model of Lake Superior. J. Geophys. Res. Ocean. 2015, 120, 5233–5253. [Google Scholar] [CrossRef]
  63. Huang, C.; Zhu, L.; Ma, G.; Meadows, G.A.; Xue, P. Wave Climate Associated With Changing Water Level and Ice Cover in Lake Michigan. Front. Mar. Sci. 2021, 8, 746916. [Google Scholar] [CrossRef]
  64. Abadi, M.; Agarwal, A.; Barham, P.; Brevdo, E.; Chen, Z.; Citro, C.; Corrado, G.S.; Davis, A.; Dean, J.; Devin, M. Tensorflow: Large-scale machine learning on heterogeneous distributed systems. arXiv 2016, arXiv:1603.04467. [Google Scholar]
  65. Zhong, Y.; Notaro, M.; Vavrus, S.J.; Foster, M.J. Recent accelerated warming of the Laurentian Great Lakes: Physical drivers. Limnol. Oceanogr. 2016, 61, 1762–1786. [Google Scholar] [CrossRef]
  66. Van Cleave, K.; Lenters, J.D.; Wang, J.; Verhamme, E.M. A regime shift in Lake Superior ice cover, evaporation, and water temperature following the warm El Niñ winter of 1997–1998. Limnol. Oceanogr. 2014, 59, 1889–1898. [Google Scholar] [CrossRef]
  67. Assel, R.A. The 1997 ENSO event and implication for North American Laurentian Great Lakes winter severity and ice cover. Geophys. Res. Lett. 1998, 25, 1031–1033. [Google Scholar] [CrossRef]
  68. Clites, A.H.; Wang, J.; Campbell, K.B.; Gronewold, A.D.; Assel, R.A.; Bai, X.; Leshkevich, G.A. Cold Water and High Ice Cover on Great Lakes in Spring 2014. Eos Trans. Am. Geophys. Union 2014, 95, 305–306. [Google Scholar] [CrossRef]
  69. Bronte, C.R.; Ebener, M.P.; Schreiner, D.R.; DeVault, D.S.; Petzold, M.M.; Jensen, D.A.; Richards, C.; Lozano, S.J. Fish community change in Lake Superior, 1970–2000. Can. J. Fish. Aquat. Sci. 2003, 60, 1552–1574. [Google Scholar] [CrossRef]
  70. Lynch, A.J.; Taylor, W.W.; Smith, K.D. The influence of changing climate on the ecology and management of selected Laurentian Great Lakes fisheries. J. Fish Biol. 2010, 77, 1764–1782. [Google Scholar] [CrossRef] [PubMed]
  71. Van Zuiden, T.M.; Sharma, S. Examining the effects of climate change and species invasions on Ontario walleye populations: Can walleye beat the heat? Divers. Distrib. 2016, 22, 1069–1079. [Google Scholar] [CrossRef]
  72. Collingsworth, P.D.; Bunnell, D.B.; Murray, M.W.; Kao, Y.-C.; Feiner, Z.S.; Claramunt, R.M.; Lofgren, B.M.; Höök, T.O.; Ludsin, S.A. Climate change as a long-term stressor for the fisheries of the Laurentian Great Lakes of North America. Rev. Fish Biol. Fish. 2017, 27, 363–391. [Google Scholar] [CrossRef]
  73. Alofs, K.; Lester, N.; Jackson, D. Ontario freshwater fish demonstrate differing range-boundary shifts in a warming climate. Divers. Distrib. 2014, 20, 123–136. [Google Scholar] [CrossRef]
  74. Cline, T.J.; Kitchell, J.F.; Bennington, V.; McKinley, G.A.; Moody, E.K.; Weidel, B.C. Climate impacts on landlocked sea lamprey: Implications for host-parasite interactions and invasive species management. Ecosphere 2014, 5, 1–13. [Google Scholar] [CrossRef]
  75. Arvola, L.; Palomäki, A.; Lehtinen, S.; Järvinen, M. Phytoplankton community structure and biomass in two basins of a boreal lake in relation to local weather conditions and North Atlantic oscillation. Int. Ver. Für Theor. Und Angew. Limnol. Verhandlungen 2002, 28, 700–704. [Google Scholar] [CrossRef]
  76. Jasser, I.; Arvola, L. Potential effects of abiotic factors on the abundance of autotrophic picoplankton in four boreal lakes. J. Plankton Res. 2003, 25, 873–883. [Google Scholar] [CrossRef]
  77. Arvola, L.; George, G.; Livingstone, D.M.; Järvinen, M.; Blenckner, T.; Dokulil, M.T.; Jennings, E.; Aonghusa, C.N.; Nõges, P.; Nõges, T.; et al. The Impact of the Changing Climate on the Thermal Characteristics of Lakes. In The Impact of Climate Change on European Lakes; George, G., Ed.; Springer: Dordrecht, The Netherlands, 2010; pp. 85–101. [Google Scholar]
  78. Adrian, R.; O’Reilly, C.M.; Zagarese, H.; Baines, S.B.; Hessen, D.O.; Keller, W.; Livingstone, D.M.; Sommaruga, R.; Straile, D.; Van Donk, E.; et al. Lakes as sentinels of climate change. Limnol. Oceanogr. 2009, 54, 2283–2297. [Google Scholar] [CrossRef]
  79. GLSEA_ACSPO_GCS. Available online: https://coastwatch.glerl.noaa.gov/erddap/files/GLSEA_ACSPO_GCS/ (accessed on 1 June 2023).
  80. Chen, R.; Wang, X.; Zhang, W.; Zhu, X.; Li, A.; Yang, C. A hybrid CNN-LSTM model for typhoon formation forecasting. GeoInformatica 2019, 23, 375–396. [Google Scholar] [CrossRef]
  81. Piccolroaz, S.; Toffolon, M.; Majone, B. A simple lumped model to convert air temperature into surface water temperature in lakes. Hydrol. Earth Syst. Sci. 2013, 17, 3323–3338. [Google Scholar] [CrossRef]
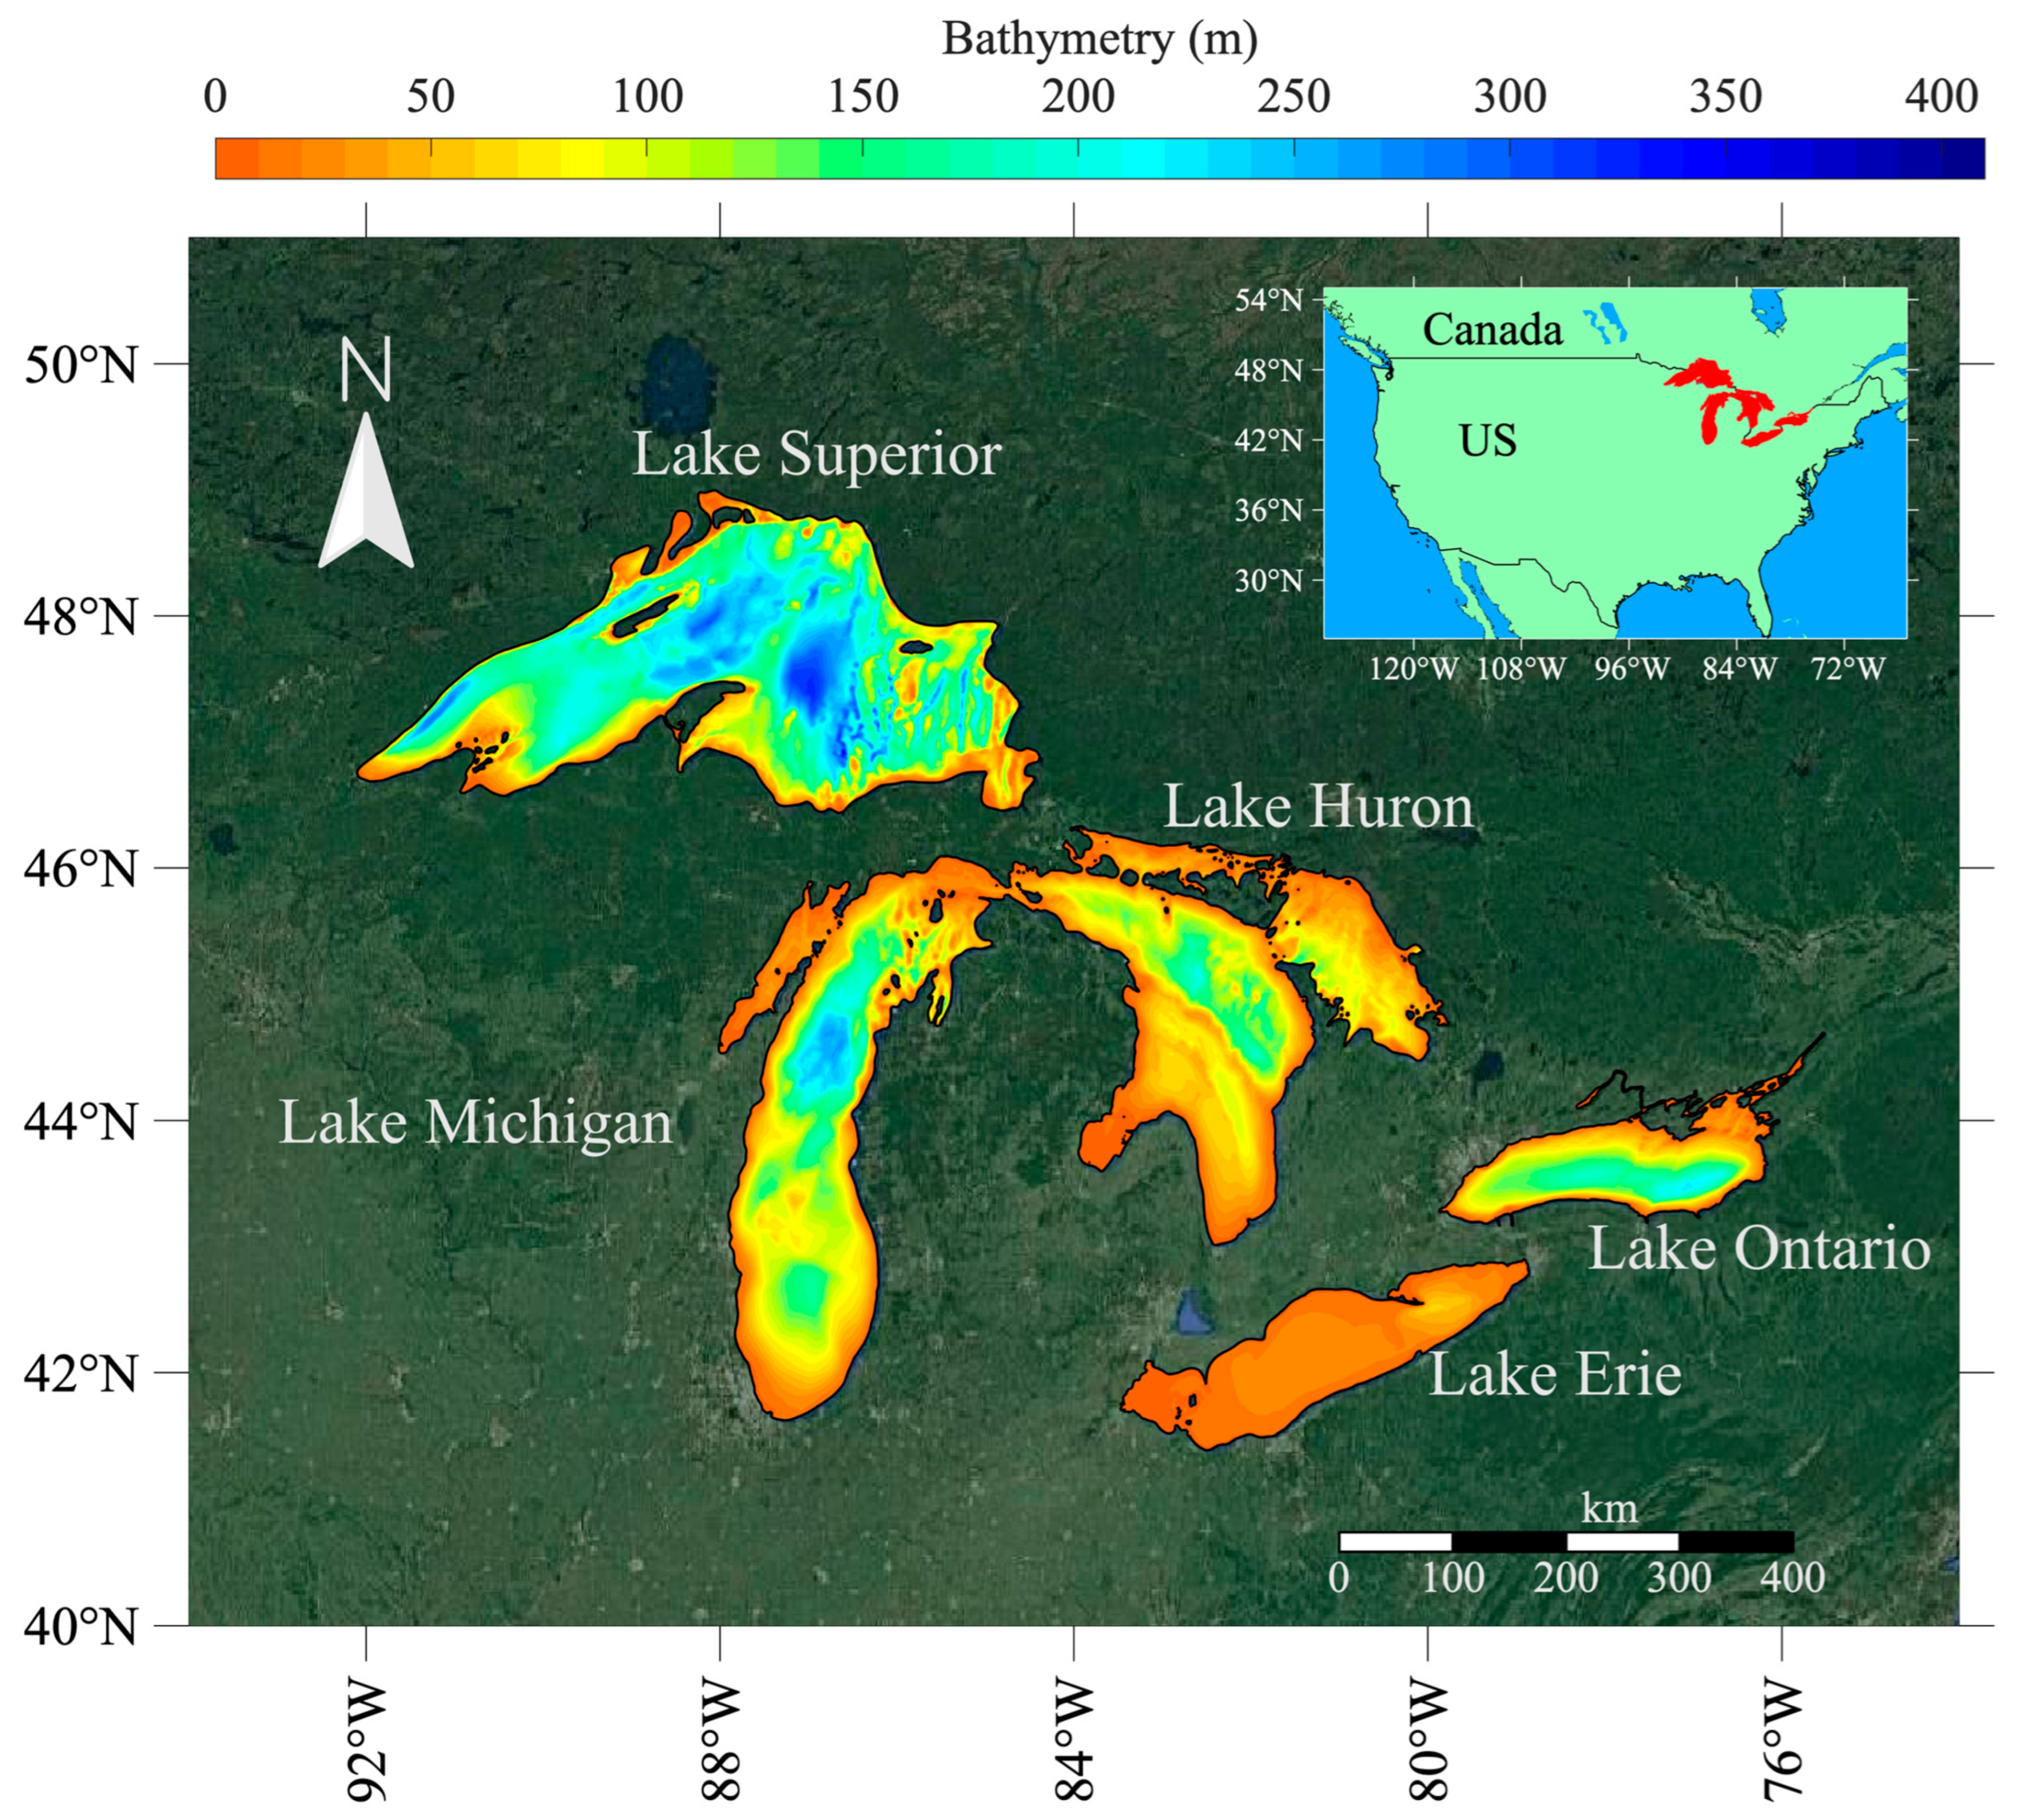
Figure 1. Bathymetry of the Great Lakes along with their location in the context of North America (shown in the inset).
Remotesensing 15 04253 g001
Figure 2. Schematic for the LST prediction process used in this study.
Remotesensing 15 04253 g002
Figure 3. Unstructured grid mesh (red dots) on which the LSTM model was trained and validated. The locations of the NDBC buoys are shown in blue plus symbols.
Remotesensing 15 04253 g003
Figure 4. LSTM architecture used for this study, with three LSTM layers, two batch normalization layers, and one dense layer. The number of neurons in each LSTM layer is denoted by na. X is the time series of historical feature data for five days (from t to t + 4). ht and ct are the short-term and long-term memories, respectively. w is the weights of the dense layer and Y is the predicted output from LSTM.
Remotesensing 15 04253 g004
Figure 5. LSTM performance evaluated by the MSE loss function on the training and validation samples for each lake.
Remotesensing 15 04253 g005
Figure 6. Comparison of daily climatology (1995–2020) of lake-wide average LST from LSTM and GLSEA. The dotted enveloping lines represent the interannual variability.
Remotesensing 15 04253 g006
Figure 7. Comparison of seasonal climatology (1995–2020) of spatial LST from LSTM and GLSEA. The LSTM-predicted LSTs are shown in the first column and the LSTs from GLSEA are shown in the second column. The differences between the LSTM-predicted LSTs and the LSTs from GLSEA are shown in the third column. The LSTs for winter, spring, summer, and fall seasons are shown in the first, second, third and fourth rows, respectively.
Remotesensing 15 04253 g007
Figure 8. Comparison of daily climatology (1995–2020) of LST from LSTM, GLSEA, and NDBC buoys. The statistics are calculated against GLSEA and NDBC buoys and are presented in that order. The dotted enveloping lines represent the interannual variability.
Remotesensing 15 04253 g008
Figure 9. Comparison of daily LST (1995–2020) box plots from LSTM, GLSEA, and NDBC buoys.
Remotesensing 15 04253 g009
Figure 10. Comparison of daily climatology (1982–1994) of lake-wide average LST from LSTM and OISST. The dotted enveloping lines represent the interannual variability.
Remotesensing 15 04253 g010
Figure 11. Seasonal climatology (1982–1994) of spatial LST from LSTM and OISST. The LSTM-predicted LSTs are shown in the first column and the LSTs from OISST are shown in the second column. The LSTs for winter, spring, summer, and fall seasons are shown in the first, second, third and fourth rows, respectively.
Remotesensing 15 04253 g011
Figure 12. Comparison of daily climatology of LST at buoy locations from LSTM (1979–1994), OISST (1982–1994), and NDBC buoys (1979–1994). The statistics are calculated against OISST and NDBC buoys and are presented in that order. The dotted enveloping lines represent the interannual variability.
Remotesensing 15 04253 g012
Figure 13. Comparison of daily LST box plots from LSTM (1979–1994), OISST (1982–1994), and NDBC buoys (1979–1994). Buoy 45012 has no observation data for 1979–1994.
Remotesensing 15 04253 g013
Figure 14. Changes in seasonal climatology of LST from LSTM, GLSEA, and OISST by comparing two time periods on either side of the 1997–1998 regime shift. The changes between the 1998–2020 mean LST and 1995–1997 mean LST are shown for LSTM (first row), GLSEA (second row), and OISST (third row). The changes between the 1998–2020 mean LST and 1982–1997 mean LST are shown for LSTM (fourth row) and OISST (fifth row). The changes in winter, spring, summer, and fall seasons are shown in the first, second, third, and fourth columns, respectively. The black dots and the corresponding numbers represent the changes calculated using the NDBC buoy data.
Remotesensing 15 04253 g014
Table 1. Physical features of the Great Lakes.
LakeElevation (m)Average Depth (m)Maximum Depth (m)Volume (km3)Water Surface Area (km2)
Superior18314940612,23282,097
Michigan17685281491857,753
Huron17659229353859,565
Erie173196448325,655
Ontario7486244163919,009
Table 2. The optimal values for the hyperparameters used in the LSTM models.
HyperparametersOptimal Value
OptimizerAdam
LSTM layers3
Activation units32, 16, 8
Activation functiontanh
Dropout0.2
Learning rate0.001
Epochs500
Batch Size2048
Table 3. Number of training and testing samples for each lake.
LakeNumber of Training SamplesNumber of Validation Samples
Superior45,832,20411,458,051
Michigan43,781,71610,945,429
Huron60,299,53615,074,884
Erie46,401,78411,600,446
Ontario53,996,18413,499,046
Table 4. Accuracy of LSTM during validation for each lake.
LakeMean of Absolute Error (°C)Mean of Squared Error (°C2)Median of Absolute Error (°C)R2 Score
Superior0.881.630.610.95
Michigan0.991.80.760.97
Huron0.941.830.650.97
Erie0.851.30.650.98
Ontario1.082.070.870.97
Table 5. Performance statistics of LSTM against GLSEA and NDBC buoys using a continuous time series spanning the training period (1995–2020). LSTM is compared against GLSEA for both the lake-wide average LST and buoy location LST.
Comparison with GLSEAComparison with NDBC
CorrelationBias (°C) RMSE (°C)CorrelationBias (°C) RMSE (°C)
Superior0.99−0.190.76---
Michigan1.000.030.52---
Huron1.00−0.250.77---
Erie1.00−0.020.60---
Ontario1.000.020.58---
450010.98−0.080.910.980.431.42
450020.99−0.241.070.980.371.29
450030.98−0.201.280.970.281.65
450040.98−0.180.930.960.191.67
450050.99−0.061.020.98−0.081.02
450060.980.141.110.970.651.81
450070.99−0.331.020.980.181.14
450080.99−0.371.270.98−0.391.42
450120.99−0.050.970.970.161.22
Table 6. Performance statistics of LSTM against OISST and NDBC buoys using a continuous time series spanning 1982–1994 for OISST and 1979–1994 for NDBC buoys. LSTM is compared against OISST for both the lake-wide average LST and buoy location LST. Buoy 45,012 has no observation data for 1979–1994.
Comparison with OISSTComparison with NDBC
CorrelationBias (°C) RMSE (°C)CorrelationBias (°C) RMSE (°C)
Superior0.950.591.55---
Michigan0.980.511.50---
Huron0.980.221.31---
Erie0.990.301.36---
Ontario0.980.381.32---
450010.970.351.040.931.362.03
450020.980.281.200.960.431.52
450030.980.261.320.931.422.66
450040.970.300.950.930.941.86
450050.990.041.030.92−0.401.49
450060.960.691.480.931.292.32
450070.990.301.070.980.541.32
450080.990.121.050.970.201.49
450120.990.250.98---
Disclaimer/Publisher’s Note: The statements, opinions and data contained in all publications are solely those of the individual author(s) and contributor(s) and not of MDPI and/or the editor(s). MDPI and/or the editor(s) disclaim responsibility for any injury to people or property resulting from any ideas, methods, instructions or products referred to in the content.