Article

Differences Evaluation among Three Global Remote Sensing SDL Products

1
Faculty of Geosciences and Environmental Engineering, Southwest Jiaotong University, Chengdu 611756, China
2
Sichuan Swjtu Railway Development Co., Ltd., Chengdu 611756, China
*
Author to whom correspondence should be addressed.
Remote Sens. 2023, 15(17), 4244; https://doi.org/10.3390/rs15174244
Submission received: 28 July 2023 / Revised: 24 August 2023 / Accepted: 26 August 2023 / Published: 29 August 2023
(This article belongs to the Section Earth Observation Data)

Abstract

:
At present, a variety of global remote sensing surface downwelling longwave radiation (SDL) products are used for atmospheric science research; however, there are few studies on the quantitative evaluation of differences among different SDL products. In order to evaluate the differences among different SDL products quantitatively, we have selected three commonly used SDL products—Clouds and the Earth’s Radiant Energy System-Synoptic Radiative Fluxes and Clouds (CERES-SYN), the European Centre for Medium Range Weather Forecasts-Surface Radiation Budget (ECMWF-SRB) and the Global Energy and Water Exchanges Project-Surface Radiation Budget (GEWEX-SRB)—to comprehensively study in this paper. The results show that there are significant differences among the three SDL products in some areas, such as in the Arctic, the Antarctic, the Sahara, the Tibet Plateau, and Greenland. The maximum absolute root mean square error (RMSEab) in these areas is greater than 20 Wm−2, the maximum relative root mean square error (RMSEre) is greater than 20%, the maximum and minimum absolute mean bias error (MBEab) are about 20 Wm−2 and −20 Wm−2, respectively, and the maximum and minimum relative mean bias error (MBEre) are about 10% and −10%, respectively. Among the three SDL products, the difference between the ECMWF-SRB and GEWEX-SRB is the most significant. In addition, this paper also analyzed the differences among different SDL products based on three aspects. Firstly, the differences among the three SDL products show that there is significant seasonality, and the differences among different months may vary greatly. However, the differences are not sensitive to years. Secondly, there are some differences in cloud-forcing radiative fluxes (CFRFs) of different SDL products, which is also an important factor affecting the difference between different SDL products. Finally, in the process of converting high temporal resolution SDL products into monthly SDL products, data processing also affects the difference between different SDL products.

1. Introduction

The surface downwelling longwave radiation (SDL), as one of the four components of a surface radiation budget (the other three surface radiation components are the surface upwelling longwave radiation (SUL), the surface downwelling shortwave radiation (SDS) and the surface upwelling shortwave radiation (SUS), respectively [1]) plays an important role in weather change, climate monitoring, and the study of earth–atmosphere system interaction [2,3,4,5].
Currently, there are two methods available for measuring SDL, which include real-time measurement by ground observation networks and retrieval using satellite remote sensing images. For the former, there are several well-known ground observation networks that measure SDL; for example, the Coordinated Energy and Water Cycle Observations Project (CEOP), the Surface Radiation Budget Network (SURFRAD), the Baseline Surface Radiation Network (BSRN) and the Greenland Climate Network (GC-Net) are all popular ground observation networks [2,3,4,5,6,7,8,9]. The SDL measured by ground observation networks has the advantage of high precision, which can be used as the reference for the SDL retrieved based on remote sensing images. However, the wide application of ground observation networks in SDL measurement is limited due to their restricted observation range and high maintenance costs.
Due to satellites, remote sensing has the advantages of a huge observation scope and a large information capacity, and it makes up for the limited measurement space range of the ground observation network; the method of SDL retrieval based on satellite remote sensing images is widely used. At present, there are many algorithms for SDL retrieval by using remote sensing images [4,8,10,11,12,13,14], some of which are commercialized and used to produce SDL products, and a variety of SDL products, such as the Clouds and the Earth’s Radiant Energy System-Synoptic Radiative Fluxes and Clouds (CERES-SYN), the European Centre for Medium Range Weather Forecasts-Surface Radiation Budget (ECMWF-SRB), the International Satellite Cloud Climatology Project-Flux Data (ISCCP-FD), and the Global Energy and Water Exchanges Project-Surface Radiation Budget (GEWEX-SRB), have been widely applied to atmospheric research. In previous studies, numerous scholars have evaluated the accuracy of existing radiation products in detail. In 2006, Yang et al. used instrument radiation data in the Tibet Plateau to evaluate the accuracy of the surface radiative fluxes from the GEWEX-SRB and ISCCP-FD. The findings reveal a significant underestimation of shortwave radiative fluxes from the GEWEX-SRB and longwave radiative fluxes from the ISCCP-FD when compared to surface radiative fluxes measured using ground instruments [15]. In 2009, Gui et al. evaluated the accuracy of the surface radiative fluxes from the Clouds and the Earth’s Radiant Energy System-Gridded Radiative Fluxes and Clouds (CERES-FSW) in combination with the ground instrument observation data from the Tibet Plateau. The results reveal a small deviation between the upwelling and downwelling longwave radiative fluxes from the CERES-FSW and the ground observation data, with a slight underestimation observed. However, there is a relatively large deviation between the shortwave radiative fluxes from the CERES-FSW and the ground observation data [16]. In 2010, Gui et al. evaluated the accuracy of longwave radiative fluxes from the GEWEX-SRB, ISCCP-FD and CERES-FSW in combination with the Coordinated Enhanced Observing Period Asian-Australian Monsoon Experiments-Tibet (CEOP-Tibet), SURFRAD and the Asian network of flux stations (AsiaFlux) [17]. The results show that the SDL from the ISCCP-FD is overestimated and the SUL from the CERES-FSW is underestimated under all sky conditions compared with the ground observation data. However, there is no consistent trend in the longwave radiative fluxes from the GEWEX-SRB. In addition, there are many other scholars that have evaluated the accuracy of the surface radiative fluxes of different radiation products in different areas; details can be found in [18,19,20,21,22,23].
In the existing research on the accuracy evaluation of radiation products, most of which takes the ground observation data as a reference to compare with the radiation products. Although this method can effectively evaluate the accuracy of radiation products, it cannot directly evaluate the difference between different radiation products. Moreover, the mutual verification conducted by developers between different radiation products might not be comprehensive and detailed enough to provide a comprehensive understanding of the differences. Systematically evaluating the difference between different radiation products is a direct and effective method for comparing the difference between different algorithms, and it can provide an important reference for improving the accuracy of subsequent radiation products. Therefore, this paper will quantitatively evaluate the mutual differences among three SDL products: the CERES-SYN, the ECMWF-SRB, and the GEWEX-SRB.
This paper is organized as follows. Section 2 briefly introduces the three SDL products, i.e., CERES-SYN, ECMWF-SRB, GEWEX-SRB, and the method of evaluating the differences among the three SDL products. In Section 3, the differences among the three SDL products are presented. The time series analysis, the impact of cloud-forcing radiative fluxes (CFRFs) and the data processing for the differences among the three SDL products are presented in Section 4. The summary and conclusions of this investigation are given in Section 5.

2. SDL Products and Evaluation Methods

2.1. SDL Products

2.1.1. CERES-SYN

CERES-SYN is one of the CERES products and is composed of surface flux, TOA flux, and other atmospheric products, and it plays an important role in the field of atmospheric remote sensing [24,25,26]. CERES-SYN uses the Langley Fu-Liou radiative transfer model [27,28] and combines cloud properties derived from 16 geostationary satellites (GEO) and the Moderate-Resolution Imaging Spectroradiometer (MODIS) to compute the surface fluxes [29]. The difference between the cloud properties derived from GEO and MODIS can be minimized by the cloud algorithms of GEO. CERES-SYN contains a variety of radiation products with different time scales, and its temporal resolution includes monthly, monthly 1 hourly, daily, 3 hourly and hourly, which have been gridded into 1° × 1° spatial units. However, the spatial resolution of CERES-SYN decreases from the equator to the poles. The spatial resolution in the low-latitude areas is 1° × 1° (latitude × longitude), and that in the high latitude areas is 1° × 360°. In addition, the SDL product information from CERES-SYN used in this paper can be seen in Table 1.

2.1.2. ECMWF-SRB

The ECMWF is an international weather forecasting research and operational organization located throughout the world and supported by 34 countries. The SDL fluxes under all sky conditions from the ECMWF-SRB are calculated from the monthly SDL measurements under clear sky conditions with the cloud correction term. The monthly SDL fluxes under clear sky conditions can be derived from ERA-Interim, which is the global atmospheric reanalysis produced by the ECMWF [30,31,32], and the cloud correction term can be calculated by the cloud correction factor multiplied by the cloud cover derived from the AVHRR images. The ECMWF-SRB can provide users with global SDL products from 1982 to 2015. The spatial resolution of the SDL products is 0.25° × 0.25°, the temporal resolution is the monthly mean, and the version used in this paper is 2.0, which can be found in Table 1.

2.1.3. GEWEX-SRB

The GEWEX is an international organization that studies climate anomalies, works to reduce and prevent disasters, addresses long-term forecasts, and ensures food production, and was established by the International Science Council and the World Meteorological Organization [18,33,34,35]. The GEWEX-SRB uses two algorithms to compute the surface radiation budget. One is the Fu et al. thermal infrared radiative transfer code [28], and the other is the Langley parameterized algorithm [10,36]. The sources of input parameters, such as the cloud parameters, temperature, moisture profiles, column ozone and surface emissivites, can be referred to in [37,38,39]. The temporal resolution of the SDL products of GEWEX-SRB includes monthly, monthly 3 hourly, daily and 3 hourly, and have been gridded into 1° × 1°spatial units. The spatial resolution of the GEWEX-SRB is same as that of the CERES-SYN, which decreases from the equator to the poles. In addition, the SDL product information from the GEWEX-SRB used in this paper can be seen in Table 1.

2.2. Evaluation Methods

Before evaluating the differences among the three SDL products, namely CERES-SYN, ECMWF-SRB and GEWEX-SRB, quality control or an inspection of the three SDL products is required first. In order to improve the reliability of the research results, we use the 3 times standard deviation as the valid range of SDL product dataset and delete the SDL product data that are greater than 3 times standard deviation.
In order to evaluate the differences among the three commonly used SDL products, the investigation in this paper selected the monthly SDL products for comparative analysis. Due to the fact that the time ranges of the monthly subsets available in the three SDL products are different, and in order to use as much data as possible to conduct the evaluation, the time periods of the SDL products selected in this paper are as follows. The product time period for the SDL difference evaluation between CERES-SYN and ECMWF-SRB is from 2001 to 2015, the time period between CERES-SYN and GEWEX-SRB is from 2001 to 2009, and the time period between ECMWF-SRB and GEWEX-SRB is from1988 to 2009. In addition, this paper used two methods to evaluate the differences among the three SDL products. Firstly, we analyzed the global SDL products over many years so as to study the differences between different SDL products worldwide. Additionally, this method can also investigate the distribution of the differences in different areas. Secondly, we selected six different special areas and then selected multiple sites from these special areas for specific analysis. The purpose of this method is to study the seasonal differences between different SDL products in special areas and study the discreteness between different SDL products. The six special areas selected in this paper are the Arctic, Antarctic, Sahara, Tibet Plateau, Amazon Basin and Greenland. The location of each special area and the number of sites in each special area can be seen in Figure 1 and Table 2. It is worth noting that the sites selected in Figure 1 do not correspond to the grid points of an SDL product, but they determine the grid of a SDL product according to the geographical location of the selected sites. Since the spatial resolution of the CERES-SYN and GEWEX-SRB SDL products gradually decreases with the increase in latitude, some sites in polar regions may be located in the same SDL product grid. In addition, the difference indices used in this paper include coefficient of determination (R2), absolute root mean square error (RMSEab), relative root mean square error (RMSEre), absolute mean bias error (MBEab) and relative mean bias error (MBEre), and these difference indices can be calculated by (1)–(5).
R 2 = [ i = 1 n ( x i x i ¯ ) ( y i y i ¯ ) ] 2 i = 1 n ( x i x i ¯ ) 2 i = 1 n ( y i y i ¯ ) 2
R M S E a b = i = 1 n ( x i y i ) 2 n
R M S E r e = i = 1 n ( x i y i ) 2 n / i = 1 n y i n × 100
M B E a b = i = 1 n ( x i y i ) n
M B E r e = i = 1 n ( x i y i ) n / i = 1 n y i n × 100
where x i and y i denote the radiation fluxes of different SDL products, respectively. x ¯ i and y ¯ i denote the mean radiation fluxes of the different SDL products, respectively. n denotes the number of samples.

3. Differences Results

3.1. CERES-SYN vs. ECMWF-SRB

When evaluating the difference between the CERES-SYN and ECMWF-SRB SDL products, we selected the monthly SDL products of the CERES-SYN and ECMWF-SRB from 2001 to 2015 to calculate the difference indices mentioned above. It is worth noting that, here, we have selected the SDL product of the CERES-SYN as the reference. The difference between the CERES-SYN and the ECMWF-SRB SDL products can be seen in Figure 2a–e, where Figure 2a–e shows R2, RMSEab, RMSEre, MBEab and MBEre, respectively. It can be seen from Figure 2a that the correlation between the CERES-SYN and the ECMWF-SRB SDL products is low near the equator, around 60° south latitude and some areas of the Antarctic; R2 is generally less than 0.6 in these areas, while it is relatively high in other areas, and R2 is generally more than 0.85. According to Figure 2b, we can find that the RMSEab between the CERES-SYN and the ECMWF-SRB SDL products are larger in the Arctic, Antarctic, Sahara, Tibet Plateau, Greenland, and the maximum RMSEab values in these areas are more than 20 Wm−2, while in other areas, especially in the ocean, the RMSEab values are relatively small, about 0–5 Wm−2. However, the RMSEre values are only large in the Antarctic, Tibet Plateau and some areas of Greenland, which are about 15%–20%. In other areas, the RMSEre values are about 0–10%. The global distribution of MBEab and MBEre are consistent with each other and can be found in Figure 2d,e. In the Antarctic, Sahara, Tibet Plateau and Greenland, the SDL of the ECMWF-SRB is significantly smaller than that of the CERES-SYN, and the MBEab and MBEre in these areas are about −10 Wm−2–−20 Wm−2 and −5%–−10%, respectively. In the Arctic, the SDL of the ECMWF-SRB is slightly larger than that of the CERES-SYN, and the MBEab and MBEre in this area are about 5 Wm−2 and 3%, respectively. In other areas, the MBEab and MBEre are both about 0.
Figure 3 shows the mean values of the two SDL products from the CERES-SYN and ECMWF-SRB at the sites in each special area mentioned in Section 2.2. The red solid line and blue solid line are the mean SDL fluxes of the CERES-SYN and ECMWF-SRB in each area, respectively, and Figure 3a–f is the special areas of the Arctic, Antarctic, Sahara, Tibet Plateau, Amazon Basin and Greenland, respectively. Due to the large differences in SDL fluxes in different areas, and in order to observe the difference clearly in each area, the range of the Y coordinate axes in Figure 3 have not been unified. We can see from Figure 3 that the differences in the two SDL products in the Arctic and Sahara areas are small. In the Antarctic, Tibet Plateau and Greenland, the annual maximum values of the two SDL products are consistent with each other. However, there is a notable discrepancy between the two SDL products during the annual minimum values, with the CERES-SYN showing higher SDL fluxes compared to the ECMWF-SRB. In the Amazon basin, the overall difference between the two SDL products is relatively large, and the CERES-SYN shows that its SDL fluxes decrease with time, while the SDL fluxes of the ECMWF-SRB are relatively stable. In addition, we can also see from Figure 3 that the SDL fluxes in the Arctic and the Sahara are larger than that of those in Antarctic; this is why the RMSEab values are large and the RMSEre values are small in the Arctic and the Sahara.
To investigate the differences between the SDL products of the CERES-SYN and ECMWF-SRB, density scatter diagrams were created for the two SDL products at the sites in each special area mentioned in Section 2.2. In addition, this paper also calculated the overall difference indices in each special area. The details of the density scatter diagrams and the overall difference indices in each special area can be seen in Figure 4 and Table 3, and Figure 4a–f is the special areas of the Arctic, Antarctic, Sahara, Tibet Plateau, Amazon Basin and Greenland, respectively. In Figure 4, the color represents the data density, and the color bar denotes normalized density. Due to the large differences in SDL fluxes in different areas, and in order to observe the discreteness in each area clearly, the range of the Y coordinate axes in Figure 4 have not been unified. The SDL fluxes of the ECMWF-SRB are larger than those of the CERES-SYN in the Arctic and the Amazon basins, which can be deduced from Figure 4. However, in fact, the SDL fluxes of the ECMWF-SRB are slightly larger than those of the CERES-SYN in the Amazon Basin, which can be found in Table 3. Moreover, in the Amazon basin, the correlation between the SDL products of the CERES-SYN and ECMWF-SRB is low, and the R2 is only 0.17. In other areas, the SDL fluxes of the ECMWF-SRB are smaller than those of the CERES-SYN. In addition, among the six special areas selected in this paper, the SDL fluxes of the CERES-SYN and ECMWF-SRB have the largest difference in the Tibet Plateau, the RMSEab and RMSEre are 31.85 Wm−2 and 14.30%, and the MBEab and MBEre are −26.39 Wm−2 and −11.82%, respectively.

3.2. CERES-SYN vs. GEWEX-SRB

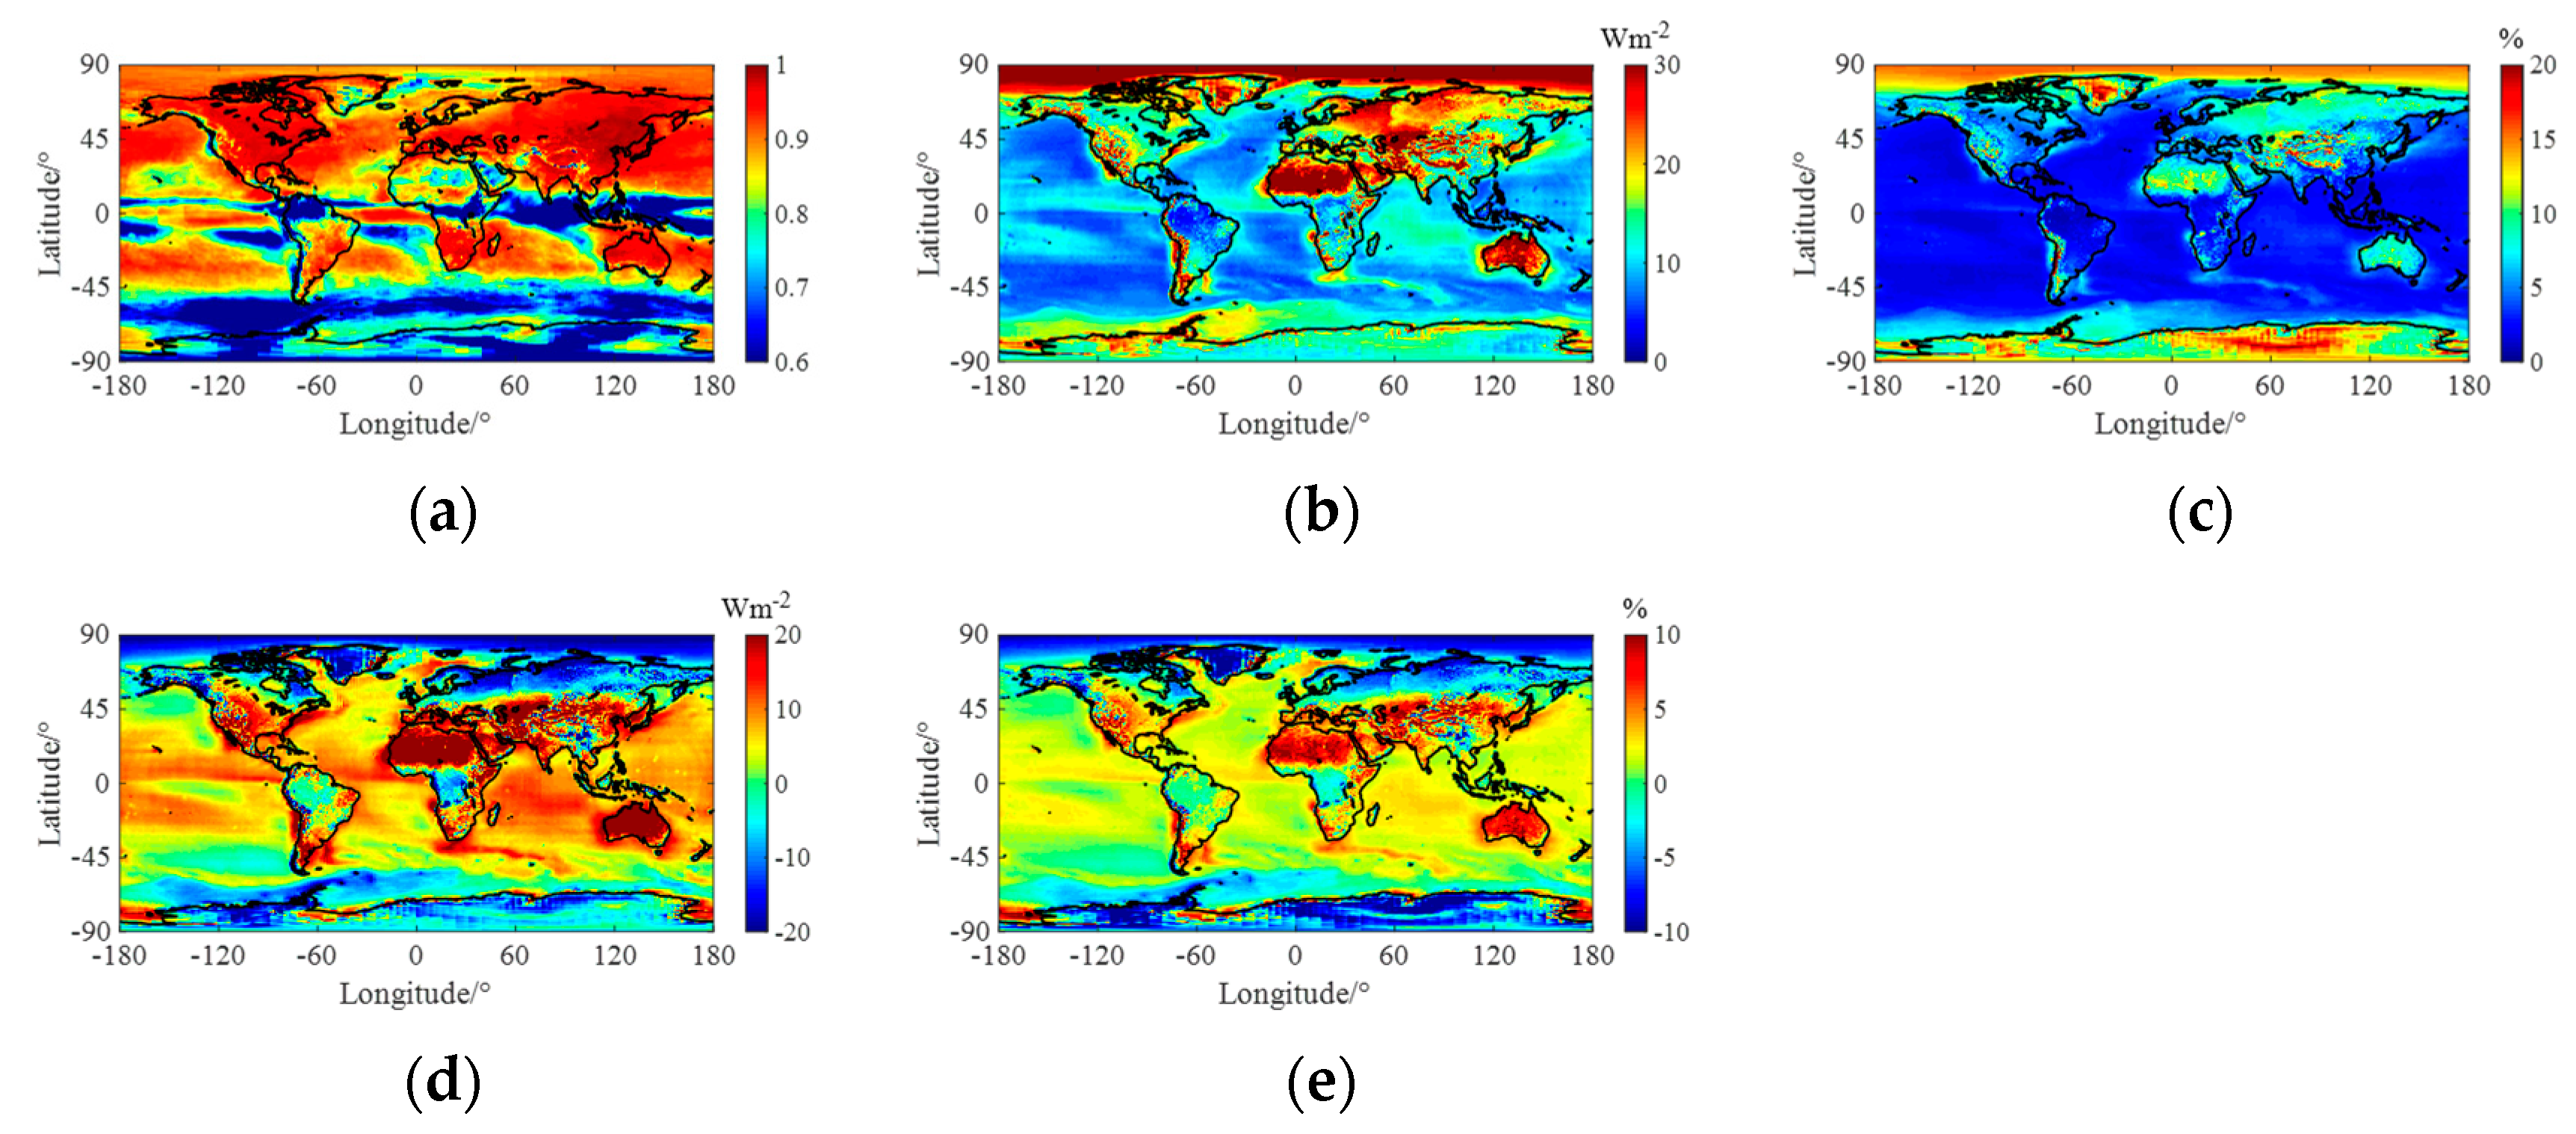
In this study, we have chosen the SDL products from the CERES-SYN and GEWEX-SRB from 2001 to 2009 to conduct a comparative analysis, and we calculated various difference indices to assess the discrepancies between these two datasets. Here, we have also selected the SDL product from the CERES-SYN as a reference. Figure 5a–e shows the R2, RMSEab, RMSEre, MBEab and MBEre between the CERES-SYN and GEWEX-SRB SDL products, respectively. We can find that the R2 between the CERES-SYN and GEWEX-SRB SDL products is less than 0.6 near the equator, in parts of the Arctic, and in the area between 60° and 90° south latitude; in the other areas, R2 is generally more than 0.85, which is basically same as the correlation between the CERES-SYN and ECMWF-SRB SDL products. It can be seen from Figure 5b that except for the oceans in mid–low latitudes, RMSEab values are relatively large in other areas, especially in the Arctic, Antarctic, Sahara, Tibet Plateau, Greenland and Australia, where the RMSEab values are larger than 20 Wm−2. However, the distribution of the RMSEab and RMSEre values shows significant differences, as observed in Figure 5b,c. Figure 5c shows that the RMSEre value is about 20% in the Antarctic and some areas of Greenland, while in other areas, especially in the ocean, the RMSEab values are relatively small, about 0–10%. Figure 5d,e shows that the distribution of the MBEab is consistent with the MBEab, but there are significant differences with the distribution of the MBEab, which is shown in Figure 2d. In the Arctic, Antarctic and Tibet Plateau, the SDLs of the GEWEX-SRB are significantly smaller than those of the CERES-SYN, and the MBEab and MBEre in these areas are about −20 Wm−2 and −10%, respectively. In Sahara and Australia, the SDLs of the GEWEX-SRB is larger than those of the CERES-SYN, and the MBEab and MBEre in these areas are about 10 Wm−2–20 Wm−2 and 5%–8%, respectively.
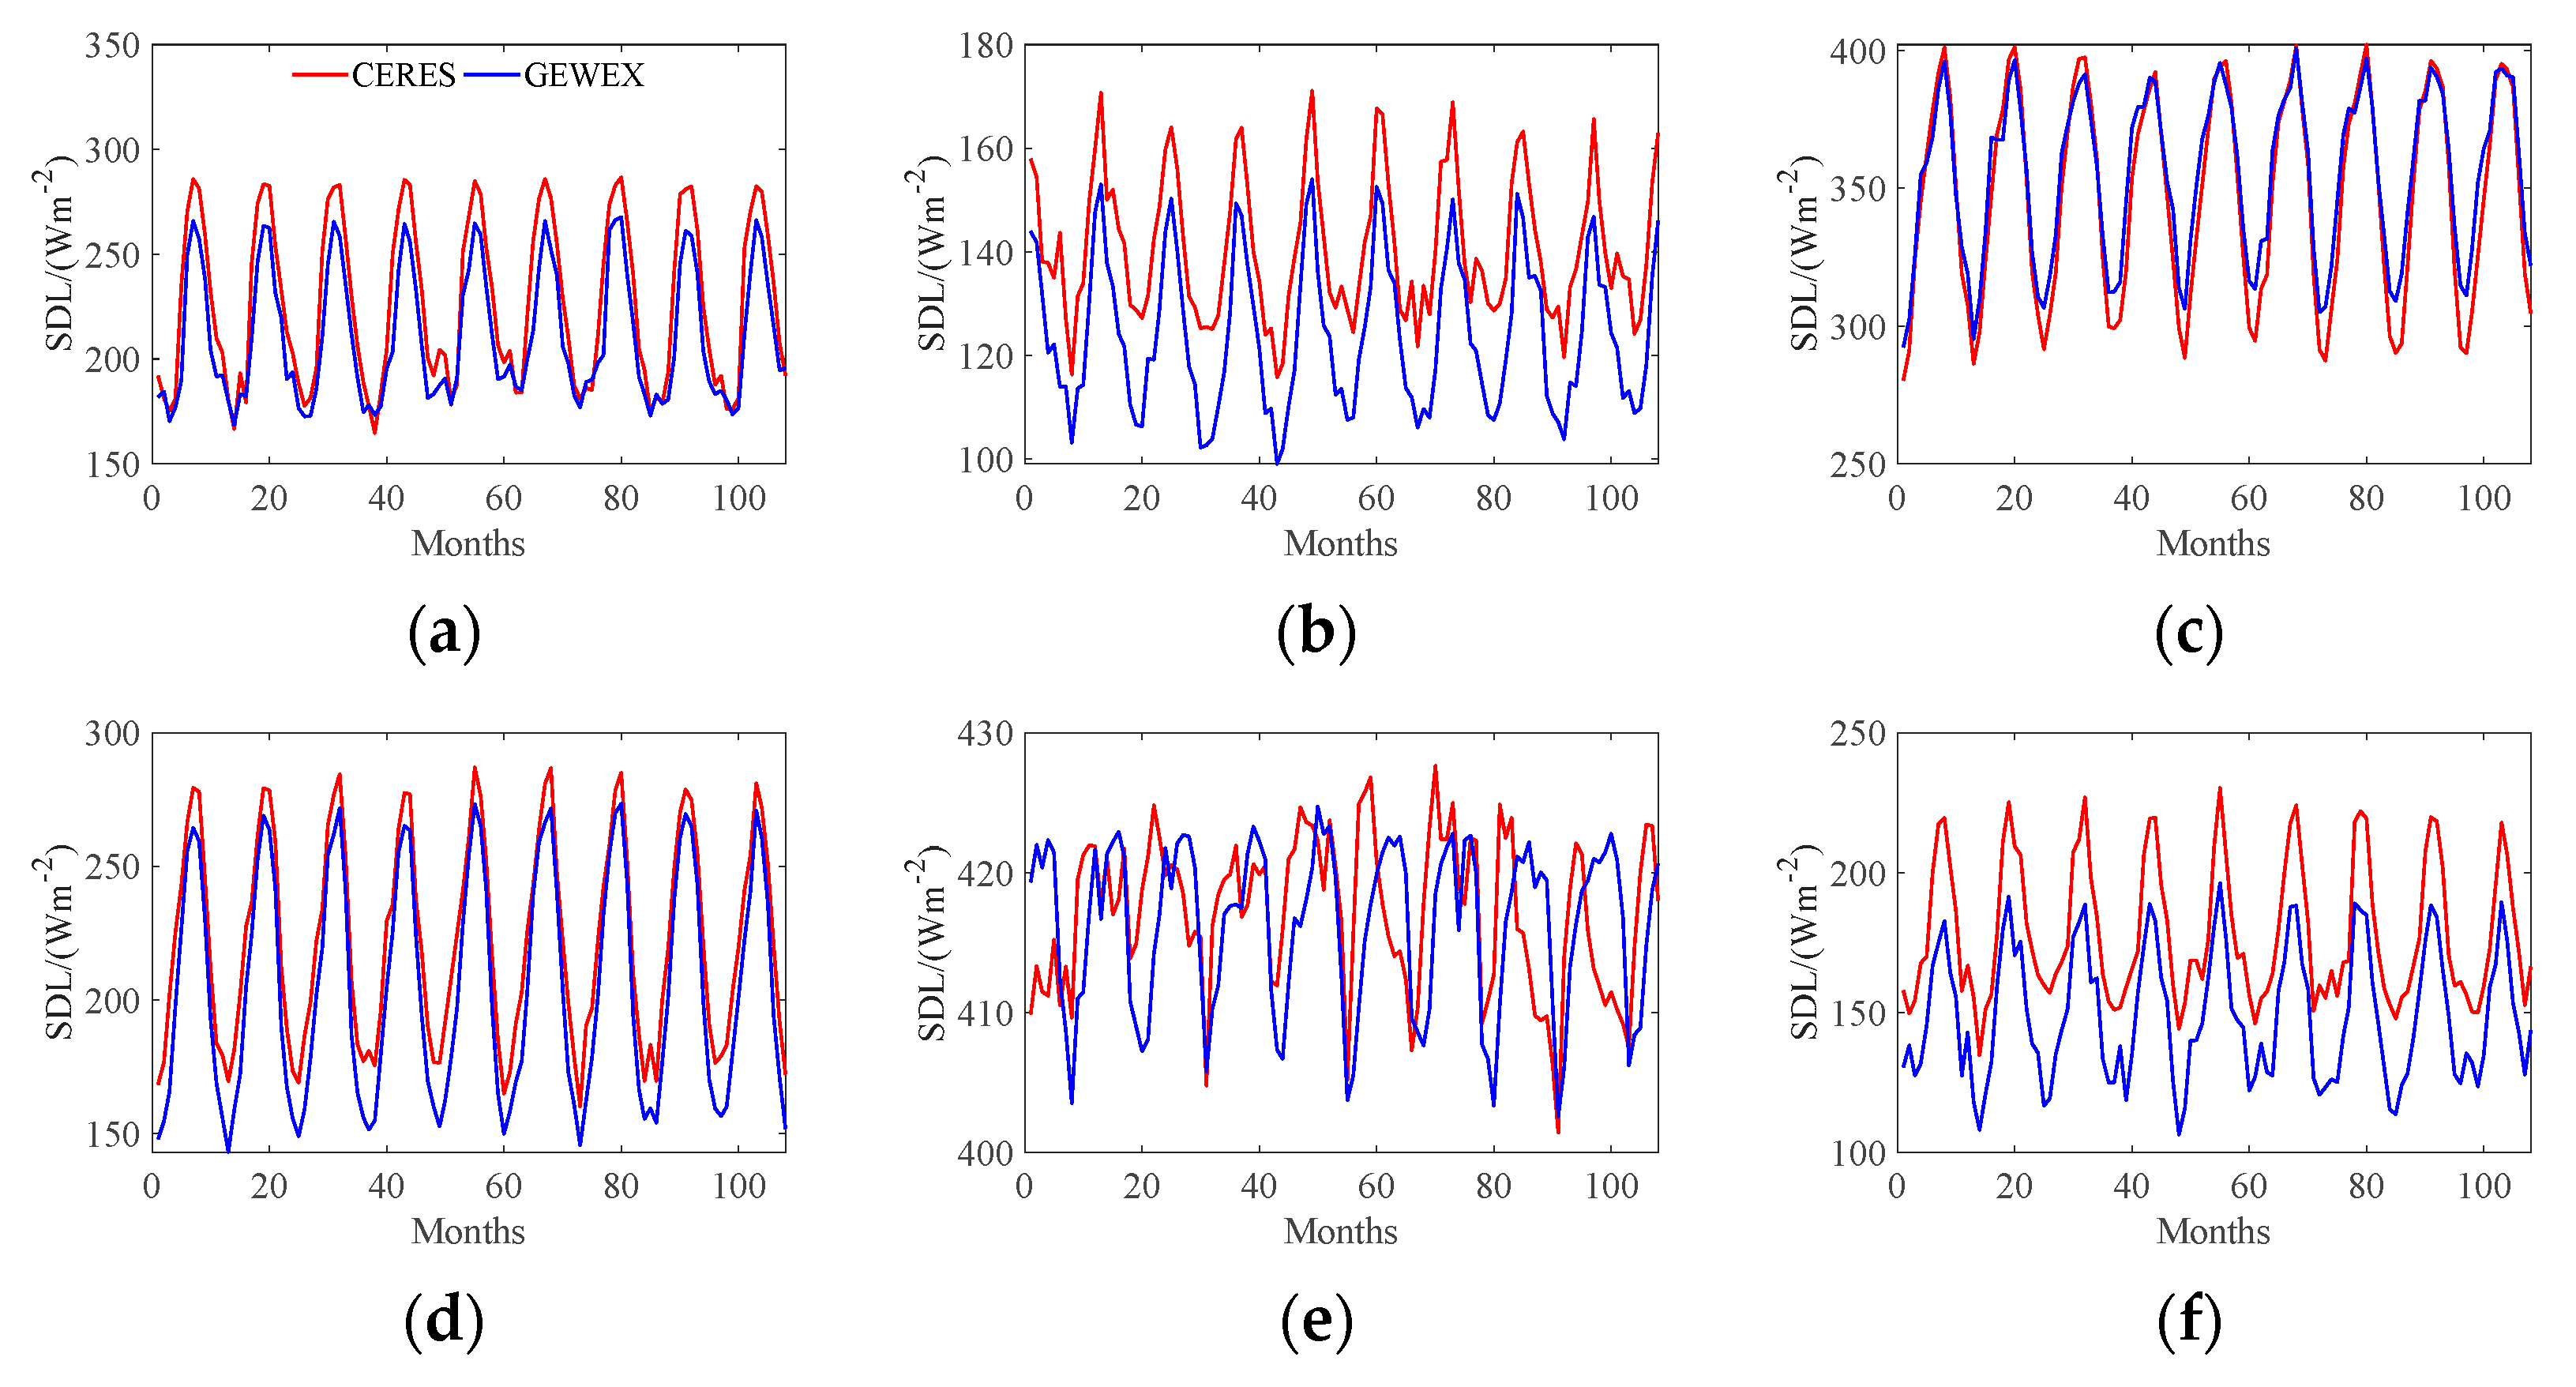
Figure 6 shows the mean values of the two SDL products from the CERES-SYN and GEWEX-SRB at the sites in each special area mentioned in this paper. The red solid line and blue solid line are the mean SDL fluxes of the CERES-SYN and GEWEX-SRB in each special area, respectively, and Figure 6a–f shows the special areas of the Arctic, Antarctic, Sahara, Tibet Plateau, Amazon Basin and Greenland, respectively. It can be found from Figure 6 that the differences in SDL fluxes between the CERES-SYN and the GEWEX-SRB in the Arctic, Sahara and Tibet Plateau are smaller than those of the Antarctic, Amazon Basin and Greenland, and the differences are very similar in the Antarctic and in Greenland. The SDL fluxes of the GEWEX-SRB are about 20 Wm−2 and 35 Wm−2 smaller than those of the CERES-SYN in the Antarctic and Greenland, respectively. However, in the Amazon Basin, the difference between the CERES-SYN and GEWEX-SRB SDL products is not as uniform as those in other areas. In addition, we can also see from Figure 6 that the SDL fluxes in the Arctic and the Sahara are larger than those of the Antarctic; this is why the RMSEab values are large and the RMSEre values are small in the Arctic and the Sahara.
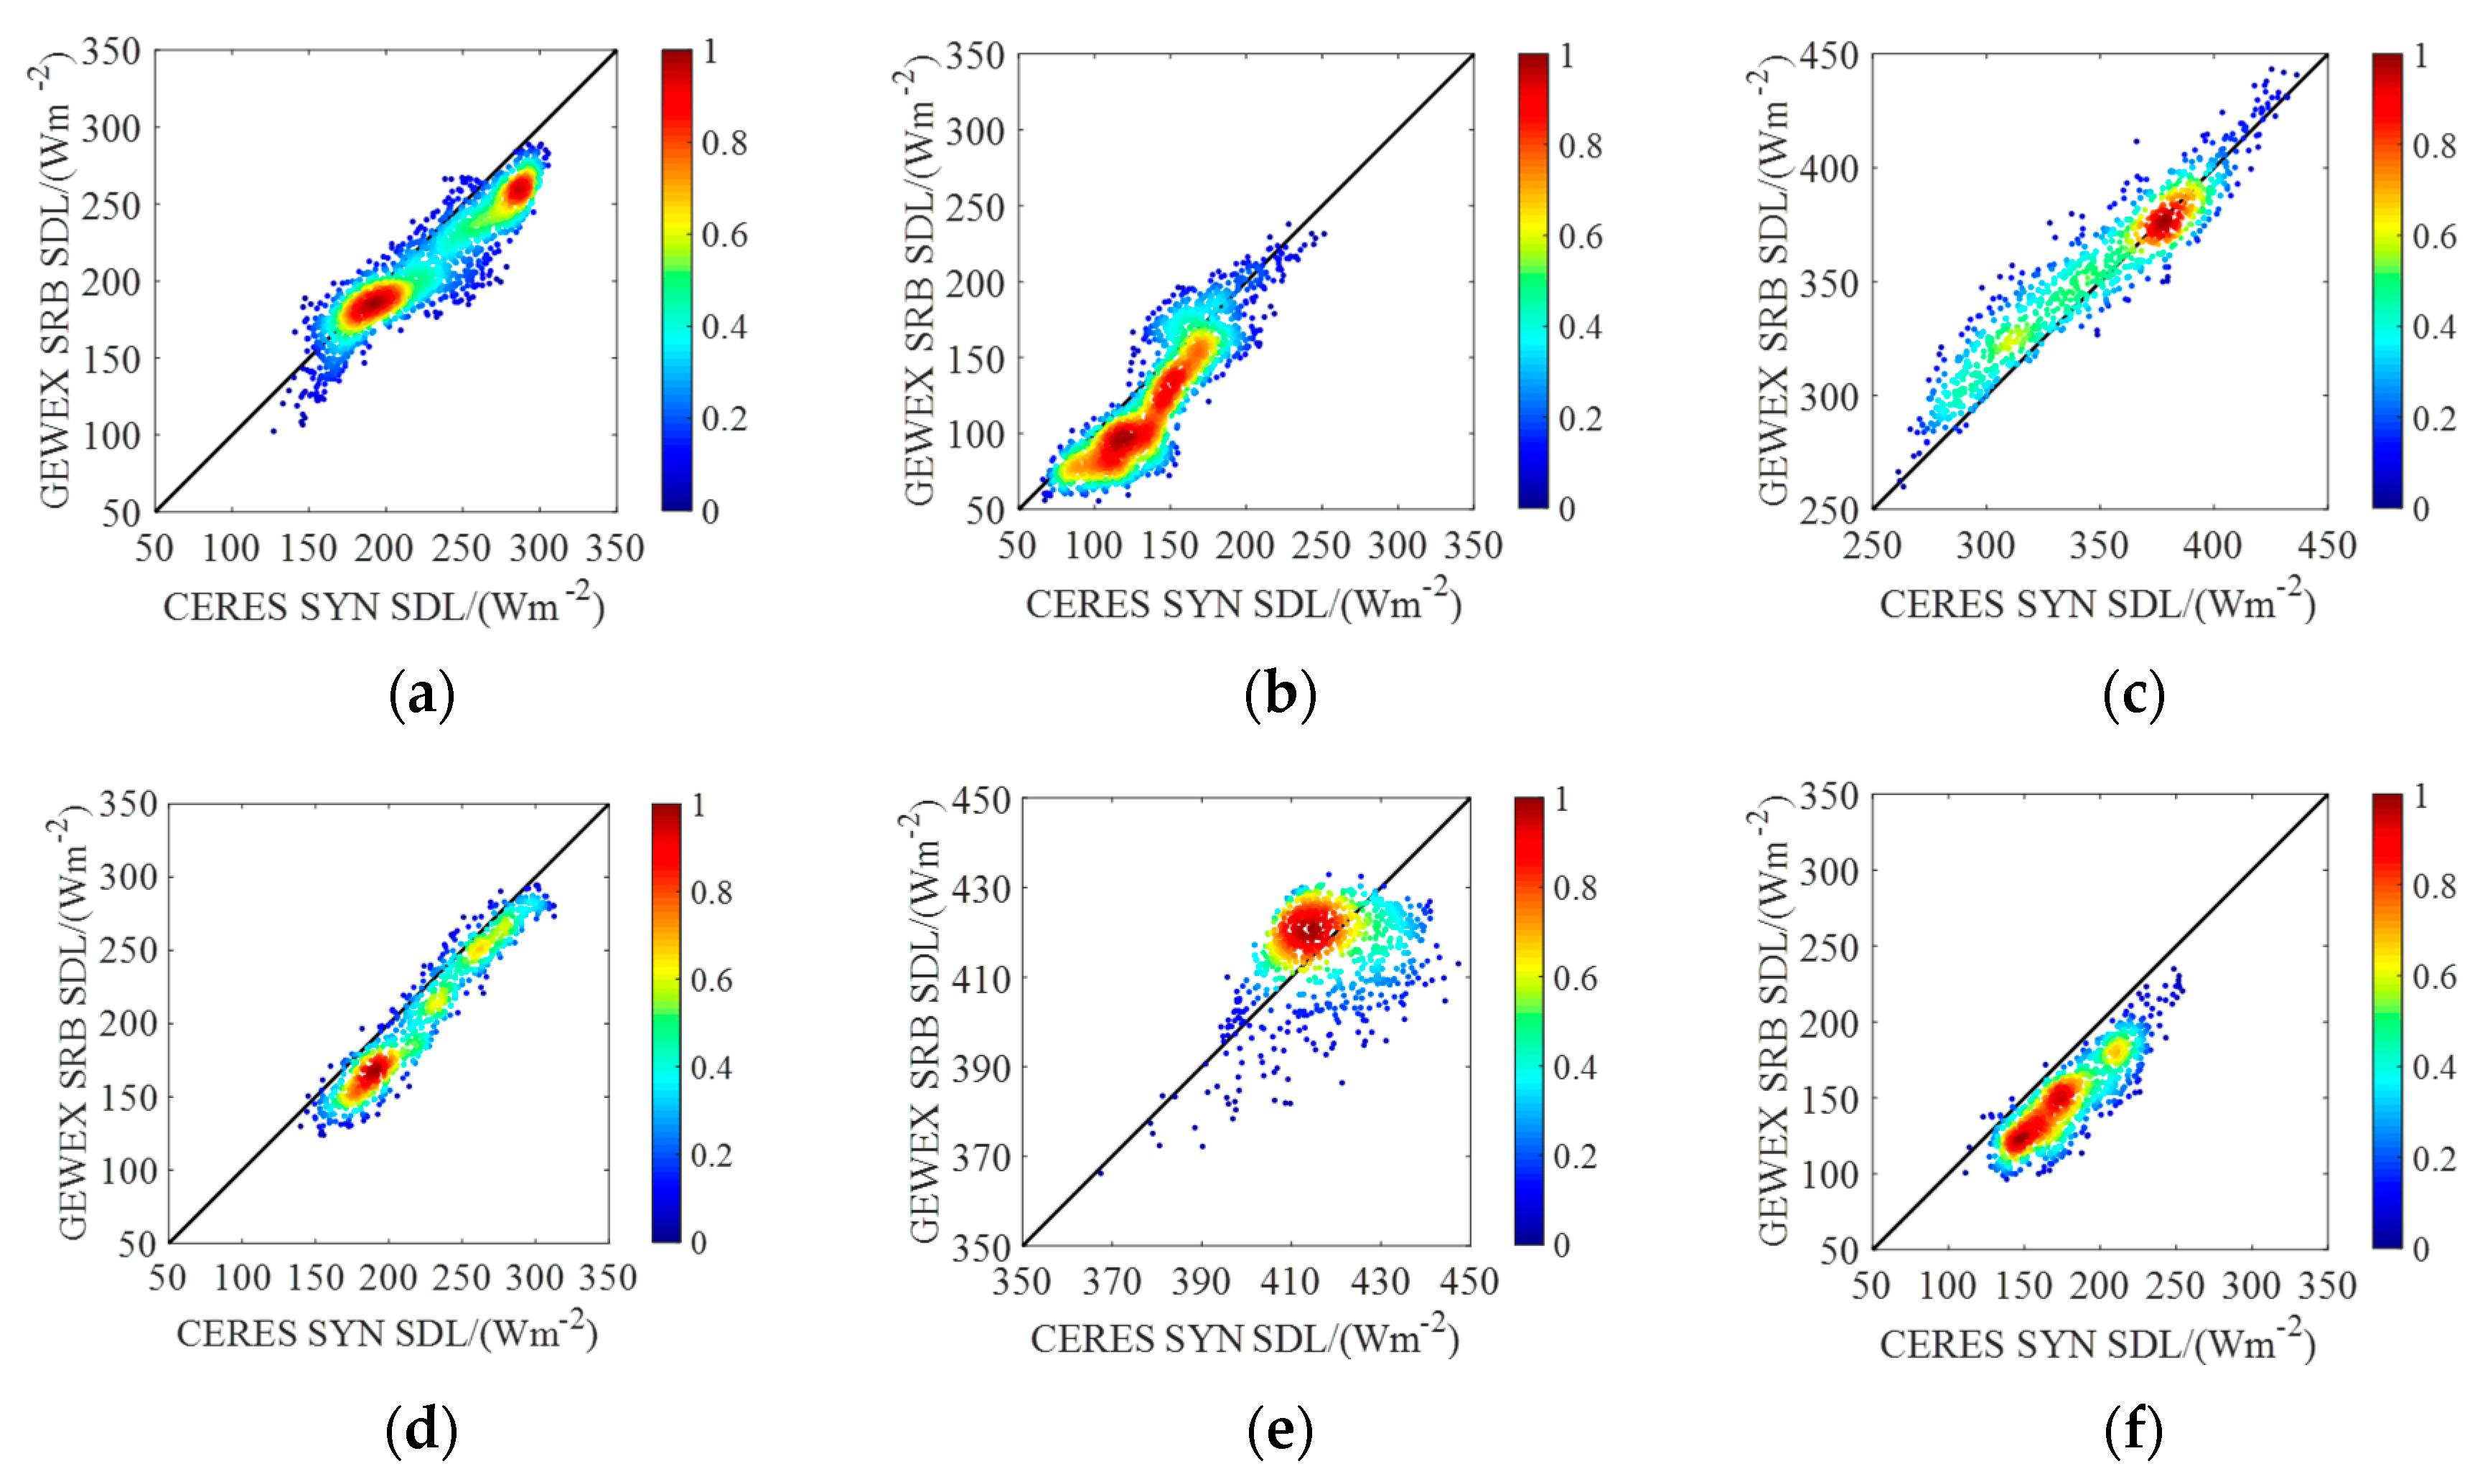
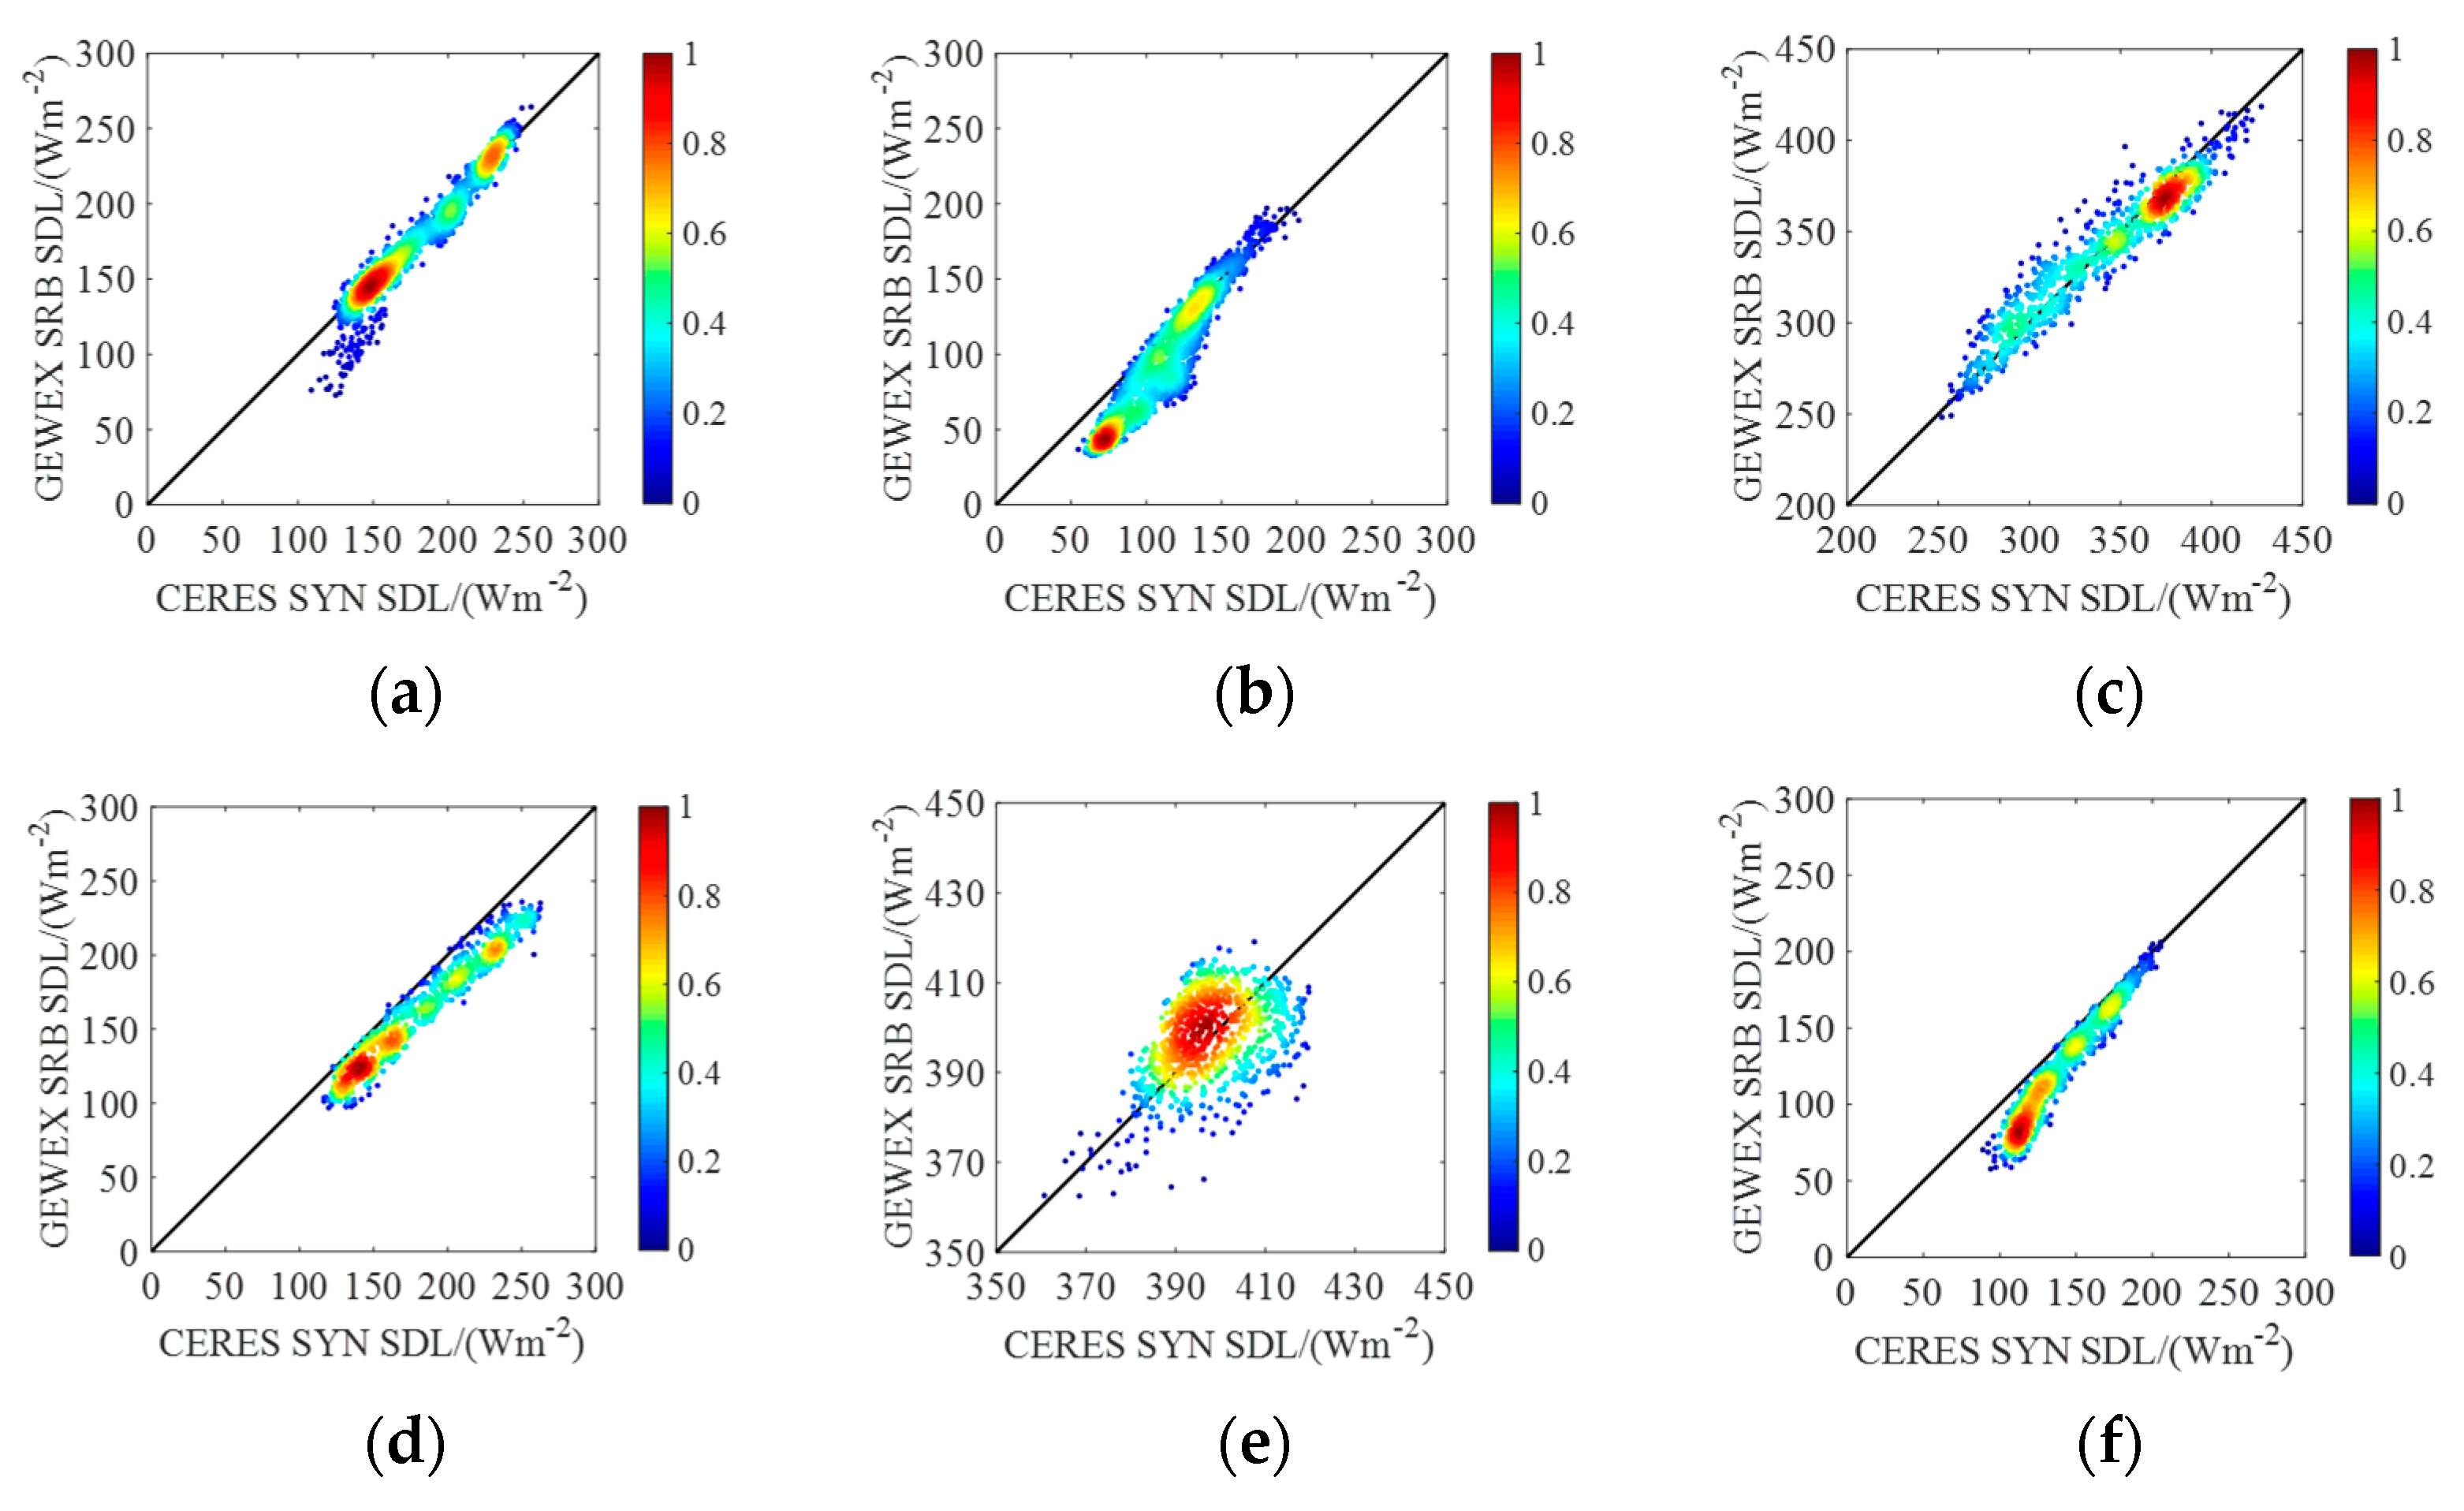
Figure 7 and Table 4 are the density scatter diagrams and the overall difference indices of the two SDL products at the sites in each special area. It can be found from Figure 7 that the SDL products of the CERES-SYN and GEWEX-SRB have a good linear relationship, except in the Amazon Basin, and the SDL fluxes of the GEWEX-SRB are smaller than those of the CERES-SYN, except in the Sahara and the Amazon Basin. However, in fact, the SDL fluxes from the GEWEX-SRB are slightly smaller than those from the CERES-SYN in the Amazon Basin, which can be found in Table 4. In addition, it can also be seen from Table 4 that the RMSEab and MBEab in Greenland are all larger than those of the other areas; they are 31.56 Wm−2 and −29.29 Wm−2, respectively, and the RMSEre and MBEre in Greenland are 17.66% and −16.37%, respectively.

3.3. ECMWF-SRB vs. GEWEX-SRB

When we evaluated the difference between the SDL products of the ECMWF-SRB and the GEWEX-SRB, the monthly SDL products of the ECMWF-SRB and the GEWEX-SRB from 1988 to 2015 had been selected to calculate the various difference indices, which are shown in Figure 8a–e, and Figure 8a–e shows the R2, RMSEab, RMSEre, MBEab and MBEre between the ECMWF-SRB and the GEWEX-SRB SDL products, respectively. It is noteworthy that the SDL product from the ECMWF-SRB has been selected as the reference here. It can be seen from Figure 8a that the correlation between the ECMWF-SRB and the GEWEX-SRB SDL products is high in most areas, and the R2 is more than 0.85, but in the areas near the equator and the area between the 60° and 90° south latitudes, R2 is less than 0.6. Figure 8b shows that, except for the oceans, most of South America and parts of the Antarctic, the RMSEab of the SDL products from the ECMWF-SRB and the GEWEX-SRB in other areas are relatively large, generally between 15 Wm−2–20 Wm−2, and in some areas, the RMSEab values are greater than 20 Wm−2. However, we can find from Figure 8c that the RMSEre are only large in some areas of the Arctic, Antarctic, and in the vicinity of the Tibet Plateau, and they are small in most other areas, where the former is about 10%-20% and the latter is about 0–10%. It can be seen from Figure 8d,e that the SDLs of the GEWEX-SRB are significantly larger than those of the ECMWF-SRB in most areas of the mid–low latitudes, especially in the Sahara, Australia, where the MBEab and the MBEre of the SDL products of the ECMWF-SRB and the GEWEX-SRB are more than 15 Wm−2 and 8%, respectively. In the Arctic and some areas of the Antarctic, the SDL of the GEWEX-SRB is smaller than that of the ECMWF-SRB, and the MBEab and MBEre are about −10 Wm−2–−20 Wm−2 and −5%–−10%, respectively.
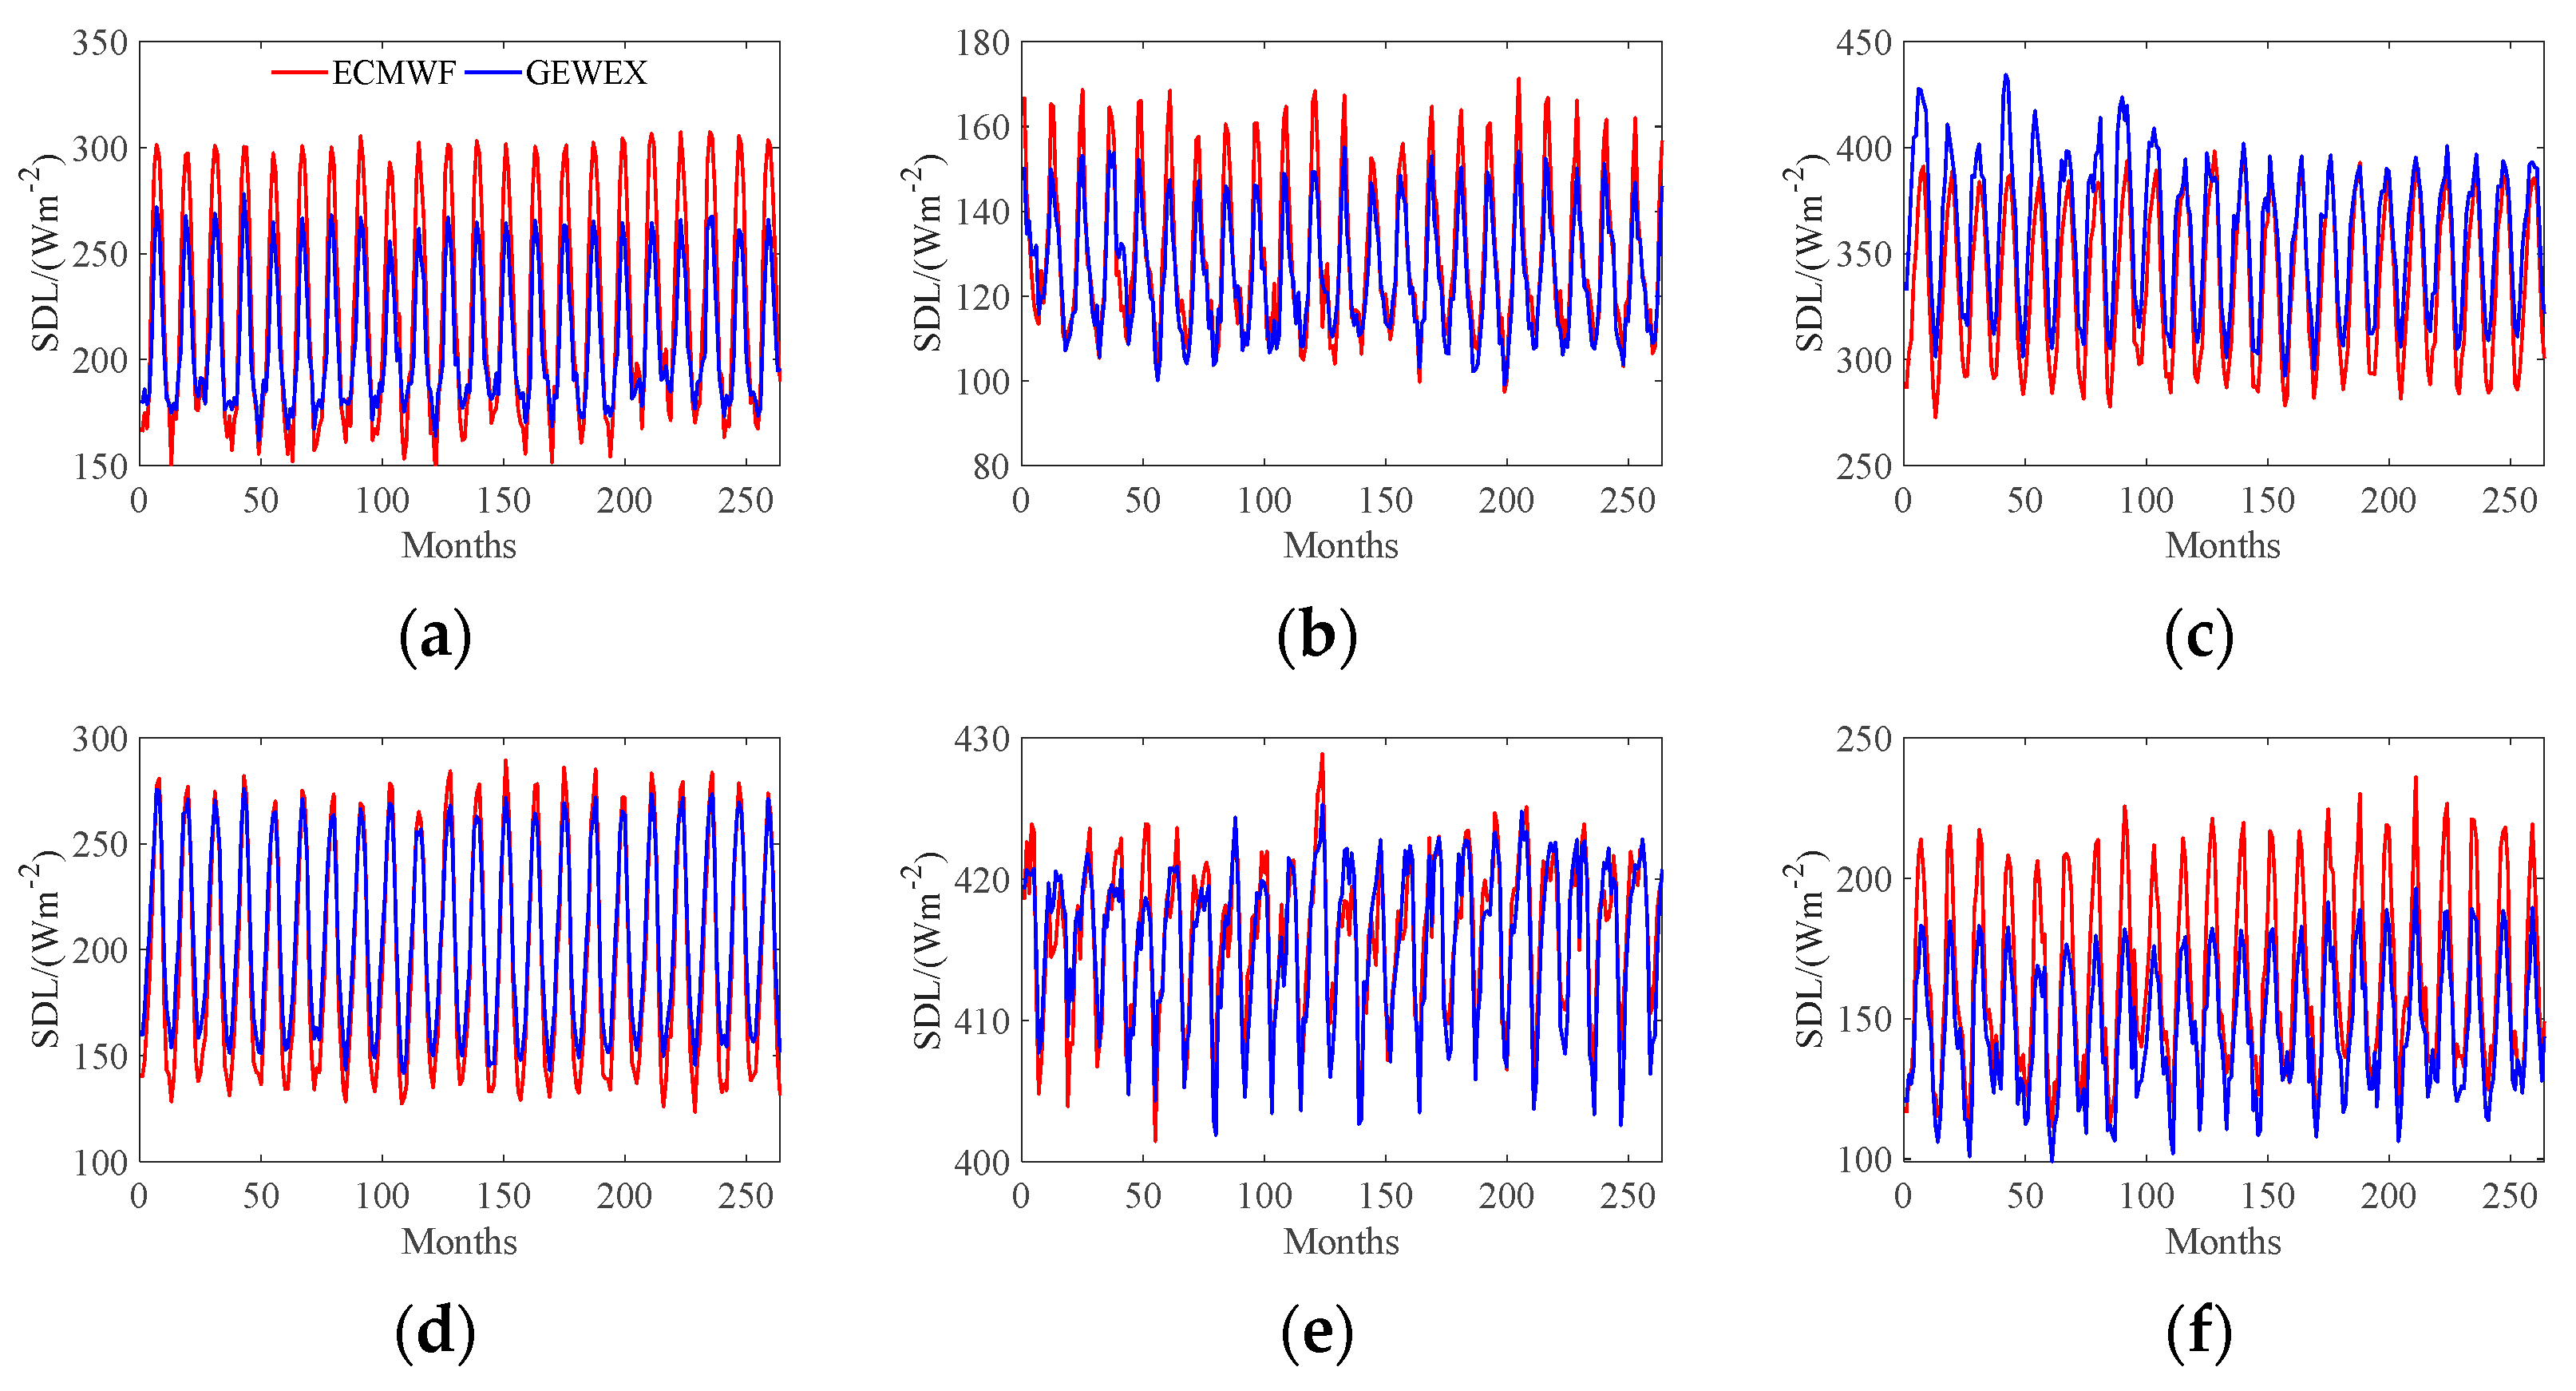
Figure 9 shows the mean values of the two SDL products from the ECMWF-SRB and the GEWEX-SRB at the sites in each special area mentioned in this paper. The red solid line and blue solid line are the mean SDL fluxes from the ECMWF-SRB and the GEWEX-SRB in each area, respectively, and Figure 9a–f shows the special areas of the Arctic, Antarctic, Sahara, Tibet Plateau, Amazon Basin and Greenland, respectively. We can see from Figure 9 that among the six areas selected in this paper, the annual maximum SDL fluxes of the ECMWF-SRB in the Arctic, Antarctic and Greenland are significantly greater than those of the GEWEX-SRB, and the annual minimum SDL fluxes of the ECMWF-SRB in the Sahara are significantly smaller than those of the GEWEX-SRB; that being said, the differences between the two SDL products are small. It is worth mentioning that the differences between the SDL fluxes of the ECMWF-SRB and GEWEX-SRB in the Amazon Basin are significantly smaller than those shown in Figure 3 and Figure 6.
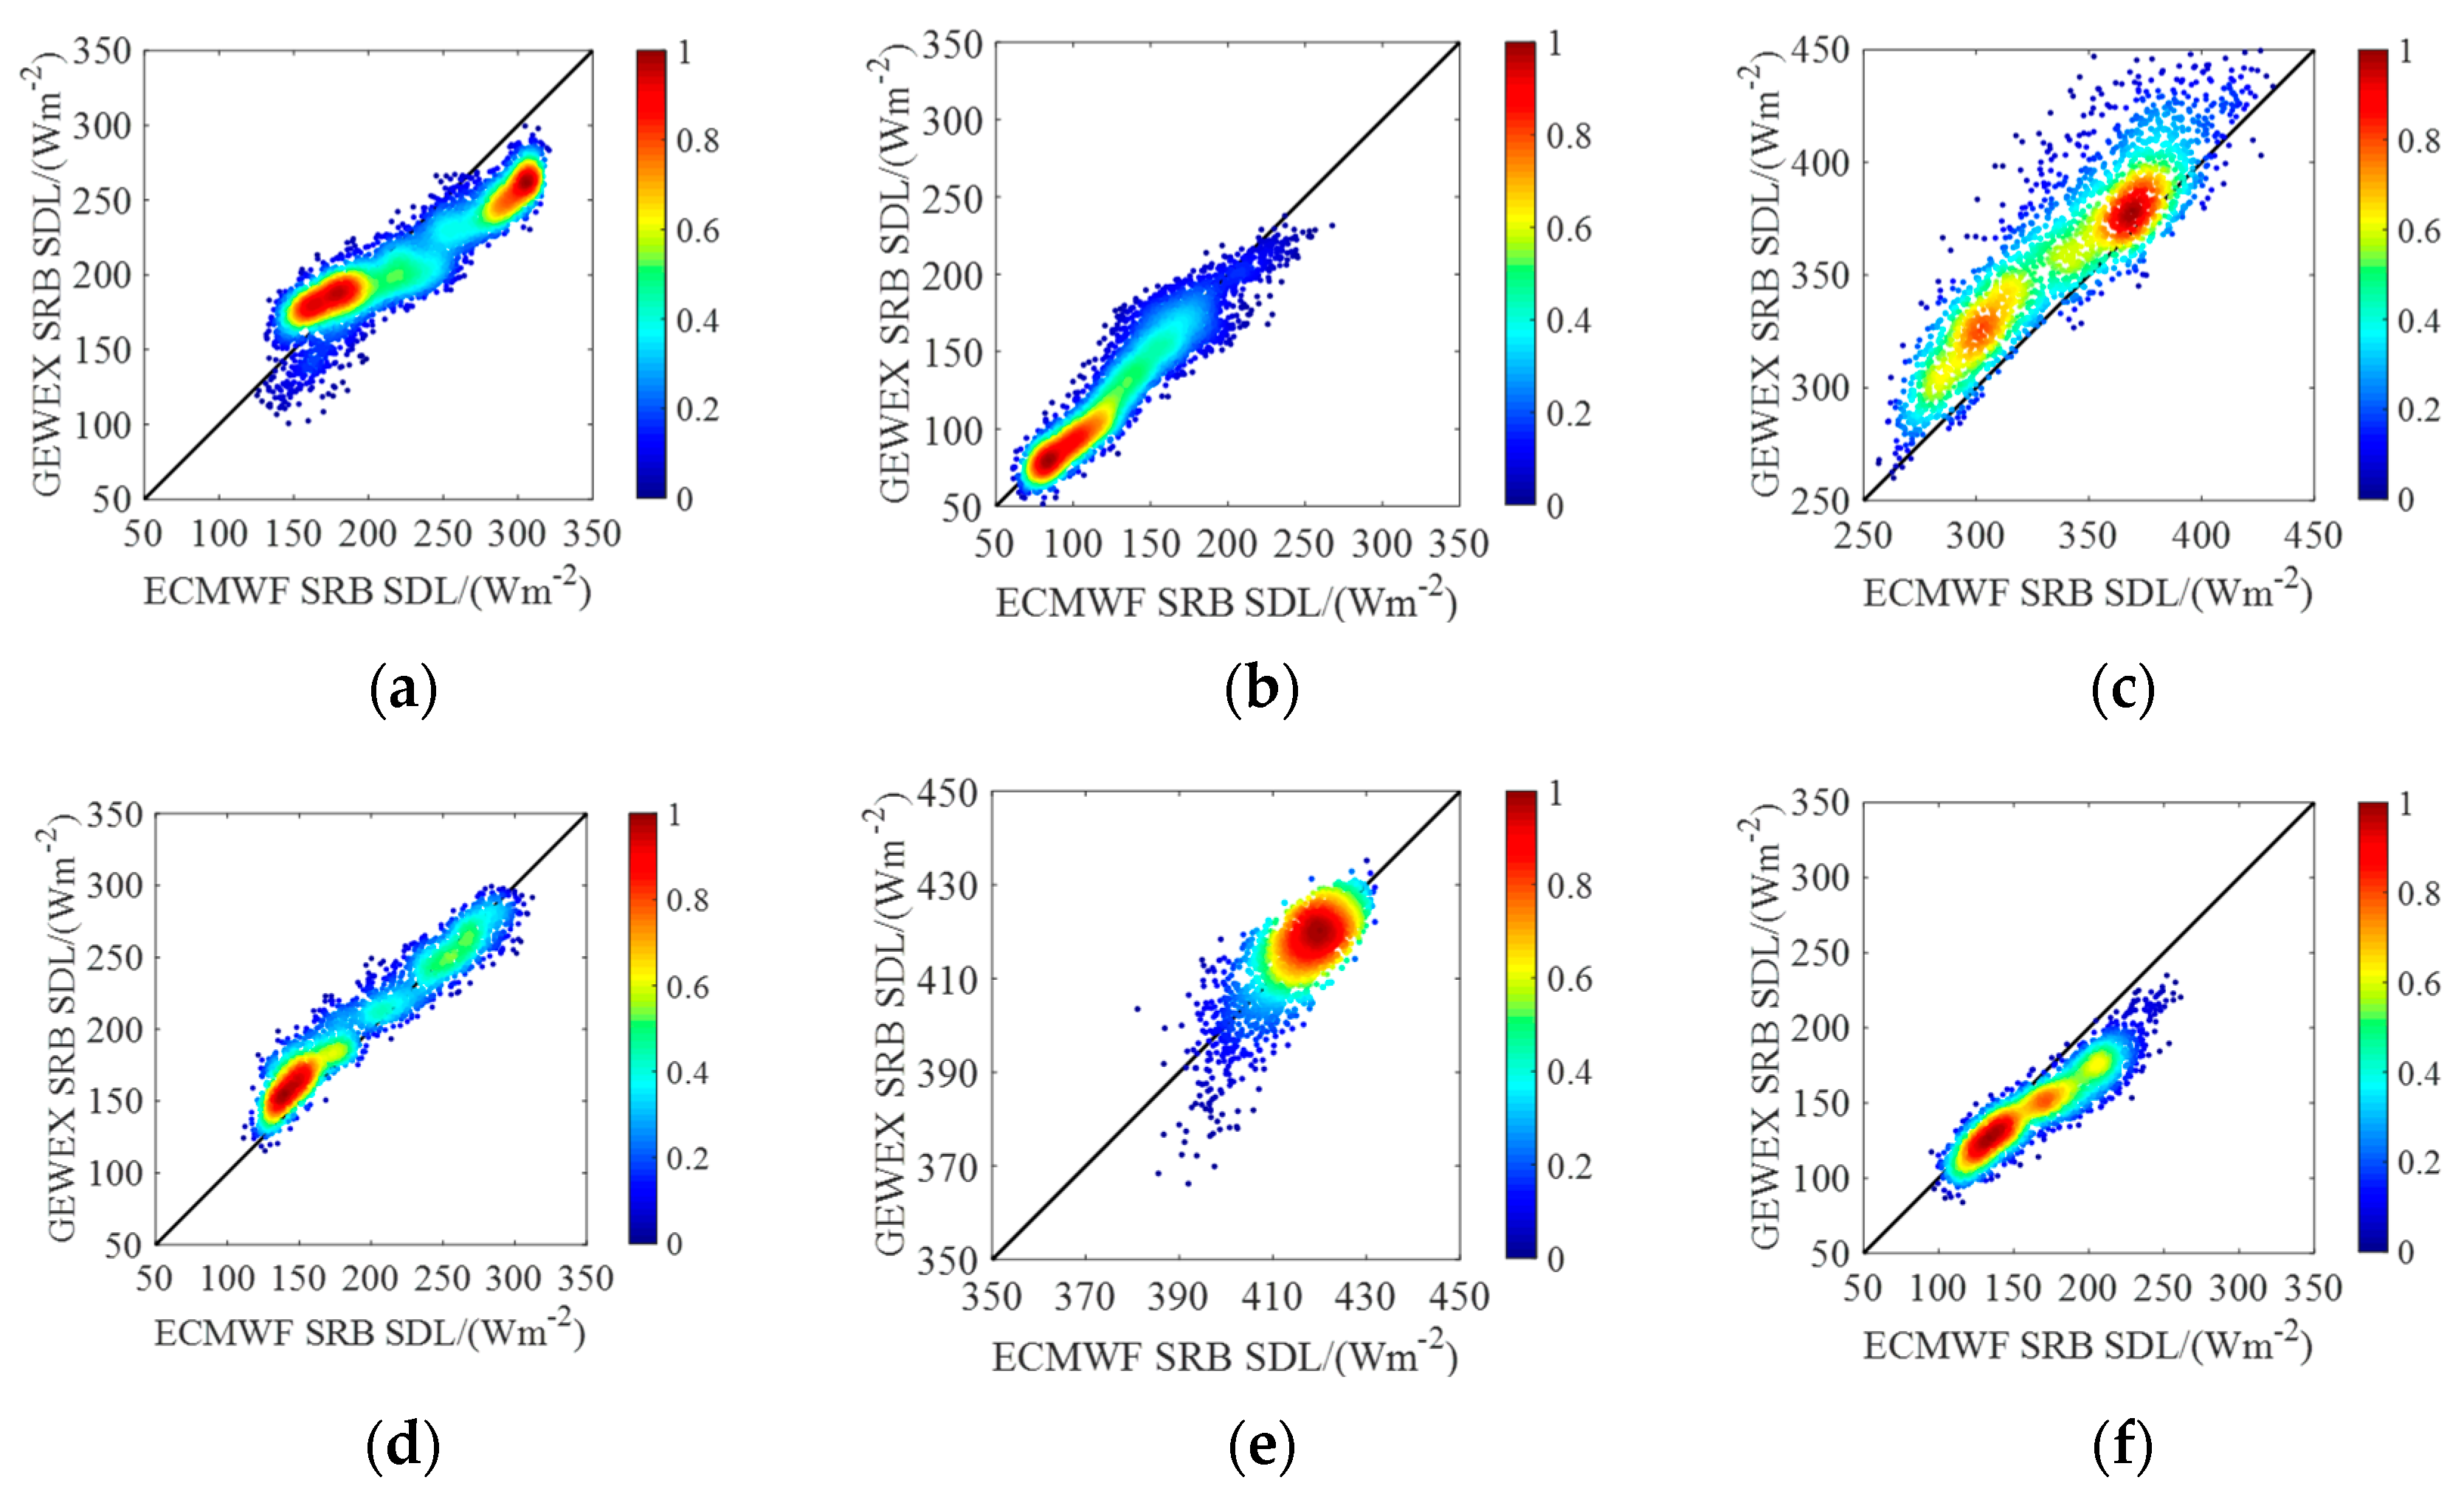
The density scatter diagrams and the overall difference indices between the SDL products from the ECMWF-SRB and the GEWEX-SRB at the sites in the six special areas are shown in Figure 10 and Table 5. It can be deduced from Figure 10 that the SDL products from the ECMWF-SRB and the GEWEX-SRB have a good linear relationship, especially in the Amazon Basin, where the correlation between the two SDL products is significantly larger than the correlations shown in Figure 4 and Figure 7, and the R2 is 0.62 in the Amazon Basin. In the Arctic and the Tibet Plateau, the SDL fluxes from the GEWEX-SRB are significantly smaller than those from the ECMWF-SRB, and the SDL fluxes from the GEWEX-SRB are significantly larger than those from the ECMWF-SRB in the Sahara. In addition, from Table 5 we can see that the largest RMSEab and the largest MBEab appear in the Arctic and the Sahara, with values of 29.27 Wm−2 and 21.25 Wm−2, respectively. And, the largest RMSEre and the smallest MBEre appear in Greenland, with values of 14.42% and −10.93%, respectively.

4. Experiment Results

4.1. Time Series Analysis

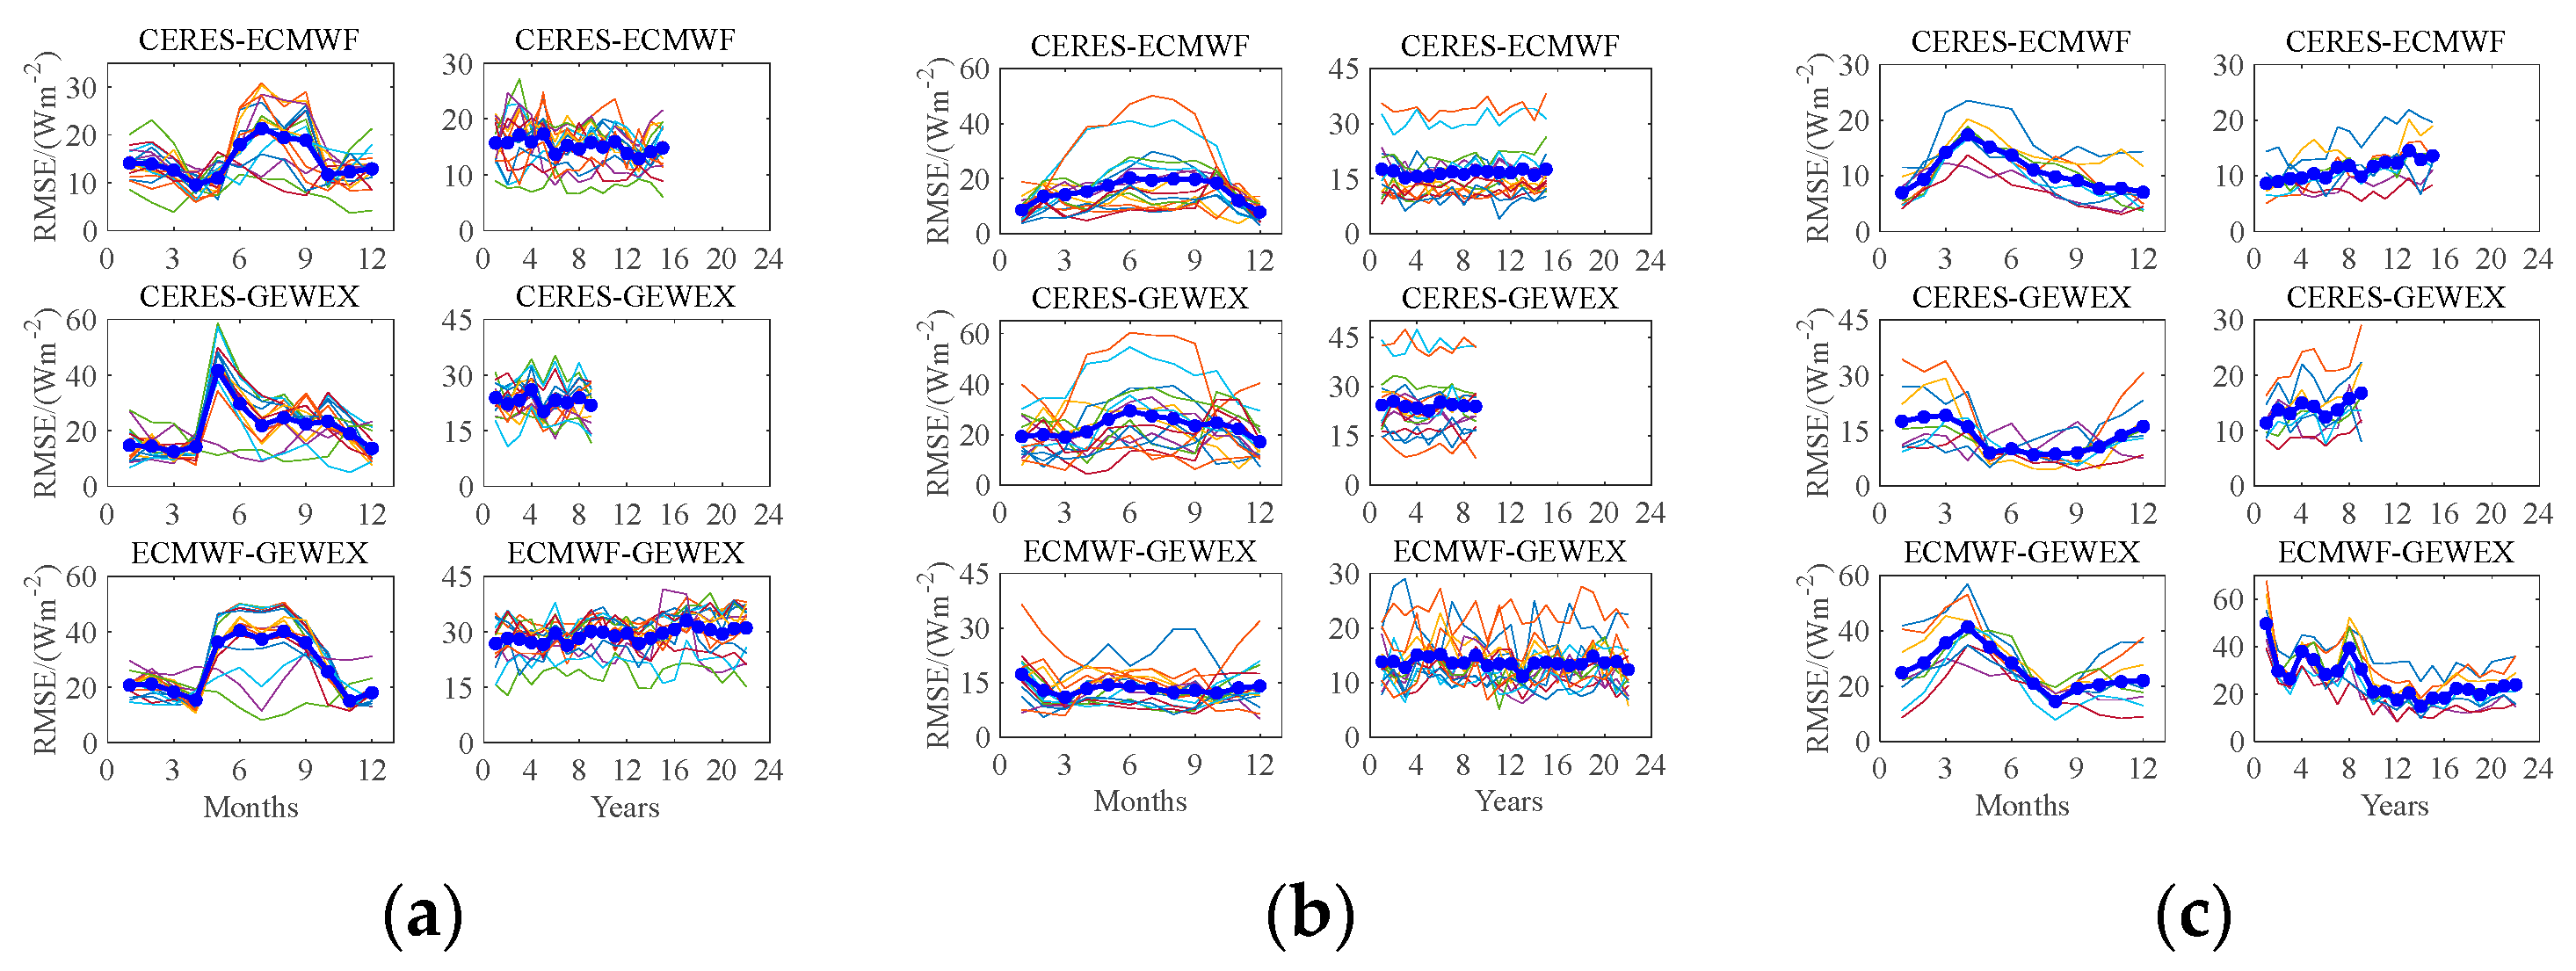
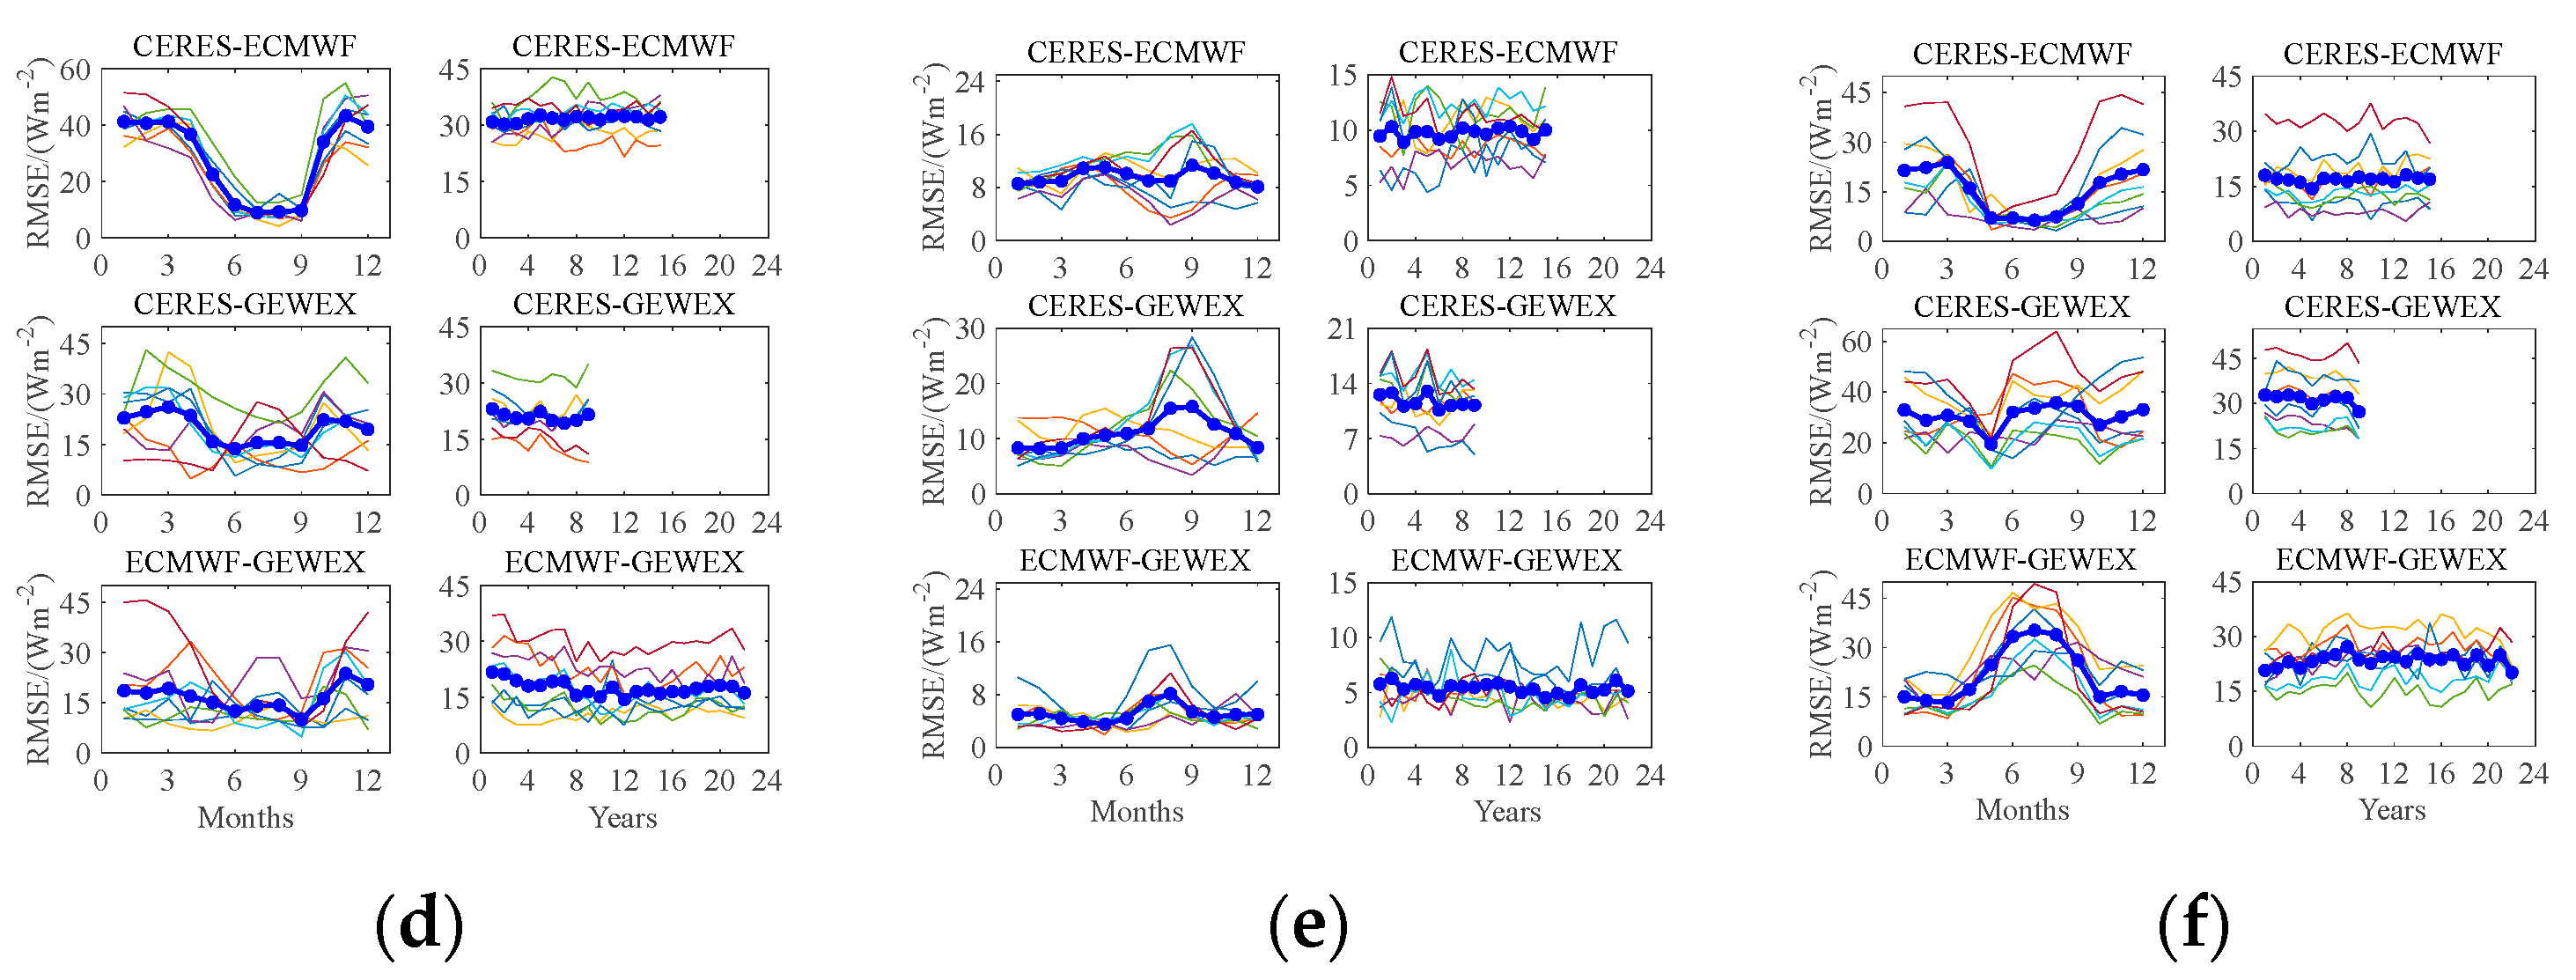
To investigate the potential influence of different seasons and years on the variations among the various SDL products, we have performed a time series analysis of each site within the six specific areas identified in Section 2.2. We calculated the RMSEab across different SDL products at each site in the special areas; refer to Figure 11 for details. The left side of Figure 11a–f shows the impact of different seasons on the differences across the different SDL products, and the right side of Figure 11a–f shows the impact of different years on the differences. The thin lines of different colors in the figures represent the RMSEab over months or years at different sites in the same area, and the blue dotted line in each figure represents the mean value of the RMSEab at different sites. It can be seen from Figure 11 that the seasons have a significant impact on the differences between the different SDL products, while the differences do not change significantly with the change in years; that is, the differences between the different SDL products are sensitive to seasons and not sensitive to years. For example, in the Arctic, the RMSEab in May, June, July and August is significantly larger than that in other months, while in the Tibet Plateau, the RMSEab in May, June, July and August is significantly smaller than that in other months. Although these differences are not uniform in different areas, it is important to acknowledge that the impact of the seasons on these differences cannot be disregarded. However, the RMSEab values across the different years are only different in the Sahara, and there are almost no differences in the RMSEab across the different years in other areas.

4.2. Impact of Clouds

Clouds are one of the important factors affecting SDL fluxes [40]. In the algorithm for calculating SDL, the accuracy of CFRFs is directly related to the accuracy of the final SDL product, and it is important to note that CFRFs can vary for different SDL product algorithms. Therefore, this paper has made a comparative analysis of the forcing radiative fluxes caused by clouds in the SDL products from the CERES-SYN and the GEWEX-SRB (the SDL products from the ECMEF-SRB used in this paper only has all sky SDLs and no clear sky SDLs). The SDL fluxes under all sky conditions are equal to the sum of the SDL fluxes under clear sky conditions and the CFRFs, i.e.,
S D L a l l = S D L c l r + S D L c l d
where SDLall is the SDL fluxes under all-sky conditions, SDLclr is the SDL fluxes under clear sky conditions, and SDLcld is the forcing radiative fluxes caused by clouds. According to (6), the CFRFs in the two SDL products of the CERES-SYN and the GEWEX-SRB have been calculated, and the results are shown in Figure 12. Figure 12a,b shows the CFRFs of the CERES-SYN and the GEWEX-SRB, respectively. As can be seen from Figure 12, the CFRFs are small, between −45° and 45° over the Antarctic continent, and larger over other areas. In addition, while the CFRFs in the two SDL products exhibit a similar spatial distribution, there are significant differences between the CFRFs of the two products. Between the −45° and 45° latitudes and over the Antarctic continent, the CFRFs of the CERES-SYN are slightly smaller than those of the GEWEX-SRB, while over other areas, the CFRFs of the CERES-SYN are significantly larger than those of the GEWEX-SRB.
In order to quantitatively evaluate the differences in CFRFs in the two SDL products, CERES-SYN and GEWEX-SRB, this paper has calculated the difference indices between the CFRFs of the two SDL products, taking the CFRFs of the CERES-SYN as a reference. For the details of the difference indices, please refer to Figure 13; Figure 13a–e shows the R2, RMSEab, RMSEre, MBEab and MBEre, respectively. It can be seen from Figure 13a that the correlation of the CFRFs of the two SDL products in most areas of mid–low latitudes is significantly larger than that in other high latitudes. The correlation in the middle latitudes is about 0.6–0.9 and less than 0.3 in the high latitudes. In addition, in the mid–low latitudes, the correlation of the CFRFs over the ocean is significantly larger than that over the land, especially in the Sahara, the Tibet Plateau, the Amazon Basin and Australia, and the correlations are about 0.1–0.3. Moreover, the RMSEab between the CFRFs of the two SDL products are larger in the Arctic and the Antarctic, which are about 15 Wm−2–20 Wm−2, while in the mid–low latitudes, except over some land, the RMSEab values are about 0–10 Wm−2. However, for the RMSEre, except for a few marine areas that are less than 13%, most other areas are greater than 20%. According to Figure 13d,e, it can be seen that the CFRFs of the GEWEX-SRB are larger than those of the CERES-SYN over most mid–low latitudes, and the CFRFs of the GEWEX-SRB are smaller than those of the CERES-SYN over most high-latitude areas.
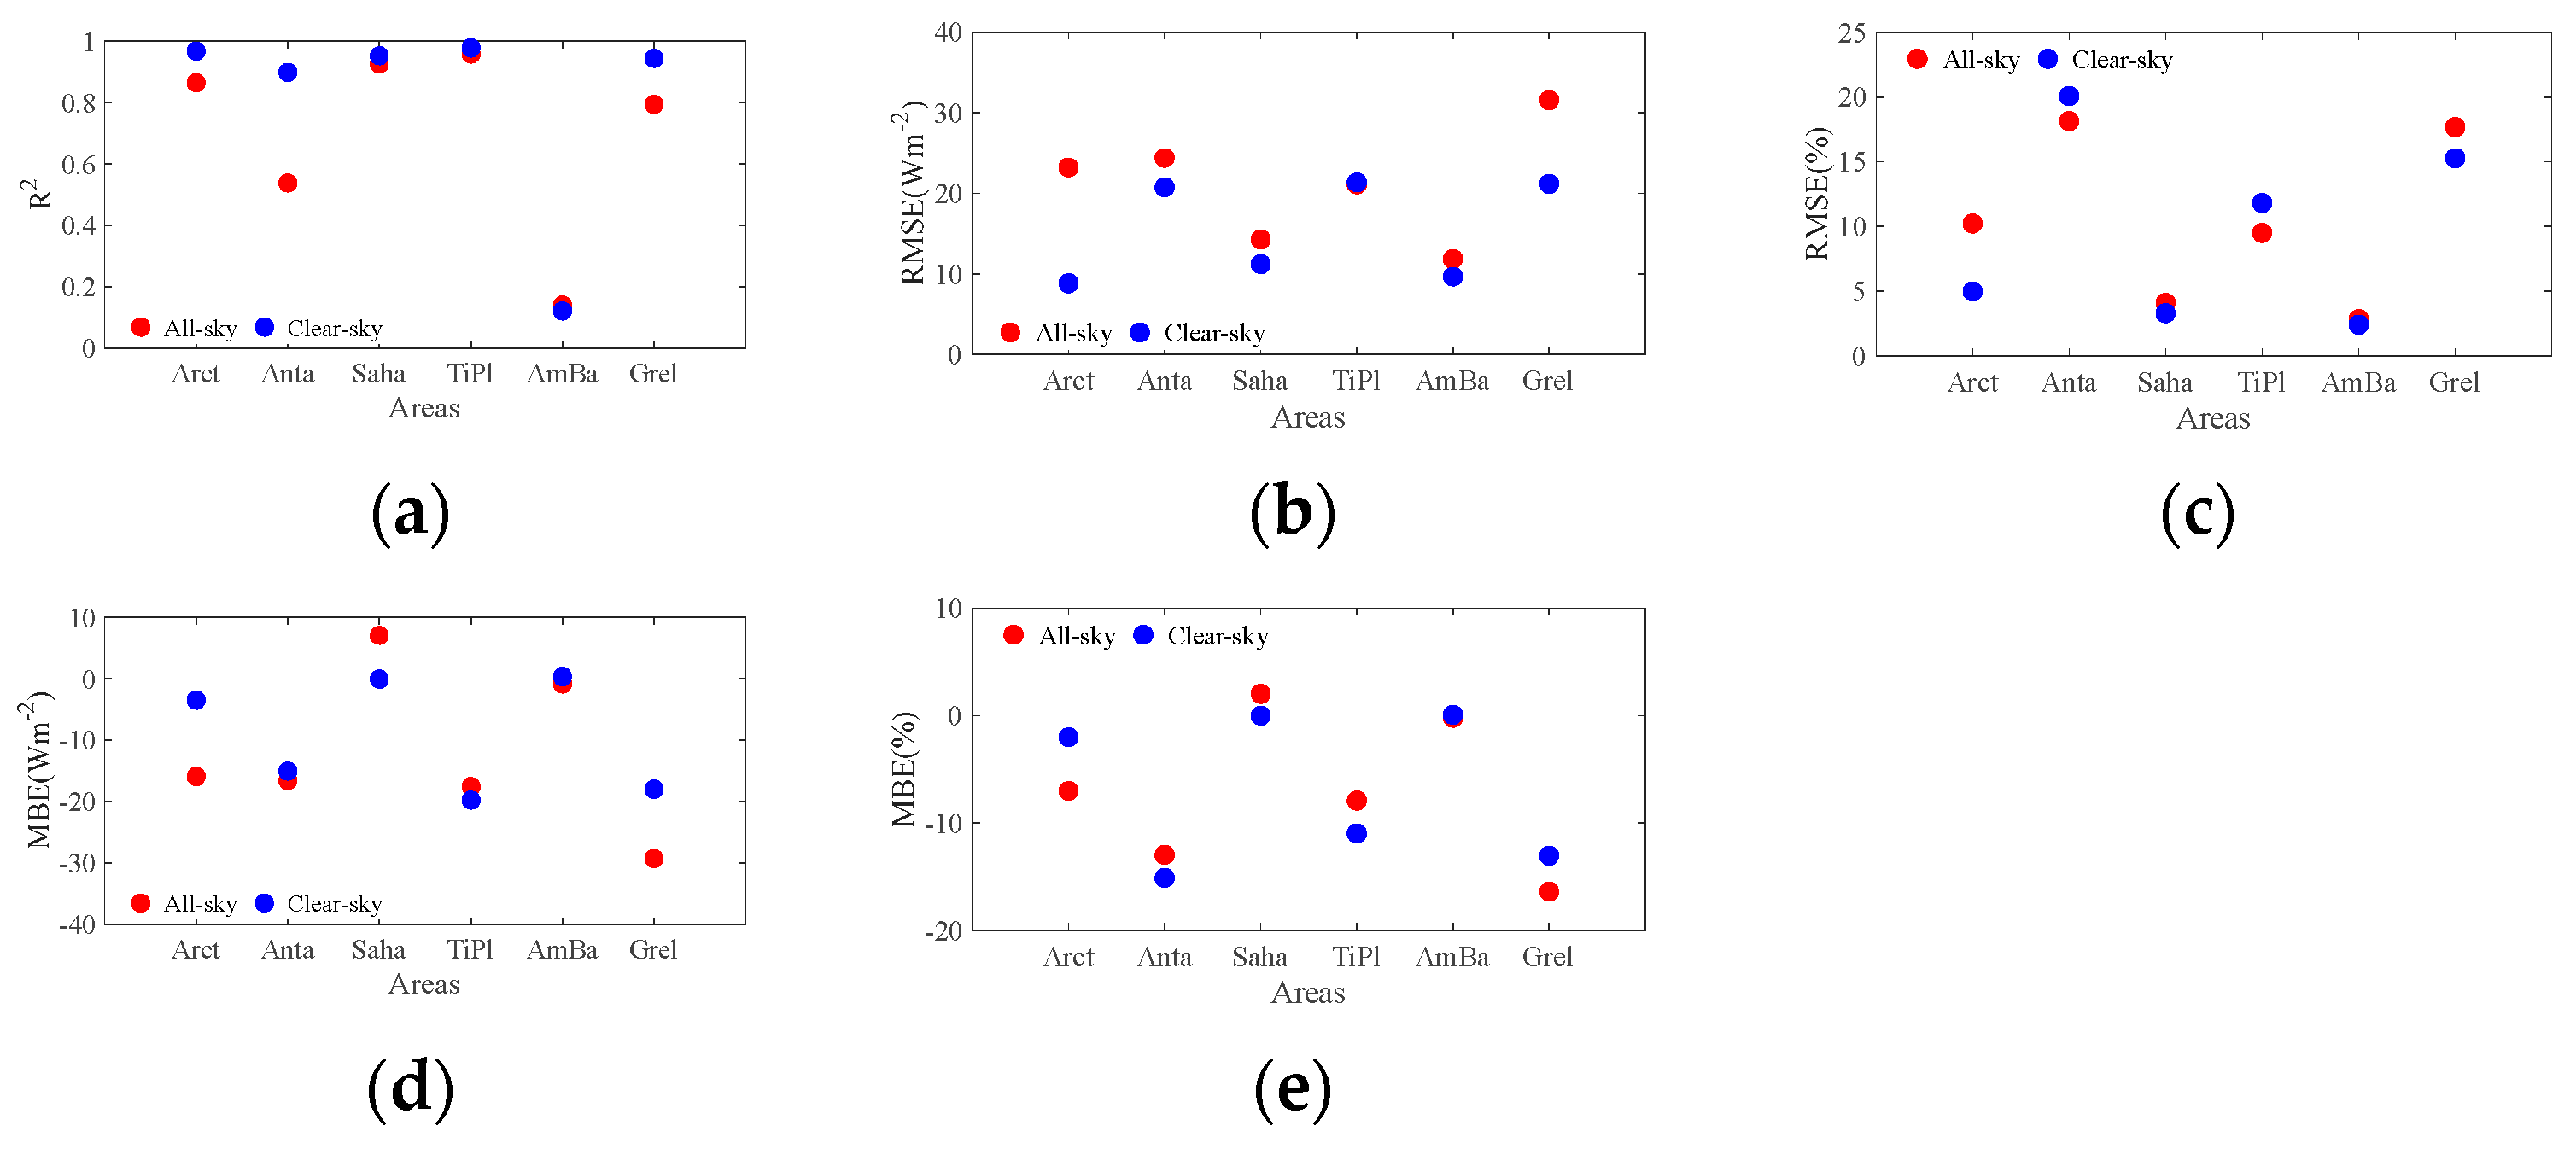
In addition, this paper also conducted the comparative analysis of the two SDL products under clear sky conditions in the six special areas selected above. Firstly, we have drawn the density scatter diagrams of SDL fluxes under clear sky conditions at the sites in the six special areas and calculated the corresponding difference indices, which can be seen in Figure 14 and Table 6. According to Figure 14, it can be deduced that the linear relationship of the two SDL products under clear sky conditions is better than that under all sky conditions. In order to clearly compare the difference between the two SDL products under all sky conditions and clear sky conditions, we also have drawn the difference indices diagrams of the two SDL products in special areas; for the details, please refer to Figure 15. According to the comparison between Table 4 and Table 6, it can be observed that the correlation between the CFRFs of the two SDL products is significantly higher in most mid–low latitude areas under clear sky conditions compared to all sky conditions, except for in the Amazon basin. For the RMSEab and MBEab, except for the Tibet Plateau, the RMSEab and MBEab under clear sky conditions are significantly smaller than those under all sky conditions.
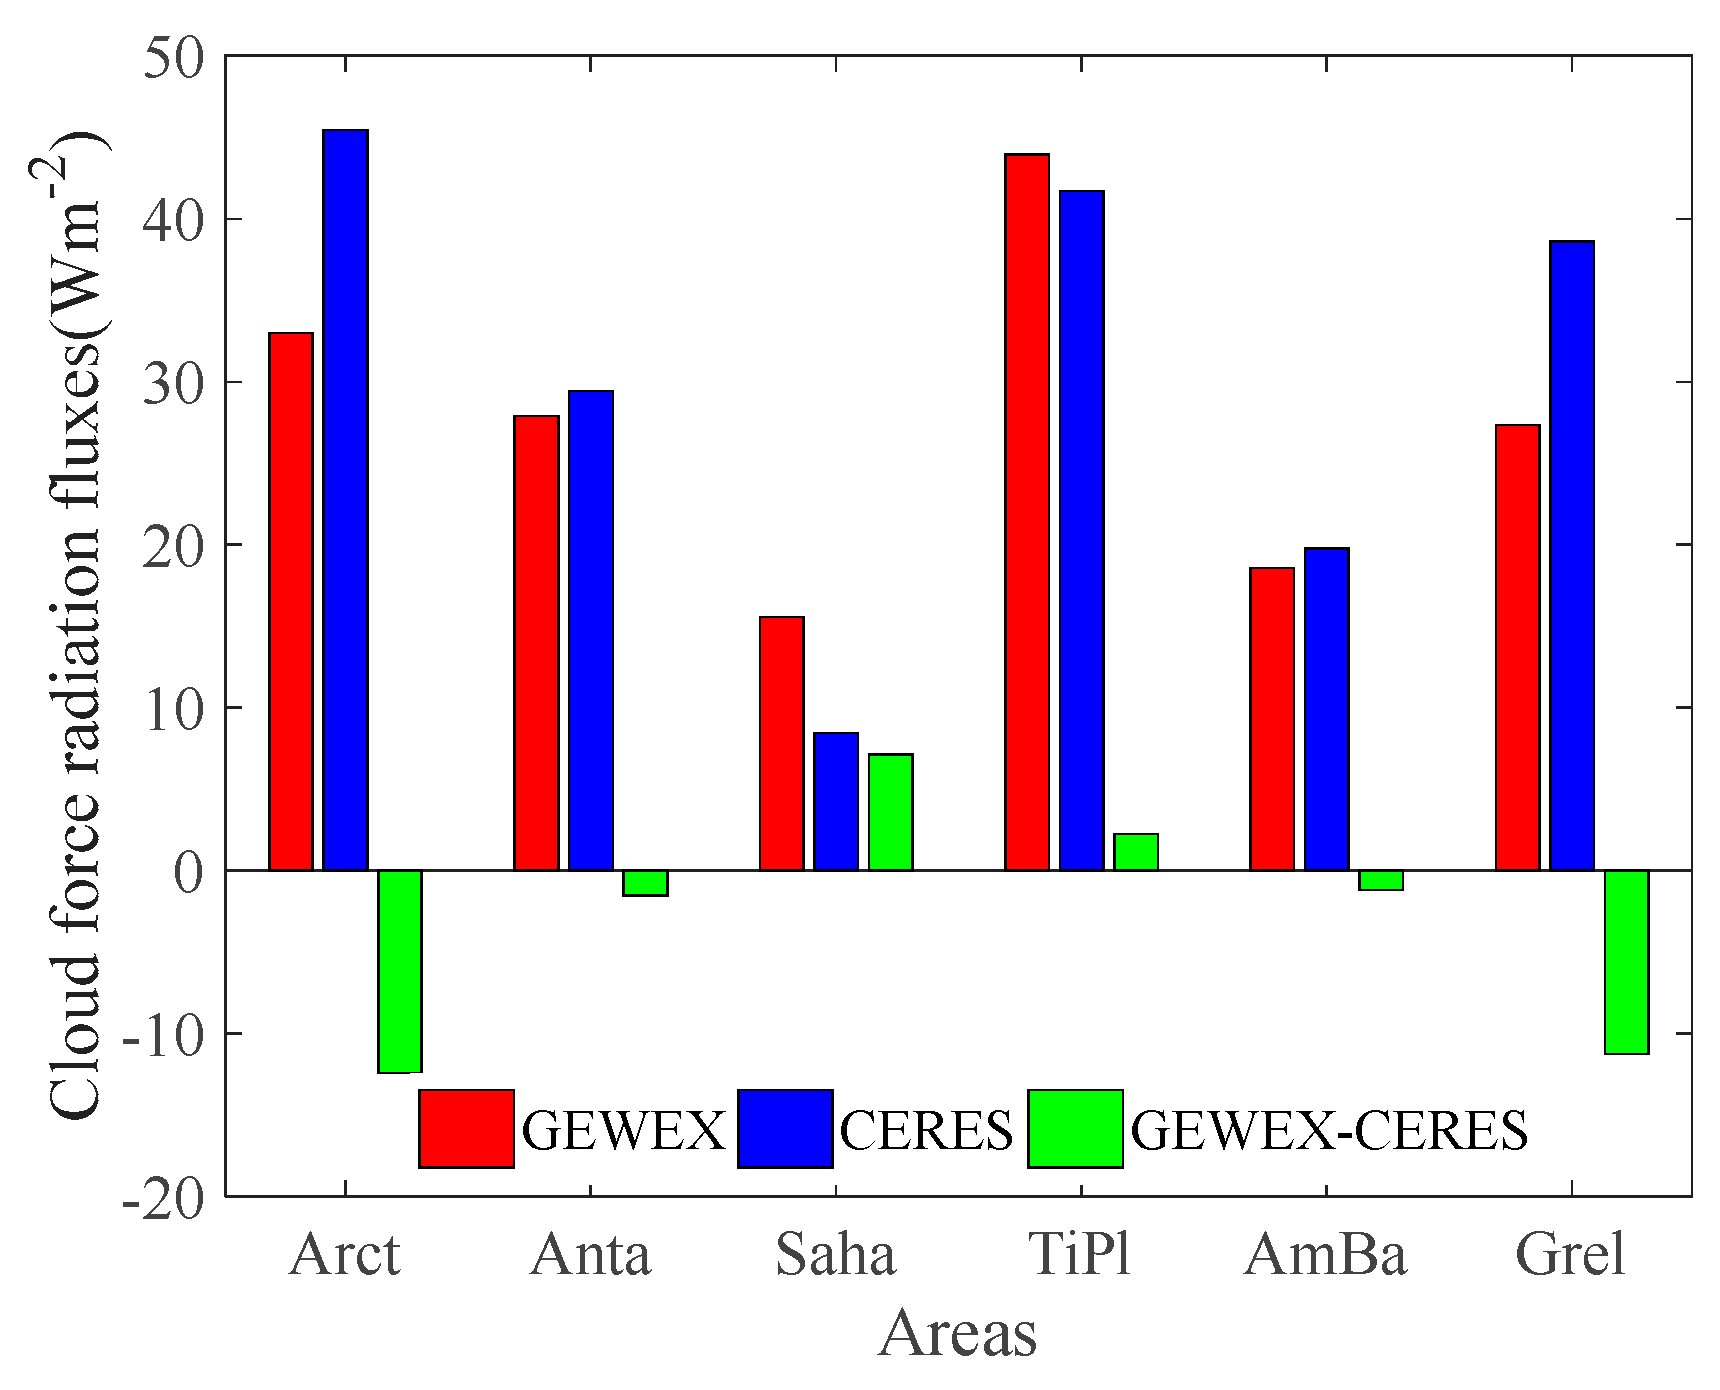
Figure 16 is a comparison diagram of the CFRFs of the two SDL products in the special areas. Table 7 shows the CFRFs and the difference between the two CFRFs. It can be seen from Figure 16 and Table 7 that in the six special areas selected in this paper, the CFRFs of the GEWEX-SRB are larger than those of the CERES-SYN in the Sahara and the Tibet Plateau, and smaller than those of the CERES-SYN in other special areas. In addition, the CFRFs of the two SDL products are quite different in the Arctic, Greenland and the Sahara, with a difference of about 12 Wm−2, 11 Wm−2, 7 Wm−2, respectively.

4.3. Impact of Data Process

For the CERES-SYN and the GEWEX-SRB, the SDL products have multiple temporal resolutions available, including 3-hourly, daily, and monthly. The two monthly SDL products evaluated in this paper can be acquired by time averaging according to high temporal-resolution SDL products, and this paper also evaluated the difference between the daily SDL products from the CERES-SYN and the GEWEX-SRB. The difference indices of two daily SDL products from the CERES-SYN and the GEWEX-SRB are shown in Figure 17, and Figure 17a–e shows R2, RMSEab, RMSEre, MBEab and MBEre, respectively. It can be seen from Figure 17 that for daily SDL products, the coefficient of determination is significantly smaller than that of the monthly SDL products, while the RMSEab and the RMSEre are significantly larger than those of the monthly SDL products, except that the MBEab and MBEre are almost the same as those of the monthly SDL products. This is due to the mean processing used to calculate the daily SDL fluxes; mean processing can reduce the influence of the SDL fluxes that are greater than the mean of the SDL fluxes, which can reduce the RMSEab and RMSEre, and increase R2.

5. Discussion

While this paper does not specifically compare the SDL products with ground station measurements, it is necessary to discuss the accuracy of the three SDL products here based on existing research.
In existing published papers, the SDL products of the CERES-SYN have primarily been compared with ground station measurements in the Polar Regions. However, for mid–low latitude regions, researchers have often utilized the SDL product of the Clouds and Earth Radiant Energy System-Gridded Radiative Fluxes and Clouds (CERES-FSW) to compare with ground station measurements. However, for the SDL products of the ECMWF-SRB, there is currently no research on accuracy evaluation using ground-measured data.
It can be found from the existing research that the RMSE corresponding to the SDL products of the CERES-SYN and GEWEX-SRB are 26.90 Wm−2 and 35.80 Wm−2 in the Polar Regions, respectively [41]. In the mid–low latitude regions, the SDL products of the CERES-FSW and GEWEX-SRB are 20.20 Wm−2 and 27.50 Wm−2, respectively [17]. Due to snow and ice covering most of the surface of Antarctica and due to seasonal variants in the Arctic, the radiation characteristics are very different from those of other regions of the Earth [41]; thus, the accuracy of SDL products in the Polar Regions are lower than those of other regions. Although there is no comparison between the SDL product of the ECMWF-SRB and ground-measured data in existing published papers, it can be inferred from the research results of this paper that the accuracy of the ECMWF-SRB is likely to be lower than that of the CERES-SYN, but higher than that of the GEWEX-SRB. In addition, the factors that affect the accuracy of SDL products mainly include uncertainties of atmospheric parameters, the cloud parameters, spatial heterogeneity, elevation, input data accuracy, etc. Therefore, if we want to improve the accuracy of the SDL products, we can correct them be addressing these aspects.

6. Summary and Conclusions

This paper uses two methods, global analysis and special regional analysis, to study the mutual differences among three widely used monthly SDL products: the CERES-SYN, the ECMWF-SRB and the GEWEX-SRB. The results show that there are significant differences among the three SDL products in some areas. Firstly, in general, the correlation among the three SDL products is high in most areas. However, it is relatively low in regions near the equator and in the Antarctic. Secondly, the RMSEab among the three SDL products are significantly large in the Arctic, the Antarctic, the Sahara and the Tibet Plateau, and the maximum RMSEab can be greater than 20 Wm−2. For the RMSEab of the SDL products of the ECMWF-SRB and the GEWEX-SRB, the RMSEab is relatively large in almost all areas except in mid–low latitude marine areas. Thirdly, according to the MBEab, we can find that for the SDL products of the CERES-SYN and the ECMWF-SRB, the SDL product of the ECMWF-SRB is significantly smaller than that of the CERES-SYN in the Antarctic, the Sahara, the Tibet Plateau and Greenland, while that of the ECMWF-SRB is slightly larger than that of the CERES-SYN in most parts of Arctic, and the difference between the two SDL products is small in the mid–low latitude marine area. For the SDL products of the CERES-SYN and the GEWEX-SRB, the SDL product of the GEWEX-SRB is significantly larger than that of the CERES-SYN in the Sahara and Australia, while the SDL product of the GEWEX-SRB is significantly smaller than that of the CERES-SYN in the Arctic, the Antarctic, the Tibet Plateau and Greenland. For the SDL products of the ECMWF-SRB and the GEWEX-SRB, the SDL product of the GEWEX-SRB is larger than that of the ECMWF-SRB in most mid–low latitudes (including oceans), especially in the Sahara and Australia, and the SDL product of the GEWEX-SRB is significantly larger than that of the ECMWF-SRB, while the SDL product of the GEWEX-SRB is significantly smaller than that of the ECMWF-SRB in the Arctic, the Antarctic, the Tibet Plateau and Greenland.
Based on time series analysis, we can see that the differences among the three SDL products show certain seasonality. While the differences among the three SDL products may not exhibit uniformity across different areas, there are noticeable variations that correspond to changes in months. However, the differences among different years are only different in the Sahara, and there are almost no differences among the different years in other areas. According to the analysis of the CFRFs of the CERES-SYN and the GEWEX-SRB, we can see that there is significant difference in the CFRFs of the CERES-SYN and the GEWEX-SRB in different areas. In addition, the difference between the SDL products of the CERES-SYN and the GEWEX-SRB under clear-sky conditions is significantly smaller than that under all sky conditions. This suggests that CFRFs play a crucial role in influencing the disparities among different SDL products. Finally, through the difference analysis between the daily SDL products of the CERES-SYN and the GEWEX-SRB, it can be found that the difference between the two daily SDL products is significantly greater than that between the two month SDL products, because the mean processing will reduce the influence of SDL fluxes greater than the mean of the SDL fluxes. Therefore, data processing is also a factor affecting the difference between different SDL products.
In addition, the SDL products used in this paper are the latest versions. The new version of an SDL algorithm has some improvement over the old version of an SDL algorithm, and the differences between the new version of a given SDL product and the old version of a given SDL product will be a focus of our future work.

Author Contributions

Conceptualization, G.L.; formal analysis, L.Y.; funding acquisition, R.Z.; data curation, L.Y.; writing—original draft, L.Y.; writing—review and editing, R.Z. and L.Y. All authors have read and agreed to the published version of the manuscript.

Funding

This research received no external funding by the National Natural Science Foundation of China (Grant 42171355 and 42071410); the Sichuan Science and Technology Program (No.2020JDTD0003 and 2020YJ0322); and the Open Research Fund of Laboratory of Target Microwave Properties (No. 2022-KFJJ-001).

Data Availability Statement

These data can be downloaded from the NASA and ESA websites.

Acknowledgments

We thank the researchers from the NASA Langley Research Center EOSDIS Distributed Active Archive Center (ASDC) and the European Centre for Medium Range Weather Forecasts (ECMWF) for providing satellite data and valuable information.

Conflicts of Interest

The authors declare no conflict of interest.

References

  1. Sun, Z.; Gebremichael, M.; Wang, Q.; Wang, J.; Sammis, T.W.; Nickless, A. Evaluation of Clear-Sky Incoming Radiation Estimating Equations Typically Used in Remote Sensing Evapotranspiration Algorithms. Remote Sens. 2013, 5, 4735–4752. [Google Scholar] [CrossRef]
  2. Ma, Y.; Yao, T.; Ishikawa, H.; Koike, T. Study of Land Surface Heat Fluxes and Water Cycle over the Tibetan Plateau. Dev. Earth Surf. Process. 2007, 10, 313–328. [Google Scholar]
  3. McDonald, K.R.; Enloe, Y.; Di, L.; Holloway, D. Data Integration Support to the Coordinated Enhanced Observing Period Project (CEOP). In Standard-Based Data and Information Systems for Earth Observation; Springer: Berlin/Heidelberg, Germany, 2010; pp. 27–36. [Google Scholar]
  4. Zhang, H.; Dong, X.; Xi, B.; Xin, X.; Liu, Q.; He, H.; Xie, X.; Li, L.; Yu, S. Retrieving High-Resolution Surface Photosynthetically Active Radiation from the MODIS and GOES-16 ABI Data. Remote Sens. Environ. 2021, 260, 112436. [Google Scholar] [CrossRef]
  5. Feng, C.; Zhang, X.; Wei, Y.; Zhang, W.; Hou, N.; Xu, J.; Yang, S.; Xie, X.; Jiang, B. Estimation of Long-Term Surface Downward Longwave Radiation over the Global Land from 2000 to 2018. Remote Sens. 2021, 13, 1848. [Google Scholar] [CrossRef]
  6. Ohmura, A.; Dutton, E.G.; Forgan, B.; Fröhlich, C.; Gilgen, H.; Hegner, H.; Heimo, A.; König-Langlo, G.; McArthur, B.; Müller, G.; et al. Baseline Surface Radiation Network (BSRN/WCRP): New Precision Radiometry for Climate Research. Bull. Am. Meteorol. Soc. 1998, 79, 2115–2136. [Google Scholar] [CrossRef]
  7. Yang, F.; Cheng, J.; Zeng, Q. Validation of a Cloud-Base Temperature-Based Single-Layer Cloud Model for Estimating Surface Longwave Downward Radiation. IEEE Geosci. Remote Sens. Lett. 2021, 19, 1–5. [Google Scholar] [CrossRef]
  8. Yu, S.; Li, L.; Cao, B.; Zhang, H.; Zhu, L.; Xin, X.; Liu, Q. Surface Downward Longwave Radiation Estimation from New Generation Geostationary Satellite Data. Atmos. Res. 2022, 276, 106255. [Google Scholar] [CrossRef]
  9. Wang, C.; Tang, B.-H.; Wu, H.; Tang, R.; Li, Z.-L. Estimation of Downwelling Surface Longwave Radiation under Heavy Dust Aerosol Sky. Remote Sens. 2017, 9, 207. [Google Scholar] [CrossRef]
  10. Gupta, S.K.; Darnell, W.L.; Wilber, A.C. A Parameterization for Longwave Surface Radiation from Satellite Data: Recent Improvements. J. Appl. Meteorol. Climatol. 1992, 31, 1361–1367. [Google Scholar] [CrossRef]
  11. Nussbaumer, E.A.; Pinker, R.T. Estimating Surface Long-Wave Radiative Fluxes at Global Scale. Q. J. R. Meteorol. Soc. 2012, 138, 1083–1093. [Google Scholar] [CrossRef]
  12. Dewitte, S.; Clerbaux, N. Measurement of the Earth Radiation Budget at the Top of the Atmosphere—A Review. Remote Sens. 2017, 9, 1143. [Google Scholar] [CrossRef]
  13. Lopes, F.M.; Dutra, E.; Trigo, I.F. Integrating Reanalysis and Satellite Cloud Information to Estimate Surface Downward Long-Wave Radiation. Remote Sens. 2022, 14, 1704. [Google Scholar] [CrossRef]
  14. Cao, Y.; Li, M.; Zhang, Y. Estimating the Clear-Sky Longwave Downward Radiation in the Arctic from FengYun-3D MERSI-2 Data. Remote Sens. 2022, 14, 606. [Google Scholar] [CrossRef]
  15. Yang, K.; Koike, T.; Stackhouse, P.; Mikovitz, C.; Cox, S.J. An Assessment of Satellite Surface Radiation Products for Highlands with Tibet Instrumental Data. Geophys. Res. Lett. 2006, 33, L22403. [Google Scholar] [CrossRef]
  16. Gui, S.; Liang, S.; Li, L. Validation of Surface Radiation Data Provided by the CERES over the Tibetan Plateau. In Proceedings of the 2009 17th International Conference on Geoinformatics, Fairfax, VA, USA, 12–14 August 2009; IEEE: New York, NY, USA, 2009; pp. 1–6. [Google Scholar]
  17. Gui, S.; Liang, S.; Li, L. Evaluation of Satellite-Estimated Surface Longwave Radiation Using Ground-Based Observations. J. Geophys. Res. Atmos. 2010, 115, D18214. [Google Scholar] [CrossRef]
  18. Zhang, T.; Stackhouse Jr, P.W.; Gupta, S.K.; Cox, S.J.; Mikovitz, J.C.; Hinkelman, L.M. The Validation of the GEWEX SRB Surface Shortwave Flux Data Products Using BSRN Measurements: A Systematic Quality Control, Production and Application Approach. J. Quant. Spectrosc. Radiat. Transf. 2013, 122, 127–140. [Google Scholar] [CrossRef]
  19. Gui, S.; Liang, S.; Wang, K.; Li, L.; Zhang, X. Assessment of Three Satellite-Estimated Land Surface Downwelling Shortwave Irradiance Data Sets. IEEE Geosci. Remote Sens. Lett. 2010, 7, 776–780. [Google Scholar] [CrossRef]
  20. Yan, H.; Huang, J.; Minnis, P.; Wang, T.; Bi, J. Comparison of CERES Surface Radiation Fluxes with Surface Observations over Loess Plateau. Remote Sens. Environ. 2011, 115, 1489–1500. [Google Scholar] [CrossRef]
  21. Sun, D.; Ji, C.; Sun, W.; Yang, Y.; Wang, H. Accuracy Assessment of Three Remote Sensing Shortwave Radiation Products in the Arctic. Atmos. Res. 2018, 212, 296–308. [Google Scholar] [CrossRef]
  22. Kratz, D.P.; Gupta, S.K.; Wilber, A.C.; Sothcott, V.E. Validation of the CERES Edition-4A Surface-Only Flux Algorithms. J. Appl. Meteorol. Climatol. 2020, 59, 281–295. [Google Scholar] [CrossRef]
  23. Mikovitz, J.C.; Stackhouse Jr, P.W.; Gupta, S.K.; Zhang, T.; Cox, S.J.; Doelling, D.R.; Keyes, D.F.; Hinkelman, L.M. A Comparison of Surface Flux Products from GEWEX Surface Radiation Budget with ECMWF ERA-40, NCEP/NCAR Reanalysis and CERES SRBAVG. In Proceedings of the 12th Conference on Atmospheric Radiation, Madison, WI, USA, 10–14 July 2006; pp. 10–14. [Google Scholar]
  24. Loeb, N.G.; Manalo-Smith, N.; Su, W.; Shankar, M.; Thomas, S. CERES Top-of-Atmosphere Earth Radiation Budget Climate Data Record: Accounting for in-Orbit Changes in Instrument Calibration. Remote Sens. 2016, 8, 182. [Google Scholar] [CrossRef]
  25. Doelling, D.R.; Loeb, N.G.; Keyes, D.F.; Nordeen, M.L.; Morstad, D.; Nguyen, C.; Wielicki, B.A.; Young, D.F.; Sun, M. Geostationary Enhanced Temporal Interpolation for CERES Flux Products. J. Atmos. Ocean. Technol. 2013, 30, 1072–1090. [Google Scholar] [CrossRef]
  26. Rutan, D.A.; Kato, S.; Doelling, D.R.; Rose, F.G.; Nguyen, L.T.; Caldwell, T.E.; Loeb, N.G. CERES Synoptic Product: Methodology and Validation of Surface Radiant Flux. J. Atmos. Ocean. Technol. 2015, 32, 1121–1143. [Google Scholar] [CrossRef]
  27. Fu, Q.; Liou, K.N. Parameterization of the Radiative Properties of Cirrus Clouds. J. Atmos. Sci. 1993, 50, 2008–2025. [Google Scholar] [CrossRef]
  28. Fu, Q.; Liou, K.; Cribb, M.; Charlock, T.; Grossman, A. Multiple Scattering Parameterization in Thermal Infrared Radiative Transfer. J. Atmos. Sci. 1997, 54, 2799–2812. [Google Scholar] [CrossRef]
  29. Doelling, D.R.; Sun, M.; Nordeen, M.L.; Haney, C.O.; Keyes, D.F.; Mlynczak, P.E. Advances in Geostationary-Derived Longwave Fluxes for the CERES Synoptic (SYN1deg) Product. J. Atmos. Ocean. Technol. 2016, 33, 503–521. [Google Scholar] [CrossRef]
  30. Dee, D.P.; Uppala, S.M.; Simmons, A.J.; Berrisford, P.; Poli, P.; Kobayashi, S.; Andrae, U.; Balmaseda, M.; Balsamo, G.; Bauer, P.; et al. The ERA-Interim Reanalysis: Configuration and Performance of the Data Assimilation System. Q. J. R. Meteorol. Soc. 2011, 137, 553–597. [Google Scholar] [CrossRef]
  31. Karlsson, K.-G.; Riihelä, A.; Müller, R.; Meirink, J.; Sedlar, J.; Stengel, M.; Lockhoff, M.; Trentmann, J.; Kaspar, F.; Hollmann, R.; et al. CLARA-A1: A Cloud, Albedo, and Radiation Dataset from 28 Yr of Global AVHRR Data. Atmos. Chem. Phys. 2013, 13, 5351–5367. [Google Scholar] [CrossRef]
  32. Karlsson, K.-G.; Anttila, K.; Trentmann, J.; Stengel, M.; Fokke Meirink, J.; Devasthale, A.; Hanschmann, T.; Kothe, S.; Jääskeläinen, E.; Sedlar, J.; et al. CLARA-A2: The Second Edition of the CM SAF Cloud and Radiation Data Record from 34 Years of Global AVHRR Data. Atmos. Chem. Phys. 2017, 17, 5809–5828. [Google Scholar] [CrossRef]
  33. Sorooshian, S.; Lawford, R.; Try, P.; Rossow, W.; Roads, J.; Polcher, J.; Sommeria, G.; Schiffer, R. Water and Energy Cycles: Investigating the Links. World Meteorol. Organ. Bull. 2005, 54, 58–64. [Google Scholar]
  34. Pinker, R.T.; Tarpley, J.D.; Laszlo, I.; Mitchell, K.E.; Houser, P.R.; Wood, E.F.; Schaake, J.C.; Robock, A.; Lohmann, D.; Cosgrove, B.A.; et al. Surface Radiation Budgets in Support of the GEWEX Continental-Scale International Project (GCIP) and the GEWEX Americas Prediction Project (GAPP), Including the North American Land Data Assimilation System (NLDAS) Project. J. Geophys. Res. Atmos. 2003, 108, GCP5-1. [Google Scholar] [CrossRef]
  35. Randall, D.; Krueger, S.; Bretherton, C.; Curry, J.; Duynkerke, P.; Moncrieff, M.; Ryan, B.; Starr, D.; Miller, M.; Rossow, W.; et al. Confronting Models with Data: The GEWEX Cloud Systems Study. Bull. Am. Meteorol. Soc. 2003, 84, 455–469. [Google Scholar] [CrossRef]
  36. Gupta, S.K.; Ritchey, N.A.; Wilber, A.C.; Whitlock, C.H.; Gibson, G.G.; Stackhouse Jr, P.W. A Climatology of Surface Radiation Budget Derived from Satellite Data. J. Clim. 1999, 12, 2691–2710. [Google Scholar] [CrossRef]
  37. Rossow, W.B.; Schiffer, R.A. Advances in Understanding Clouds from ISCCP. Bull. Am. Meteorol. Soc. 1999, 80, 2261–2288. [Google Scholar] [CrossRef]
  38. Wilber, A.C. Surface Emissivity Maps for Use in Satellite Retrievals of Longwave Radiation; NASA: Washington, WA, USA, 1999. [Google Scholar]
  39. Suarez, M.J.; daSilva, A.; Dee, D.; Bloom, S.; Bosilovich, M.; Pawson, S.; Schubert, S.; Wu, M.-L.; Sienkiewicz, M.; Stajner, I. Documentation and Validation of the Goddard Earth Observing System (GEOS) Data Assimilation System, Version 4; NASA: Washington, WA, USA, 2005. [Google Scholar]
  40. Li, J.; Wang, W.-C.; Chen, G.; You, Q. Characteristics of Top-of-Atmosphere Radiation Budget over the Tibetan Plateau and Its Bias Sources in Climate Models. Atmos. Res. 2022, 276, 106256. [Google Scholar] [CrossRef]
  41. Xin, X.; Yu, S.; Sun, D.; Zhang, H.; Li, L.; Zhong, B. Assessment of Three Satellite-Derived Surface Downward Longwave Radiation Products in Polar Regions. Atmosphere 2022, 13, 1602. [Google Scholar] [CrossRef]
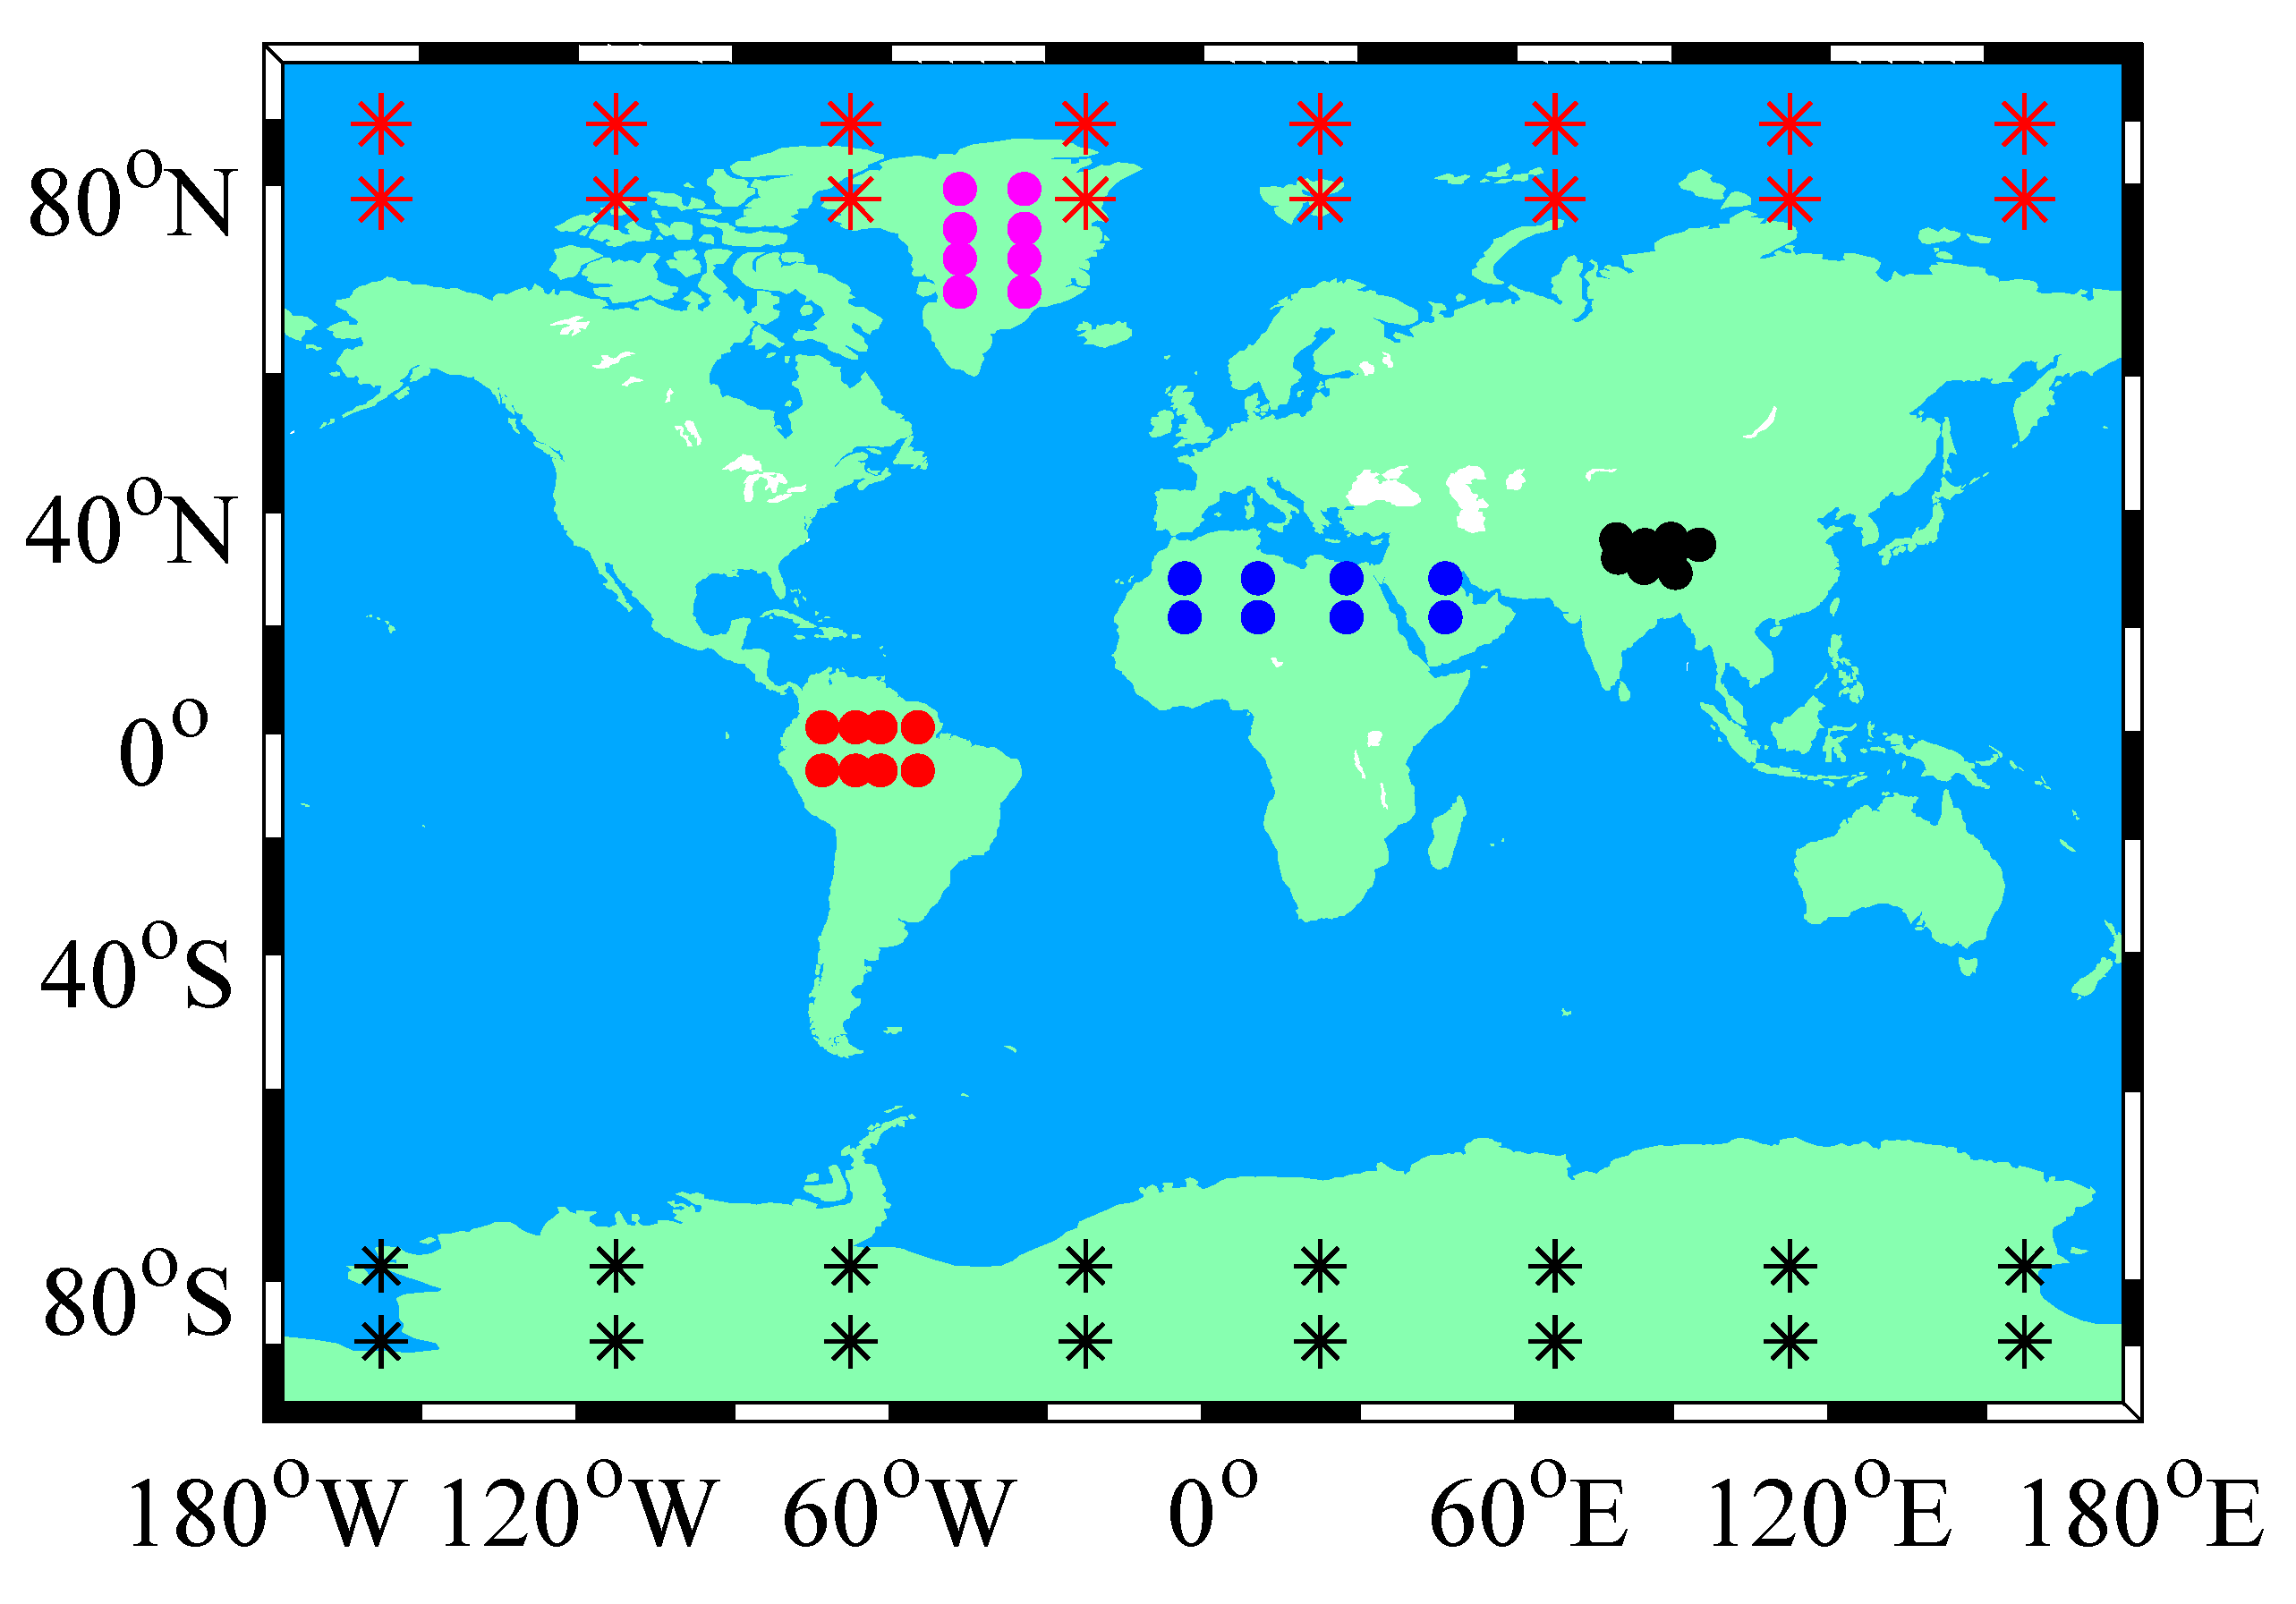
Figure 1. Locations of the special areas, and locations of the sites in each special area. The special areas are the Arctic, Greenland, Tibet Plateau, Sahara, Amazon Basin and Antarctic from the Arctic to the Antarctic, respectively. The red stars, black stars, blue dots, black dots, red dots and purple dots represent the sites selected in Arctic, Antarctic, Sahara, Tibet Plateau, Amazon Basin and Greenland, respectively.
Remotesensing 15 04244 g001
Figure 2. Difference indices between SDL products from CERES-SYN and ECMWF-SRB. (ae) are R2, RMSEab, RMSEre, MBEab and MBEre, respectively.
Remotesensing 15 04244 g002
Figure 3. Mean values of the two SDL products from CERES-SYN and ECMWF-SRB at the sites in each special area. (af) are the special areas of the Arctic, Antarctic, Sahara, Tibet Plateau, Amazon Basin and Greenland, respectively.
Remotesensing 15 04244 g003
Figure 4. Discreteness between the SDL products from CERES-SYN and ECMWF-SRB at the sites in each special area. (af) are the special areas of Arctic, Antarctic, Sahara, Tibet Plateau, Amazon Basin and Greenland, respectively.
Remotesensing 15 04244 g004aRemotesensing 15 04244 g004b
Figure 5. Difference indices between SDL products of CERES-SYN and GEWEX-SRB. (ae) are R2, RMSEab, RMSEre, MBEab and MBEre, respectively.
Remotesensing 15 04244 g005
Figure 6. Mean values of the two SDL products of CERES-SYN and GEWEX-SRB at the sites in each special area. (af) are the special areas of the Arctic, Antarctic, Sahara, Tibet Plateau, Amazon Basin and Greenland, respectively.
Remotesensing 15 04244 g006
Figure 7. Discreteness between the SDL products from the CERES-SYN and GEWEX-SRB at the sites in each special area. (af) are the special areas of the Arctic, Antarctic, Sahara, Tibet Plateau, Amazon Basin and Greenland, respectively.
Remotesensing 15 04244 g007
Figure 8. Difference indices between SDL products of ECMWF-SRB and GEWEX-SRB. (ae) are R2, RMSEab, RMSEre, MBEab and MBEre, respectively.
Remotesensing 15 04244 g008
Figure 9. Mean values of the two SDL products of ECMWF-SRB and GEWEX-SRB at the sites in each special area. (af) are the special areas of Arctic, Antarctic, Sahara, Tibet Plateau, Amazon Basin and Greenland, respectively.
Remotesensing 15 04244 g009
Figure 10. Discreteness between the SDL products of the ECMWF-SRB and the GEWEX-SRB at the sites in each special area. (af) are the special areas of the Arctic, Antarctic, Sahara, Tibet Plateau, Amazon Basin and Greenland, respectively.
Remotesensing 15 04244 g010
Figure 11. Impact of seasons and years on the differences among different SDL products. The left side of (af) shows the impact of different seasons on the differences between different SDL products, and the right side of (af) shows the impact of different years on the differences. The thin lines of different colors in the figures represent the change in RMSEab with months or years at different sites in the same area, and the blue dotted line in each figure is the mean value of RMSEab at different sites. The special areas corresponding to subgraphs (af) are the Arctic, Antarctic, Sahara, Tibet Plateau, Amazon Basin and Greenland, respectively.
Remotesensing 15 04244 g011aRemotesensing 15 04244 g011b
Figure 12. CFRF of CERES-SYN and GEWEX-SRB. (a) CFRF of CERES-SYN, (b) CFRF of GEWEX-SRB.
Remotesensing 15 04244 g012
Figure 13. Difference indices between CFRFs of CERES-SYN and GEWEX-SRB. (ae) are R2, RMSEab, RMSEre, MBEab and MBEre, respectively.
Remotesensing 15 04244 g013
Figure 14. Discreteness between the SDL products of CERES-SYN and GEWEX-SRB under clear sky conditions at the sites in each special area. (af) are the special areas of the Arctic, Antarctic, Sahara, Tibet Plateau, Amazon Basin and Greenland, respectively.
Remotesensing 15 04244 g014
Figure 15. Comparison of difference indices between SDL products from the CERES-SYN and the GEWEX-SRB in the special areas (Arctic, Antarctic, Sahara, Tibet Plateau, Amazon Basin and Greenland) under all sky and clear sky conditions. (ae) are R2, RMSEab, RMSEre, MBEab and MBEre, respectively.
Remotesensing 15 04244 g015
Figure 16. CFRF comparison for CERES-SYN and GEWEX-SRB in the special areas. The red bar and blue bar represent the CFRFs of the CERES-SYN and the GEWEX-SRB, respectively. The green bar represents the difference between the CFRFs of the CERES-SYN and the GEWEX-SRB.
Remotesensing 15 04244 g016
Figure 17. Difference indices between daily SDL products from CERES-SYN and GEWEX-SRB. (ae) are R2, RMSEab, RMSEre, MBEab and MBEre, respectively.
Remotesensing 15 04244 g017
Table 1. The SDL product information from CERES-SYN, ECMWF-SRB and GEWEX-SRB used in this paper.
SDL ProductsSpatial ScaleSpatial ResolutionTemporal ResolutionVersions
CERES-SYNGlobal1° × 1°MonthlyEdition4
ECMWF-SRBGlobal0.25° × 0.25°MonthlyV2.0
GEWEX-SRBGlobal1° × 1°MonthlyRelease 4
Table 2. Site mark symbols and quantities in each special area (“N” denotes the quantity of site).
AreaSymbolsNAreaSymbolsNAreaSymbolsN
Arctic* (red)16Sahara● (blue)8Amazon Basin● (red)8
Antarctic* (black)16Tibet Plateau● (black)8Greenland● (purple)8
Table 3. R2, RMSEab (Wm−2), RMSEre (%), MBEab (Wm−2) and MBEre (%) between the SDL products from CERES-SYN and ECMWF-SRB in each special area.
AreaR2RMSEab
(RMSEre)
MBEab
(MBEre)
AreaR2RMSEab
(RMSEre)
MBEab
(MBEre)
Arctic0.9415.48
(6.85)
4.10
(1.86)
Tibet Plateau0.9631.85
(14.30)
−26.39
(−11.82)
Antarctic0.7416.81
(12.42)
−11.34
(−8.74)
Amazon Basin0.179.85
(2.37)
2.66
(0.65)
Sahara0.9811.47
(3.28)
−9.78
(−2.79)
Greenland0.8817.04
(9.56)
−11.09
(−6.24)
Table 4. R2, RMSEab (Wm−2), RMSEre (%), MBEab (Wm−2) and MBEre (%) between the SDL products from the CERES-SYN and GEWEX-SRB in each special area.
AreaR2RMSEab
(RMSEre)
MBEab
(MBEre)
AreaR2RMSEab
(RMSEre)
MBEab
(MBEre)
Arctic0.8623.20
(10.22)
−15.91
(−7.01)
Tibet Plateau0.9621.08
(9.50)
−17.57
(−7.90)
Antarctic0.5424.37
(18.12)
−16.59
(−12.95)
Amazon Basin0.1411.84
(2.83)
−0.86
(−0.19)
Sahara0.9314.26
(4.10)
7.03
(2.03)
Greenland0.7931.56
(17.66)
−29.29
(−16.37)
Table 5. R2, RMSEab (Wm−2), RMSEre (%), MBEab (Wm−2) and MBEre (%) between the SDL products from the ECMWF-SRB and GEWEX-SRB in each special area.
AreaR2RMSEab
(RMSEre)
MBEab
(MBEre)
AreaR2RMSEab
(RMSEre)
MBEab
(MBEre)
Arctic0.8929.27
(13.03)
−15.29
(−6.84)
Tibet Plateau0.9617.78
(8.98)
8.93
(4.47)
Antarctic0.7013.90
(10.99)
−4.51
(−4.23)
Amazon Basin0.625.53
(1.33)
−0.43
(−0.10)
Sahara0.8027.36
(8.09)
21.25
(6.28)
Greenland0.8523.68
(14.42)
−18.09
(−10.93)
Table 6. RMSEab (Wm−2), RMSEre (%), MBEab (Wm−2) and MBEre (%) between the SDL products from the ECMWF-SRB and the GEWEX-SRB under clear sky conditions in each special area.
AreaR2RMSEab
(RMSEre)
MBEab
(MBEre)
AreaR2RMSEab
(RMSEre)
MBEab
(MBEre)
Arctic0.978.85
(4.98)
−3.48
(−2.00)
Tibet Plateau0.9821.36
(11.81)
−19.80
(−10.96)
Antarctic0.9020.73
(20.06)
−15.05
(−15.10)
Amazon Basin0.129.65
(2.42)
0.35
(0.10)
Sahara0.9511.20
(3.29)
−0.07
(−0.01)
Greenland0.9421.18
(15.28)
−18.01
(−13.01)
Table 7. The CFRFs and the difference between the two CFRFs (Wm−2).
AreaGE_FCE_FΔFAreaGE_FCE_FΔF
Arctic33.0045.43−12.43Tibet Plateau43.9441.712.23
Antarctic27.8729.41−1.54Amazon Basin18.5519.76−1.21
Sahara15.548.447.10Greenland27.3338.61−11.28
CE_F denotes the CFRFs of CERES-SYN, GE_F denotes the CFRFs of GEWEX-SRB, and ΔF denotes the difference between the CFRFs of CERES-SYN and GEWEX-SRB.
Disclaimer/Publisher’s Note: The statements, opinions and data contained in all publications are solely those of the individual author(s) and contributor(s) and not of MDPI and/or the editor(s). MDPI and/or the editor(s) disclaim responsibility for any injury to people or property resulting from any ideas, methods, instructions or products referred to in the content.