Article

Glacier Change in the West Kunlun Main Peak Area from 2000 to 2020

1
College of Geography and Environment Sciences, Northwest Normal University, Lanzhou 730070, China
2
National Disaster Reduction Center, Ministry of Emergency Management, Beijing 100124, China
*
Author to whom correspondence should be addressed.
Remote Sens. 2023, 15(17), 4236; https://doi.org/10.3390/rs15174236
Submission received: 10 June 2023 / Revised: 25 August 2023 / Accepted: 26 August 2023 / Published: 29 August 2023
(This article belongs to the Section Remote Sensing for Geospatial Science)

Abstract

:
Glaciers are sensitive indicators of climate change, and investigation of their dynamics is crucial for ensuring regional ecological security as well as disaster prevention and mitigation measures. Based on Landsat Thematic Mapper (TM)/Enhanced Thematic Mapper Plus (ETM+)/Operational Land Imager (OLI) imagery, the outlines and length of glaciers in the West Kunlun Main Peak Area (WKMPA) during 2000–2020 were obtained by combining a band ratio method with manual interpretation and an automatic extraction method for the glacier centerline, respectively. There were 440 glaciers in the WKMPA in 2020, covering an area of 2964.59 ± 54.87 km2, with an average length of 2916 ± 60 m. The glacier count increased due to division, while the area and length all exhibited a declining trend from 2000 to 2020, at rates of −0.04%·a−1 (24.83 km2) and −0.11%·a−1 (66 m), respectively. Glacier retreat was primarily observed during the early period (2000–2005). Except for glaciers located above an elevation of 6250 m, the glacier area decreased with each altitude interval from 2000 to 2020, and the rate of relative change in glacier area generally decreased with increasing altitude. Moreover, except for a slight increase in north-facing glaciers, the area of glaciers facing other orientations decreased during 2000–2020. The accuracy of the empirical formula fit for glacier length was highly dependent on glacier class, with greater precision observed for smaller glaciers and lower precision for larger valley-basin glaciers due to their complex morphological structures being neglected and only a single quantitative relationship being considered. There was a time lag of 12 years between temperature changes and glacier area response in this region. The mechanism by which glacier division affects glacier change is complex, requiring dissection of multiple factors such as area, length, and terminal elevation before and after division.

1. Introduction

In 2023, the Intergovernmental Panel on Climate Change (IPCC) has unequivocally reported that global warming, with a global surface temperature increase of 1.1 °C above the 1850–1900 baseline, is primarily caused by human activities through greenhouse gas emission [1]. The cryosphere is undergoing significant changes, exerting a direct and sensitive influence on the climate system. Its alterations have substantial impacts on global and regional climates and ecosystems, as well as human wellbeing [2]. Glaciers, as a crucial component of the cryosphere, serve as highly sensitive indicators of climate and environmental change. Their meltwater not only regulates river runoff but also acts as an essential water resource in arid and semi-arid regions, where they are commonly referred to as solid reservoirs [3,4,5]. Meanwhile, natural disasters such as glacier collapses and glacial lake outburst floods resulting from glacier change have posed significant threats to local residents and downstream infrastructure [6,7,8]. Therefore, it is imperative to enhance regional glacier monitoring, analyze its trends, and explore its relationship with climate change. This can contribute to the protection of the regional ecological environment and ensure water resource security, enhance the utilization and management of water resources, and prevent and mitigate disasters.
In recent years, the heating rate of the Tibetan Plateau and its surrounding areas has exceeded that of other regions [9,10]. According to previous research, the Tibetan Plateau region is projected to experience a temperature increase of 2.1 °C under a global warming scenario of 1.5 °C [11]. Abnormal climate change has accelerated glacier melting in this area, resulting in an estimated reduction of glaciers by 49%, 51%, and 64% respectively under RCP4.5, RCP6.0, and RCP8.5 scenarios [12] and leading to their abnormal state [13]. Meanwhile, the glaciers in the Pamir–Karakoram–West Kunlun region, also known as the Karakoram anomaly [14,15,16,17,18], depict a situation of general stability.
The West Kunlun region is the most concentrated area of large mountain glaciers in China [19]. Several studies on glacier change in the West Kunlun region have been conducted in the 21st century [17,20,21,22,23]. Studies on glacier area have primarily relied upon early digital topographic maps and Landsat images with long time intervals. The findings indicate that the rates of change in glacier area within the West Kunlun Main Peak Area (WKMPA) during the periods 1970s–1990, 1990–2010s, 1970s–2016, and 2010–2017 were −0.16 ± 0.10%·a−1 [20], −0.01 ± 0.32%·a−1 [20], −0.07 ± 0.10%·a−1 [17], and 0.16%·a−1 [21]. Research on glacier mass balance has traditionally relied on topographic maps, SRTM DEM, and ICESat data [17,20,22]. However, the results have shown significant discrepancies: −0.06 ± 0.13 m w.e.a−1 during 1970–2000 [17] and 0.23 ± 0.24 m w.e.a−1 during 2003–2009 [20], respectively. Some glaciers exhibit a mass balance close to zero or even a slight thickening trend [22]. Research on glacier velocity has primarily focused on extraction methods and the short-term continuous trend, utilizing techniques such as optical image cross-correlation and feature tracking [21]. The findings indicate that the surface motion velocity of the Duofeng Glacier was marginally lower in 2013–2014 compared with 2001–2002 [23].
Previous studies on glacier change in this region have mainly focused on individual characteristics such as area, surface elevation, and movement velocity with relatively long time intervals. However, given the current state of glacier anomalies, it is of great significance to investigate glacier change using long-term time series and high spatial–temporal resolution remote sensing images. Glacial meltwater constitutes a crucial water resource in this area and holds immense significance for maintaining its own resource security [24,25].
In this study, Landsat images from 2000 to 2020 were utilized to delineate the glaciers in the WKMPA by integrating a band ratio method with manual interpretation. The glacier changes in the WKMPA were quantified based on diverse parameters such as number, area, length, and volume. Then, the linkages among glacier change, climate change, and topographic factors were investigated to enhance our comprehension of the response of glaciers to climate change. This can serve as a scientific basis for water resources assessment and eco-environmental protection in the WKMPA.

2. Study Area

The Kunlun Mountains traverse the northern region of the Tibetan Plateau, stretching from the Pamir Plateau in the west to the Ruoergai Basins in the east. They borders on the hinterland of the plateau, and are adjacent to the Tarim and Qaidam Basins in their northward direction [26]. They are delimited by the Kunlun Mountain Pass and Qiongmuzitage Peak on the Tibetan Highway, and comprise three distinct sections, about 5500~6000 km2. The area is characterized by a series of parallel mountain ranges that run from northwest to southeast. The elevation of the WKMPA (80°E~82°E, 35°N~36°N) ranges from approximately 4800 to 7200 m, with the highest peak being Kunlun Peak (7167 m) [20]. The climate is predominantly characterized as a plateau mountain arid climate. Both the average daily mild temperature and the annual temperature show significant fluctuation [25]. It is administratively subordinate to Cele County, Hetian County, and Yutian County in the Hotan prefecture of Xinjiang province and Ritu County in the Ngari prefecture of the Tibet autonomous region. There is no inherent geographical condition conducive to glacier development in the Kunlun Mountains; rather, it was the uplift of the Tibetan Plateau since the Pleistocene that elevated this region to rise above the snow line in ice ages and interglacial periods [27]. The glaciers in the WKMPA are classified as continental glaciers, primarily composed of valley glaciers, ice caps, and glacial cirques. Many valley glaciers with multiple branches are distributed in the steep north-facing region, where meltwater primarily flows into the Tarim Basin via the Yurungkash and Keriya Rivers. The southern slope of the terrain is more gently undulating, flat and wide at the ice tongue, with meltwater flowing into salt lakes such as Aksai Chin, Guozaco, and Bondarco (Figure 1).

3. Materials and Methods

3.1. Data

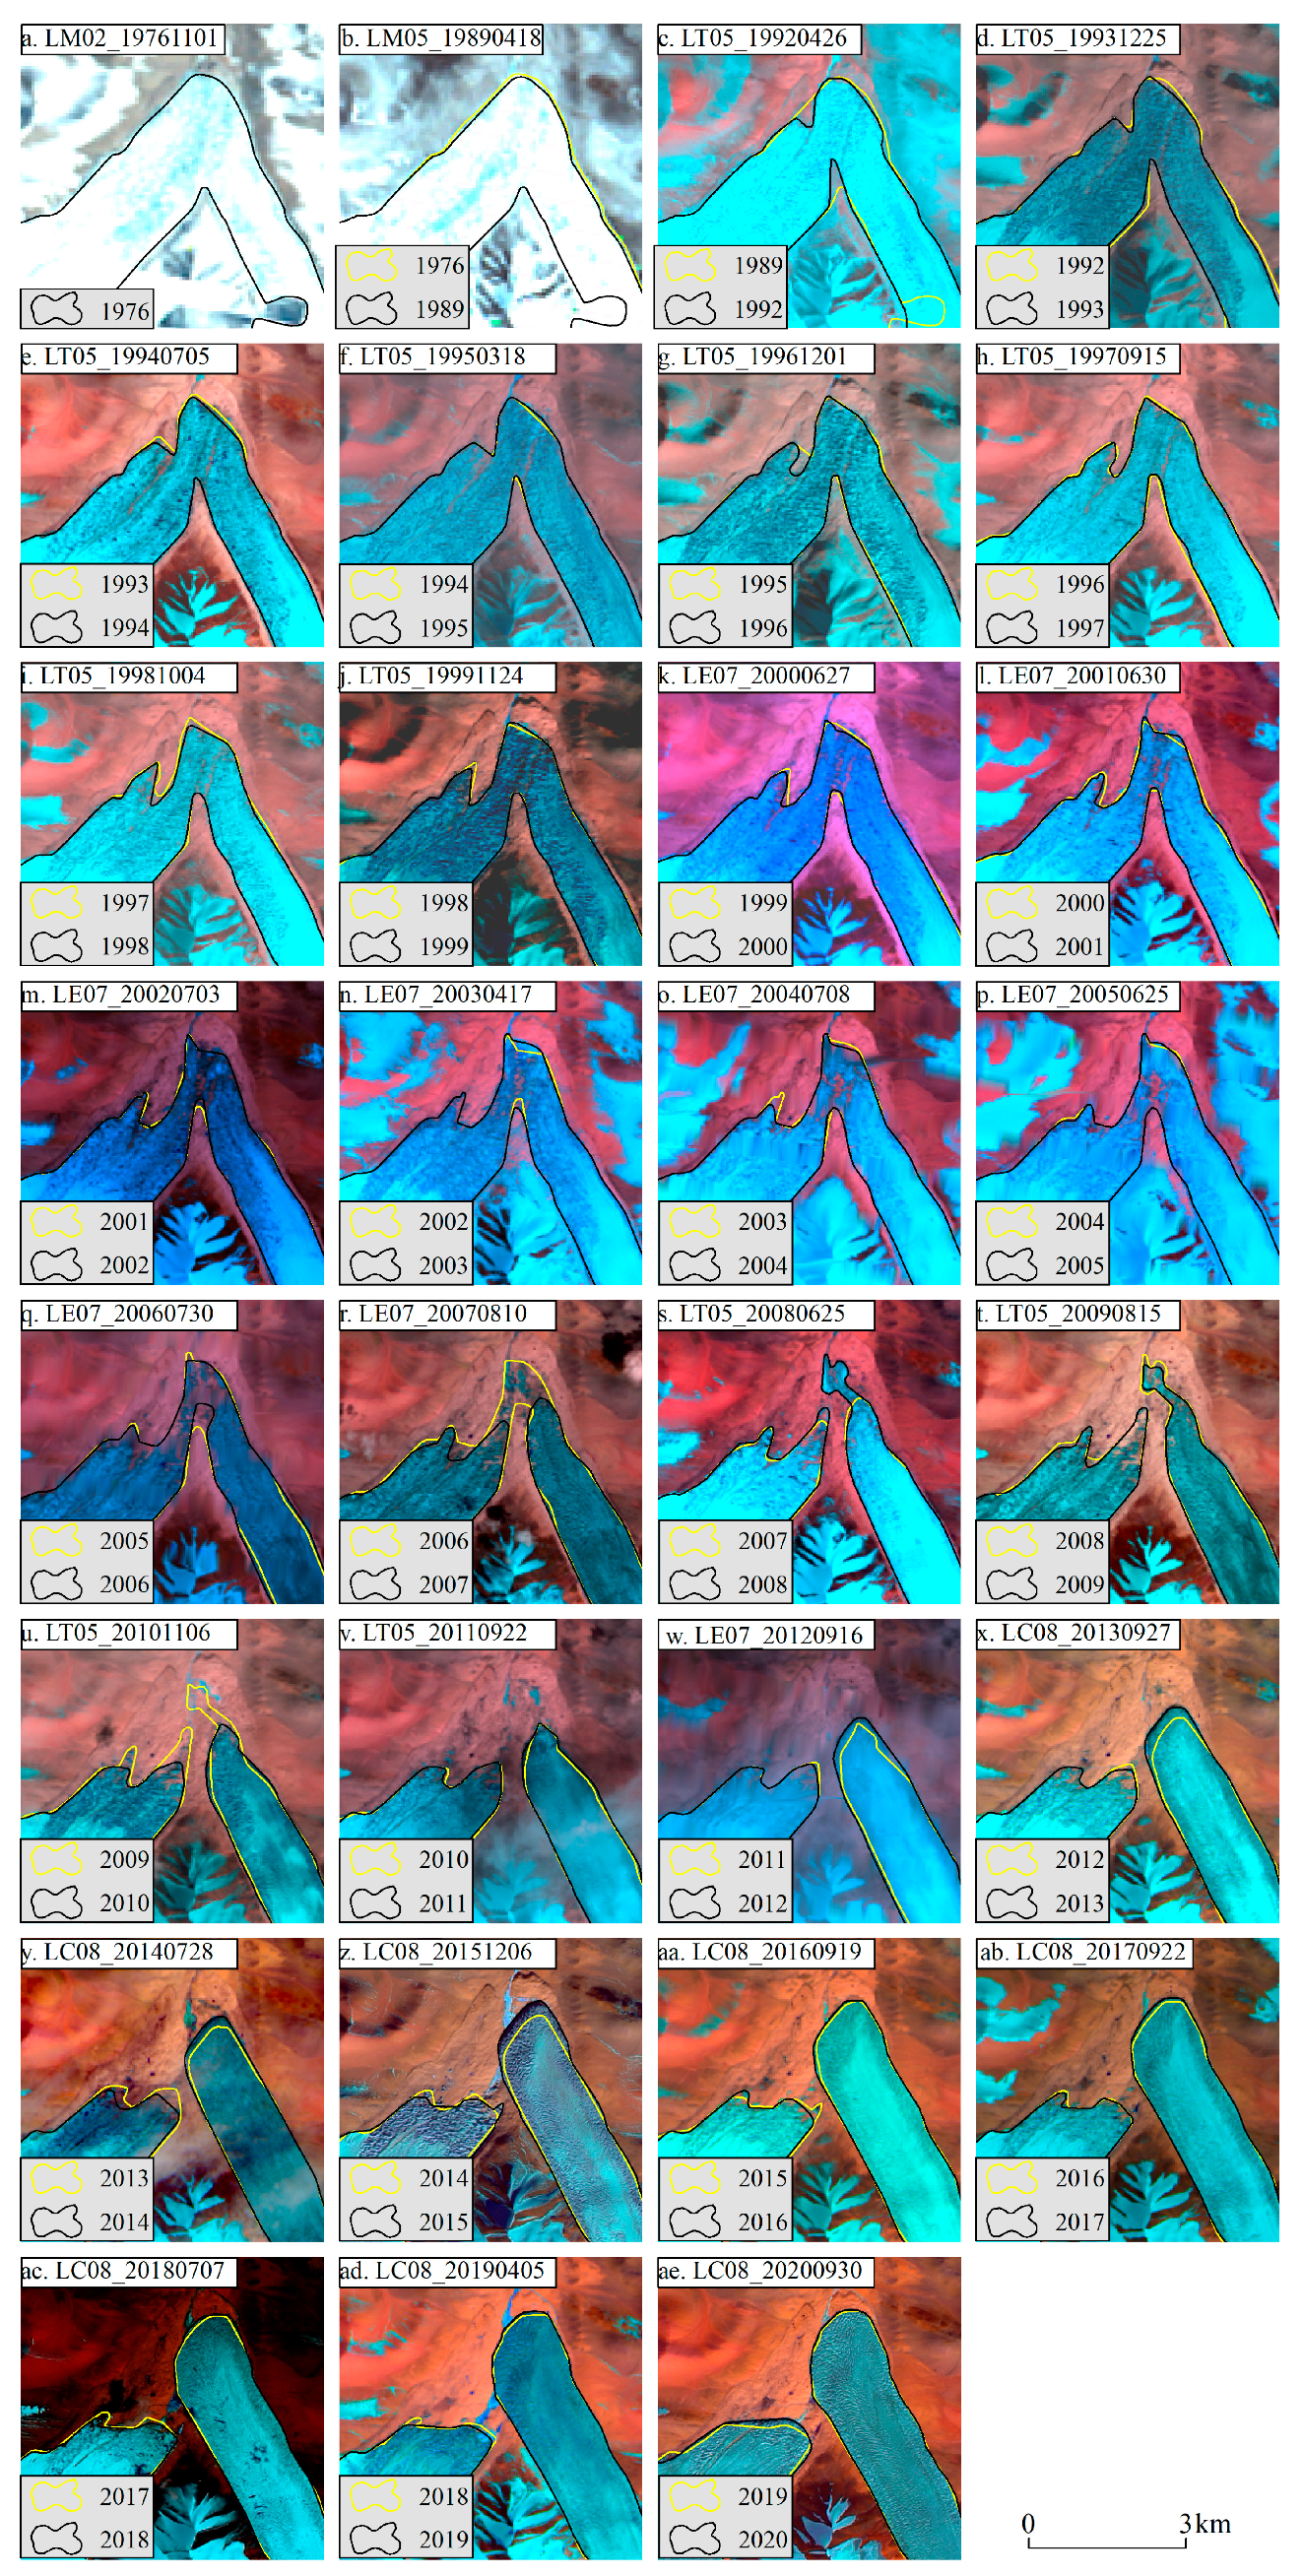
Due to the inaccessibility of most glaciers, remote sensing technology is widely utilized for glacier monitoring [28]. To delineate and analyze changes in glaciers within the WKMPA, Landsat Multi Spectral Scanner (MSS)/Thematic Mapper (TM)/Enhanced Thematic Mapper Plus (ETM+)/pan-sharpened Operational Land Imager (OLI) images (Figure 2) were obtained from the United States Geological Survey (USGS) website (https://earthexplorer.usgs.gov/, accessed on 1 December 2022). The images underwent Level 1 processing, including radiometric, geometric, and topographic correction. To improve the spatial resolution of images while preserving their multi-spectral information, we fused the visible bands and panchromatic band of the Landsat ETM+ and OLI images, resulting in a spatial resolution of 15 m with the Create Pan-sharpened Raster Dataset Arctool in ArcGIS.
In this study, the Shuttle Radar Topography Mission Version 3 (SRTM V3) DEM dataset with a spatial resolution of 30 m and a vertical accuracy of 16 m [29] was acquired from the Geospatial Data Cloud platform (http://www.gscloud.cn/, accessed on 1 December 2022) of the Chinese Academy of Sciences, to extract topographic information such as elevation, orientation, and glacier centerlines.
We opted for ERA5-Land monthly temperature and annual precipitation data to investigate the climatic characteristics in the WKMPA. ERA5-Land is a global land-surface dataset, consistent with atmospheric data from the ERA5 reanalysis. ERA5 is the fifth-generation global atmospheric reanalysis dataset from the European Centre for Medium-Range Weather Forecasts (ECMWF), which employs an integrated forecasting system (IFS) and significantly improves data accuracy [30,31]. ERA5-Land data were obtained from the Copernicus Climate Change Service platform (https://cds.climate.copernicus.eu/cdsapp#!/home, accessed on 1 December 2022) and possessed a spatial resolution of 0.1°.

3.2. Methods

3.2.1. Glacier Information Extraction

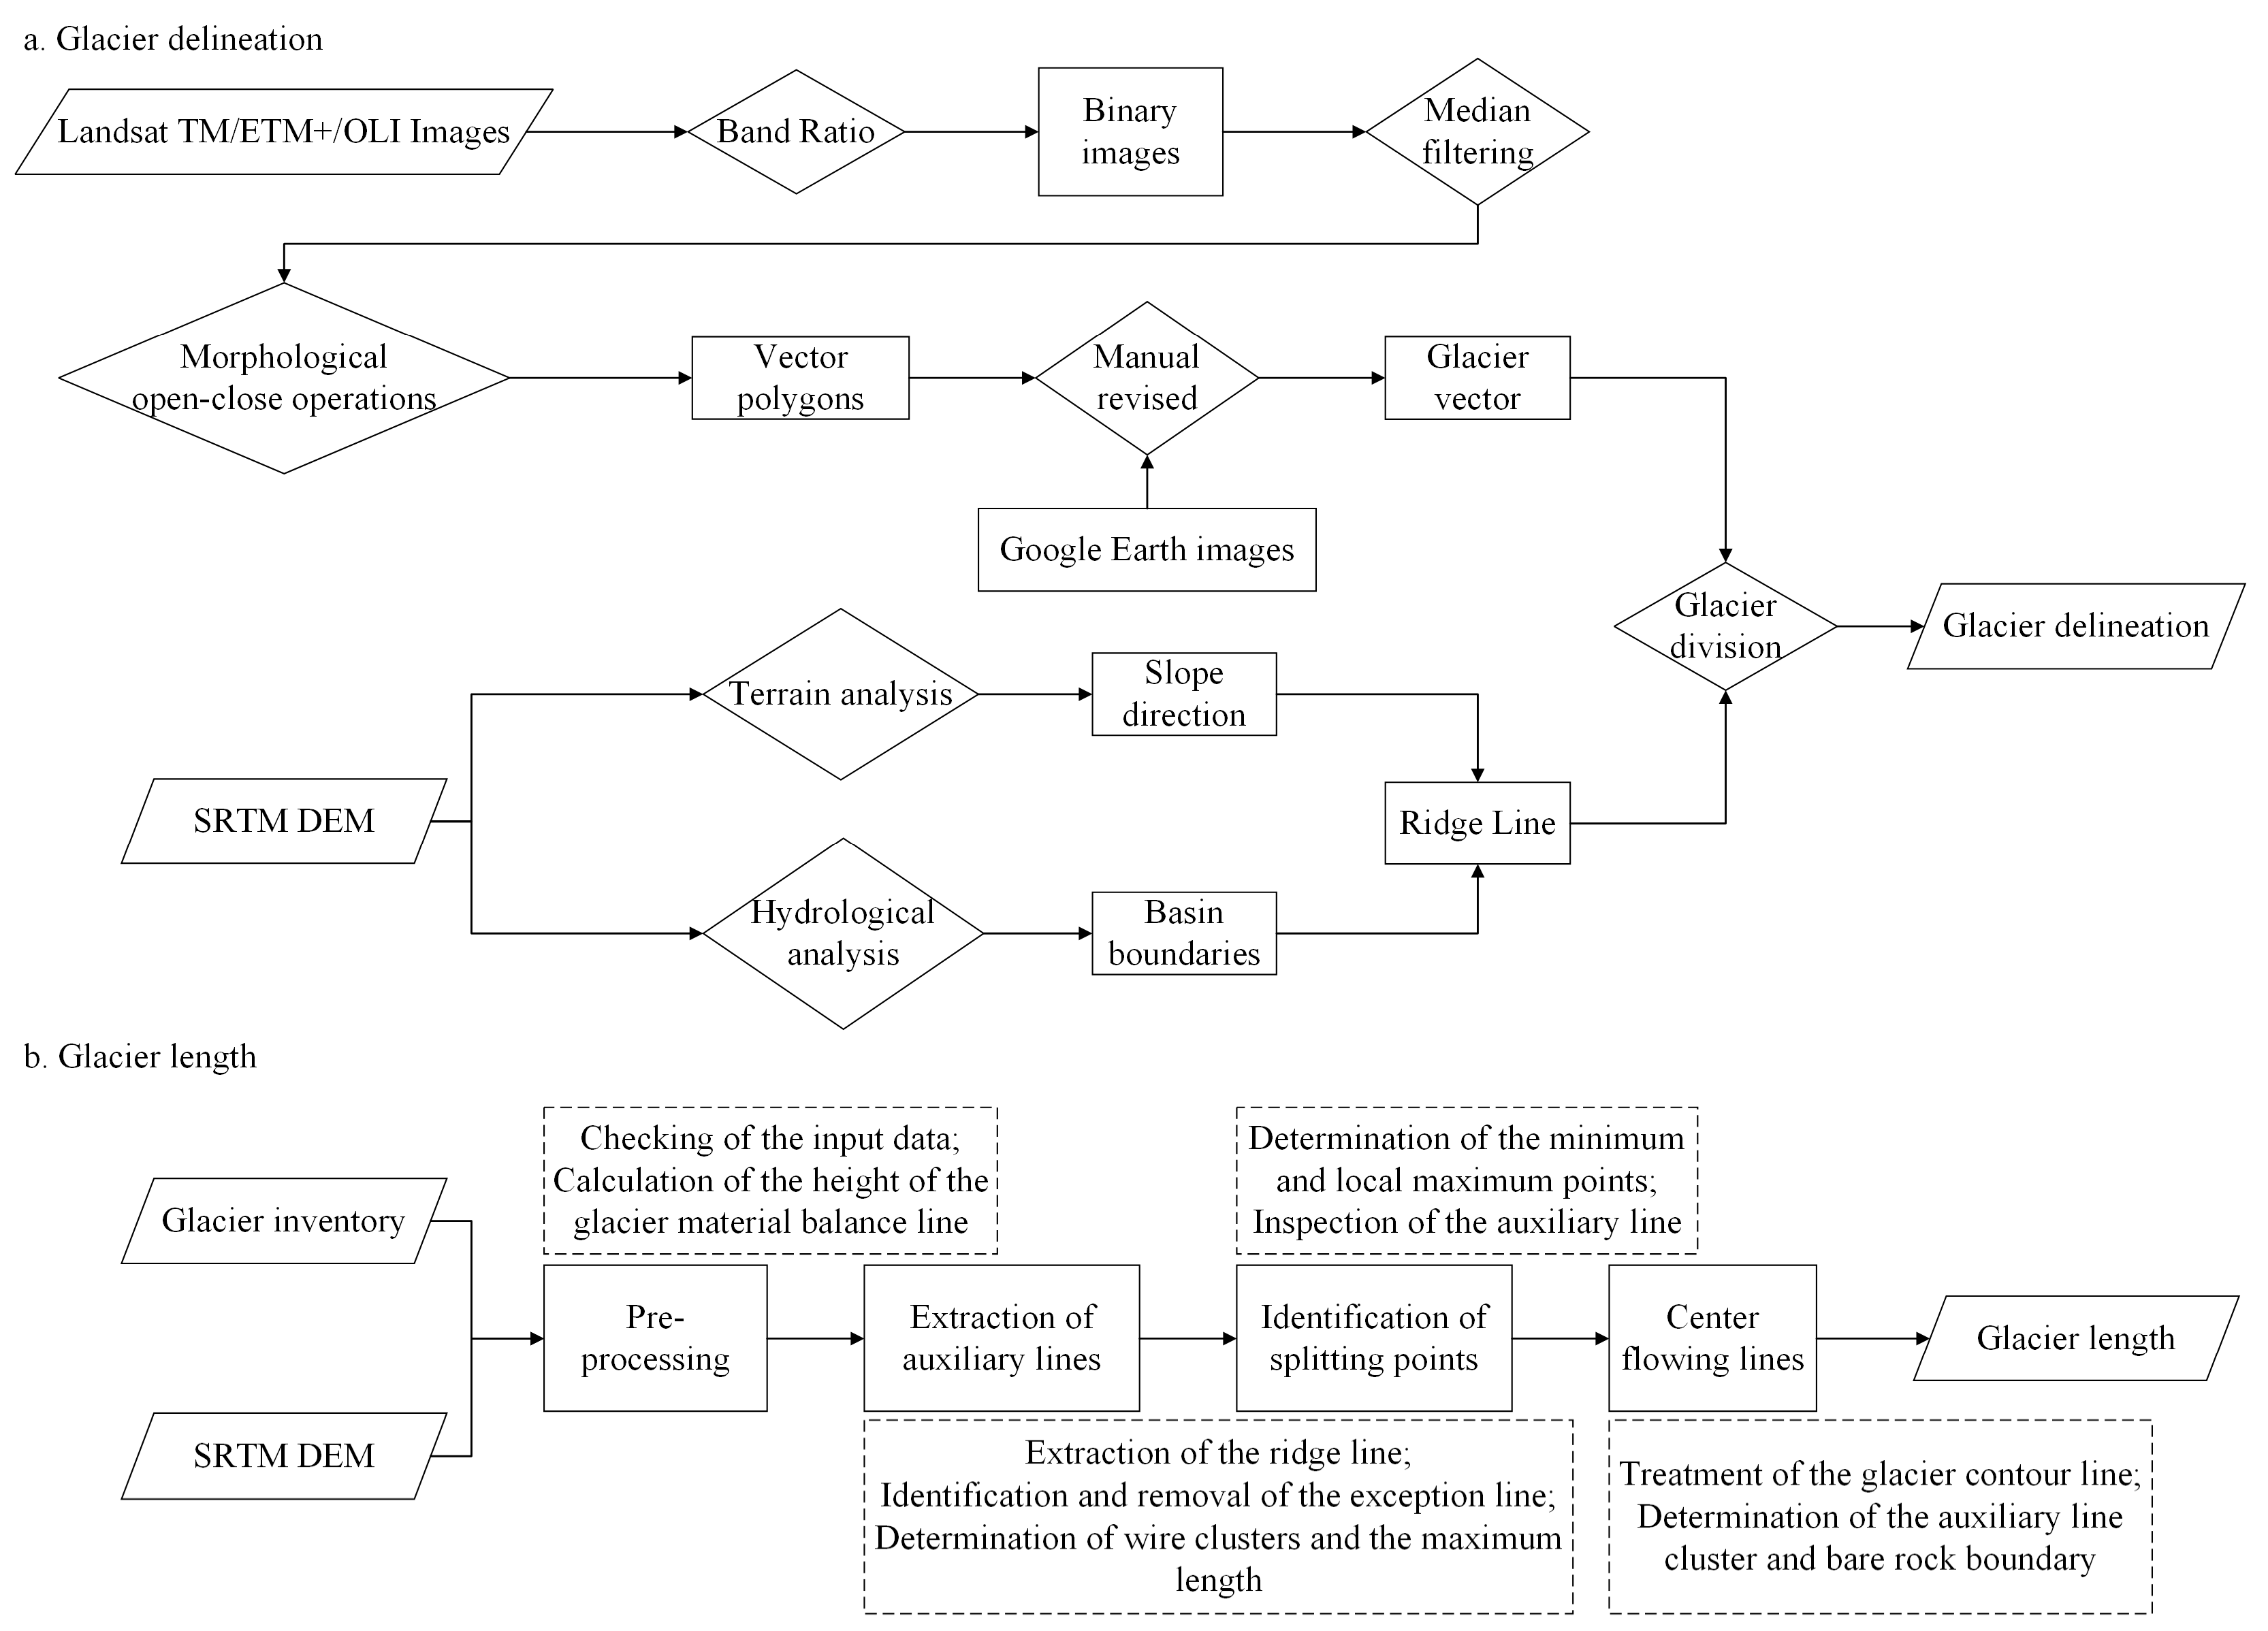
Existing studies have demonstrated that the band ratio threshold method has the highest efficiency and requires minimal manual intervention [32,33,34,35,36]. The glacier delineation process can be divided into three main steps: band ratio (red/SWIR), threshold segmentation, and manual revision [37] (Figure 3). Firstly, the red band’s raw digital number was normalized with that of the SWIR band, and an optimal threshold value for distinguishing between glacier areas and non-glacier areas was manually determined. The threshold values ranged from 1.8 to 2.0. Then, a median filter was applied to address small gaps caused by rocks on ice and eliminate snow patches [38]. Thirdly, the binary images depicting glacier and non-glacier areas in raster format were subsequently converted into vector format to depict glacier outlines. To ensure the accuracy of the glacier boundaries, we manually verified and revised them using Google Earth images and glacier inventory data as reference. Finally, the ridgelines extracted from the SRTM DEM [39] were utilized to automatically partition the glacier outlines, resulting in individual glacier delineations.
Glacier length, a crucial parameter of glacier geometry, serves as the foundation for calculating the retreat and advance distance of a glacier’s terminus. This parameter effectively reflects changes in glaciers and is an essential component of global glacier inventories. Based on Euclidean allocation and glacier surface topography features, we employed the automated extraction method for glacier centerlines proposed by Zhang et al. [40] to derive the length of glaciers (Figure 3). Its input data solely comprises glacier boundary vector and DEM data. For a simple glacier, the length is defined as the distance along its centerline. However, for complex glaciers, such as valley glaciers and ice caps, their length is determined by measuring the maximum distance along each of their respective centerlines.

3.2.2. Accuracy Estimation

We reviewed the four main sources of error in the process of glacier mapping [41,42,43], which include positional errors, processing errors, conceptual errors, and classification errors [33], respectively. Here, we employed several methods to minimize all of these errors. To reduce positional errors, we selected and manually inspected all acquired Landsat images to ensure accurate georeferencing based on ground control points geolocated by the USGS. To reduce processing errors, we used automatic methods of glacier classification, which have been found to be more robust than manual digitization for ice bodies larger than 0.1 km2 [44]. To reduce conceptual errors, we processed and manually inspected all cloud-free observations in the Landsat archive to try to ensure that our glacier area measurements represented the annual snow minima. This left classification errors, described below, as the main source of uncertainty in our study. Classification errors are mainly affected by the spatial resolution and spectral features of the images [36,41,42], glacier debris, snow, and manual visual interpretation. These errors are primarily observed in the exposed rock areas on the glacier’s edge and within the glacier itself [19]. Due to the challenging field conditions at high altitudes where glaciers are located, only errors caused by the spatial resolution of the images are considered in this paper. The area error was calculated using the following equation:
ε A = i = 1 a ε i = L H P × i = 1 a P i
where εA is the error in glacier area resulting from image spatial resolution (m2), Pi is the perimeter of the glacier outline (m), LHP is half of the pixel side length (m).
The method for assessing the uncertainty of glacier area change (εAC) is basically the same as above. Taking a single glacier as an example (Figure 4a), we firstly erased two phases of data from each other to obtain the results in Figure 4b,c. The two data were merged to obtain vector data, Figure 4d. Then, we cropped the terminus of the glacier and deleted the excess, that is, the purple layer in Figure 4e. Finally, according to the calculation idea of the glacier area error, the area error of the beauty layer in Figure 4e was calculated. The calculation formula is shown in Equation (1); that is, the area in Figure 4f is the uncertainty of glacier area change.
Assuming correct classification of glacier morphology types, the accuracy of glacier length calculation primarily relies on the precision of the glacier outline and the quality of the DEM data. Relevant studies have indicated that the influence of the latter can be ignored [45]. Therefore, the accuracy of a single glacier’s length is contingent upon the error introduced by the spatial resolution of the DEM utilized for extracting its extreme altitude point, i.e., the local maximum peak, and the lowest point [46,47]. The calculation formula is as follows:
ε L = ( n + 1 ) × L p
where εL is the accuracy of glacier length, n is the number of the glacier centerlines, Lp is the spatial resolution of the DEM (m).

3.2.3. Analysis of Glacier Change

Given the inherent discrepancies in manual visual interpretation, such as mixed pixels and debris, this study aimed to scientifically assess glacier changes by referencing previous studies on lake area changes [48]. The following formula was used to analyze glacier changes:
C = { Increase ,   if   Δ S > 0   and   Δ S > Δ E Decrease ,   if   Δ S < 0   and   Abs ( Δ S ) > Δ E Stable ,   if   Abs ( Δ S ) Δ E
Δ S = S j S i
Δ E = ( P i + P j ) × L H P 2
where ΔS is the difference in glacier area (km2) between two time periods, denoted by i and j, ΔE is the error in glacier area between these two periods, Pi and Pj refer to the glacier perimeter (m) at time i and j, LHP is half of the Landsat TM/ETM+/OLI image pixel size (m).
To facilitate the analysis of glacier changes (including area and length) across different periods and regions, this study employed the rate of change and relative rate of change [49] for quantification. The calculation equations are as follows:
V G C = G s G f Y f s
P V G C = [ ( G s G f ) 1 / Y f s 1 ] × 100 %
where VGC and PVGC represent change rate and relative change rate of glaciers, respectively, Gs and Gf represent the values of glacier characteristics at different time periods, Yf−s is the time interval between the two periods.

4. Results

4.1. General Change

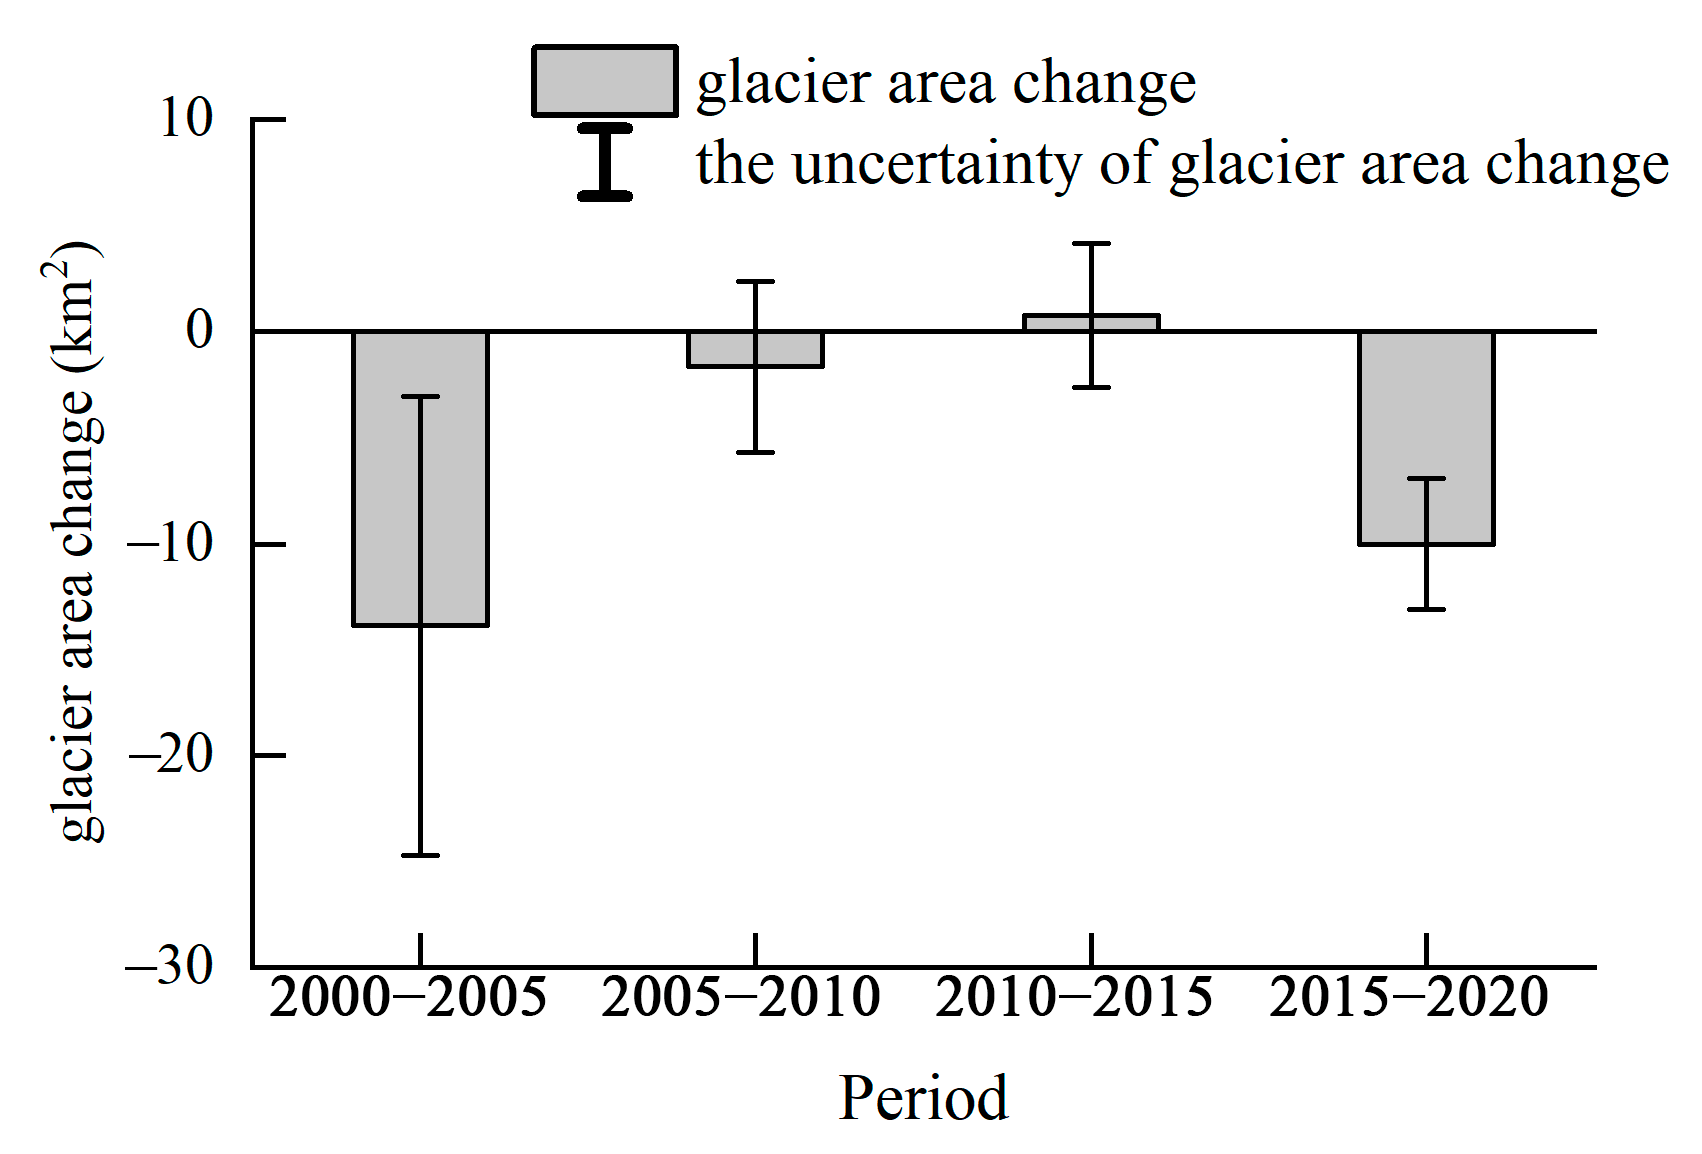
Table 1 and Figure 5 present the number, total area, and average length of glaciers in the WKMPA during 2000–2020. The glacier count increased from 2000 to 2010 due to glacier division, but remained stable thereafter. Except for a slight increase in glacier area during 2010–2015, there was a consistent decrease in glacier area throughout all other years, indicating an ongoing retreat. From 2000 to 2020, the area and length of glaciers decreased by 24.83 km2 and 66 m, with relative change rates of −0.04%·a−1 and −0.11%·a−1. By comparing the relative change rates over a five-year period, it was found that the most significant changes in glacier area and length occurred between 2000 and 2005, with relative change rates of −0.09%·a−1 and −0.23%·a−1, respectively. Comparing the relative rates of change over a decade, it is evident that glacier area and length experienced greater changes during 2000–2010 than during 2010–2020. In other words, the major retreat of glaciers within the WKMPA occurred in the early period, with the most substantial retreat taking place between 2000 and 2010, remaining stable in the later period.

4.2. Characteristics of Glacier Area Change

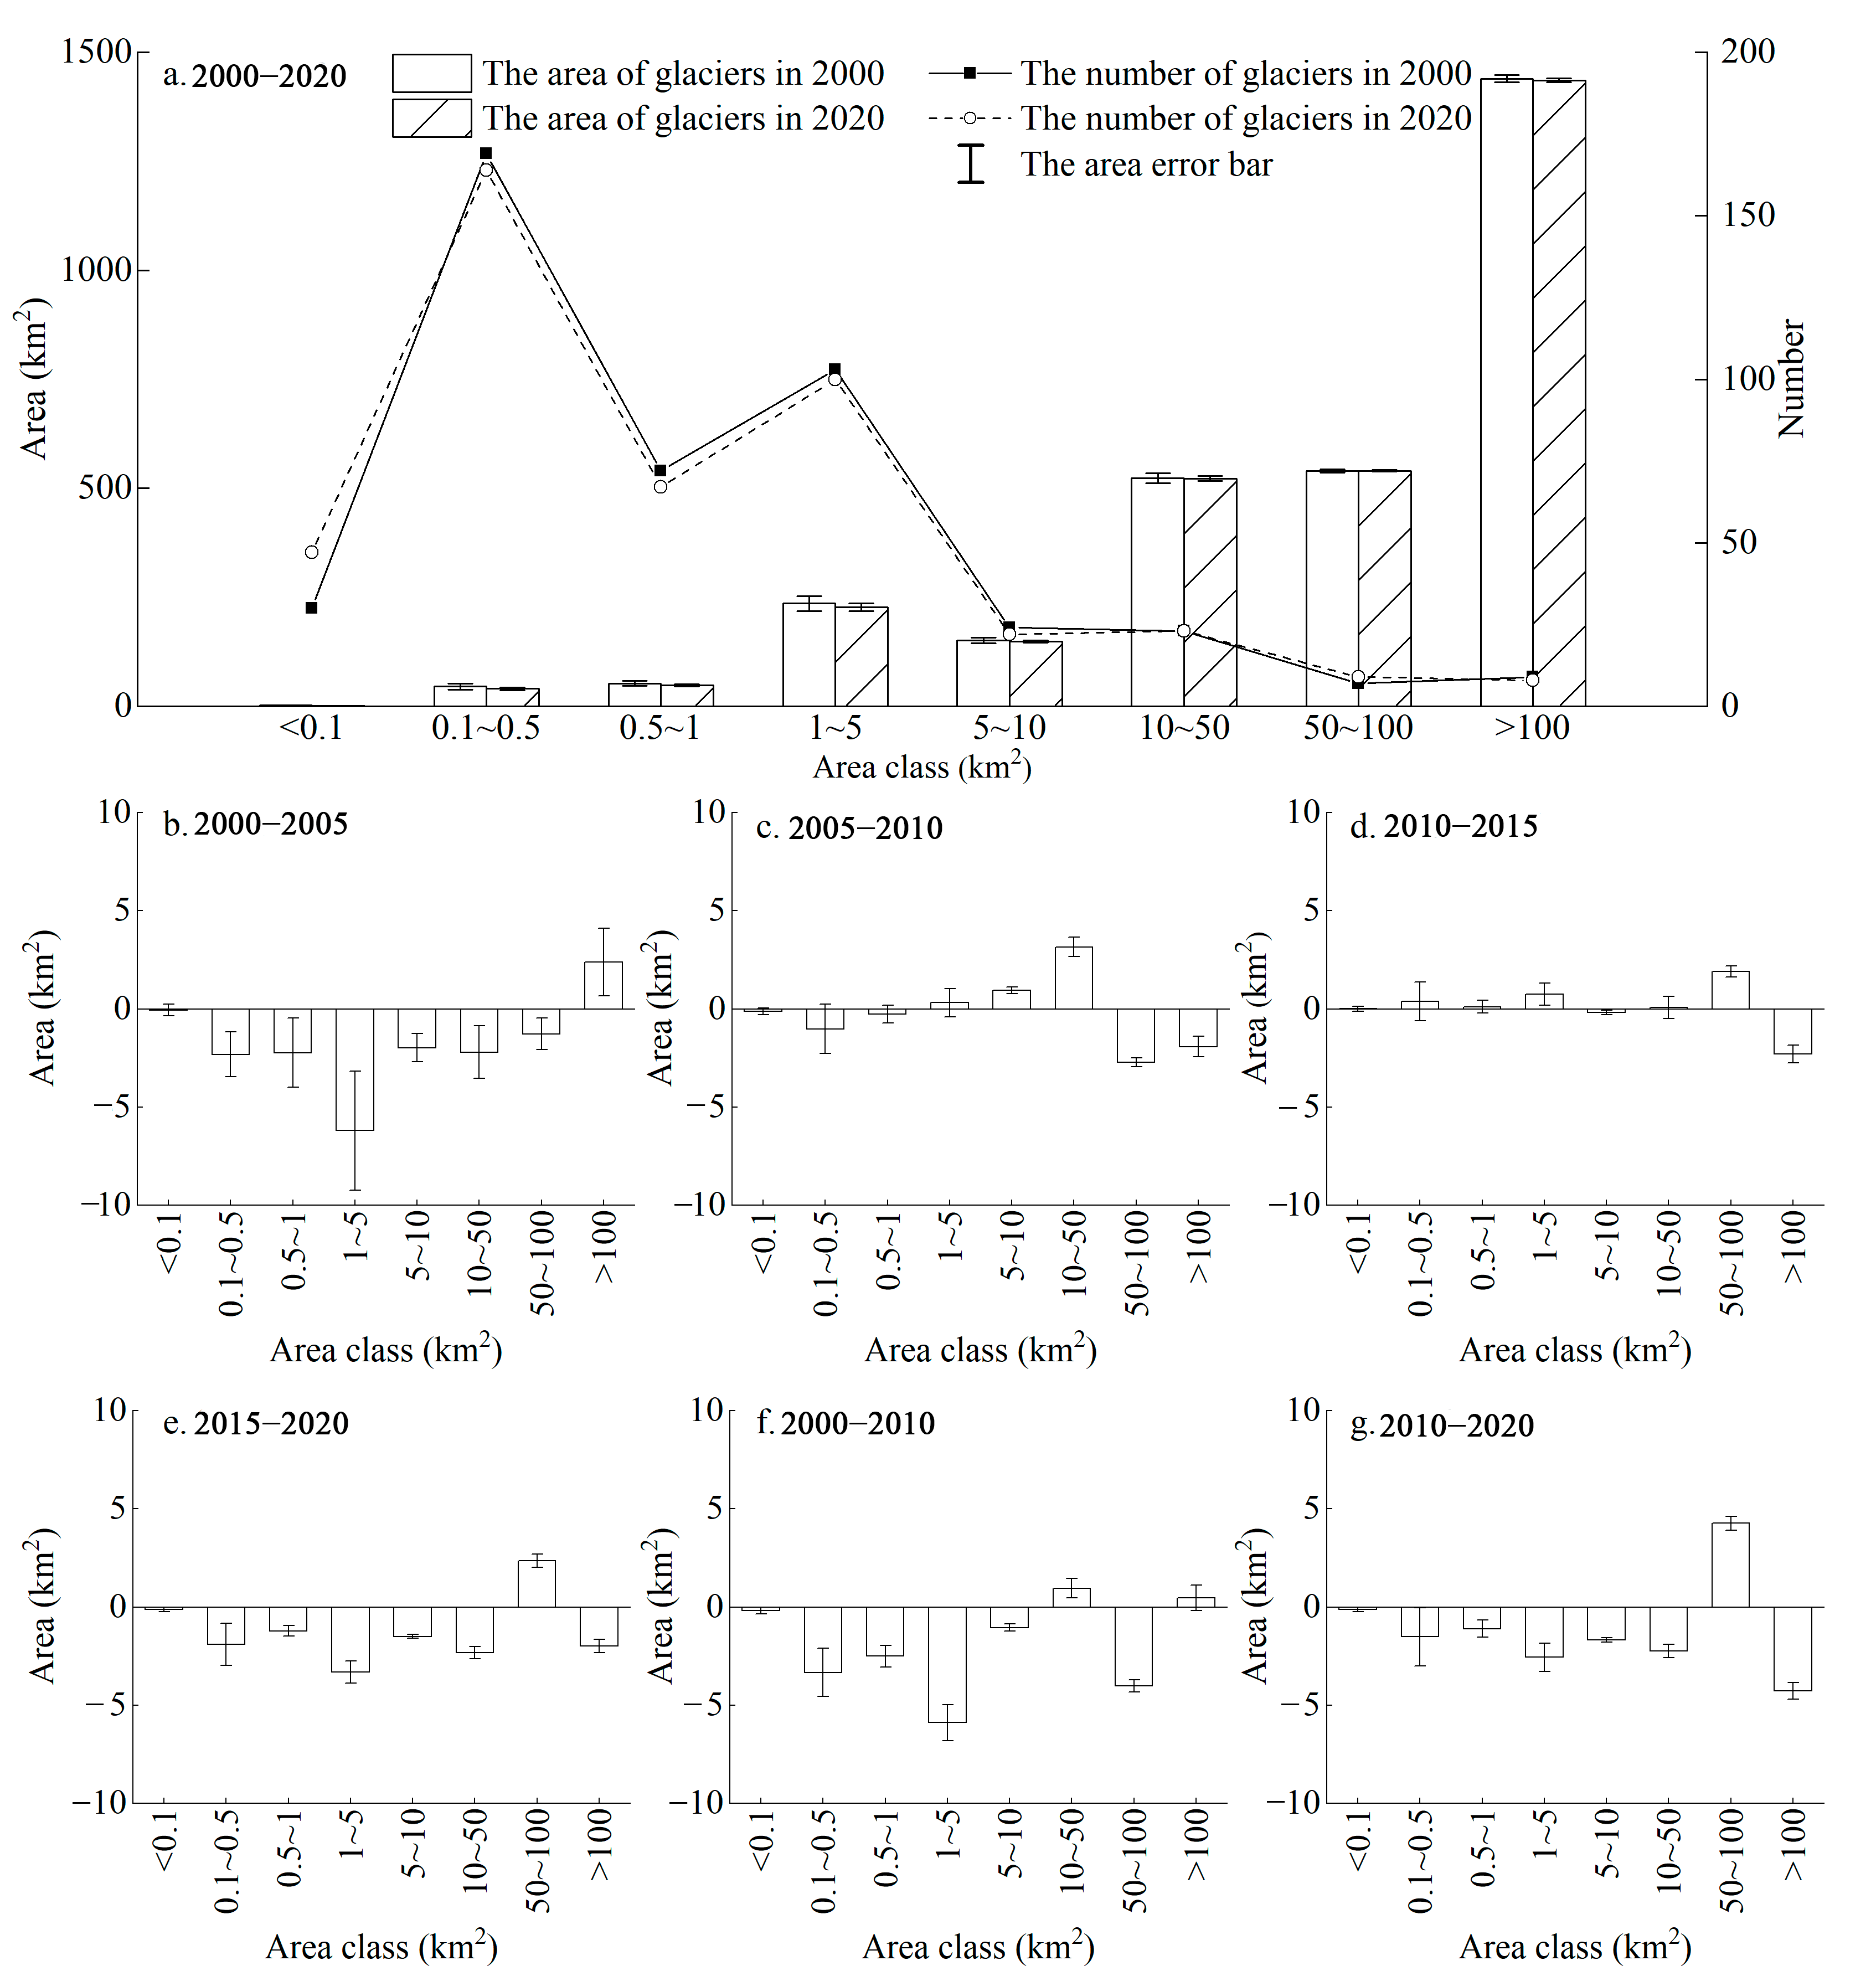
In terms of glacier area classification, the majority of glaciers in the WKMPA in 2020 had an area ranging from 0.1 to 0.5 km2 (164 glaciers) and 1 to 5 km2 (100 glaciers), while those with an area between 50 and 100 km2 (9 glaciers) and >100 km2 (8 glaciers) were the least abundant. Apart from a significant increase in the number of glaciers with an area <0.1 km2, there was only a slight change in the number of glaciers across other area classes during the period 2000–2020 (Figure 6a). When comparing glacier area changes among different area classes, we observed glacier area increasing for areas ranging from 50 to 100 km2, while all other area classes experienced a decreasing tendency. Notably, the glaciers of the <0.1 km2 and 0.5–1 km2 area classes exhibited the most significant declines, with relative change rates of −0.85%·a−1 and −0.57%·a−1, respectively. Comparing changes over a five-year period (Figure 6b–e), the glacier area of each area class showed different trends of increasing and decreasing within different periods. For the change trend over a decade (Figure 6f,g), there was a two-stage increase followed by a decrease in glacier area for area classes between 10 and 50 km2 and >100 km2, a decrease followed by an increase in glacier area for areas ranging from 50 to 100 km2, and a continuous decrease in the other area classes.
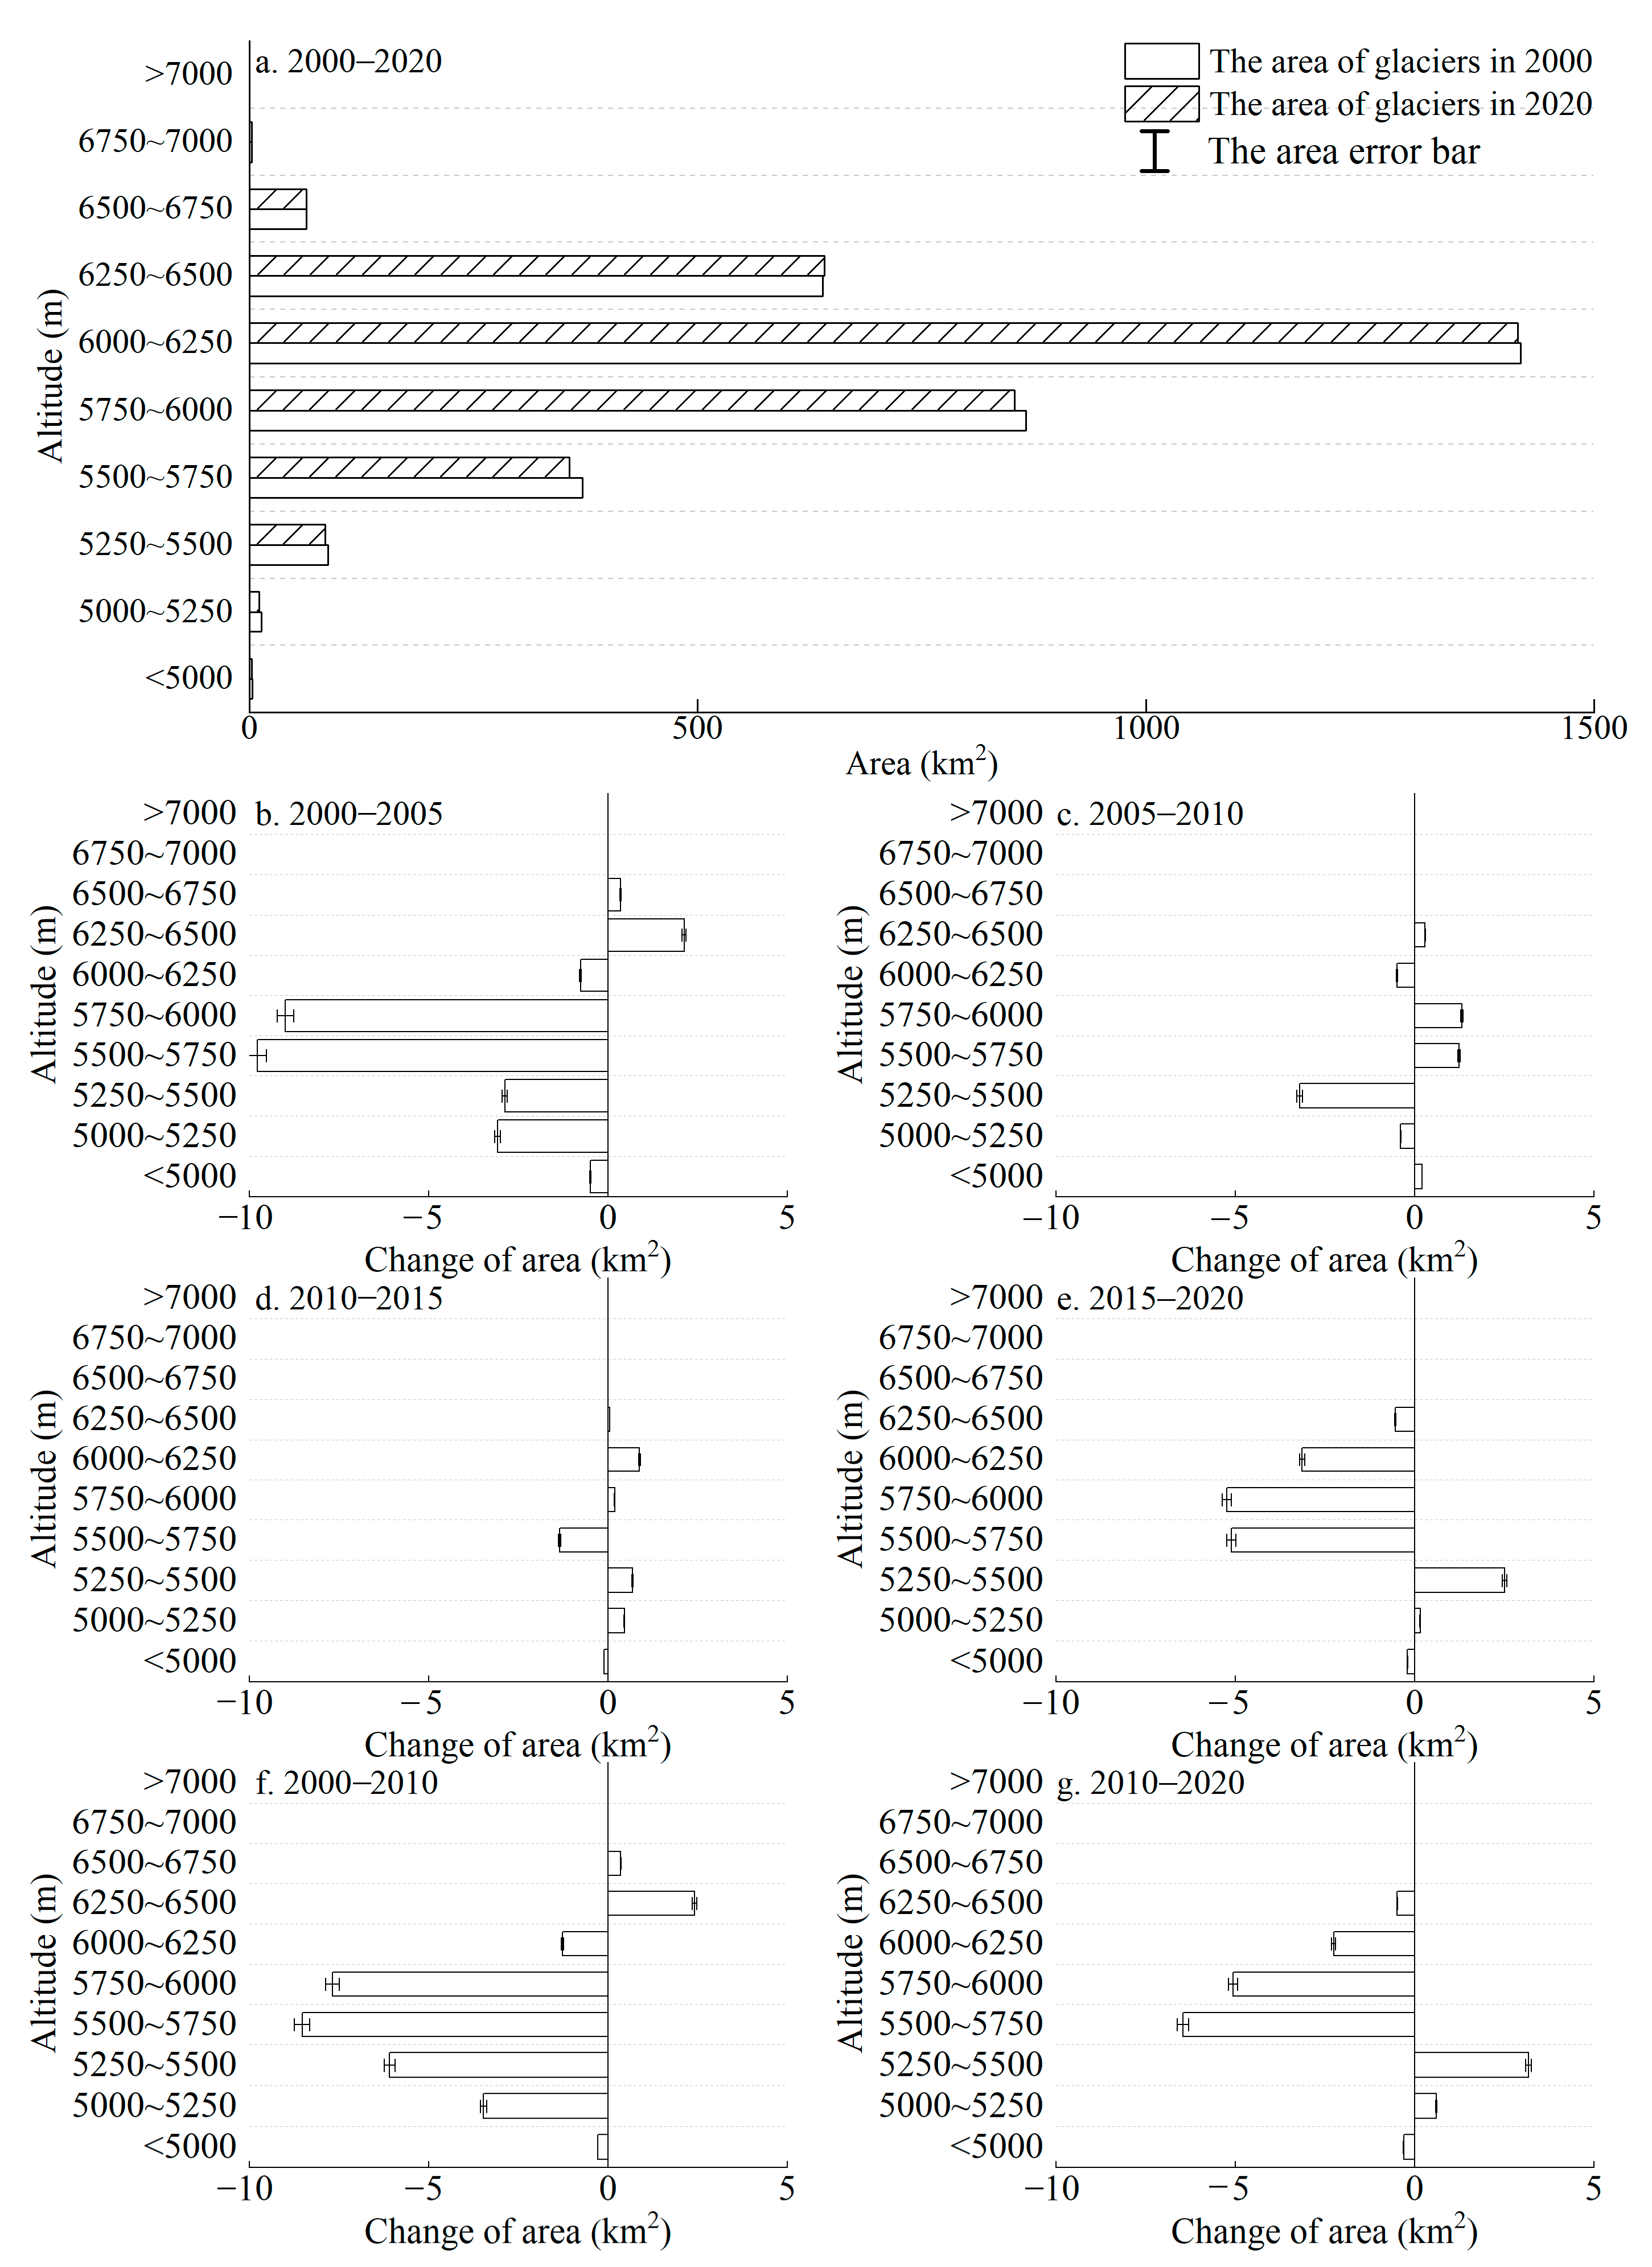
The absolute elevation of mountain ranges or peaks, as well as the relative height difference above the equilibrium line, constitute the primary topographic factors that determine both the number and area of mountain glaciers [50]. The glacier mass balance is the algebraic sum of the mass inputs and outputs per unit area, dominated by solid precipitation and glacier melt. It serves as a valuable climate–geomorphologic indicator of glaciers, reflecting the combined influence of regional climate and topography on glacier evolution. Based on statistical analysis of glacier coverage altitude intervals of 250 m, the distribution of glacier area in the WKMPA approximately conforms to a normal distribution with respect to altitude (Figure 7a). The majority of glaciers were distributed within elevations from 4600 to 7100 m, with a concentration of 95.22% occurring between 5500 and 6500 m in 2020. With the exception of glaciers located above an elevation of 6250 m, the glacier area at each altitude interval decreased during the period 2000–2020, and the relative change rate of glacier area generally decreased as altitude increased. Comparing the change trend over a five-year period (Figure 7b–e), it is evident that there are significant differences in glacier area and relative change rate among different altitude intervals during various periods. While analyzing the decadal change trend (Figure 7f,g), four distinct patterns were identified, including “continuous decrease”, “increase followed by decrease”, “decrease followed by increase”, and “stable”. The median elevation of all glaciers exhibited a slight upward trend, rising from 6071 m in 2000 to 6075 m in 2020.
Orientation is a crucial topographical factor that impacts the energy balance of glaciers, exerting significant influence on their size and changes through temperature and precipitation conditions. In the WKMPA, the number and area of north- and northeast-oriented glaciers were found to be the largest (Figure 8a,b). The number of northwest-oriented glaciers ranked second only to those facing north and northeast, while their area was larger than that of east-oriented glaciers. Although relatively few in number, south-oriented glaciers had an area ranking second only to those facing north and northeast. Except for a slight increase in the area of north-oriented glaciers, the glacier areas facing other orientations experienced a decrease during 2000–2020 (Figure 8i). Among them, northeast-oriented glaciers retreated the most (−10.91 km2), followed by those facing southeast (−7.21 km2), south (−6.72 km2), and northwest (−5.03 km2), while the recession area of glaciers facing other orientations was less than 5 km2. Comparing the change trend over a five-year period (Figure 8c–f), the area of north-oriented glaciers exhibited a pattern of “decrease followed by increase”, while the area of glaciers facing all other orientations showed a continuous decreasing trend. During the period 2000–2005, glaciers of all orientations exhibited a continuous decrease in area. While the glacier area with north orientation slightly increased (0.73 km2, 0.02%·a−1) during 2015–2020, other orientations showed a decreasing trend. Comparing the decadal change trend (Figure 8g,h), it can be observed that the area of glaciers of all orientations decreased from 2000 to 2010. Except for an increase in the area of the north-oriented glaciers, other orientations experienced a decline during 2010–2020.
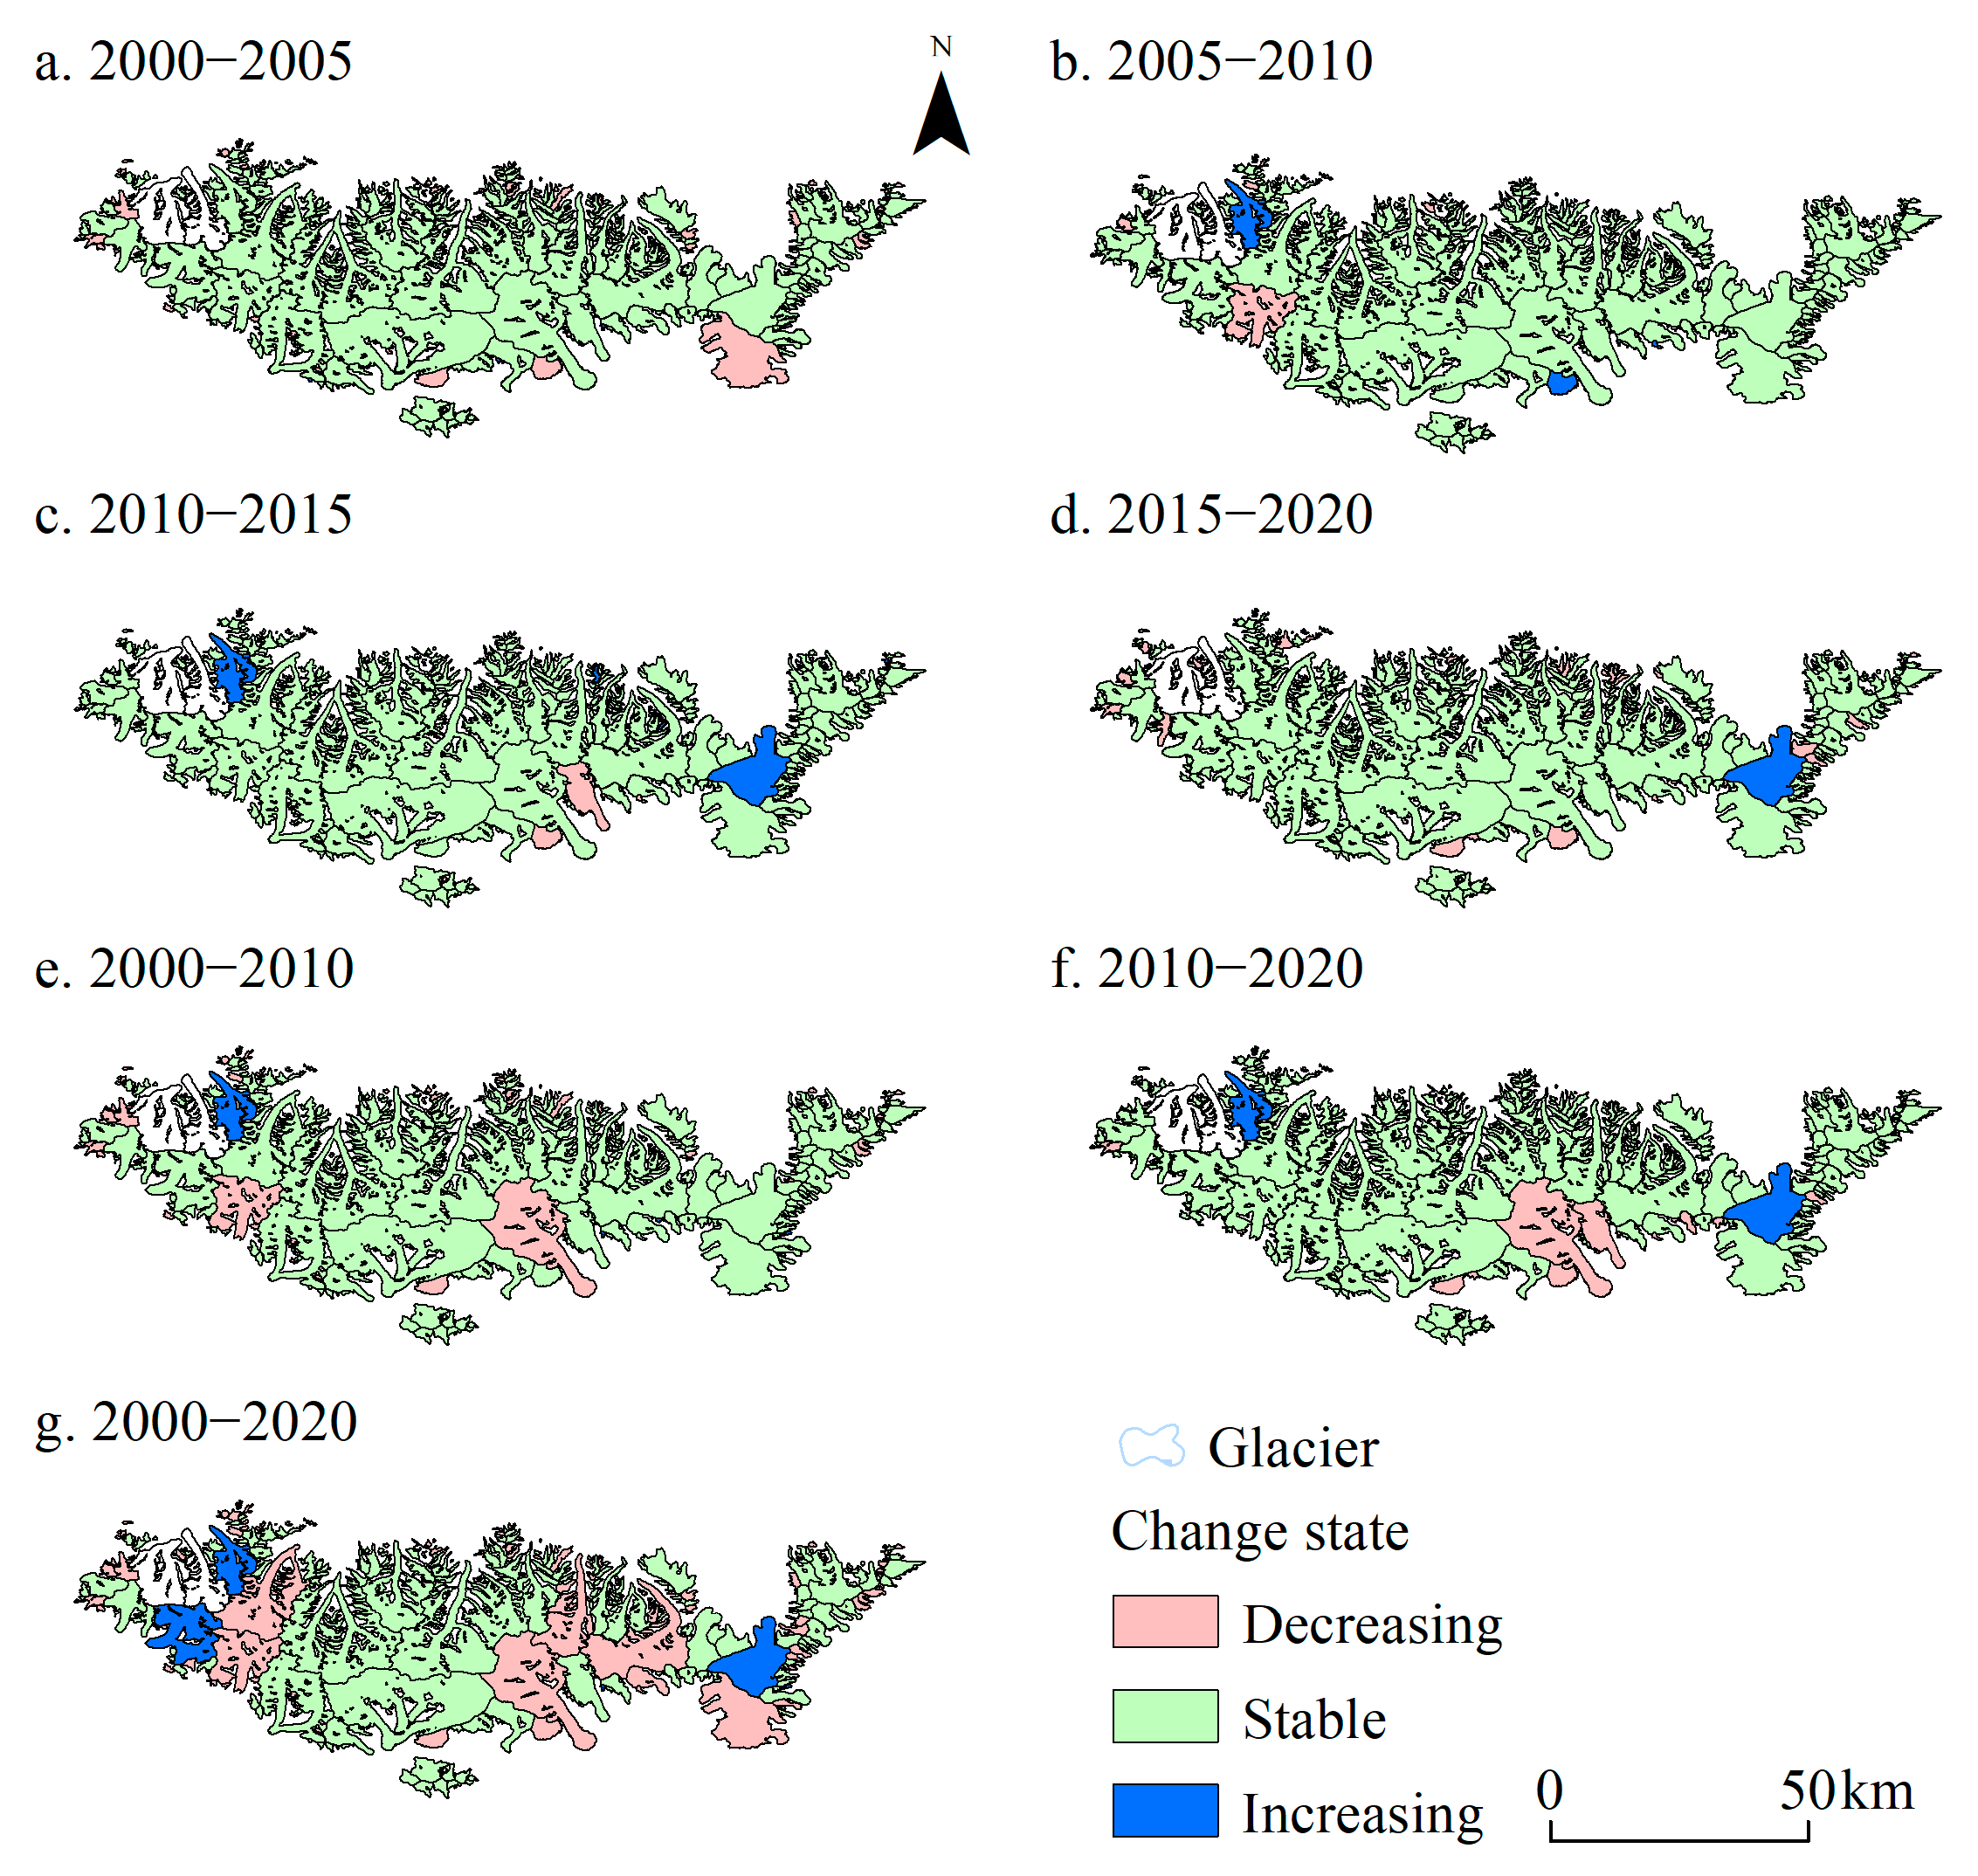
Figure 9 shows the status of glacier area change by comparing the changes in both area and perimeter of individual glaciers. Among them, seven glaciers experienced an increase in area during 2000–2020 while two glaciers had an area larger than 50 km2, namely Alaqishayi Glacier (90.56 km2) and Binghuohe Glacier (85.70 km2). The areas of 271 glaciers remained stable. Comparing the trend of change over a five-year period, 14, 7, 13, and 1 glaciers respectively exhibited an increasing trend in area during the four time periods, while 82, 22, 11, and 76 glaciers showed a decreasing trend; the remaining glaciers were in a stable state. When comparing changes over a decade, we found that only 10 and 2 glaciers, respectively, presented an increasing trend in area during the two time periods, while as many as 84 and 43 glaciers showed a decreasing trend. In the past two decades, the glacier changes in the WKMPA have remained largely stable, with some glaciers exhibiting an advance and surge state, resulting in an increasing trend in area. Glacial changes during 2010–2020 were comparatively more stable than those observed during 2000–2010.

4.3. Characteristics of Glacier Length Change

In terms of glacier length classification, the majority (76.61%) of glaciers in the WKMPA in 2020 were 0.5–5 km in length (Figure 10a). Specifically, the majority of glaciers had a length between 0.5 and 1 km (128 glaciers) and 1 and 2 km (109 glaciers), while those exceeding a length of 20 km (9 glaciers) were the least numerous. The glacier lengths across all length classes decreased during 2000–2020, with the relative change rates showing a trend of “decrease followed by increase” as length increased. The glaciers of length <0.5 km experienced the largest relative change rate (−1.04%·a−1), decreasing from 471 m to 382 m, while the range of glacier length between 5 and 10 km exhibited the lowest relative change rate (−0.02%·a−1), decreasing from 6988 m to 6957 m during 2000–2020. The relative change rates in glacier length for those of 10–20 km and >20 km were relatively small (−0.07%·a−1 and −0.10%·a−1), but their absolute changes were significant, namely −116 m and −534 m, respectively. When comparing the length of a single glacier with its corresponding relative change rate (Figure 10b), no simple linear relationship was observed. However, it is generally noted that smaller glaciers exhibit greater relative change rates and more acute retreats and are more sensitive to climate change. This observation aligns with the analysis results obtained for glacier area and its corresponding changes.
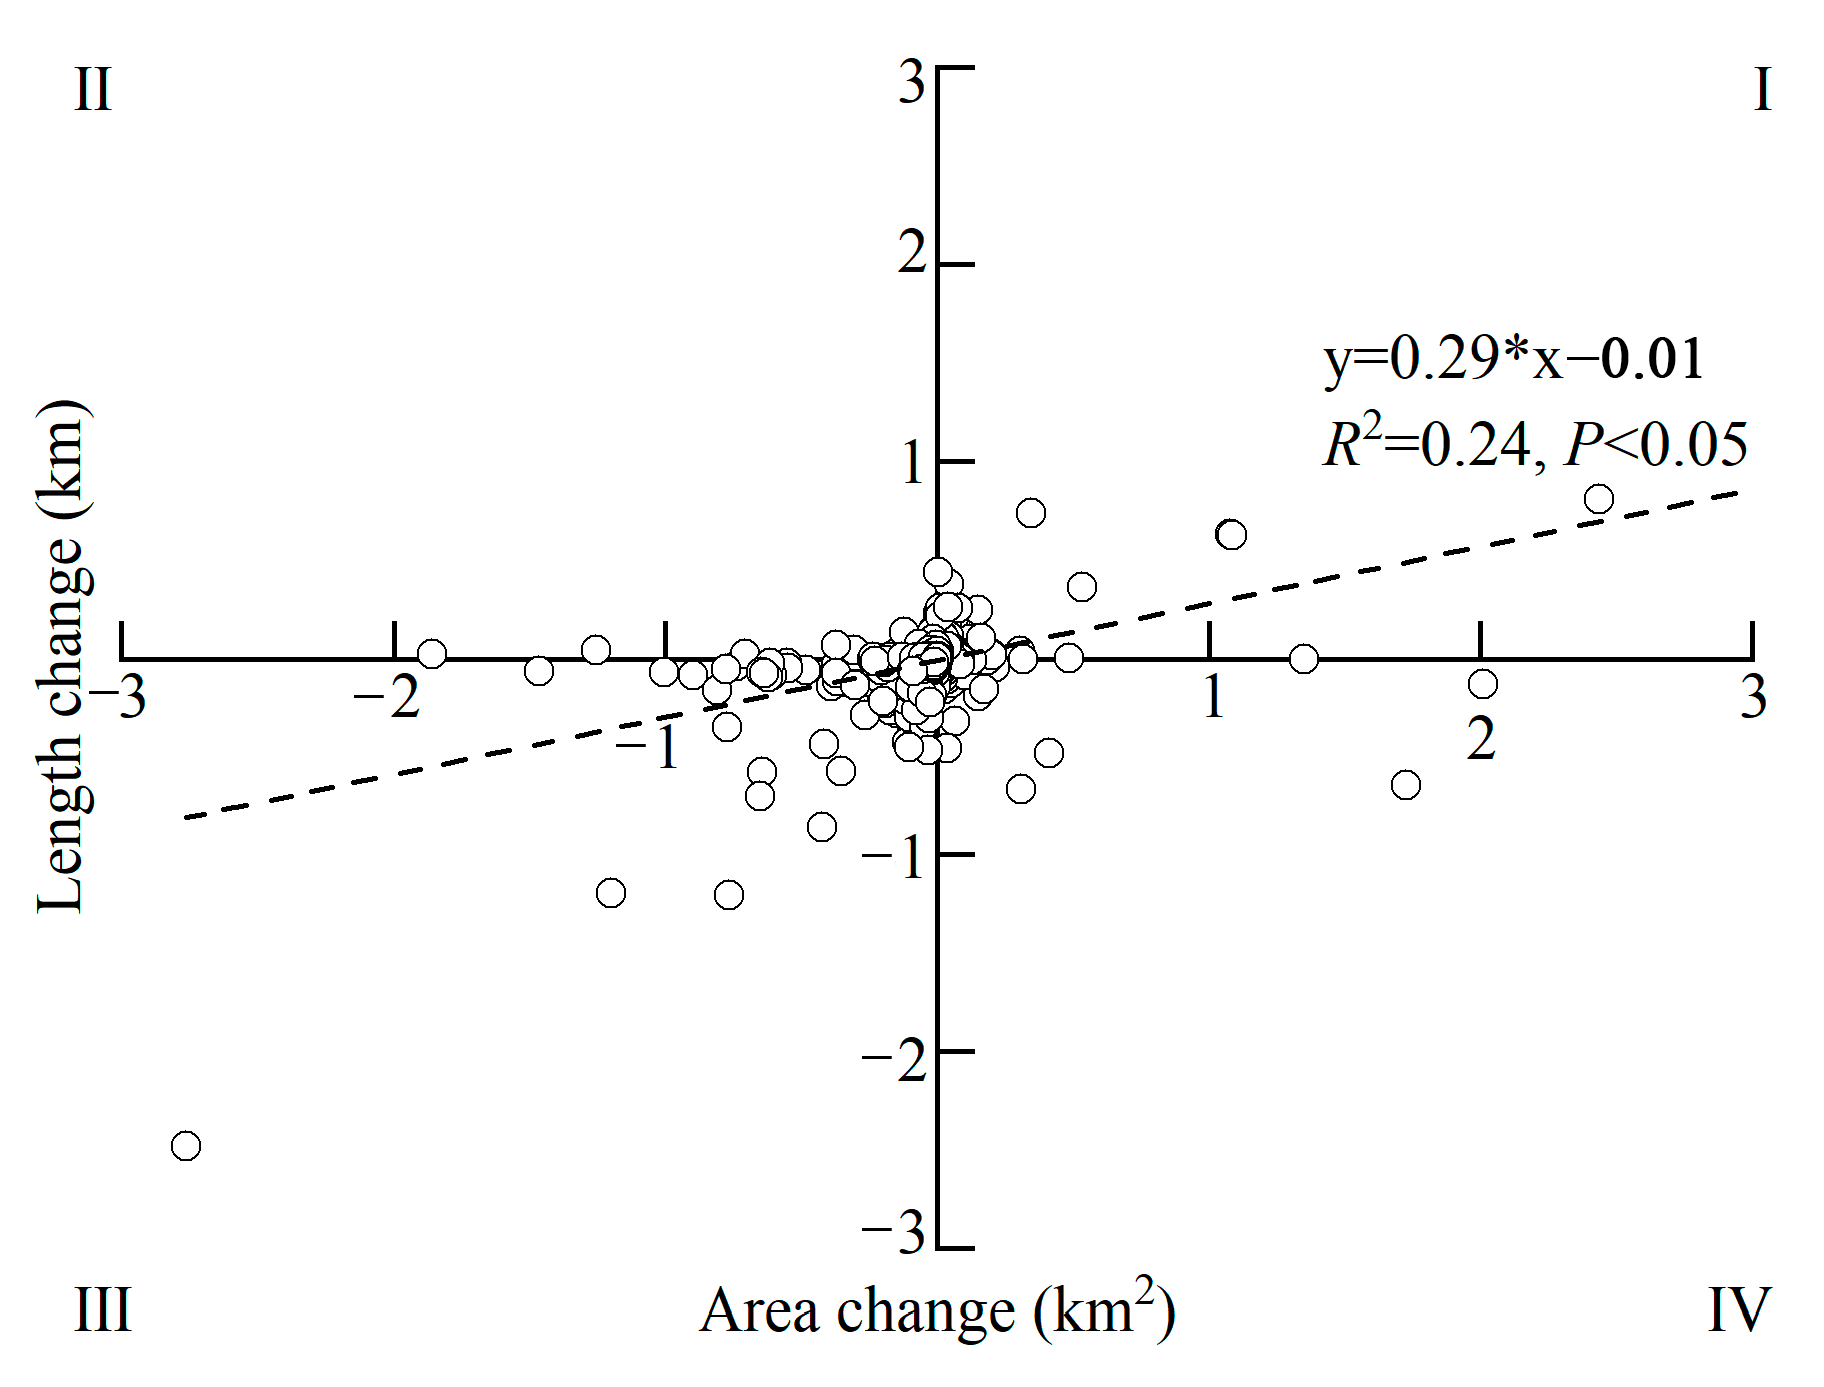
To elucidate the relationship between glacier area and length changes, we performed statistical and correlation analysis on the area and length changes of individual glaciers in the study area during 2000–2020 (Figure 11). Our findings indicate a positive correlation between these two variables (R2 = 0.24), with a relatively concentrated distribution. Glaciers located in the third quadrant were predominantly in a state of retreat, with their area and length decreasing. Conversely, glaciers situated in the first quadrant were mostly advancing or surging, resulting in an increase in both area and length. Glaciers located in the second or fourth quadrant exhibited an inverse relationship between changes in area and length, which can be attributed to the fact that glacier length is predominantly influenced by morphological characteristics. The change in glacier area is not solely attributed to terminus changes, but is also influenced by the erosion of glacial lateral moraines. Therefore, the dynamics of glacier length are more intricate than those of area and require consideration of both terminus behavior and morphological characteristics.
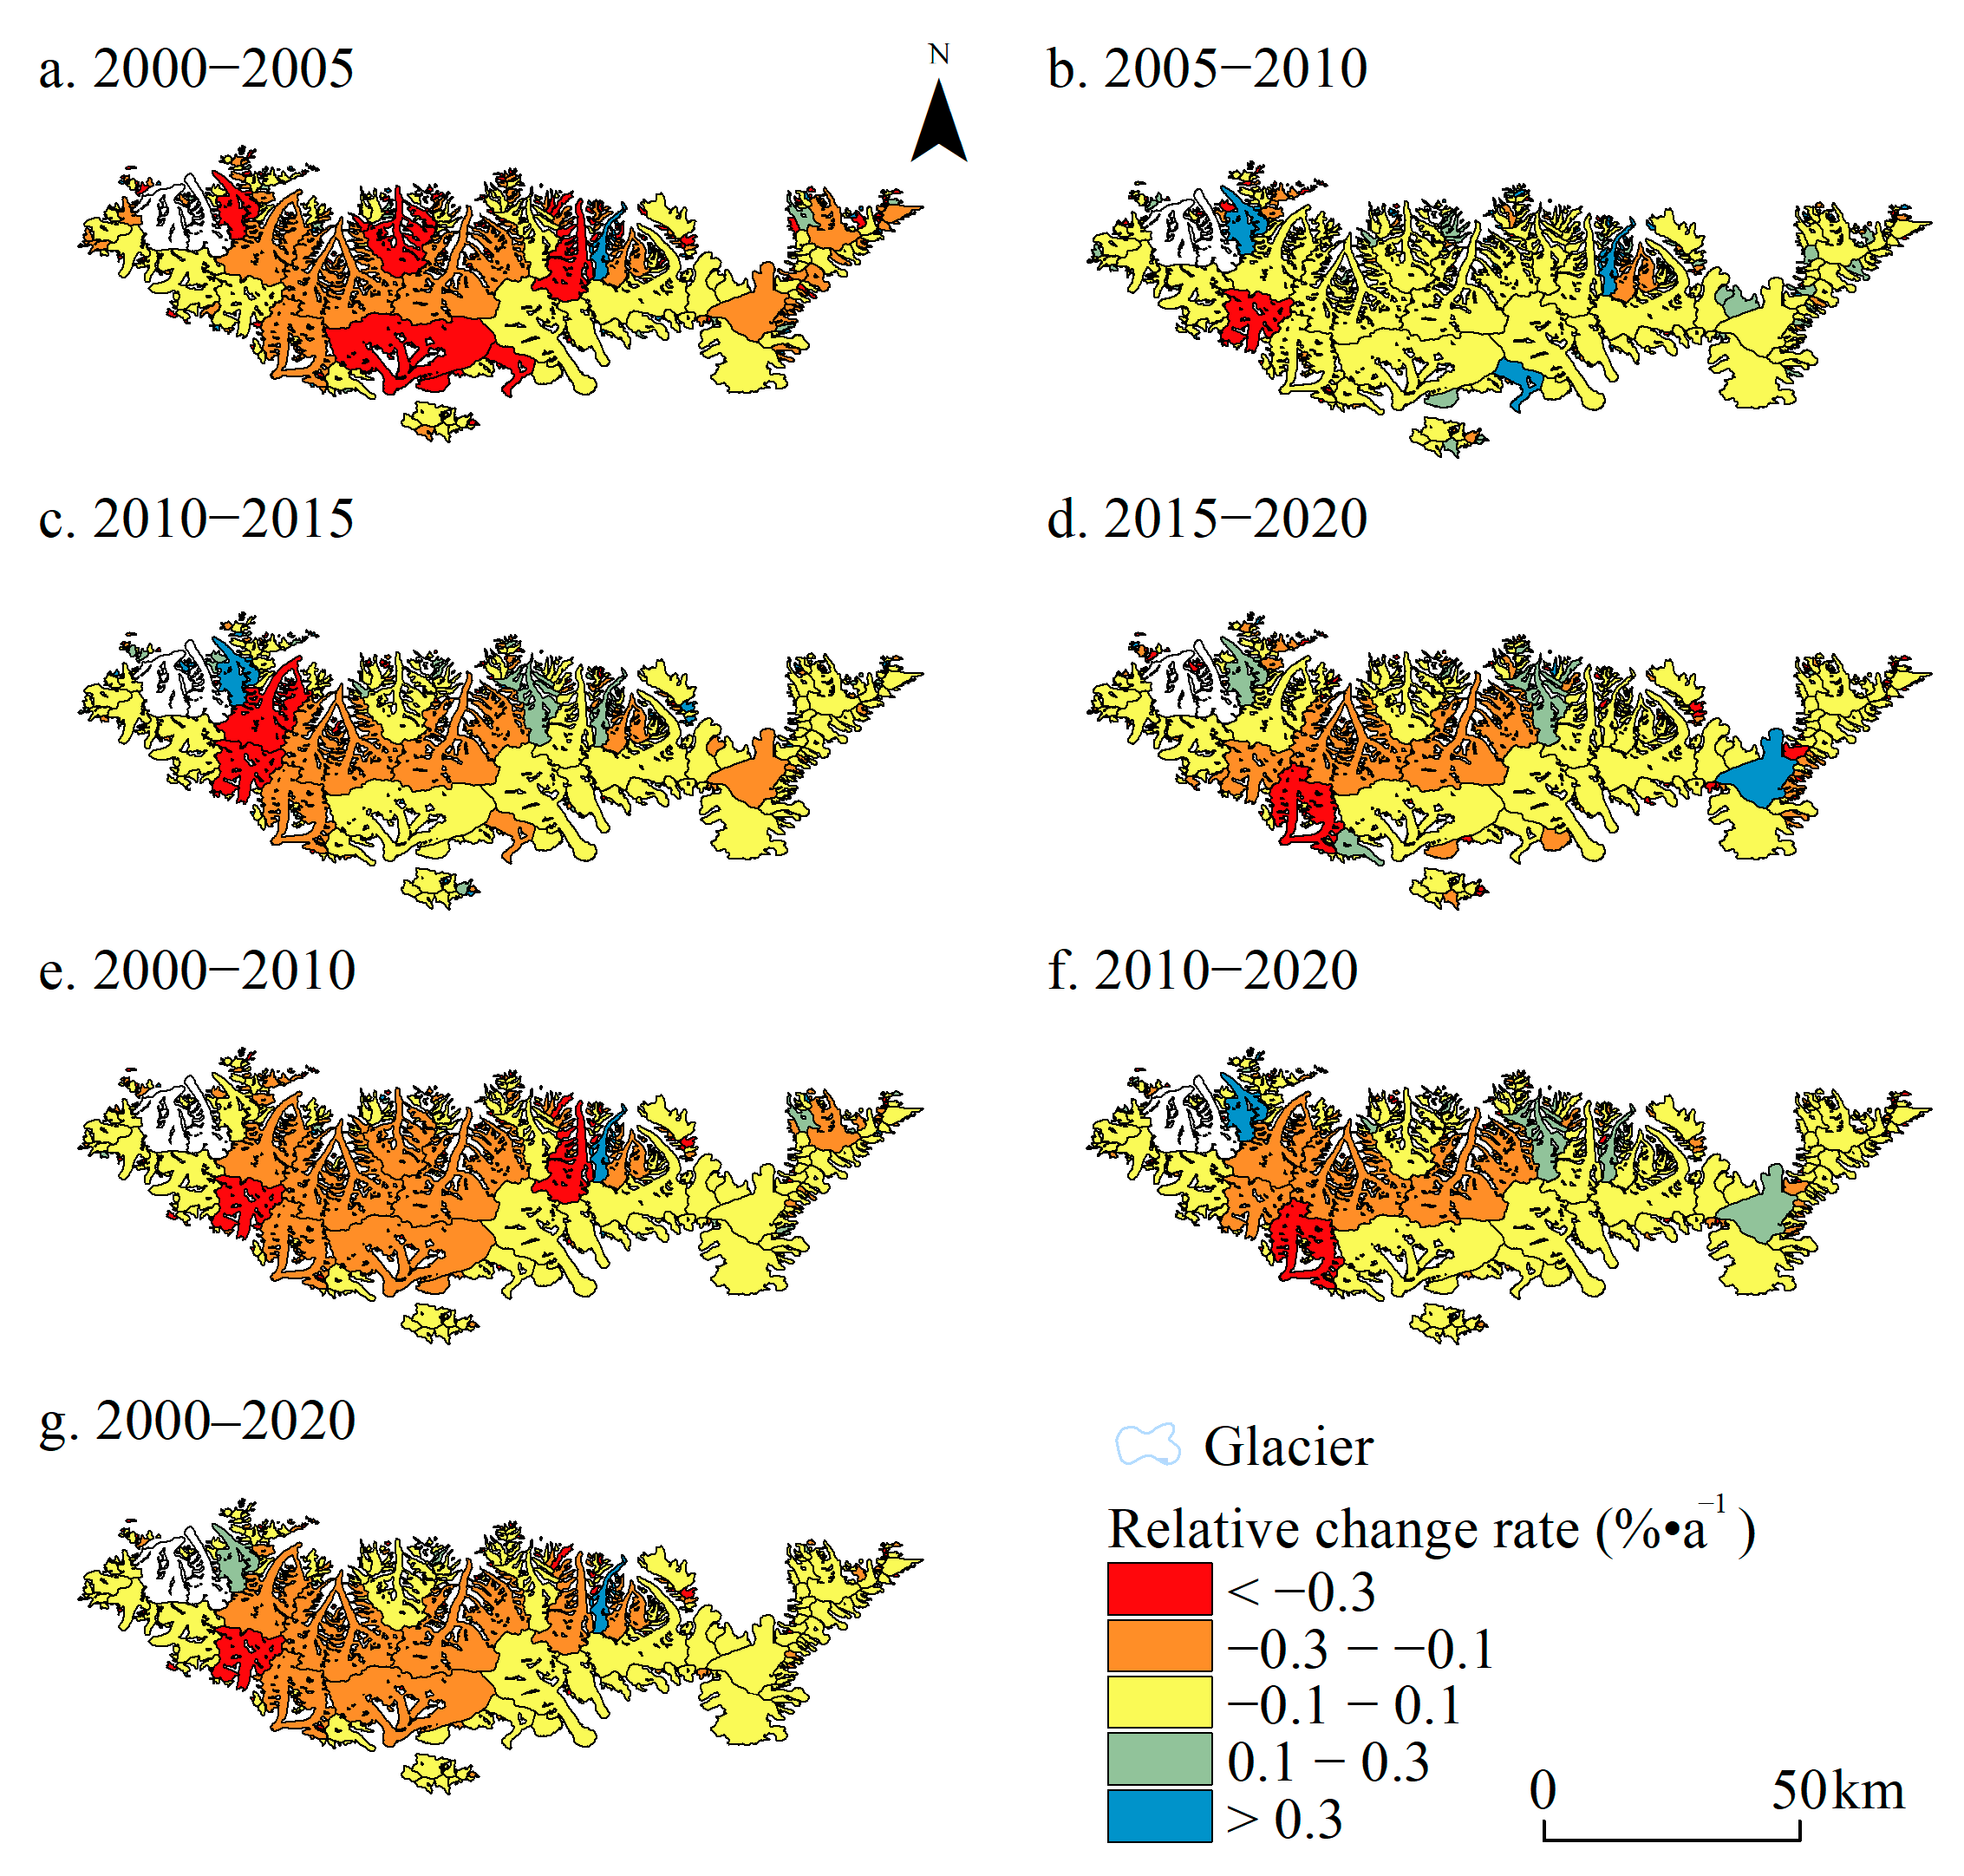
By comparing the relative rates of change in glacier length during 2000–2020 (Figure 12), we observed that 8 and 105 glaciers experienced change rates of more than 0.3%·a−1 and less than −0.3%·a−1, respectively. When examining changes over five-year periods, the numbers of glaciers with change rates greater than 0.3%·a−1 were 56, 57, 73, and 7 during each of the respective time periods, while the numbers of glaciers with change rates less than −0.3%·a−1 were 166, 100, 72, and 135, respectively. This indicates that the glacier changes remained relatively stable during 2010–2015 in comparison to other time periods. When comparing trends over a decade, there were 26 and 11 glaciers with annual change rates greater than 0.3% in the two time periods, while there were 119 and 98 glaciers with annual rates less than −0.3%.

4.4. Empirical Formula among Glacier Area, Perimeter, and Length

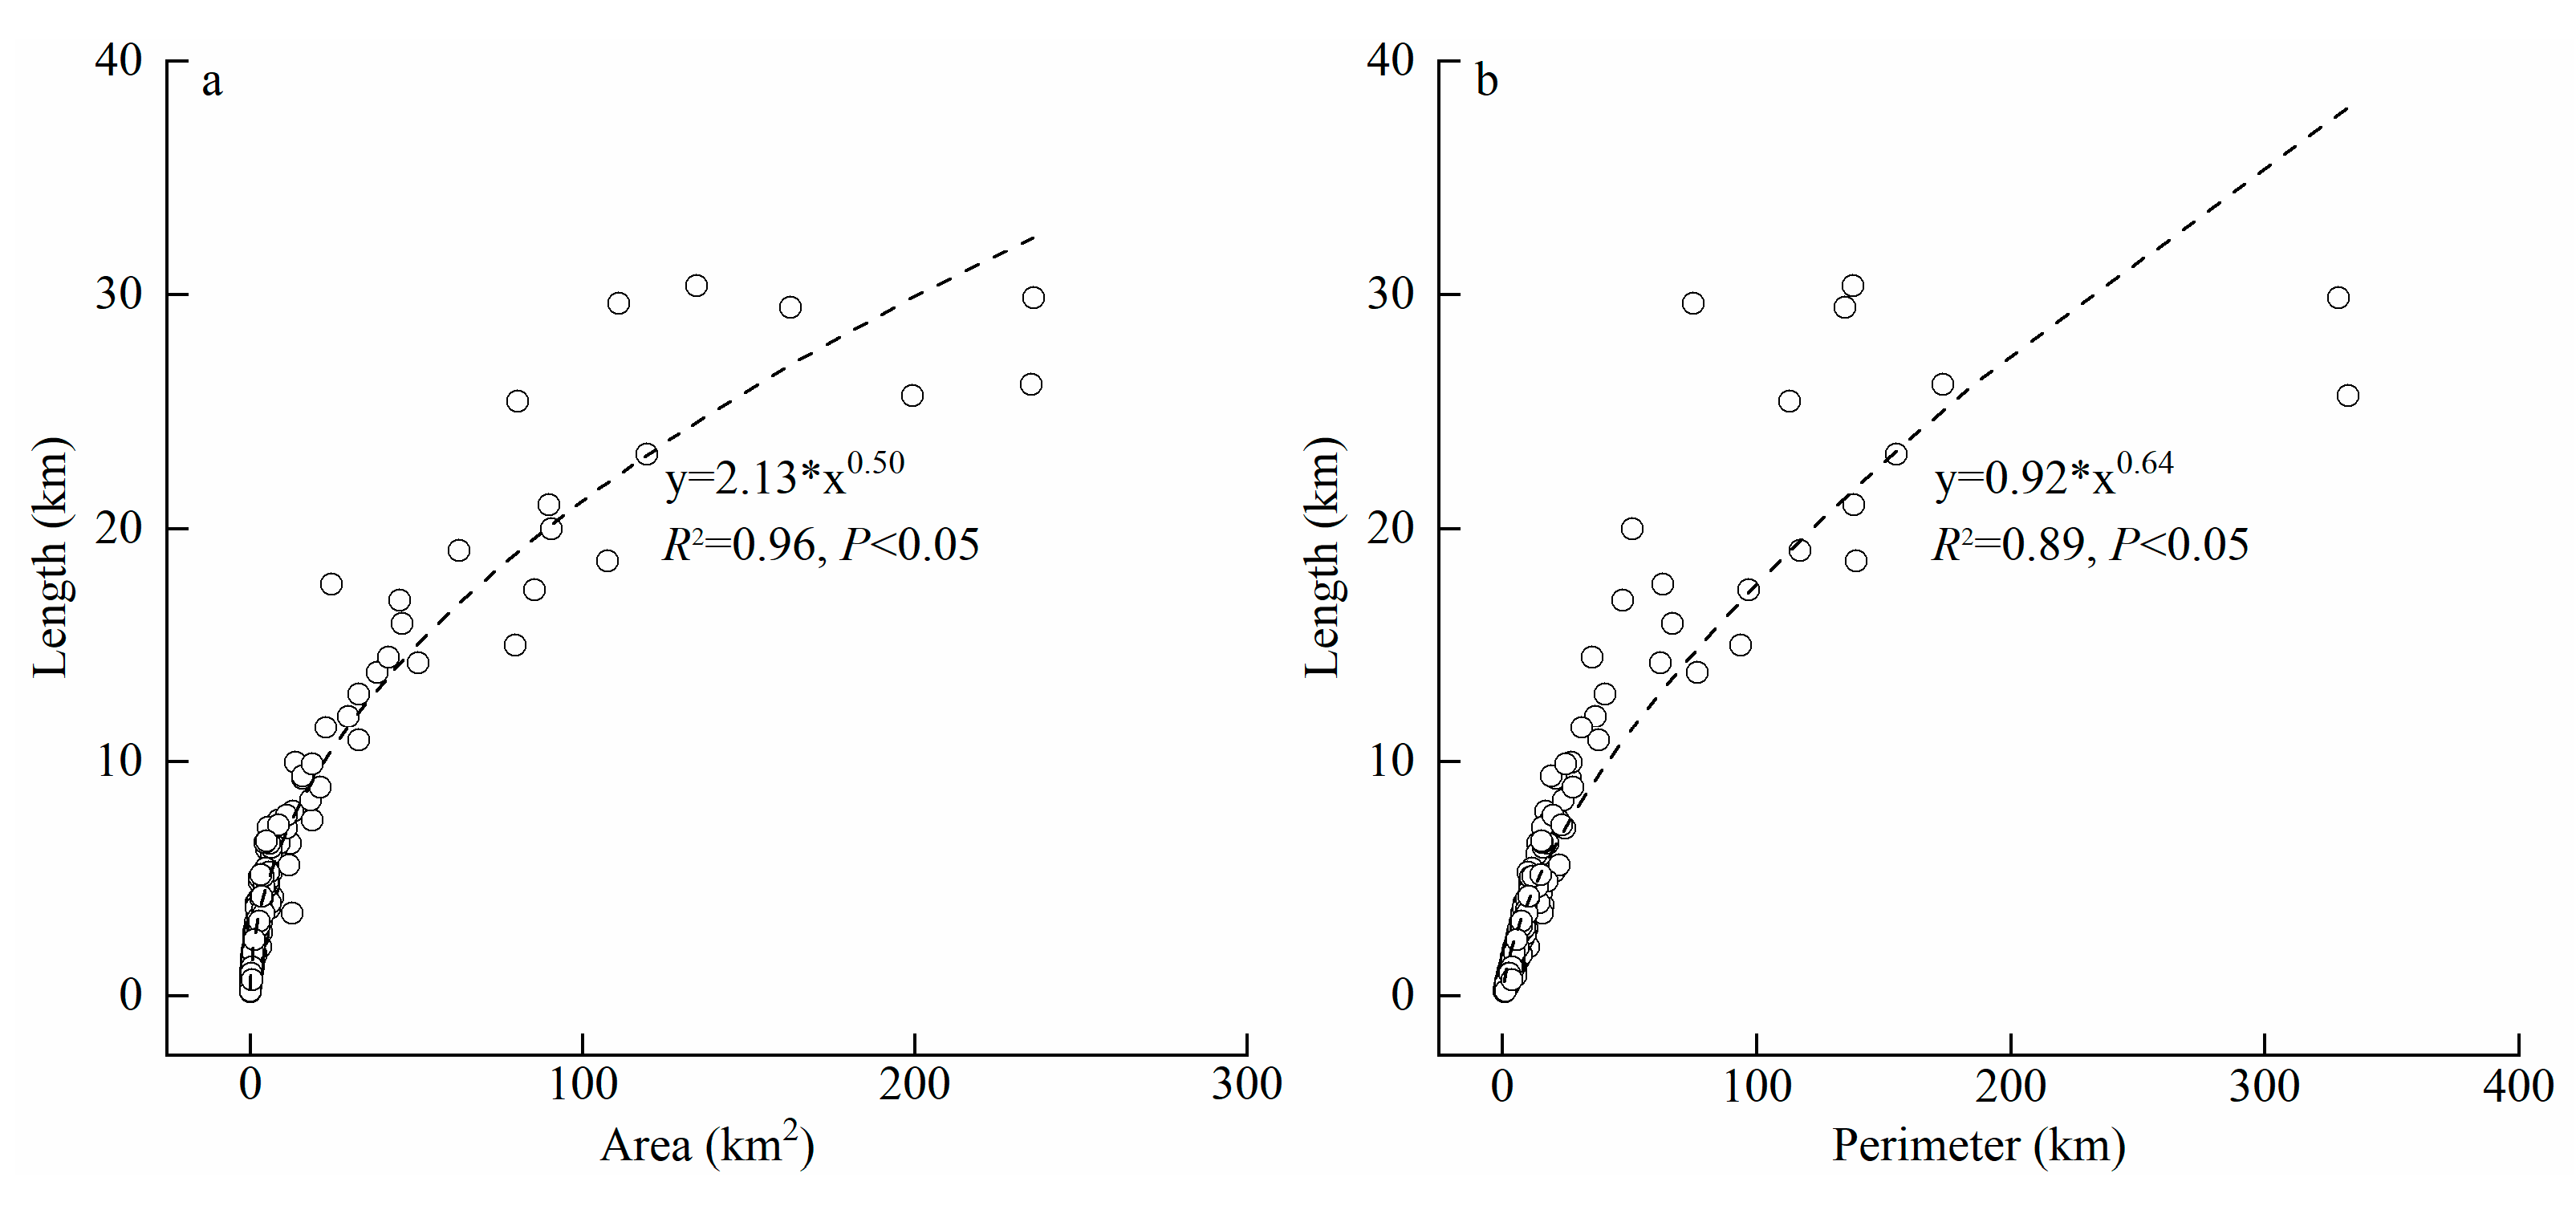
Length is a critical parameter frequently utilized in the analysis of velocity fields [51,52], ice volume estimation [53,54], and one-dimensional modeling of glaciers [55,56]. The geometric definition of glacier length is closely associated with glacier area and perimeter in two-dimensional space. Taking the glacier data in the WKMPA in 2020 as an example, a power fit curve was applied to analyze the relationship between glacier area, perimeter, and length (Figure 13). The results indicate that, similar to the empirical formula for glacier area and volume, the power fit curve yields high correlation coefficients of 0.96 and 0.89, respectively. However, the accuracy of the empirical formula fit for glacier length is highly dependent on glacier class. Greater precision can be achieved for smaller glaciers, while lower precision may result from neglecting complex morphological structures in large valley-basin glaciers and considering only a single quantitative relationship.

5. Discussion

5.1. Response of Glacier Area to Climate Change

Air temperature and precipitation conditions and their combination are the primary climatic factors influencing glacier change. The intra-annual distribution and inter-annual variability of precipitation affect glacier recharge and activity, while temperature directly influences glacier ablation and ice formation, both of which determine the nature, development, and evolution of glaciers [57]. At longer temporal and larger spatial scales, temperature exerts a more significant influence on glacier change, whereas at shorter temporal and smaller spatial scales, precipitation plays a more dominant role [58]. Furthermore, there is a lag effect in the response of glaciers to climate change [59], with the duration of this period primarily dependent on glacier size, type, movement speed, and melting rate [60].
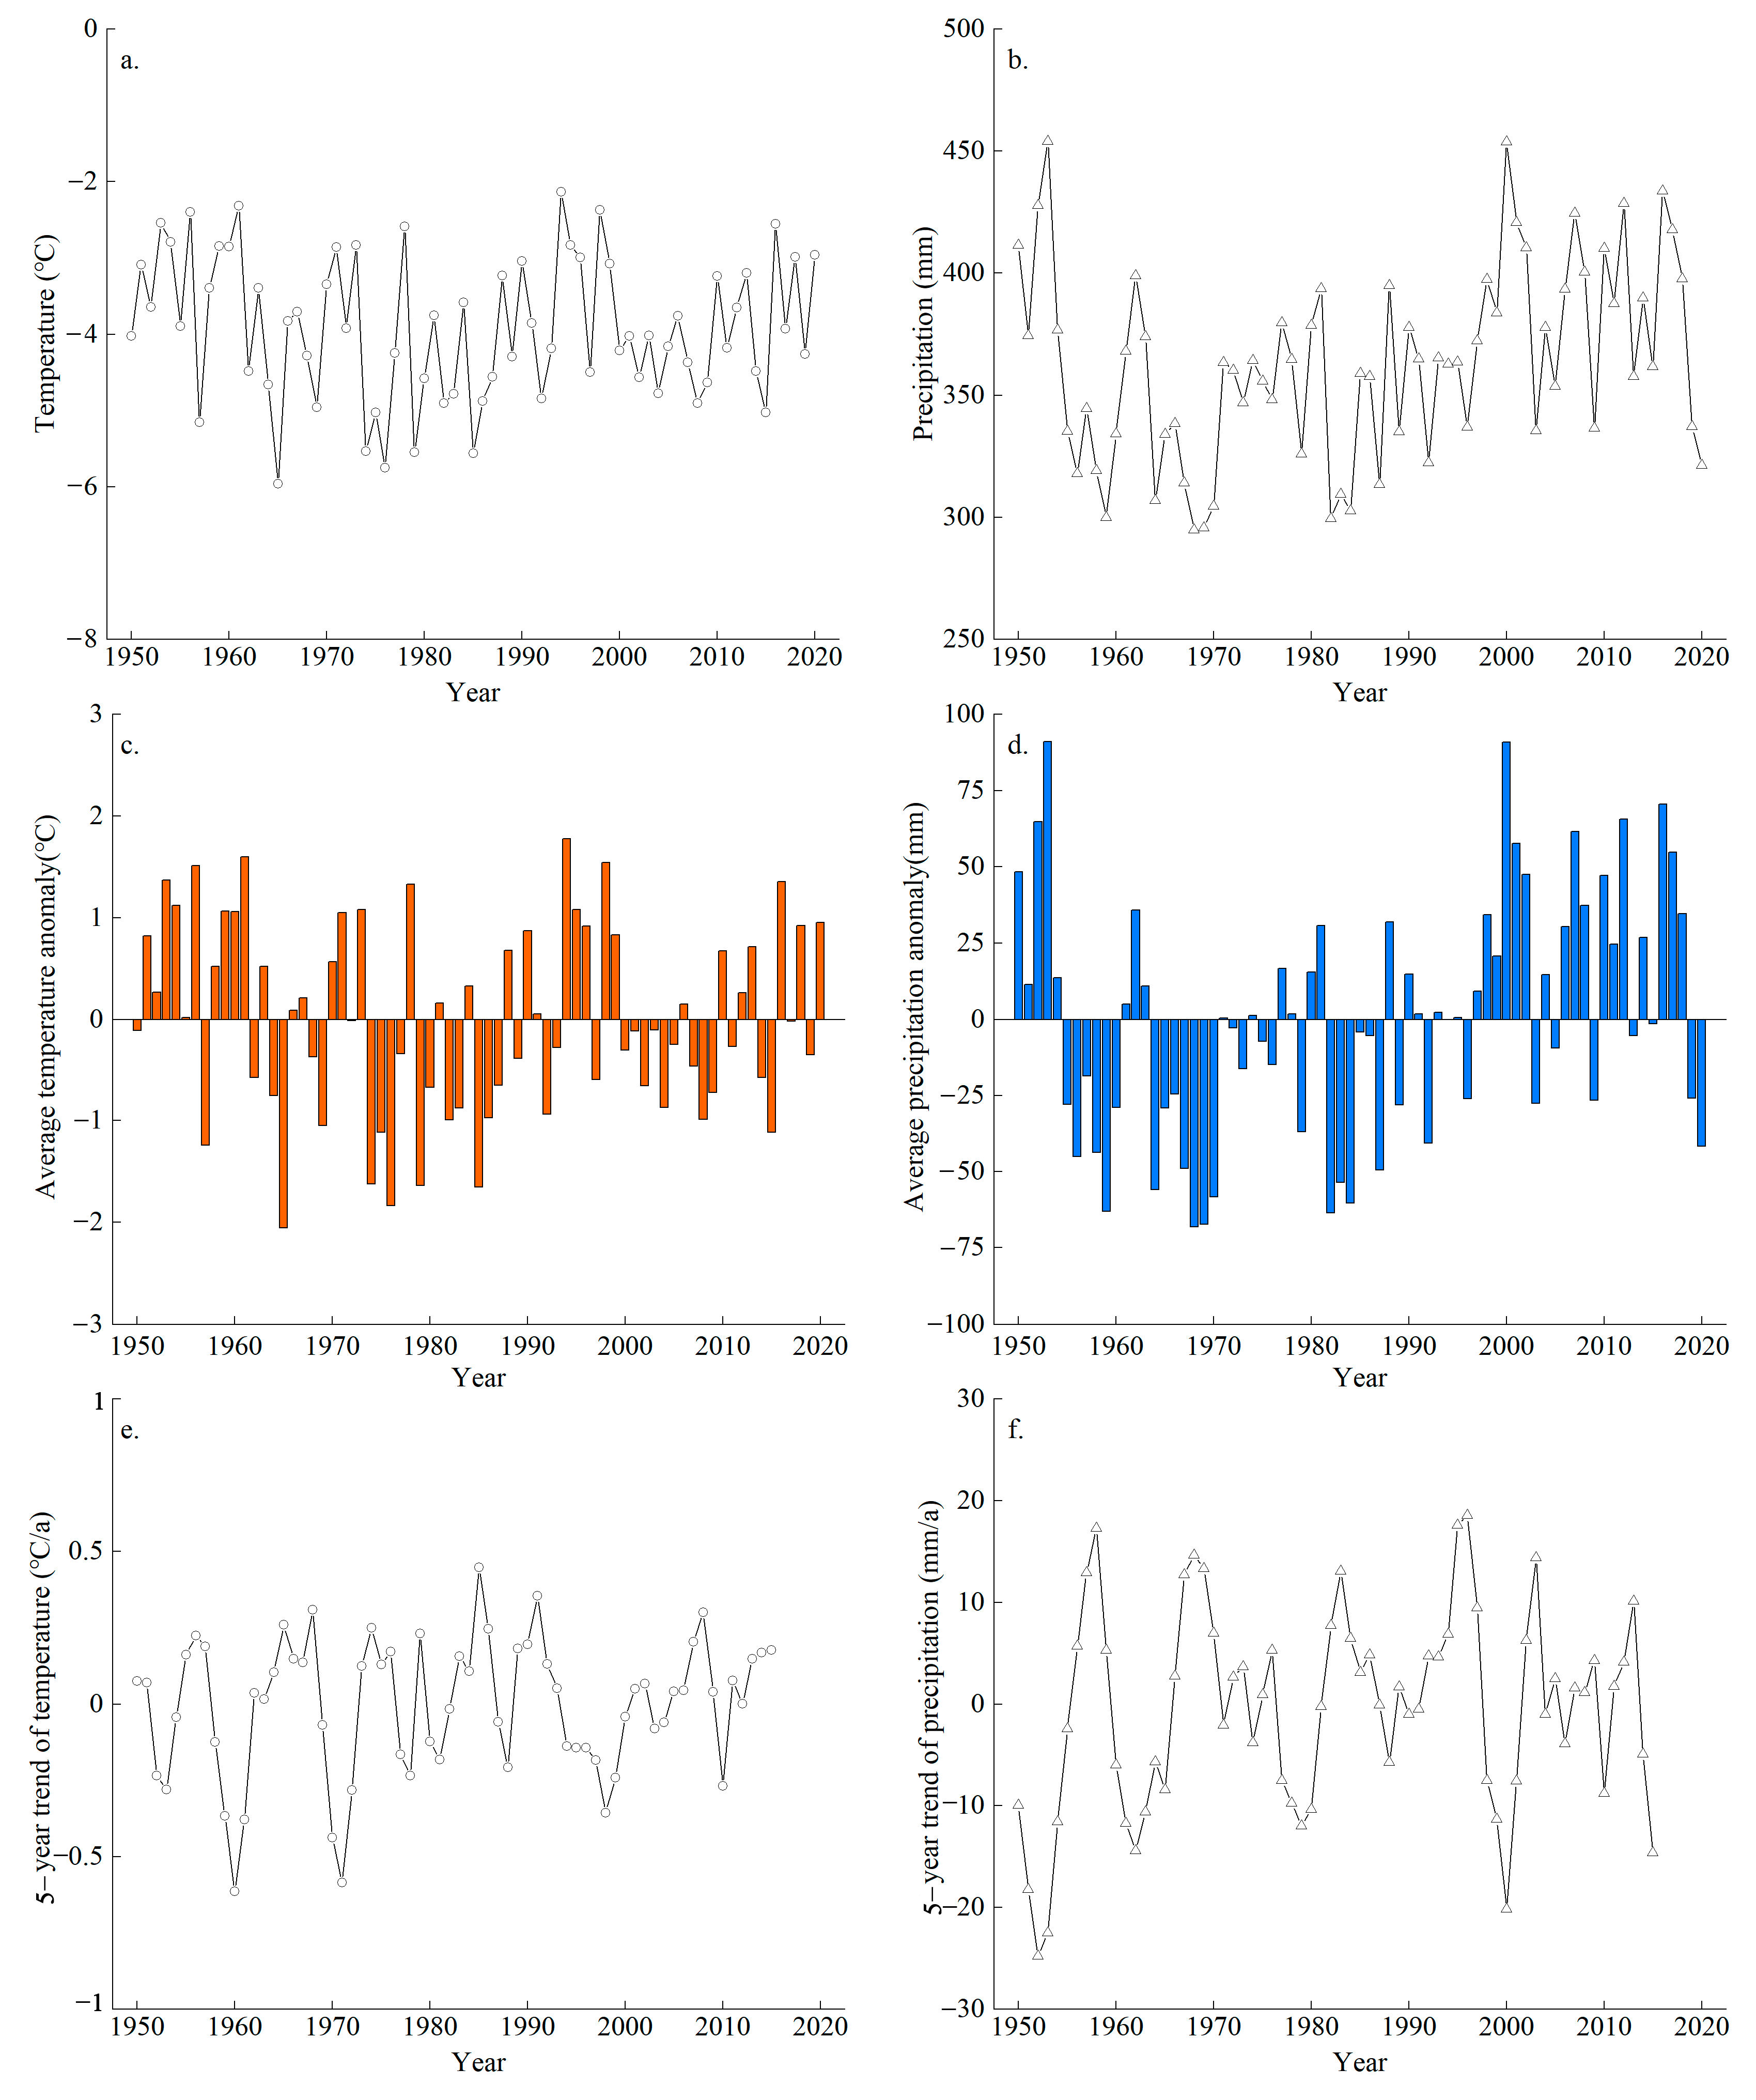
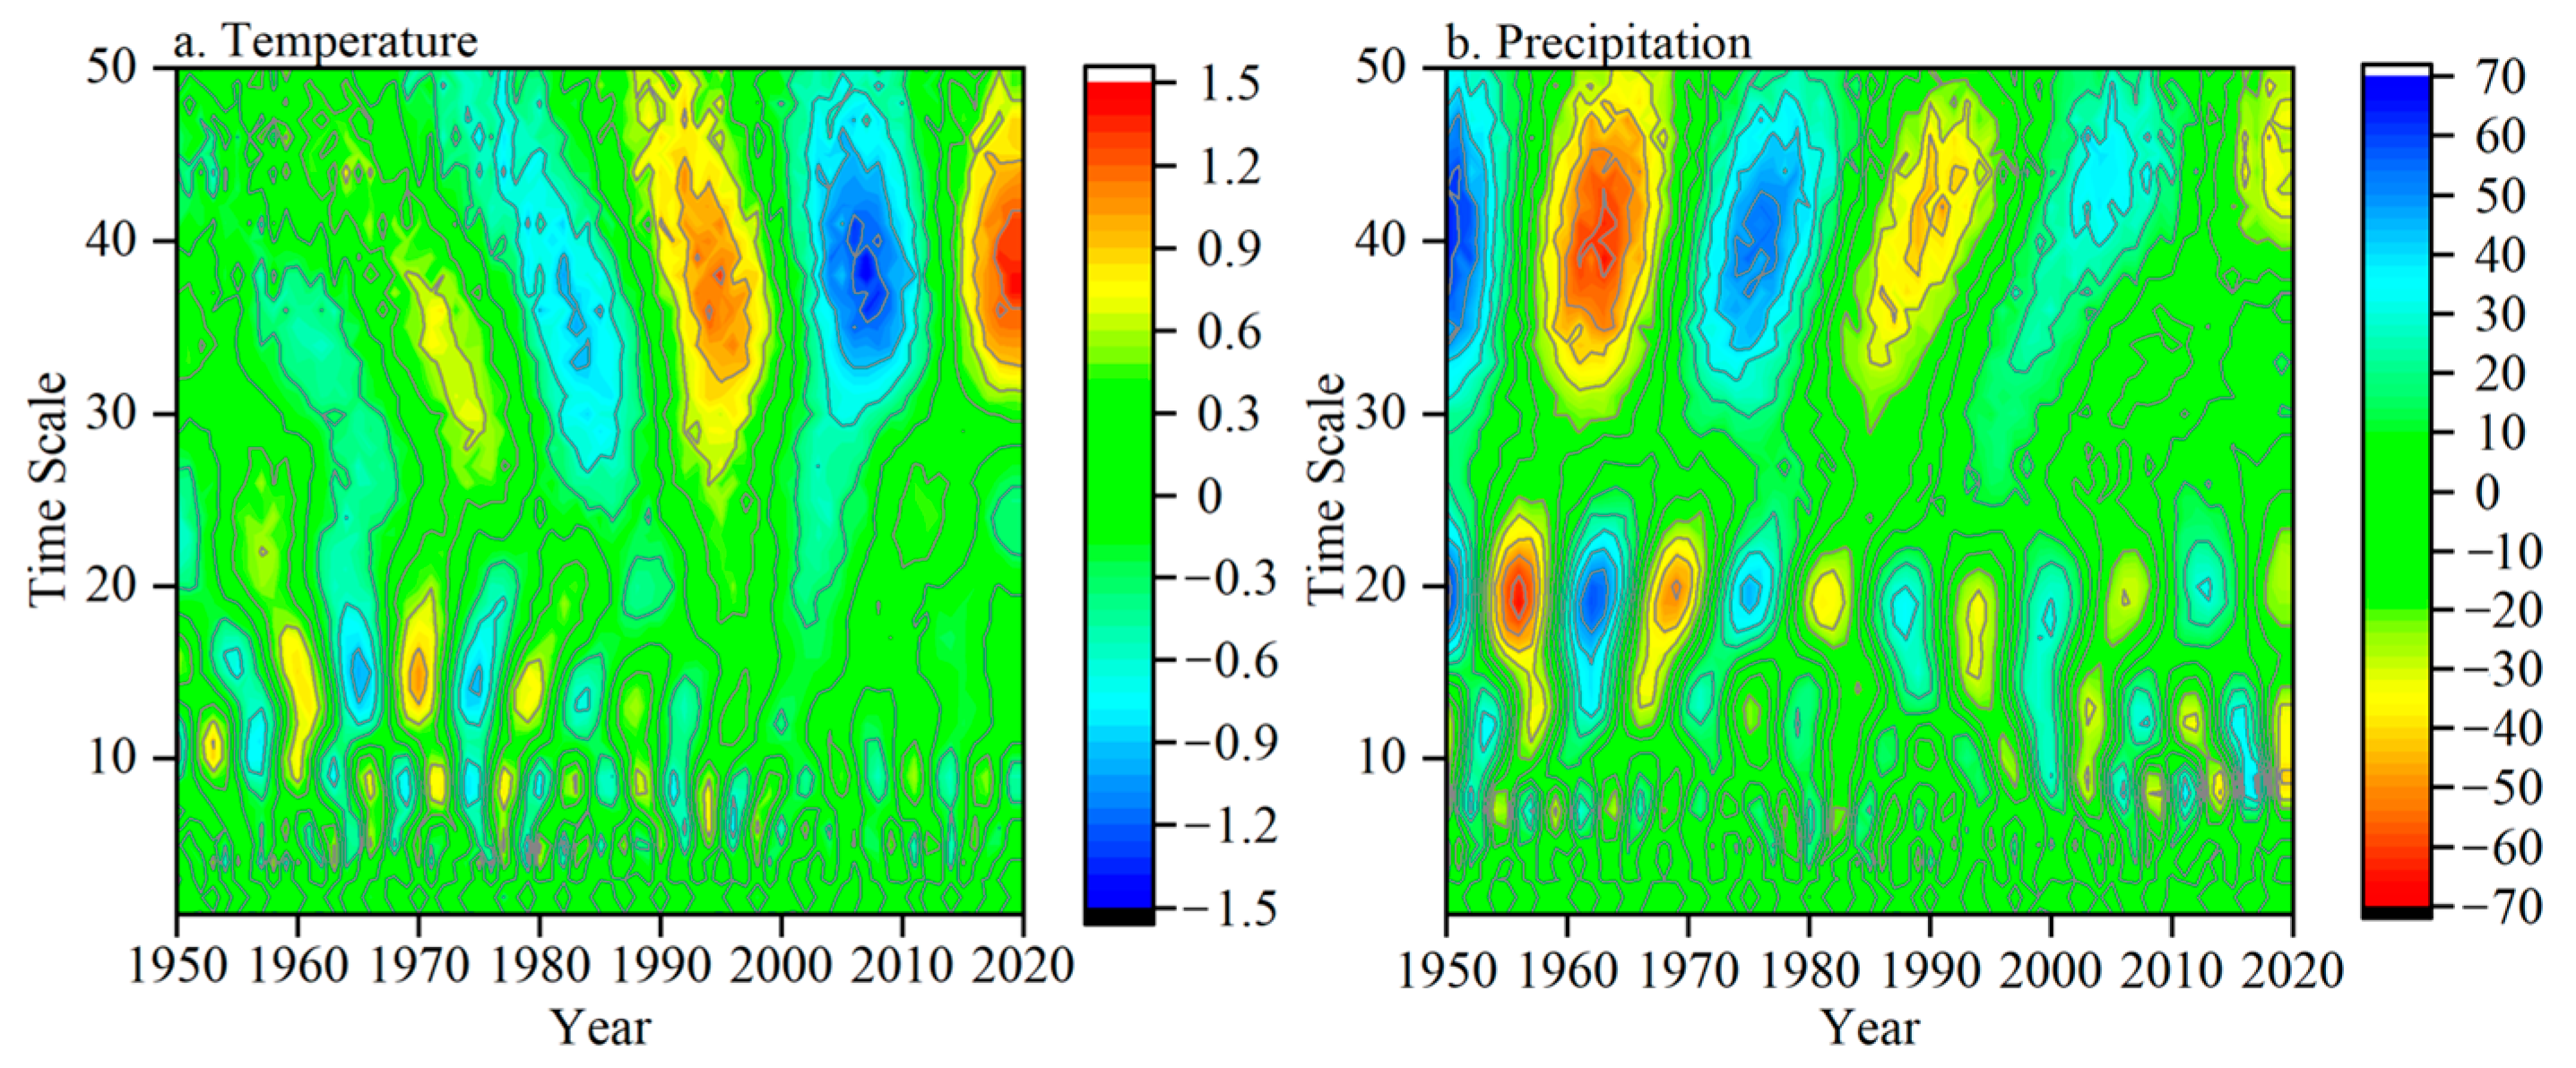
Based on the ERA5-Land data, we obtained the inter-annual temperature and precipitation data from 1950 to 2020 in the study area, and plotted the change curve of meteorological elements, anomaly distribution, and 5-year trend chart (Figure 14). To obtain the time lag between temperature changes and glacier response in this region, we compared trends in glacier area with rates of temperature change over five years. Then, we were surprised to find that the 5-year trend of temperature during 1988–2008 corresponded to the 5-year trend of glacier area during 2000–2020. Therefore, our findings suggest a 12-year time lag between temperature changes and glacier area response in this region [17] (Table 2). Furthermore, relevant studies have demonstrated that a 1 °C rise in summer mean temperature leads to a shift in the equilibrium-line altitude of 100–160 m, necessitating an increase in precipitation of 40–50% [61,62]. Despite the upward trends observed in both temperature and precipitation during 2006–2011, the increased precipitation was insufficient to compensate for the mass loss of glaciers caused by rising temperatures. Additionally, Morlet wavelet analysis was employed to examine the variations in temperature and annual precipitation during the ablation period [63] within the study area, elucidating their periodic patterns (Figure 15). The real part of the wavelet analysis coefficient contains both intensity and phase information of a signal at a specific time and scale, which can be leveraged to forecast its future trend changes across various temporal scales [64]. The results revealed conspicuous periodic fluctuations in temperature and precipitation within the study area during 1950–2020. Specifically, during the ablation period, dominant cycles of interannual precipitation and temperature were observed at 43 years and 38 years, respectively, while those for annual precipitation and temperature were found at 27 years and 25 years, correspondingly.
Therefore, considering the lag response of glaciers to climate change and the periodicity of climatic fluctuations, it is anticipated that glaciers’ retreats will persist in this region over the next decade. However, it should be noted that large glacier systems exhibit a more intricate response mechanism closely tied to their own hydrological conditions [65,66].

5.2. Glacier Change with an Area More Than 100 km2

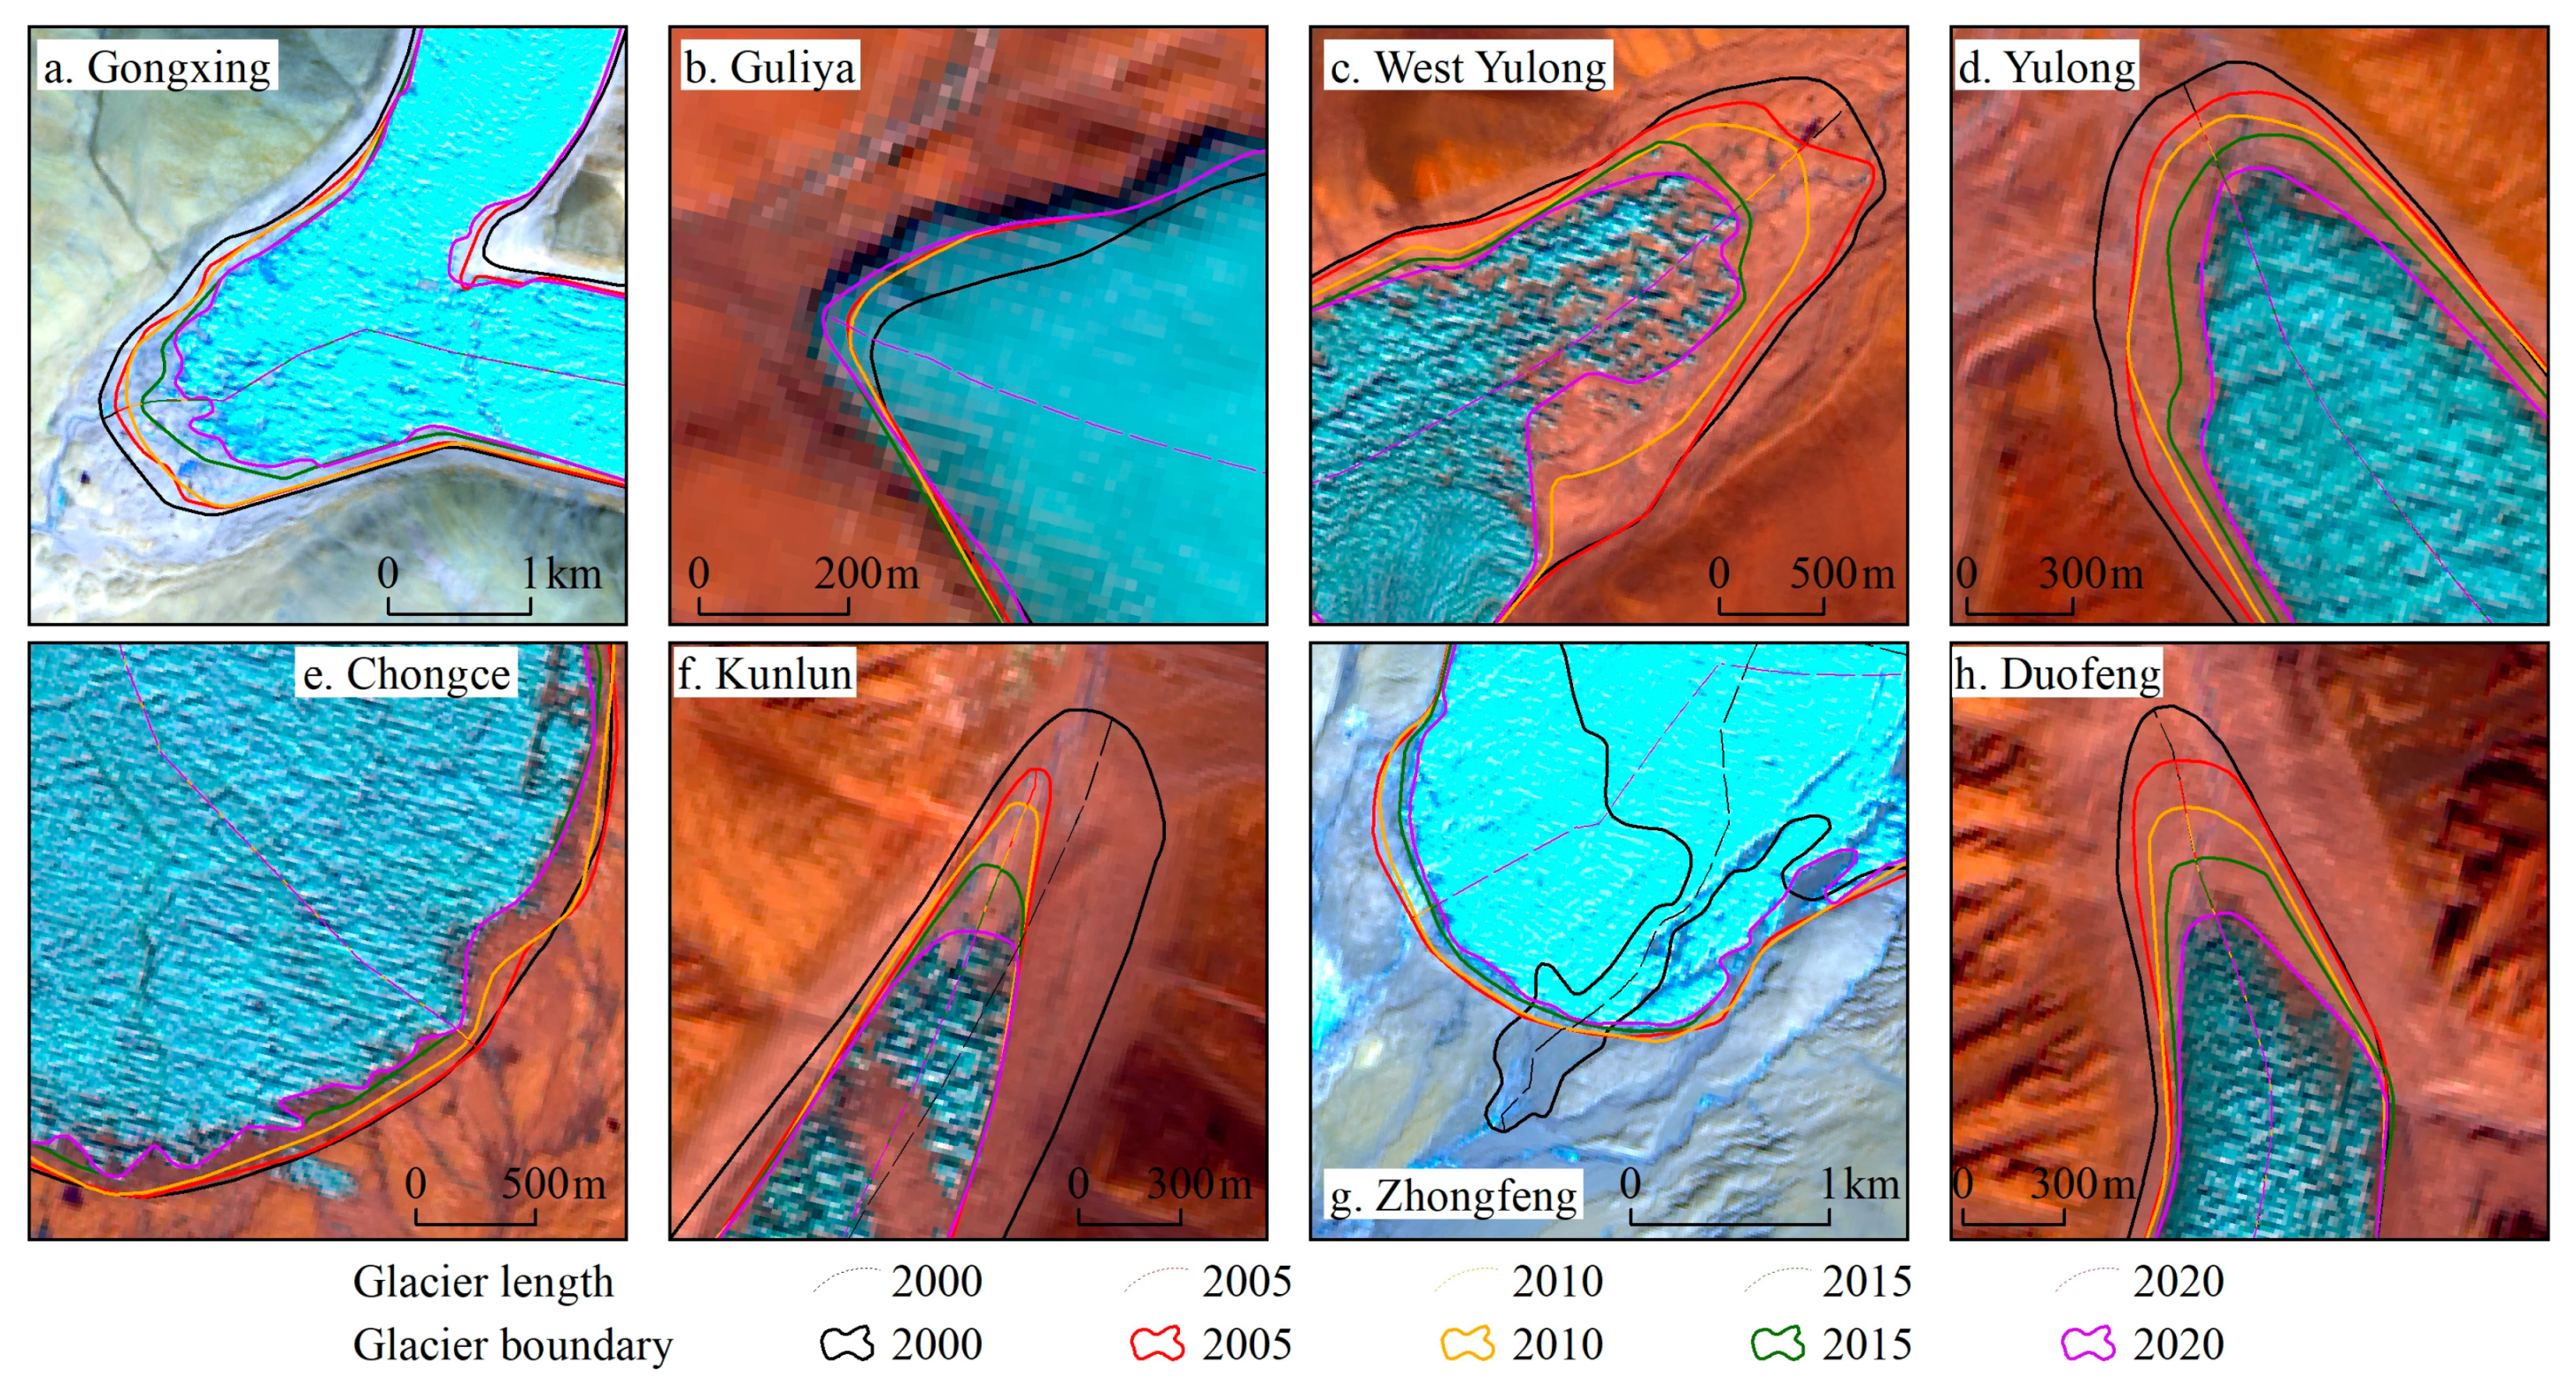
According to the second Chinese glacier inventory, there were 22 glaciers with an area of ≥100 km2, totaling 3977.91 km2 (7.68%), concentrated around the high peaks of the Tianshan, Karakoram, Kunlun, and Nyainqentanglha Mountains. Among them, the Kunlun Mountains had the highest concentration of giant glaciers and was the largest glacierized area in China [19]. This region boasts eight glaciers with an area exceeding 100 km2, namely Gongxing, Gulia, Xiyulong, Yulong, Chongce, Kunlun, Zhongfeng, and Duofeng. Based on a comparison of glacier area changes during 2000–2020 (Figure 16), all glaciers except for the Zhongfeng Glacier (+0.98 km2) exhibited a decreasing trend in their areas. The changes in glacier area can be classified into three types: “continuous decrease”, “irregular change”, and “increase followed by decrease”. Among them, the areas of Gongxing, West Yulong, Chongce, and Duofeng Glaciers have experienced continuous reduction in area. The Guliya and Yulong Glaciers exhibited irregular changes while the Kunlun and Zhongfeng Glaciers showed an increasing trend followed by a decrease. Compared with the relative change rate of glacier area (−0.04%·a−1) in the WKMPA during 2000–2020, giant glaciers have retreated significantly, with only Kunlun (~0), Zhongfeng (0.02%·a−1), and Duofeng (−0.02%·a−1) Glaciers experiencing less pronounced retreat.
Glacier change is not only manifested in area but also in length and terminal morphology. As illustrated in Figure 17, all glaciers except for the Guliya Glacier have experienced terminal retreat. Notably, the Guliya Glacier had a 74 m increase in length while its terminal altitude dropped from 5478 m to 5469 m during 2000–2020. Although an increasing trend was observed for the Zhongfeng Glacier, this can be attributed to changes in terminal morphology. Specifically, its length decreased by 991 m while its terminal altitude rose from 5338 m to 5343 m during the same period. In general, there exists a negative correlation between the changes in glacier length and terminal altitude. An increase in glacier length indicates its advancement and expansion towards lower altitudes, resulting in a decrease in terminal altitude. Therefore, when discussing terminal morphology and its changes, representation of glacier length is evidently more significant than that of area.

5.3. Glacier Separation and Advance

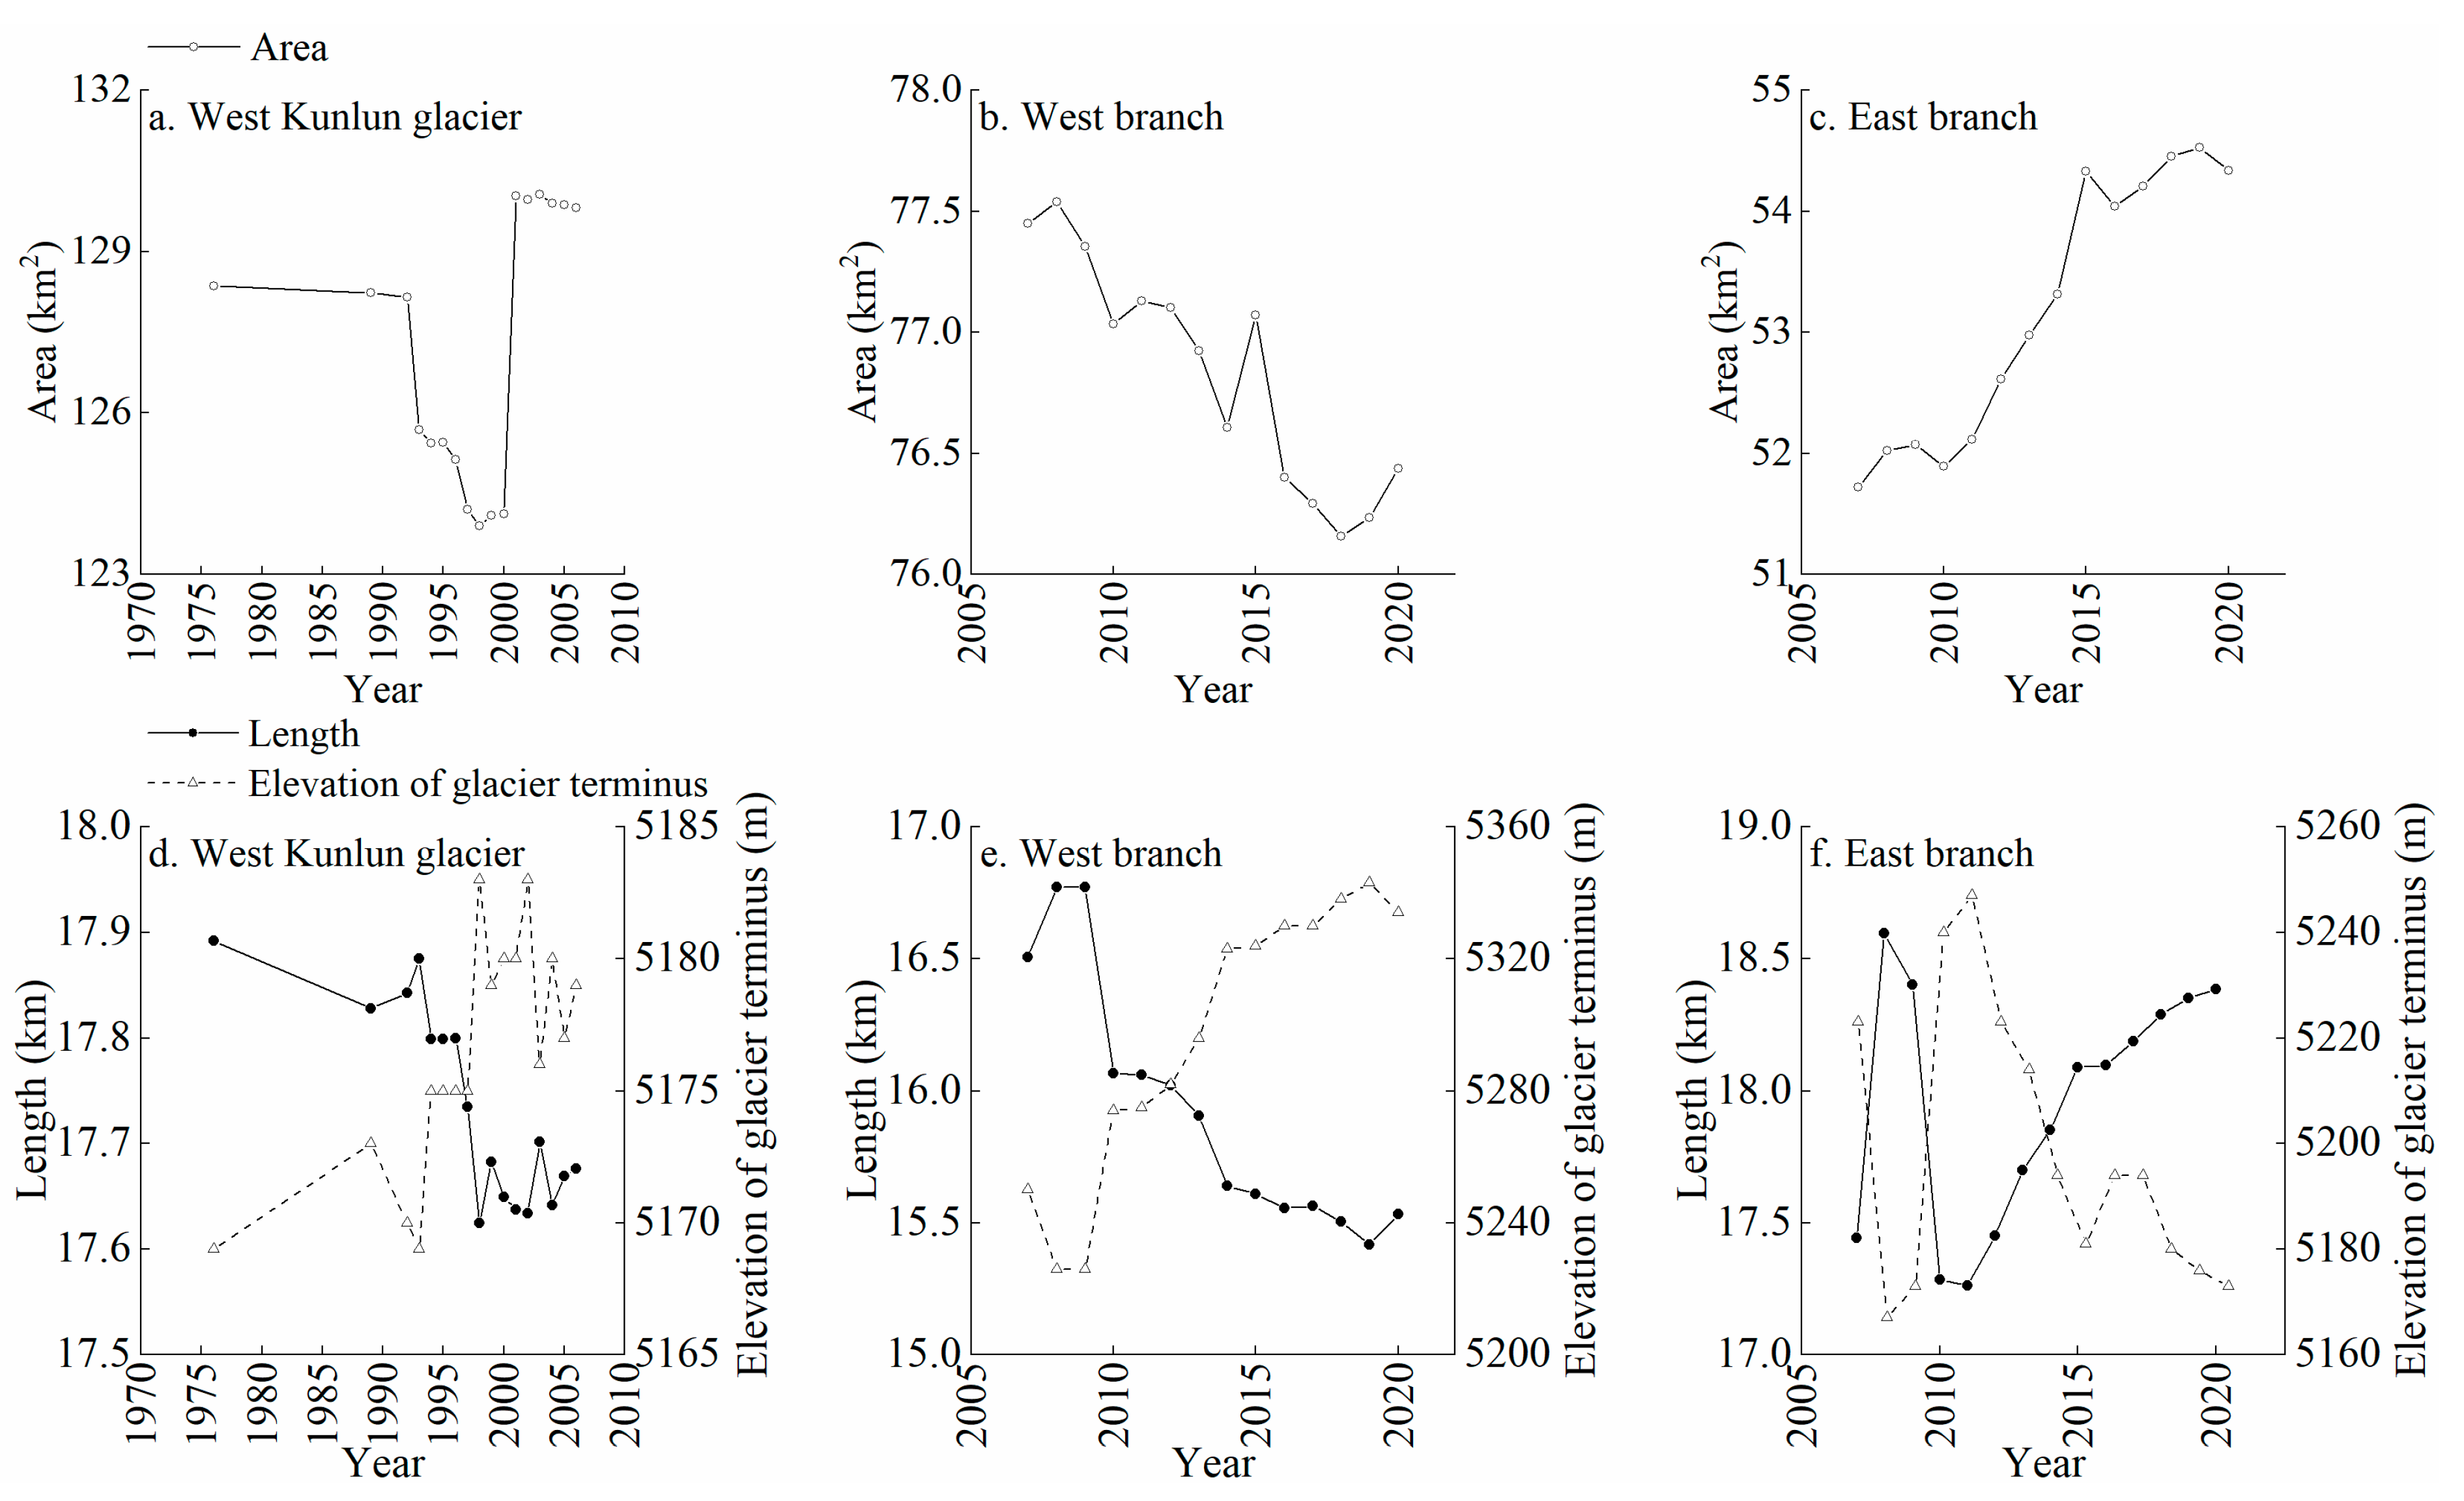
The glacier separation phenomenon is a manifestation of the process by which a glacier splits into multiple branches due to climate change. Compared with an unsplit glacier, changes in the area, length, and end position of a divided glacier are more complex [46]. With regards to the West Kunlun Glacier, it is necessary to examine changes in area, length, and terminus in two stages due to its division into east and west branches resulting from glacier retreat during 2006–2007 (Figure 18). From 1976 to 2006, the West Kunlun Glacier experienced an increase in area but a decrease in length, with an upward trend observed for its terminus altitude (Figure 19). Despite the expansion of its area during this period, the glacier retreated primarily due to lateral moraine erosion and transportation. The glacier’s length decreased from 17982 m to 17676 m during 1976–2006. Moreover, the length and the end altitude of the glacier showed opposite trends. Its area and length decreased annually from 1976 to 1996, while the area showed a trend of “increase followed by stable”. The glacier area decreased during 1996–2006. The total glacier area of the east and west branches exhibited an overall fluctuating increasing trend of 0.15 km2·a−1, increasing from 129.17 km2 to 130.77 km2 during 2007–2020, with the largest area observed in 2015 (131.40 km2).
The two branches of the West Kunlun Glacier demonstrated significant differences in their changes during 2007–2020 (Figure 17). The west branch experienced retreat, characterized by fluctuations and reductions in both its area and length, as well as an increase in the elevation of its terminus and median point. Specifically, the glacier’s area and length decreased from 77.45 km2 and 16507 m in 2007 to 76.44 km2 and 15532 m in 2020, at the rate of −0.10 km2·a−1 and −102 m·a−1, respectively. In contrast, the east branch showed an advance, characterized by an increase in both its area and length, as well as a fluctuation and decrease in the elevation of its terminus and median point. Its area and length increased from 51.72 km2 and 17442 m in 2007 to 54.33 km2 and 18385 m in 2020, with a corresponding change rate of 0.25 km2·a−1 and 46 m·a−1, respectively. By comparing the changes in glacier area and length between adjacent years, it was observed that the west branch of the glacier experienced an increase in its area during the periods 2007–2008 (0.09 km2), 2010–2011(0.10 km2), 2014–2015 (0.46 km2), and 2018–2020 (0.28 km2). Furthermore, its length increased during 2007–2008 (265 m) and 2019–2020 (115 m), while decreasing in other periods. The east branch glacier experienced a reduction in area during the periods 2009–2010 (−0.18 km2), 2015–2016 (−0.29 km2), and 2019–2020 (−0.19 km2). Additionally, there was a decrease in length during 2008–2011 (−1335 m), with an increase observed during other periods. Following its division in 2007–2008, both branches of the West Kunlun Glacier advanced, with an increase in area and length as well as a decrease in terminus elevation; however, this trend was followed by a strong retreat during 2009–2010, while both branches of the glacier exhibited distinct trends after 2010. It can be concluded that the mechanism of glacier division and subsequent change is complex, exhibiting synchronous as well as different advances and retreats. Therefore, a detailed analysis of specific changes in area, length, and elevation at the terminus of the glacier is necessary to avoid generalizations.

6. Conclusions

In this study, we conducted a systematic analysis of the geometrical change characteristics of glaciers and their impacts in the WKMPA during 2000–2020, based on Landsat TM/ETM+/OLI remote sensing images and SRTM DEM data. Building upon previous research, our findings revealed numerous glacier change patterns and their responses to climate change. The main conclusions include: (1) There were 440 glaciers in the WKMPA in 2020, with an area of 2964.59 ± 54.87 km2 and an average length of 2916 ± 60 m. (2) The number of glaciers increased during the periods 2000–2005 and 2005–2010 as a result of glacier division, remaining stable thereafter. Over the period from 2000 to 2020, there were reductions in glacier area and length by 24.83 km2 and 66 m, with relative change rates of −0.04%·a−1 and −0.11%·a−1, respectively. On the whole, the degree of glacier change is relatively unobvious. Glacier retreat was primarily observed during the early period (2000–2005). (3) It is to some extent worthwhile to explore the relationship between different glacier parameters to help us calculate the other parameters quickly. Meanwhile, the accuracy of the empirical formula fit for parameters is greatly affected by the area class of glaciers from a two-dimensional perspective. (4) There is a 12-year time lag between temperature fluctuations and glacier area response in this region. (5) The mechanism by which glacier division affects glacier change is complex. In general, it is necessary to analyze its changes concretely before and after division.

Author Contributions

Conceptualization, C.Z. and X.Y.; methodology, C.Z. and X.Y.; software, C.Z., S.L., L.L. and T.S.; validation, C.Z., X.Y., S.L. and Y.Z.; formal analysis, C.Z. and T.S.; investigation, C.Z., L.L. and T.S.; resources, C.Z. and X.Y.; data curation, C.Z., L.L. and T.S.; writing—original draft preparation, C.Z.; writing—review and editing, C.Z. and Y.Z.; visualization, C.Z., X.Y., S.L., L.L., T.S. and Y.Z.; supervision, C.Z. and L.L.; project administration, C.Z.; funding acquisition, X.Y. All authors have read and agreed to the published version of the manuscript.

Funding

This research was jointly funded by the Third Xinjiang Scientific Expedition Program (no. 2021xjkk0801), the National Key Research and Development Program of China (no. 2019YFE0127700), the Wetland Protection and Restoration Program (no. QHDY2022-12-12A), the National Natural Science Foundation of China (no. 42161027) and the Northwest Normal University Postgraduate Research Program (no. 2021KYZZ01040).

Data Availability Statement

Not applicable.

Conflicts of Interest

The authors declare no conflict of interest.

References

  1. IPCC. Synthesis Report of the IPCC Sixth Assessment Report (AR6): Longer Report; Cambridge University Press: London, UK, 2023. [Google Scholar]
  2. Qin, D.H. Introduction to Cryospheric Science; Science Press: Beijing, China, 2017; p. 1. [Google Scholar]
  3. Piao, S.L.; Ciais, P.; Huang, Y.; Shen, Z.H.; Peng, S.S.; Li, J.S.; Zhou, L.P.; Liu, H.Y.; Ma, Y.C.; Ding, Y.H.; et al. The impacts of climate change on water resources and agriculture in China. Nature 2010, 467, 43–51. [Google Scholar] [CrossRef]
  4. Sorg, A.; Bolch, T.; Stoffel, M.; Solomina, O.; Beniston, M. Climate change impacts on glaciers and runoff in Tien Shan (Central Asia). Nat. Clim. Change 2012, 2, 725–731. [Google Scholar] [CrossRef]
  5. Zhang, C.; Yao, X.J.; Xiao, J.S.; Zhang, H.F.; Wang, Y.; Xue, J. Spatio-temporal characteristics of glacier and lake variations in Qinghai province from 2000 to 2020. J. Nat. Res. 2023, 38, 822–838. [Google Scholar] [CrossRef]
  6. Yao, T.D.; Zhu, L.P. The response of environmental changes on Tibetan Plateau to global changes and adaptation strategy. Adv. Earth Sci. 2006, 21, 459–464. [Google Scholar] [CrossRef]
  7. Yao, X.J.; Liu, S.Y.; Sun, M.P.; Zhang, X.J. Study on the glacial lake outburst flood events in Tibet since the 20th century. J. Nat. Res. 2014, 29, 1377–1390. [Google Scholar] [CrossRef]
  8. Ye, Q.H.; Cheng, W.M.; Zhao, Y.L.; Zong, J.B.; Zhao, R. A review on the research of glacier changes on the Tibetan Plateau by remote sensing technologies. J. Geo–Inf. Sci. 2016, 18, 920–930. [Google Scholar] [CrossRef]
  9. You, Q.L.; Zhang, Y.Q.; Xie, X.Y.; Wu, F.Y. Robust elevation dependency warming over the Tibetan Plateau under global warming of 1.5 °C and 2 °C. Clim. Dynam. 2019, 53, 2047–2060. [Google Scholar] [CrossRef]
  10. China Meteorological Administration Climate Change Centre. Blue Book on Climate Change in China 2021; Science Press: Beijing, China, 2021; pp. 12–17. [Google Scholar]
  11. Farinotti, D.; Huss, M.; Fürst, J.J.; Landmann, J.; Machguth, H.; Maussion, F.; Pandit, A. A consensus estimate for the ice thickness distribution of all glaciers on Earth. Nat. Geosci. 2019, 12, 168–173. [Google Scholar] [CrossRef]
  12. Kraaijenbrink, P.D.A.; Bierkens, M.F.P.; Lutz, A.F.; Immerzeel, W.W. Impact of a global temperature rise of 1.5 degrees Celsius on Asia’s glaciers. Nature 2017, 549, 257–260. [Google Scholar] [CrossRef]
  13. Yao, T.D.; Xue, Y.K.; Chen, D.L.; Chen, F.H.; Thompson, L.; Cui, P.; Koike, T.; Lau, W.K.M.; Lettenmaier, D.; Mosbrugger, V.; et al. Recent Third Pole’s rapid warming accompanies cryospheric melt and water cycle intensification and interactions between monsoon and environment: Multi–disciplinary approach with observation, modeling and analysis. Bull. Am. Meteorol. Soc. 2019, 100, 423–444. [Google Scholar] [CrossRef]
  14. Gardelle, J.; Berthier, E.; Arnaud, Y. Impact of resolution and radar penetration on glacier elevation changes computed from DEM differencing. J. Glaciol. 2012, 58, 419–422. [Google Scholar] [CrossRef]
  15. Gardelle, J.; Berthier, E.; Arnaud, Y.; Kääb, A. Region–wide glacier mass balances over the Pamir–Karakoram–Himalaya during 1999–2011. Cryosphere 2013, 7, 1263–1286. [Google Scholar] [CrossRef]
  16. Farinotti, D.; Immerzeel, W.W.; Kok, R.J.; Quincey, D.J.; Dehecq, A. Manifestations and mechanisms of the Karakoram glacier Anomaly. Nat. Geosci. 2020, 13, 8–16. [Google Scholar] [CrossRef]
  17. Wang, Y.T.; Hou, S.G.; Huai, B.J.; An, W.L.; Pang, H.X.; Liu, Y.P. Glacier anomaly over the western Kunlun Mountains, Northwestern Tibetan Plateau, since the 1970s. J. Glaciol. 2018, 64, 624–636. [Google Scholar] [CrossRef]
  18. Yao, T.D.; Yu, W.S.; Wu, G.J.; Xu, B.Q.; Yang, W.; Zhao, H.B.; Wang, W.C.; Li, S.H.; Wang, N.L.; Li, Z.Q.; et al. Glacier anomalies and relevant disaster risks on the Tibetan Plateau and surroundings. Chin. Sci. Bull. 2019, 64, 2770–2782. [Google Scholar] [CrossRef]
  19. Liu, S.Y.; Yao, X.J.; Guo, W.Q.; Xu, J.L.; Shangguan, D.H.; Wei, J.F.; Bao, W.J.; Wu, L.Z. The contemporary glaciers in China based on the Second Chinese Glacier Inventory. Acta Geo. Sin. 2015, 70, 3–16. [Google Scholar] [CrossRef]
  20. Bao, W.J.; Liu, S.Y.; Wei, J.F.; Guo, W.Q. Glacier changes during the past 40 years in the West Kunlun Shan. J. Mt. Sci. 2015, 12, 344–357. [Google Scholar] [CrossRef]
  21. Ma, Q.Q. Monitoring glacier change on West–Kunlun Shan based on multi–source remote sensing data. Master’s Thesis, Nanjing University, Nanjing, China, 2018. [Google Scholar]
  22. Zhou, Y.; Li, Z.; Li, J.; Zhao, R.; Ding, X.L. Glacier mass balance in the Qinghai Tibet Plateau and its surroundings from the mid–1970s to 2000 based on Hexagon KH–9 and SRTM DEMs. Remote Sens. Environ. 2018, 210, 96–112. [Google Scholar] [CrossRef]
  23. Han, Y.F. Research on Glacier Change in the West Kunlun Mountains and Flow Velocity Estimation Based on Landsat Images (1977–2013). Master’s Thesis, Nanjing University, Nanjing, China, 2015. [Google Scholar]
  24. Xu, L.P.; Li, P.H.; Li, Z.Q.; Zhang, Z.Y.; Wang, P.Y.; Xu, C.H. Advances in research on changes and effects of glaciers in Xinjiang mountains. Adv. Water Sci. 2020, 31, 946–959. [Google Scholar] [CrossRef]
  25. Ni, M.X.; Duan, Z.R.; Xia, J.X. Melting of mountain glacier and its risk to future water resources in Southern Xinjiang, China. Mt. Res. 2022, 40, 329–342. [Google Scholar] [CrossRef]
  26. Guan, W.J. Modern Glacier Changes in the Main Peak Area of West Kunlun Mountains. Master’s Thesis, Lanzhou University, Lanzhou, China, 2020. [Google Scholar]
  27. Duan, K.Q.; Shi, P.H.; He, J.P. Numerical simulations of mountain glacial changes and its application in Asian High Mountains. J. Glacio. Geocryo. 2022, 44, 753–761. [Google Scholar] [CrossRef]
  28. Kääb, A. Monitoring high–mountain terrain deformation from repeated air and spaceborne optical data: Examples using digital aerial imagery and ASTER data. ISPRS J. Photogramm. Remote Sens. 2002, 57, 39–52. [Google Scholar] [CrossRef]
  29. Mukul, M.; Srivastava, V.; Mukul, M. Analysis of the accuracy of Shuttle Radar Topography Mission (SRTM) height models using International Global Navigation Satellite System Service (IGS) Network. J. Earth Sys. Sci. 2015, 124, 1343–1357. [Google Scholar] [CrossRef]
  30. Czernecki, B.; Taszarck, M.; Marosz, M.; Półrolniczak, M.; Kolendowicz, L.; Wyszogrodzki, A.; Szturc, J. Application of machine learning to large hail prediction–The importance of radar reflectivity, lightning occurrence and convective parameters derived from ERA5. Atmos. Res. 2019, 227, 249–262. [Google Scholar] [CrossRef]
  31. Hersbach, H.; Bell, B.; Berrisford, P.; Hirahara, S.; Horányi, A.; Muñoz-Sabater, J.; Nicolas, J.; Peubey, C.; Radu, R.; Schepers, D.; et al. The ERA5 global reanalysis. Q. J. Roy. Meteor. Soc. 2020, 146, 1999–2049. [Google Scholar] [CrossRef]
  32. Paul, F.; Kääb, A.; Maisch, M.; Kellenberger, T.; Haeberli, W. The new remote–sensing–derived Swiss glacier inventory: I. methods. Ann. Glacio. 2002, 34, 355–361. [Google Scholar] [CrossRef]
  33. Racoviteanu, A.E.; Paul, F.; Raup, B.H.; Khalsa, S.J.S.; Armstrong, R. Challenges and recommendations in mapping of glacier parameters from space: Results of the 2008 Global Land Ice Measurements from Space (GLIMS) workshop, Boulder, Colorado, USA. Ann. Glacio. 2009, 50, 53–69. [Google Scholar] [CrossRef]
  34. Paul, F.; Barry, R.G.; Cogley, J.G.; Haeberli, W.; Ohmura, A.; Ommanney, C.S.L.; Raup, B.; Rivera, A.; Zemp, M. Recommendations for the compilation of glacier inventory data from digital sources. Ann. Glacio. 2010, 50, 119–126. [Google Scholar] [CrossRef]
  35. Wang, Y.; Wu, L.Z.; Xu, J.L.; Liu, S.Y. Variation and uncertainty analysis of the glaciers in the past 50 years in Geladandong of Tibetan Plateau. J. Glacio. Geocryo. 2013, 35, 255–262. [Google Scholar] [CrossRef]
  36. Guo, W.Q.; Liu, S.Y.; Xu, J.L.; Wu, L.Z.; Shangguan, D.H.; Yao, X.J.; Wei, J.F.; Bao, W.J.; Yu, P.C.; Liu, Q.; et al. The second Chinese glacier inventory: Data, methods and results. J. Glacio. 2015, 61, 357–372. [Google Scholar] [CrossRef]
  37. Paul, F.; Bolch, T.; Kääb, A.; Nagler, T.; Nuth, C.; Scharrer, K.; Shepherd, K.; Strozzi, T.; Ticconi, F.; Bhambri, R.; et al. The glaciers climate change initiative: Methods for creating glacier area, elevation change and velocity products. Remote Sens. Environ. 2015, 162, 408–426. [Google Scholar] [CrossRef]
  38. Raup, B.; Kääb, A.; Kargel, J.S.; Bishop, M.P.; Hamilton, G.; Lee, E.; Paul, F.; Rau, F.; Soltesz, D.; Khalsa, S.J.S.; et al. Remote sensing and GIS technology in the Global Land Ice Measurements from Space (GLIMS) project. Comput. Geosci. 2007, 33, 104–125. [Google Scholar] [CrossRef]
  39. Guo, W.Q.; Liu, S.Y.; Yu, P.C.; Xu, J.L. Automatic extraction of ridgelines using on drainage boundaries and aspect difference. Sci. Sur. Map. 2011, 36, 191, 210–212. [Google Scholar] [CrossRef]
  40. Zhang, D.H.; Yao, X.J.; Duan, H.Y.; Liu, S.Y.; Guo, W.Q.; Sun, M.P.; Li, D.Z. A new automatic approach for extracting glacier centerlines based on Euclidean allocation. Cryosphere 2021, 15, 1955–1973. [Google Scholar] [CrossRef]
  41. Williams, R.S.; Hall, D.K.; Sigurosson, O.; Chien, J.Y.L. Comparison of satellite—Derived with ground–based measurements of the fluctuations of the margins of Vatnajökull, Iceland, 1973–1992. Ann. Glaciol. 1997, 24, 72–80. [Google Scholar] [CrossRef]
  42. Hall, D.K.; Bayr, K.J.; Schnöer, W.; Bindschadler, R.A.; Chien, J.Y.L. Consideration of the errors inherent in mapping historical glacier positions in Austria from ground and space (1893–2001). Remote Sens. Environ. 2003, 86, 566–577. [Google Scholar] [CrossRef]
  43. Kochtitzky, W.H.; Edwards, B.R.; Enderlin, E.M.; Marino, J.; Marinque, N. Improved estimates of glacier change rates at Nevado Coropuna Ice Cap, Peru. J. Glaciol. 2018, 64, 175–184. [Google Scholar] [CrossRef]
  44. Paul, F.; Andreassen, L.M. A new glacier inventory for the Svartisen region, Norway, from Landsat ETM+ data: Challenges and change assessment. J. Glaciol. 2009, 55, 607–618. [Google Scholar] [CrossRef]
  45. Yao, X.J.; Liu, S.Y.; Zhu, Y.; Gong, P.; An, L.N.; Li, X.F. Design and implementation of an automatic method for deriving glacier centerlines based on GIS. J. Glaciol. Geocryol. 2015, 37, 1563–1570. [Google Scholar] [CrossRef]
  46. Zhang, C.; Yao, X.J.; Liu, S.Y.; Zhang, D.H.; Xu, J.L. Variation of glacier length in the Altun Mountains during 1970–2016. J. Glaciol. Geocryol. 2021, 43, 49–60. [Google Scholar] [CrossRef]
  47. Zhou, S.G.; Yao, X.J.; Zhang, Y.; Zhang, D.H.; Duan, H.Y. A glacier vector dataset in the Qaidam Basin from 1977 to 2018. China Sci. Data 2021, 6, 175–182. [Google Scholar] [CrossRef]
  48. Li, X.F.; Yao, X.J.; Sun, M.P.; Gong, P.; An, L.N.; Qi, M.M.; Gao, Y.P. Spatial–temporal variations in lakes in Northwest China from 2000 to 2014. Acta Ecol. Sin. 2018, 38, 96–104. [Google Scholar] [CrossRef]
  49. Sun, M.P.; Liu, S.Y.; Yao, X.J.; Guo, W.Q.; Xu, J.L. Glacier changes in the Qilian Mountains in the past half century: Based on the revised First and Second Chinese Glacier Inventory. Acta Geo. Sin. 2015, 70, 1402–1414. [Google Scholar] [CrossRef]
  50. Gärtner-Roer, I.; Naegeli, K.; Huss, M.; Knecht, T.; Machguth, H.; Zemp, M. A database of worldwide glacier thickness observations. Global Planet. Change 2014, 122, 330–344. [Google Scholar] [CrossRef]
  51. Heid, T.; Kääb, A. Repeat optical satellite images reveal widespread and long term decrease in land–terminating glacier speeds. Cryosphere 2012, 6, 467–478. [Google Scholar] [CrossRef]
  52. Melkonian, A.K.; Willis, M.J.; Pritchard, M.E. Satellite–derived volume loss rates and glacier speeds for the Juneau Icefield, Alaska. J. Glaciol. 2017, 60, 743–760. [Google Scholar] [CrossRef]
  53. Li, H.L.; Ng, F.; Li, Z.Q.; Qin, D.H.; Cheng, G.D. An extended “perfect–plasticity” method for estimating ice thickness along the flow line of mountain glaciers. J. Geophys. Res. Earth Sur. 2012, 117, 1020–1030. [Google Scholar] [CrossRef]
  54. Linsbauer, A.; Paul, F.; Haeberli, W. Modeling glacier thickness distribution and bed topography over entire mountain ranges with GlabTop: Application of a fast and robust approach. J. Geophys. Res. Earth Sur. 2012, 117, 3007–3024. [Google Scholar] [CrossRef]
  55. Oerlemans, J. A flowline model for Nigardsbreen, Norway: Projection of future glacier length based on dynamic calibration with the historic record. Ann. Glaciol. 1997, 24, 382–389. [Google Scholar] [CrossRef]
  56. Sugiyama, S.; Bauder, A.; Zahno, C.; Funk, M. Evolution of Rhonegletscher, Switzerland, over the past 125 years and in the future: Application of an improved flowline model. Ann. Glaciol. 2007, 46, 268–274. [Google Scholar] [CrossRef]
  57. Shi, Y.F. Glaciers and Related Environments in China; Science Press: Beijing, China, 2000; p. 12. [Google Scholar]
  58. Gao, X.Q.; Tang, M.C.; Feng, S. Discussion on the relationship between glacial fluctuation and climate change. Pla. Meteorol. 2000, 19, 9–16. [Google Scholar]
  59. Duan, J.P.; Wang, L.L.; Ren, J.W.; Li, L. Progress in glacier variations in China and its sensitivity to climate change during the past century. Pro. Geo. 2009, 28, 231–237. [Google Scholar] [CrossRef]
  60. Ren, J.W.; Qin, D.H.; Kang, S.C.; Hou, S.G.; Pu, J.C.; Jing, Z.F. Glacier variation and climate warming and drying in the middle Himalayas. Chi. Sci. Bull. 2003, 48, 2478–2482. [Google Scholar] [CrossRef]
  61. Raper, S.C.B.; Brown, O.; Braithwaite, R.J. Ageometric glacier model for sea level change calculations. J. Glaciol. 2000, 46, 357–368. [Google Scholar] [CrossRef]
  62. Oerlemans, J. Linear modelling of glacier length fluctuations. Geogr. Ann. A 2012, 94, 183–194. [Google Scholar] [CrossRef]
  63. Beedle, M.J.; Menounos, B.; Wheate, R. Glacier change in the Cariboo Mountains, British Columbia, Canada (1952–2005). Cryosphere 2015, 9, 65–80. [Google Scholar] [CrossRef]
  64. Chen, Y.N.; Li, W.H.; Xu, C.C.; Hao, X.M. Effects of climate change on water resources in Tarim River Basin, Northwest China. J. Environ. Sci. 2007, 4, 488–493. [Google Scholar] [CrossRef]
  65. Frappé, T.P.; Clarke, G.K.C. Slow surge of Trapridge Glacier, Yukon Territory, Canada. J. Geophys. Res. Earth 2007, 112, 1–17. [Google Scholar] [CrossRef]
  66. Jamieson, S.S.; Ewertowski, M.W.; Evans, D.J. Rapid advance of two mountain glaciers in response to mine–related debris loading. J. Geophys. Res. Earth 2015, 120, 1418–1435. [Google Scholar] [CrossRef]
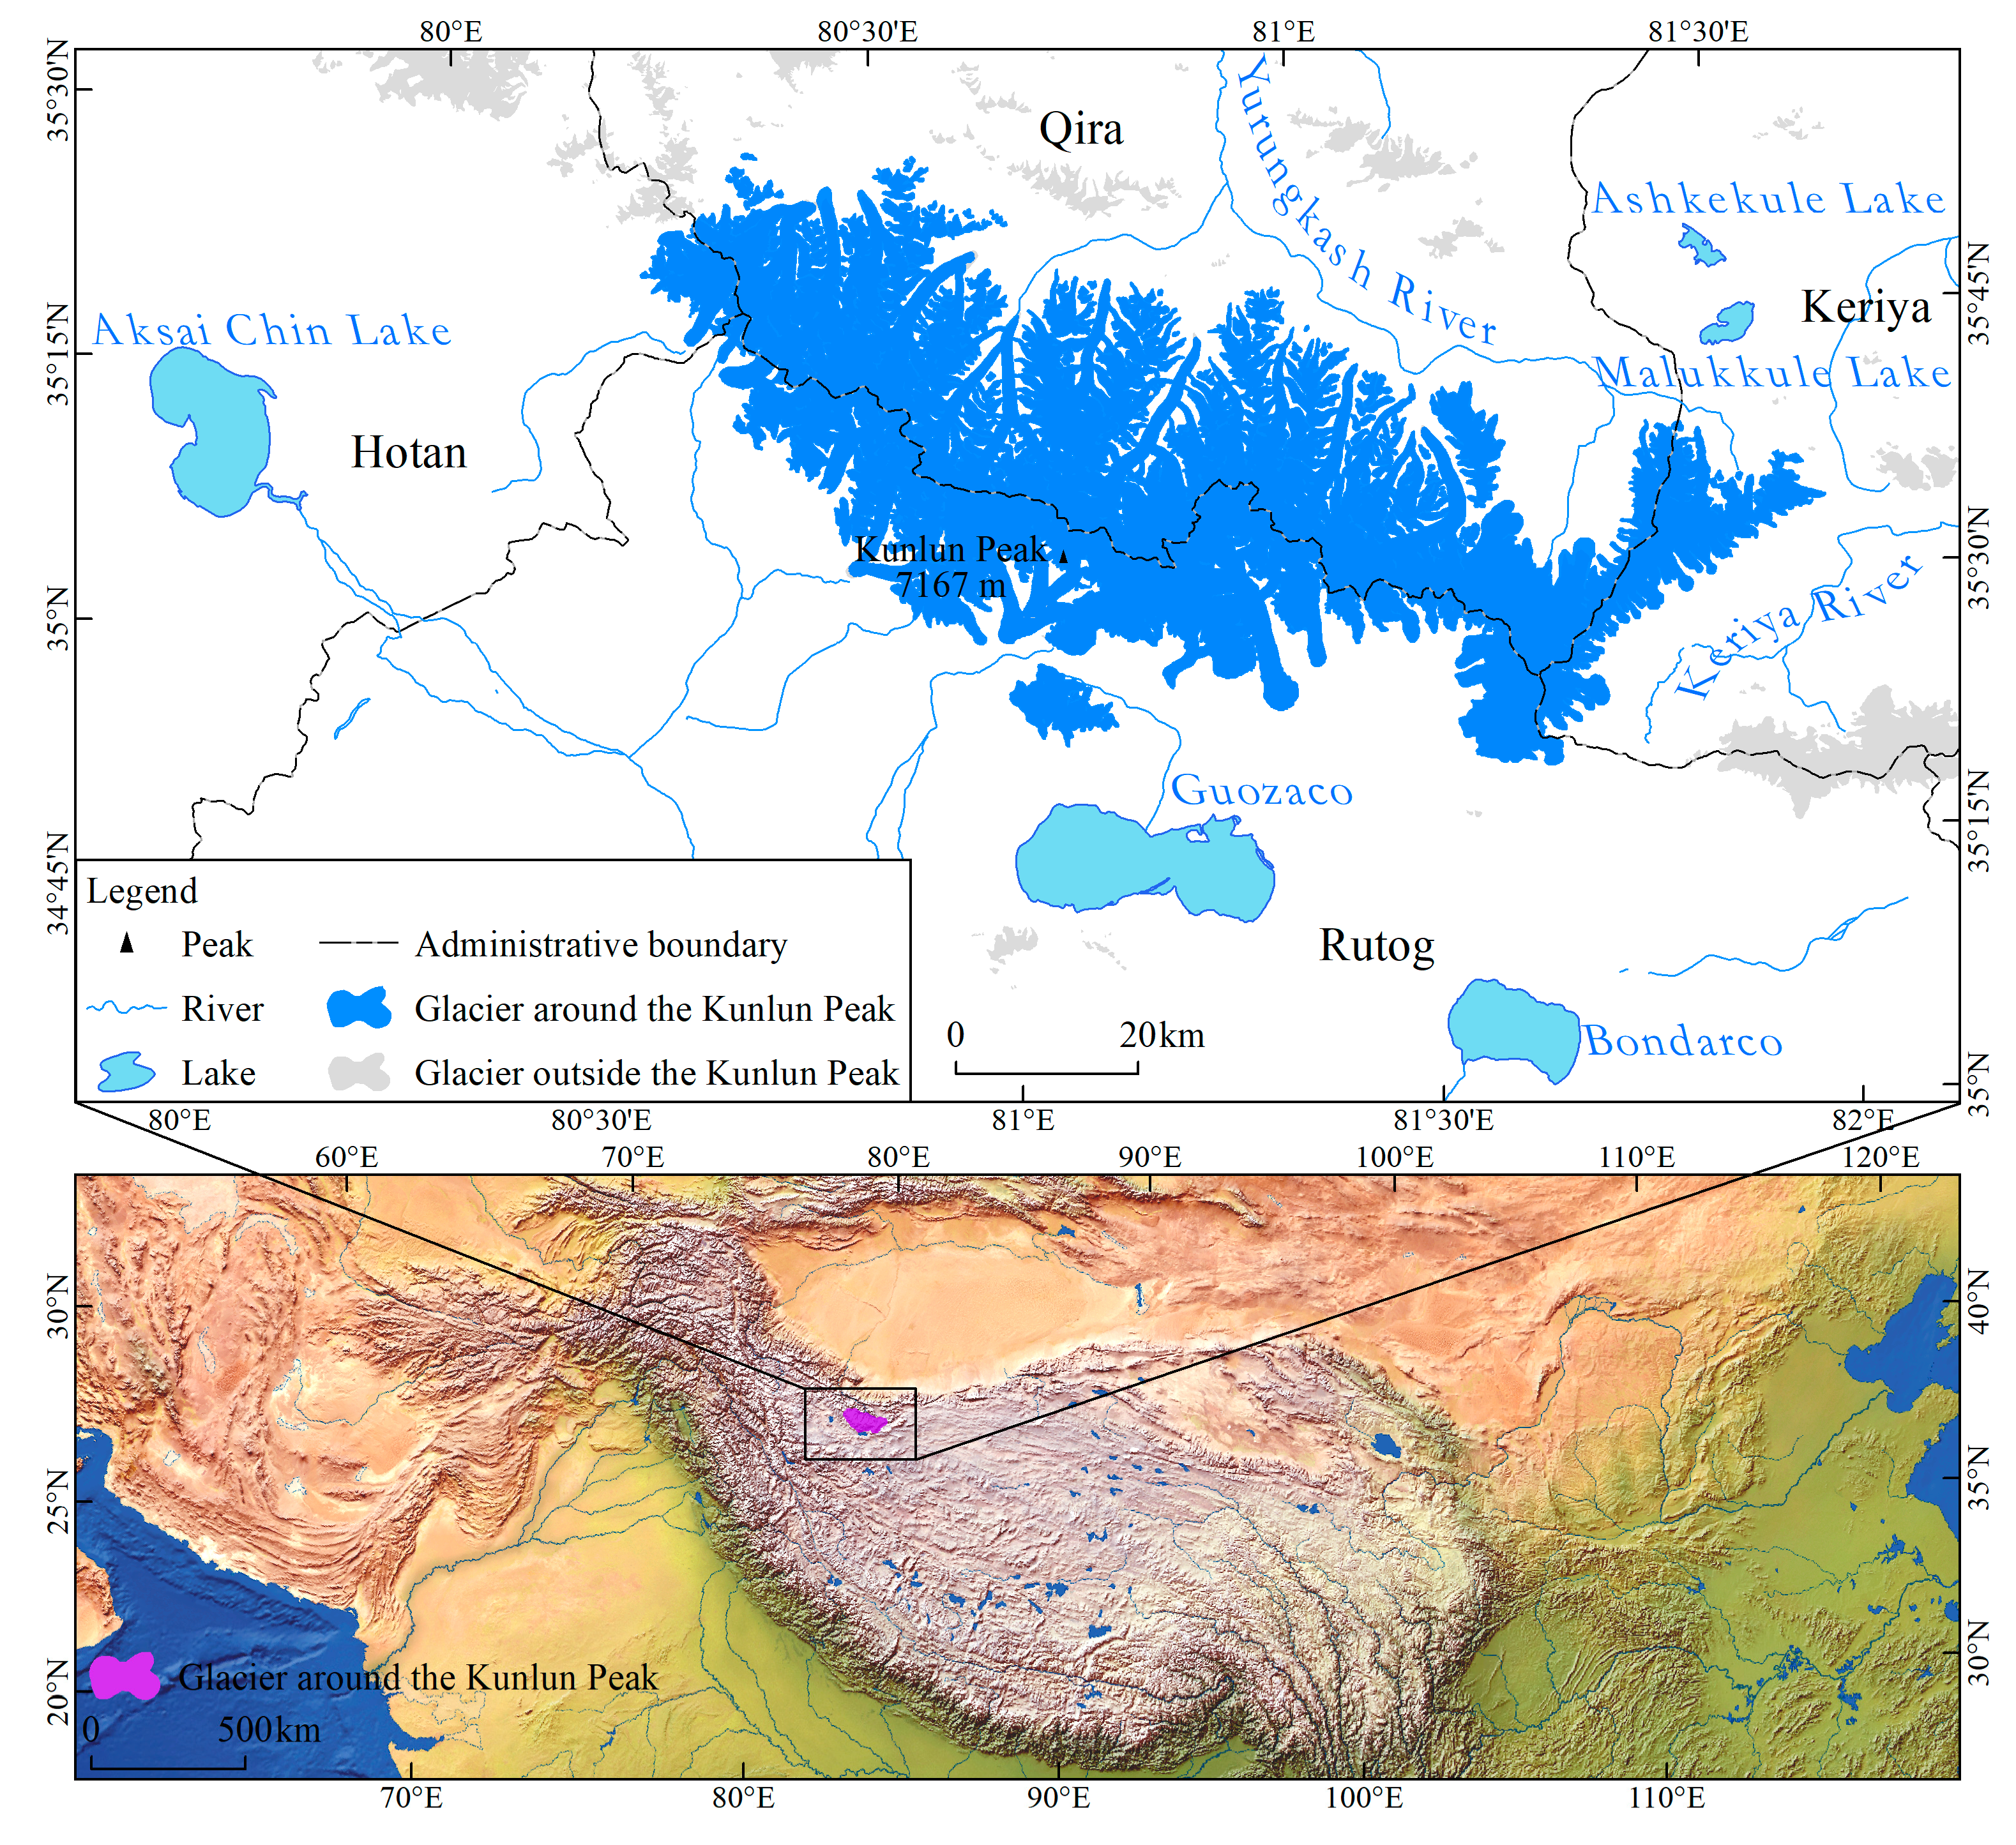
Figure 1. Overview of the research area [20].
Remotesensing 15 04236 g001
Figure 2. Landsat image series for glacier interpretation.
Remotesensing 15 04236 g002
Figure 3. The process of glacier (a) delineation and (b) length extraction.
Remotesensing 15 04236 g003
Figure 4. The process of glacier area change error extraction. (a) Glacier data and raw images. (b) Erase data b with data a. (c) Erase data a with data b. (d) Erased data. (e) The region of the glacier terminus change based on the erased data. (f) The range of the buffer zone based on the region of the glacier terminus change, namely the glacier area change error.
Remotesensing 15 04236 g004
Figure 5. Glacier area change and its uncertainty in the WKMPA.
Remotesensing 15 04236 g005
Figure 6. The change of glacier number and area in different sizes in the WKMPA.
Remotesensing 15 04236 g006
Figure 7. Altitudinal characteristics of glacier area changes in the WKMPA.
Remotesensing 15 04236 g007
Figure 8. Orientational characteristics of glacier number and area changes in the WKMPA.
Remotesensing 15 04236 g008
Figure 9. State of glacier area changes in the WKMPA.
Remotesensing 15 04236 g009
Figure 10. Glacier length class and the relationship between glacier length and its relative change rate in the WKMPA. (a) Glacier number and length relative change rate of all length classes. (b) Glacier length and its relative change rate.
Remotesensing 15 04236 g010
Figure 11. Relationship between glacier area change and length change in the WKMPA.
Remotesensing 15 04236 g011
Figure 12. Relative change rate of glacier length in the WKMPA.
Remotesensing 15 04236 g012
Figure 13. The relationship between glacier length and (a) glacier area, (b) glacier perimeter.
Remotesensing 15 04236 g013
Figure 14. The change curves of meteorological elements, anomaly distribution, 5-year trend of temperature during glacial melt, and annual precipitation in the WKMPA.
Remotesensing 15 04236 g014
Figure 15. The periodic pattern of (a) temperature and (b) precipitation in the WKMPA.
Remotesensing 15 04236 g015
Figure 16. The area change of glaciers whose area is more than 100 km2 in the WKMPA.
Remotesensing 15 04236 g016
Figure 17. The terminus changes of glaciers in the WKMPA whose area is more than 100 km2.
Remotesensing 15 04236 g017
Figure 18. The change in the West Kunlun Glacier terminus.
Remotesensing 15 04236 g018
Figure 19. The changes in area, length, and elevation of the West Kunlun Glacier and its branches.
Remotesensing 15 04236 g019
Table 1. The number, total area, and average length of glaciers in the WKMPA in different years.
YearNumberArea (km2)Length (m)
20004372989.42 ± 109.872982 ± 60
20054392975.52 ± 110.102947 ± 60
20104402973.86 ± 109.342935 ± 60
20154402974.61 ± 54.812935 ± 60
20204402964.59 ± 54.872916 ± 60
Table 2. Changes in glacier area and temperature during glacial melt and annual precipitation in the WKMPA.
YearArea (km2)Change Rate (km2·a−1)YearTemperature (°C)Change Rate
Temperature (°C·a−1)Precipitation (mm·a−1)
20002989.42 ± 109.87 1988−4.00
20052975.52 ± 110.10−2.781993−3.570.07−0.05
20102973.86 ± 109.34−0.331998−3.430.056.67
20152974.61 ± 54.810.152003−4.31−0.19−2.18
20202964.59 ± 54.87−2.002008−4.180.012.93
2013−4.110.06−1.12
Disclaimer/Publisher’s Note: The statements, opinions and data contained in all publications are solely those of the individual author(s) and contributor(s) and not of MDPI and/or the editor(s). MDPI and/or the editor(s) disclaim responsibility for any injury to people or property resulting from any ideas, methods, instructions or products referred to in the content.