

Study of the Application of FY-3D/MERSI-II Far-Infrared Data in Wildfire Monitoring

Abstract
:1. Introduction
2. Data and Methods
2.1. Data
2.2. The Principle of Fire Spot Detection by 10.8 µm (250 m)
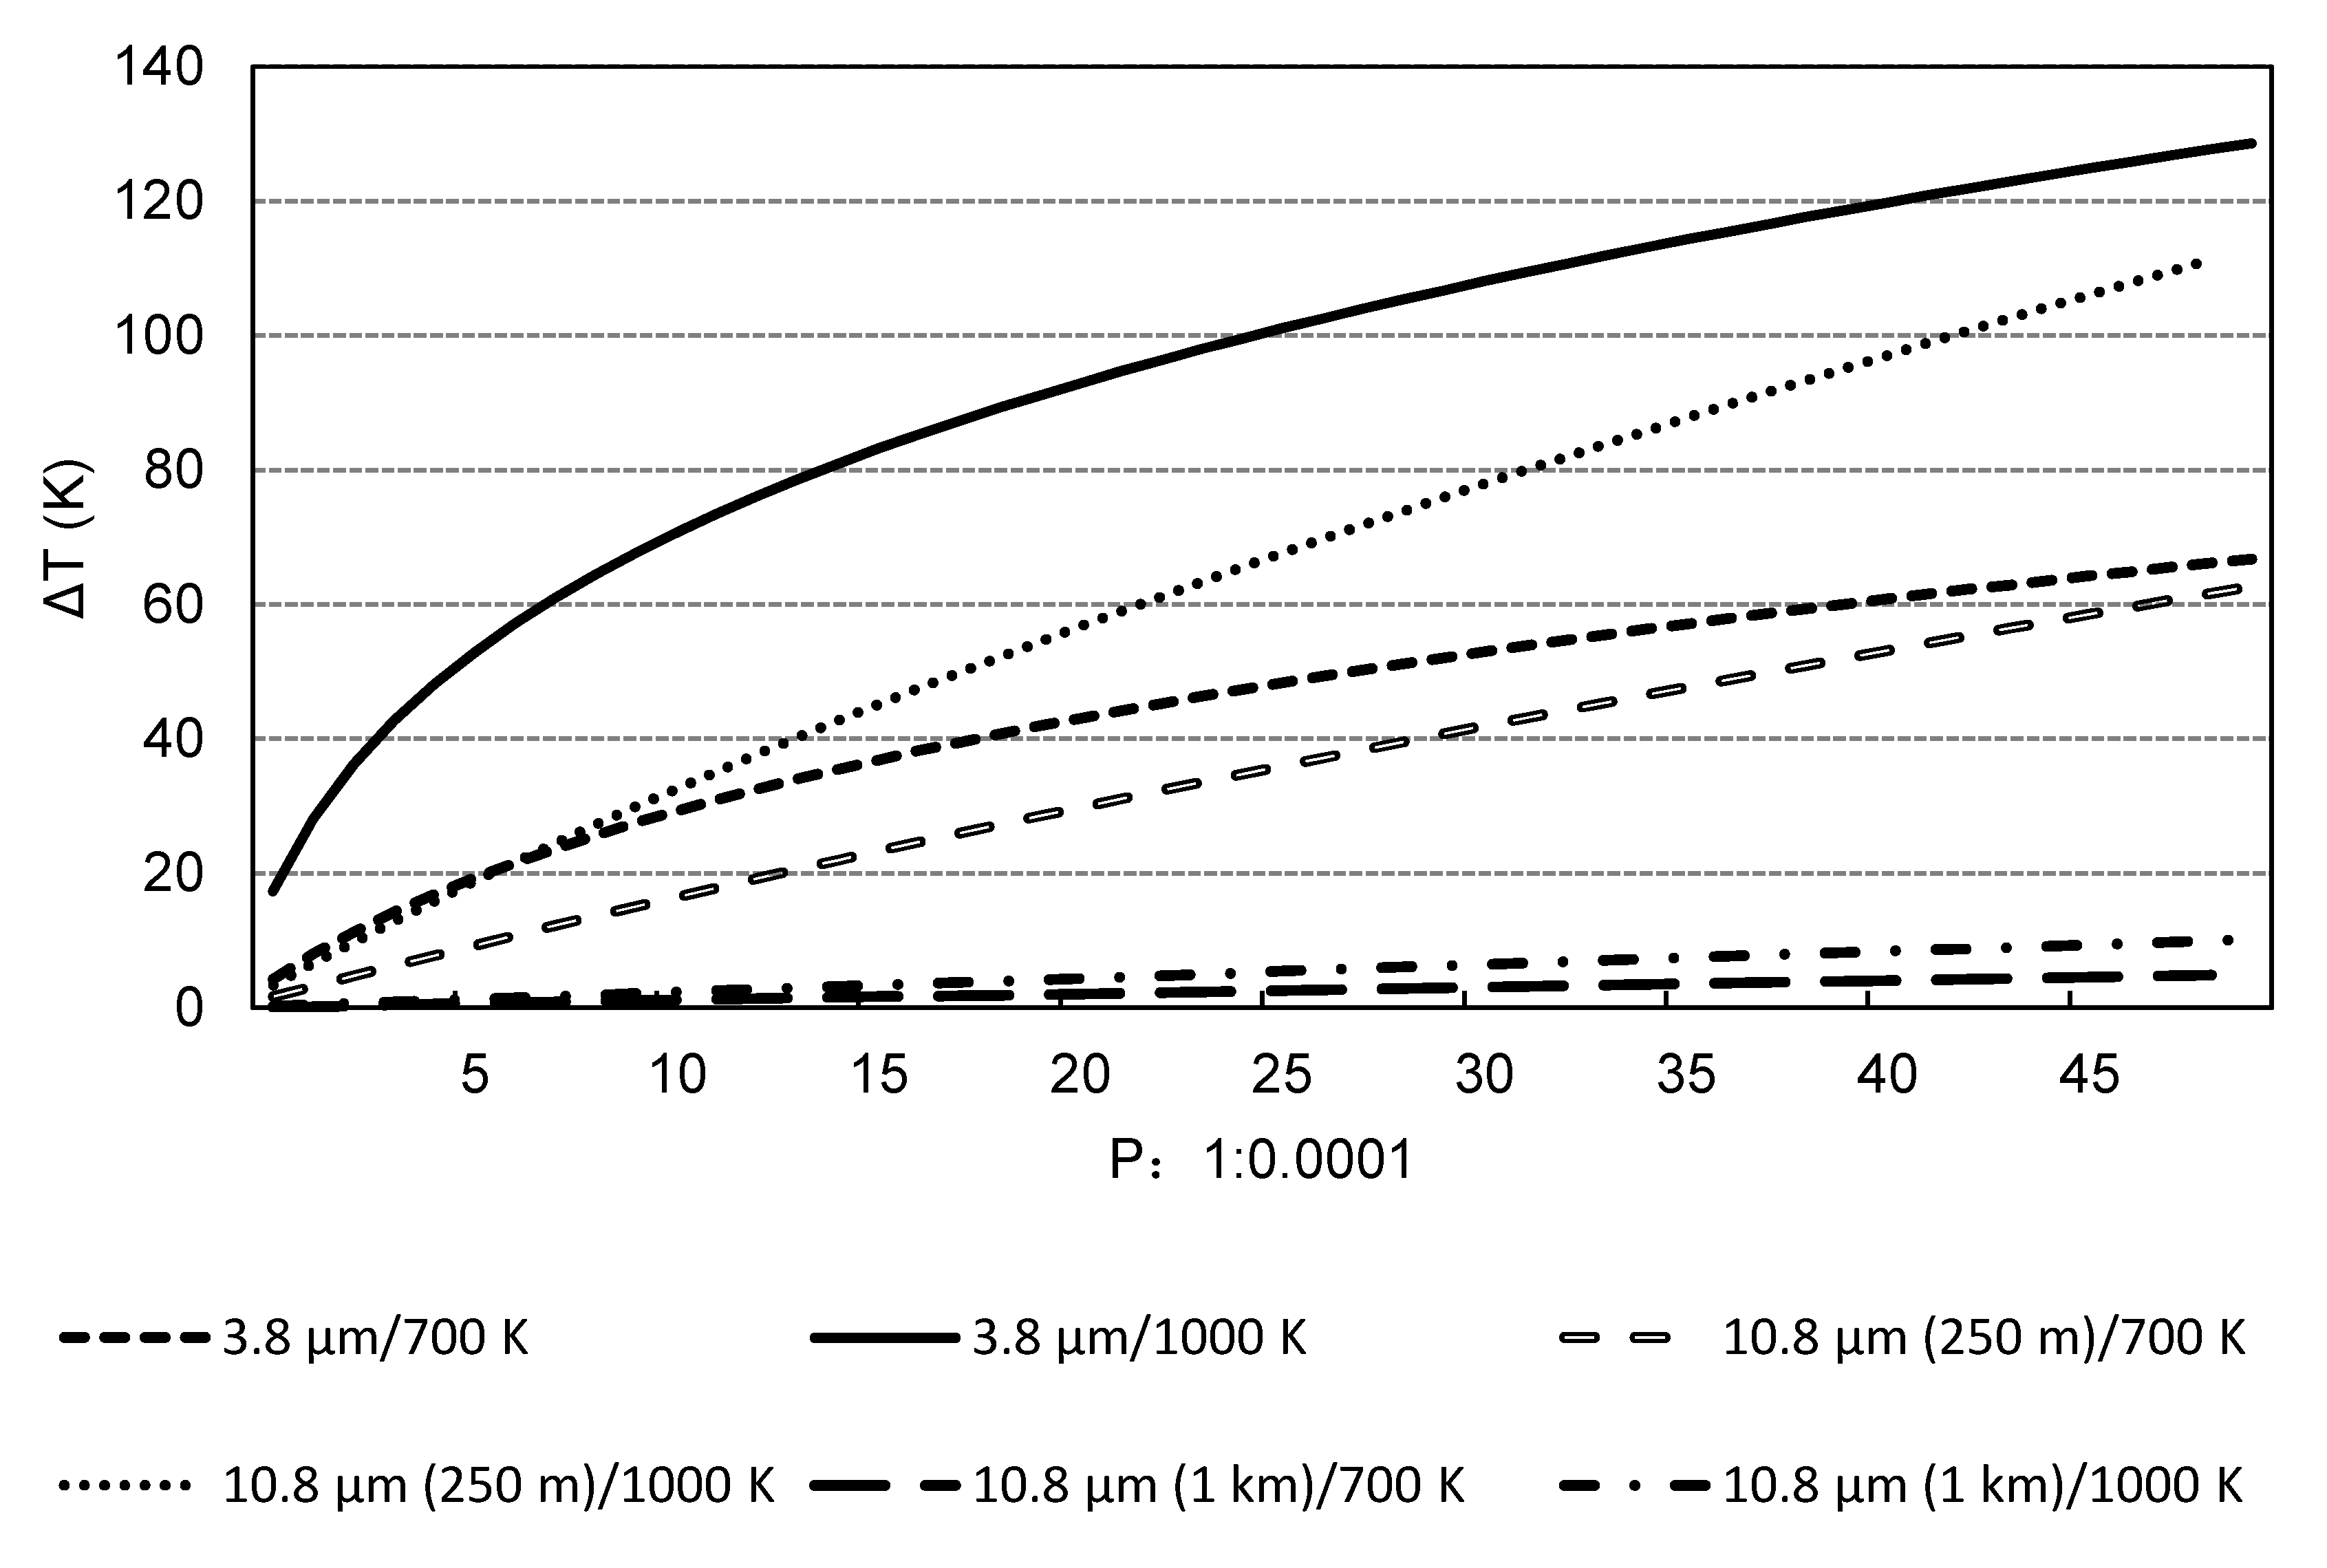
2.2.1. Analysis of the Sensitivity of 10.8 μm (250 m) to Fire Spots
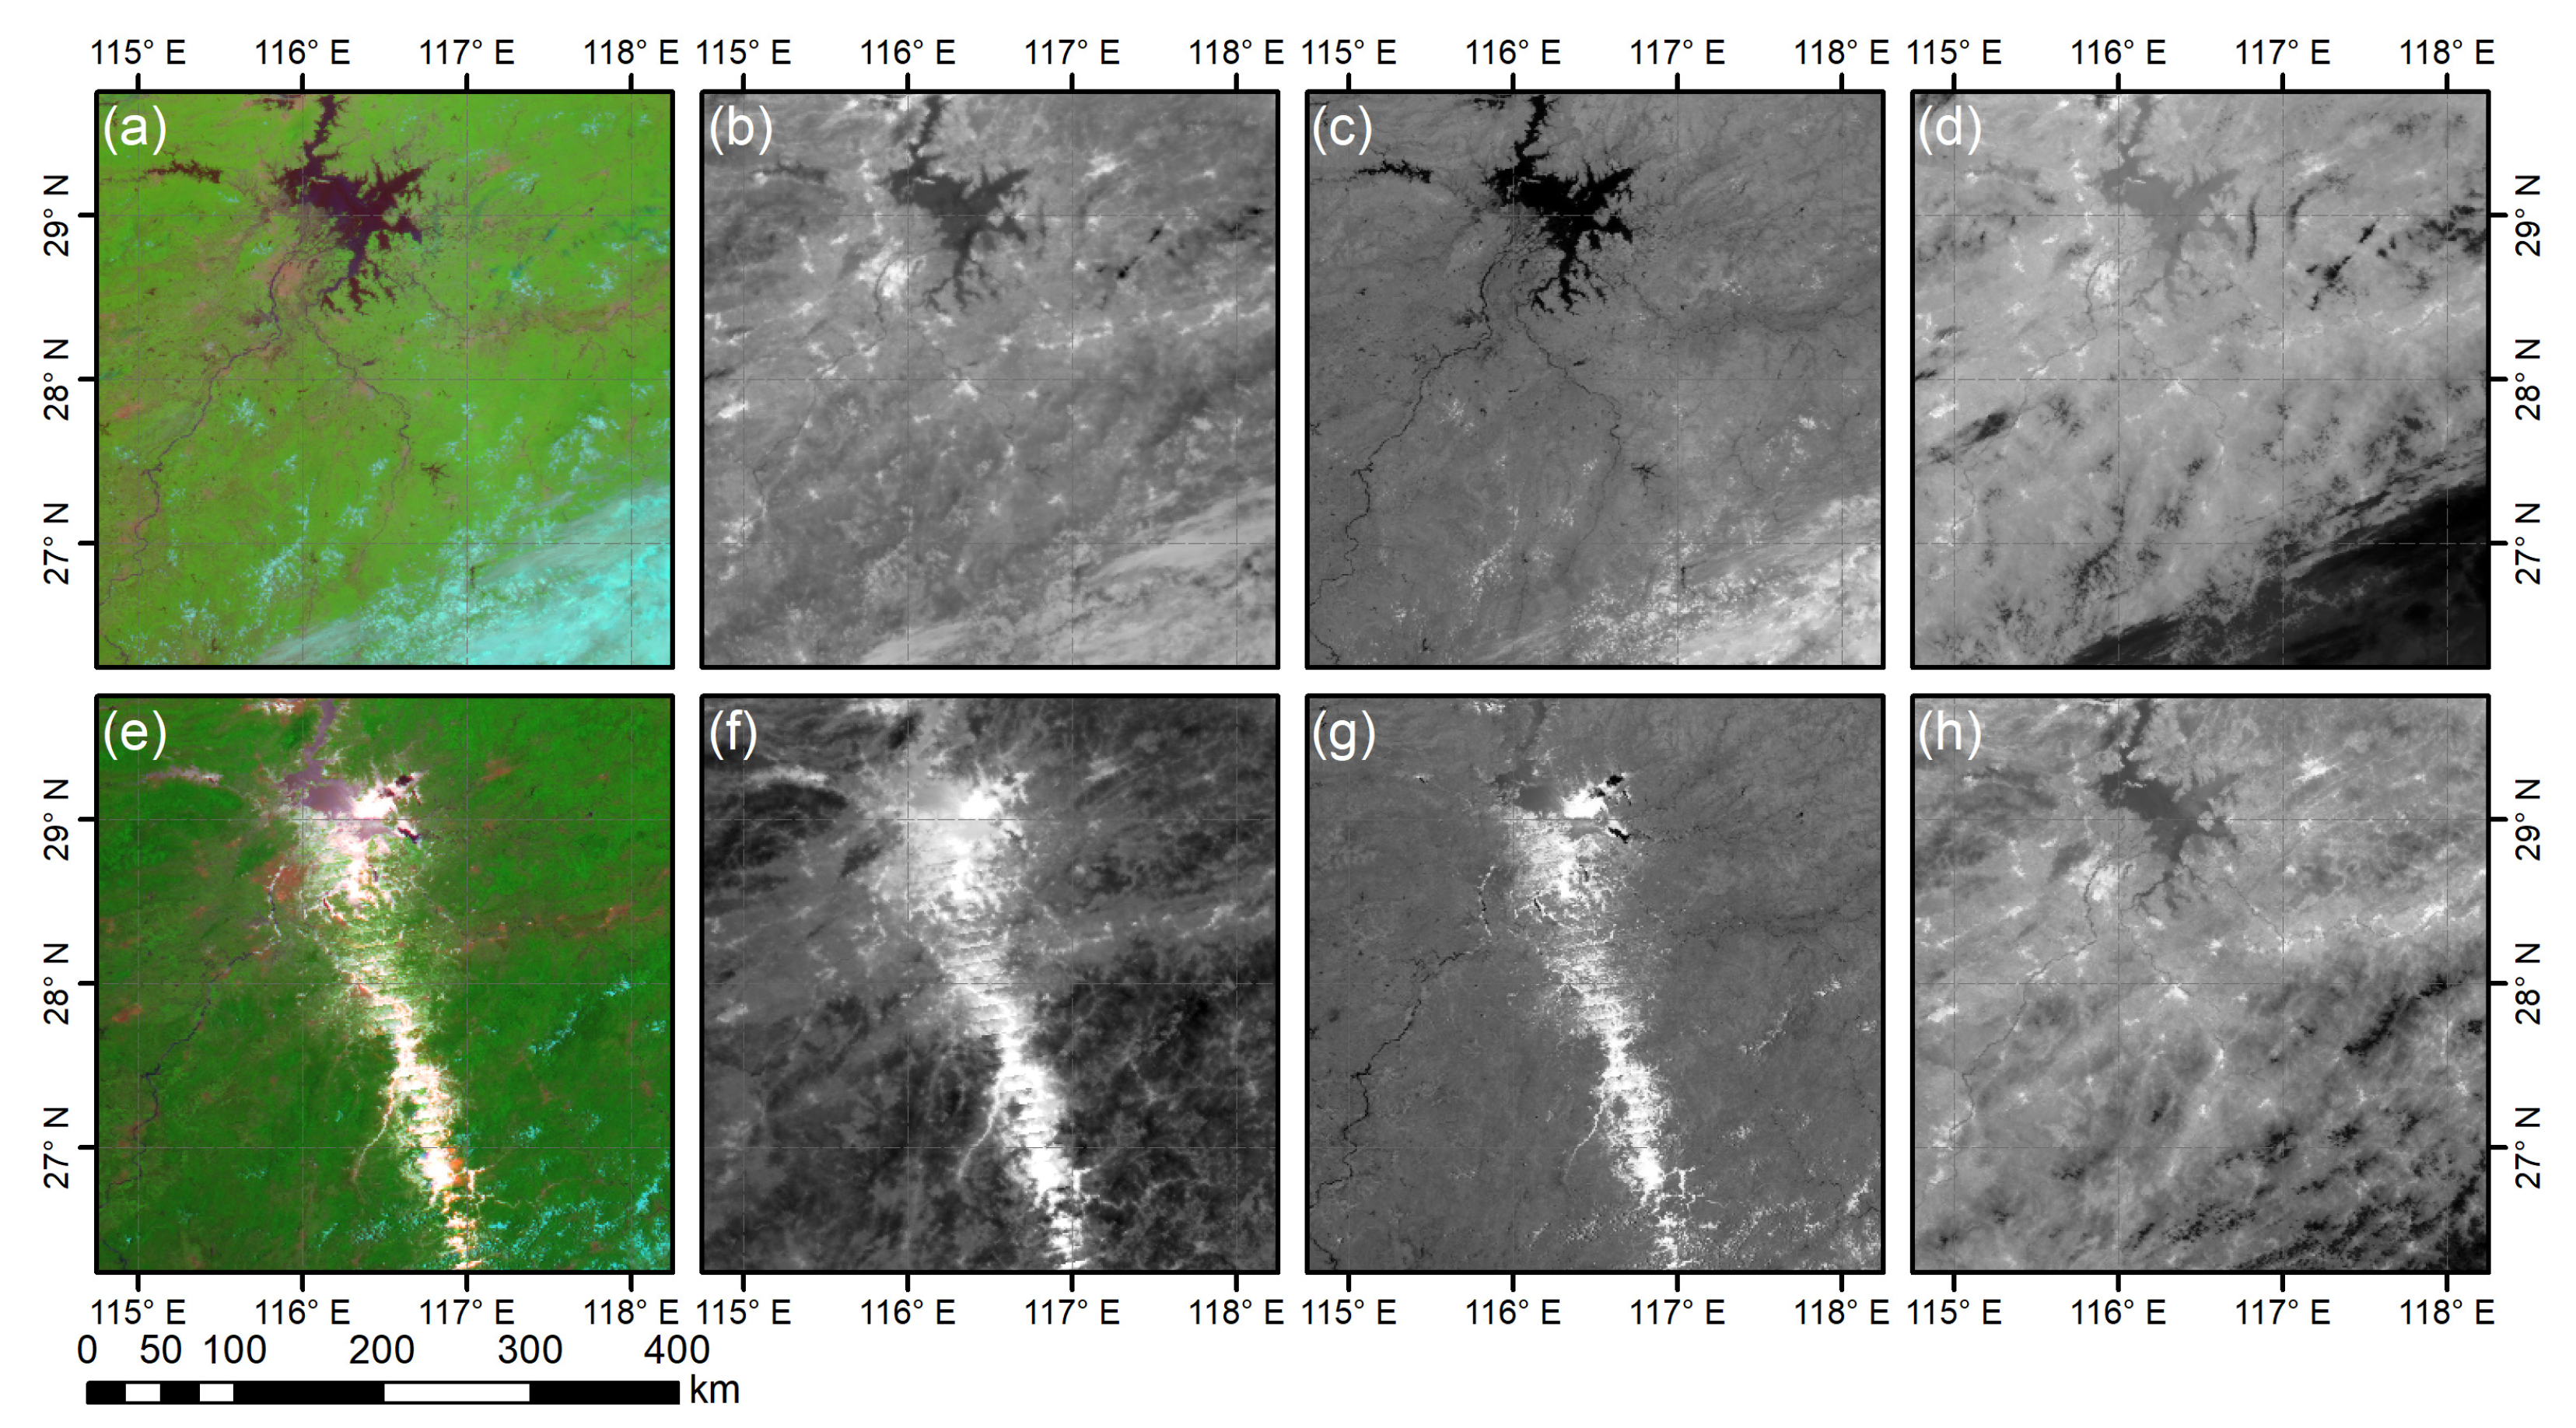
2.2.2. The Response of 10.8 µm (250 m) to Fire Spots in a Real Case
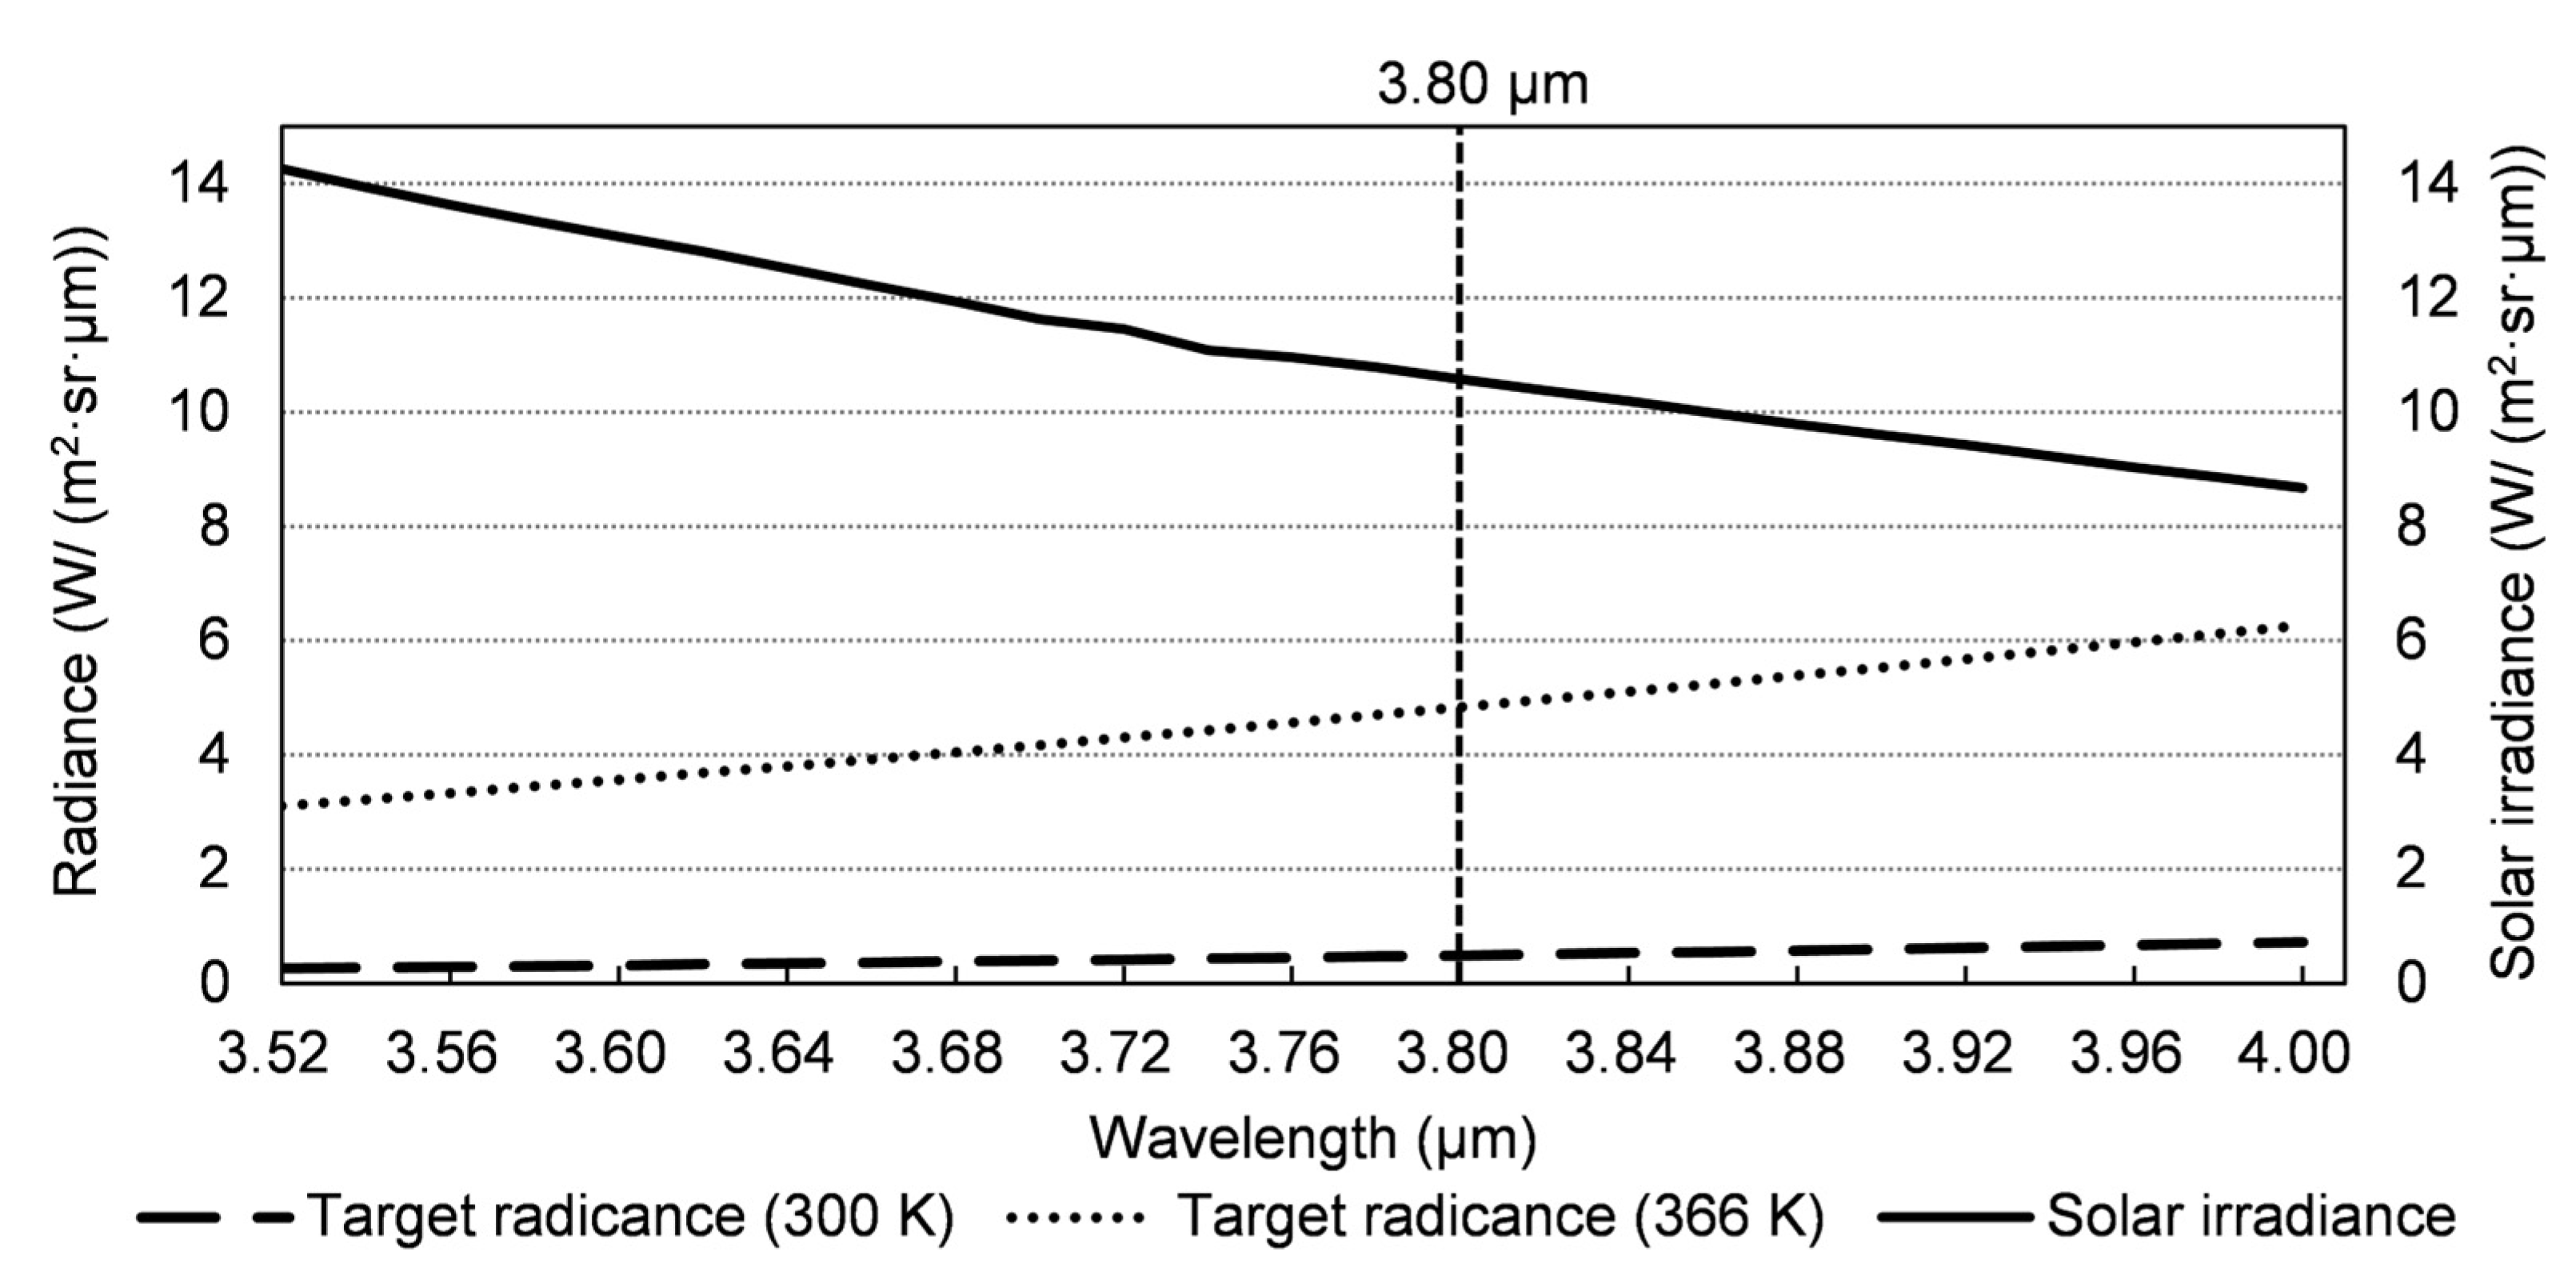
2.2.3. The Influence of Solar Radiation on Mid- and Far-Infrared Channels
Difference of Radiance Ratio between Mid- and Far-Infrared Channels by Solar Irradiance
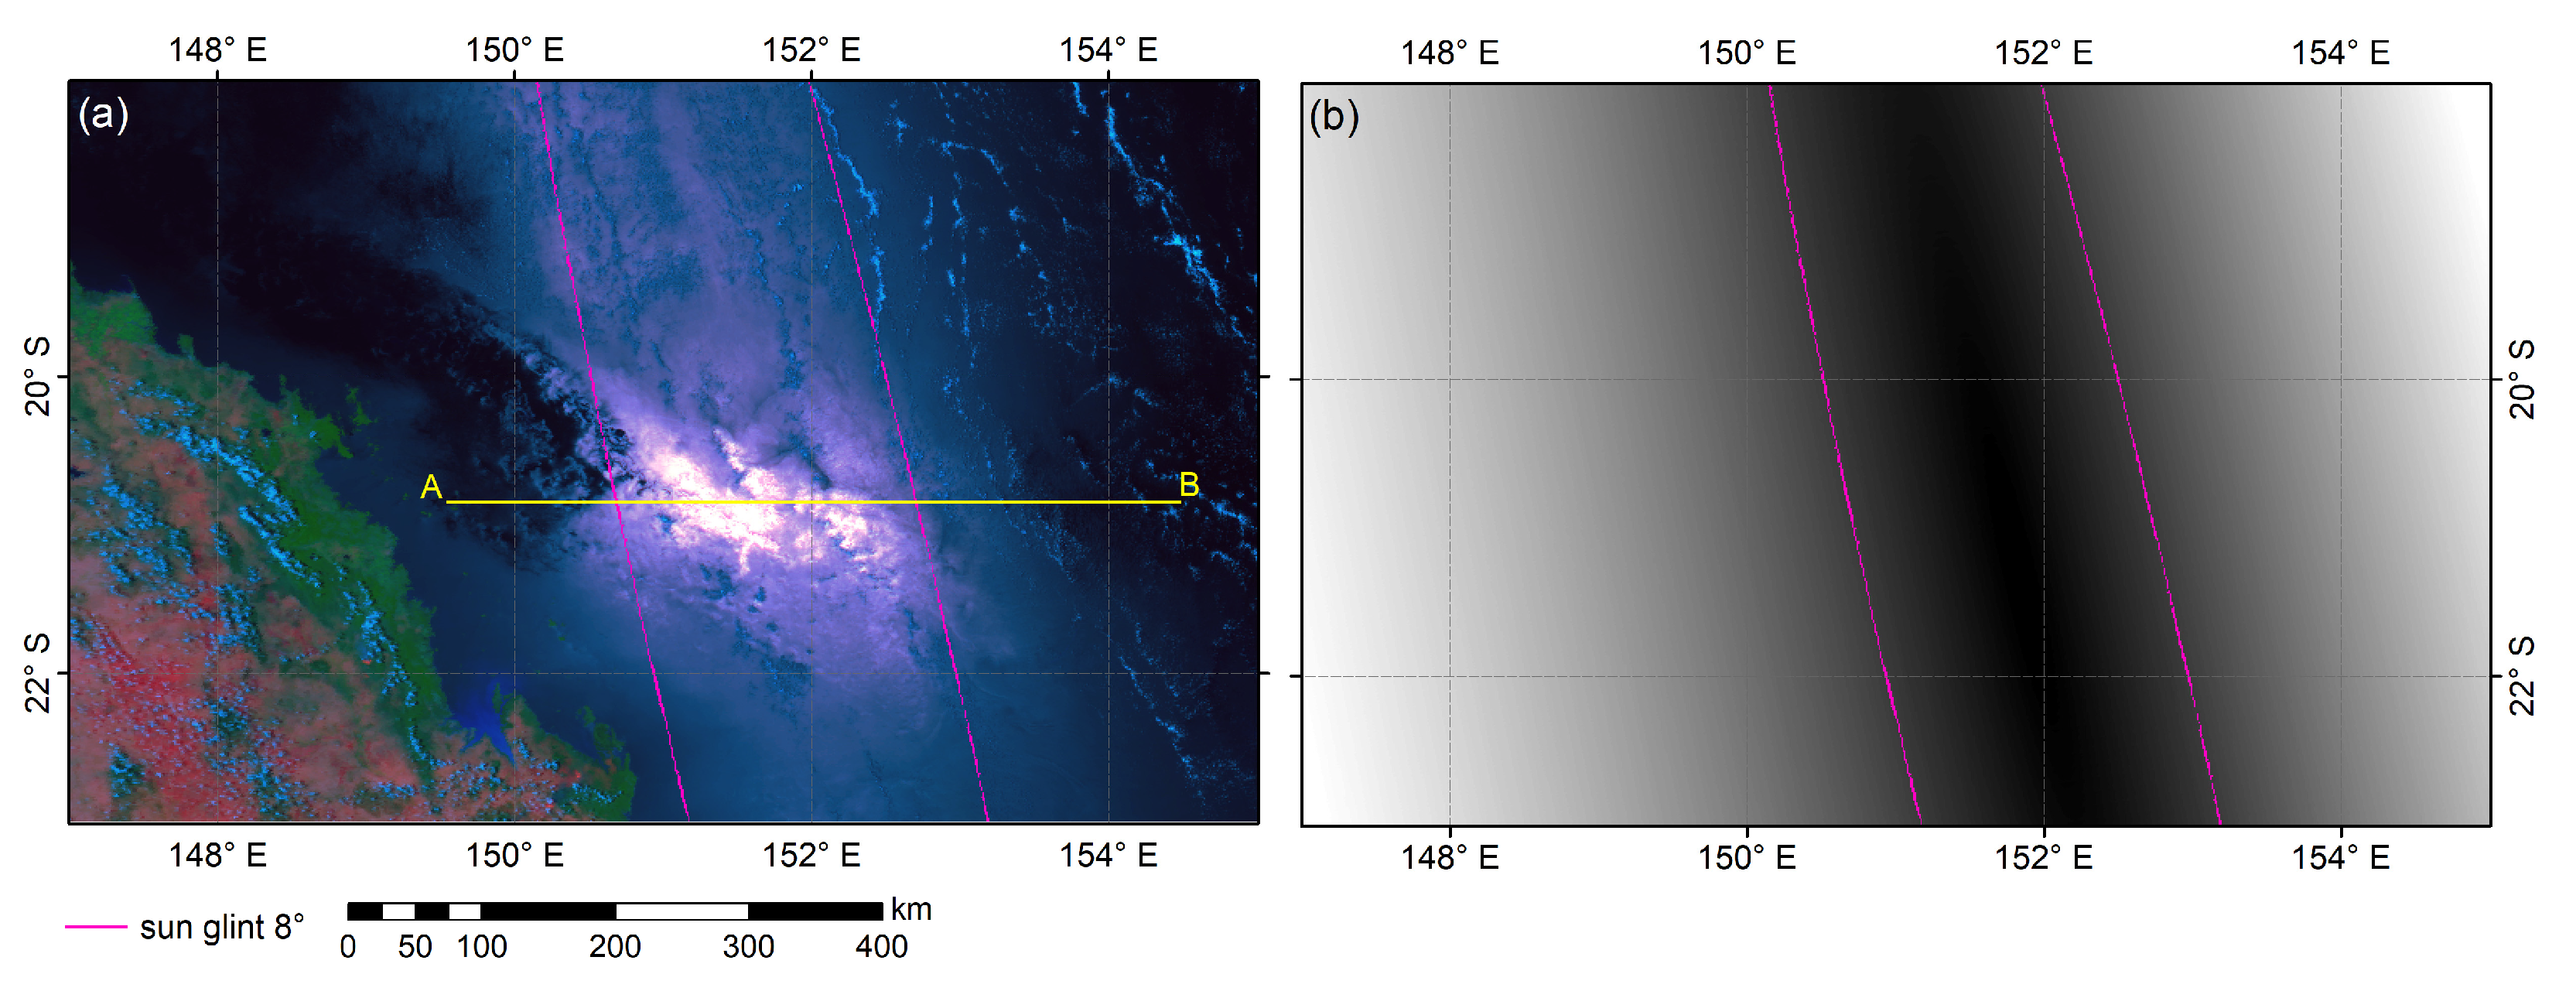
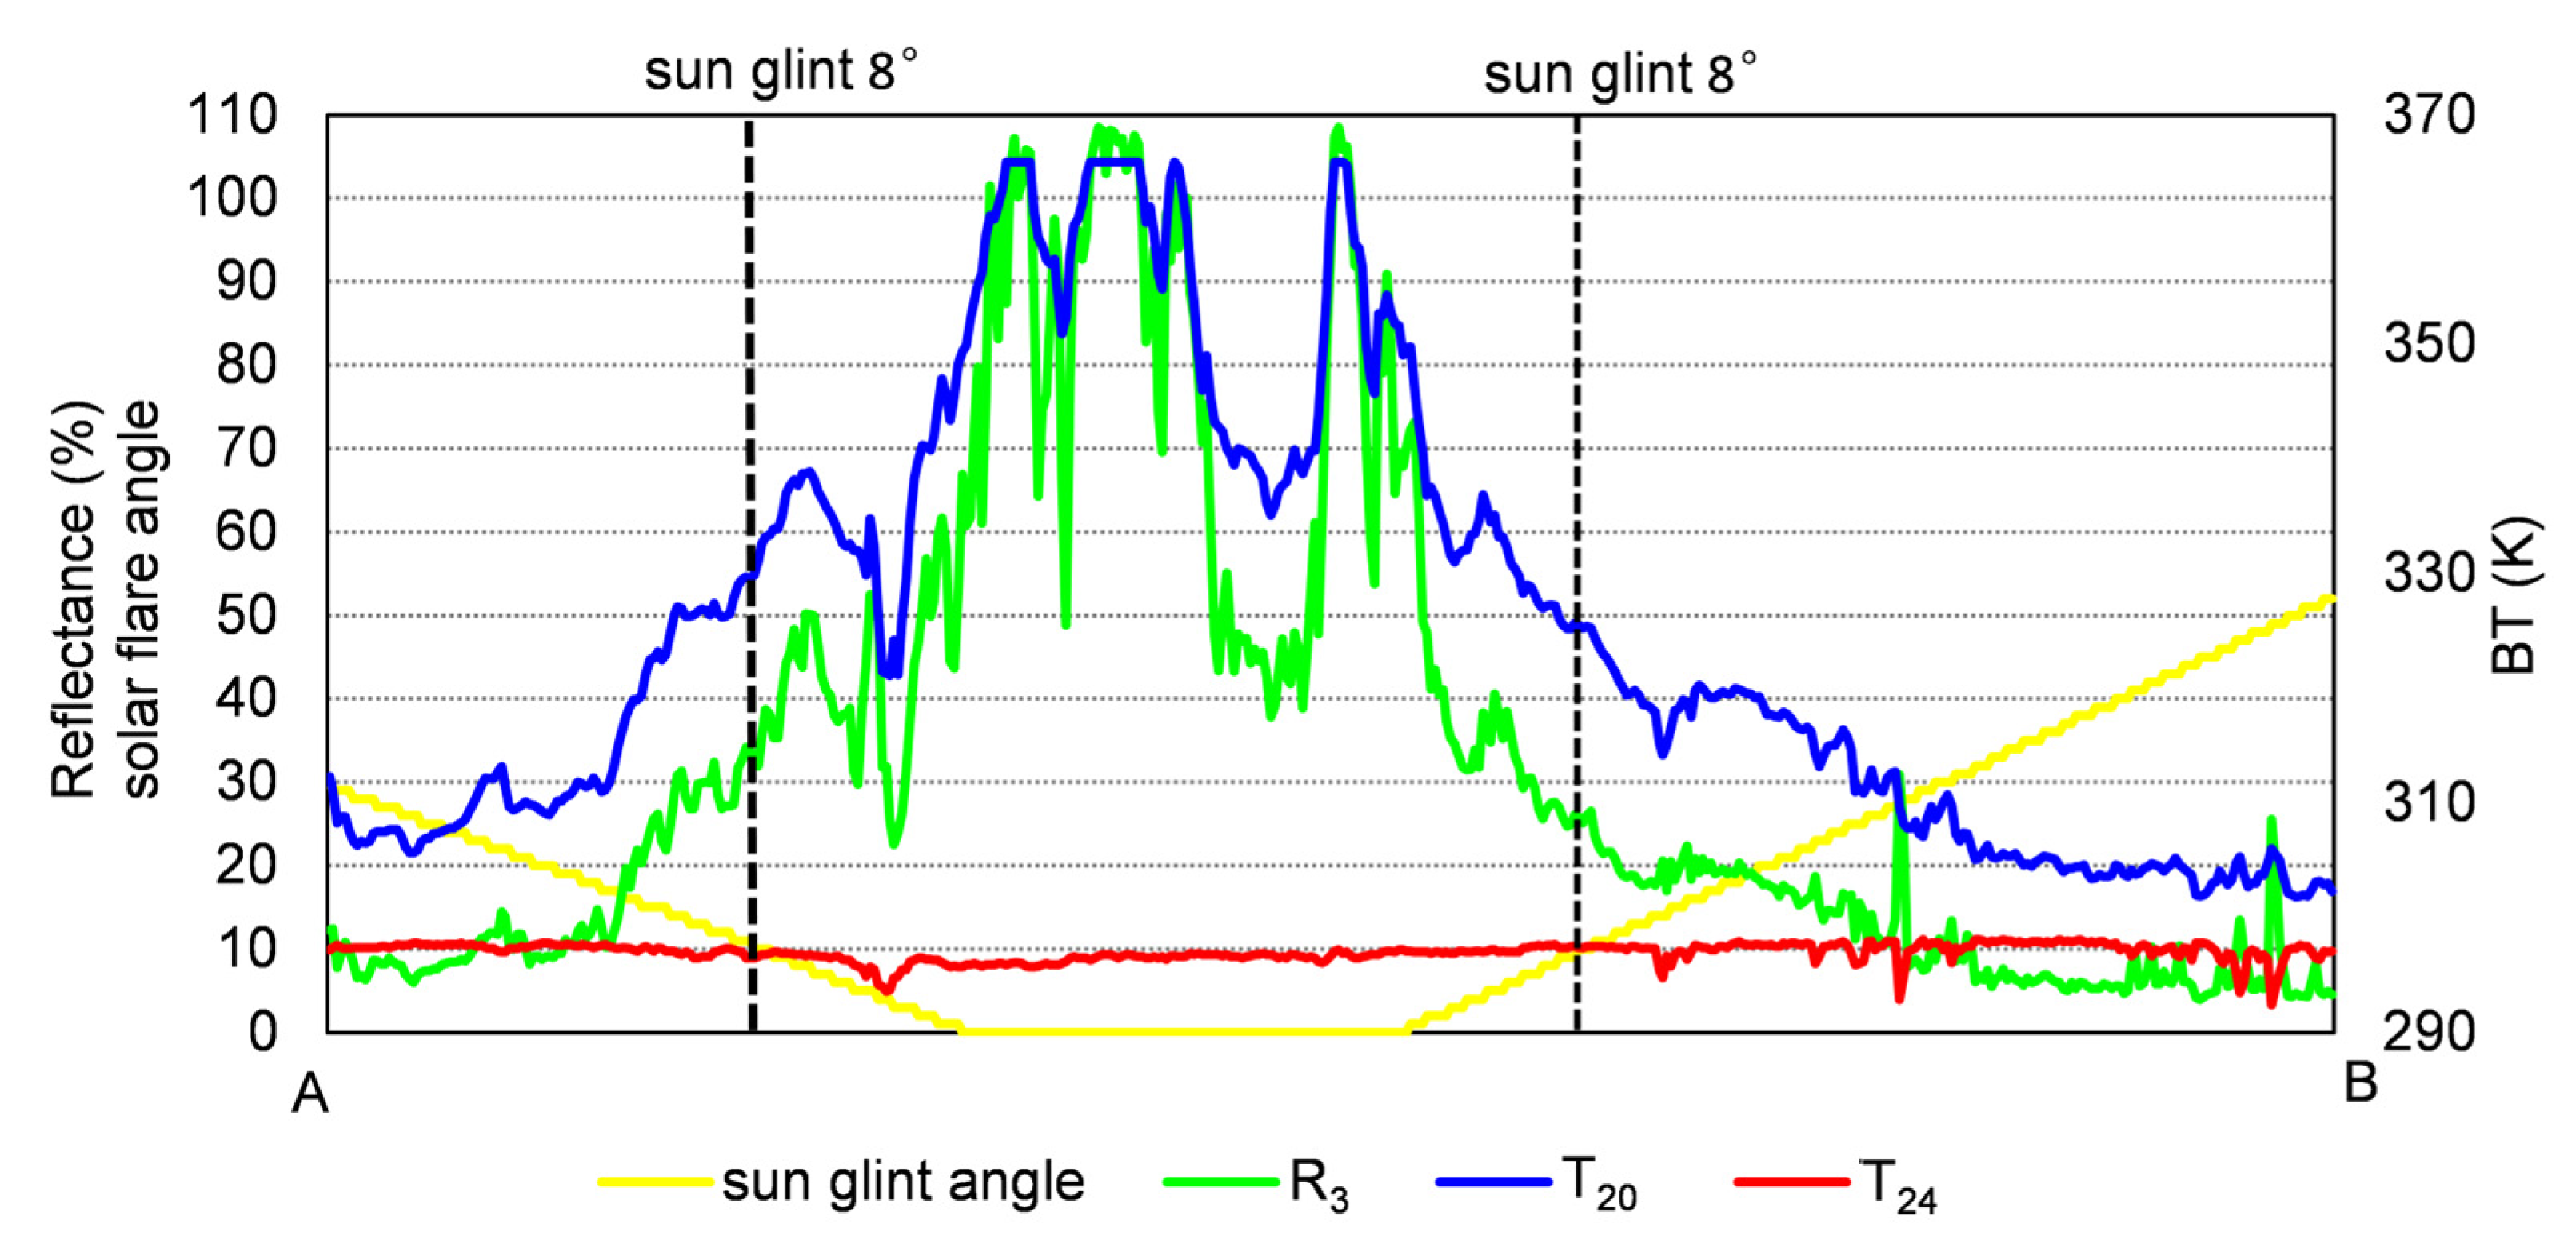
The Effect of Sun Glint on Mid- and Far-Infrared Channels
The Influence of the Specular Reflection of Solar Radiation on the Sensitivity of Fire Spot Identification by Mid-Infrared Channels
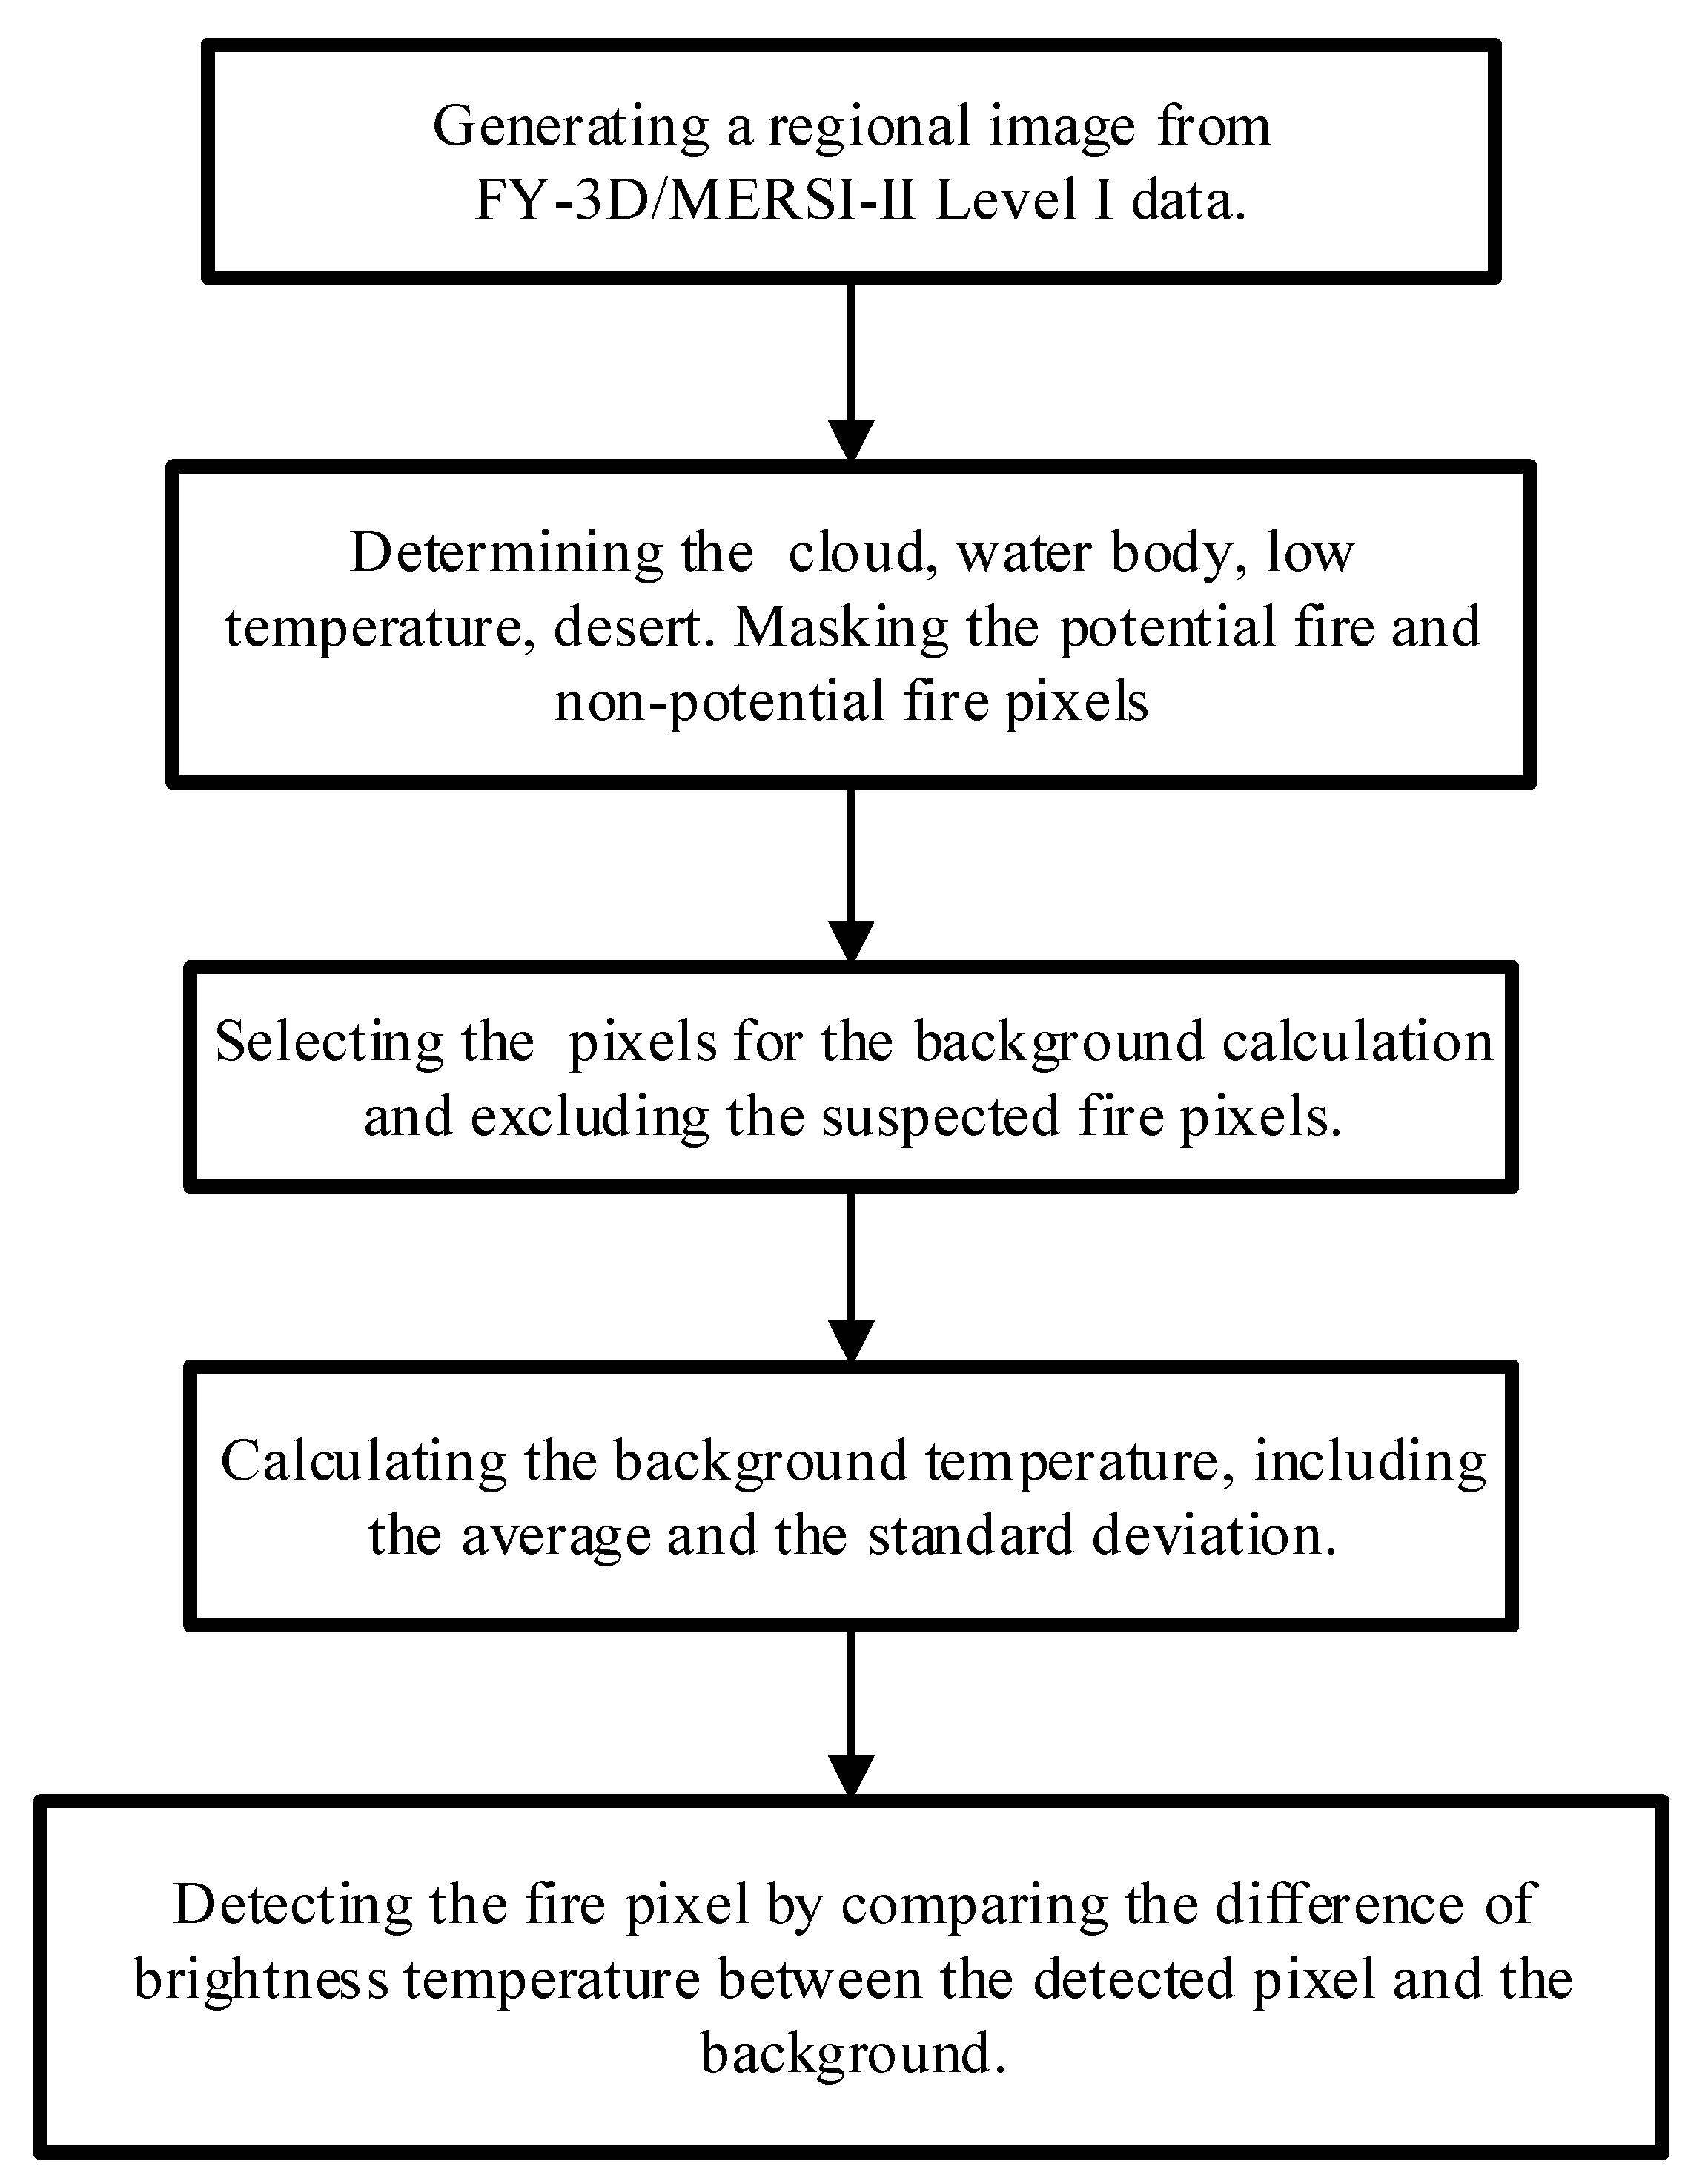
2.3. Method
2.3.1. Masking the Potential and Non-Potential Fire Pixels
Cloud Determination
Water Body Determination
Low Temperature Determination
Desert Determination
2.3.2. Selecting the Background Pixels
2.3.3. Calculating the Background Temperature
2.3.4. Fire Pixel Detection
2.3.5. Flow Chart of the Processing
3. Results
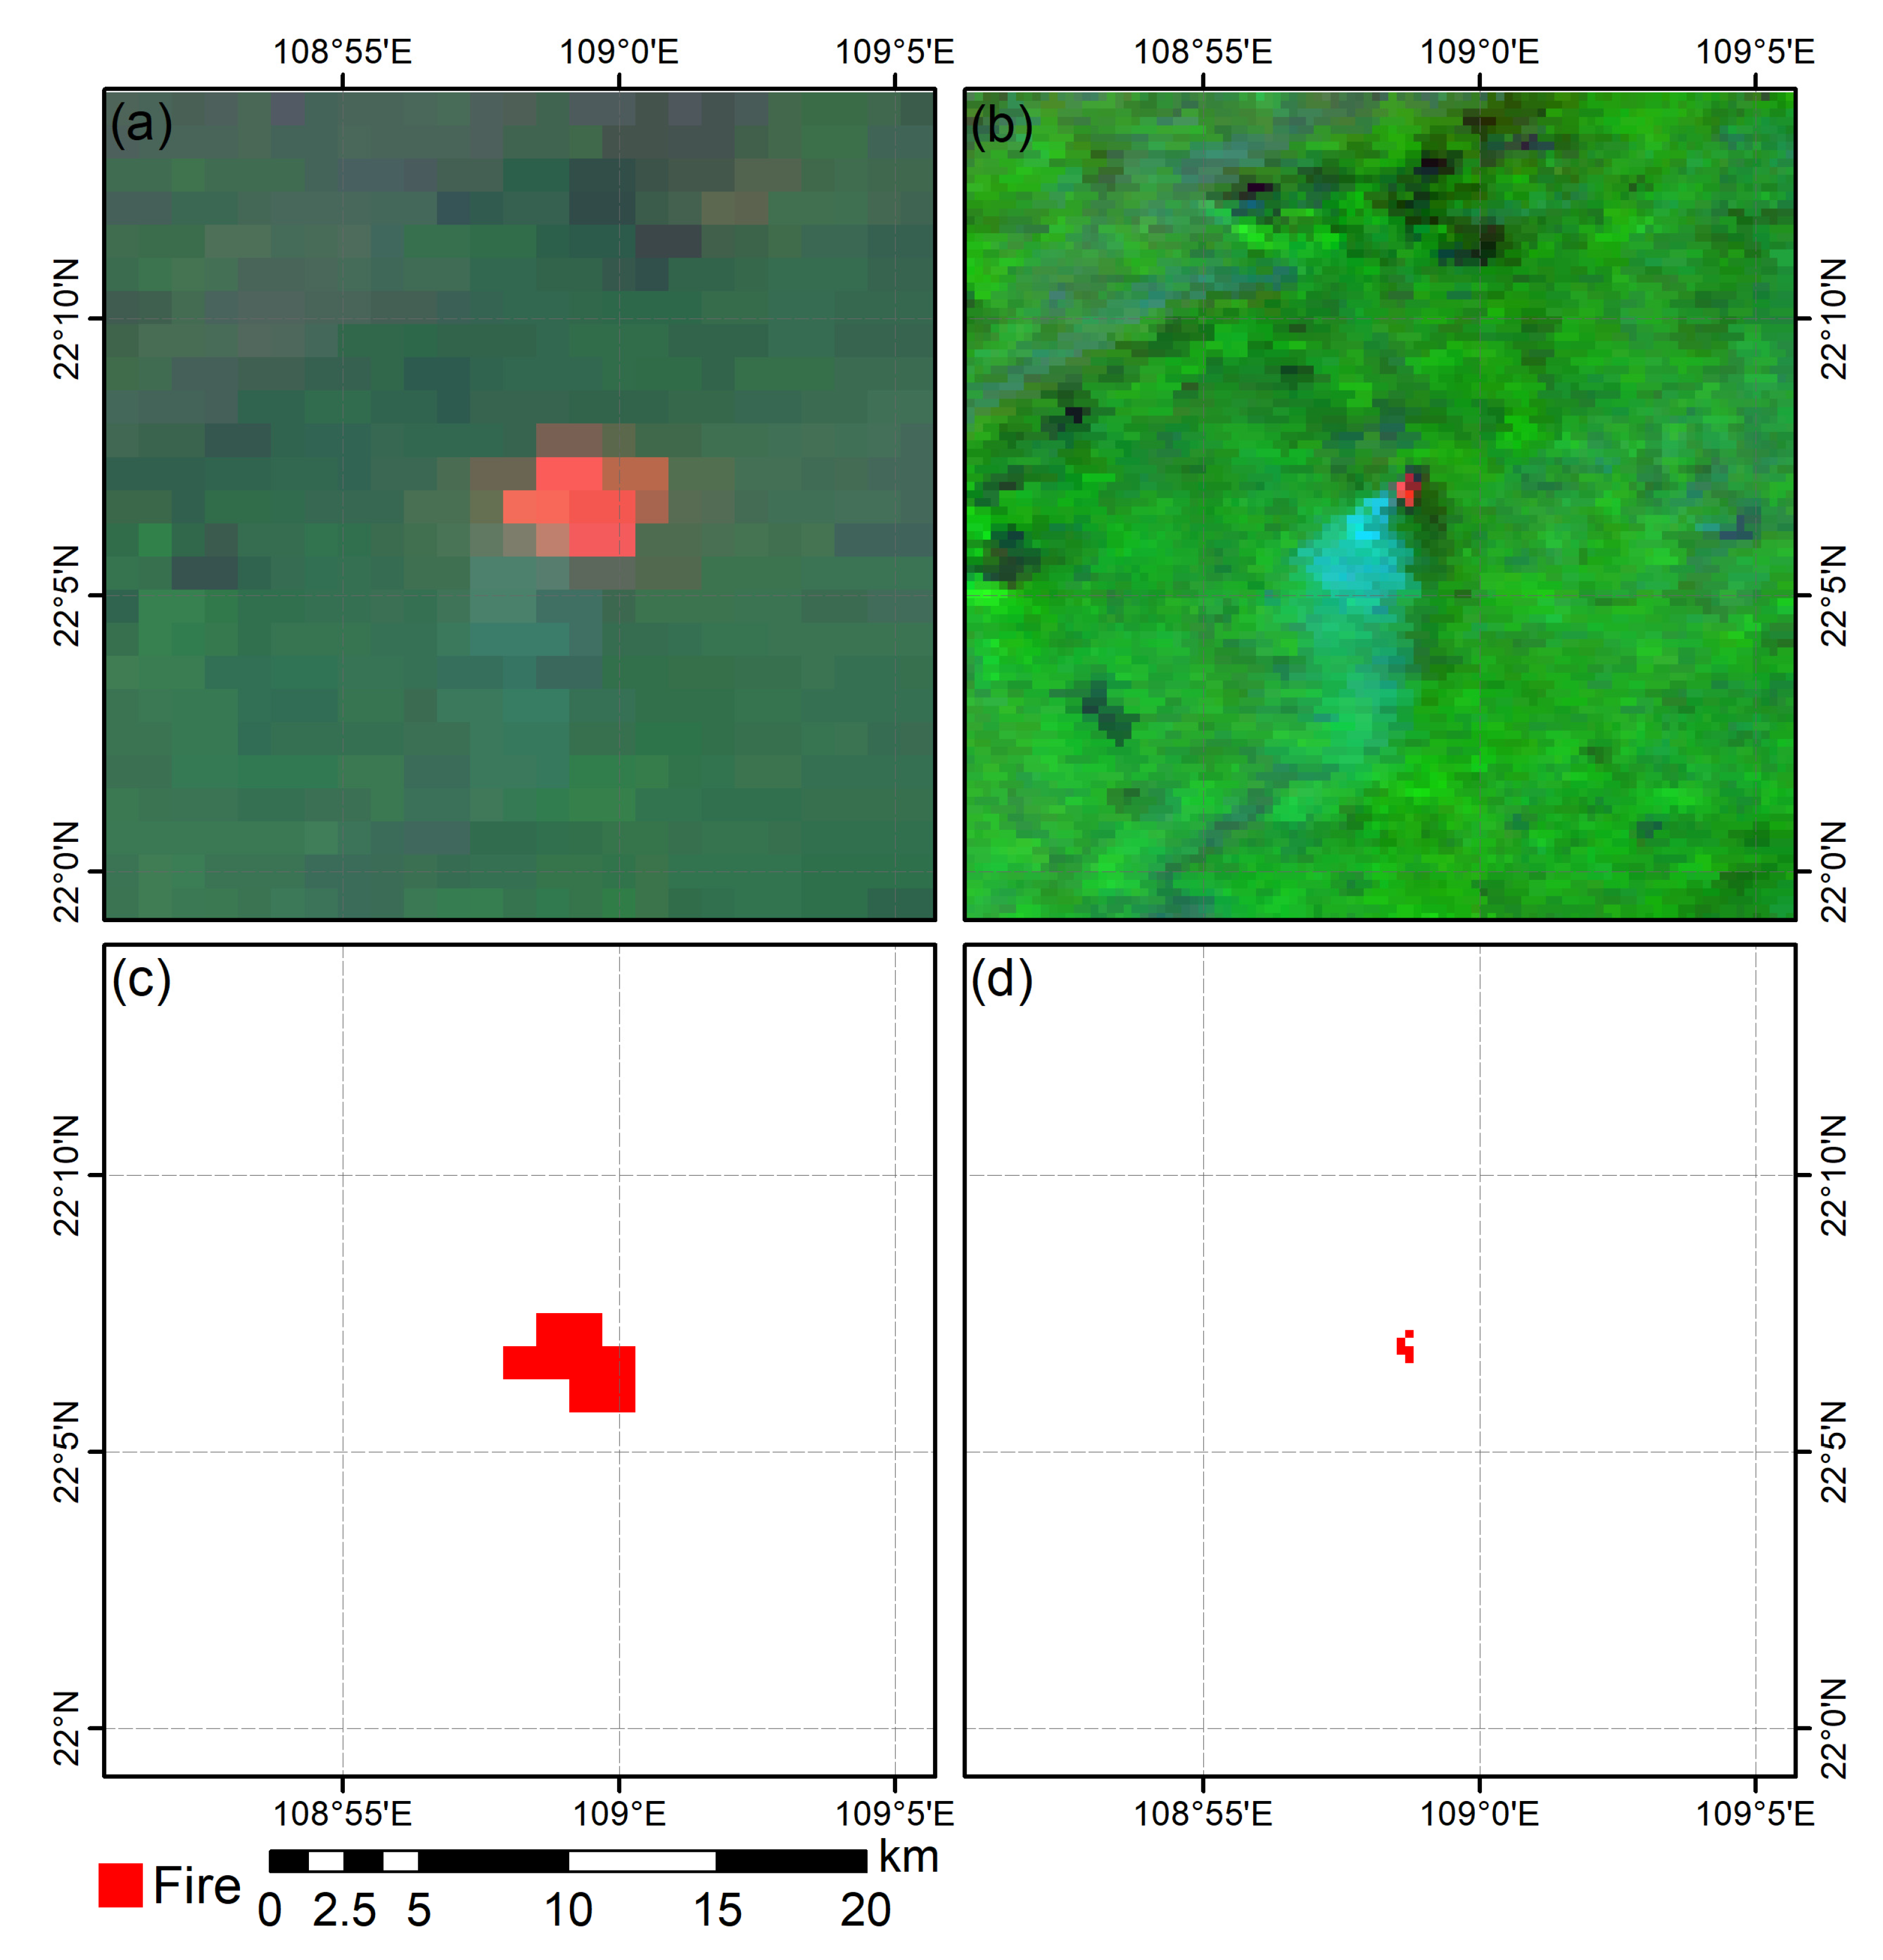
3.1. Forest Fire Monitoring in Southern China on 19 January 2023
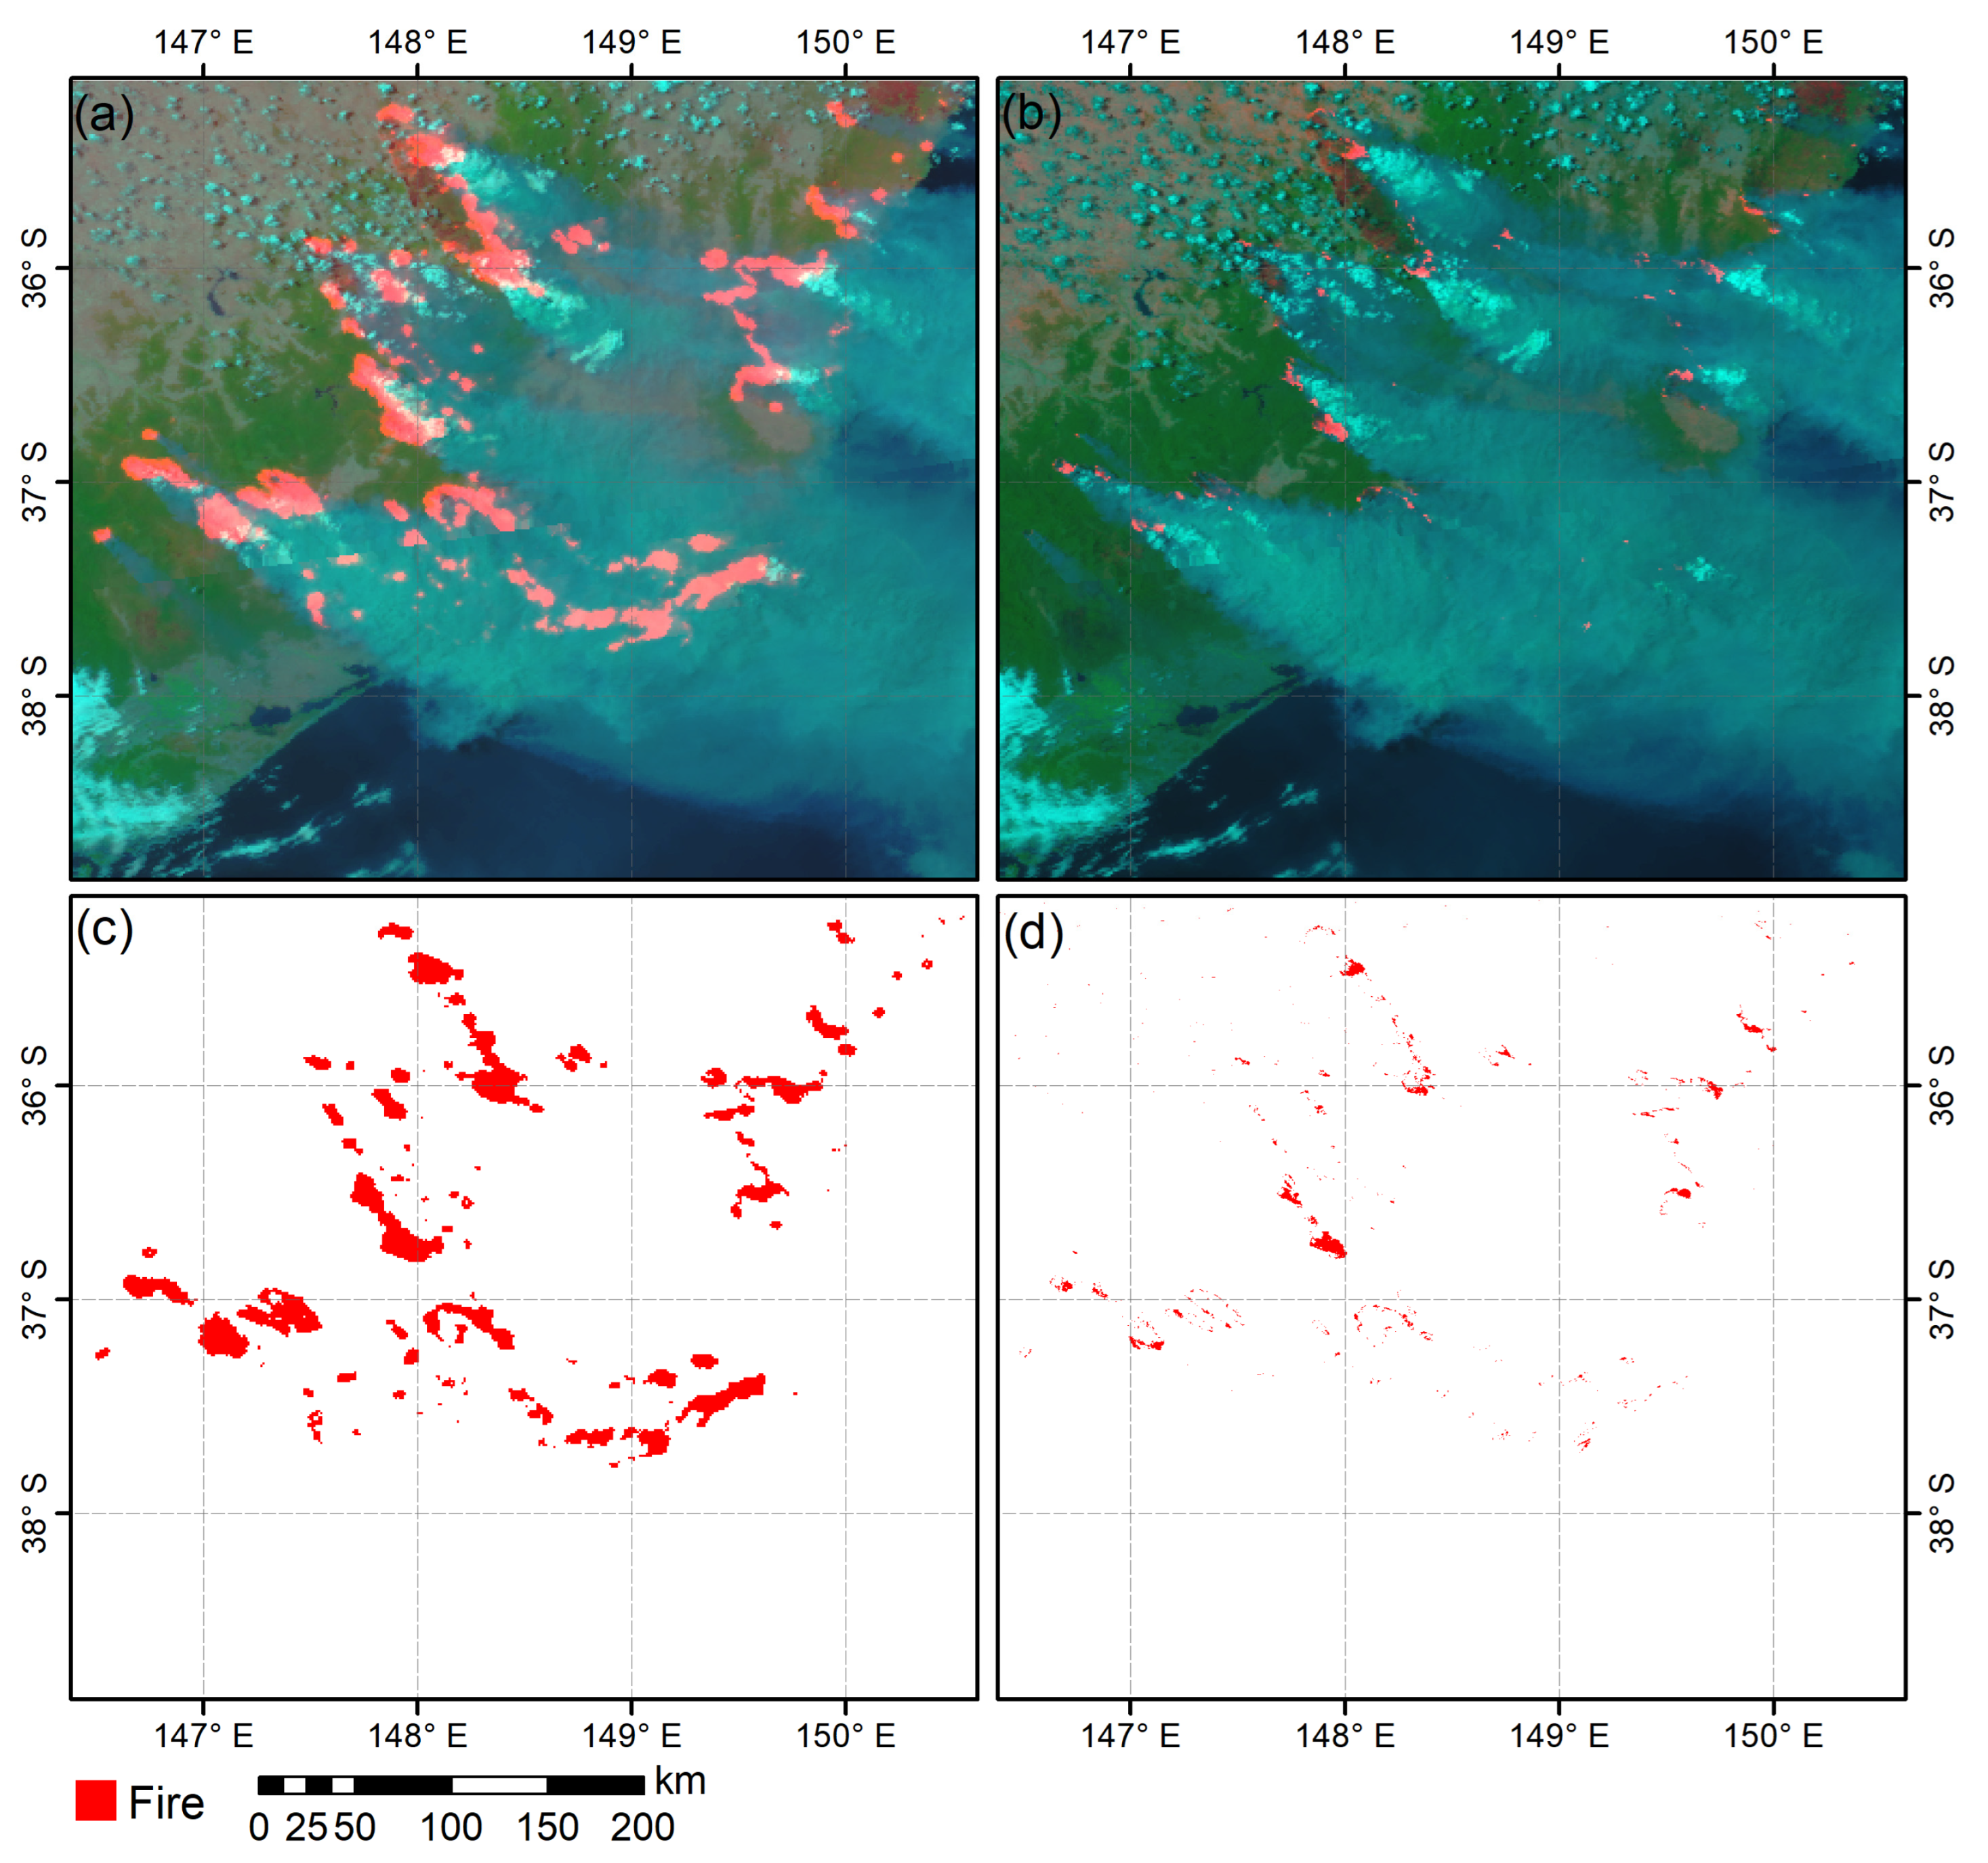
3.2. Large Wild Fire Monitoring in Australia on 4 January 2020
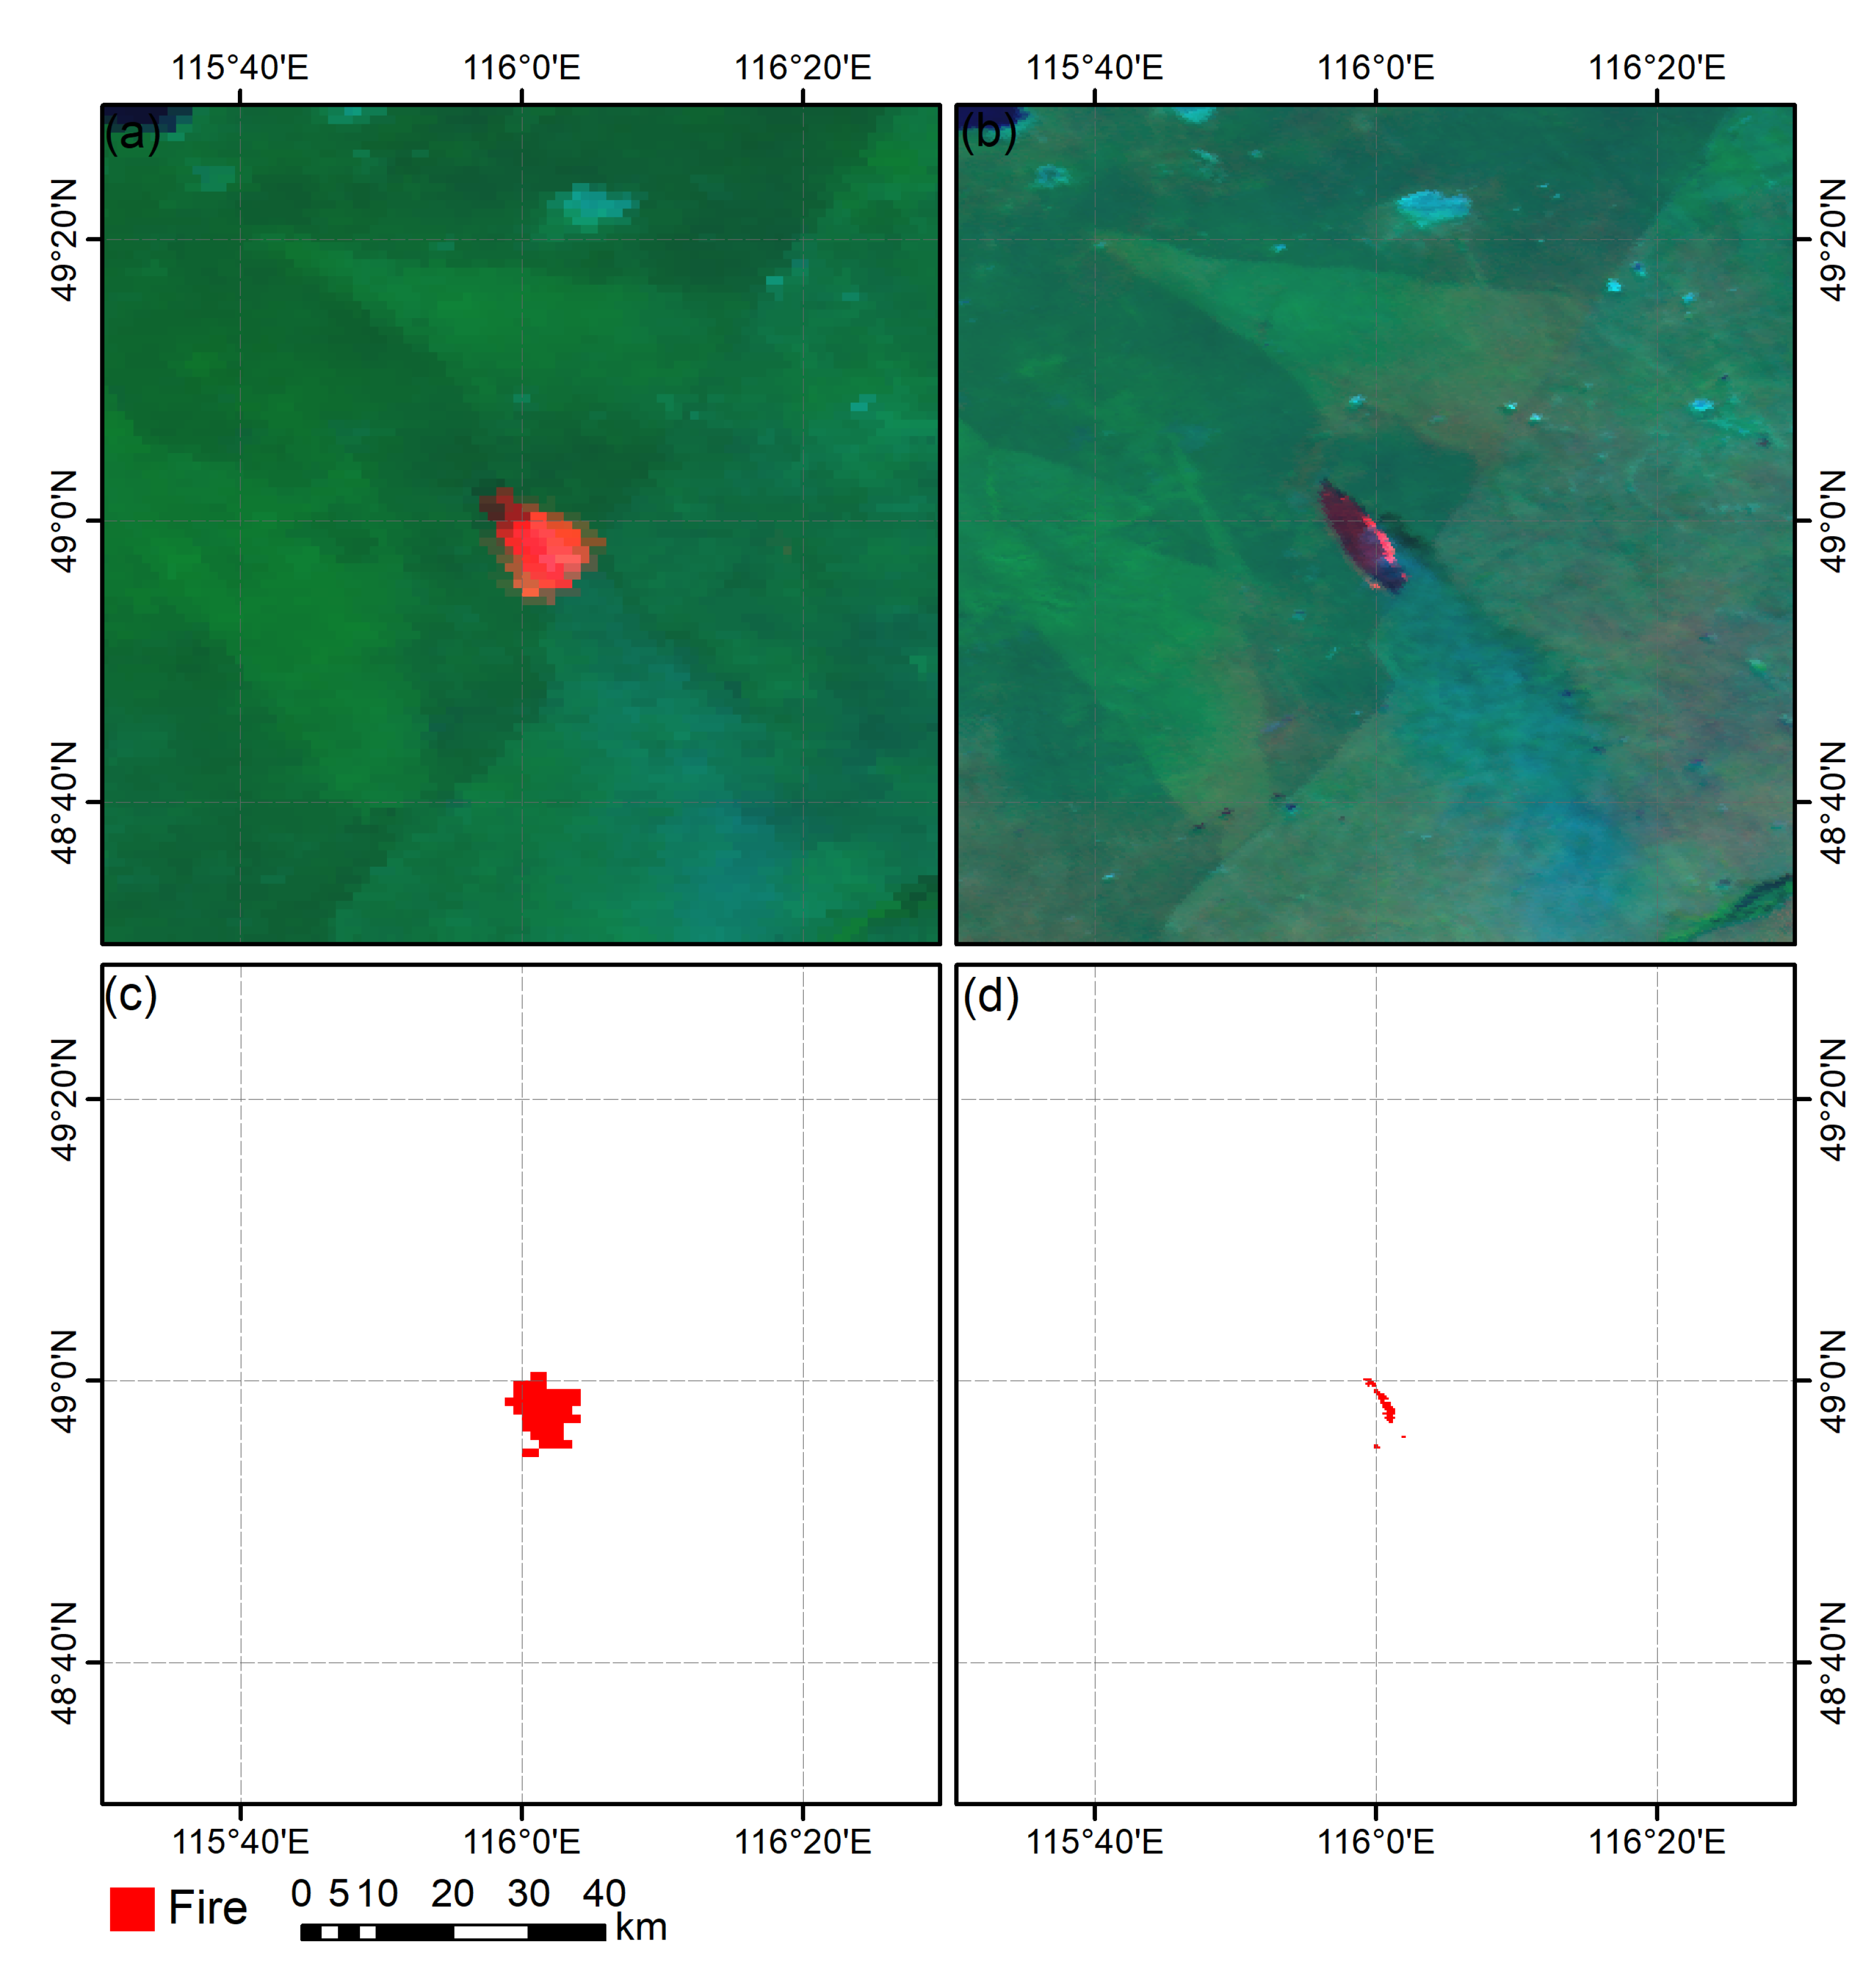
3.3. Grass Land Fire Monitoring in Northeast Asia on 19 September 2022
3.4. Fire Spot Identification in Sun Glint Areas
4. Discussion
4.1. Sensitivity
4.2. More Precise Location
4.3. Avoiding the Disturbance of Solar Radiation Reflection
4.4. Accuracy
4.5. Some Issues for Using 10.8 μm (250 m) in Fire Detection
5. Conclusions
- (1)
- Provides effective support for fire spot identification in sun glint areas, since the far-infrared channel is not disturbed by solar radiation reflection.
- (2)
- Raises the accuracy of the location of detected fire spots, as the spatial resolution of the FY-3D/MERSI-II far-infrared channel (10.8 μm) is 250 m, which is four times better than 1 km spatial resolution; thus, the problem that the relatively coarse resolution of 1 km cannot determine the precise position of fire fields in the fire pixel can effectively be solved.
- (3)
- Identifies the spatial distribution of regions with strong fires in large-scale fire fields, especially distinguishing flaming fire lines from smoldering fire in grass land fires.
Author Contributions
Funding
Data Availability Statement
Conflicts of Interest
References
- Sudhakar, S.; Vijayakumar, V.; Kumar, C.S.; Priya, V.; Ravi, L.; Subramaniyaswamy, V. Unmanned Aerial Vehicle (UAV) based Forest Fire Detection and monitoring for reducing false alarms in forest-fires. Comput. Commun. 2020, 149, 1–16. [Google Scholar] [CrossRef]
- Dozier, J. A method for satellite identification of surface temperature fields of sub-pixel resolution. Remote Sens. Environ. 1982, 11, 221–229. [Google Scholar] [CrossRef]
- Zhang, J.; Zhang, Q.; Lin, C.; Liu, C.; Dong, C. Detection of forest fire in Da Hinggan Ling Region by meteorological satellite. Acta Meteorol. Sin. 1989, 3, 562–568. [Google Scholar]
- Liu, C.; Li, Y.J.; Zhao, C.H.; Yan, H.; Zhao, H.M. The method of evaluating sub-pixel size and temperature of fire spot in AVHRR data. J. Appl. Meteorol. Sci. 2004, 15, 273–280. [Google Scholar]
- Liu, C.; Zhao, C.H.; Li, Y.J.; Zhao, H.M.; Xiu, Z. Improved method of detecting and evaluating the conditions of forest and grassland fire using meteorological and environment satellites. Proc. SPIE. 2003, 4895, 225–235. [Google Scholar]
- He, Q.J.; Liu, C. Improved algorithm of self-adaptive fire detection for MODIS data. J. Remote Sens. 2008, 12, 448–453. [Google Scholar]
- Kaufman, Y.J.; Kleidman, R.; King, M.D. SCAR-B. Fires in the Tropics: Properties and remote sensing from EOS-MODIS. J. Geophys. Res. 1998, 103, 31955–31968. [Google Scholar] [CrossRef]
- Hassini, A.; Benabdelouahed, F. Active fire monitoring with level 1. 5 MSG satellite images. Am. J. Appl. Sci. 2009, 6, 157–166. [Google Scholar] [CrossRef]
- Zhou, Y.; Wang, S.X.; Wang, L.T.; Chen, S.R.; Li, H.C. MODIS Data-based automatic extraction of information on fire spot. J. Nat. Disasters 2007, 16, 88–93. [Google Scholar]
- Zheng, X.; Chen, F.; Lou, L.; Cheng, P.; Huang, Y. Real-Time Detection of Full-Scale Forest Fire Smoke Based on Deep Convolution Neural Network. Remote Sens. 2022, 14, 536. [Google Scholar] [CrossRef]
- Kaufman, Y.J.; Chris, J.; Luke, F.; Jackie, K.; Elaine, P.; Darold, E.; Ward, P.M.; Alberto, S. Potential global fire monitoring from EOS-MODIS. J. Geophys. Res. 1998, 103, 32215–32238. [Google Scholar] [CrossRef]
- Giglio, L.; Descloitres, J.; Justice, C.O.; Kaufman, Y.J. An enhanced contextual fire detection algorithm for MODIS. Remote Sens.Environ. 2003, 87, 273–282. [Google Scholar] [CrossRef]
- He, B.; Chen, L.; Tao, J.; Su, L.; Wang, Z.; Li, S.; Han, D.; Zhang, Y.; Yu, C. A contextual fire detection algorithm based on observation geometry for HJ-1B-IRS. J. Infrared Millim. Waves 2011, 30, 104–109. [Google Scholar] [CrossRef]
- Zheng, W.; Shao, J.L.; Wang, M.; Liu, C. Dynamic Monitoring and analysis of grassland fire based on multi-source satellite remote sensing data. J. Nat. Disasters 2013, 22, 54–61. [Google Scholar]
- Chen, J.; Yao, Q.; Chen, Z.Y.; Li, M.C.; Hao, Z.Z.; Liu, C.; Zheng, W.; Xu, M.Q.; Chen, X.; Yang, J.; et al. The Fengyun-3D (FY-3D) global active fire product: Principle, methodology and validation. Earth Syst. Sci. Data. 2022, 14, 3489–3508. [Google Scholar] [CrossRef]


| Channel | Wavelength (μm) | Band | Spatial Resolution (km) |
|---|---|---|---|
| 3 | 0.650 | visible | 0.25 |
| 4 | 0.865 | near infrared | 0.25 |
| 20 | 3.8 | mid infrared | 1 |
| 24 | 10.8 | far infrared | 0.25 |
| Channels | P | 0.0001 | 0.0005 | 0.001 | 0.005 | ||||
|---|---|---|---|---|---|---|---|---|---|
| 700 K | 1000 K | 700 K | 1000 K | 700 K | 1000 K | 700 K | 1000 K | ||
| 3.8 µm (1 km) | 4.30 | 17.30 | 16.60 | 48.20 | 27.50 | 67.70 | 66.70 | 141.60 | |
| 10.8 µm (1 km) | 0.10 | 0.21 | 0.50 | 1.06 | 1.00 | 2.10 | 6.46 | 13.24 | |
| 10.8 µm (250 m) | 1.60 | 3.50 | 7.80 | 15.87 | 15.10 | 29.90 | 78.40 | 139.25 | |
| 3.8 µm (1 km) | 10.8 µm (1 km) | 10.8 µm (250 m) | |
|---|---|---|---|
| Temp. Increment (K) | 45 | 3 | 15 |
| Location | 109.980°E, 22.120°N | 109.980°E, 22.120°N | 108.975°E, 22.115°N |
| Wavelength of Channel | Solar Irradiance (W (m2µm)−1) | Radiance to a Temperature of Surface (W (m2 sr µm)−1) | Radiance to the Upper Brightness Temperature (W (m2 sr µm) −1) |
|---|---|---|---|
| 3.8 µm | 10.57 | 0.49 (300 K) | 4.83 (366 K) |
| 10.8 µm | 0.18 | 9.67 (300 K) | 17.03 (343 K) |
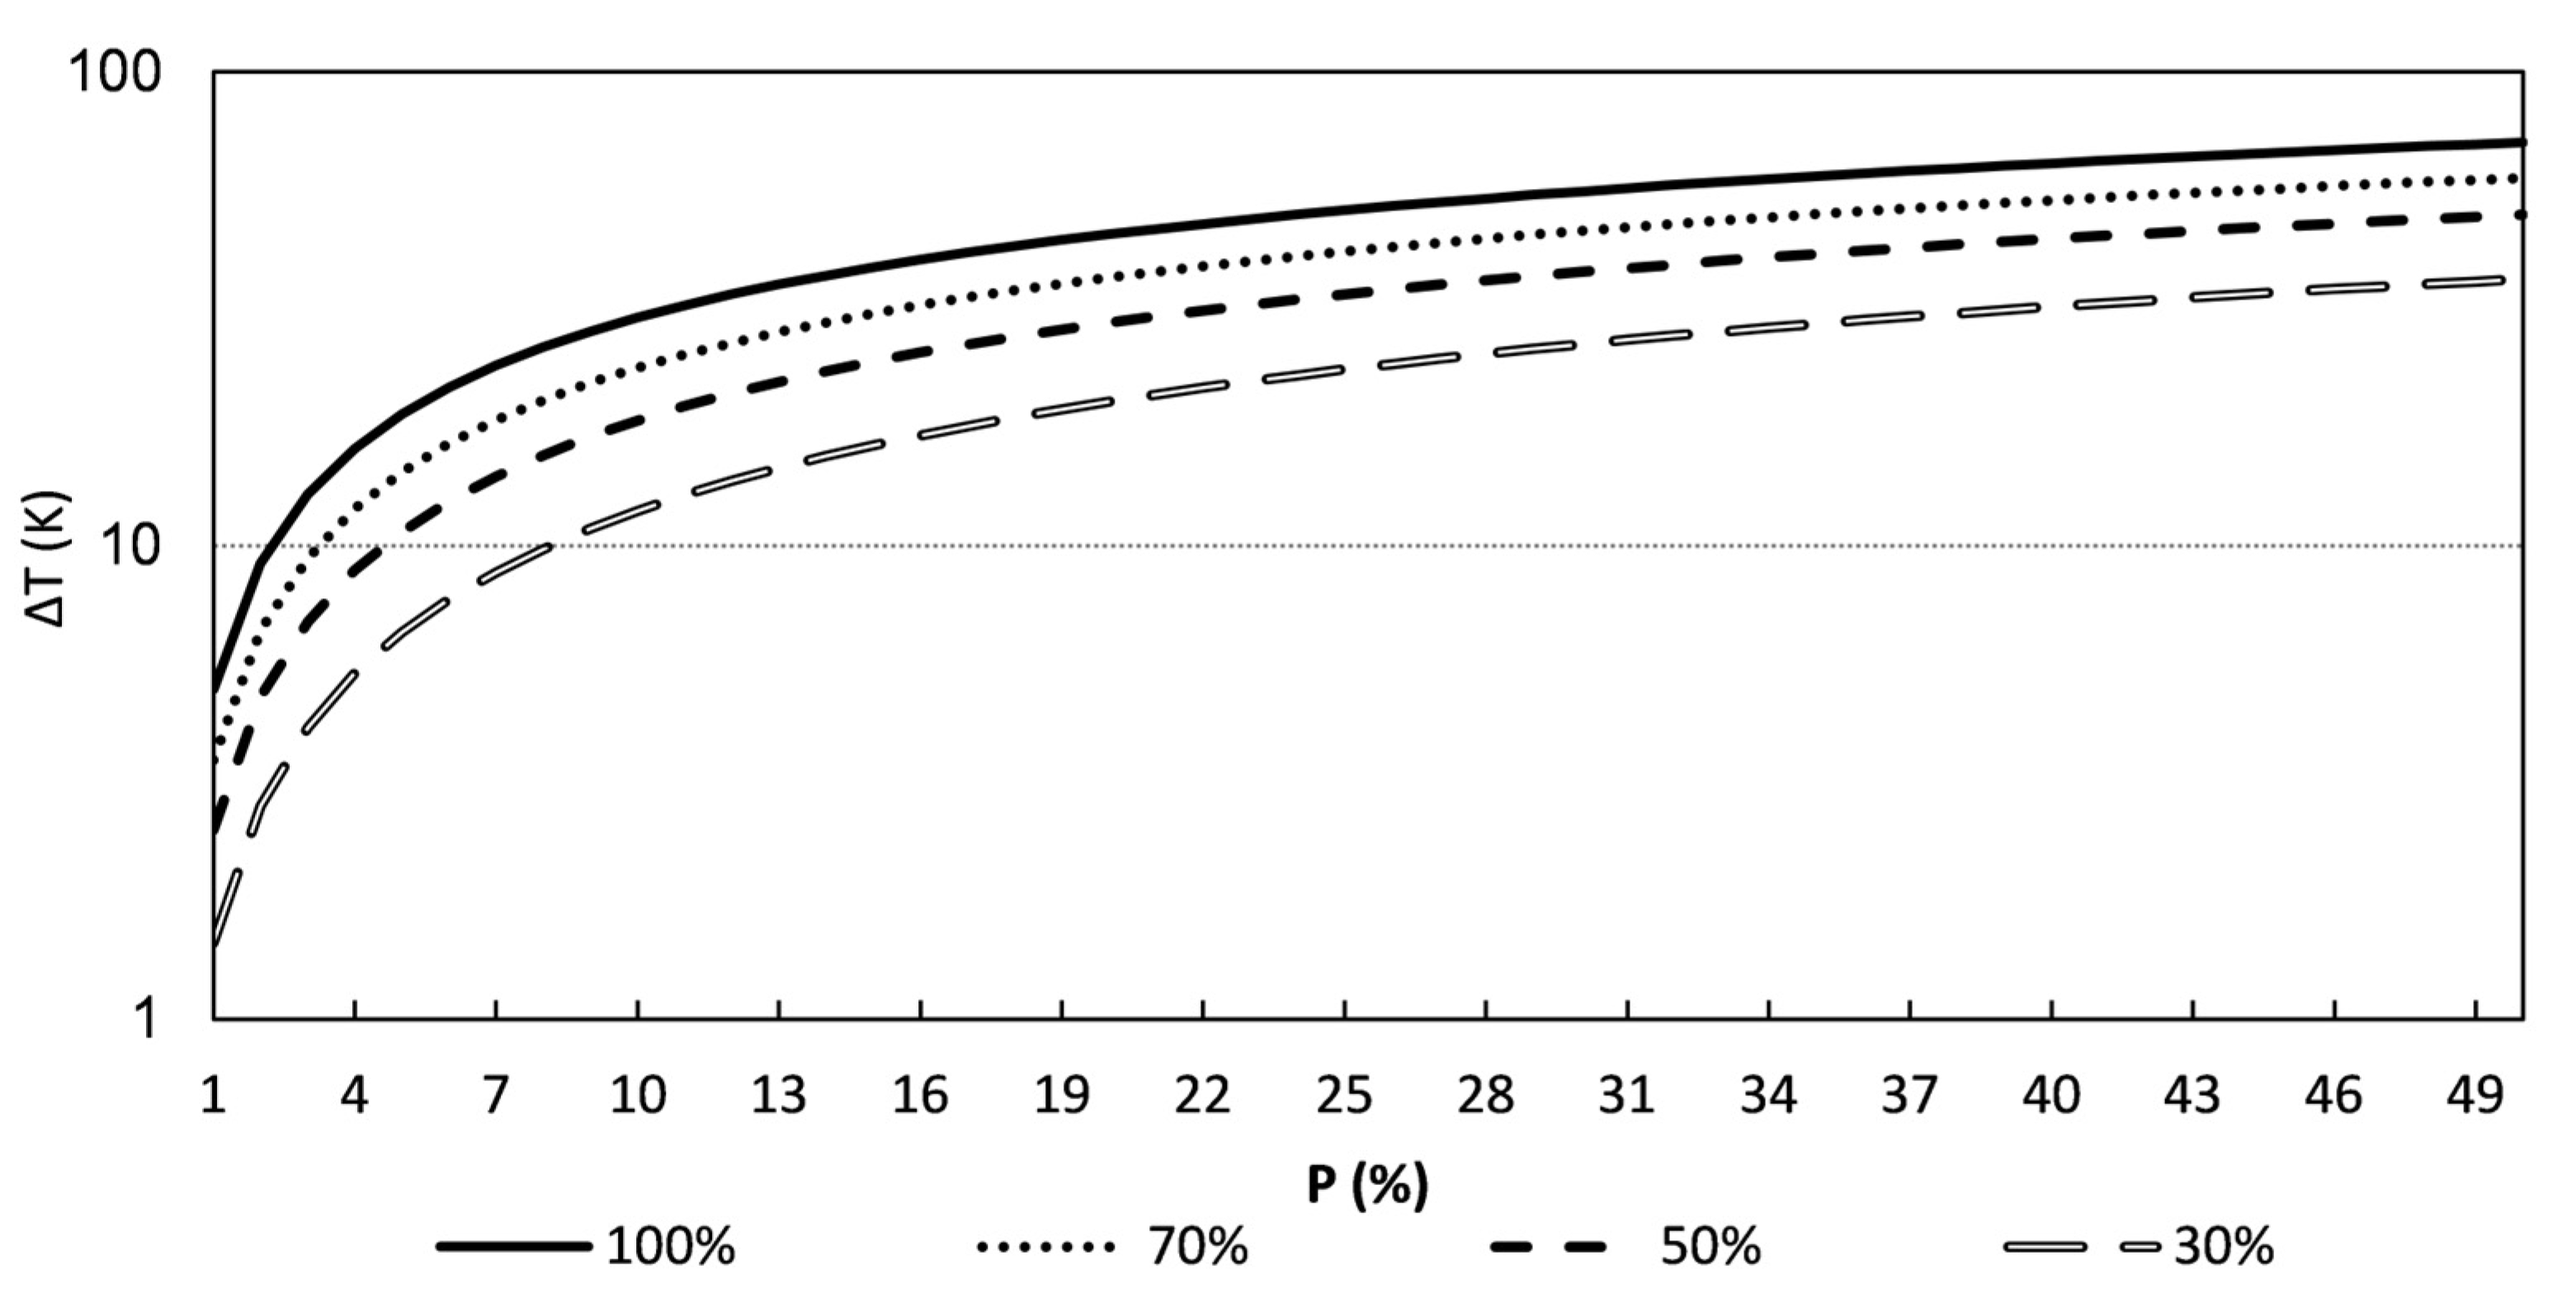
| Rsung (%) | 100 | 70 | 50 | 30 | |
|---|---|---|---|---|---|
| P (%) | |||||
| 1 | 4.98 | 3.52 | 2.51 | 1.45 | |
| 2 | 9.17 | 6.63 | 4.80 | 2.82 | |
| 3 | 12.81 | 9.42 | 6.90 | 4.13 | |
| 4 | 16.04 | 11.95 | 8.86 | 5.37 | |
| 5 | 18.95 | 14.28 | 10.69 | 6.56 | |
| 6 | 21.59 | 16.43 | 12.40 | 7.70 | |
| 7 | 24.02 | 18.43 | 14.02 | 8.80 | |
| 3.8 µm (1 km) Existing Method | 10.8 µm (250 m) Proposed Method | ||
|---|---|---|---|
| Number of Fire Pixels | Size Coverd | Number of Fire Pixels | Size Coverd |
| 8 | 9.16 km2 | 5 | 0.36 km2 |
| 3.8 µm (1 km) Existing Method | 10.8 µm (250 m) Proposed Method | ||
|---|---|---|---|
| Number of Fire Pixels | Size Coverd | Number of Fire Pixels | Size Coverd |
| 5670 | 5622 km2 | 11,267 | 700.25 km2 |
| Distance of Longitude/Latitude | Number of Fire Pixels Detected | Ratio |
|---|---|---|
| 0 | 10,763 | 0.955 |
| <0.01 | 10,965 | 0.973 |
| <0.02 | 11,002 | 0.976 |
| ≥0.02 | 264 | 0.023 |
| 3.8 µm (1 km) Existing Method | 10.8 µm (250 m) Proposed Method | ||
|---|---|---|---|
| Number of Fire Pixels | Size Coverd | Number of Fire Pixels | Size Coverd |
| 45 | 36.5 km2 | 57 | 2.88 km2 |
Disclaimer/Publisher’s Note: The statements, opinions and data contained in all publications are solely those of the individual author(s) and contributor(s) and not of MDPI and/or the editor(s). MDPI and/or the editor(s) disclaim responsibility for any injury to people or property resulting from any ideas, methods, instructions or products referred to in the content. |
© 2023 by the authors. Licensee MDPI, Basel, Switzerland. This article is an open access article distributed under the terms and conditions of the Creative Commons Attribution (CC BY) license (https://creativecommons.org/licenses/by/4.0/).
Share and Cite
Zheng, W.; Chen, J.; Liu, C.; Shan, T.; Yan, H. Study of the Application of FY-3D/MERSI-II Far-Infrared Data in Wildfire Monitoring. Remote Sens. 2023, 15, 4228. https://doi.org/10.3390/rs15174228
Zheng W, Chen J, Liu C, Shan T, Yan H. Study of the Application of FY-3D/MERSI-II Far-Infrared Data in Wildfire Monitoring. Remote Sensing. 2023; 15(17):4228. https://doi.org/10.3390/rs15174228
Chicago/Turabian StyleZheng, Wei, Jie Chen, Cheng Liu, Tianchan Shan, and Hua Yan. 2023. "Study of the Application of FY-3D/MERSI-II Far-Infrared Data in Wildfire Monitoring" Remote Sensing 15, no. 17: 4228. https://doi.org/10.3390/rs15174228
APA StyleZheng, W., Chen, J., Liu, C., Shan, T., & Yan, H. (2023). Study of the Application of FY-3D/MERSI-II Far-Infrared Data in Wildfire Monitoring. Remote Sensing, 15(17), 4228. https://doi.org/10.3390/rs15174228