
Machine Learning for Predicting Forest Fire Occurrence in Changsha: An Innovative Investigation into the Introduction of a Forest Fuel Factor

 , and
, and
Abstract
:1. Introduction
2. Materials and Methods
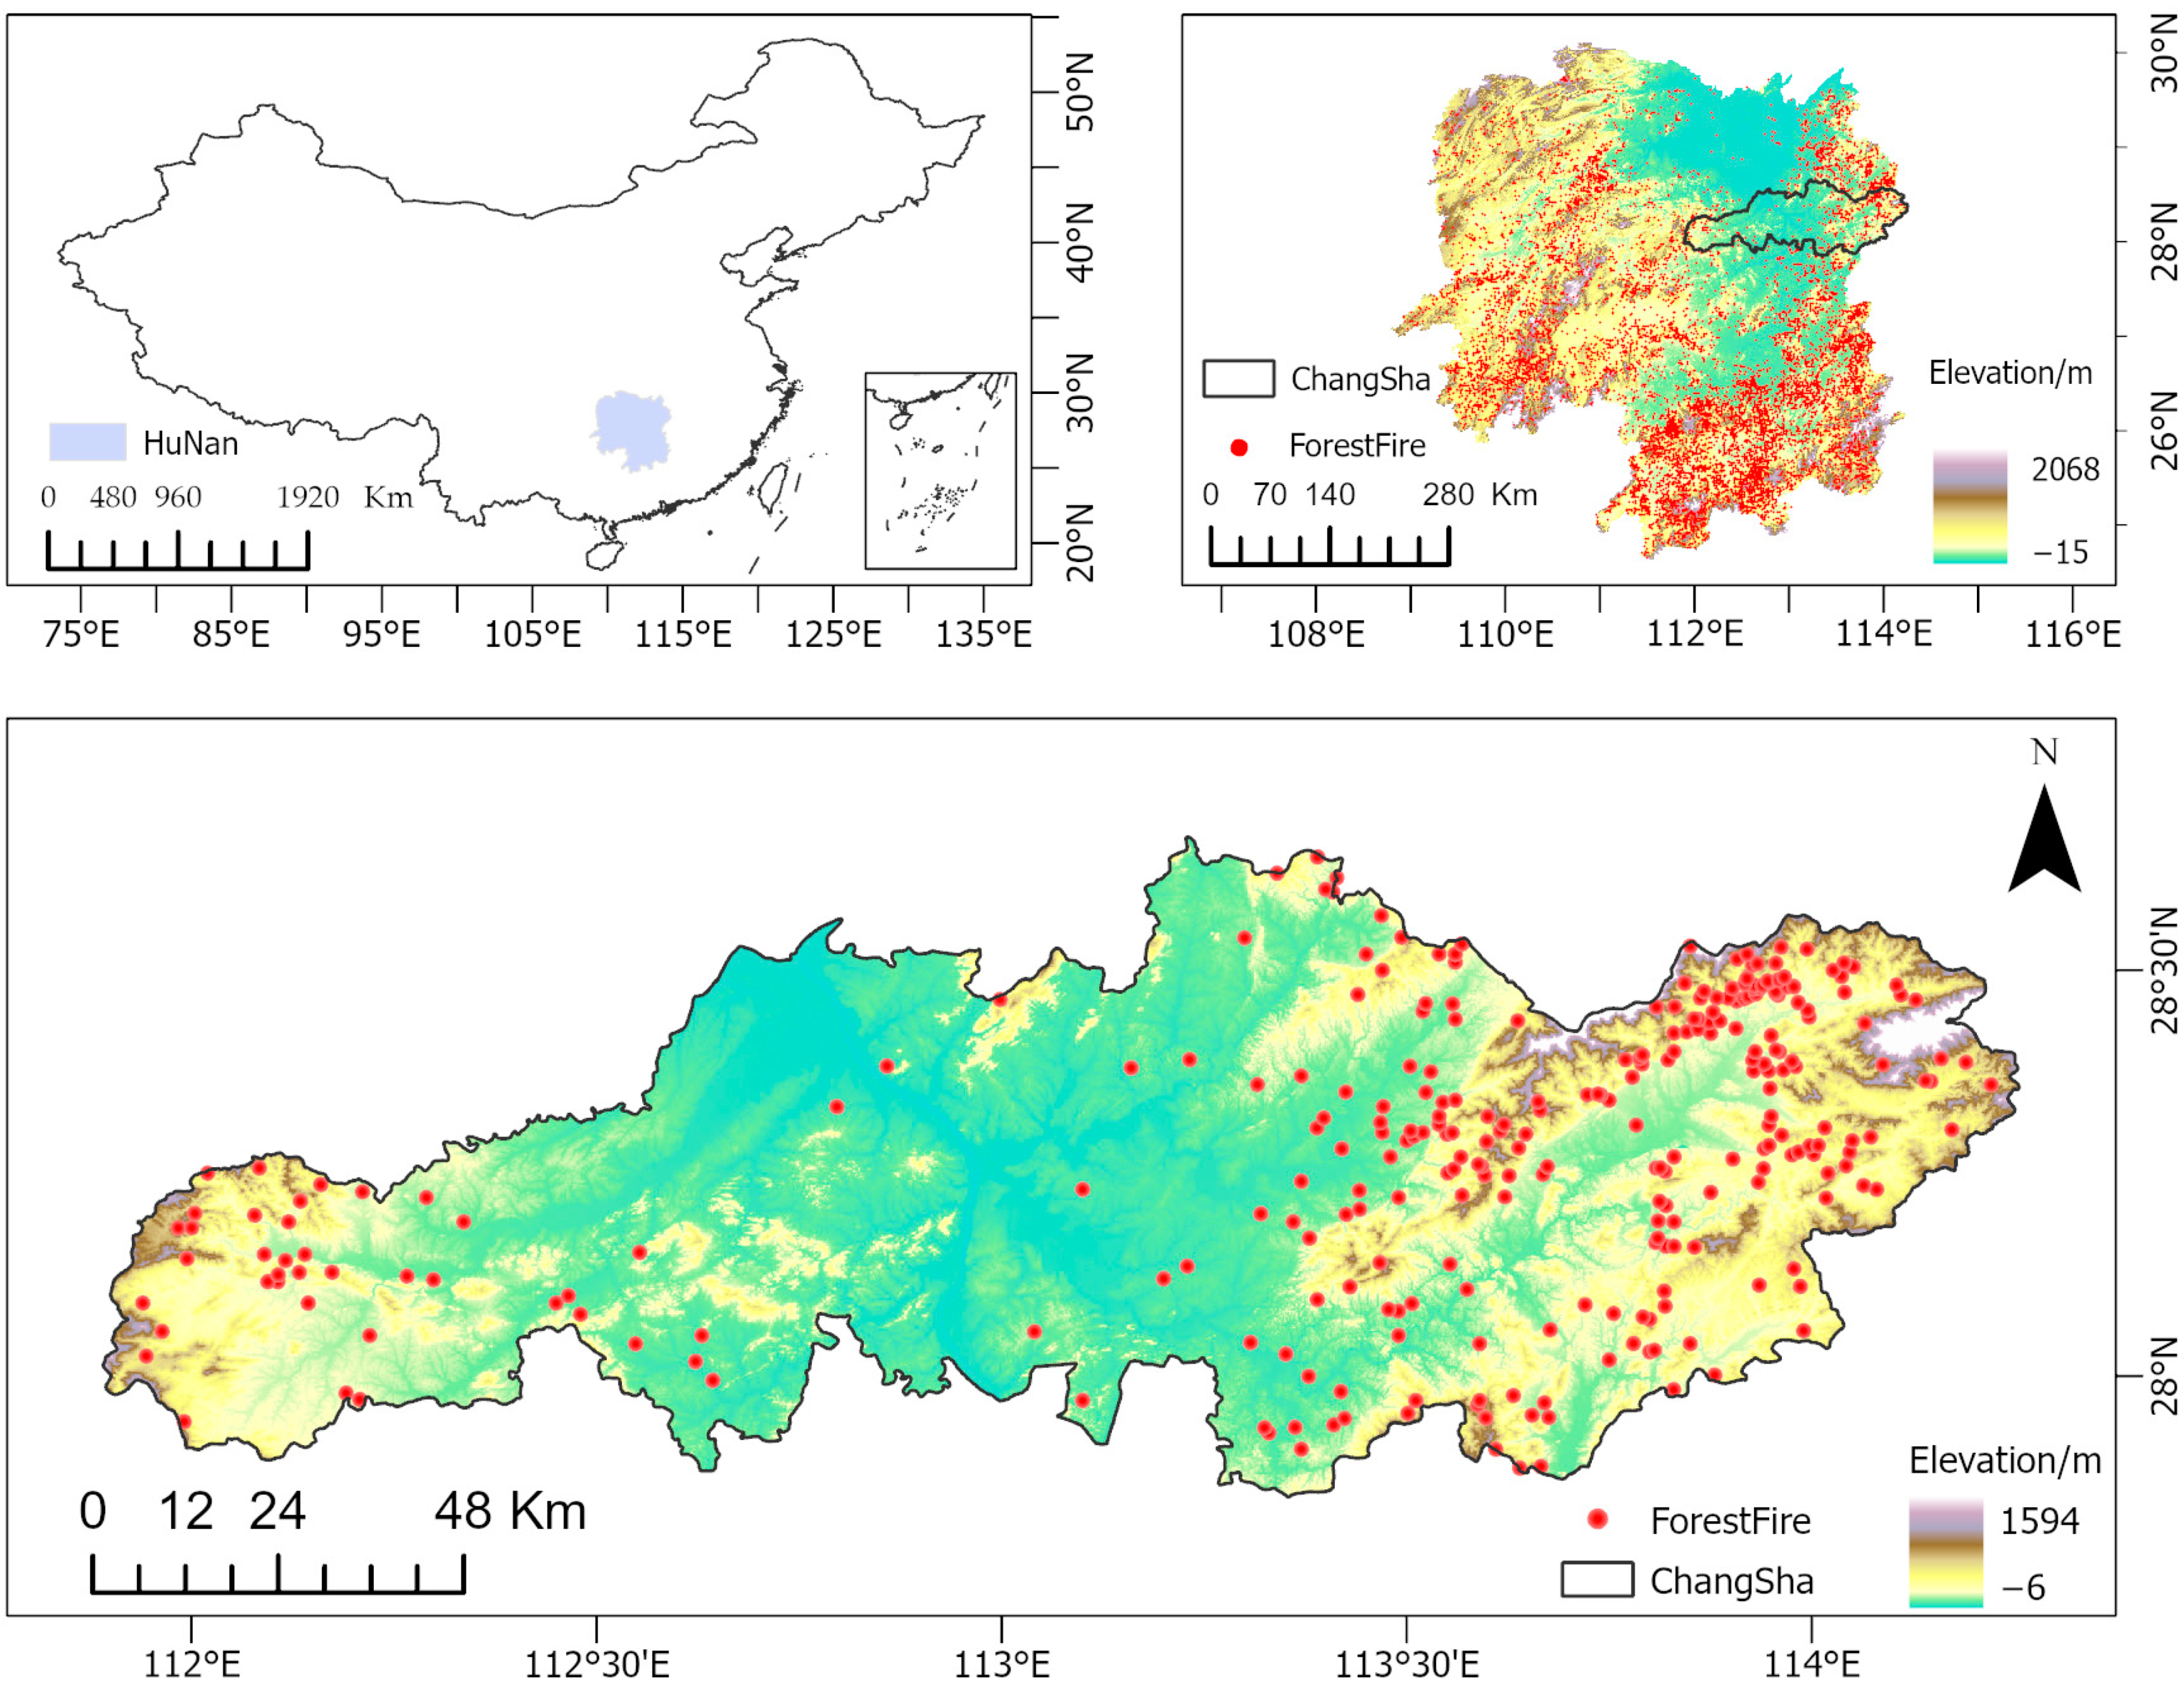
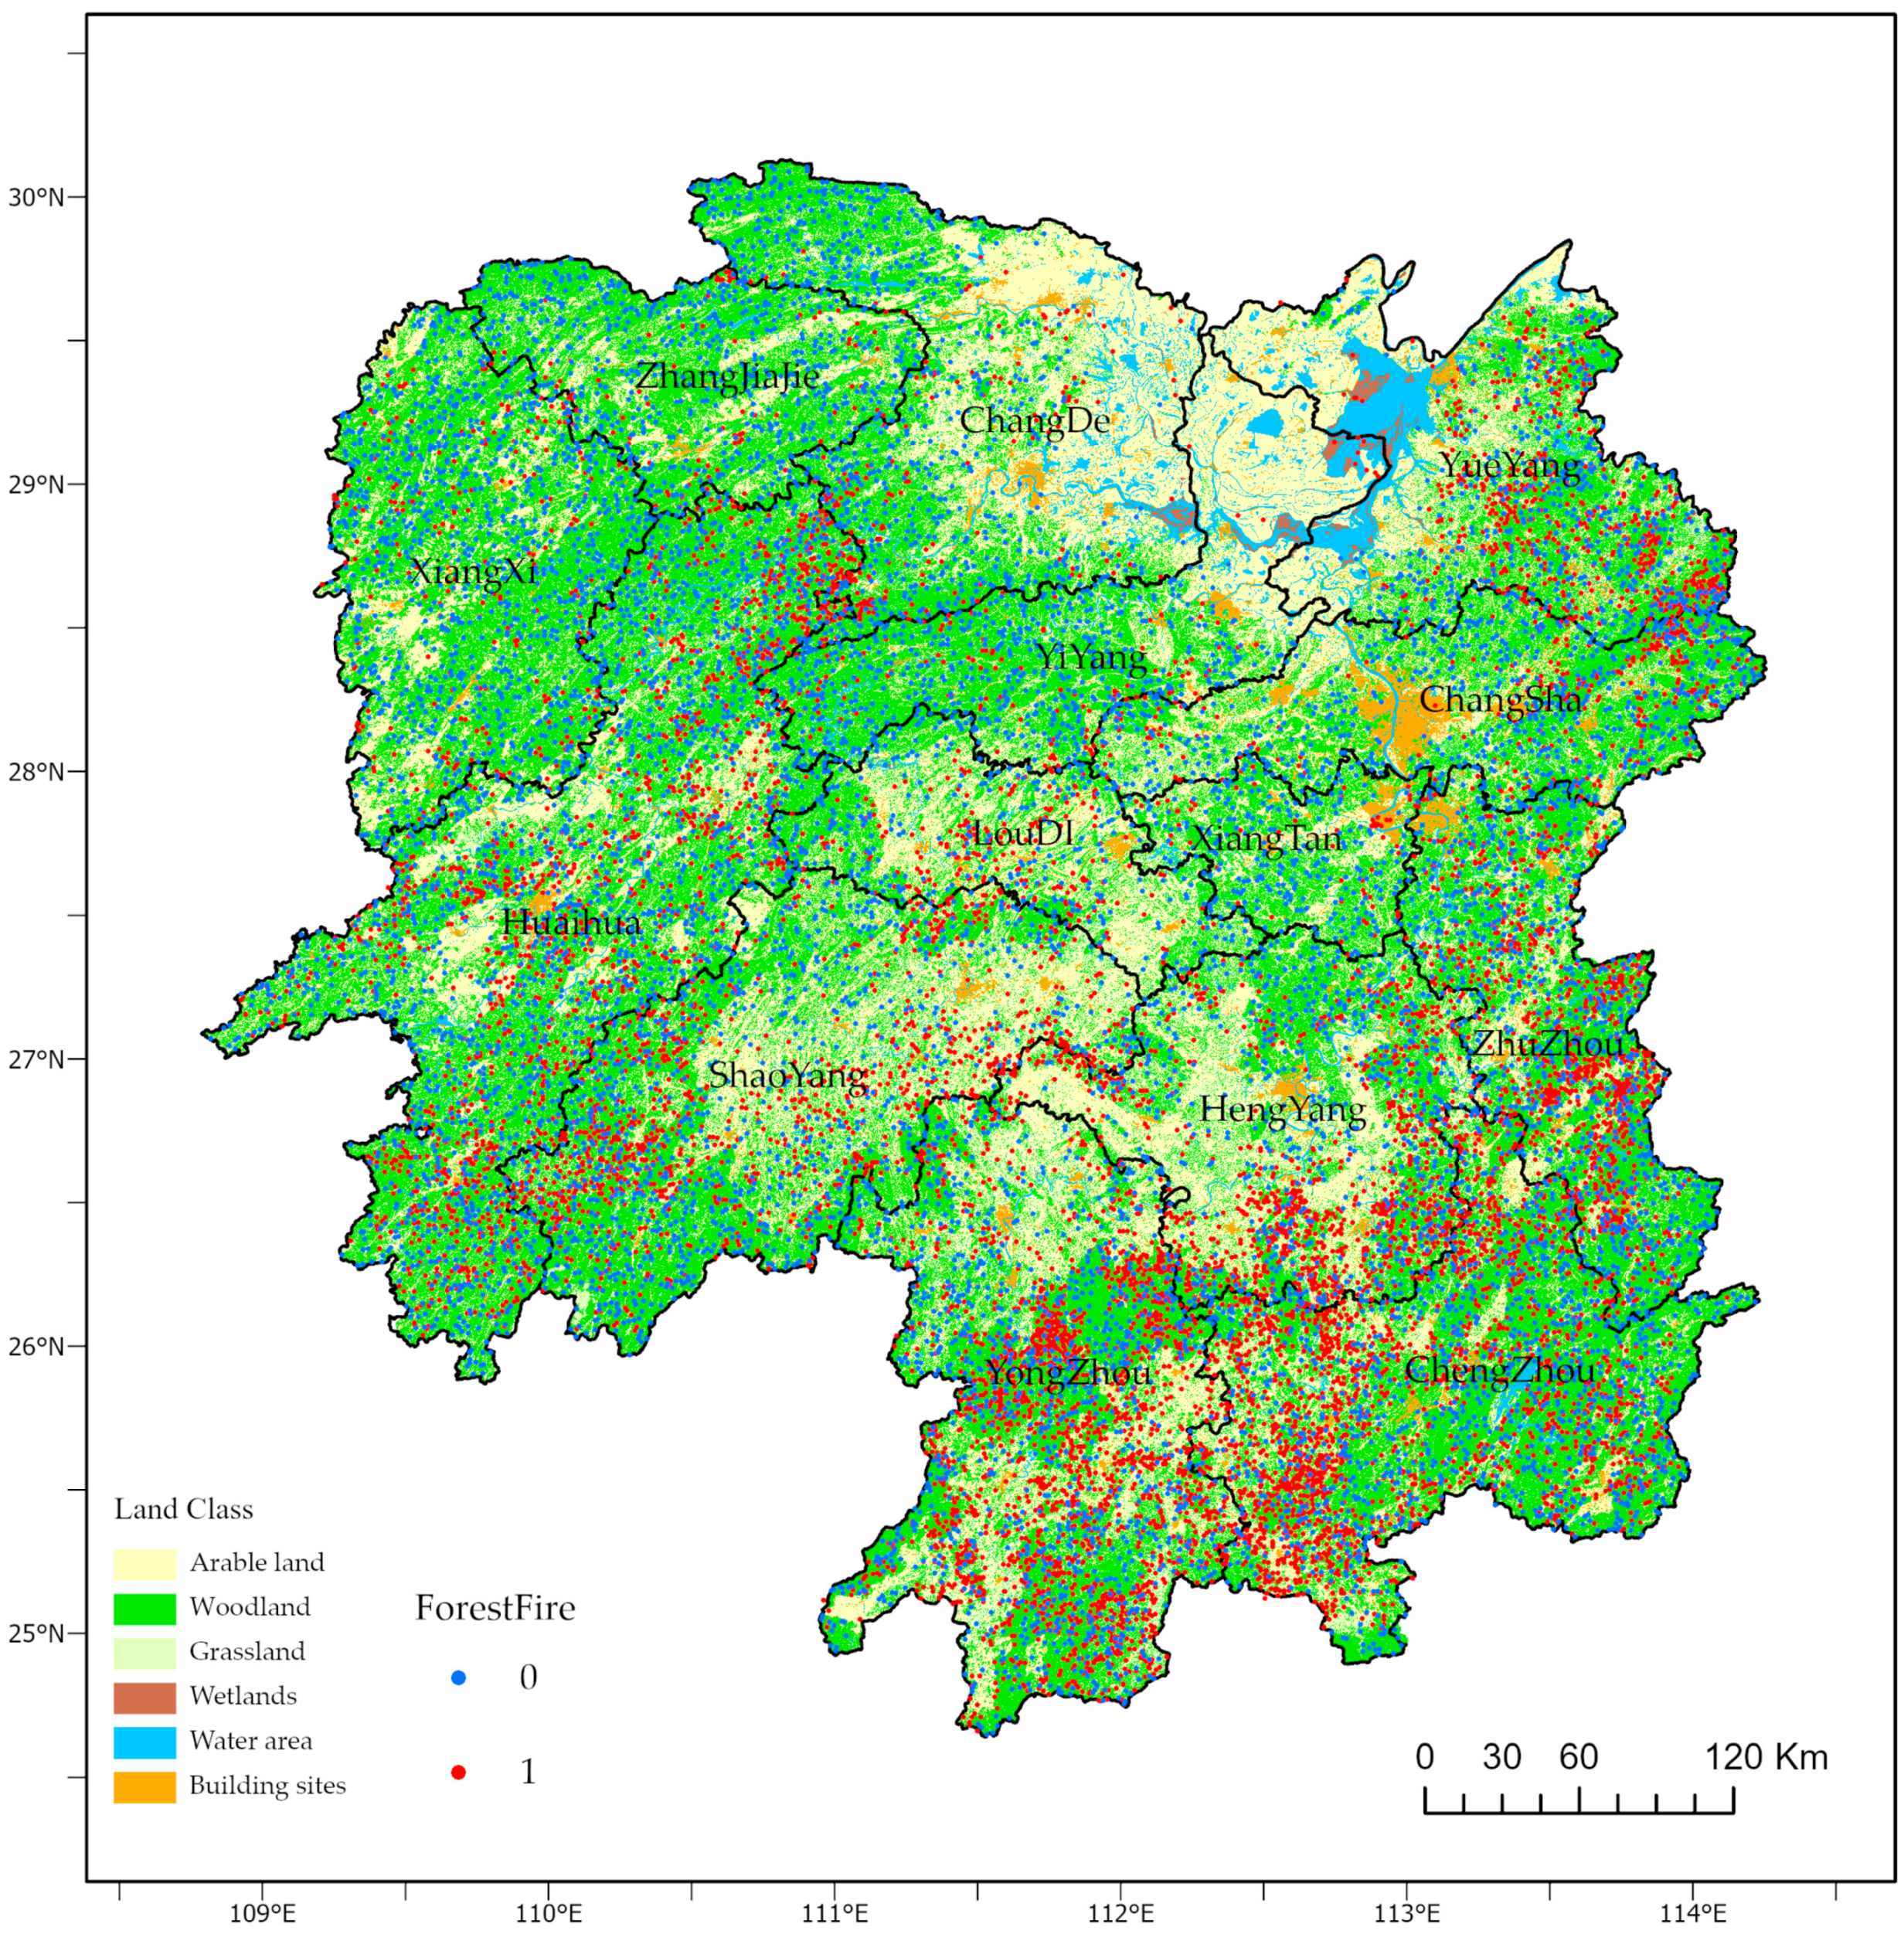
2.1. Study Area
2.2. Data Sources and Pre-Processing
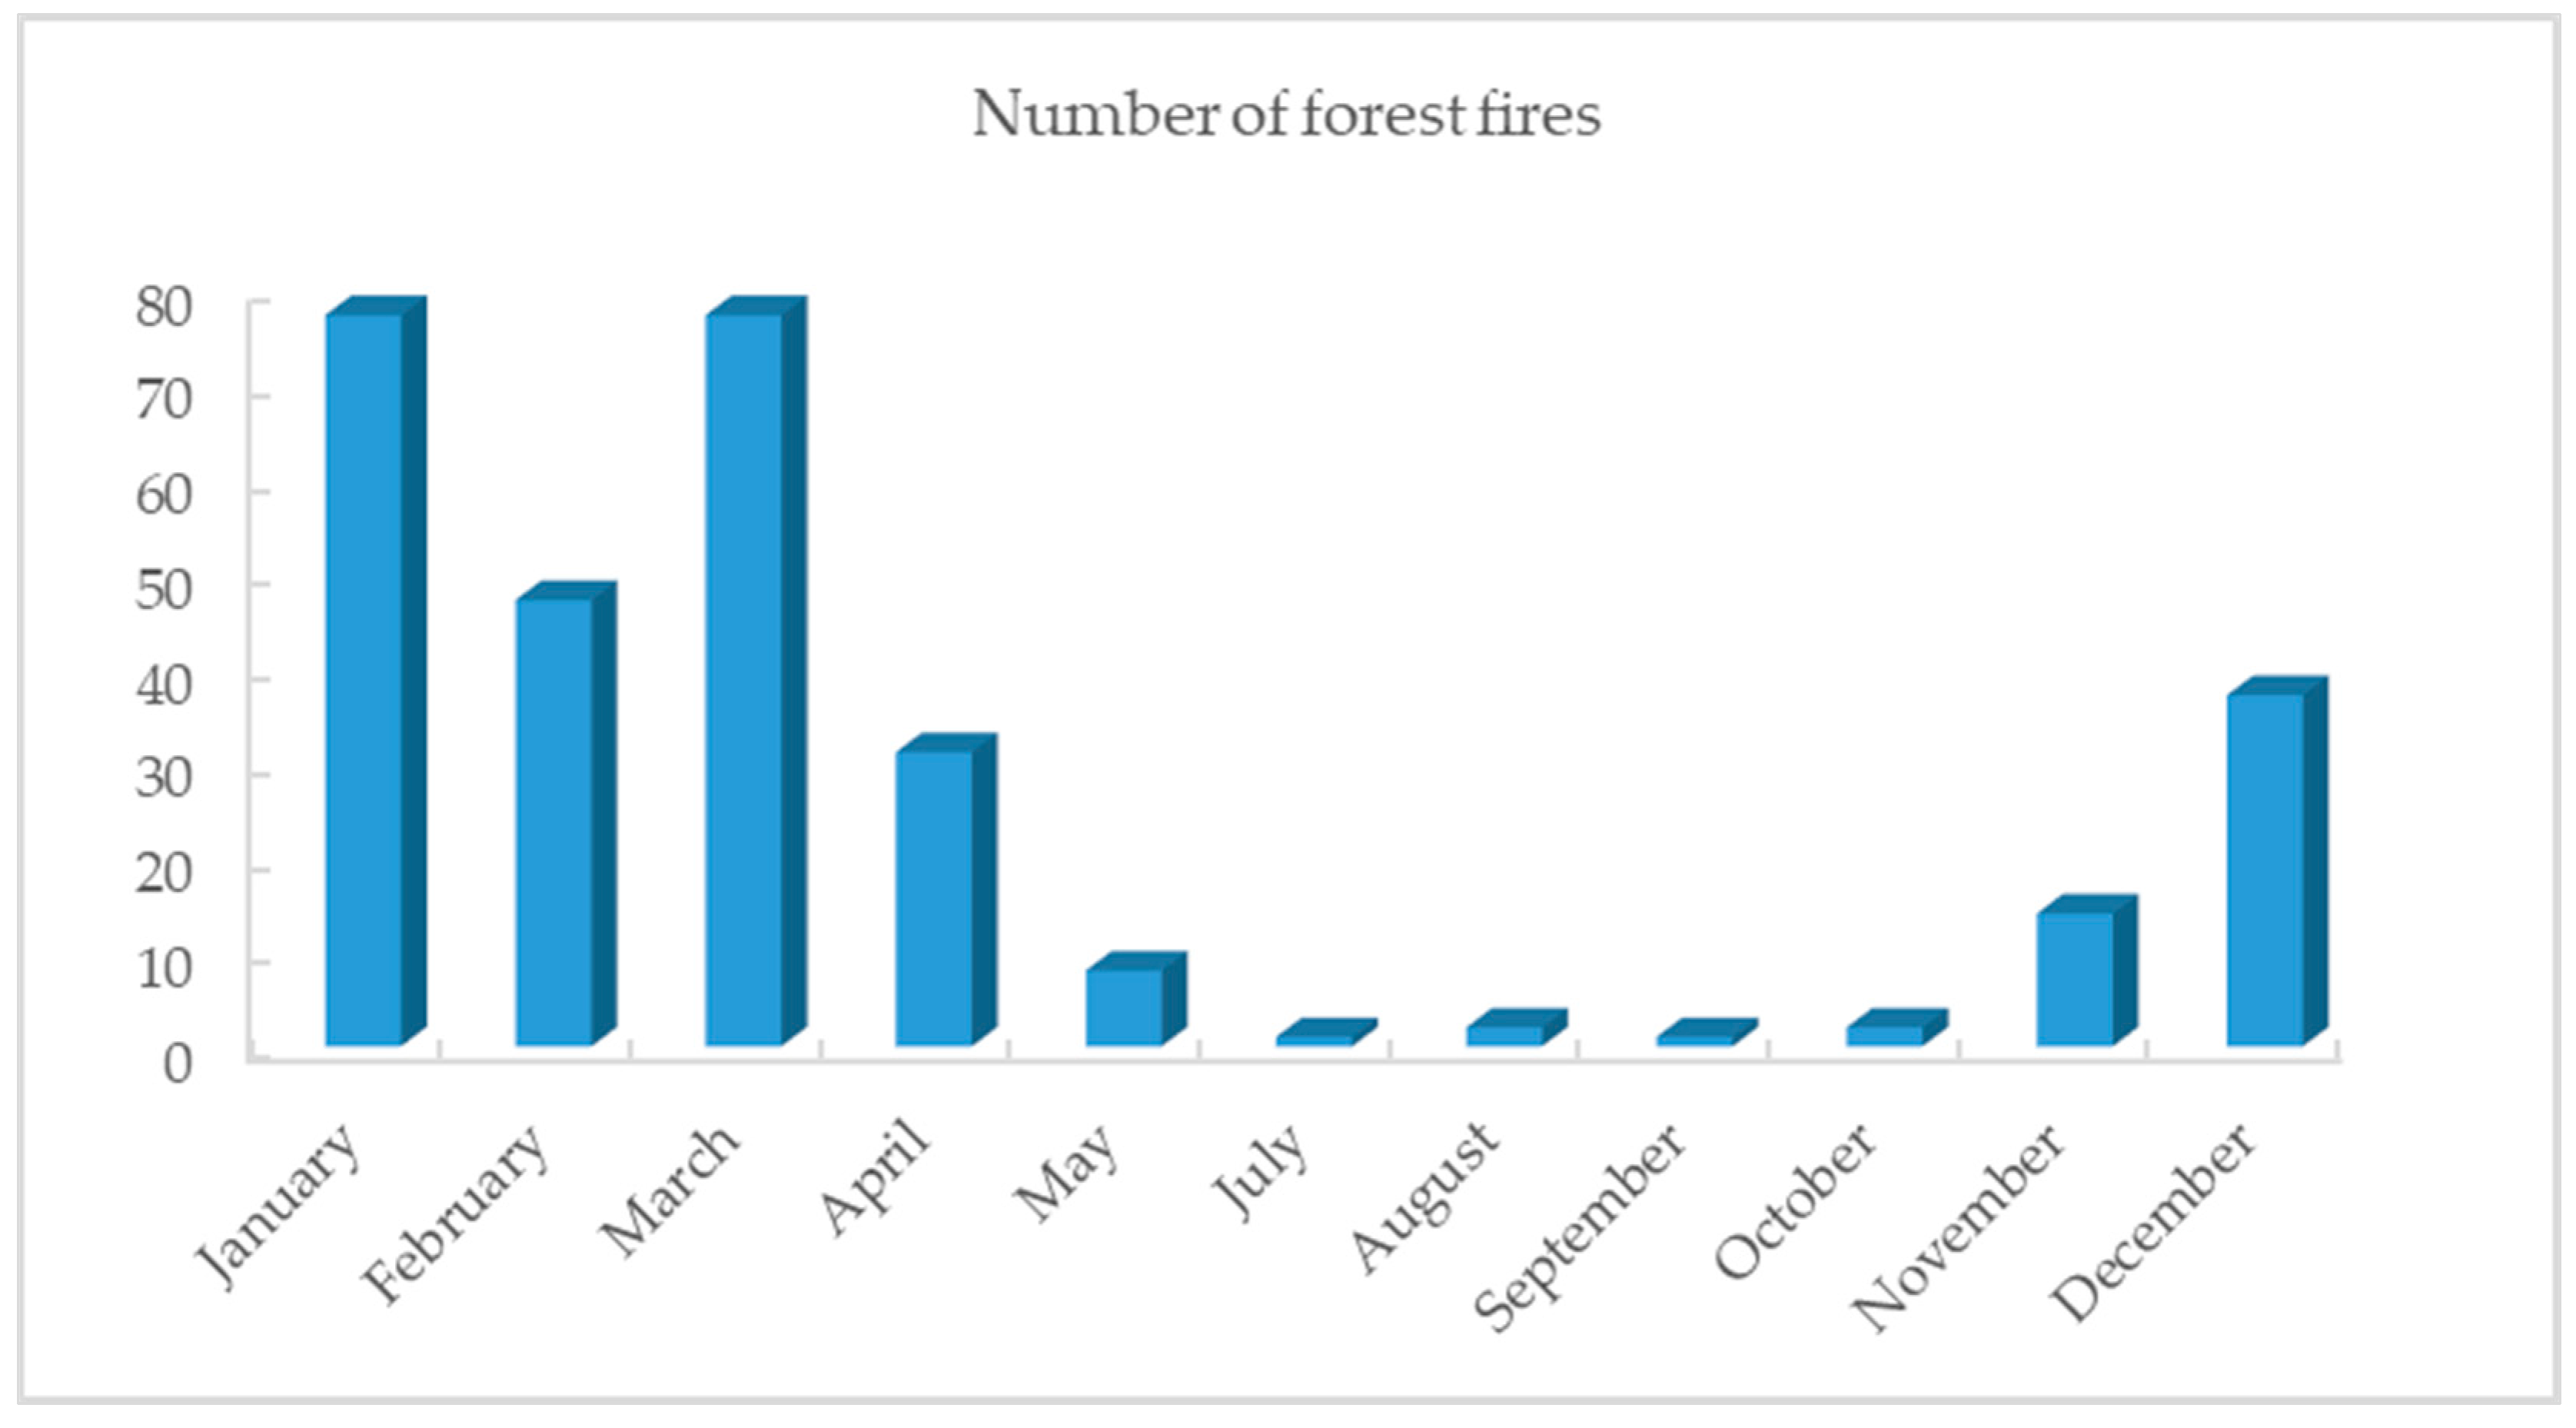
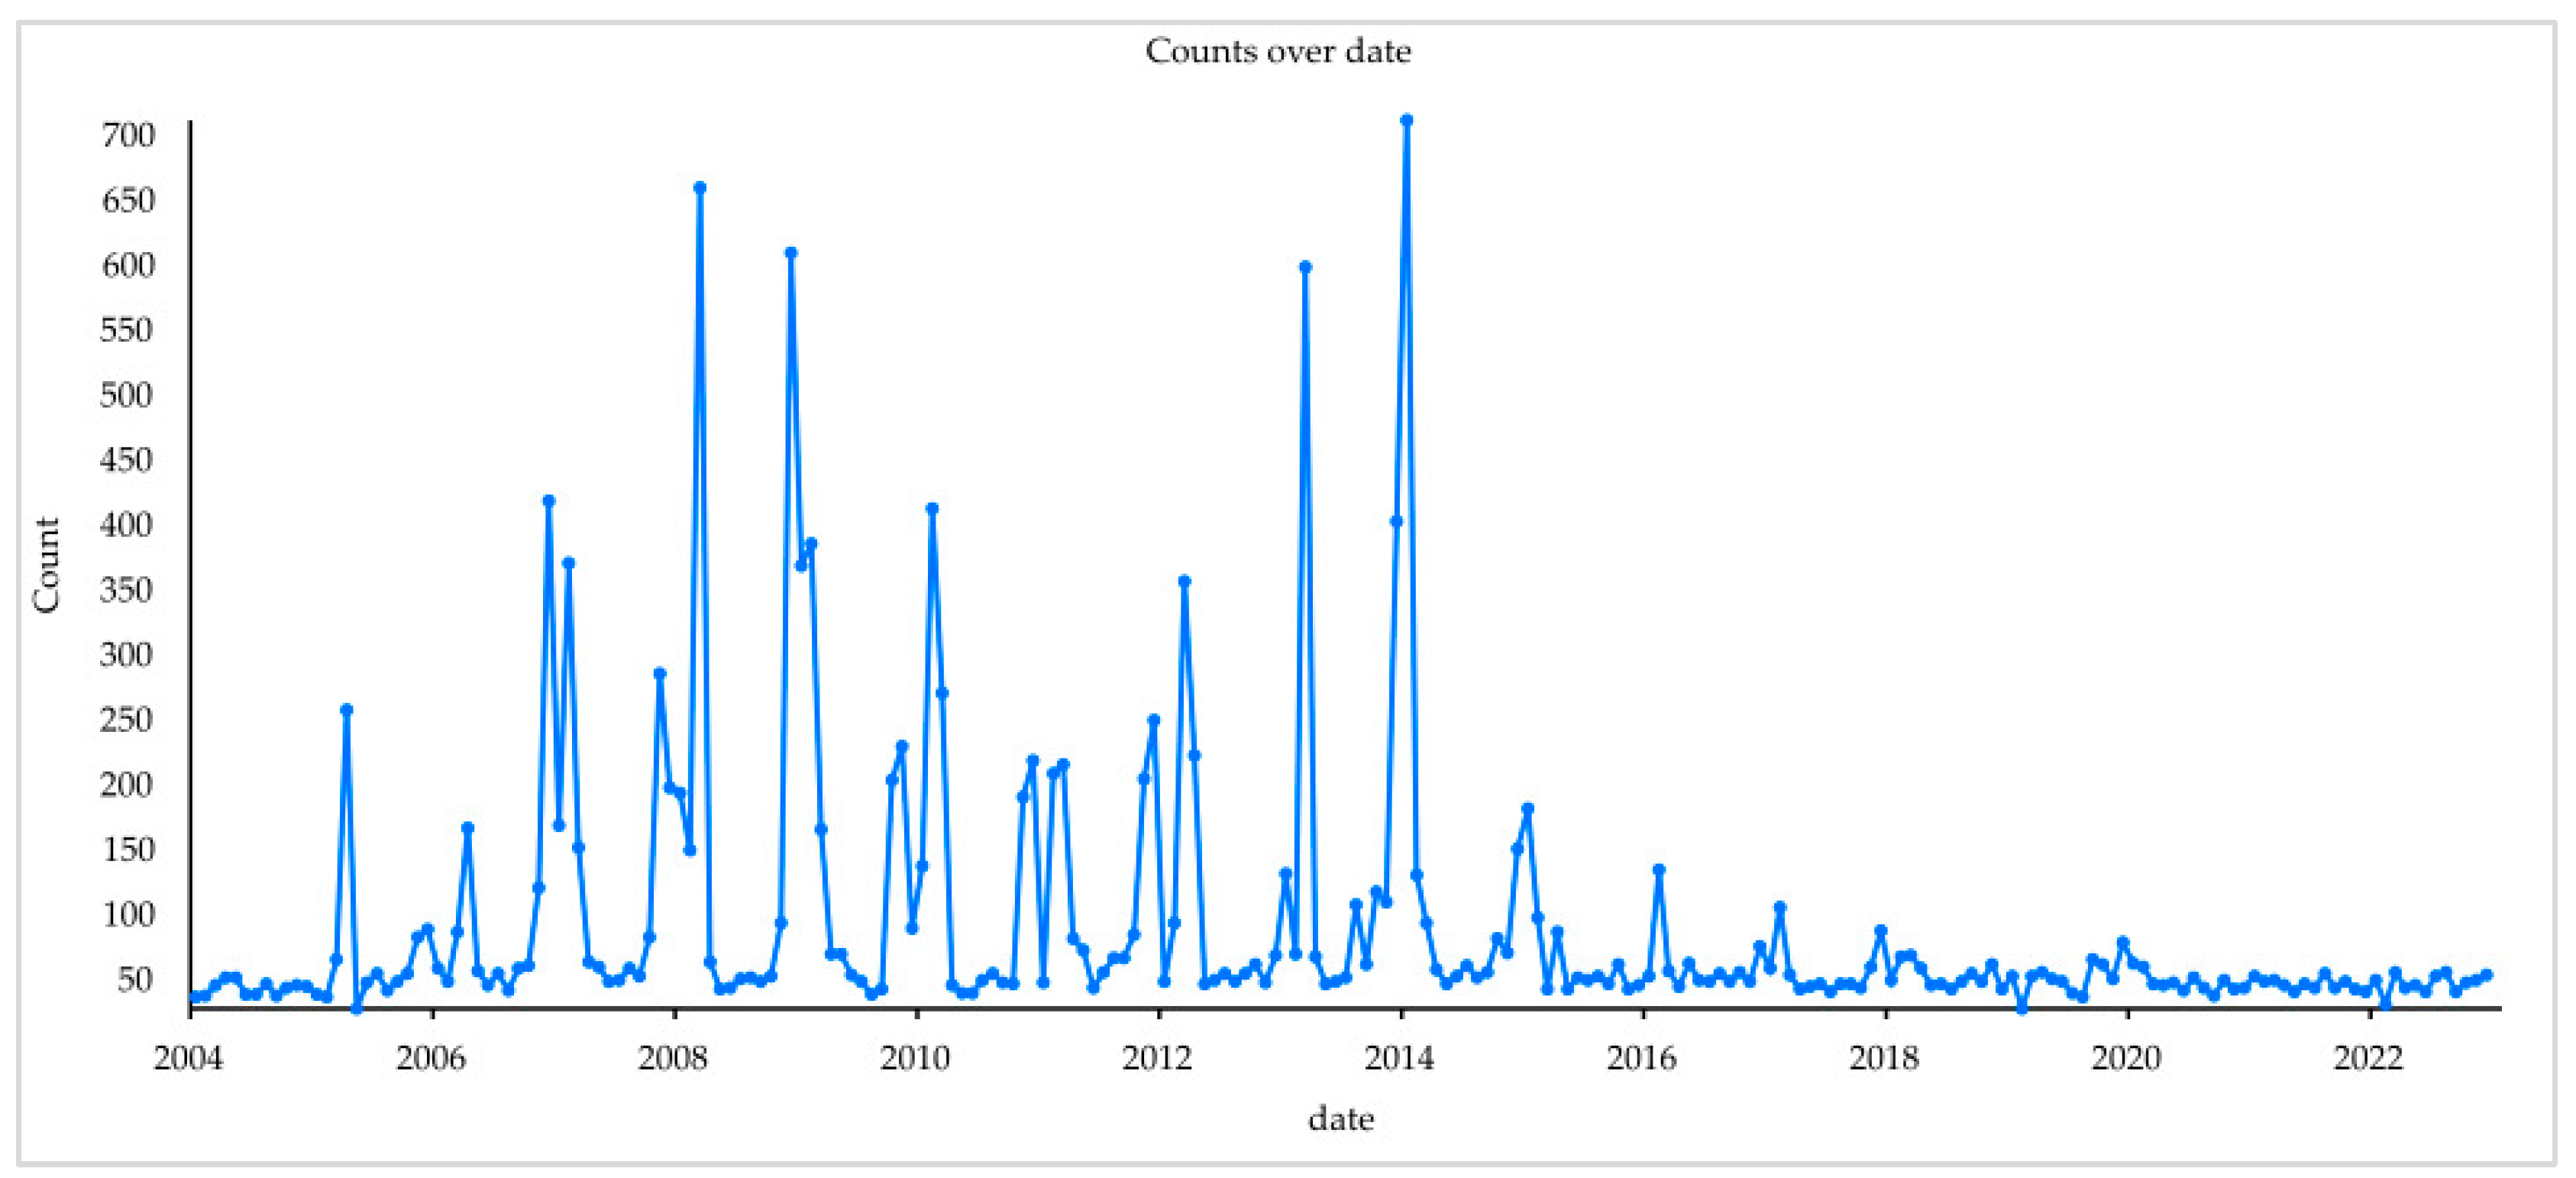
2.2.1. Fire Point Data
2.2.2. Data on Forest Fuels and Vegetation
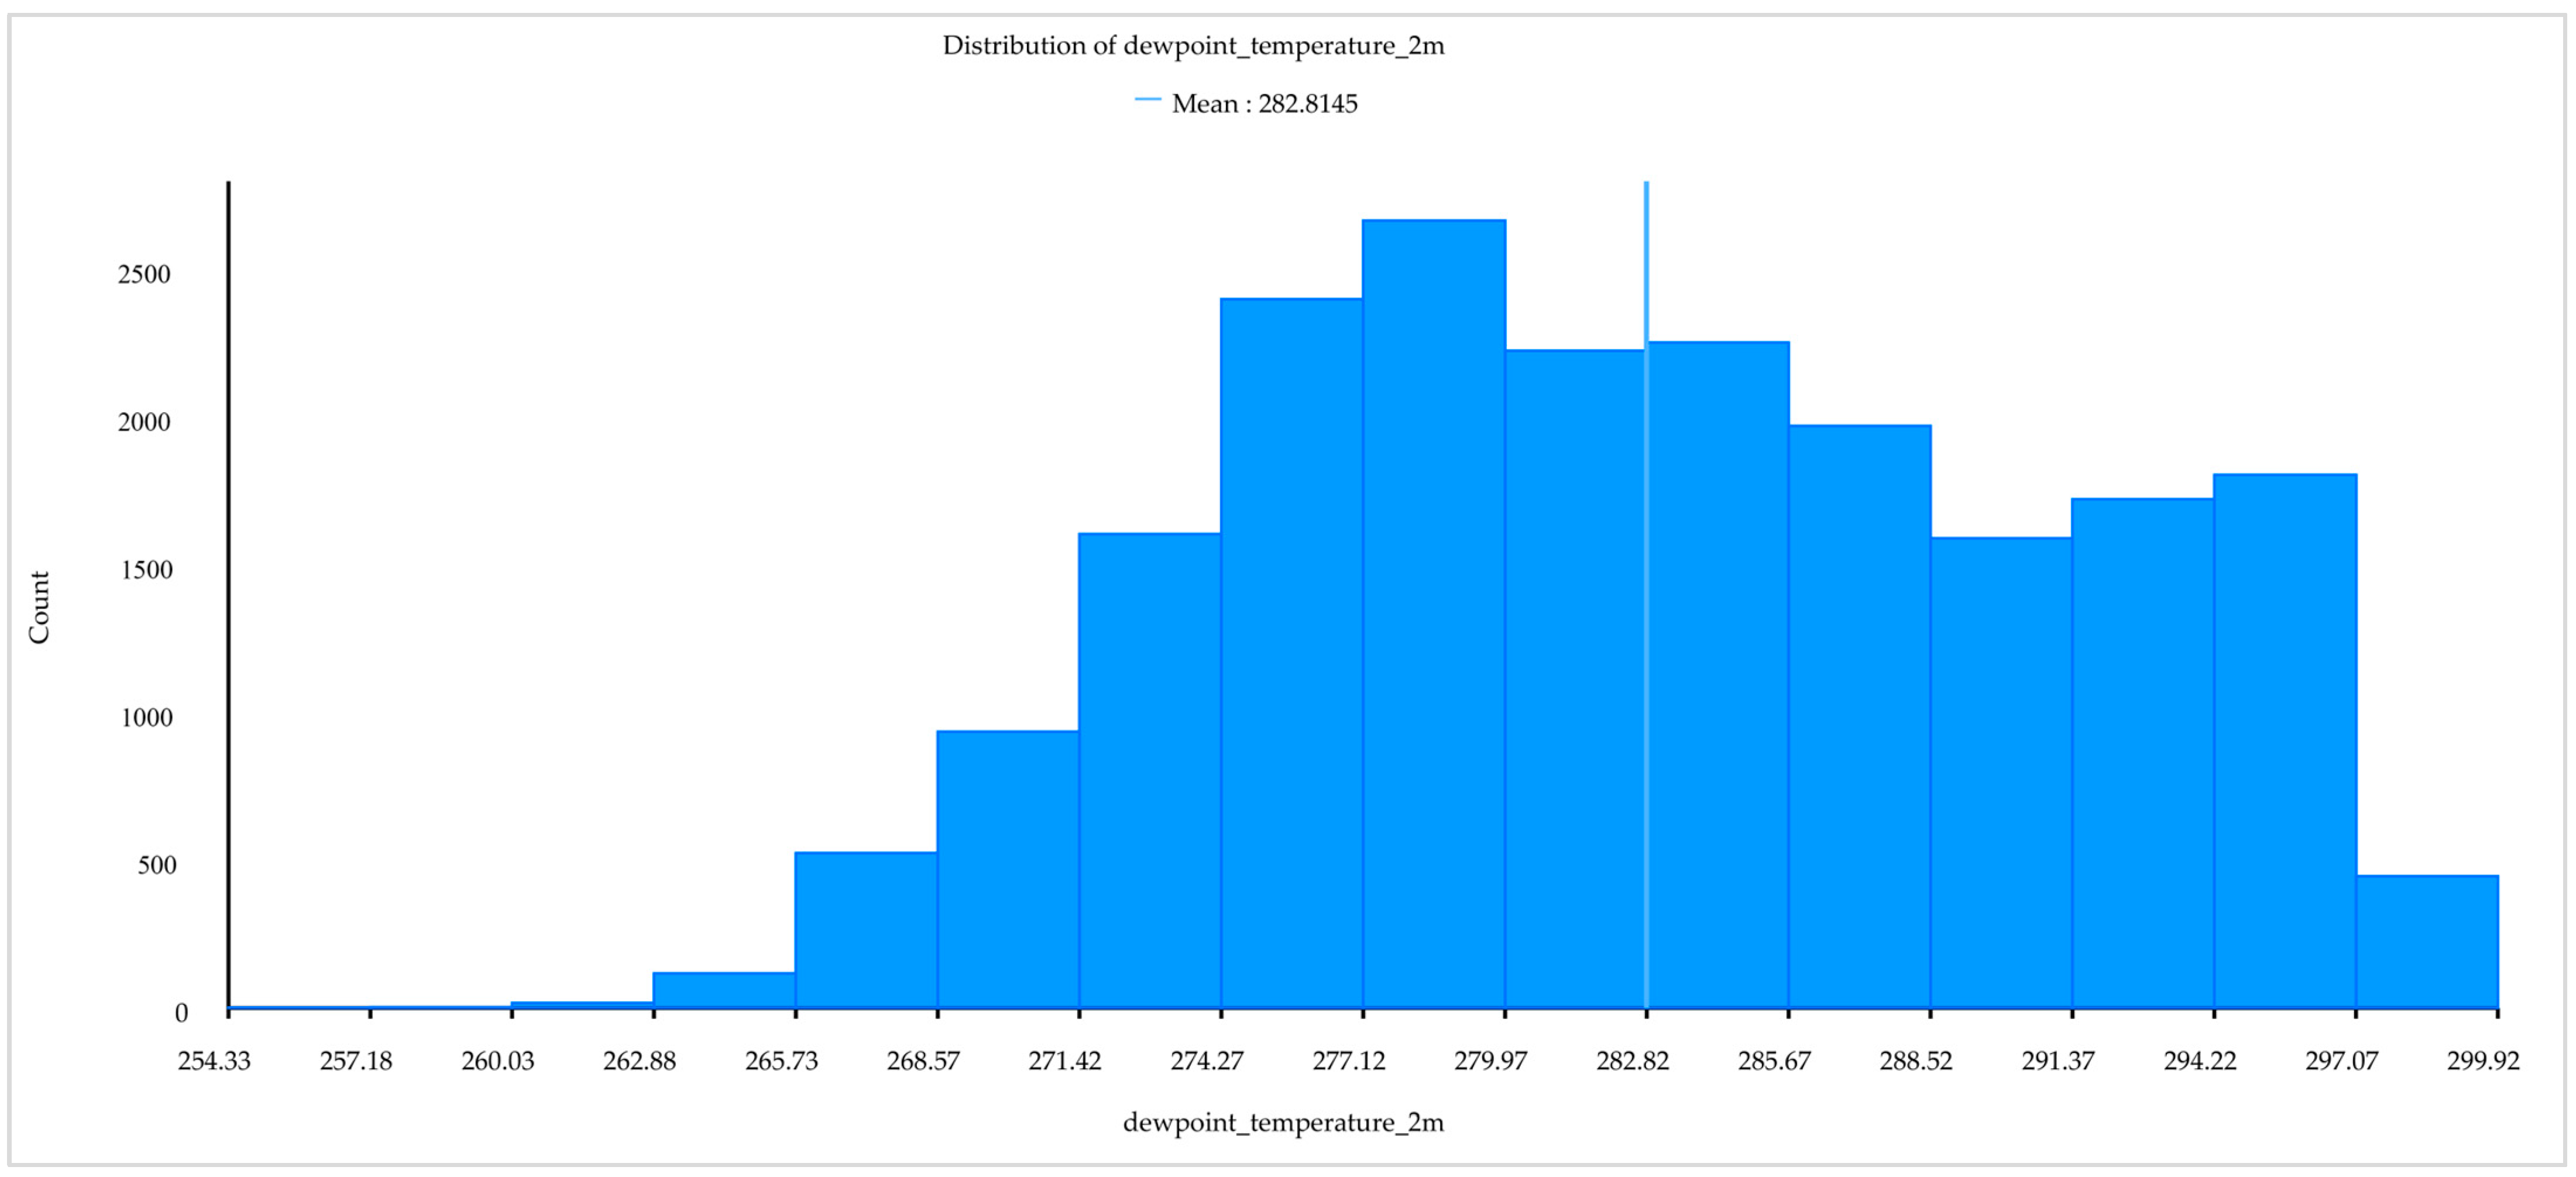
2.2.3. Meteorological Data
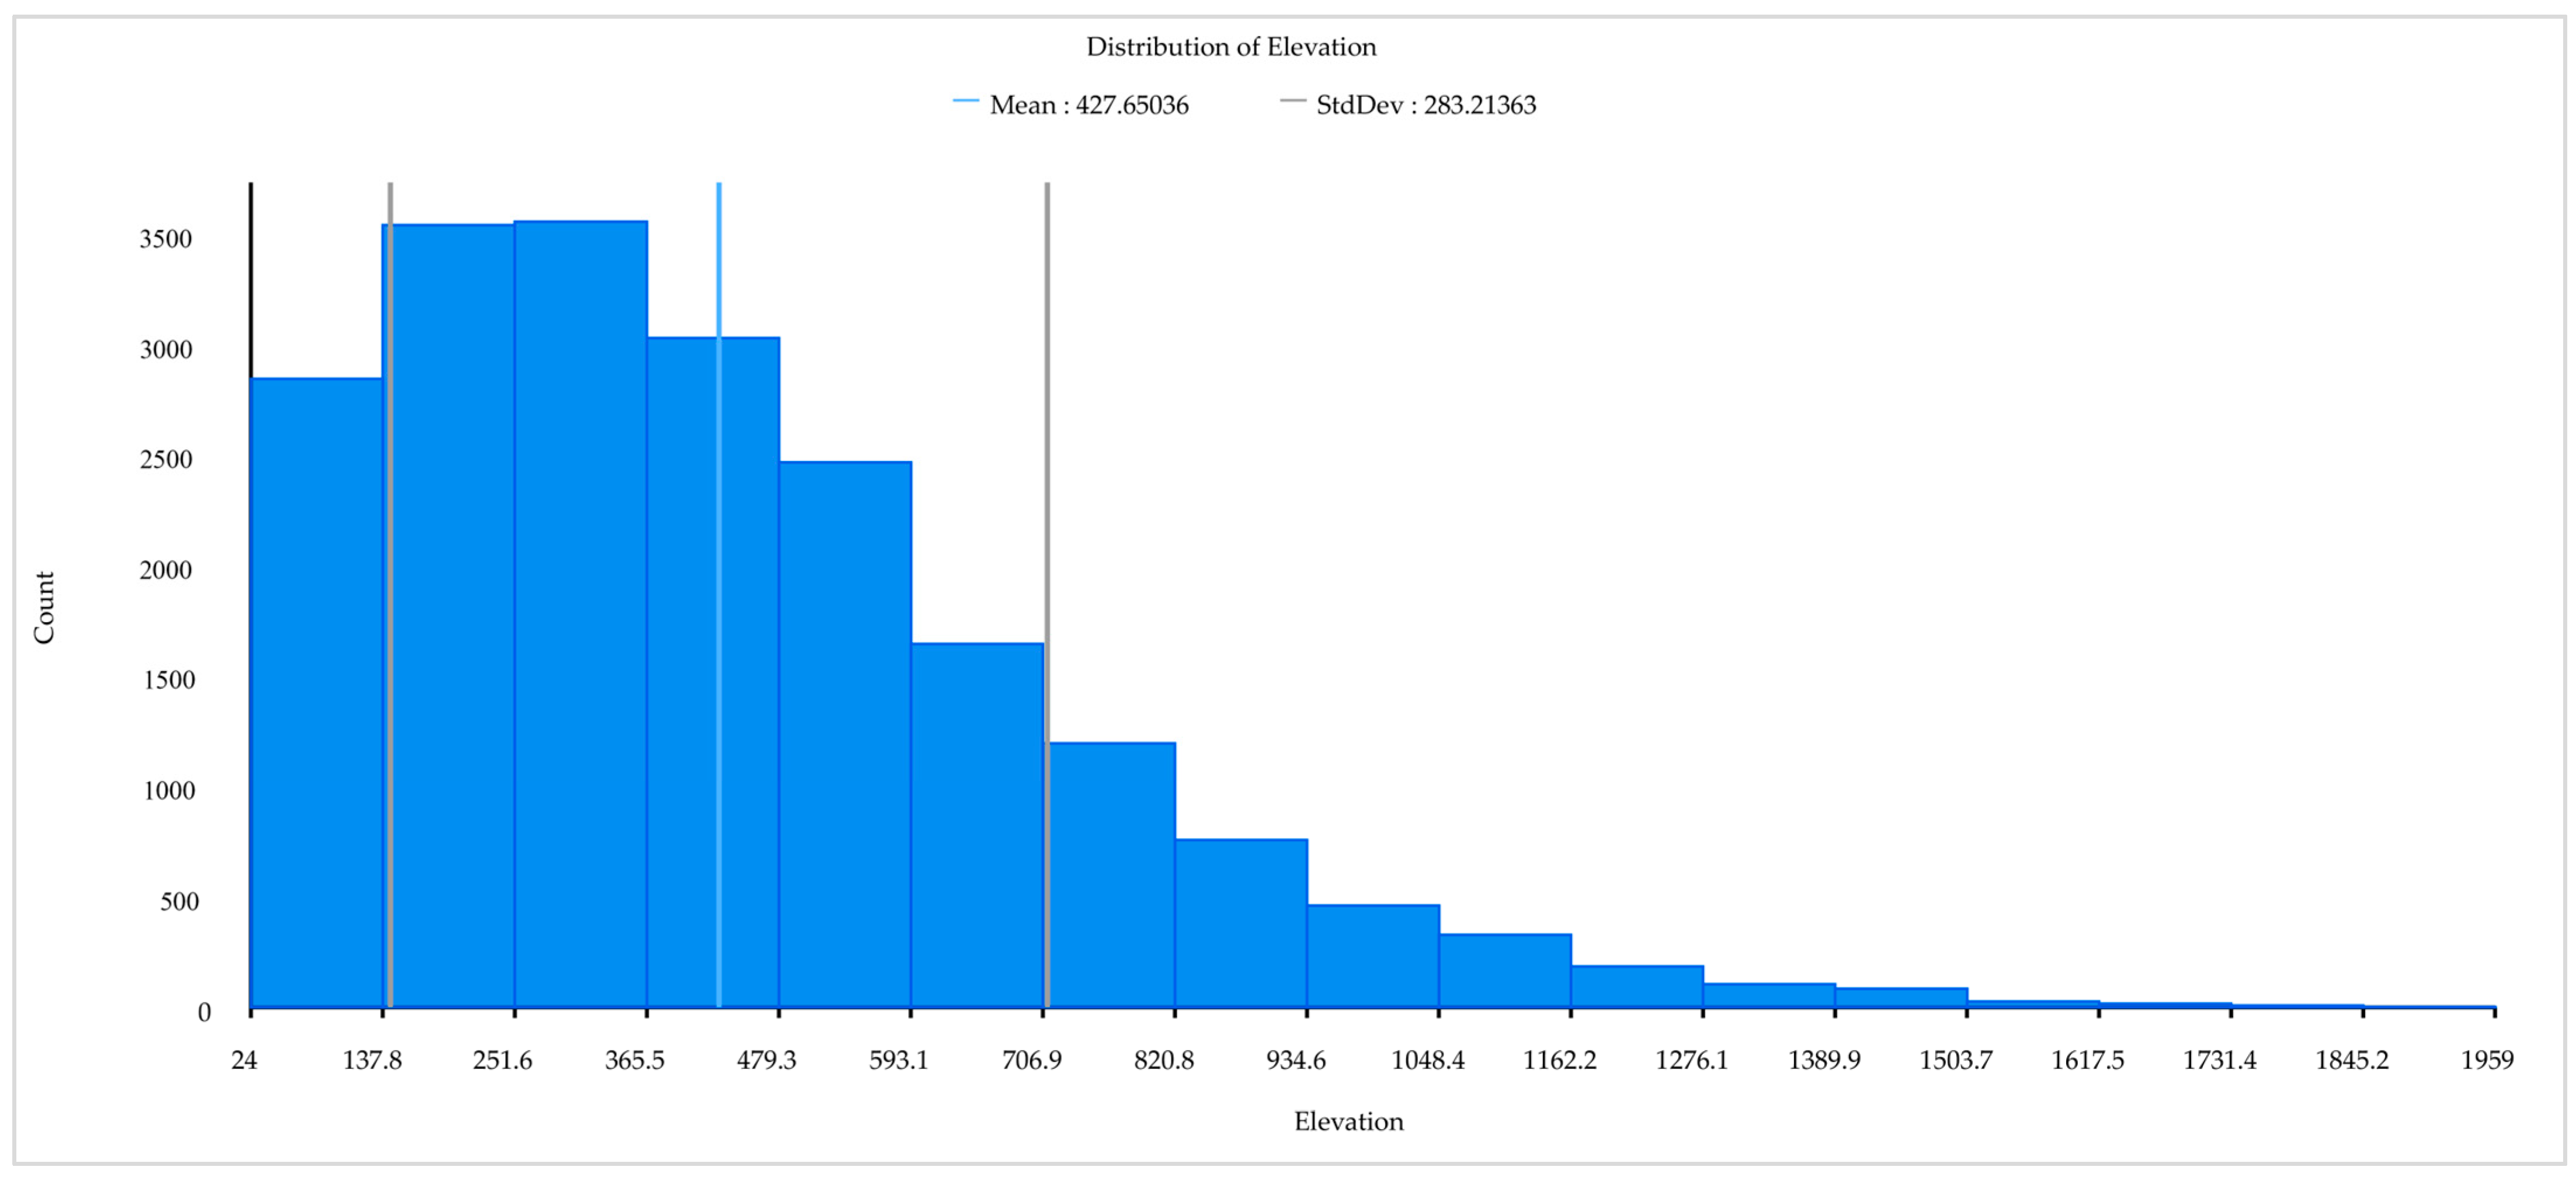
2.2.4. Topographical Data
2.2.5. Anthropogenic Activity Data
2.2.6. Predictors of Forest Fire Occurrence
2.3. Research Method
2.3.1. Adaptive Boosting Algorithm
2.3.2. Gradient Boosting Decision Tree Algorithm
2.3.3. Random Forest Algorithm
2.3.4. Inverse Distance Weight Interpolation Algorithm
2.3.5. Accuracy Evaluation
2.3.6. Evaluation of the Importance of Characteristic Factors
3. Results
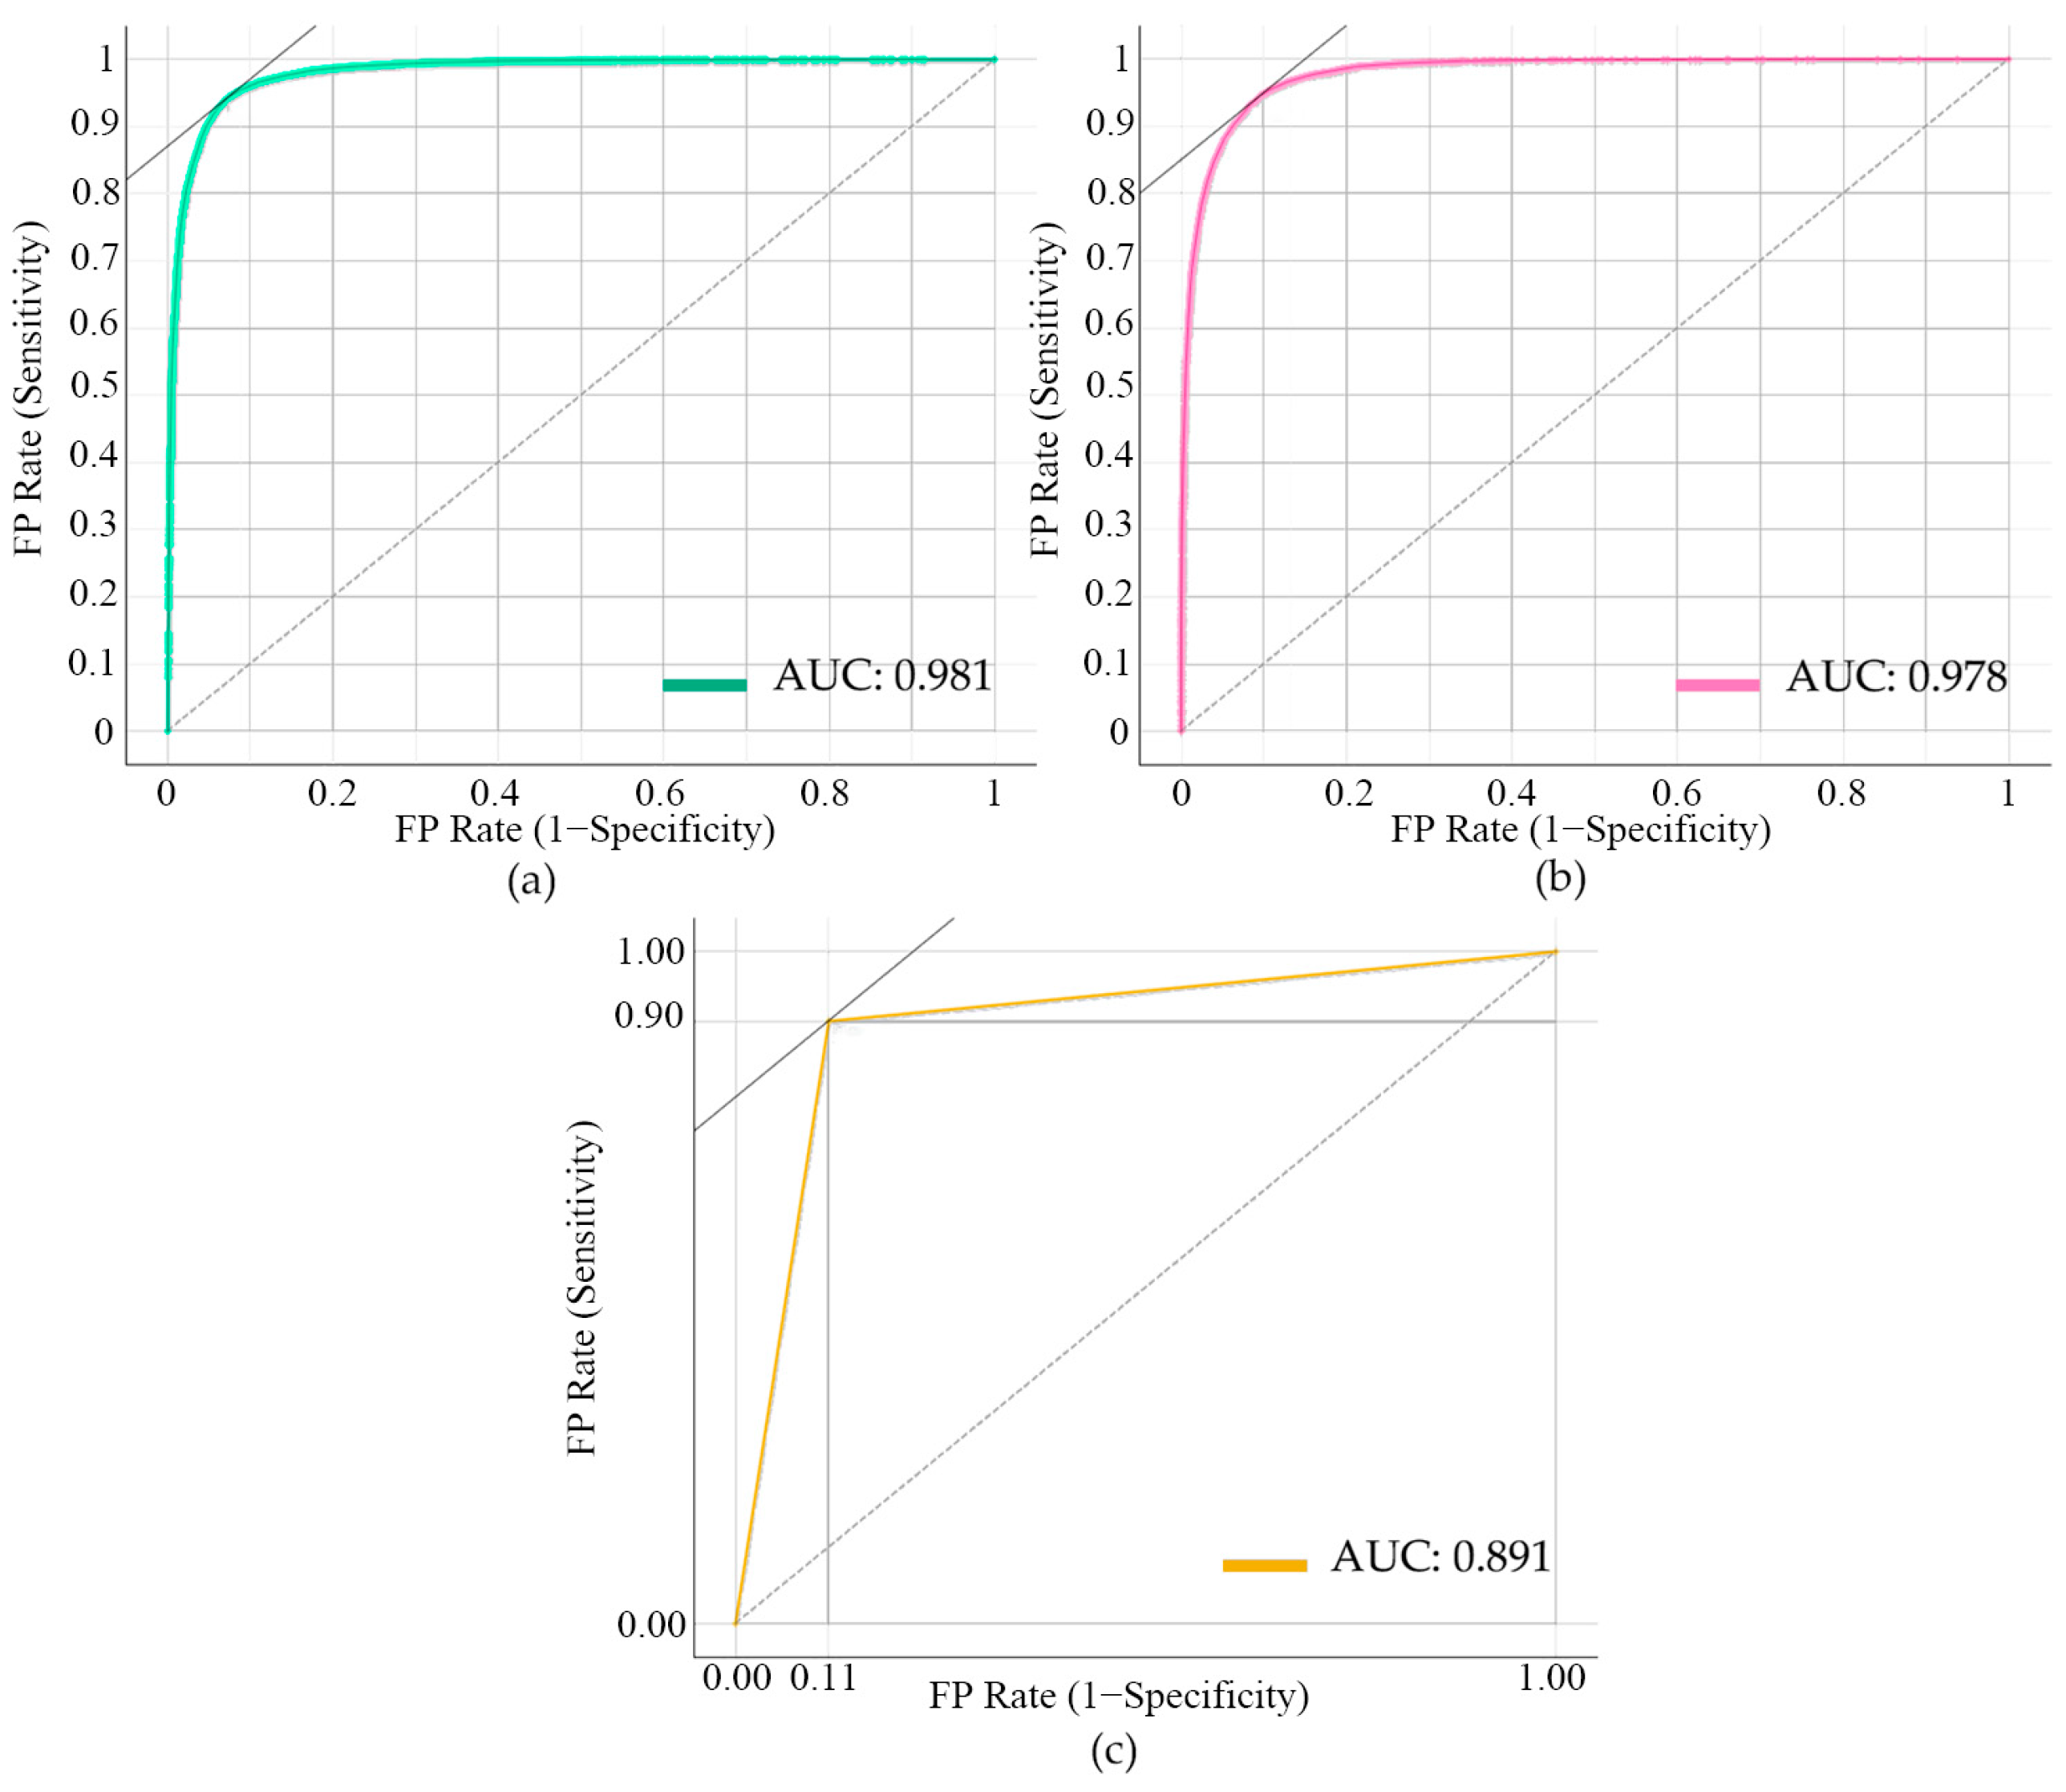
3.1. Model Accuracy Validation
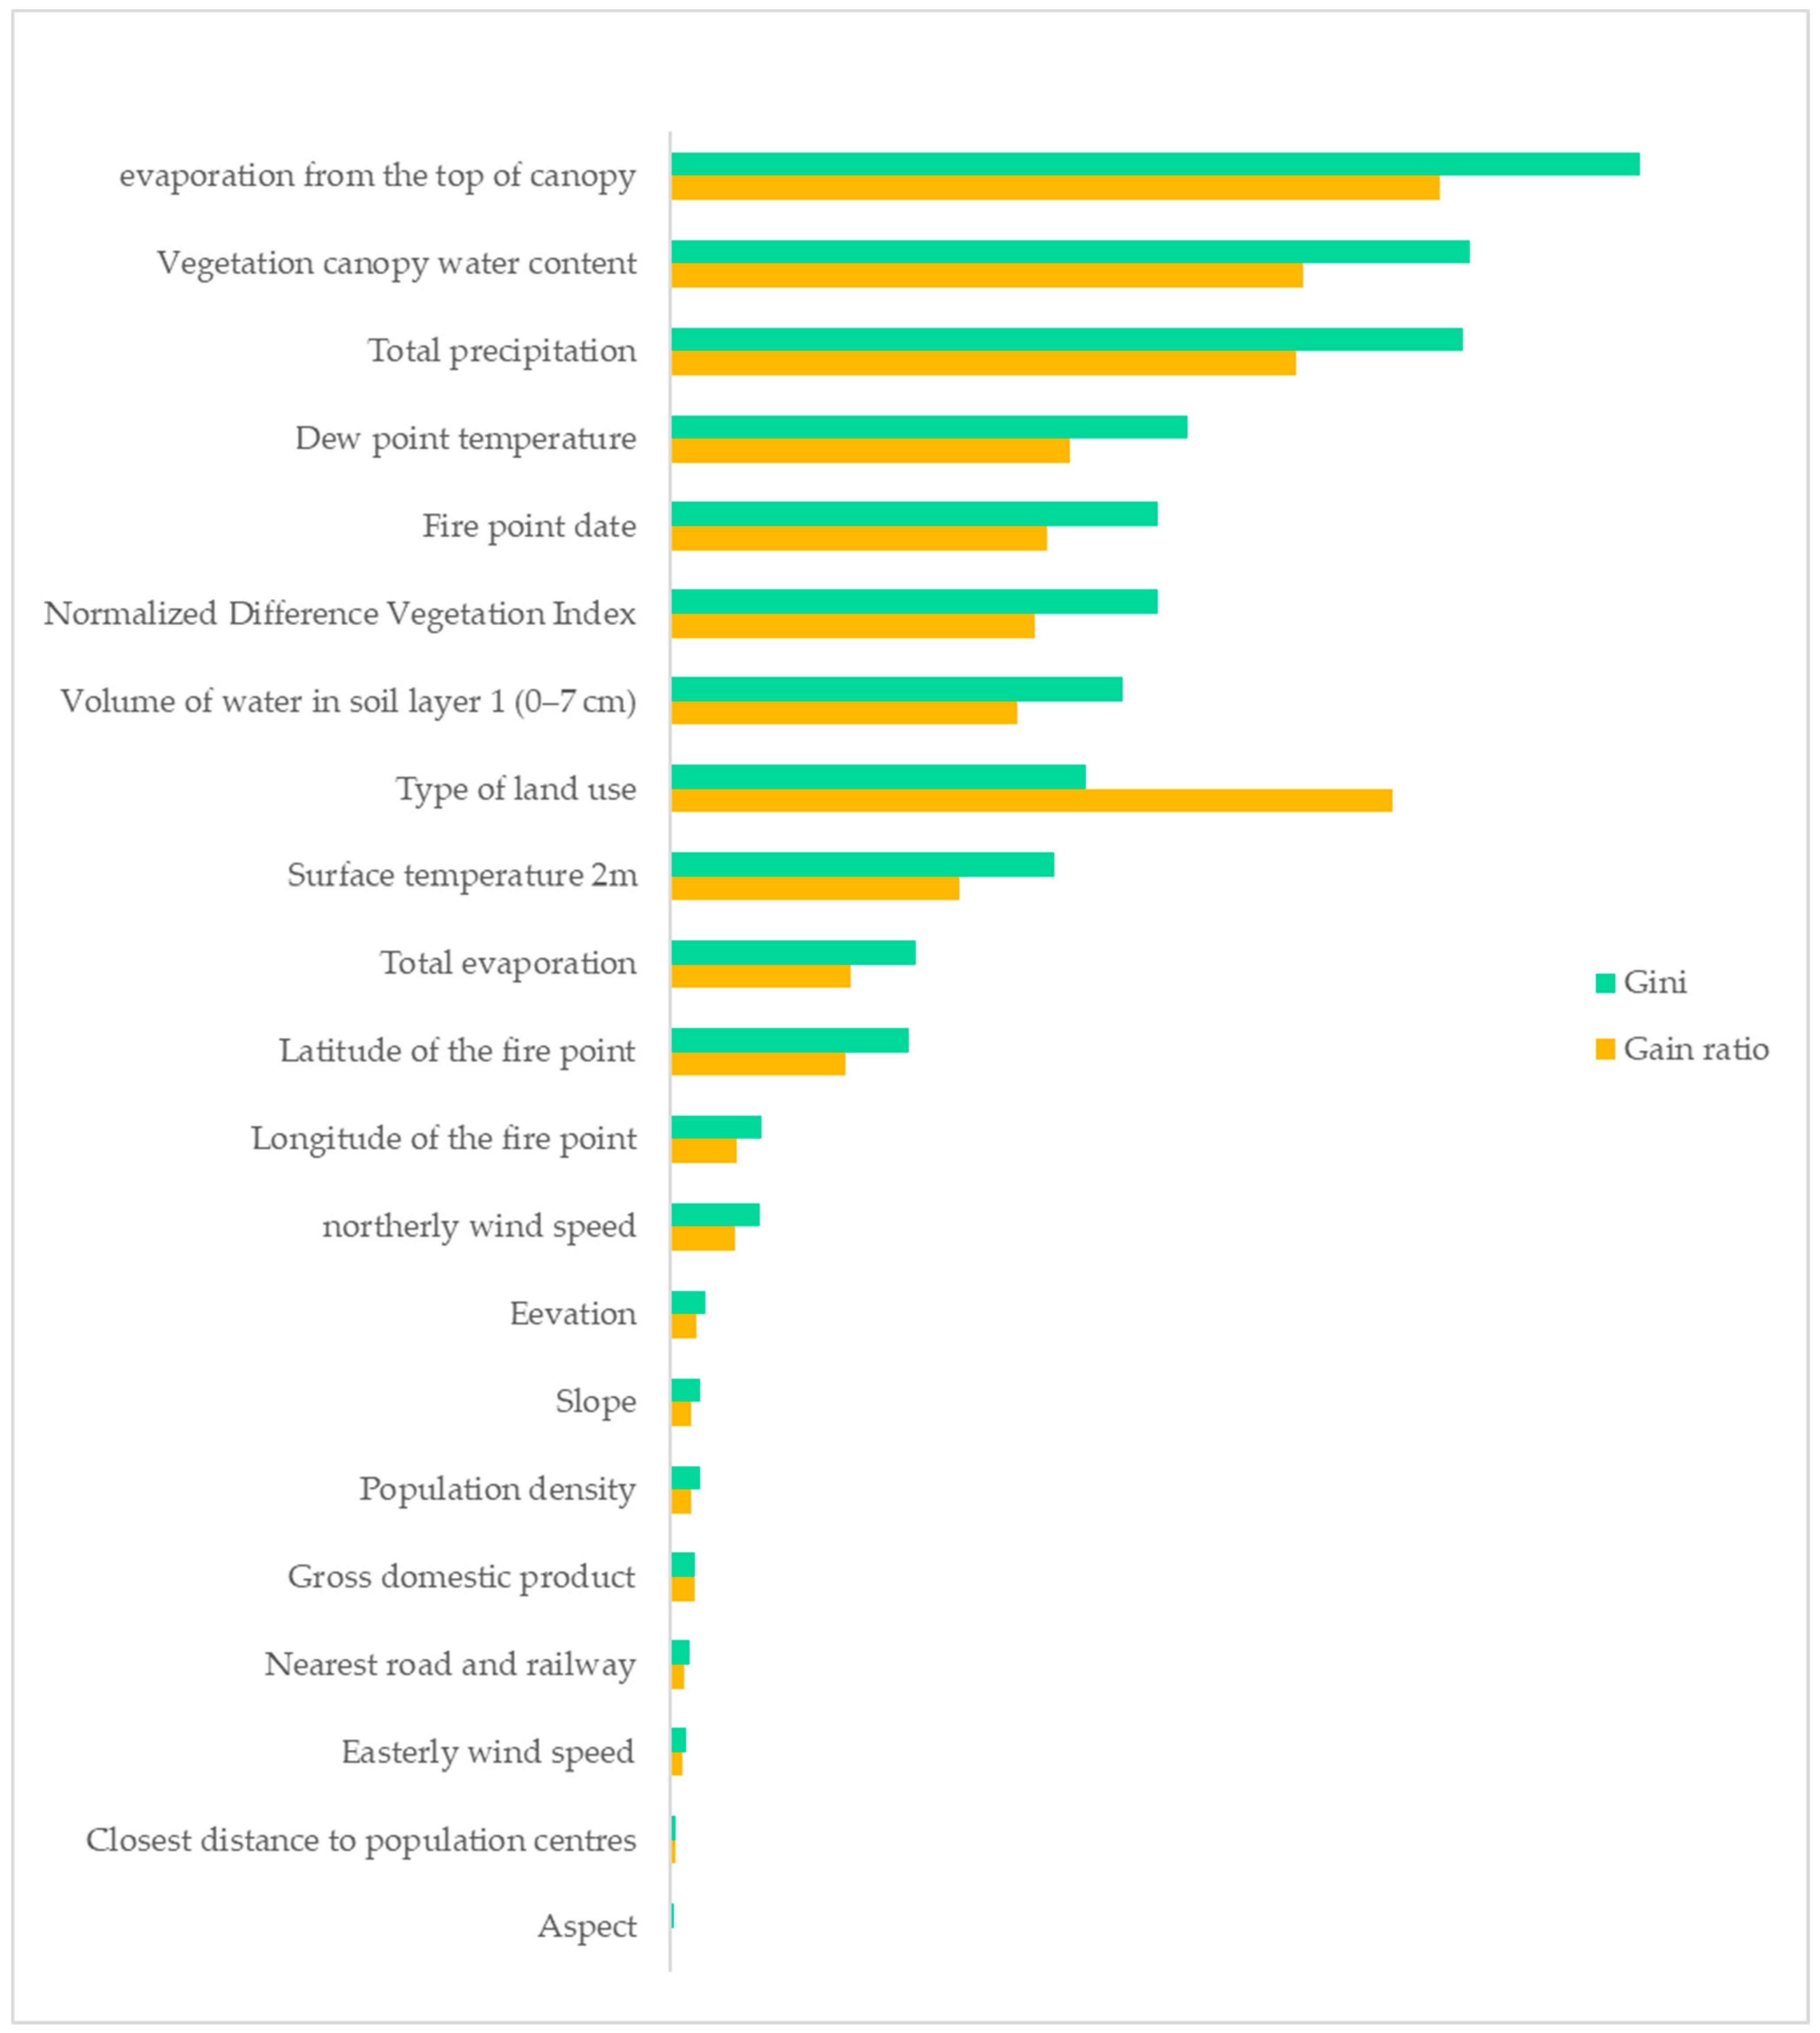
3.2. Characteristic Factor Importance Evaluation
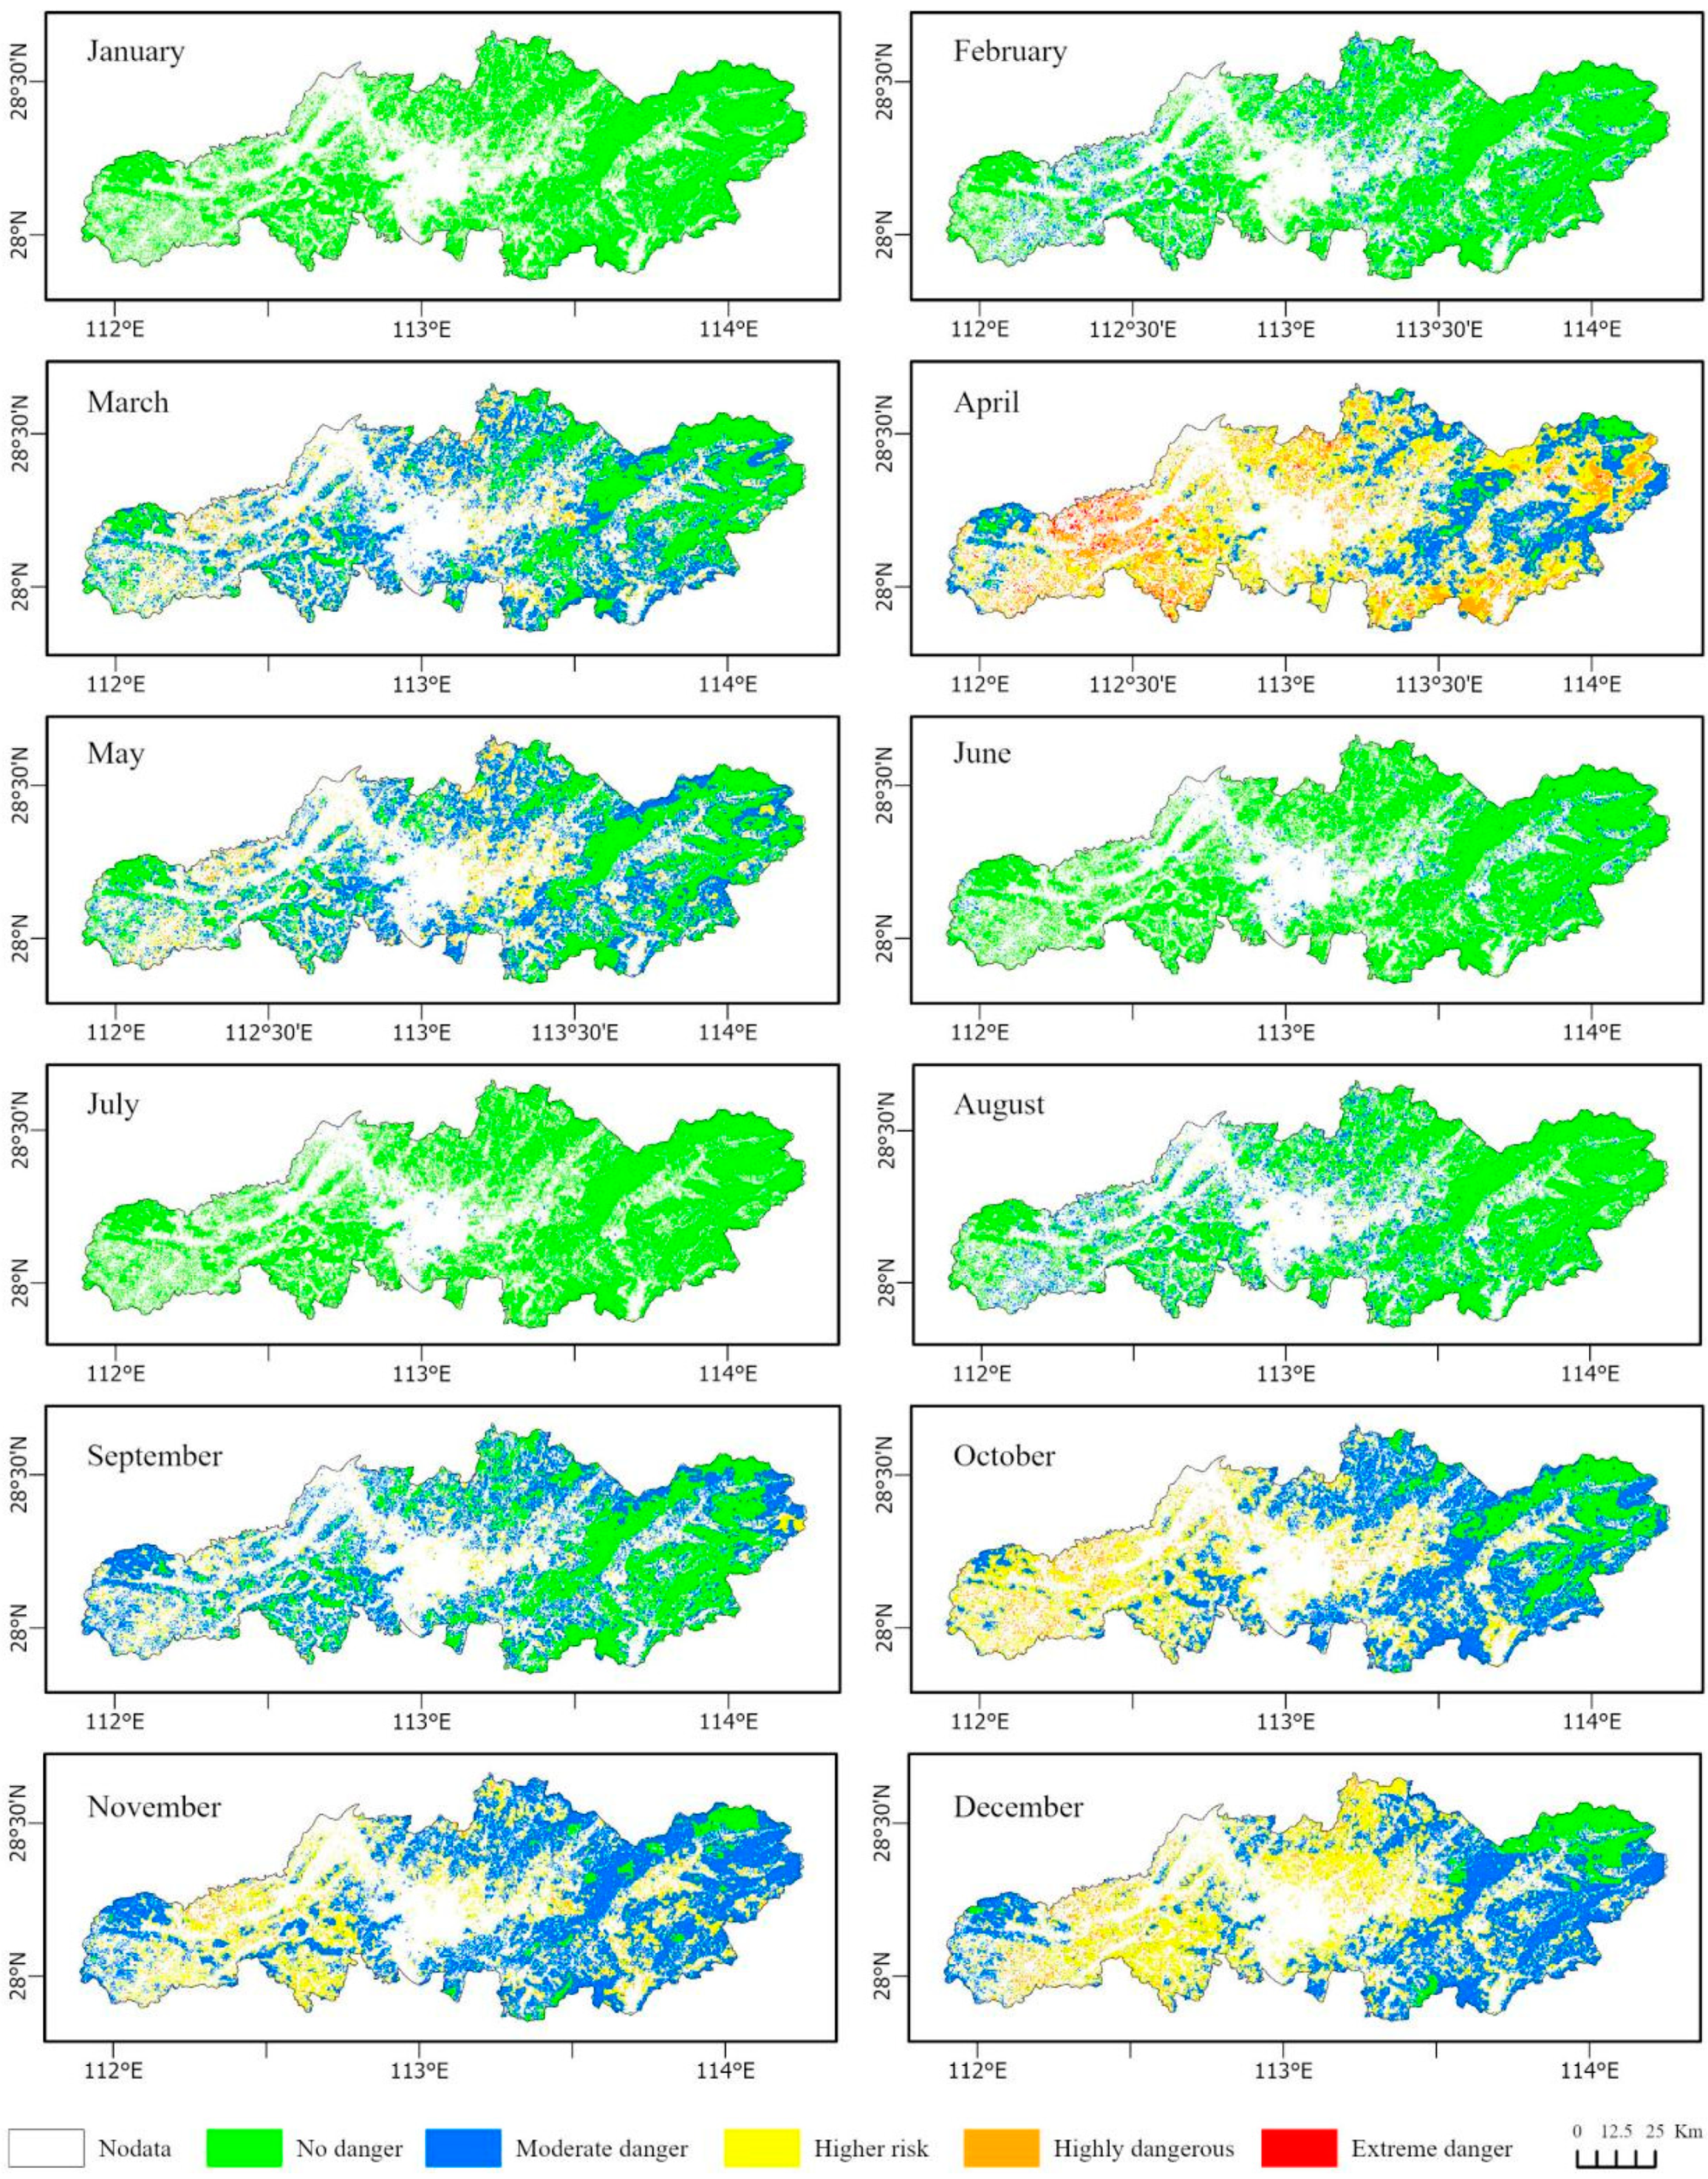
3.3. Mapping of Forest Fire Risk for Different Months
4. Discussion
5. Conclusions
Author Contributions
Funding
Data Availability Statement
Conflicts of Interest
References
- Clarke, H.; Nolan, R.H.; De Dios, V.R.; Bradstock, R.; Griebel, A.; Khanal, S.; Boer, M.M. Forest fire threatens global carbon sinks and population centres under rising atmospheric water demand. Nat. Commun. 2022, 13, 7161. [Google Scholar] [CrossRef] [PubMed]
- Xie, J.; Qi, T.; Hu, W.; Huang, H.; Chen, B.; Zhang, J. Retrieval of Live Fuel Moisture Content Based on Multi-Source Remote Sensing Data and Ensemble Deep Learning Model. Remote Sens. 2022, 14, 4378. [Google Scholar] [CrossRef]
- Justino, F.; Bromwich, D.H.; Schumacher, V.; Dasilva, A.; Wang, S.-H. Arctic Oscillation and Pacific-North American pattern dominated-modulation of fire danger and wildfire occurrence. NPJ Clim. Atmos. Sci. 2022, 5, 52. [Google Scholar] [CrossRef]
- Ma, W.; Feng, Z.; Cheng, Z.; Chen, S.; Wang, F. Identifying Forest Fire Driving Factors and Related Impacts in China Using Random Forest Algorithm. Forests 2020, 11, 507. [Google Scholar] [CrossRef]
- Tan, C.; Feng, Z. Mapping Forest Fire Risk Zones Using Machine Learning Algorithms in Hunan Province, China. Sustainability 2023, 15, 6292. [Google Scholar] [CrossRef]
- Pang, Y.; Li, Y.; Feng, Z.; Feng, Z.; Zhao, Z.; Chen, S.; Zhang, H. Forest Fire Occurrence Prediction in China Based on Machine Learning Methods. Remote Sens. 2022, 14, 5546. [Google Scholar] [CrossRef]
- Wang, L.; Quan, X.; He, B.; Yebra, M.; Xing, M.; Liu, X. Assessment of the dual polarimetric sentinel-1A data for forest fuel moisture content estimation. Remote Sens. 2019, 11, 1568. [Google Scholar] [CrossRef]
- White, D.A.; Balocchi-Contreras, F.; Silberstein, R.P.; de Arellano, P.R. The effect of wildfire on the structure and water balance of a high conservation value Hualo (Nothofagus glauca (Phil.) Krasser.) forest in central Chile. For. Ecol. Manag. 2020, 472, 118219. [Google Scholar] [CrossRef]
- Li, W.; Xu, Q.; Yi, J.; Liu, J. Predictive model of spatial scale of forest fire driving factors: A case study of Yunnan Province, China. Sci. Rep. 2022, 12, 19029. [Google Scholar] [CrossRef]
- Sun, J.; Qi, W.; Huang, Y.; Xu, C.; Yang, W. Facing the Wildfire Spread Risk Challenge: Where Are We Now and Where Are We Going? Fire 2023, 6, 228. [Google Scholar] [CrossRef]
- Rossa, C.G. The effect of fuel moisture content on the spread rate of forest fires in the absence of wind or slope. Int. J. Wildland Fire 2017, 26, 24–31. [Google Scholar] [CrossRef]
- Costa-Saura, J.M.; Balaguer-Beser, Á.; Ruiz, L.A.; Pardo-Pascual, J.E.; Soriano-Sancho, J.L. Empirical Models for Spatio-Temporal Live Fuel Moisture Content Estimation in Mixed Mediterranean Vegetation Areas Using Sentinel-2 Indices and Meteorological Data. Remote Sens. 2021, 13, 3726. [Google Scholar] [CrossRef]
- Konings, A.G.; Saatchi, S.S.; Frankenberg, C.; Keller, M.; Leshyk, V.; Anderegg, W.R.L.; Humphrey, V.; Matheny, A.M.; Trugman, A.; Sack, L.; et al. Detecting forest response to droughts with global observations of vegetation water content. Glob. Chang. Biol. 2021, 27, 6005–6024. [Google Scholar] [CrossRef] [PubMed]
- Luo, K.; Quan, X.; He, B.; Yebra, M. Effects of Live Fuel Moisture Content on Wildfire Occurrence in Fire-Prone Regions over Southwest China. Forests 2019, 10, 887. [Google Scholar] [CrossRef]
- Canadell, J.G.; Meyer, C.P.; Cook, G.D.; Dowdy, A.; Briggs, P.R.; Knauer, J.; Pepler, A.; Haverd, V. Multi-decadal increase of forest burned area in Australia is linked to climate change. Nat. Commun. 2021, 12, 6921. [Google Scholar] [CrossRef]
- Chuvieco, E.; González, I.; Verdú, F.; Aguado, I.; Yebra, M. Prediction of fire occurrence from live fuel moisture content measurements in a Mediterranean ecosystem. Int. J. Wildland Fire 2009, 18, 430–441. [Google Scholar] [CrossRef]
- Yin, S.; Shan, Y.; Tang, S.; Douglas, G.; Yu, B.; Cui, C.; Cao, L. Study on the Limit of Moisture Content of Smoldering Humus during Sub-Surface Fires in the Boreal Forests of China. Forests 2023, 14, 252. [Google Scholar] [CrossRef]
- Lehmann, C.E.R.; Anderson, T.M.; Sankaran, M.; Higgins, S.I.; Archibald, S.; Hoffmann, W.A.; Hanan, N.P.; Williams, R.J.; Fensham, R.J.; Felfili, J.; et al. Savanna Vegetation-Fire-Climate Relationships Differ Among Continents. Science 2014, 343, 548–552. [Google Scholar] [CrossRef] [PubMed]
- Zhang, H.; Qi, P.; Guo, G. Improvement of fire danger modelling with geographically weighted logistic model. Int. J. Wildland Fire 2014, 23, 1130–1146. [Google Scholar] [CrossRef]
- Fang, L.; Yang, J.; Zu, J.; Li, G.; Zhang, J. Quantifying influences and relative importance of fire weather, topography, and vegetation on fire size and fire severity in a Chinese boreal forest landscape. For. Ecol. Manag. 2015, 356, 2–12. [Google Scholar] [CrossRef]
- Fan-Hua, K.; Xiu-Zhen, L.; Hai-Wei, Y. Landscape change on burned blanks in Daxing’s Mountains. J. For. Res. 2004, 15, 33–38. [Google Scholar] [CrossRef]
- Akther, M.S.; Hassan, Q.K. Remote sensing-based assessment of fire danger conditions over boreal forest. IEEE J. Sel. Top. Appl. Earth Obs. Remote Sens. 2011, 4, 992–999. [Google Scholar] [CrossRef]
- Fry, D.L.; Stephens, S.L. Influence of humans and climate on the fire history of a ponderosa pine-mixed conifer forest in the southeastern Klamath Mountains, California. For. Ecol. Manag. 2006, 223, 428–438. [Google Scholar] [CrossRef]
- Williams, A.P.; Abatzoglou, J.T.; Gershunov, A.; Guzman-Morales, J.; Bishop, D.A.; Balch, J.K.; Lettenmaier, D.P. Observed Impacts of Anthropogenic Climate Change on Wildfire in California. Earths Futur. 2019, 7, 892–910. [Google Scholar] [CrossRef]
- He, W.; Shirowzhan, S.; Pettit, C.J. GIS and Machine Learning for Analysing Influencing Factors of Bushfires Using 40-Year Spatio-Temporal Bushfire Data. ISPRS Int. J. Geo Inf. 2022, 11, 336. [Google Scholar] [CrossRef]
- Sun, L.; Yang, L.; Xia, X.; Wang, D.; Zhang, T. Climatological Aspects of Active Fires in Northeastern China and Their Relationship to Land Cover. Remote Sens. 2022, 14, 2316. [Google Scholar] [CrossRef]
- Kumari, B.; Pandey, A.C. MODIS based forest fire hotspot analysis and its relationship with climatic variables. Spat. Inf. Res. 2019, 28, 87–99. [Google Scholar] [CrossRef]
- Rodrigues, M.; De la Riva, J. An insight into machine-learning algorithms to model human-caused wildfire occurrence. Environ. Model. Softw. 2014, 57, 192–201. [Google Scholar] [CrossRef]
- Nami, M.H.; Jaafari, A.; Fallah, M.; Nabiuni, S. Spatial prediction of wildfire probability in the Hyrcanian ecoregion using evidential belief function model and GIS. Int. J. Environ. Sci. Technol. 2017, 15, 373–384. [Google Scholar] [CrossRef]
- Pourtaghi, Z.S.; Pourghasemi, H.R.; Aretano, R.; Semeraro, T. Investigation of general indicators influencing on forest fire and its susceptibility modeling using different data mining techniques. Ecol. Indic. 2016, 64, 72–84. [Google Scholar] [CrossRef]
- Jaafari, A.; Gholami, D.M.; Zenner, E.K. A Bayesian modeling of wildfire probability in the Zagros Mountains, Iran. Ecol. Inform. 2017, 39, 32–44. [Google Scholar] [CrossRef]
- Hong, H.; Panahi, M.; Shirzadi, A.; Ma, T.; Liu, J.; Zhu, A.-X.; Chen, W.; Kougias, I.; Kazakis, N. Flood susceptibility assessment in Hengfeng area coupling adaptive neuro-fuzzy inference system with genetic algorithm and differential evolution. Sci. Total. Environ. 2017, 621, 1124–1141. [Google Scholar] [CrossRef] [PubMed]
- Termeh, S.V.R.; Kornejady, A.; Pourghasemi, H.R.; Keesstra, S. Flood susceptibility mapping using novel ensembles of adaptive neuro fuzzy inference system and metaheuristic algorithms. Sci. Total. Environ. 2018, 615, 438–451. [Google Scholar] [CrossRef]
- Guo, F.; Zhang, L.; Jin, S.; Tigabu, M.; Su, Z.; Wang, W. Modeling Anthropogenic Fire Occurrence in the Boreal Forest of China Using Logistic Regression and Random Forests. Forests 2016, 7, 250. [Google Scholar] [CrossRef]
- Rosadi, D.; Andriyani, W.; Arisanty, D.; Agustina, D. Prediction of Forest Fire using Hybrid SOM-AdaBoost Method. In Journal of Physics: Conference Series; IOP Publishing: Bristol, UK, 2021. [Google Scholar]
- Coughlan, R.; Di Giuseppe, F.; Vitolo, C.; Barnard, C.; Lopez, P.; Drusch, M. Using machine learning to predict fire-ignition occurrences from lightning forecasts. Meteorol. Appl. 2021, 28, e1973. [Google Scholar] [CrossRef]
- He, Q.; Jiang, Z.; Wang, M.; Liu, K. Landslide and Wildfire Susceptibility Assessment in Southeast Asia Using Ensemble Machine Learning Methods. Remote Sens. 2021, 13, 1572. [Google Scholar] [CrossRef]
- Reyes-Bueno, F.; Loján-Córdova, J. Assessment of Three Machine Learning Techniques with Open-Access Geographic Data for Forest Fire Susceptibility Monitoring—Evidence from Southern Ecuador. Forests 2022, 13, 474. [Google Scholar] [CrossRef]
- Rubí, J.N.; de Carvalho, P.H.; Gondim, P.R. Application of machine learning models in the behavioral study of forest fires in the Brazilian Federal District region. Eng. Appl. Artif. Intell. 2023, 118, 105649. [Google Scholar] [CrossRef]
- Saha, S.; Bera, B.; Shit, P.K.; Bhattacharjee, S.; Sengupta, N. Prediction of forest fire susceptibility applying machine and deep learning algorithms for conservation priorities of forest resources. Remote Sens. Appl. Soc. Environ. 2023, 29, 100917. [Google Scholar] [CrossRef]
- Shao, Y.; Feng, Z.; Sun, L.; Yang, X.; Li, Y.; Xu, B.; Chen, Y. Mapping China’s Forest Fire Risks with Machine Learning. Forests 2022, 13, 856. [Google Scholar] [CrossRef]
- Tariq, A.; Shu, H.; Siddiqui, S.; Munir, I.; Sharifi, A.; Li, Q.; Lu, L. Spatio-temporal analysis of forest fire events in the Margalla Hills, Islamabad, Pakistan using socio-economic and environmental variable data with machine learning methods. J. For. Res. 2021, 33, 183–194. [Google Scholar] [CrossRef]
- Xie, L.; Zhang, R.; Zhan, J.; Li, S.; Shama, A.; Zhan, R.; Wang, T.; Lv, J.; Bao, X.; Wu, R. Wildfire Risk Assessment in Liangshan Prefecture, China Based on An Integration Machine Learning Algorithm. Remote Sens. 2022, 14, 4592. [Google Scholar] [CrossRef]
- Adab, H.; Kanniah, K.D.; Solaimani, K.; Sallehuddin, R. Modelling static fire hazard in a semi-arid region using frequency analysis. Int. J. Wildland Fire 2015, 24, 763–777. [Google Scholar] [CrossRef]
- Jaafari, A.; Zenner, E.K.; Pham, B.T. Wildfire spatial pattern analysis in the Zagros Mountains, Iran: A comparative study of decision tree based classifiers. Ecol. Inform. 2018, 43, 200–211. [Google Scholar] [CrossRef]
- Bui, D.T.; Bui, Q.-T.; Nguyen, Q.-P.; Pradhan, B.; Nampak, H.; Trinh, P.T. A hybrid artificial intelligence approach using GIS-based neural-fuzzy inference system and particle swarm optimization for forest fire susceptibility modeling at a tropical area. Agric. For. Meteorol. 2017, 233, 32–44. [Google Scholar] [CrossRef]
- Goldarag, Y.J.; Mohammadzadeh, A.; Ardakani, A.S. Fire Risk Assessment Using Neural Network and Logistic Regression. J. Indian Soc. Remote Sens. 2016, 44, 885–894. [Google Scholar] [CrossRef]
- Vecín-Arias, D.; Castedo-Dorado, F.; Ordóñez, C.; Rodríguez-Pérez, J.R. Biophysical and lightning characteristics drive lightning-induced fire occurrence in the central plateau of the Iberian Peninsula. Agric. For. Meteorol. 2016, 225, 36–47. [Google Scholar] [CrossRef]
- Zhao, P.; Zhang, F.; Lin, H.; Xu, S. GIS-Based Forest Fire Risk Model: A Case Study in Laoshan National Forest Park, Nanjing. Remote Sens. 2021, 13, 3704. [Google Scholar] [CrossRef]
- Rodrigues, M.; Zúñiga-Antón, M.; Alcasena, F.; Gelabert, P.; Vega-Garcia, C. Integrating geospatial wildfire models to delineate landscape management zones and inform decision-making in Mediterranean areas. Saf. Sci. 2022, 147, 105616. [Google Scholar] [CrossRef]
- Wang, S.; Zhang, G.; Tan, S.Q.; Wang, P.; Wu, X. Assessment of forest fire risk in Hunan province based on spatial logistic model. J. Cent. South Univ. For. Technol. 2020, 40, 88–95. [Google Scholar]
- Yang, X.; Jin, X.; Zhou, Y. Wildfire Risk Assessment and Zoning by Integrating Maxent and GIS in Hunan Province, China. Forests 2021, 12, 1299. [Google Scholar] [CrossRef]
- Luo, F.; Wang, C.; Lei, H.; Xiao, Z. Young adults’ perception of forests using landscape-image-sketching technique: A case study of Changsha, Central China. Int. J. Environ. Res. Public Health 2023, 20, 2986. [Google Scholar] [CrossRef]
- Hu, T.; Dong, J.; Hu, Y.; Qiu, S.; Yang, Z.; Zhao, Y.; Cheng, X.; Peng, J. Stage response of vegetation dynamics to urbanization in megacities: A case study of Changsha City, China. Sci. Total. Environ. 2023, 858, 159659. [Google Scholar] [CrossRef]
- Liu, Z.H.; Yang, J.; He, H.S.; Chang, Y. Spatial point analysis of fire occurrence and its influence factor in Huzhong forest area of the Great Xing ‘an Mountains in Heilongjiang Province, China. Acta Ecol. Sin. 2011, 31, 1669–1677. [Google Scholar]
- Bhattarai, N.; Dahal, S.; Thapa, S.; Pradhananga, S.; Karky, B.S.; Rawat, R.S.; Windhorst, K.; Watanabe, T.; Thapa, R.B.; Avtar, R. Forest Fire in the Hindu Kush Himalayas: A Major Challenge for Climate Action. J. For. Livelihood 2022, 21, 14–31. [Google Scholar] [CrossRef]
- Chen, J.; Chen, J.; Liao, A.; Cao, X.; Chen, L.; Chen, X.; He, C.; Han, G.; Peng, S.; Lu, M.; et al. Global land cover mapping at 30 m resolution: A POK-based operational approach. ISPRS J. Photogramm. Remote Sens. 2015, 103, 7–27. [Google Scholar] [CrossRef]
- Li, Y.; Feng, Z.; Chen, S.; Zhao, Z.; Wang, F. Application of the Artificial Neural Network and Support Vector Machines in Forest Fire Prediction in the Guangxi Autonomous Region, China. Discret. Dyn. Nat. Soc. 2020, 2020, 1–14. [Google Scholar] [CrossRef]
- Son, R.; Stacke, T.; Gayler, V.; Nabel, J.E.M.S.; Schnur, R.; Silva, L.A.; Mesa, C.R.; Winkler, A.; Hantson, S.; Zaehle, S.; et al. Integration of a deep-learning-based fire model into a global land surface model. J. Adv. Model. Earth Syst. 2023. [Google Scholar]
- Eddin, M.H.S.; Roscher, R.; Gall, J. Location-Aware Adaptive Normalization: A Deep Learning Approach for Wildfire Danger Forecasting. IEEE Trans. Geosci. Remote Sens. 2023, 61, 1–18. [Google Scholar] [CrossRef]
- Maffei, C.; Menenti, M. Predicting forest fires burned area and rate of spread from pre-fire multispectral satellite measurements. ISPRS J. Photogramm. Remote Sens. 2019, 158, 263–278. [Google Scholar] [CrossRef]
- Oliveira, S.; Oehler, F.; San-Miguel-Ayanz, J.; Camia, A.; Pereira, J.M. Modeling spatial patterns of fire occurrence in Mediterranean Europe using Multiple Regression and Random Forest. For. Ecol. Manag. 2012, 275, 117–129. [Google Scholar] [CrossRef]
- Gigović, L.; Pourghasemi, H.R.; Drobnjak, S.; Bai, S. Testing a New Ensemble Model Based on SVM and Random Forest in Forest Fire Susceptibility Assessment and Its Mapping in Serbia’s Tara National Park. Forests 2019, 10, 408. [Google Scholar] [CrossRef]
- Guo, H.; Yu, W. Study weather grade prediction model of forest-fire risk in Hunan province. J. Central South Univ. For. Technol. 2016, 36, 44–47. [Google Scholar]
- Weiss, D.J.; Nelson, A.; Gibson, H.S.; Temperley, W.; Peedell, S.; Lieber, A.; Hancher, M.; Poyart, E.; Belchior, S.; Fullman, N.; et al. A global map of travel time to cities to assess inequalities in accessibility in 2015. Nature 2018, 553, 333–336. [Google Scholar] [CrossRef] [PubMed]
- Su, Z.; Hu, H.; Wang, G.; Ma, Y.; Yang, X.; Guo, F. Using GIS and Random Forests to identify fire drivers in a forest city, Yichun, China. Geomat. Nat. Hazards Risk 2018, 9, 1207–1229. [Google Scholar] [CrossRef]
- Zhang, F.; Yang, X. Improving land cover classification in an urbanized coastal area by random forests: The role of variable selection. Remote Sens. Environ. 2020, 251, 112105. [Google Scholar] [CrossRef]
- Naderpour, M.; Rizeei, H.M.; Khakzad, N.; Pradhan, B. Forest fire induced Natech risk assessment: A survey of geospatial technologies. Reliab. Eng. Syst. Saf. 2019, 191, 106558. [Google Scholar] [CrossRef]
- Sachdeva, S.; Bhatia, T.; Verma, A.K. GIS-based evolutionary optimized Gradient Boosted Decision Trees for forest fire susceptibility mapping. Nat. Hazards 2018, 92, 1399–1418. [Google Scholar] [CrossRef]
- Miller, L.; Zhu, L.; Yebra, M.; Rüdiger, C.; Webb, G.I. Multi-modal temporal CNNs for live fuel moisture content estimation. Environ. Model. Softw. 2022, 156, 105467. [Google Scholar] [CrossRef]
- Sevinc, V.; Kucuk, O.; Goltas, M. A Bayesian network model for prediction and analysis of possible forest fire causes. For. Ecol. Manag. 2019, 457, 117723. [Google Scholar] [CrossRef]
- Abram, N.J.; Henley, B.J.; Gupta, A.S.; Lippmann, T.J.R.; Clarke, H.; Dowdy, A.J.; Sharples, J.J.; Nolan, R.H.; Zhang, T.; Wooster, M.J.; et al. Connections of climate change and variability to large and extreme forest fires in southeast Australia. Commun. Earth Environ. 2021, 2, 8. [Google Scholar] [CrossRef]
- Boubeta, M.; Lombardía, M.J.; Marey-Pérez, M.F.; Morales, D. Prediction of forest fires occurrences with area-level Poisson mixed models. J. Environ. Manag. 2015, 154, 151–158. [Google Scholar] [CrossRef] [PubMed]


| Name of Predictor | Abbreviations | Resolution, Units | Data Sources |
|---|---|---|---|
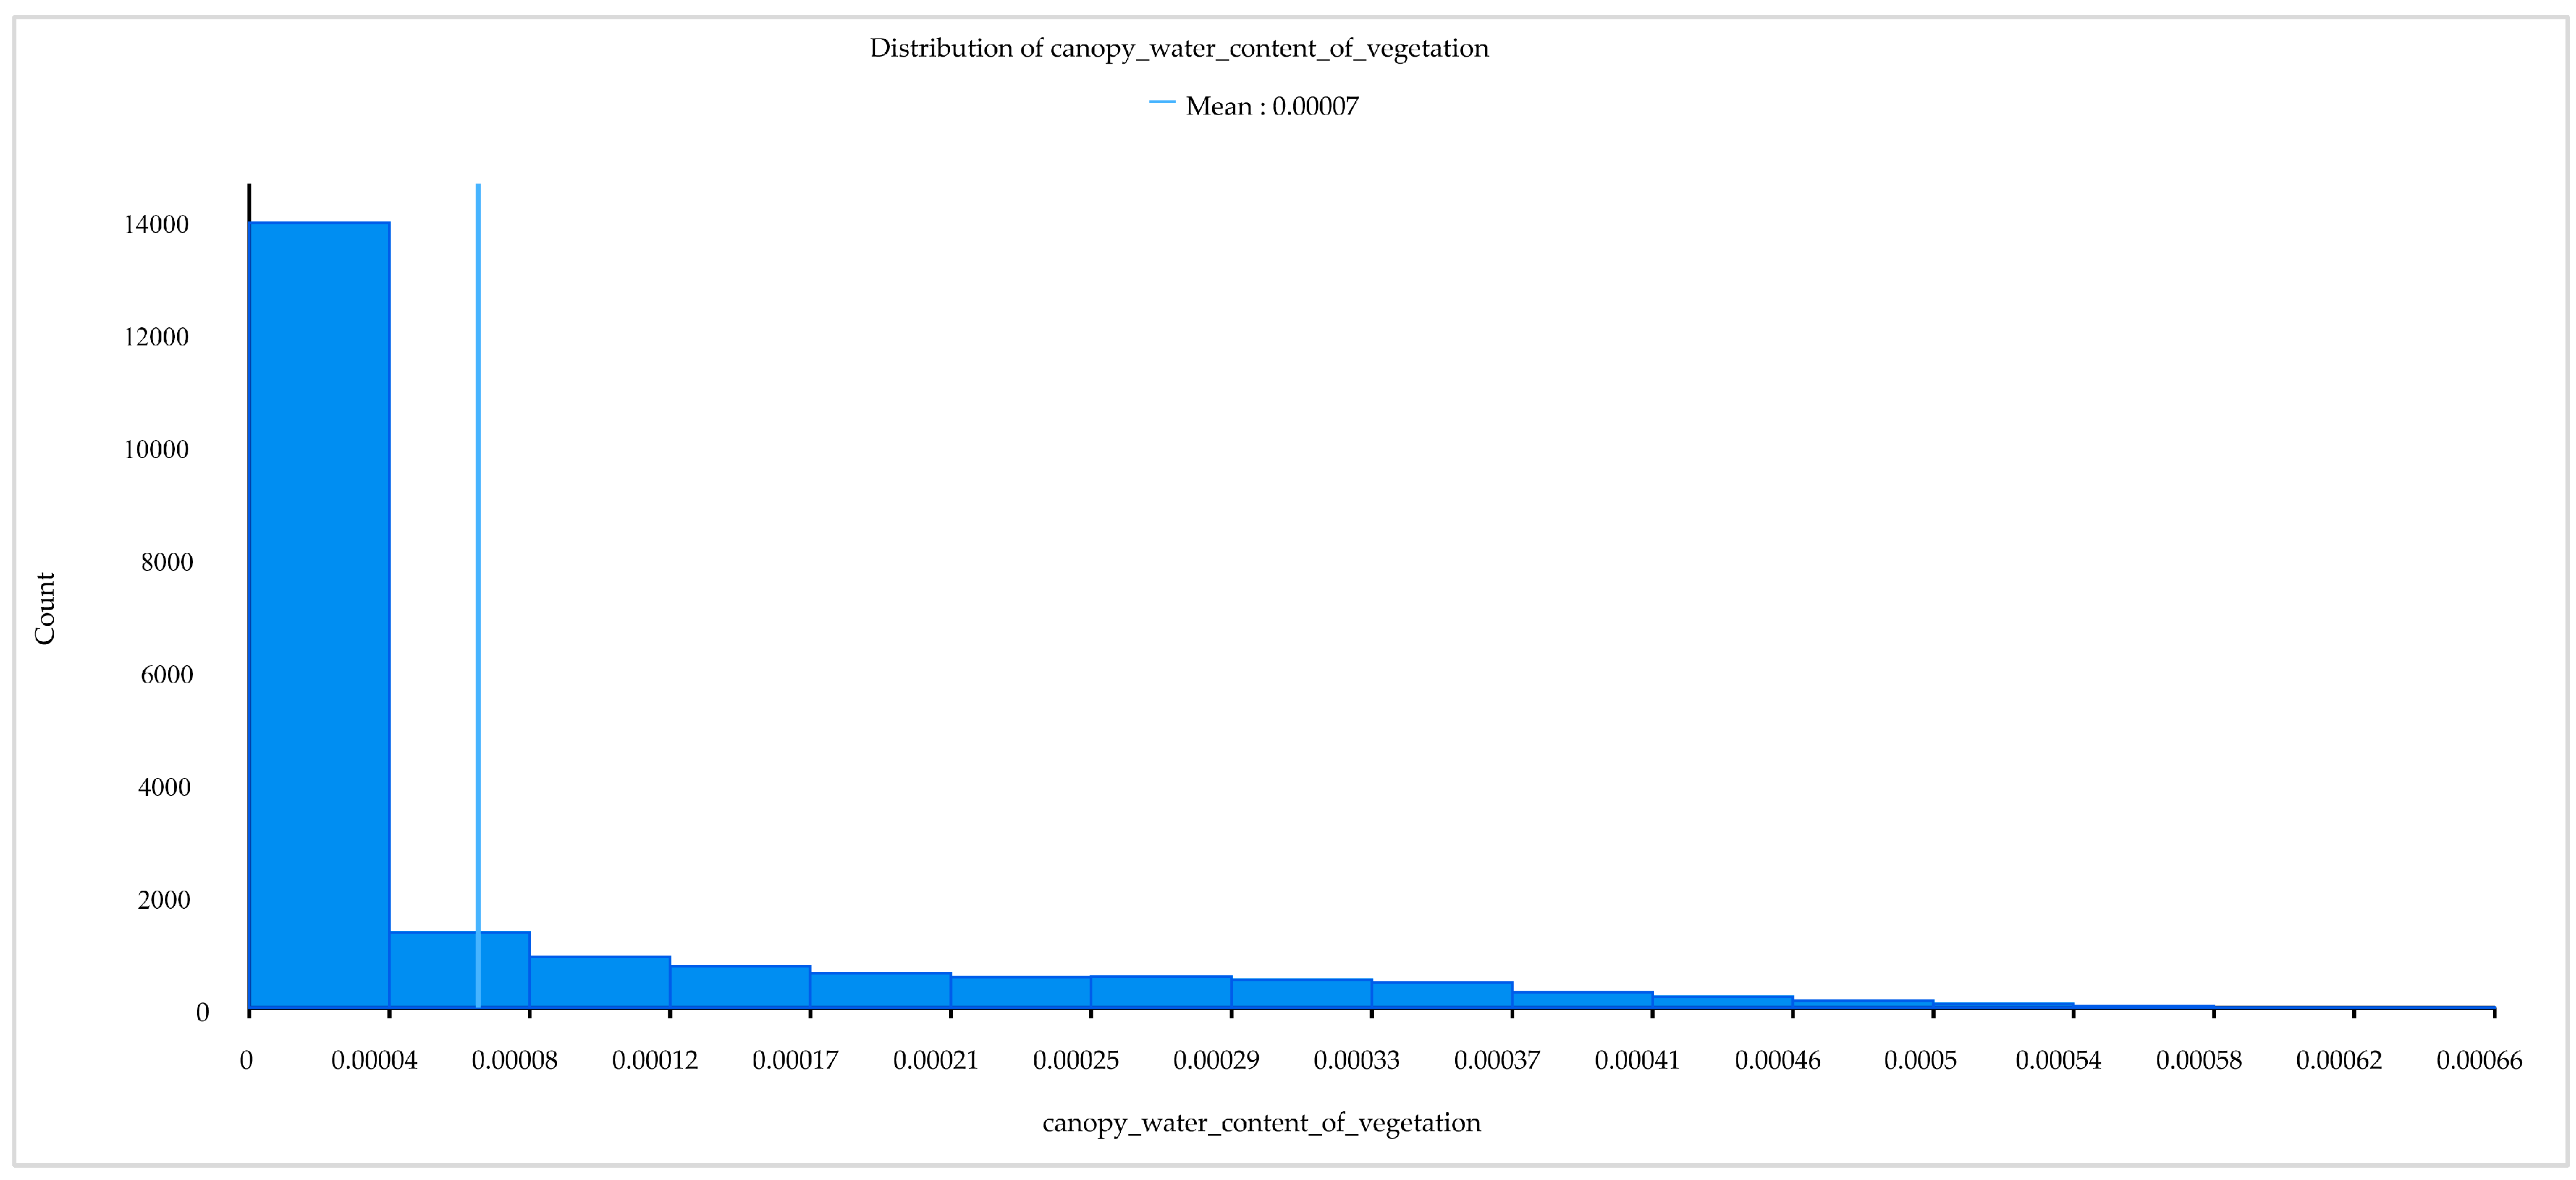
| Vegetation canopy water content | Vcwc | m of water equivalent | https://cds.climate.copernicus.eu accessed on 30 December 2022 |
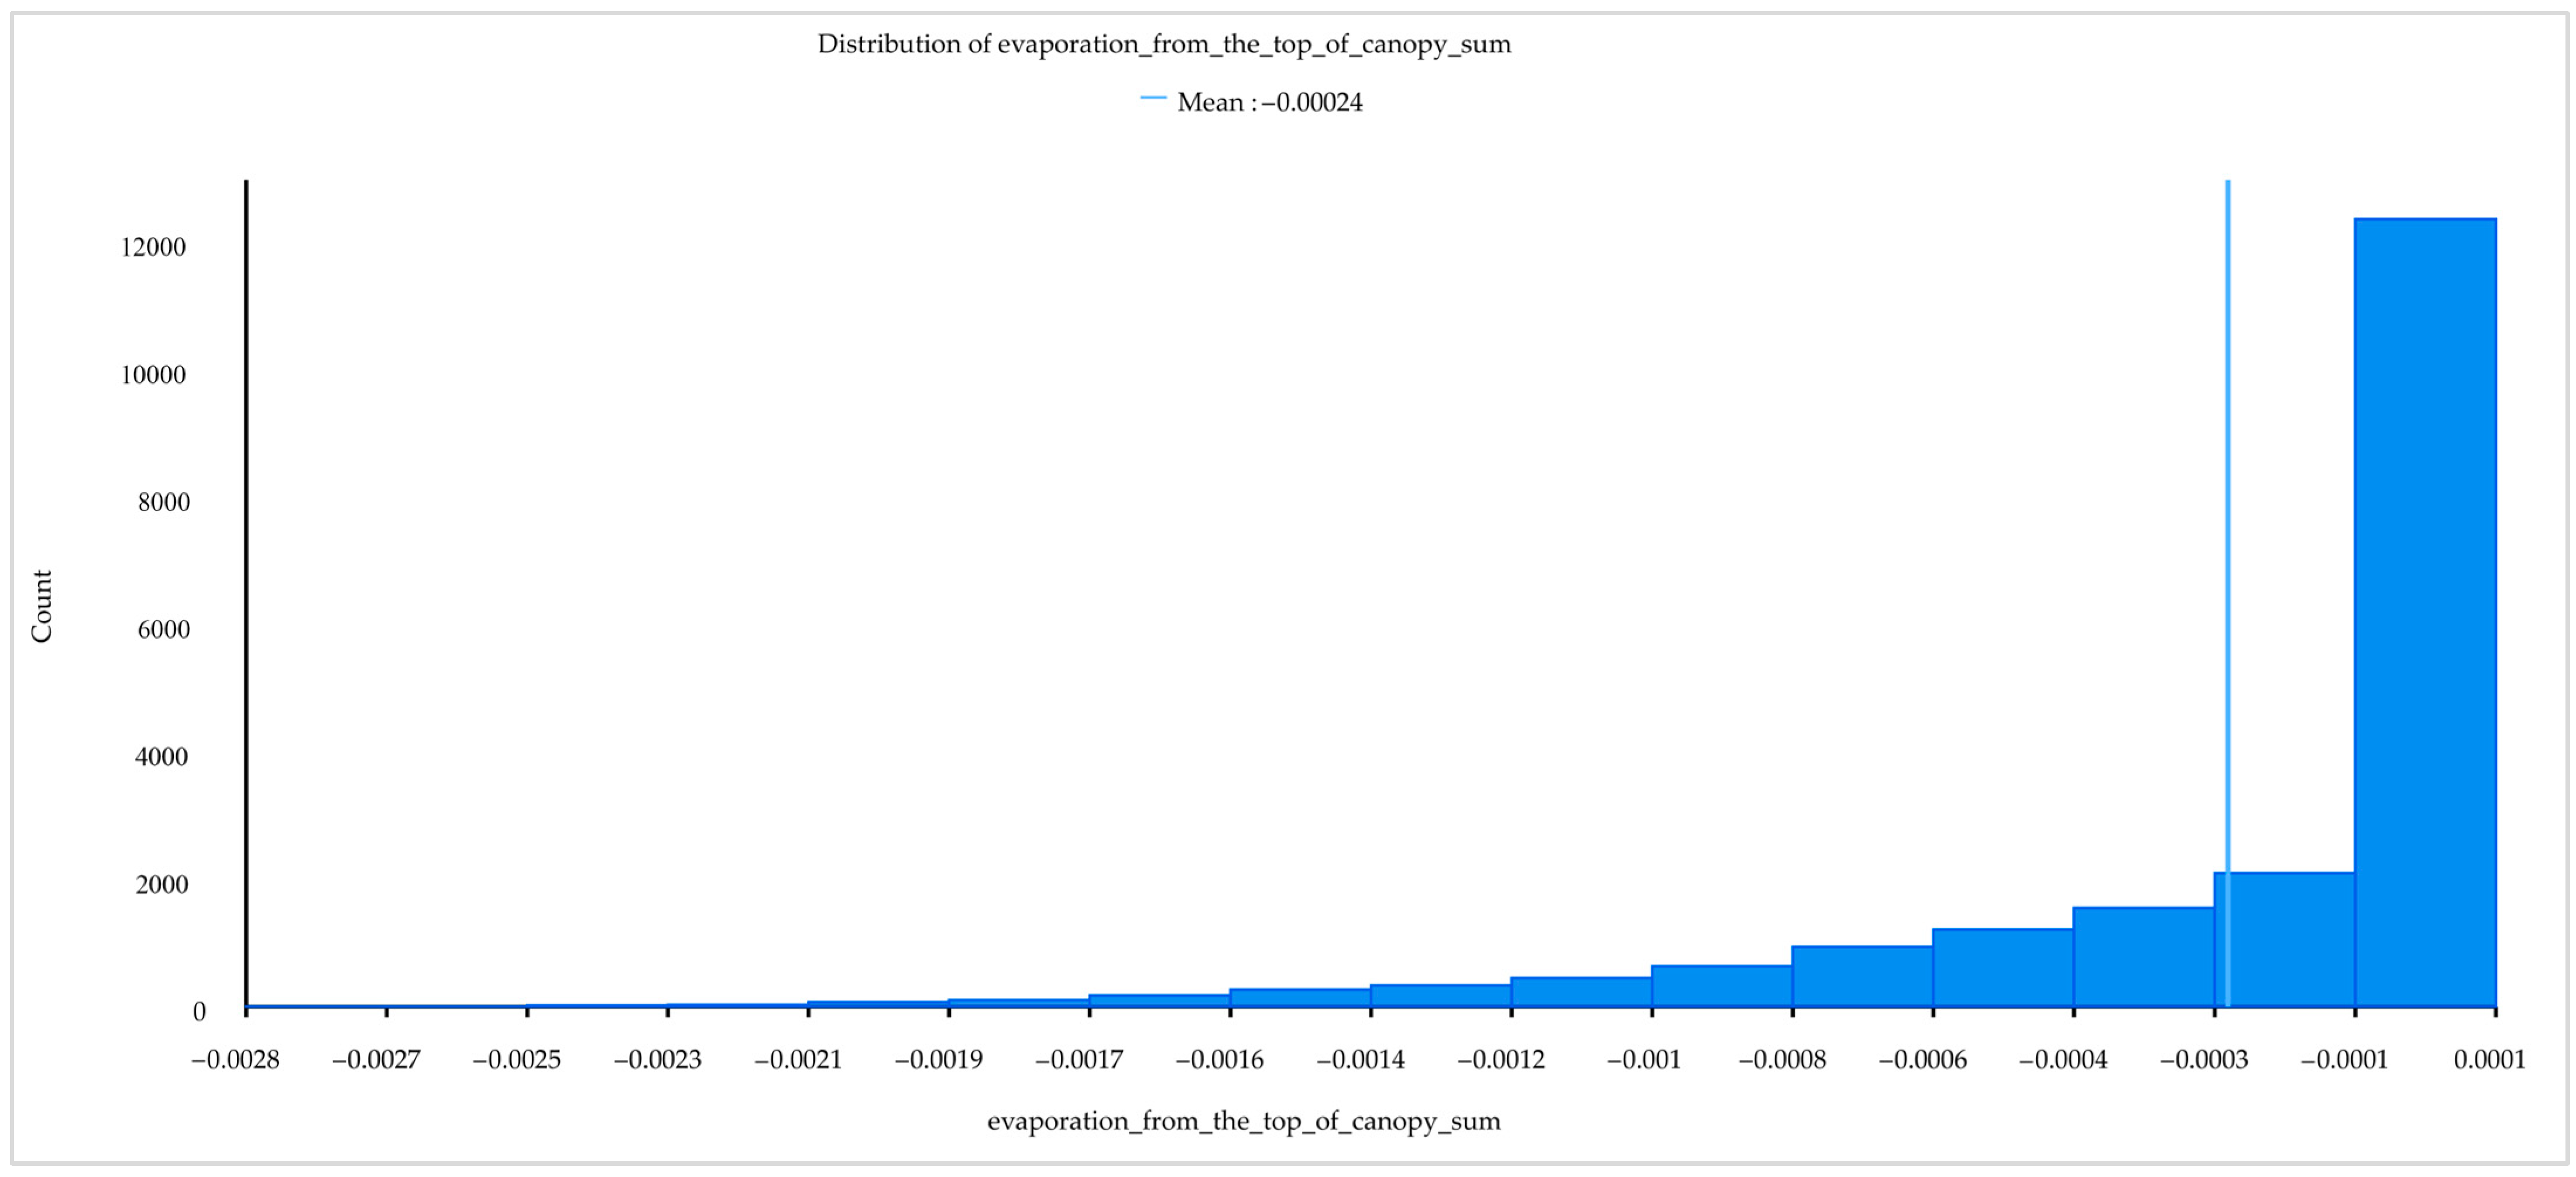
| evaporation from the top of canopy | Eftc | m of water equivalent | https://cds.climate.copernicus.eu accessed on 30 December 2022 |
| Volume of water in soil layer 1 (0–7 cm) | Vws | 1 (volume fraction) | https://cds.climate.copernicus.eu accessed on 30 December 2022 |
| Type of land use | Ldu | 30 m | http://www.globallandcover.com accessed on 31 December 2022 |
| Easterly wind speed | Ews | m/s | https://cds.climate.copernicus.eu accessed on 30 December 2022 |
| northerly wind speed | Nws | m/s | https://cds.climate.copernicus.eu accessed on 30 December 2022 |
| Total evaporation | Tev | m of water equivalent | https://cds.climate.copernicus.eu accessed on 30 December 2022 |
| Surface temperature 2 m | Stem | K | https://cds.climate.copernicus.eu accessed on 30 December 2022 |
| Normalized Difference Vegetation Index | Ndvi | 250 m | https://cds.climate.copernicus.eu accessed on 30 December 2022 |
| Dew point temperature | Dwp | K | https://cds.climate.copernicus.eu accessed on 30 December 2022 |
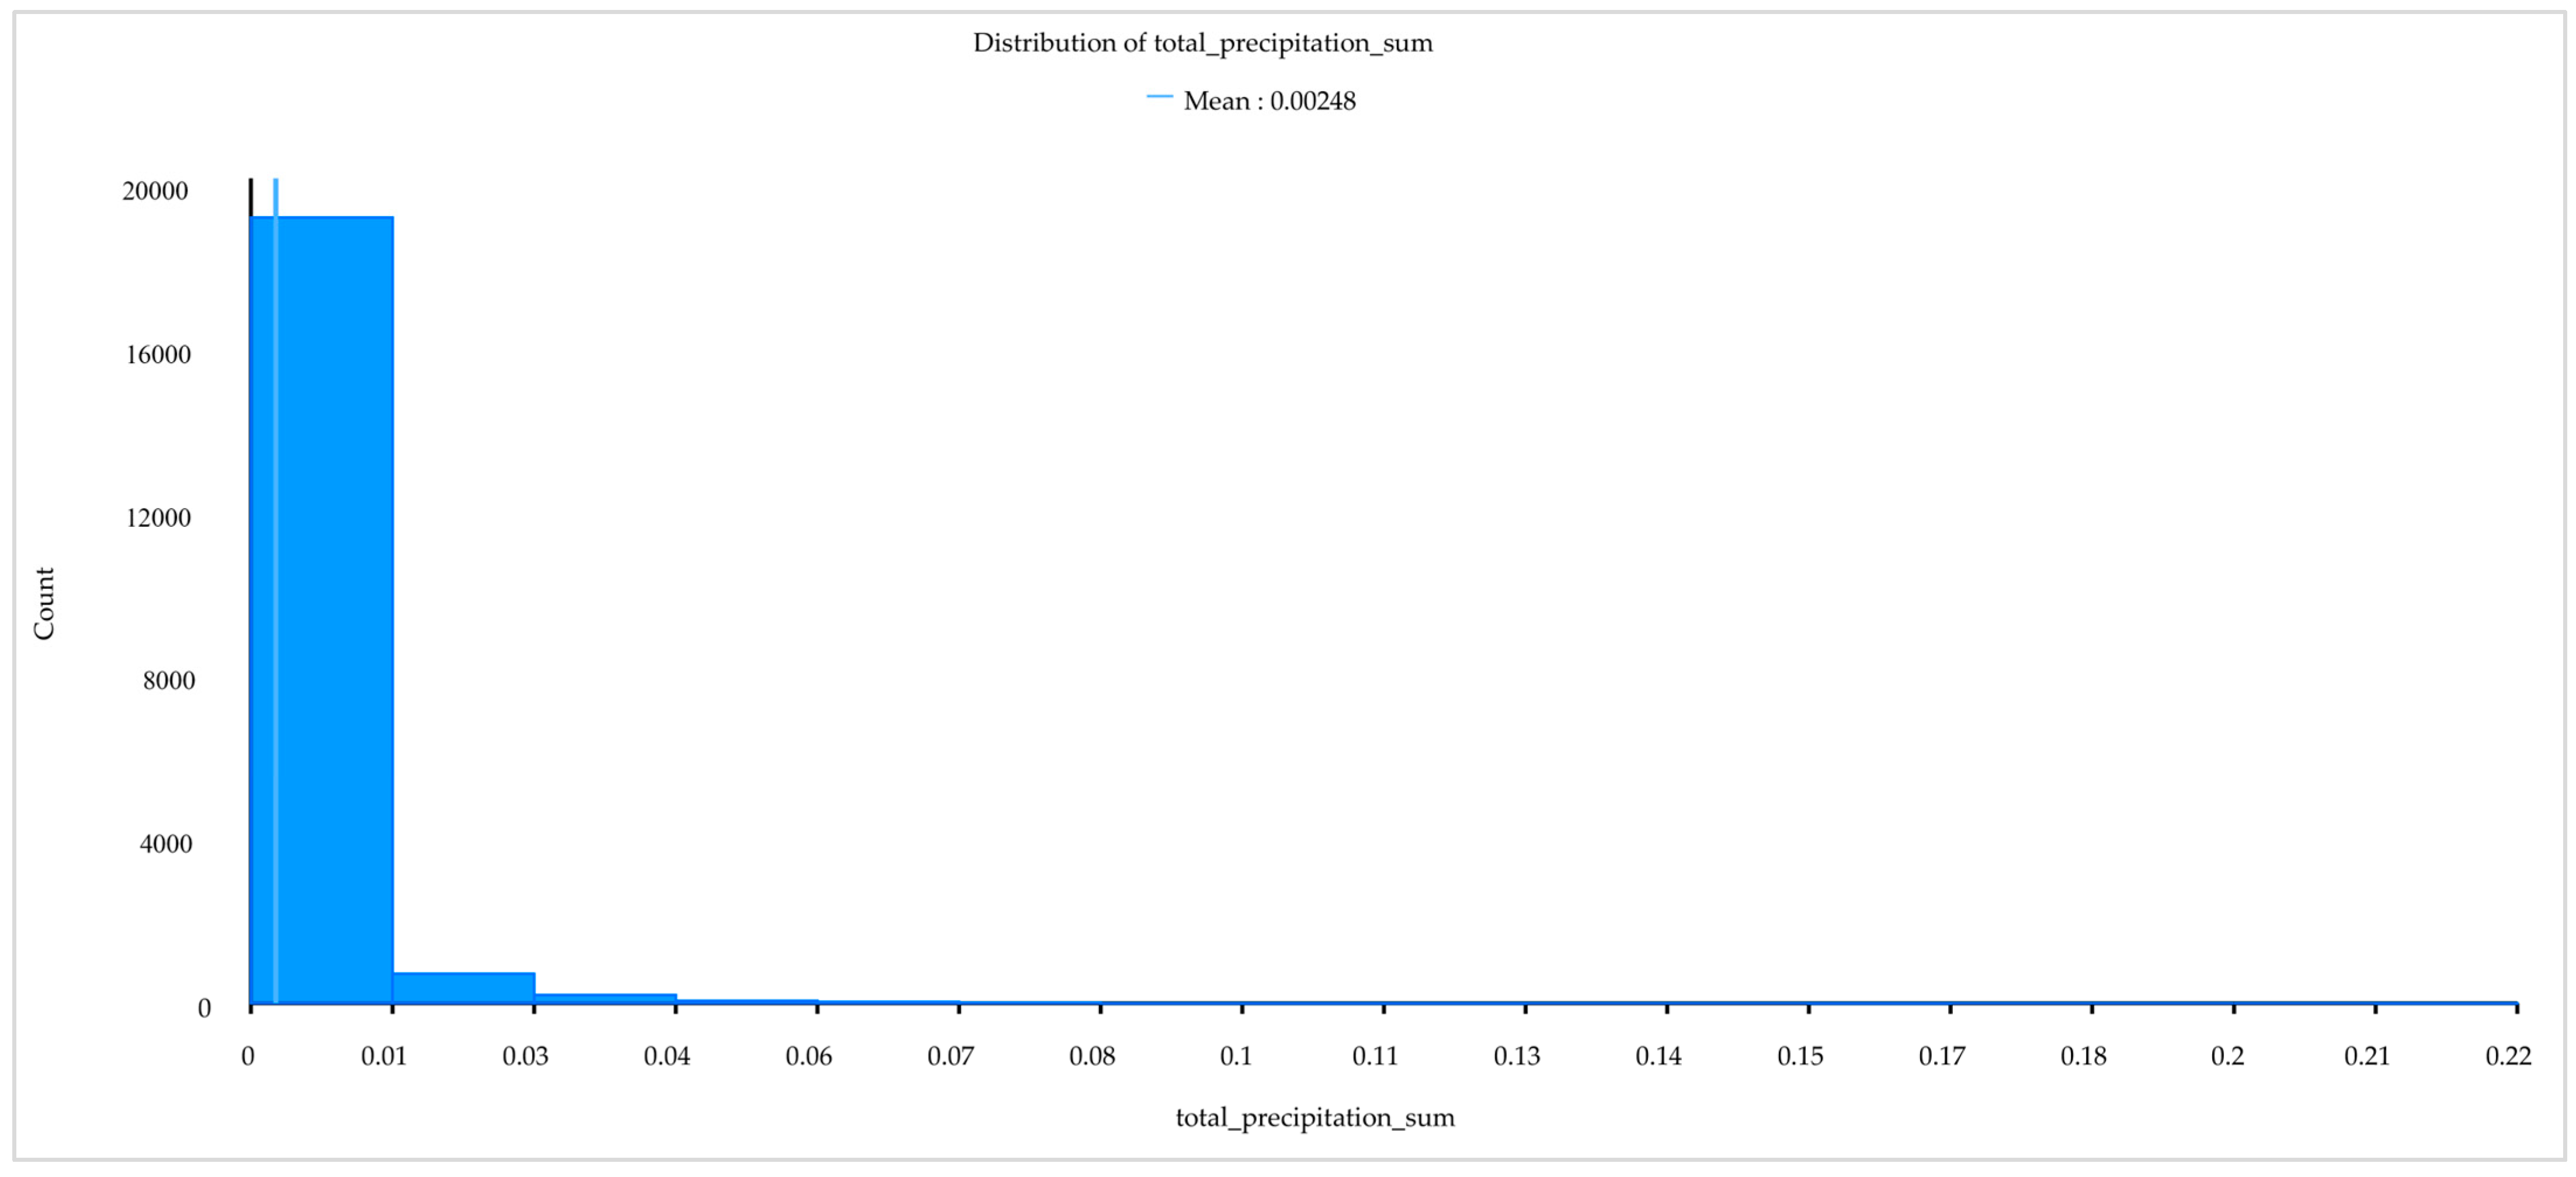
| Total precipitation | Tprp | m | https://cds.climate.copernicus.eu accessed on 30 December 2022 |
| Aspect | Asp | 30 m | https://earthexplorer.usgs.gov accessed on 31 December 2022 |
| Slope | Slo | ° | https://earthexplorer.usgs.gov accessed on 31 December 2022 |
| Elevation | Eva | m | https://earthexplorer.usgs.gov accessed on 31 December 2022 |
| Nearest road and railway | nrar | km | http://www.webmap.cn accessed on 16 December 2022 |
| Gross domestic product | GDP | RMB/km2 | https://www.resdc.cn accessed on 16 December 2022 |
| Population density | Popd | persons/km2 | https://www.resdc.cn accessed on 16 December 2022 |
| Closest distance to population centres | Cdtp | km | http://www.webmap.cn accessed on 16 December 2022 |
| Longitude of the fire point | Lon | ° | https://slcyfh.mem.gov.cn accessed on 31 December 2022 |
| Latitude of the fire point | Lat | ° | https://slcyfh.mem.gov.cn accessed on 31 December 2022 |
| Fire point date | Fpd | date | https://slcyfh.mem.gov.cn accessed on 31 December 2022 |
| Machine Learning Algorithm | Category | Accuracy | Precision | Recall | F1 | AUC |
|---|---|---|---|---|---|---|
| SVM | Forest fire | 0.779 | 0.768 | 0.801 | 0.784 | 0.847 |
| Non-forest fire | 0.791 | 0.756 | 0.773 | |||
| GBDT | Forest fire | 0.899 | 0.882 | 0.921 | 0.901 | 0.962 |
| Non-forest fire | 0.917 | 0.876 | 0.896 | |||
| RF | Forest fire | 0.908 | 0.896 | 0.925 | 0.910 | 0.965 |
| Non-forest fire | 0.922 | 0.892 | 0.907 |
| Name of Predictor | Gain Ratio | Gini |
|---|---|---|
| Evaporation from the top of canopy | 12.22% | 15.40% |
| Vegetation canopy water content | 10.05% | 12.70% |
| Total precipitation | 9.95% | 12.58% |
| Dew point temperature | 6.35% | 8.21% |
| Fire point date | 5.98% | 7.74% |
| Normalized Difference Vegetation Index | 5.79% | 7.74% |
| Volume of water in soil layer 1 (0–7 cm) | 5.52% | 7.19% |
| Type of land use | 11.47% | 6.61% |
| Surface temperature 2 m | 4.61% | 6.10% |
| Total evaporation | 2.86% | 3.90% |
| Latitude of the fire point | 2.79% | 3.80% |
| Longitude of the fire point | 1.06% | 1.46% |
| northerly wind speed | 1.04% | 1.42% |
| Elevation | 0.40% | 0.56% |
| Slope | 0.34% | 0.48% |
| Population density | 0.33% | 0.46% |
| Gross domestic product | 0.39% | 0.40% |
| Nearest road and railway | 0.23% | 0.32% |
| Easterly wind speed | 0.18% | 0.25% |
| Closest distance to population centres | 0.07% | 0.10% |
| Aspect | 0.04% | 0.06% |
Disclaimer/Publisher’s Note: The statements, opinions and data contained in all publications are solely those of the individual author(s) and contributor(s) and not of MDPI and/or the editor(s). MDPI and/or the editor(s) disclaim responsibility for any injury to people or property resulting from any ideas, methods, instructions or products referred to in the content. |
© 2023 by the authors. Licensee MDPI, Basel, Switzerland. This article is an open access article distributed under the terms and conditions of the Creative Commons Attribution (CC BY) license (https://creativecommons.org/licenses/by/4.0/).
Share and Cite
Wu, X.; Zhang, G.; Yang, Z.; Tan, S.; Yang, Y.; Pang, Z. Machine Learning for Predicting Forest Fire Occurrence in Changsha: An Innovative Investigation into the Introduction of a Forest Fuel Factor. Remote Sens. 2023, 15, 4208. https://doi.org/10.3390/rs15174208
Wu X, Zhang G, Yang Z, Tan S, Yang Y, Pang Z. Machine Learning for Predicting Forest Fire Occurrence in Changsha: An Innovative Investigation into the Introduction of a Forest Fuel Factor. Remote Sensing. 2023; 15(17):4208. https://doi.org/10.3390/rs15174208
Chicago/Turabian StyleWu, Xin, Gui Zhang, Zhigao Yang, Sanqing Tan, Yongke Yang, and Ziheng Pang. 2023. "Machine Learning for Predicting Forest Fire Occurrence in Changsha: An Innovative Investigation into the Introduction of a Forest Fuel Factor" Remote Sensing 15, no. 17: 4208. https://doi.org/10.3390/rs15174208
APA StyleWu, X., Zhang, G., Yang, Z., Tan, S., Yang, Y., & Pang, Z. (2023). Machine Learning for Predicting Forest Fire Occurrence in Changsha: An Innovative Investigation into the Introduction of a Forest Fuel Factor. Remote Sensing, 15(17), 4208. https://doi.org/10.3390/rs15174208