Article

Laboratory Characterisation of a Commercial RGB CMOS Camera for Measuring Night Sky Brightness

1
Department of Industrial Engineering, University of Padova, I-35131 Padova, Italy
2
Regional Environmental Prevention and Protection Agency of Veneto, I-35121 Padova, Italy
3
Department of Mechanical and Industrial Engineering, NTNU, Gloshaugen, Richard Birkelands vei 2b, 7034 Trondheim, Norway
4
Department of Physics and Astronomy, University of Padova, I-35121 Padova, Italy
5
INAF—Osservatorio Astronomico di Padova, I-35122 Padova, Italy
*
Author to whom correspondence should be addressed.
Remote Sens. 2023, 15(17), 4196; https://doi.org/10.3390/rs15174196
Submission received: 6 June 2023 / Revised: 2 August 2023 / Accepted: 16 August 2023 / Published: 26 August 2023

Abstract

:
The use of RGB cameras in photometric applications has grown over the last few decades in many fields such as industrial applications, light engineering and the analysis of the quality of the night sky. In this last field, they are often used in conjunction with a Sky Quality Meter (SQM), an instrument used for the measurement of night sky brightness (NSB), mainly when there is a significant amount of artificial light at night (ALAN). The performances of these two instruments are compared here. A simple source composed of nine narrowband LEDs in an integrating sphere was used to excite the two instruments and therefore measure the spectral responsivity of the SQM and of the three channels of the camera. The estimated uncertainties regarding spectral responsivity were less than 10%. A synthetic instrument approximating the SQM’s responsivity can be created using a combination of the R, G and B channels. The outputs of the two instruments were compared by measuring the spectral radiance of the night sky. An evaluation of the spectral mismatch between the two instruments completed the analysis of their spectral sensitivity. Finally, the measurements of real SQMs in four sites experiencing different levels of light pollution were compared with the values obtained by processing the recorded RGB images. Overall, the analysis shows that the two instruments have significantly different levels of spectral responsivity, and the alignment of their outputs requires the use of a correction which depends on the spectral distribution of the light coming from the sky. A synthetic SQM will always underestimate real SQM measures; an average correction factor was evaluated considering nine sky spectra under low and medium levels of light pollution; this was determined to be 1.11 and, on average, compensated for the gap. A linear correction was also supposed based on the correlation between the NSB levels measured by the two instruments; the mean squared error after the correction was 0.03 mag arcsec−2.

1. Introduction

Nowadays, several kinds of digital RGB cameras are available on the market, including professional reflex cameras; mirrorless, compact cameras; action cameras; and the cameras integrated into mobile phones. Many of them use a wide-angle or fisheye lens, which can allow for a wide portion of the night sky to be recorded and detailed maps of artificial sky glow to be analysed [1,2,3,4]. Scientific monochromatic cameras present higher performance: for example, in terms of repeatability and linearity. Some scientific cameras have multiple channels, allowing for multispectral imaging; commercial RGB cameras are less expensive but maintain the advantages of their three channels and, therefore, their ability to perform basic spectral analysis [5]. In fact, they can perform a rough separation of the short, medium and long wavelengths in the visible range. Furthermore, their wide use across the world could be the basis of large citizen science projects. Up to now, calibration has been an open problem. It is a requirement for the use of commercial RGB cameras as instruments, but it is not easy to achieve and is commonly performed in professional laboratories. The most important characteristic of a camera is the spectral responsivity of its channels, even if an attempt at standardization is underway based on channel spectral similarities [6,7].
Night sky brightness is often measured by radiometers; some of them work alone, while others are part of a network. Two examples are presented in [8,9]. Two radiometers are mainly used for this application. One is the Sky Quality Meter (SQM) [10,11], which has a bandwidth at half maximum that spans from 390 nm to 600 nm. The other, the Telescope Encoder and Sky Sensor (TESS) [12], is very similar; it has a wider bandwidth of between 400 nm and 740 nm. Figure 1 presents the spectral responsivity of those two instruments [13]; as an example of the behaviour of an RGB camera, the spectral responsivity values of the three channels of the Canon 5D mark II [14] are also shown.
Both instruments are used to track trends in NSB and to link them to variations in outdoor lighting. This is possible so long as no variations in the instruments themselves and no changes in atmospheric conditions occur. In fact, SQMs are sensitive to atmospheric conditions, in particular to aerosol concentration and cloud cover, and they can also be used as cloud detectors [15,16].
Actually, an ageing effect has been found due to the instruments being exposed to outdoor conditions. Furthermore, it has also been proven that variations in the atmosphere cause changes in the instruments’ outputs [17,18]. These factors affect the results of NSB measurements; as such, they have been highlighted, and possible compensations were proposed in [19,20].
Either as an alternative or as a backup instrument, a calibrated RGB camera can be used to measure NSB. Measuring NSB using SQMs is so widespread that NSB values usually refer to the result of weighting the spectral sky radiance with the SQM spectral responsivity. Consequently, in this work, the data outputs from the considered RGB camera were used to try to approximate the output of this kind of instrument. Using the RGB camera in parallel with an SQM allows for improved confidence regarding the status of the night sky. In particular, looking at slow trends, it could help to understand what may cause variations in SQM output. Obviously, before a comparison of the two instruments can be performed, the outputs of the R, G and B channels have to be combined to produce a value of brightness comparable with the one provided by the SQM; at a minimum, the same or similar behaviour along the visible wavelength range has to be obtained.
At present, different approaches to calibrating RGB cameras can be found. When cameras are used to measure NSB, they can be calibrated by using known stars as reference sources [7]. Calibration in terms of luminance and colour temperature can be obtained by observing at least three coloured sources or a set of common-use light sources with known and significantly different colour tristimulus values and finding a transformation between the readings of the camera channels and the tristimulus values. The transformation may be linear and represented by a matrix [4,21]. RGB cameras can also be used to measure sky radiance within three bands. For this application, the spectral responsivity of each of the R, G and B channels is measured [5], e.g., by using a set of narrowband colour LEDs. The present work measured the spectral responsivity of the R, G and B channels, but they were here used to approximate the responsivity of the SQM. This allowed for the goodness of the approximation in different light pollution situations to be analysed and for the possibility of highlighting the causes of the gap between the two instruments.
The present work starts by presenting the analysis of the spectral responsivity of the SQM and a specific RGB camera available for the working group. The R, G and B outputs of the camera were combined to obtain a radiometer with a spectral responsivity similar to the SQM. At the end, their performances were compared while the two instruments were excited by real night sky spectral radiances.

2. Materials

The night sky brightness at zenith is the parameter most frequently used to quantify the status of a site in terms of light pollution. The commonly used instrument for this measurement is the SQM, which is briefly described below. Then, the main characteristics of the RGB camera involved in the analysis are presented. Both the instruments were exposed to a coloured source based on light emitting diodes (LED), described here, to compare their responses. The output radiance of the source was measured using a laboratory spectrometer in the visible range and a UV radiometer in the long-wave ultraviolet region (UVA). Two other spectrometers are briefly described. They were used to measure night sky spectral radiance in sites characterised by different levels of light pollution.

2.1. The Sky Quality Meter

The most popular instrument for NSB measurement is probably the SQM [10,11]. It is a radiometer composed of a photodiode with an infrared-blocking filter to shape its spectral sensitivity. In this work, the version SQM-L was considered; it has a directional response with a half-width half-maximum (HWHM) aperture angle of about 20° [22]. Another version of the instrument is available: the SQM-Classic or SQM-WL, which has a HWHM aperture angle of about 42°. The instrument is easy to use; it is oriented towards the zenith, and then the NSB measure is taken. There are models for manual use and for automatic recording. It can be inserted in a protective case and left outdoors; it facilitates its use and the creation of a network of instruments for analysing NBS trends.
SQM output is usually expressed in magnitudes (m) on a logarithmic scale. As the radiance received by the instrument is weighted by its spectral responsivity, it should be more appropriate to use the symbol m s q m to clearly express this weighting action. Provided that the magnitude values are proportional to the logarithm base 10 of the ratio of the weighted input radiance M and the reference radiance M r e f used by the manufacturer in the calibration laboratory,
m s q m = 2.5 l o g 10 M M r e f .
Different situations were considered in this analysis, which did not allow the use of the same SQM for the same activities and sites.
The analysis of the spectral responsivity of an SQM is based on the averages of the measures of the radiance of the LED source obtained from several either new SQMs or SQMs that have not exposed been to outdoor conditions for a long time.
A portable SQM was used for most of the outdoor measures of NSB. This SQM is often used to provide a reference to assess the correct operation of instruments in outdoor network stations; it was always kept protected from strong light and temperature exposure in controlled indoor places.
For the data collected at Padova, and only for these data, the NSB values were obtained by an SQM of the network of the Veneto Region (Italy). It is an instrument that is always used outdoors and is therefore exposed to bad weather and solar radiation. It presents a decay in its performances, partially identified in [15,17]. In this work, the ageing effects were compensated for before comparing its measures with the NBS values derived from the images recorded by the RGB camera.

2.2. The Analysed Camera

The camera considered in this study was the commercial RGB camera model Canon 70D with a fisheye lens Sigma 4.5 mm f/2.8; it is available at the Regional Environmental Prevention and Protection Agency of Veneto (ARPAV) headquarters. It allows for the acquisition of digital images with a pixel depth of 14 bits using a 22.5 mm × 15 mm CMOS sensor that has about 20 Mpixels. The images can also be saved in a raw CR2 format for later processing. In particular, at the ARPAV, the “Sky Quality Camera” (SQC) software (version 1.9.2, Euromix Ltd., Ljubljana, Slovenia) is available, which allows for the calibration of camera images in terms of sky brightness and colour temperature; examples of the use of this software can be found in [4,23,24]. Calibration is achieved by applying classical astronomical photometric methods during photometric nights (i.e., under clear and stable atmospheric conditions) and is based on knowledge of star brightness and extinction measurements. Calibration is performed in conditions closer to those of an unpolluted or weakly polluted site than to those of a site characterised by medium/high light pollution. The available version of the SQC software provides an “SQM value” which should correspond to the measurement of an SQM-WL.

2.3. The Laboratory Spectroradiometer

The instrument used to measure the spectral radiance at the output port of the LED source was the Konica Minolta CS-1000a spectroradiometer (Chiyoda, Tokyo, Japan). It works in the visible range between 380 nm and 780 nm, with a spectral resolution of 1 nm and a resolving resolution full width at half maximum (FWHM) of about 5 nm. When measuring the luminance and weighting the spectral radiance of an Illuminant A with the photopic sensitivity, its uncertainty is equal to 2% of the reading plus 1 digit, working in a range from 0.01 cd m−2 to 80,000 cd m−2. Its repeatability is 0.1% of the reading plus 1 digit, considering a confidence interval correspondent equal to 1 standard deviation. Its spectral flatness is particularly significant for the analysis presented in this work; it was measured to be within 5% of the full operating range [25].

2.4. The UV Radiometer

The Deltaohm HD 9021 radiometer [26] was used to extend the analysed range towards the shortest wavelength in the UVA region. It is a simple radiometer composed of a meter and sensors. In this work, the UVA sensor was used. Its spectral range is between 315 nm and 400 nm, and the peak of its sensitivity is 365 nm, very close to the peak of the LED with the shortest peak wavelength. Its working range is between 100 μW m−2 and 2000 W m−2.

2.5. The Coloured LED Source

The source was composed of an integrating sphere with an internal diameter of 200 mm. The internal surface was covered in white diffusing paint with a reflectivity of about 0.8. It presented two opposite circular apertures. One of them was used as an output port and had a diameter of 32 mm; the second one accommodated 9 coloured LEDs. The two ports were separated by a baffle in the middle between the two ports, which covered about 40% of the median section of the sphere. This ensured that the light coming from the LEDs did not directly reach the output port but was reflected at least once on the baffle and the sphere port before it came out. This improved the uniformity of the radiance seen from the output port.
The LEDs were powered by the digital output ports of a National Instrument I/O board, NI USB 6008 [27]. It allowed for the LEDs to be switched on and off by a PC and the automated use of the source. For this application, 9 of the 12 digital I/O channels were used.
Figure 2 presents the spectral radiance at the output port when the 9 LEDs were switched on separately. The peaks of the LEDs are approximately evenly spaced along the visible range, from 360 nm to 720 nm, with a step of about 45 nm. Their full width at half maximum (FWHM) spans from 25 nm to 40 nm. The peak values are different, and the ratio between the more powerful LED and the weakest one is about 5. The number of LED types in the source was a compromise between the desired wavelength resolution on the instrument’s responsivity and the size of the integrating sphere and its input port. The same is also true for the number of the LEDs at the same peak wavelength: for most peak wavelengths, only one LED was used, as this was powerful enough; the weaker emission at 545 nm required the use of 2 LEDs. This dispersion of LED characteristics, which appears in Figure 2, was easily overcome by changing the exposure time for both the SQM and the camera. The thermal stability of the source is an important issue, which was accounted for; in fact, we waited long enough for thermal transients to have a negligible effect after each LED power up. The stability of the source was analysed by measuring the spectral radiance at the output port for each LED before and after each SQM/camera measure. The spectra differ by less than 0.1% of the peak value of the spectral radiance. That value was considered negligible in the evaluation of the uncertainty budget.
The spectral emission of the LED XSL-360-SE is minimally presented in Figure 2; in fact, its peak is outside the visible range at 360 nm. At that wavelength, our tested instruments showed their weakest response; therefore, the radiation at that wavelength was used to assess the lower wavelength limit of the SQM and the camera.
Usually, radiance reference sources, one of which is available at the Photometric Laboratory, are based on a halogen lamp, the spectrum of which is a good approximation of the Illuminant A. The latter is a theoretical source commonly used for the calibration of photometric and spectrometric instruments; its spectral distribution is proportional to that of a black body at 2856 K. The emitted light spans the whole visible range, and its spectral radiance is also represented in Figure 2 using an arbitrary scale.
The LEDs used in our source have a relatively narrow bandwidth compared to the spectral responsivity ranges of the analysed instruments. This allowed for them to be excited in a limited wavelength range, where there is reduced variation in instrument behaviour. The result was different from what can be obtained using the output of a monochromator, which can be characterised by a very narrow bandwidth, but it can be considered a cheap first approximation. Furthermore, the whole source, including its control system, can be easily used in the field and used to characterise instruments on site.
The uniformity of the radiance on the baffle source in the middle of the sphere was evaluated from the images recorded by the camera. The ratio of the standard deviation to the average value on the baffle was about 4%.

2.6. Measurements of Night Sky Spectral Radiance

The recordings of the spectral radiance of the night were collected in sites characterised by different levels of light pollution. The sites included Mößna in Austria, which is a low light pollution site; Asiago, on a plateau facing the Padana plain in Italy, a low–medium light pollution site; and Padova (Italy) within the Padana plain, with medium light pollution. The spectral distribution of the power emitted downward by the sky in Mößna and Padova was measured using a portable spectrometer. It was developed at the ARPAV specifically for light pollution and sky glow analysis. The data related in Asiago were recorded by the Asiago Faint Object Spectrograph and Camera (AFOSC), which is part of the facilities of the Ekar Observatory. The main characteristics of the two instruments are presented in [18].

3. Methods

The spectral responsivity of the SQM and camera channels were estimated, then the responsivity of the R, G and B channels of the camera were combined to obtain a responsivity as close as possible to that of the SQM, in terms of the least squares function approximation.
A significant part of this section explains a criterium for estimating the uncertainty boundary around the identified spectral responsivity.
All processing activities in this work were developed in a MATLAB® environment [28].

3.1. Measures for the Spectral Responsivity Estimate

A first approximation of the spectral responsivity of both the SQM and the camera was directly obtained from their respective outputs regarding their exposure to the LED lights. At the LED peak wavelengths, its value was set to be equal to the normalised instrument response. For two near-peak wavelengths, the spectral responsivity was obtained via interpolation of the values estimated at the peak wavelengths. To compensate for the different outputs of the source obtained when using the different LEDs, the outputs of the instruments have to be divided by the total radiance of the source for each specific LED. Therefore, the output of the LED source has to be characterised when each LED is on. The most important information is the spectral radiance at the output port. This was measured using the Konica-Minolta CS-1000 spectrometer for the visible LED, while for the UV LED, the total radiance was measured by the Deltaohm HD 9021 radiometer, its spectral distribution was estimated according to the LED manufacturer. The results were already presented in Figure 2.
A further processing was conducted to improve knowledge regarding the instrument’s responsivity. After a first approximation of the responsivity was obtained, as stated above, the instrument responses to the LED spectral radiances were evaluated by convolving that responsivity estimate with the LED spectra. The differences between the new response estimates and those in the previous phase were used to correct the previous estimate of the spectral responsivity of the instrument; a fraction of the difference, considering its signed value, was directly added to the new estimated responsivity at the peak LED wavelengths. The refining process continued for a maximum of 100 iterations, or until either the new estimate of the instrument’s output differed from the measured output by less than 0.1% of the measured value or it differed from the result of the previous step by less than 0.1%. The latter case meant no further convergence occurred.
The evaluation of the responses to the LEDs requires that the responsivity is known across the entire wavelength range. These values were obtained by applying Modified Akima cubic Hermite interpolation between the results that corresponded to near-peak wavelengths. This interpolation method reduces overshoots compared to a cubic interpolation. For spectral responsivity similar to those analysed, the residual error was found to be related to the second derivative of the responsivity. Therefore, to obtain a further reduction in error, a correction proportional to the estimate of the second derivative was also applied.

3.2. Uncertainty on the Spectral Responsivity Estimate

To obtain an evaluation of the limit of the error or of the uncertainty in the reconstruction of the spectral responsivity of the analysed instruments, the following process is used. It allows for this information on the reconstructed spectral responsivity to be evaluated, starting from the instrument responses to the LED narrowband sources and their uncertainties. The spectral measurement of the spectral radiance of the LED source measured by the CS-1000 spectrometer was used to evaluate the tristimulus values at the output port of the source. These were obtained by calculating the weighted sums of the measured spectral radiance values; the weighting functions are the colour matching functions x ¯ λ , y ¯ λ , z ¯ λ , defined by the Commission International de l’Éclairage (CIE) [29]. The colour matching functions, x ¯ , y ¯ and z ¯ , are represented in Figure 3a,c,e, respectively, by the thin, continuous black lines. The values of those weighted sums, the tristimulus values of the normalised LED radiances, were used to reconstruct the colour matching functions themselves; the reconstruction process used was the one presented above. The LED tristimulus values are represented in the related section of Figure 3 by empty circles with black contour. The choice of the colour matching functions as a test bench was due to their similarity with the expected responsivity of the R, G and B channels of the camera; they essentially highlight the long, the medium and the short wavelengths, respectively. The first approximations of the colour matching functions, obtained through the iterative process, are presented in Figure 3 by red, dashed lines. As expected, errors appeared in the first estimates of the colour matching functions; these are indicated in Figure 3b,d,f by red, dashed lines. As a consequence of these errors, evaluating the tristimulus values using the estimates of the colour matching function gave values which diverged from the real ones; these are represented in Figure 3a,c,d by empty red squares. In Figure 3b,d,f, the second derivative of the colour matching functions and its estimate are represented by solid black and red lines, respectively. It should be noted that the errors in the estimates of the colour matching functions are correlated with the second derivative of the function we want to estimate. The correlation coefficients between them are 0.75, 0.92 and 0.83, respectively, for the functions x ¯ , y ¯ , z ¯ . The correspondent p-values are practically zero, several tens of orders of magnitude below the measurement uncertainties of the spectral radiance values. Considering the second derivative of the estimates, the correlation coefficient values decrease to 0.46, 0.76 and 0.71, which represent a weaker dependence; this is particularly true for the colour matching function x ¯ . The estimates of the colour matching functions obtained after the corrections based on the estimate of the second derivatives and the correspondent errors are represented by the blue lines in Figure 3a–f. The new estimates of the tristimulus values, represented by blue dots, are closer to the right values.
Table 1 shows the errors caused by the two approximations of the tristimulus values associated with the normalised LED radiances. The second approximation almost always improves the quality of the tristimulus estimates; this is certainly the case for the average of the absolute values of the tristimulus errors. These error values can be considered a basis for the estimates of the uncertainties we can meet in the evaluation of the responsivity of the R, G and B channels of the camera. As presented in Table 2, the second approximations of the colour matching functions present a reduction in the maximum absolute error and also a reduced mean squared error along the working range. The maximum values are about 10% for all functions, while the mean squared errors are 4.2% for the function x ¯ and 2.8% for the functions y ¯ and z ¯ . All percentage values refer to the maximum value of the functions themselves. The value for the function x ¯ demonstrates its greater variability, as it presents two local maximums. Even if functions y ¯ and z ¯ present the same mean squared errors, the low value for function z ¯ occurs mainly because this function stays close to the zero value for more than half of the considered wavelength range.
Differences in the behaviour of the three functions can be highlighted by considering two parameters. The first one ( S 1 ) explains how the function is focused on a portion of its domain of definition; it is defined by the mean value normalised to the maximum of the function:
S 1 = 1 λ m a x λ m i n f λ d λ m a x λ λ m i n , λ m a x f λ
The second index ( S 2 ) describes the total absolute variation of a function within its domain; it is defined by the integral of the absolute value of the derivative of the function over the maximum of the function itself:
S 2 = 1 2 f λ d λ m a x λ λ m i n , λ m a x f λ
Division by 2 allows for the parameter S 2 to be equal to 1 for a function, showing one monotonic growth and a monotonic decrease which returns it to the initial value.
As a reference, a value equal to 1 for the parameter S 1 means that the function is constant over its entire domain. Meanwhile, a rectangular function with a value other than zero in 1/5 of its domain of definition presents a value equal to 0.2, much like a triangular function that is non-zero in 2/5 of its domain. For the functions x ¯ , y ¯ and z ¯ , the values of the parameter S 1 are 0.21, 0.23, 0.13, respectively; this means that the function z ¯ is more focused on a portion of the visible range than x ¯ and y ¯ .
The values of the index S 2 describing the total down–up and up–down variation of the functions x ¯ , y ¯ and z ¯ are 1.33, 1.00 and 1.00, respectively. These values highlight the different behaviour of the function x ¯ , which has two local maximums.
Aiming at constructing a tool to obtain an approximation of the errors in the estimation of the responsivity of the camera channels and of the SQM, a relationship was sought between the errors in the function estimates (see Figure 3b,d,f) and the errors in the estimate of the tristimulus values (see also Table 1).
Figure 3 shows that the errors in the estimate present significant fluctuation within the LED bandwidth. The analysis of the errors in the tristimulus values of the LED light did not allow for the fastest ones to be highlighted; LED emission with finite wavelength bandwidth acts as a low-pass filter against fluctuation on the approximating functions.
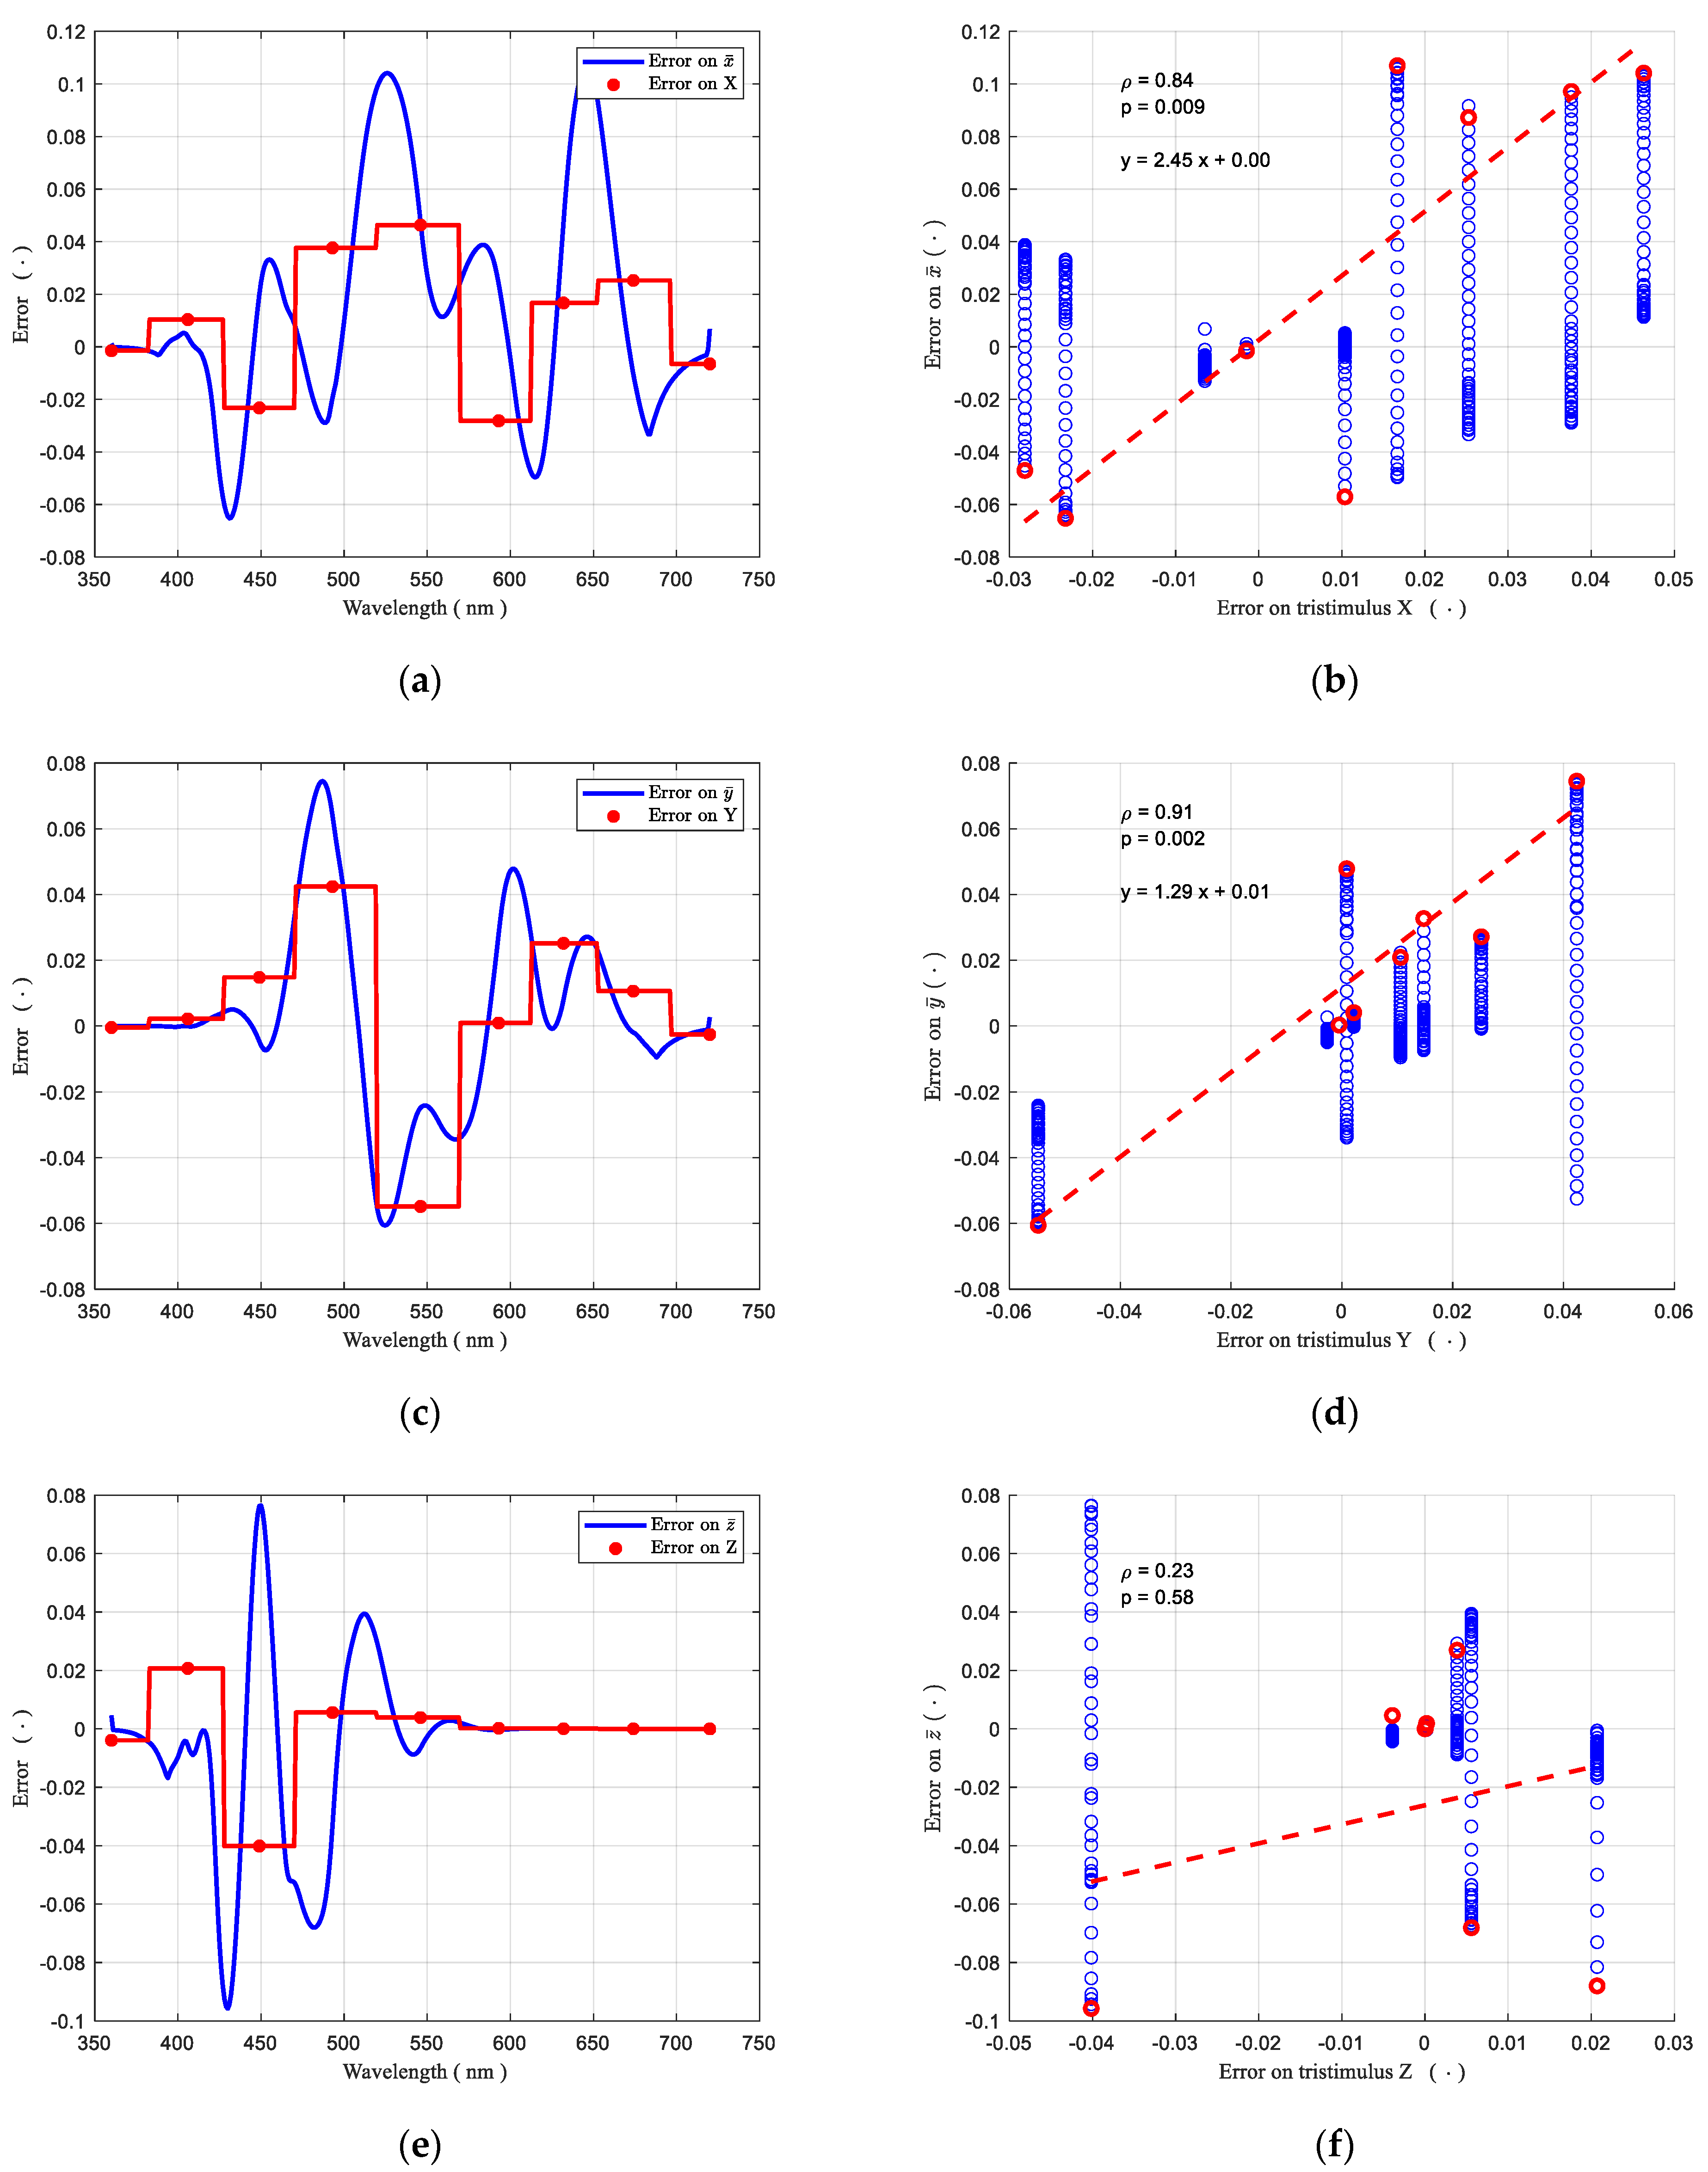
Figure 4a,c,e shows the relative error in the estimate of the functions x ¯ , y ¯ and z ¯ along the wavelengths of the visible range. There is the error superposed on the estimate of the tristimulus values, which was obtained by weighting the LED radiance with the estimated colour matching function. Both the error in the estimates of the colour matching functions and the errors in the tristimulus values were normalised to the maximum of the related colour matching function.
Conventionally, each tristimulus value is associated with the peak wavelength of the related LED, even if it depends on the behaviours of both the LED spectral radiance and of the weighting function in a range around the peak wavelength. This is graphically represented in Figure 4 using the step function. For each LED, the step centre is at its peak wavelength, and the step span roughly depicts the range in which the LED is most significant in estimating the matching function.
The step function divides the wavelength interval into as many sub-intervals as there are LEDs. The blue circles in Figure 4b,d,f show the values of the error in the matching functions of each sub-interval versus the error in the tristimulus. A value of the error in the tristimulus corresponds to multiple values of the error in the function. These values may or may not have the same sign as the error in the tristimulus. In the search for an upper limit for the error in the function estimates, in each sub-interval, the Pearson correlation coefficient ( ρ ) was found between the error in the function estimate with the maximum absolute extent and the error in the tristimulus. These values are presented in Figure 4 along with the probability of the null hypothesis (p). The correlation coefficient is more than 0.8, with a p-value of less than 5%, for the functions x ¯ and y ¯ , with the highest value (0.91) indicating that y ¯ is the smoothest function. On the contrary, as expected, the correlation is very weak for the function z ¯ , and its p-value is larger than 5%. The least squares linear function fitting the maximum errors in the estimated function (red circle) is represented by a dashed line in Figure 4 for all the colour matching functions. These approximations have an intercept with the vertical axis close to zero; therefore, they estimate that the maximum error in the function approximation is equal to zero when the tristimulus error is zero. This is not true, as is shown in Figure 4c,d.
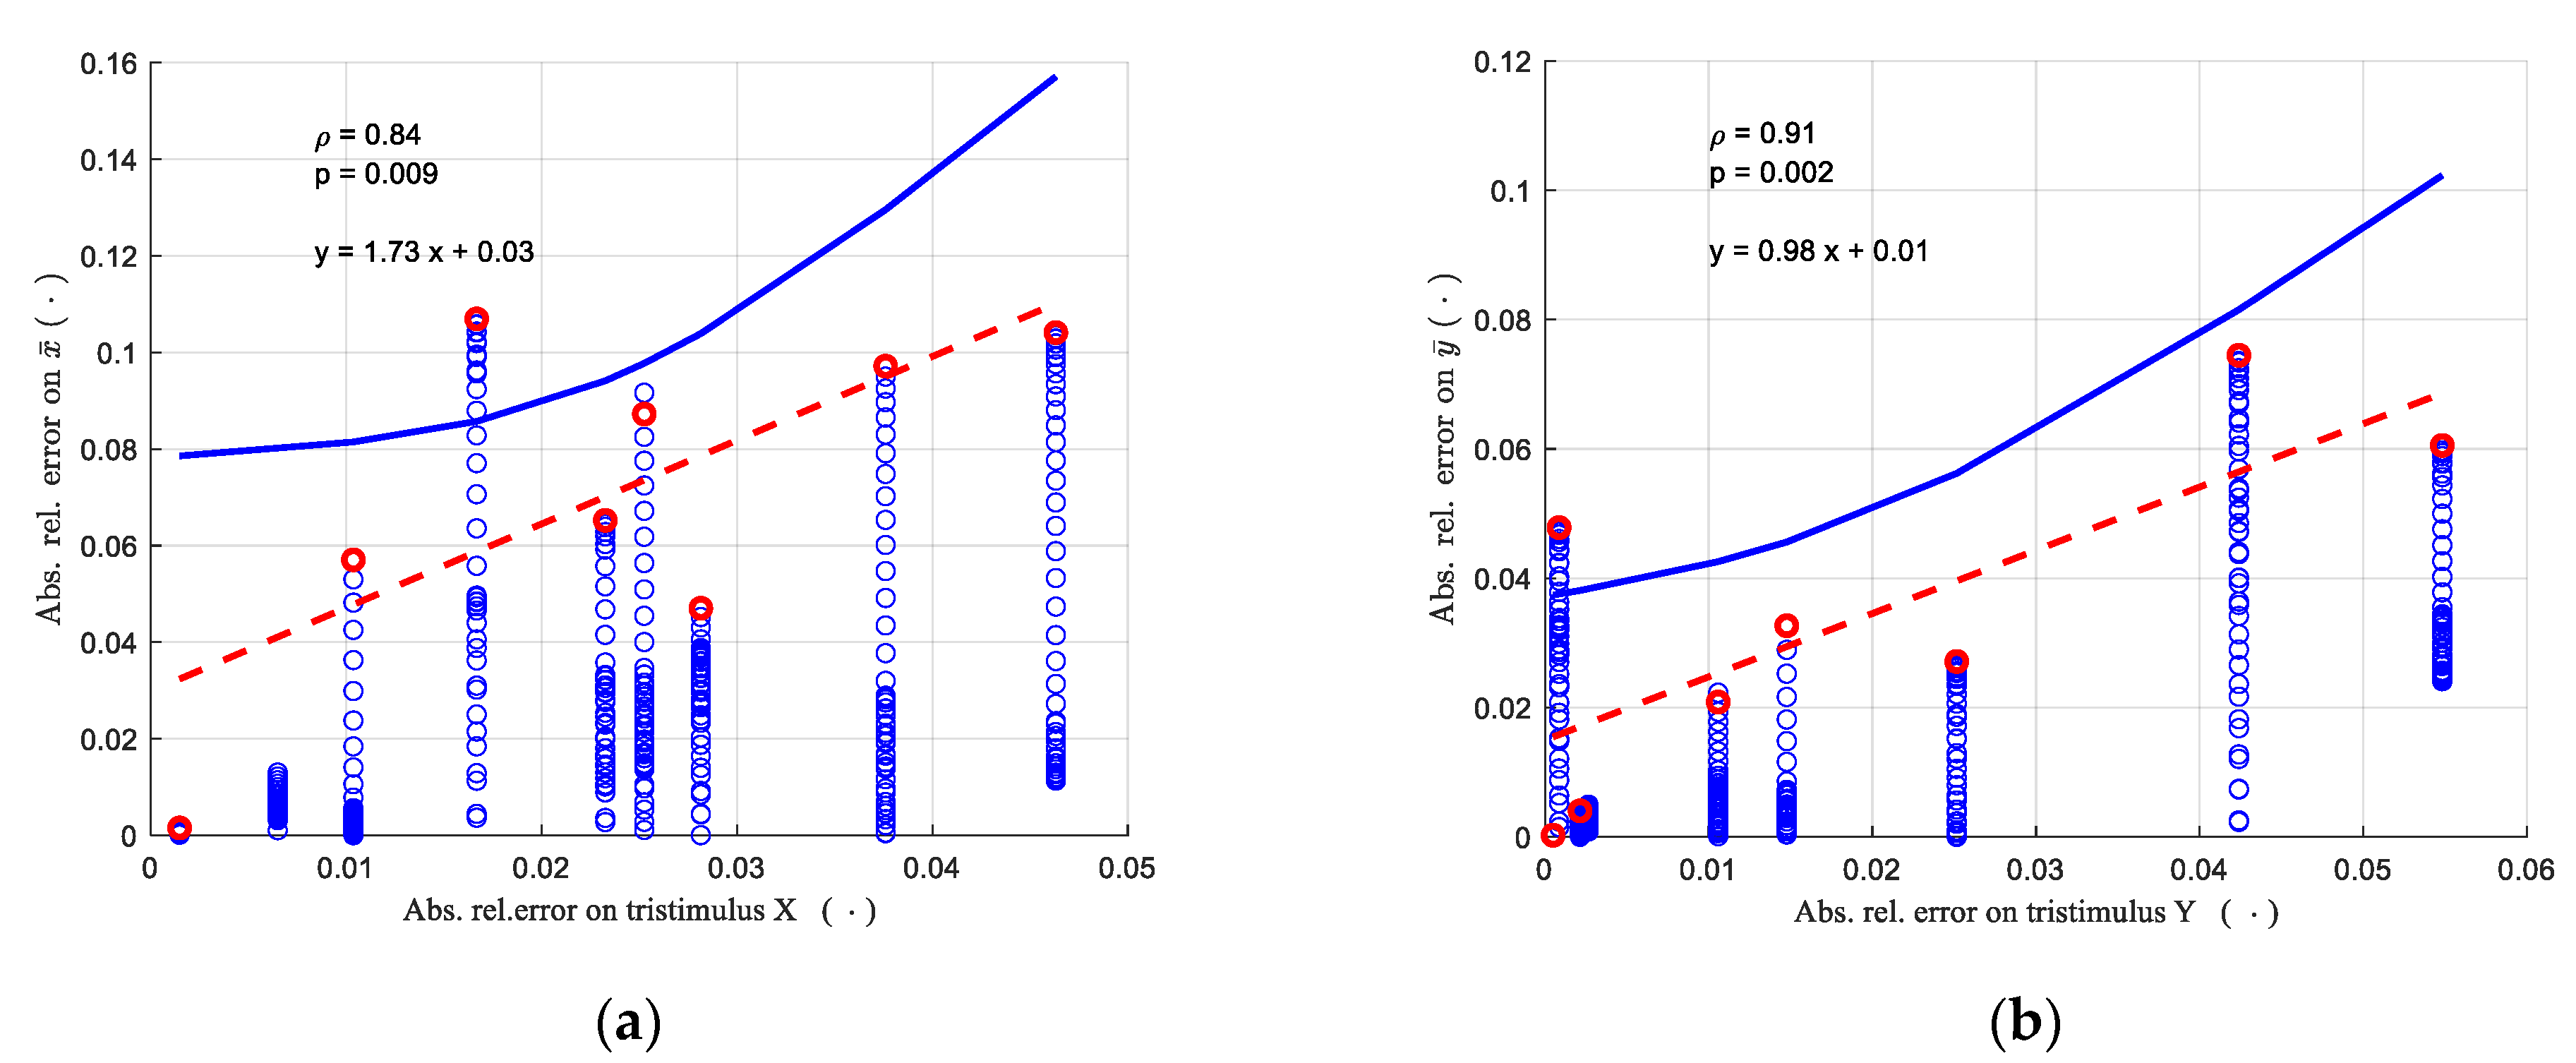
A better estimate of the limit of the errors in the function estimates can be obtained by considering the absolute values of the errors. These are presented in Figure 5 for the functions x ¯ and y ¯ only, as more significant and higher correlation was found for these functions. Again, the Pearson correlation coefficient is high, and the probability of the null hypothesis is well below 5%. The red, dashed line represents the least squares linear function fitting of the absolute values of the maximum error in the function estimates, and the continuous blue line shows the upper bound of the prediction correspondent to a probability of 95%. These bounds correspond to the relative expanded uncertainties on the colour matching functions x ¯ and y ¯ , considering the expansion factor to be equal to 2.
These limits can be used to estimate the error at each wavelength in a specific sub-interval, starting from the error in the tristimulus value in the same interval. The results may be applied to the spectral responsivity of the R, G and B camera channels, in case they present similar behaviours to those of the x ¯ and y ¯ colorimetric functions.

3.3. Analysis of the SQM Radiometer

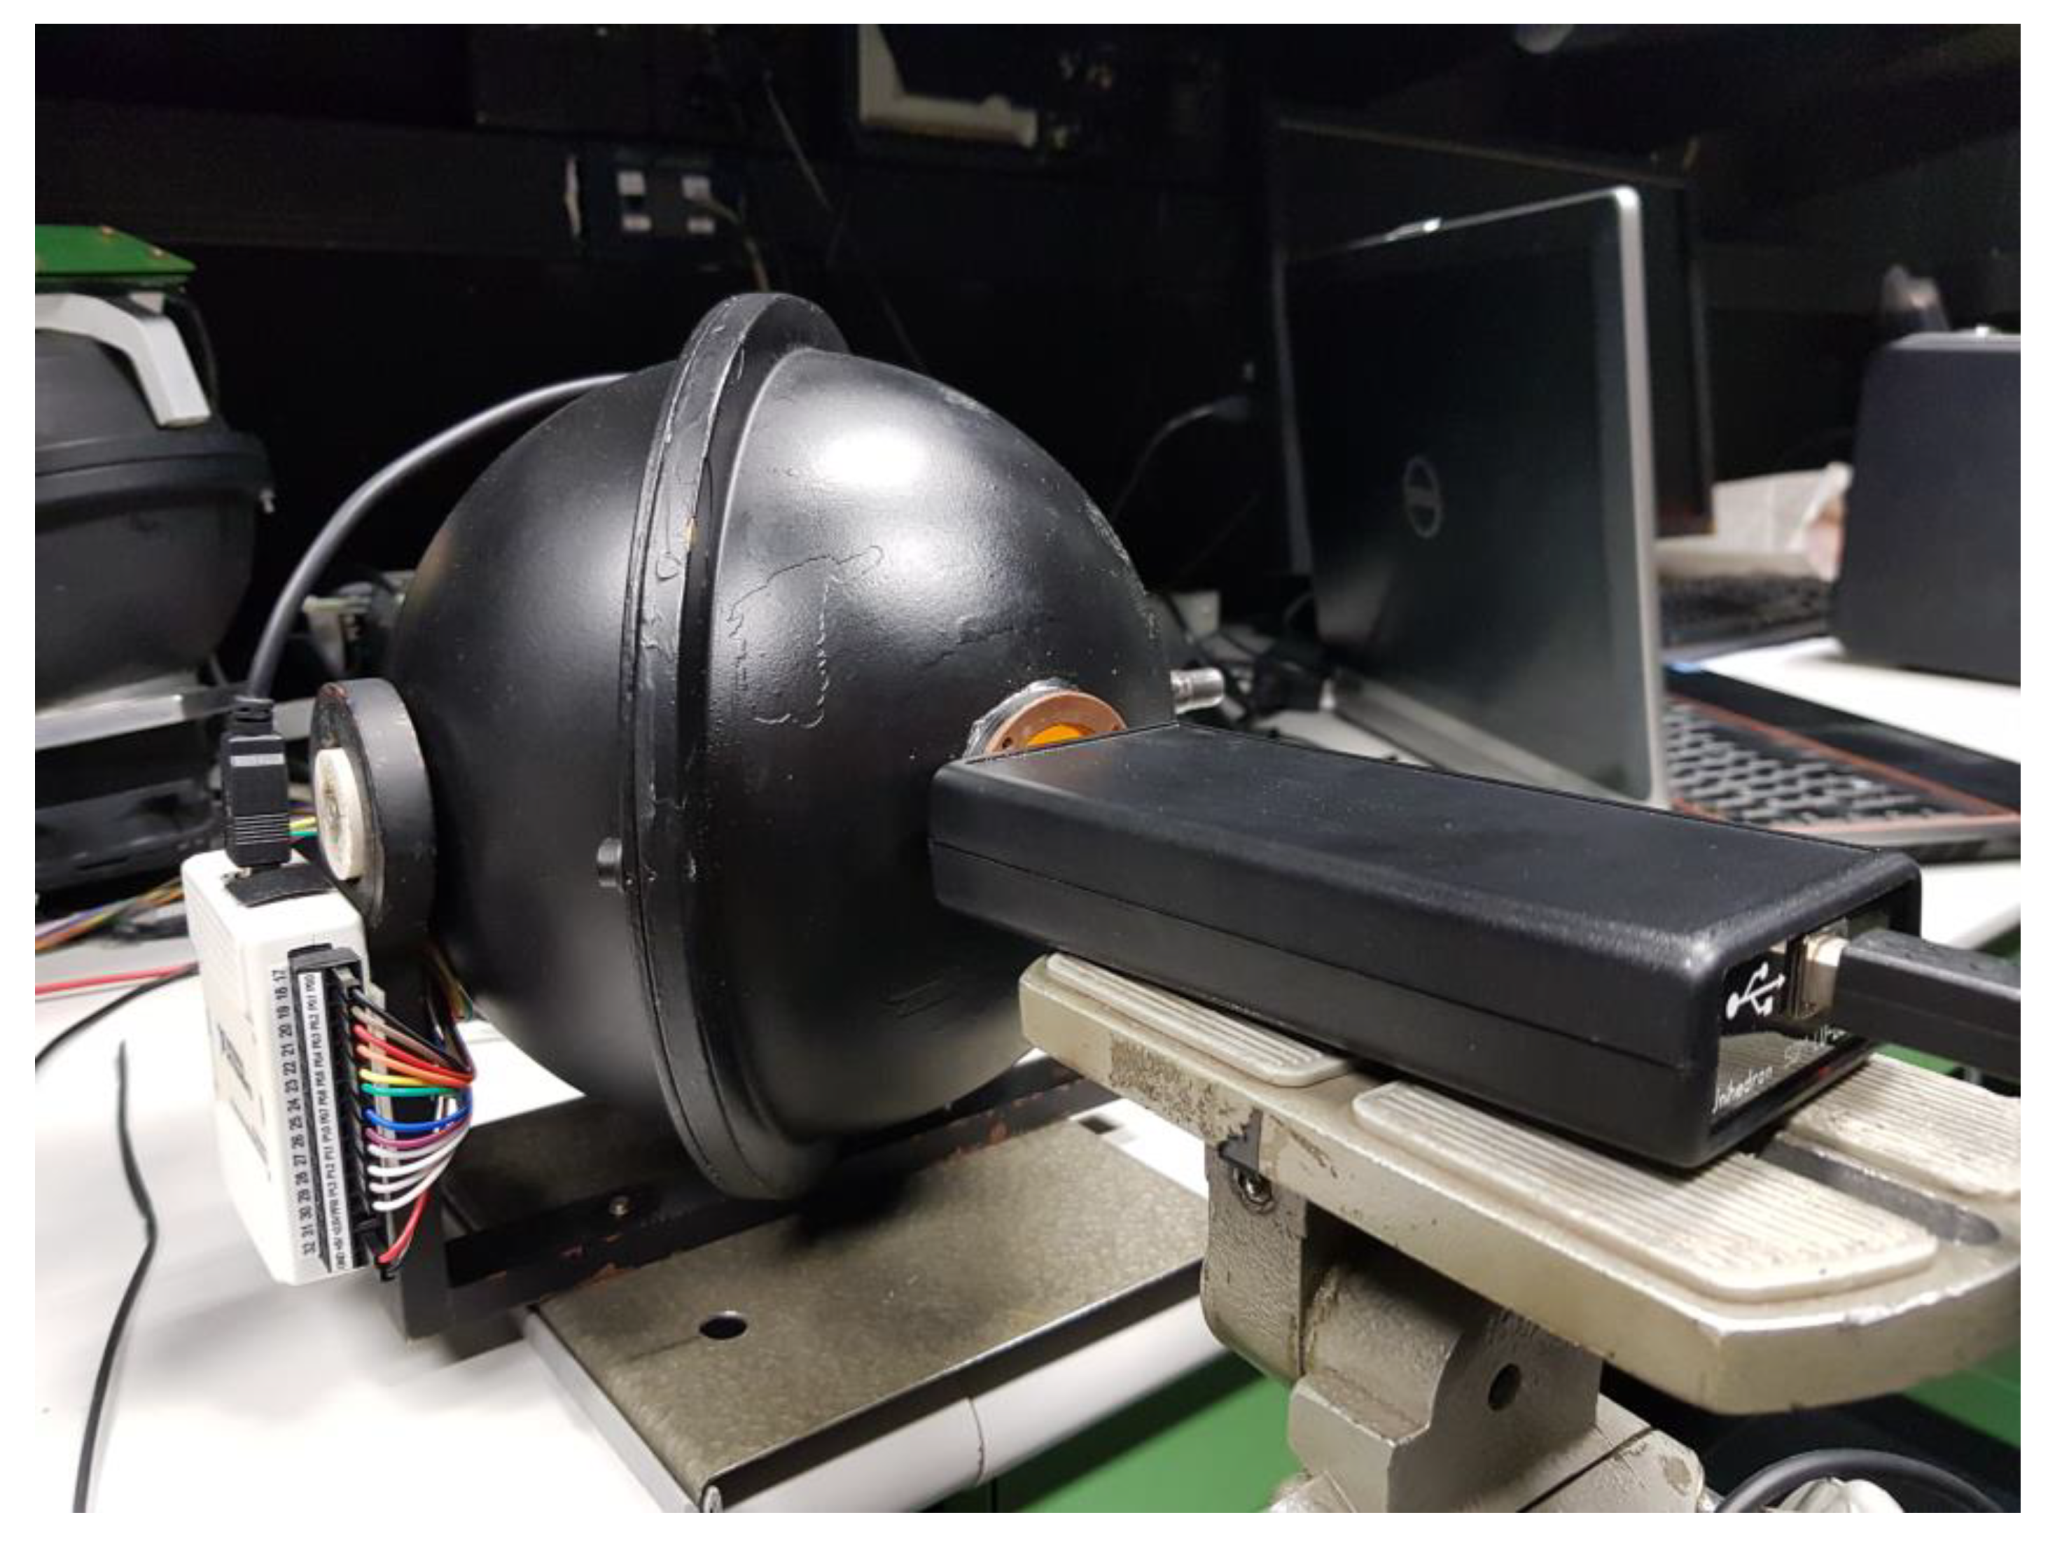
The response of the SQM was obtained by directly placing the SQM as close as possible to the output port of the LED source. Its output was then recorded. The close position, visible in Figure 6, allows the light to reach the front lens of the SQM from almost all directions. Furthermore, this way, the baffle in the middle of the sphere covers an angle of about 30°. As stated above, the considered SQM has a directional response with an aperture angle of 20°, and at 30°, it typically has a response of 1% or less than the value at 0°. The contribution of the source coming from outside the baffle can be considered negligible compared to that of the central area of the baffle.

3.4. Analysis of the Camera

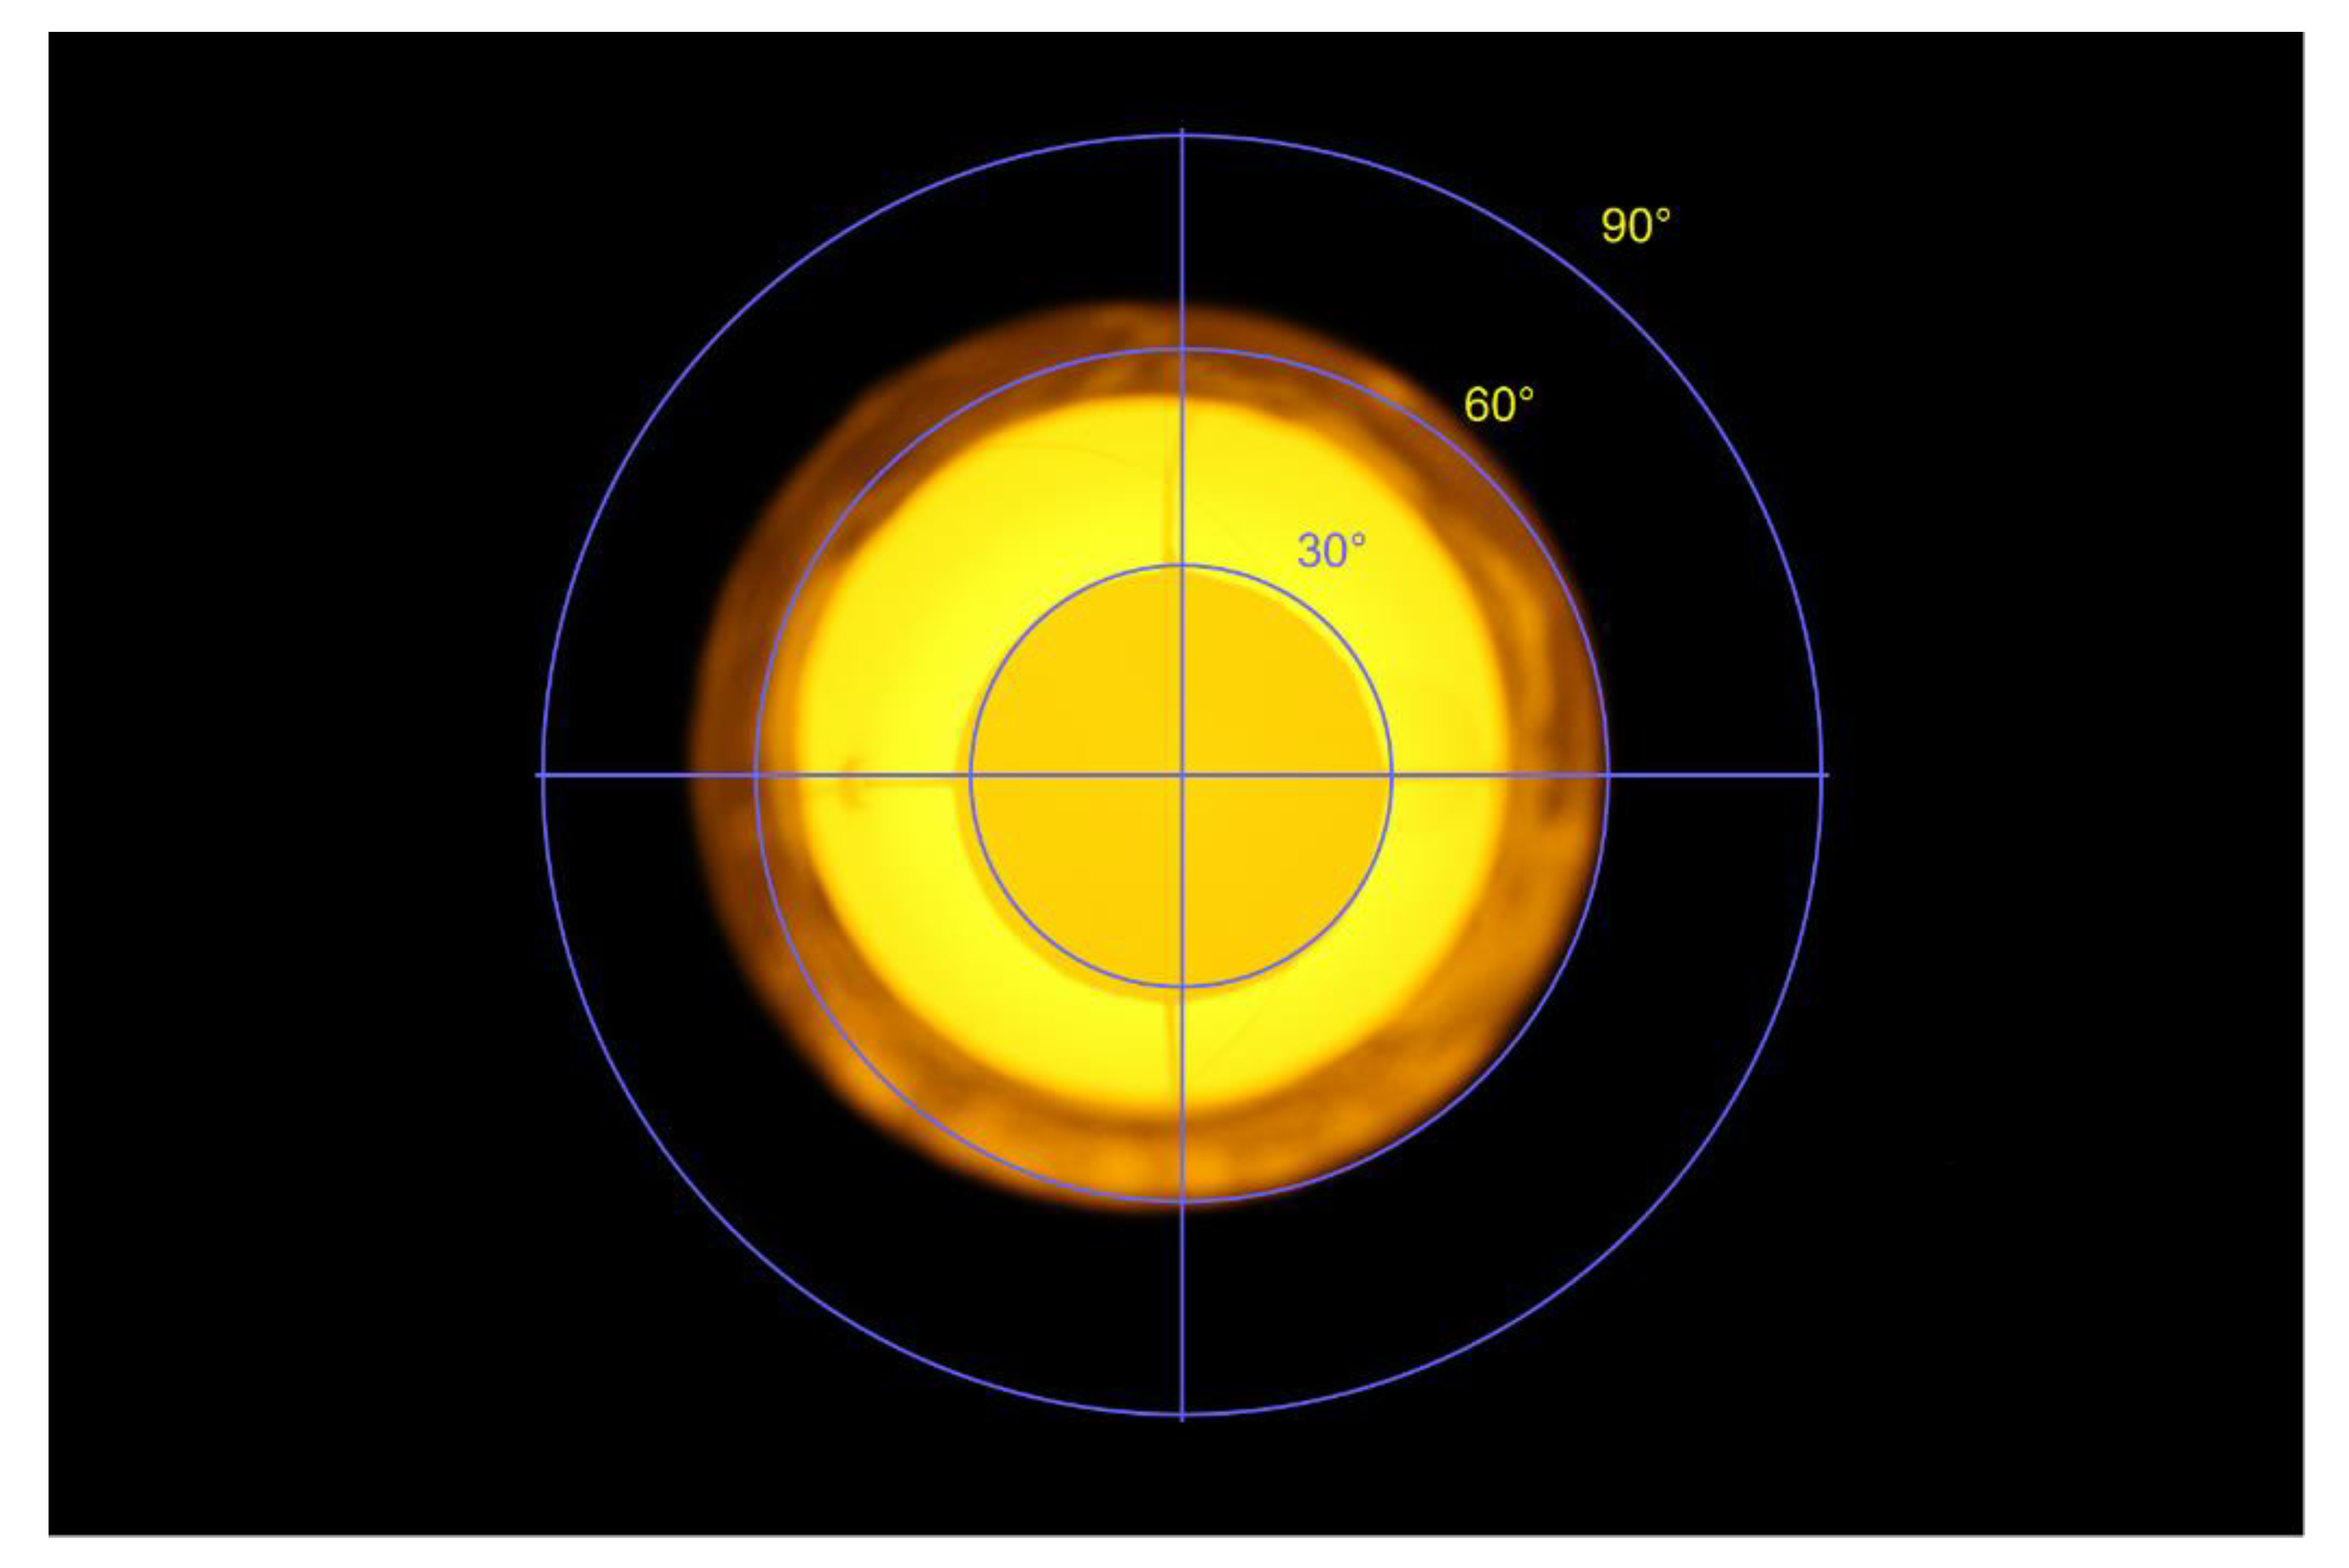
One image of the output port of the integrating sphere was collected by the camera under test conditions for each LED. An example is presented in Figure 7; it corresponds to the LED, the peak of which was at 593 nm. The camera provides both a JPEG (Joint Photographic Experts Group) and a raw CR2 file, according to the Canon standard. The latter was used for the analysis, as it allows values proportional to the output of the camera sensor to be directly considered. The code dcraw by Dave Coffin [30] was used to extract the information included in the CR2 files; new images were saved in the PGM (Portable Gray Map) format, which is easy to read and to process. In the conversion, no interpolation or colour scaling were applied, and the RGB values were saved as 16-bit values. All flips were disabled; therefore, each pixel of the PGM matrix corresponded to one pixel of the raw pixels of the sensor. The sensor uses a Bayer pattern; therefore, to have the same resolution on the image as on the sensor, the R, G and B values should be interpolated. Owing to the high resolution, redundant in the case of evaluating night sky brightness, the four pixels of the Bayer pattern are assumed to be in the same position, reducing the pixel resolution, which, however, remains overabundant. A matrix NxMx3 was created in Matlab to represent the RGB values, where N and M are half values of the row and of the column numbers of the sensor, respectively. When reading the CR2 files, the camera setting was saved in a log files: in particular the aperture, the shutter time and the ISO speed, which are used to normalise the sensor outputs.
To reduce the dispersion of the camera behaviour during data collection, and the consequential effect on the results, the ISO speed was set to a fixed value of 1600, and the lens aperture stayed at f/2.8, which is the value commonly used when looking at the night sky. Consequently, owing to the different values of the radiance produced by the different LEDs, the shutter time may be different for each image and is automatically selected by the camera. The shutter time values were always selected to avoid the saturation of each of the R, G and B channels, as it is assessed during the analysis of the images.
The DC offset of the images, as the sum of the value at the output when the exposure time is zero and the effect of the dark current for the used exposure time, was evaluated from the portion of the sensor that was not exposed. As the used lens was a fisheye, a large portion of the sensor was not used for each collected image, which is clearly visible in Figure 7. This allows for the information to be extracted directly from the analysed images, at the exposure time actually used. Once the DC offset values of the R, G and B channels were known, they were subtracted from the value in the matrix.
At last, the average values and the dispersion of the RGB channels’ outputs were evaluated in the central part of the images of the baffle, about 10% of the baffle area. They were the basis for the estimate of the spectral responsivity of the three channels.

4. Results

This section presents the results of the measurements of the response of the analysed camera and the SQM. Then, an approximation of the SQM’s responsivity is presented, which was obtained using the weighted sum of the responsivity of the R, G and B channels by applying the principle of least squares. The obtained approximating functions were used to evaluate the response difference in the presence of real sky spectral distributions recoded in sites with light pollution of low to medium–high levels. Furthermore, the NBS values obtained using the RGB camera were compared to measurements obtained from real SQMs.

4.1. Spectral Sensitivity of the RGB Channels

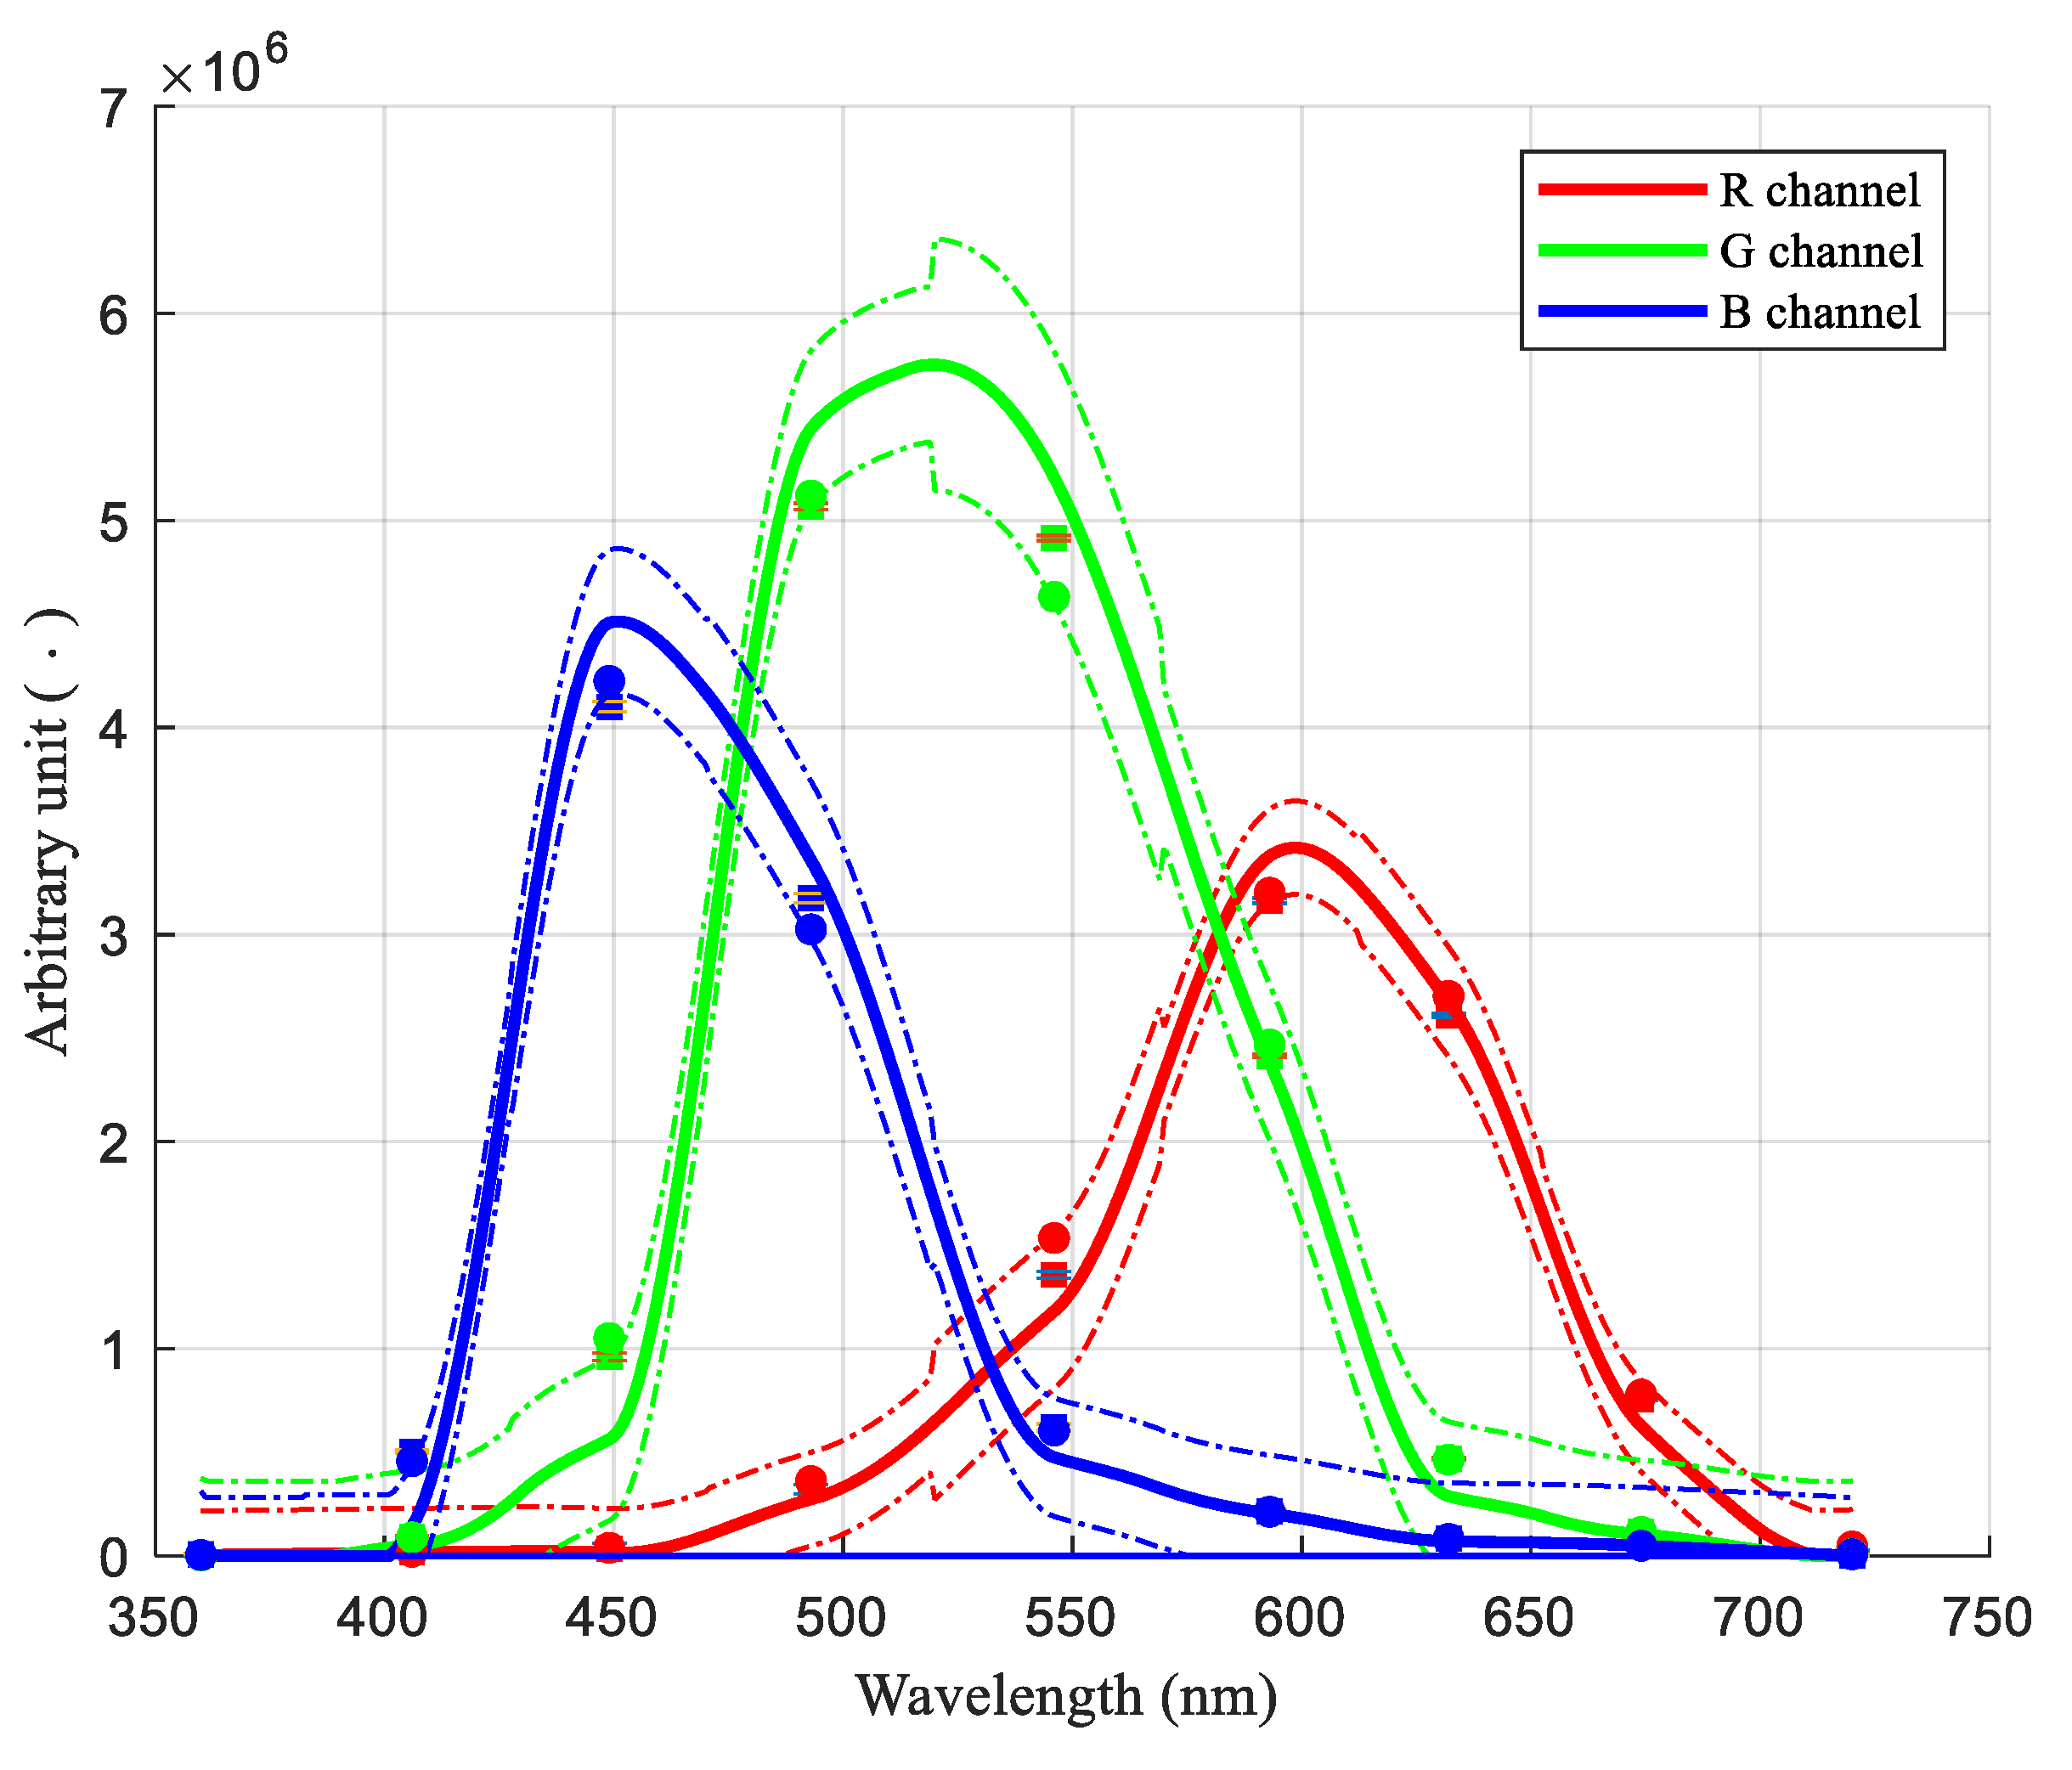
The average values of the output of the R, G and B channels in the central part of the CMOS sensor divided by the radiance measured by the CS-1000 spectrometer are the starting point for estimating the camera responsivity. These are represented in Figure 8 by squares. Even if the bandwidth of the LED is narrow, it is not negligible with respect to the bandwidth of the camera channels, which is of the order of hundreds of nanometres. An iterative process was applied as described in the Section 3 to improve the quality of the estimates; the results are presented in Figure 8, represented by coloured continuous lines. As for the colour matching functions, the shape of the r ¯ c a m , g ¯ c a m and b ¯ c a m functions, corresponding to the three camera channels, can be characterised by the S 1 and S 2 indices. The S 1 values are 0.29, 0.33 and 0.25, respectively, which are close or larger than the S 1 obtained for the colour matching function y ¯ , which exhibited the highest value. The S 2 index of the responsivity of each camera channel presents an e value equal one, which means that they do not have significant oscillations. Overall, comparing the spectral responsivity of the camera channels with the colour matching functions, they appear more similar to the function y ¯ and even smoother in their behaviours. This information can be used to evaluate the uncertainty of their estimates according to what was explained in Section 3.2.
The estimates of the functions r ¯ c a m , g ¯ c a m and b ¯ c a m were used to calculate the normalised output of the LEDs. These values are represented in Figure 8 by coloured dots at the peak wavelength of the related LED. The errors in the reconstructed R, G and B values due to normalised LED radiances were computed; they are presented in Table 3 as percentages of the maximum spectral responsivity of the related channel. The maximum value was about 5% for the R and G channels and about 3% for the B channel. The maximum errors occurred at the LED peak wavelengths in the centre of the analysed range. To describe the situation along the whole wavelength range, the average of the absolute value of the errors was considered; it is about 1% for the three channels.
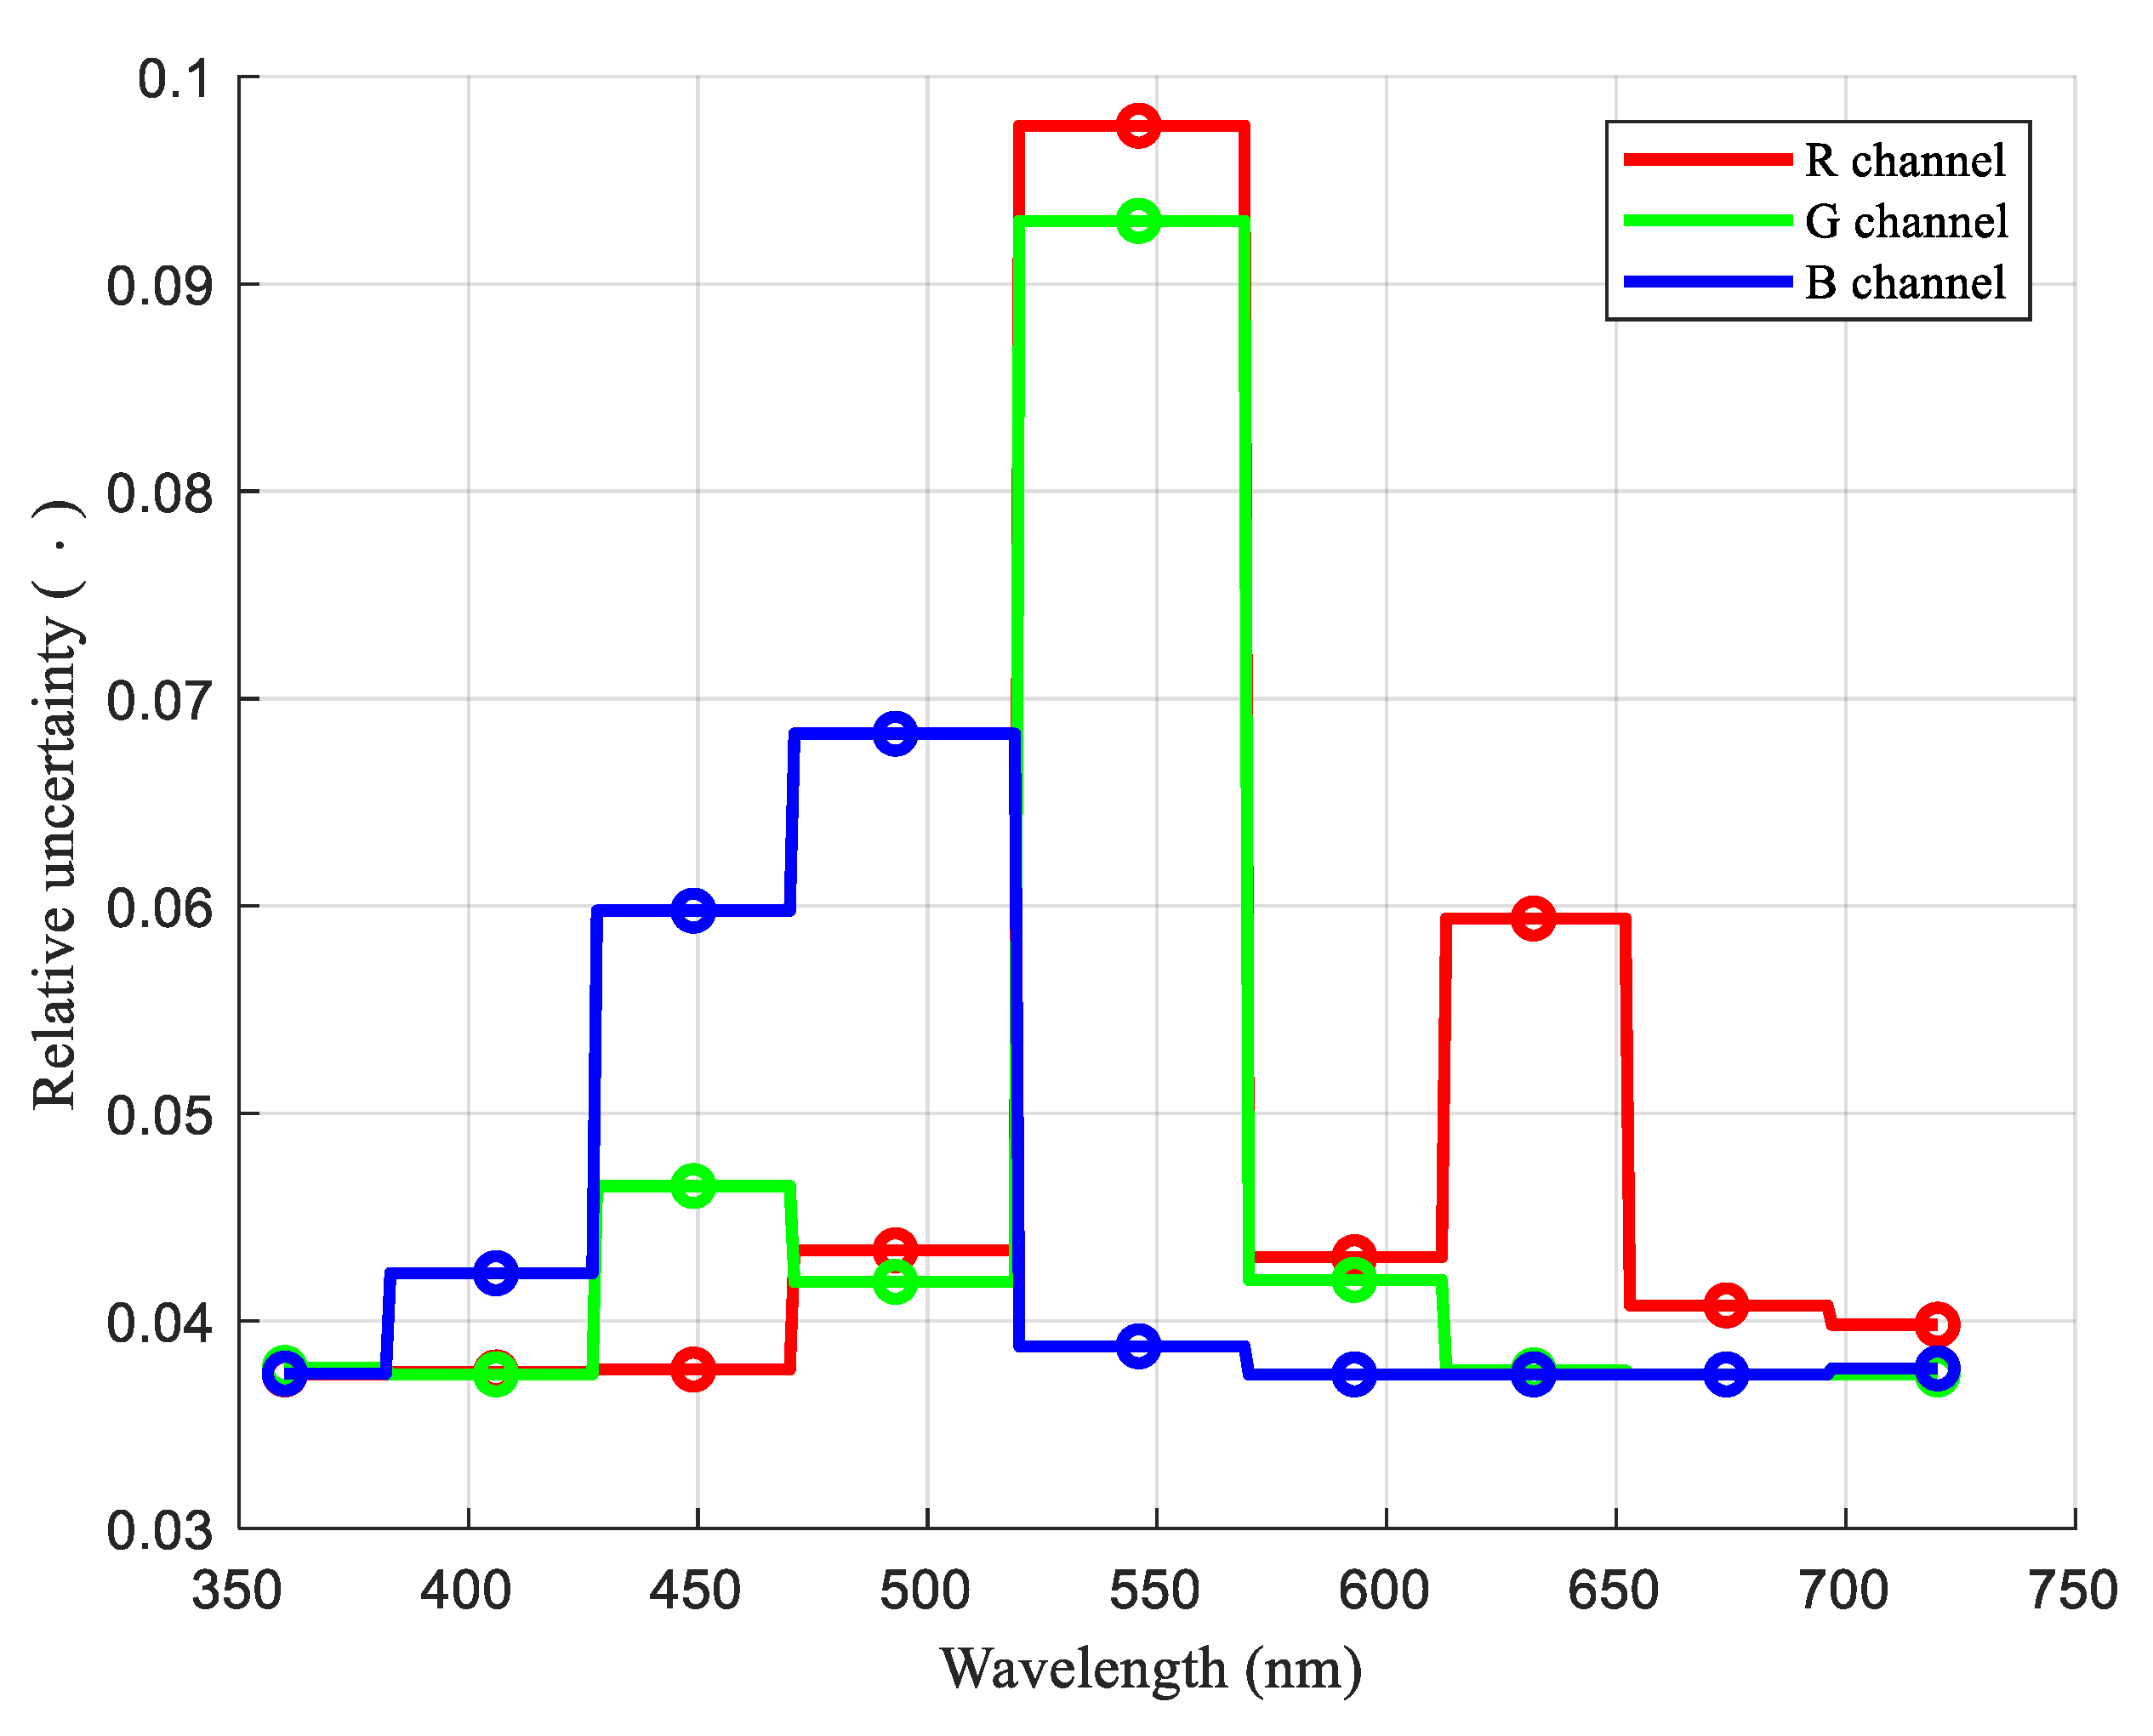
According to the results presented in Figure 5, and on the basis of the errors in the R, G and B values corresponding to the exposure to the considered LEDs, an evaluation of the uncertainty on the spectral responsivity of the R, G and B channels was conducted, with a confidence level of 95%. It is presented in Figure 9 along the entire wavelength range. The limit masks for the uncertainty of the r ¯ c a m , g ¯ c a m and b ¯ c a m functions are shown by the continuous line, while the circles highlight the peak wavelengths of the LEDs. The maximum uncertainties appear in the central part of the wavelength range and reach the value of about 10% for the R and G channels. These were added to the uncertainty of the flatness of the Konica Minolta CS100 spectrometer and converted into absolute values. The overall uncertainty was used to present the interval values around the estimated functions in Figure 8 using thin, dotted lines.
According to the results in Table 3, the R, G and B values evaluated by using the estimates of the r ¯ c a m , g ¯ c a m and b ¯ c a m functions present small errors on the left and right extremes of the wavelength range. It also suggests that the error in the function estimates themselves could be small; consequently, the estimated uncertainty may be overestimated.

4.2. SQM Spectral Responsivity and Its Least Square Approximation

By following the same method undertaken to evaluate the responsivity of each camera channel, the outputs of the SQM were used to estimate the SQM’s responsivity function; the result is presented in Figure 10. The SQM output, which is usually acquired in logarithmic scale, was converted into a linear scale by inverting Equation (1) before the optimising process. The squares in Figure 9 represent the linearised output values, while blue circles represent the estimated output based on the reconstructed spectral responsivity depicted by the continuous blue line. Around the latter, the thin, blue, dotted lines present the uncertainty mask with a 95% confidence level. The uncertainty estimates are based on the errors in the reconstructed linearised output values, which are shown in Table 4, and also account for the spectrometer uncertainty. The largest error happened for the LED, which peaked at 360 nm. It is a wavelength at which very little radiation is detected in ALAN characterisation; it is in the UV range, which is not useful for external lighting. The maximum error in the central portion of the visible range is about 3%, it is a value well below that of the measured SQM uncertainty declared by the manufacturer.
The approximation of the SQM by the RGB camera begins with the outputs to the radiance of the coloured LED of both the SQM and the camera themselves. The process looks for the linear combination of the outputs of the R, G and B channels to the LED lights, which more closely resembles the SQM outputs. The unknowns are the coefficients C R G B S Q M of the equation
R G B L E D C R G B S Q M = S Q M L E D
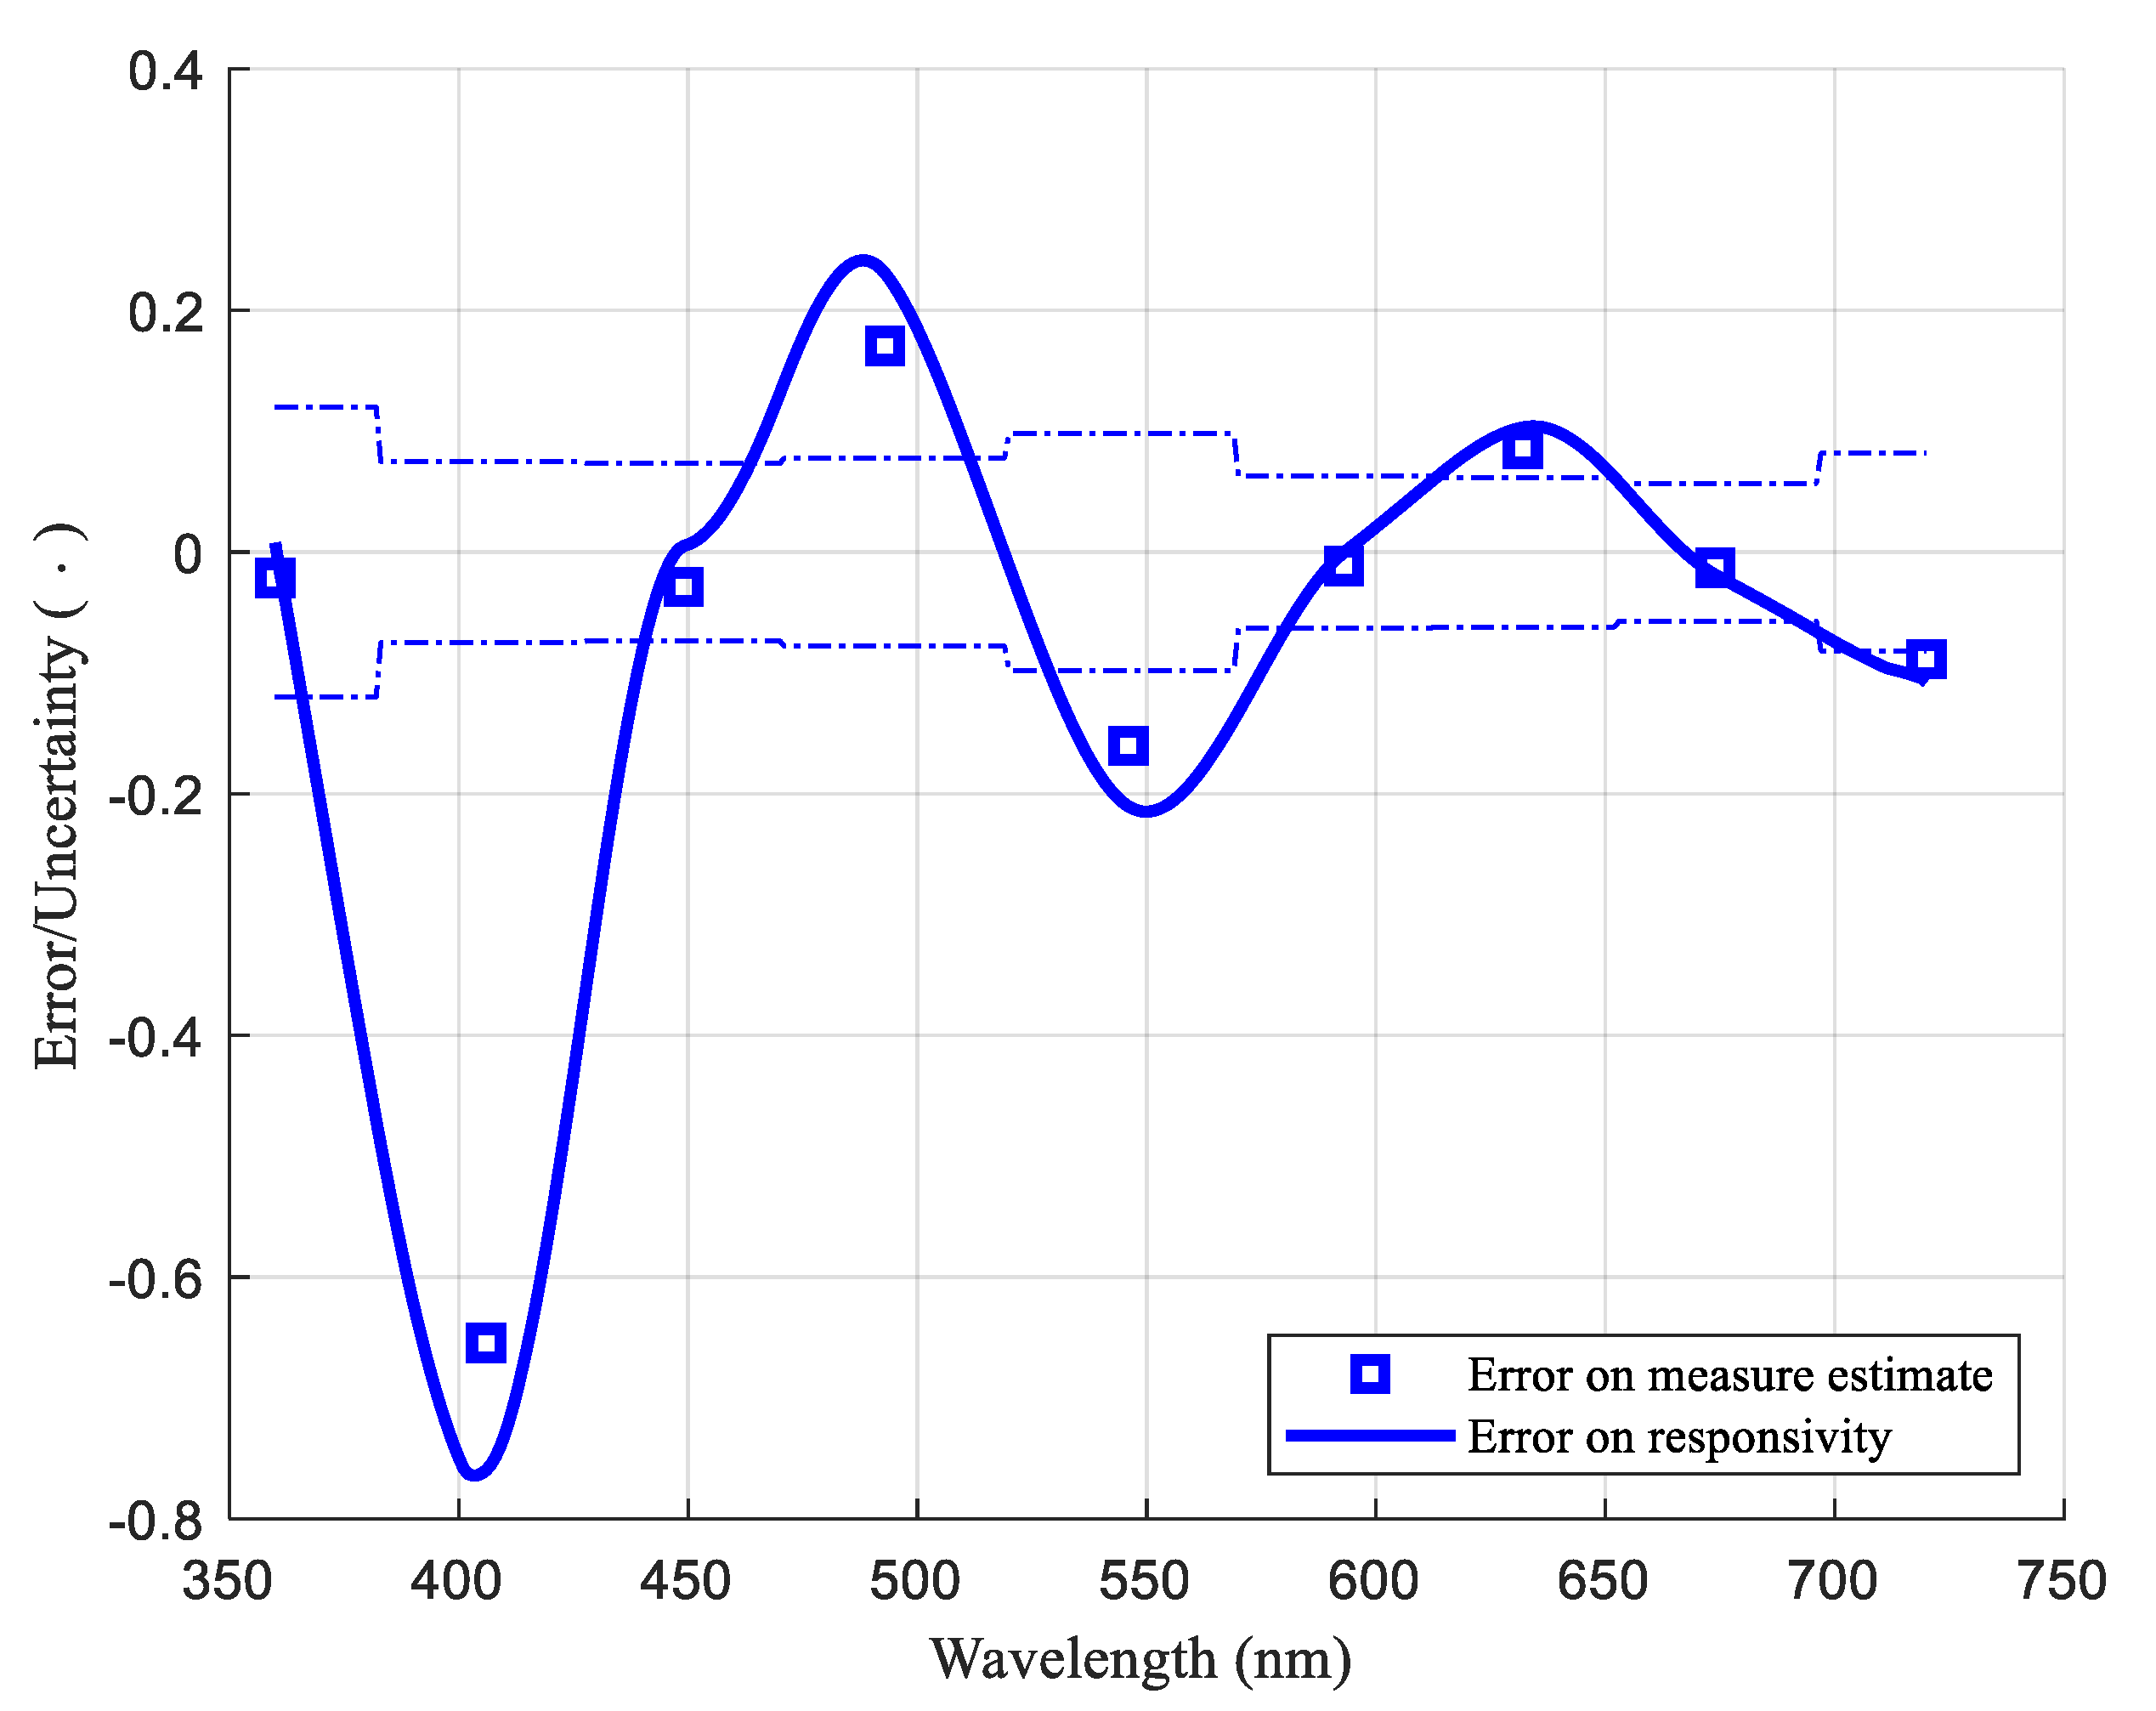
where R G B L E D is a matrix with as many rows as the number of the considered LEDs and one column for each of the R, G and B camera channels; S Q M L E D is a column with the SQM outputs to the LEDs. To improve the results, the outputs were scaled by the total radiance for each LED; the least squares method was applied. The best approximation of the SQM outputs obtained by linearly combining the outputs of the camera channels is presented in Figure 10, represented by red squares. The synthetic SQM provides zero response below 400 nm (at 360 nm), much like the camera channels. The latter are built to react to radiations as seen by the human eye, and at those wavelengths, human responsivity is very low: less than 1.3%, 0.04% and 4% of their maximum, respectively, for the colour matching functions x ¯ , y ¯ and z ¯ . The highest errors appear at 490 nm and about 550 nm. The differences between the estimated values of the SQM measures when using the RGB camera and the measured values are presented in Figure 11, represented by squares. Apart from the lowest wavelength range, where the error reaches the value of 65%, the error is always within 20% of the maximum SQM spectral responsivity.
The spectral responsivity of the synthetic SQM based on the camera was then evaluated; this is the linear combination of the spectral responsivity of the R, G and B channels by the same coefficients of the vector C R G B S Q M . Its estimate was obtained by combining the evaluated approximations of the functions r ¯ c a m , g ¯ c a m and b ¯ c a m ; the result is represented by the continuous red line in Figure 10. Around that line, the dotted lines show its uncertainty mask with a 95% confidence level.
Figure 11 also presents the difference between the approximation of the SQM spectral responsivity using the R, G and B channels’ responsivity and the estimated spectral responsivity of the SQM itself. Again, a large peak in error appears at the shortest wavelengths, where it reaches 76%; lower but significant errors have the values of around 20% at 480 nm and 550 nm. These are significant, as they overcome the limits of the uncertainty mask related to the difference between the spectral responsivity of the SQM and of its approximation, obtained by combining the camera channels. The mask is represented by the dotted lines in Figure 11.
A very similar result was obtained by directly approximating the estimate of the SQM’s spectral responsivity by linearly combining the spectral responsivity of the camera channels. The maximum difference is about 2.5%, which is considered negligible compared to the errors presented in Figure 11. However, basing the evaluation of the approximation of the SQM responsivity on the direct measures, i.e., the outputs of the SQM and the camera, was preferred, as this avoids other approximations and assumptions, such as interpolation between adjacent peak wavelengths.
The large amounts of error in the response to the LED at 405 nm and in the approximation of the spectral response at wavelengths shorter than 450 nm highlight an important consideration: the behaviours of the two instruments differ greatly in that wavelength range. Consequently, approximations of the response of an SQM radiometer obtained by combining the responses of the R, G and B channels will always fail in providing an accurate brightness value, e.g., within 0.1 magSQM, in the event that the night sky spectrum has a significant contribution at the shortest wavelength.

4.3. Cases of Real Night Sky Spectral Radiances

To quantify the extent of the error in real situations, real spectral distributions of the power scattered downward by the night sky were considered. The responses of the SQM and the synthetic SQM to them were computed and compared.
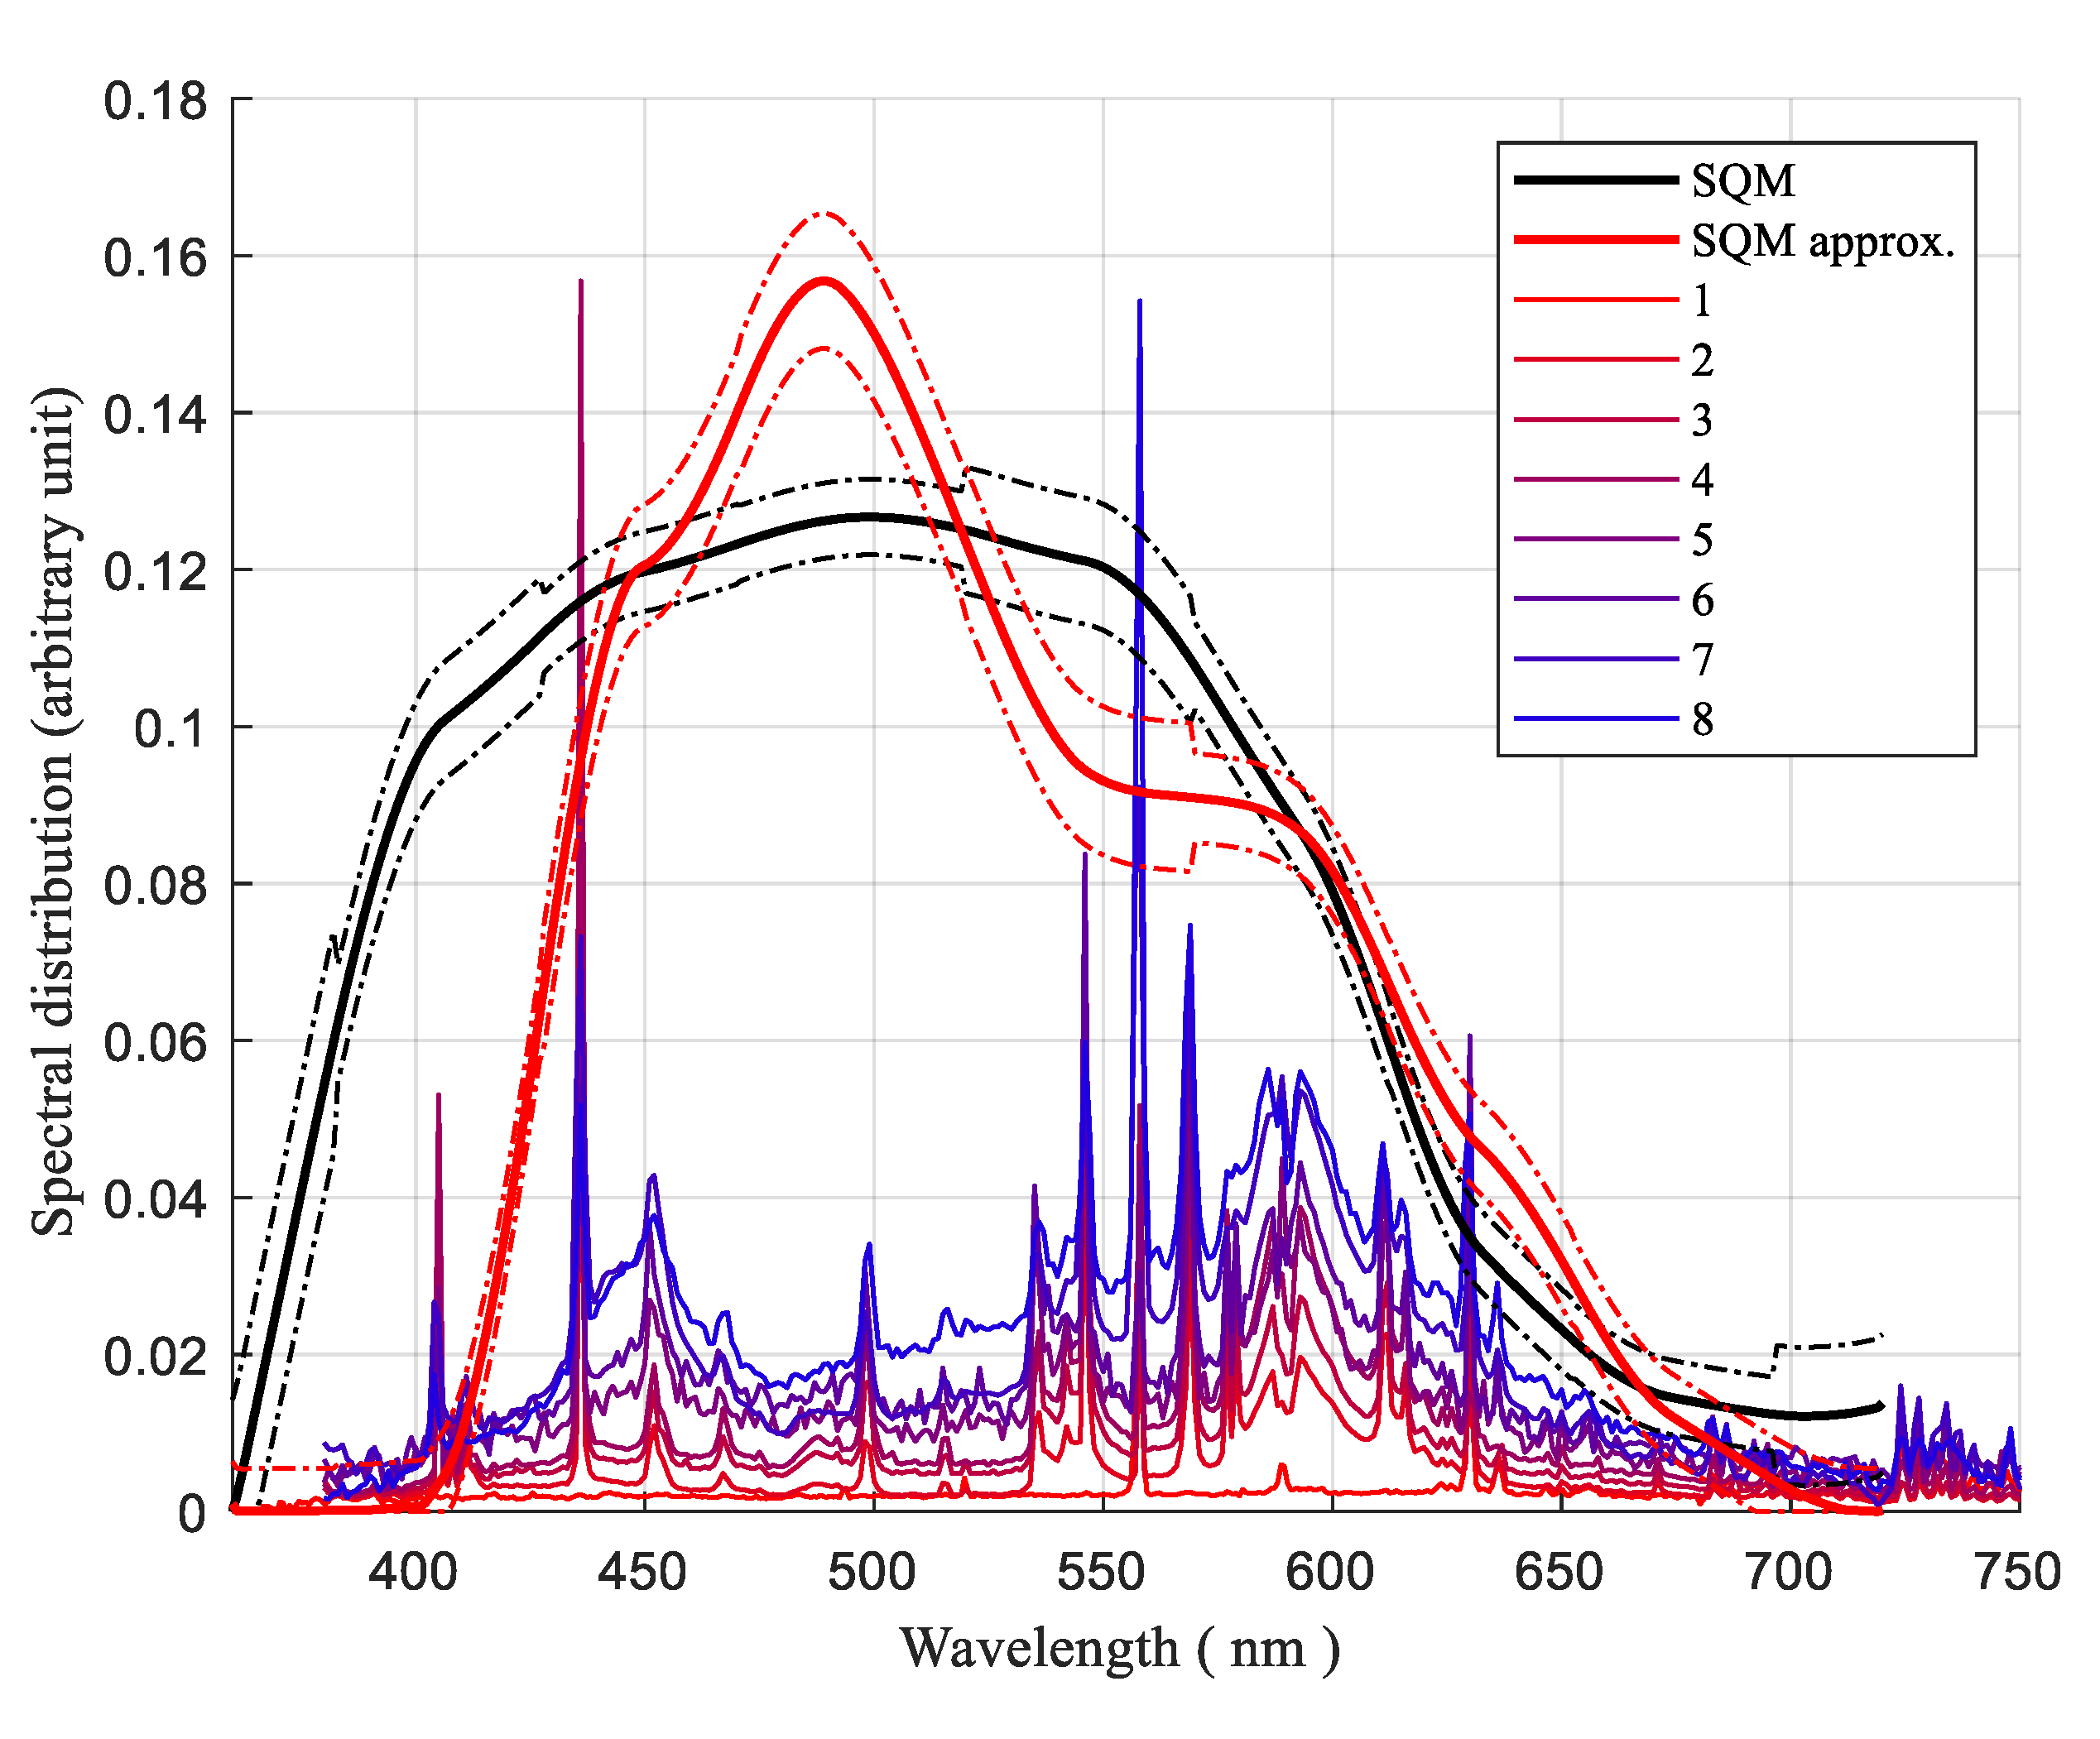
Some spectra of the night sky are presented in Figure 12; they are numbered according to the spectrum recorded on a site with very low light pollution (Mößna, Austria) and move through more polluted skies, affected by the light of high-pressure sodium lamps and, at the end, by the light emitted by white LED sources; the last spectra were recorded in Asiago and Padova. Some of these were already presented in [18]. The spectra are presented with increasing amplitudes, but this does not correspond to a real growth in the effect of ALAN; here, this scaling is only used to allow for a better presentation of the shapes of the spectra. However, they could represent a possible evolution of the night sky radiance for a site experiencing increasing light pollution and changes in outdoor lighting technology. Figure 12 also presents the measured spectral responsivity of an SQM and its reconstruction according to the responses of the camera channels. It allows for us to get a prompt idea of how the power at different wavelengths is weighted by the two spectral responsivity values. In particular, the increase in the power in the portion of the spectra at wavelengths below 450 nm is noteworthy; this is the wavelength range where the synthetic SQM has its largest approximation error.
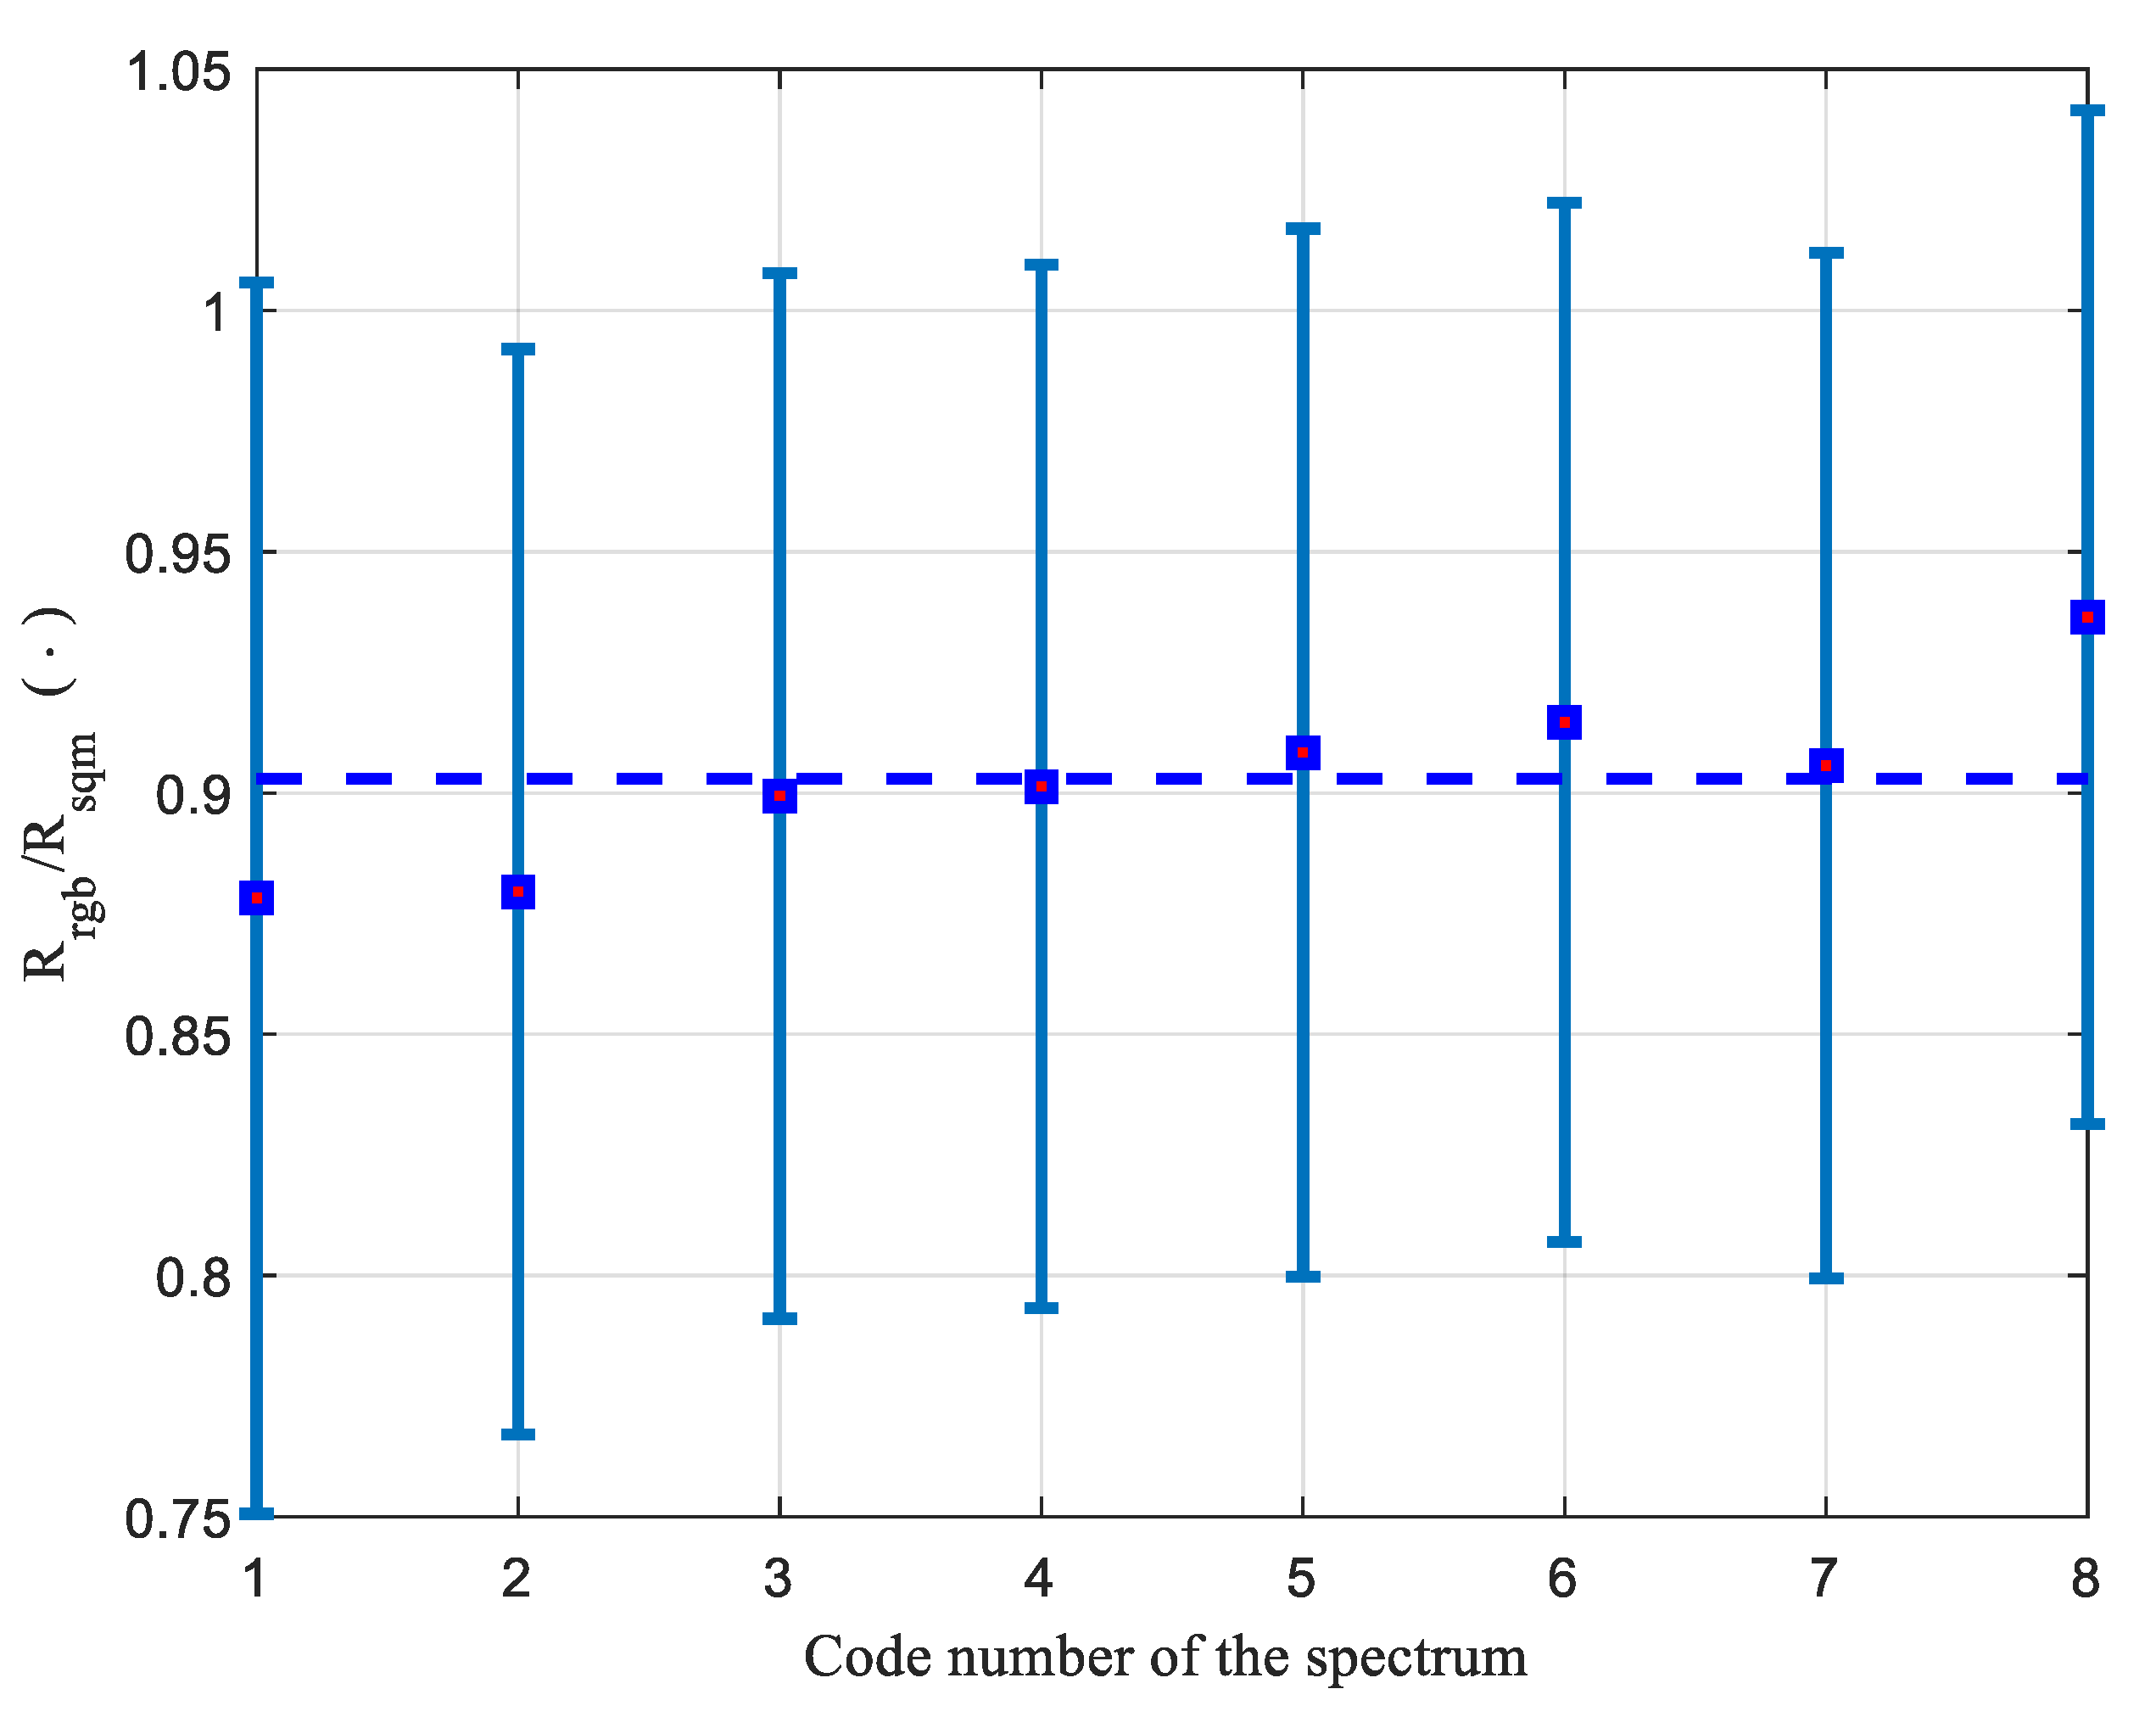
To compare the differing ability of the two instruments in evaluating sky brightness, their responses were evaluated for all the presented spectra. The ratios between the responses of the synthetic SQM ( R r g b ) to those of the SQM itself ( R s q m ) were then calculated and are presented in Figure 13 alongside the code number assigned to the spectra. The bars around the ratio values account for the uncertainty of the measurement of the spectral responsivity of the SQM and of the R, G and B channels of the camera: a 95% confidence level. The closer the ratio is to unit, the better the camera approximates the SQM. The average value of the ratio is very close to 90%; this suggests that a spectral correction factor equal to 1.11 should be applied to correct the response of the synthetic SQM when it considers the radiance from the night sky. This correction mainly compensates for the weak values of its spectral responsivity at the shortest wavelengths. Clearly, that correction factor should be used only for measurements of night sky brightness; theoretically, there should be a correction factor for each spectral distribution of night sky radiance.
The suggested correction relies on the spectra analysed in this work; slightly different values could be evaluated if different spectral distributions were taken into consideration. Furthermore, the choice to use the average value leaves residual errors in the evaluation of the NSB of less-polluted and more-polluted sites. A different option that can be used is the introduction of a spectral correction factor, which improves the approximation of the NSB for unpolluted and lightly polluted sites, but at the same time worsens the NSB evaluation in highly polluted sites. In any case, even at the same site and using the same camera, variations in the spectral density of ALAN cause a drift in NSB evaluations, which occurs regardless of the total upward emitted power. The drift is apparent in Figure 13, passing through the spectra considered in this study.
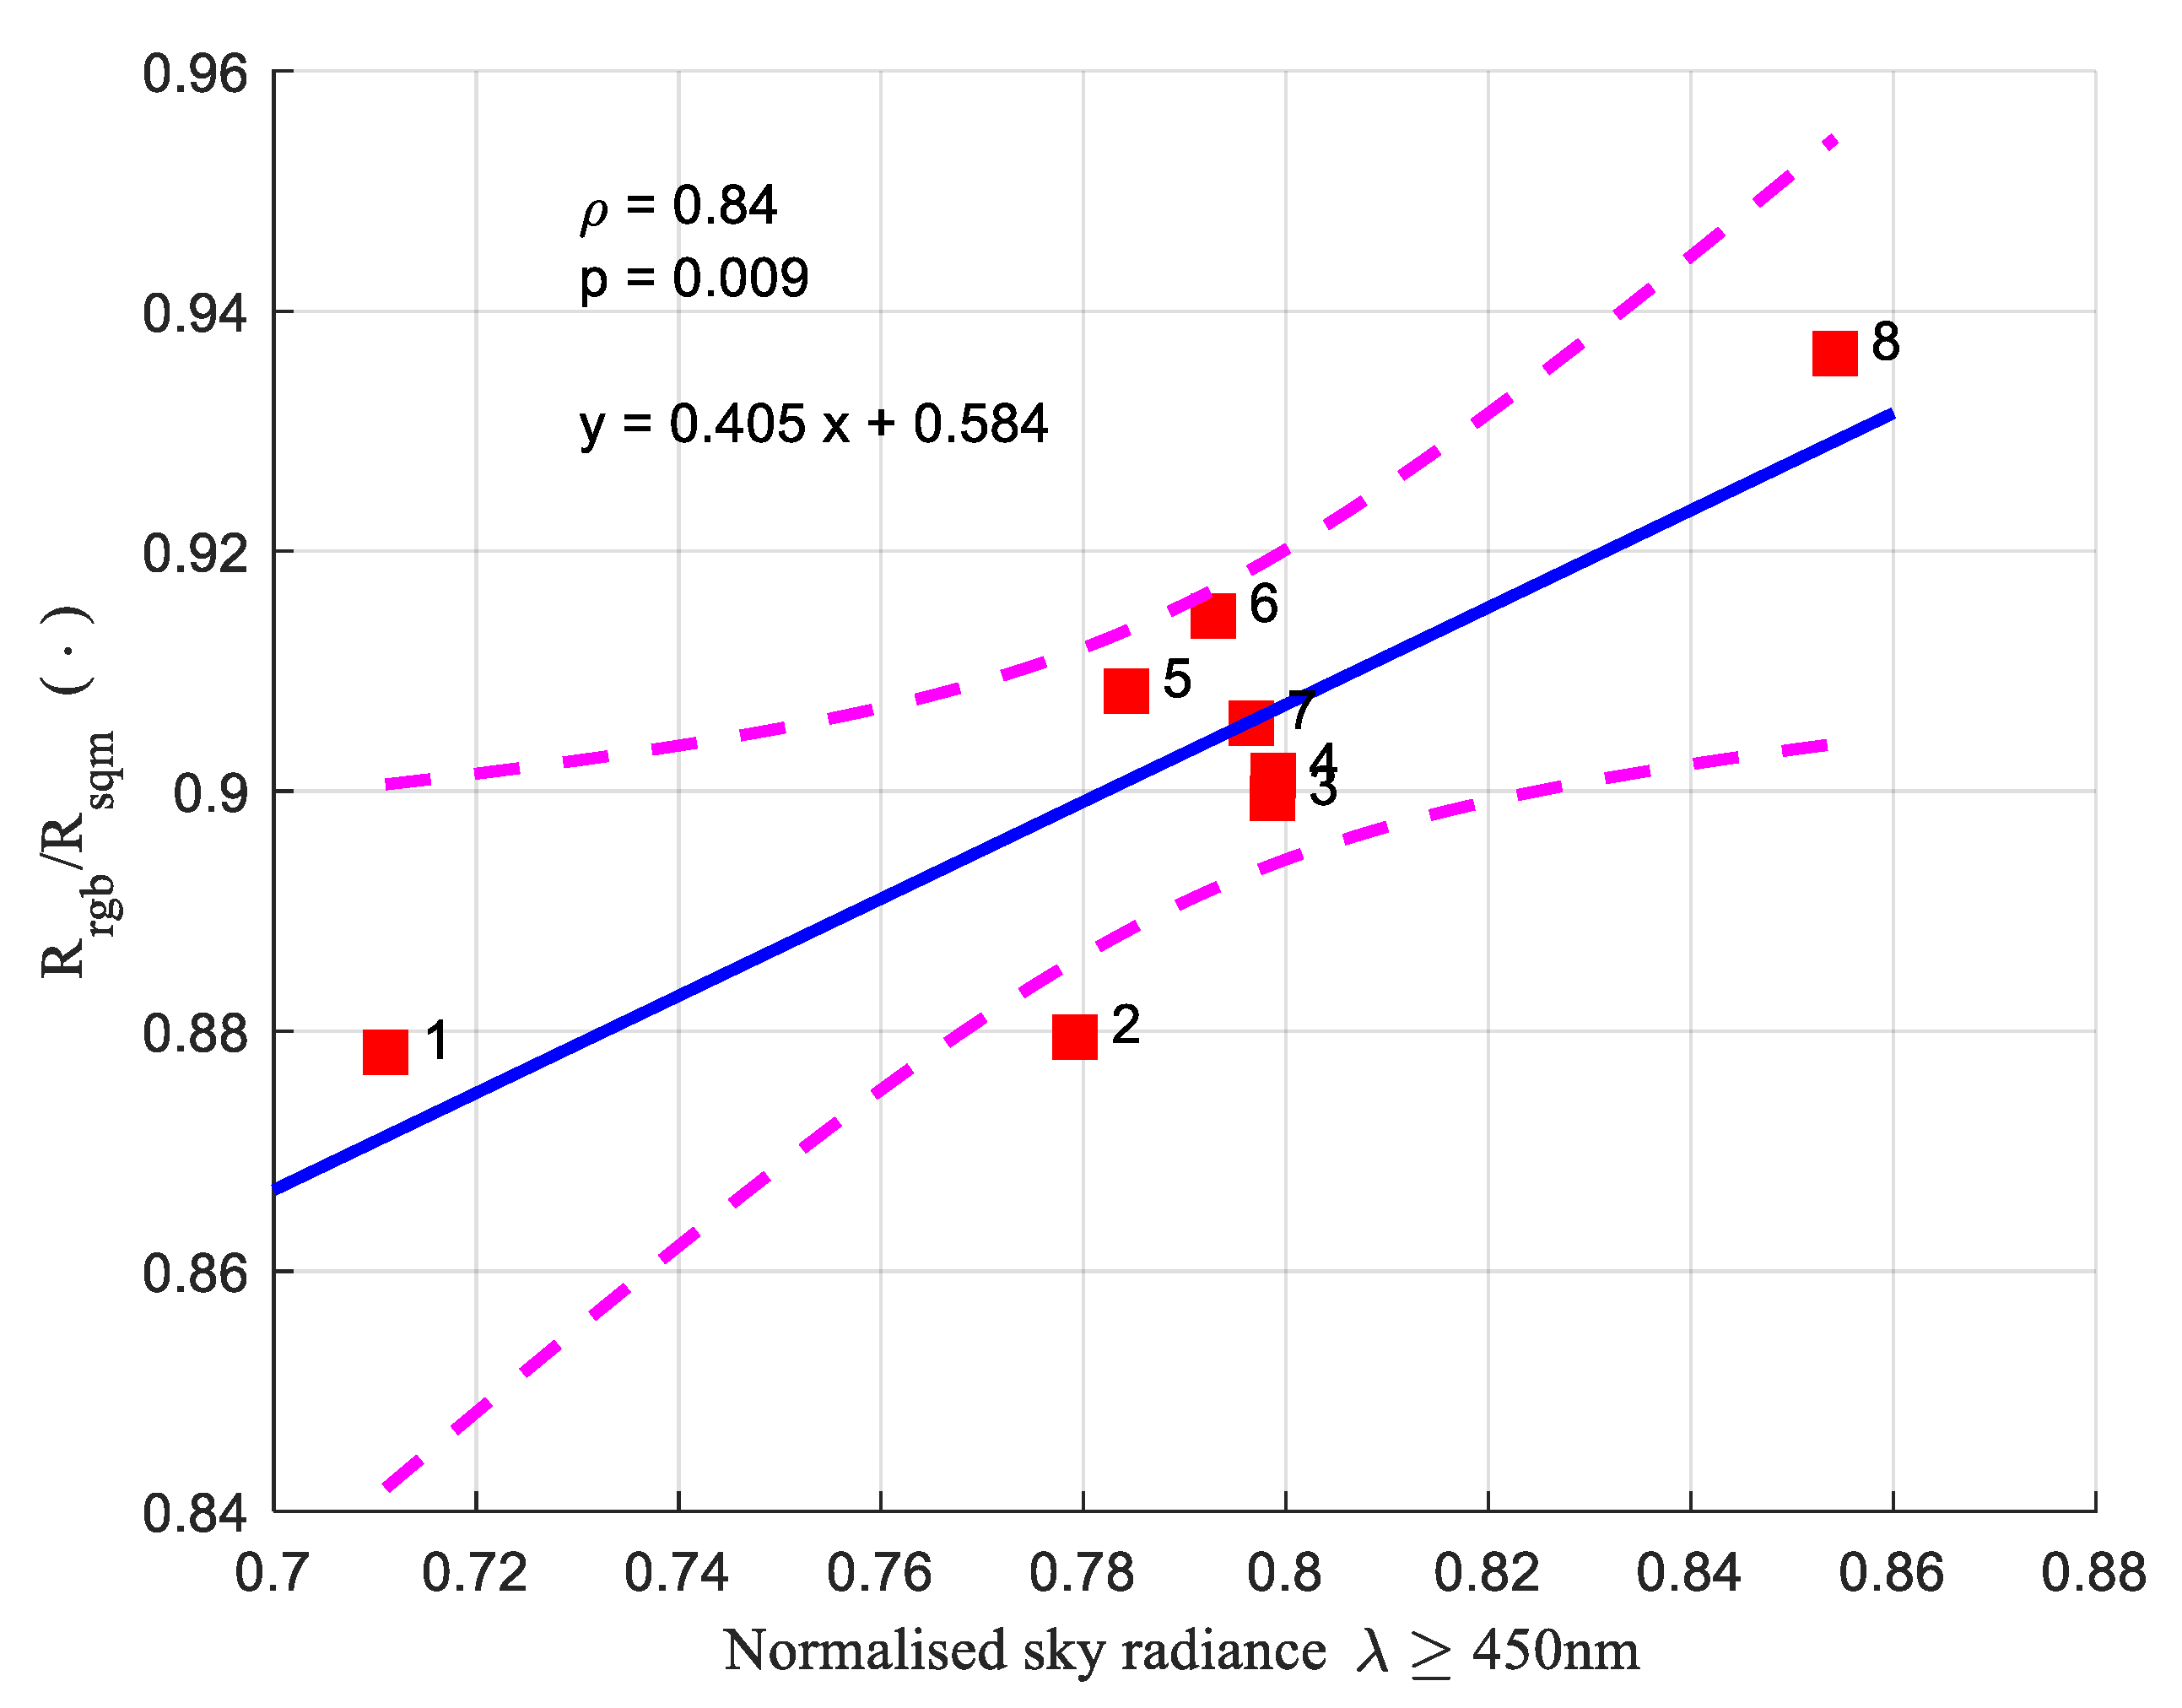
As stated above, there is a significant difference between the spectral responsivity of the synthetic SQM and the responsivity of a real SQM at wavelengths shorter than 450 nm. That difference and the variations in the spectral radiance of the night sky in the same wavelength range may be the main causes of the drift visible in Figure 13. To obtain an analysis which is independent of the absolute values of the total downward scattered power, the correlation between the fraction of the sky radiance associated with the radiation where wavelengths are longer than 450 nm, compared to the total sky radiance, and the ratio between the responses of the synthetic SQM and of the SQM was considered. The relationship between these two quantities is presented in Figure 14 for the spectral distributions considered in this study. The squares represent the ratio between the responses from the two instruments, while the blue line shows the best linear fit for the data. Around the fitting line, the pink, dashed lines show the upper and lower 95% prediction bounds for the fitted curve. To confirm the significance of the linear fitting, the correlation coefficient between the fraction of the radiance at wavelengths longer than 450 nm and the ratio between the responses of the two instruments was evaluated; it is equal to 0.84, which can be considered a good value. The probability value corresponding to the hypothesis of no correlation is equal to 0.9%, which means there is sufficient evidence to assume that the model based on the line regression fits the data better than the one with no independent variable. Figure 14 also presents the equation of the fitting line; from the values of its coefficients, it appears that, when all radiations scattered downward by the night sky have wavelengths of above the limit of 450 nm (x equal to unit in the equation), the difference between the behaviours of the two instruments becomes negligible compared to the uncertainty associated with the characterization of their spectral responsivity. In particular, the value of the ratio resulting from the fitting line is 0.989, and the difference in the behaviour is just over 1%.

4.4. Comparison between Field Measures from Real SQMs and the Synthetic SQM

To validate the analysis and the comparison of the spectral responsivity of the real SQM and the synthetic SQM, the measurements of the NSB values obtained at zenith at four sites are here compared; they are characterised by different light pollution levels and skies. The data are summarised in Table 5, and they are discussed below. The first column (SQM) presents the values measured by a real SQM-L; the values evaluated by the SQC sw are shown in the second column, and Δ SQC sw shows their difference from the values of the first column; the columns RGB and Δ RGB refer to the measurements obtained by the RGB camera and have similar significance; the last column presents the expected difference between the measurements of the synthetic SQM and of the real SQM. In Table 5, the NSB values provided by the SQC software are corrected to represent the output of an SQM-L. As usual, all values are presented in the logarithmic scale of magnitudes.
The data in the first row correspond to the measurements recorded in Mößna, which is a site with a very little light pollution. The spectral distribution of the sky radiance is the one presented in Figure 12 with the code number 1.
The NSB in Mößna was obtained from the analysis of an image of the sky; it was elaborated on the basis of the characterization performed in this study; the obtained NSB (column RGB) was 21.91 mag arcsec−2. The NSB was also measured by a portable SQM, the value provided by which was 21.54 mag arcsec−2. The recorded image was also processed by the SQC software, which provided a value of 21.52 mag arcsec−2 as an estimate of the SQM value at zenith; this value is in really good agreement with the one obtained by the real SQM. This fine result may be attributed to the calibration condition of the SQC software, which was close to the measurement situation.
According to the results presented in Figure 14, the difference between the NSB measured by the RGB camera and that by the SQM should be 0.15 mag arcsec−2, (see the “Expected Δ RGB” column in Table 5) in a logarithmic scale. It does not justify the difference of 0.37 mag arcsec−2. The distance between the two evaluations can be explained by also considering the uncertainty regarding the ratio between the responses of the synthetic SQM and the real SQM. Considering the lowest value of the interval correspondent at a 95% confidence level in Figure 13, the expected error associated with the lack of the spectral responsivity of the SQM and of the used camera rises to 0.31 mag arcsec−2, which is a value very close to the difference between the two NSB measures.
Figure 15a displays a black, dashed line to represent the NSB measured on 23 December 2019 by the SQM devoted to continuous recording, which is located above the roof of the ARPAV headquarters in Padova; the site can be considered to experience a medium level of light pollution. The spectrum of the sky can be assumed to be similar to the one presented in Figure 12 with the code number 7. As the SQM has been working for more than 6 years, a reduction in its output occurs, and logarithmic scale the values provided by the aged SQM are 0.05 mag arcsec−2 higher than they should be; this is true in accordance with the analysis on the effect of the ageing of the IR blocking filter on NSB measures presented in [18]. A correction has been applied to the data presented in Figure 15.
Again, in Figure 15, the SQM measurements are compared with the NSB values obtained from a sequence of raw RGB images recorded by the camera analysed in this work. The time step of the sequences through the night was 15 min. The NSB values provided by the synthetic SQM obtained using the characterization described above are represented by the red, continuous line above the values supplied by the SQM, while the values provided by the Sky Quality Camera software are represented by the blue line. Figure 15b shows the difference between the two sequences of the synthetic SQM and the real SQM, which are represented by the red line; a trend can be seen through the night towards the highest difference values. This can be justified by a variation in sky spectral radiance due to the switching off and dimming of outdoor lights.
According to the results presented in Figure 14, the values obtained by the RGB camera should correspond to a darker sky, and the difference should be 0.11 mag arcsec−2. From the recorded measurements, the average difference during the night is 0.12 mag arcsec−2. The deviation from the expected value is 0.01 mag arcsec−2; this is well within the dispersion of the characteristics of various SQM, which is represented by the uncertainty declared by the manufacturer, equal to 0.1 mag arcsec−2. In addition, the uncertainty regarding the ratio presented in Figure 13 must also be considered, which is about 0.12 mag arcsec−2 on average.
The difference between the values provided by the SQC software and the SQM is represented by the blue line in Figure 14b. It does not show the significant variation around the average value of −0.16 mag arcsec−2.
The last row of Table 5 corresponds to the measurements of the real SQM, from the SQC software and from the synthetic SQM at about 3 a.m.
The intermediate situation of the second row of Table 5 corresponds to the Asiago Ekar site. The spectrum of the sky referred to here is the one presented in Figure 12 with the number code 7. There, the manual measure of the SQM-L provided an NSB value of 20.61 mag arcsec−2, and the output of the SQC software, corrected for the viewing angle, was equal to 20.53 mag arcsec−2. The difference was −0.08 mag arcsec−2, which is in between the values at the Mößna and Padova sites. The NSB value obtained from the same photo but according to the synthetic SQM defined in this work was 20.87 mag arcsec−2. This value is 0.26 mag arcsec−2 more than the output of the real SQM. Considering only the central values of the spectral responsivity, a difference equal to 0.11 mag arcsec−2 is expected. Considering also the uncertainties on the spectral responsivity, the explained difference can rise up to 0.24 mag arcsec−2.
The third row of Table 5 presents the situation at the Oasis of Ca’ di Mezzo, located in the municipality of Codevigo in the province of Padova. Even if it is in the Padana plain, it is far from important sources of light pollution. The spectral measure is not available, but the spectrum should contribute significantly at the shortest wavelengths; this can be assumed from the colour temperature estimated at the zenith of about 4400 K, similar to that at Mößna. This justifies the higher NSB values in logarithmic scale in the “RGB” column of Table 5.
Let us take an overall look at the discrepancies between the NSB values provided by the SQC software and by the synthetic SQM analysed in this work, compared to the outputs of a real SQM. The first display an increase in NSB from a sky with a low level of pollution sky to a sky with a medium–high level of pollution. The opposite trend is present for the second comparison. These results show the need to account for the spectral distribution of sky radiance to compensate for the imperfect approximation of the SQM spectral responsivity when using a linear combination of the responsivity of the three channels of an RGB camera.
Even if the four considered situations are too few to represent a statistical sample, the data can be used to attempt to refine the correction factor, evaluated above as, on average, around 90%.
It is a fact that increases in external lighting are linked to variations in the spectral distribution of night sky radiance. Furthermore, this has been facilitated by increase in the luminous efficiency of light sources. This corresponds to a shift in the radiant power scattered downward by the sky in the central part of the visible range. It is visible in Figure 12 and highlighted in Figure 14.
In this factual situation, low values of NSB are associated with natural, or almost natural, light from the night sky (spectrum coded as 1 in Figure 12); sites with medium or high light pollution are characterised by a night sky spectrum similar to the spectrum of the most recent artificial light sources (see as example the spectrum with code number 8 in Figure 11).
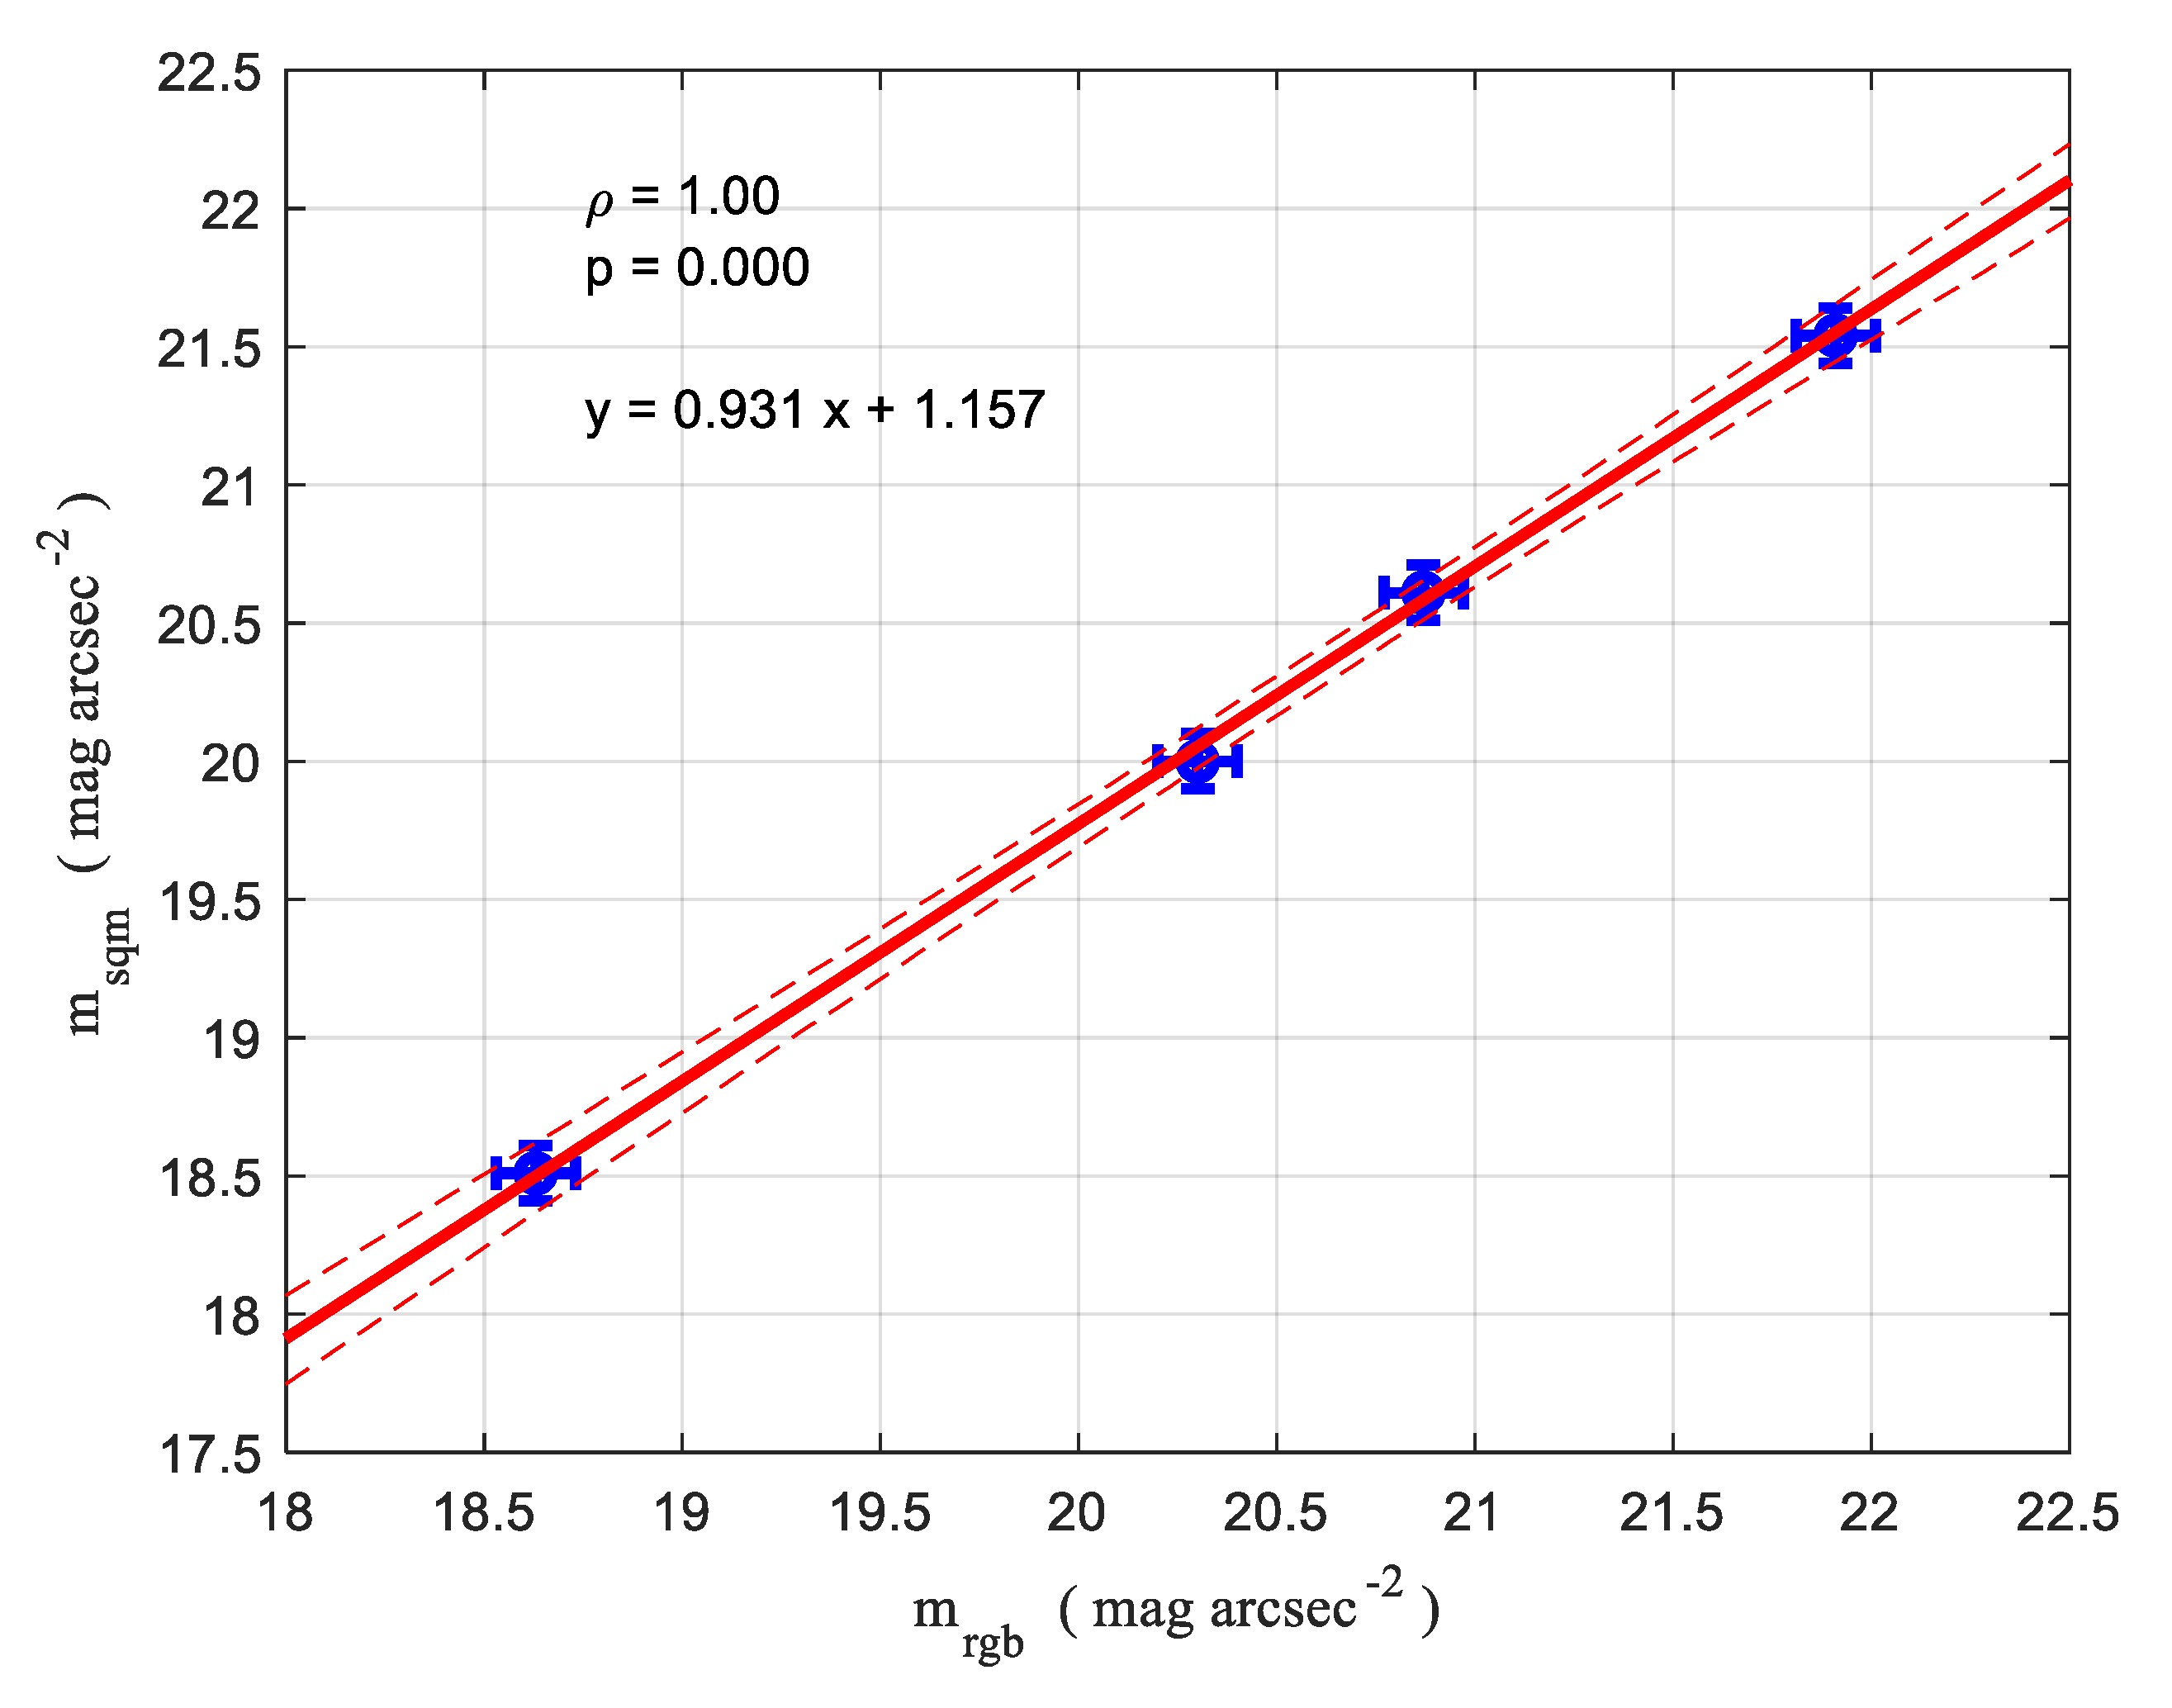
Indeed, there is often a close link between the NSB level measured by SQMs and the shape of the spectrum of the night sky. Based on this hypothesis, it can also be assumed that the NSB values measured using the RGB camera are only related to the SQM measures. The correlation coefficient (ρ) between the two-measure series is practically equal to one, with the probability (p) of the null hypothesis being well below 0.05. Figure 16 presents the data corresponding to the four sites and their fitting, accounting also for the uncertainty of the data.
The simpler relationship between real SQM measurements ( m s q m ) and the output of the synthetic SQM ( m r g b ) is linear, and the result of the regression analysis of the data is
m s q m = α m r g b + β
where the coefficients of the regression are α = 0.931 ± 0.059 and β = 1.157 ± 1.211 . The fitting is represented in Figure 16 by the thick, red line; the thin, dashed lines represent the upper and lower limits of the fitting function, corresponding to one standard deviation of the fitting parameters. This linear approximation agrees completely with the analysis of the SQM and camera responses presented in Figure 13 and the proposed correction factor equal to 0.9 and improves the result. The new linear fitting allows for a better estimate of the values provided by the SQM; the maximum deviation from the corrected and the measured SQM values is about 0.05 mag arcsec−2, which is completely justified by the uncertainty declared by the SQM manufacturer. The mean squared error is 0.03 mag arcsec−2.

5. Conclusions

The analysis of the spectral responsivity of the three channels of the RGB camera (Canon 70D) available for the working group allowed for the definition of a synthetic SQM. The same facilities used for the measurements on the camera were also employed to evaluate the spectral responsivity of an SQM. The uncertainty regarding the responsivity, with a 95% confidence level, was between about 5% and about 10% of the maximum of the considered function.
The performances of the synthetic instrument and of a real SQM were compared. The lack of an approximation of the SQM responsivity at the shortest wavelength was highlighted. This means that the spectral mismatch between the two instruments depends on the spectral distribution of the analysed light. To evaluate this effect, the measured spectral radiances of the night sky at sites with different light pollution levels were considered as stimuli for the two instruments.
An average deficiency of about 10% in the NSB directly measured by the synthetic SQM was highlighted. Therefore, an acceptable approximation of the response of an SQM radiometer obtained by combining the responses of the R, G and B channels of the considered camera requires at least a correction factor equal to 1.11, even if a better solution needs a dedicated correction for each spectral distribution of the light coming from the sky.
In addition, a direct comparison was carried out between the measurements of a real SQM and of the synthetic SQM based on the RGB camera. It considered the data of four sites with different levels of light pollution. The result was in good agreement with the analysis of the spectral responsivity. A new linear correction was evaluated, which supposed a strong relationship between the NSB levels measured by the two instruments. The expected discrepancy after the correction was, at maximum, 0.05 mag arcsec−2. New data at other sites will be used to confirm the identified correction.
The analysis shown that the RGB camera can also provide reliable NSB values in the presence of different ALAN conditions and light pollution levels. Owing to the absence of the spectral responsivity values of the R, G and B channels, this is true only if dedicated corrective actions are applied.
It could also of interest to evaluate the stability of RGB cameras based on different technologies over a long time. If good performances are found, RGB cameras placed in parallel with SQMs could be used as another tool to assess the long-term trends of NSB.

Author Contributions

Conceptualization, P.F.; methodology, P.F.; software, P.F.; formal analysis, P.F.; data curation, A.B.; writing—original draft preparation, P.F.; writing—review and editing, S.C., S.O. and A.B. All authors have read and agreed to the published version of the manuscript.

Funding

This research received no external funding.

Data Availability Statement

The data underlying this paper will be shared upon reasonable request to the corresponding author Pietro Fiorentin ([email protected]).

Conflicts of Interest

The authors declare no conflict of interest.

References

  1. Jechow, A.; Hölker, F.; Kolláth, Z.; Gessner, M.O.; Kyba, C.C. Evaluating the summer night sky brightness at a research field site on Lake Stechlin in northeastern Germany. J. Quant. Spectrosc. Radiat. Transf. 2016, 181, 24–32. [Google Scholar] [CrossRef]
  2. Jechow, A.; Kolláth, Z.; Lerner, A.; Hänel, A.; Shashar, N.; Hölker, F.; Kyba, C.C. Measuring Light Pollution with Fisheye Lens Imagery from A Moving Boat–A Proof of Concept. Int. J. Sustain. Light. 2017, 19, 15–25. [Google Scholar] [CrossRef]
  3. Hänel, A.; Posch, T.; Ribas, S.J.; Aubé, M.; Duriscoe, D.; Jechow, A.; Kollath, Z.; Lolkema, D.E.; Moore, C.; Schmidt, N.; et al. Measuring night sky brightness: Methods and challenges. J. Quant. Spectrosc. Radiat. Transf. 2018, 205, 278–290. [Google Scholar] [CrossRef]
  4. Fiorentin, P.; Bertolo, A.; Cavazzani, S.; Ortolani, S. Calibration of digital compact cameras for sky quality measures. J. Quant. Spectrosc. Radiat. Transf. 2020, 255, 107235. [Google Scholar] [CrossRef]
  5. Kolláth, Z.; Cool, A.; Jechow, A.; Kolláth, K.; Száz, D.; Tong, K.P. Introducing the dark sky unit for multi-spectral measurement of the night sky quality with commercial digital cameras. J. Quant. Spectrosc. Radiat. Transf. 2020, 253, 107162. [Google Scholar] [CrossRef]
  6. Burggraaff, O.; Schmidt, N.; Zamorano, J.; Pauly, K.; Pascual, S.; Tapia, C.; Spyrakos, E.; Snik, F. Standardized spectral and radiometric calibration of consumer cameras. Opt. Express 2019, 27, 19075–19101. [Google Scholar] [CrossRef] [PubMed]
  7. Cardiel, N.; Zamorano, J.; Bará, S.; Sánchez de Miguel, A.; Cabello, C.; Gallego, J.; García, L.; González, R.; Izquierdo, J.; Pascual, S.; et al. Synthetic RGB photometry of bright stars: Definition of the standard photometric system and UCM library of spectrophotometric spectra. Mon. Not. R. Astron. Soc. 2021, 504, 3730–3748. [Google Scholar] [CrossRef]
  8. Bertolo, A.; Binotto, R.; Ortolani, S.; Sapienza, S. Measurements of night sky brightness in the Veneto region of Italy: Sky quality meter network results and differential photometry by digital single lens reflex. J. Imaging 2019, 5, 56. [Google Scholar] [CrossRef]
  9. Bará, S.; Lima, R.C.; Zamorano, J. Monitoring long-term trends in the anthropogenic night sky brightness. Sustainability 2019, 11, 3070. [Google Scholar] [CrossRef]
  10. Cinzano, P. Night Sky Photometry with Sky Quality Meter. ISTIL Int. Rep. 2005, 9, 1–14. [Google Scholar]
  11. Available online: http://www.unihedron.com/ (accessed on 17 May 2023).
  12. Zamorano, J.; García, C.; Tapia, C.; de Miguel, A.S.; Pascual, S.; Gallego, J. Stars4all night sky brightness photometer. Int. J. Sustain. Light. 2016, 18, 49–54. [Google Scholar] [CrossRef]
  13. Bará, S.; Tapia, C.E.; Zamorano, J. Absolute radiometric calibration of TESS-W and SQM night sky brightness sensors. Sensors 2019, 19, 1336. [Google Scholar] [CrossRef]
  14. Available online: http://astrosurf.com/buil/50d/test.htm (accessed on 1 August 2023).
  15. Cavazzani, S.; Ortolani, S.; Bertolo, A.; Binotto, R.; Fiorentin, P.; Carraro, G.; Zitelli, V. Satellite measurements of artificial light at night: Aerosol effects. Mon. Not. R. Astron. Soc. 2020, 499, 5075–5089. [Google Scholar] [CrossRef]
  16. Cavazzani, S.; Ortolani, S.; Bertolo, A.; Binotto, R.; Fiorentin, P.; Carraro, G.; Saviane, I.; Zitelli, V. Sky Quality Meter and satellite correlation for night cloud-cover analysis at astronomical sites. Mon. Not. R. Astron. Soc. 2020, 493, 2463–2471. [Google Scholar] [CrossRef]
  17. Puschnig, J.; Näslund, M.; Schwope, A.; Wallner, S. Correcting sky-quality-meter measurements for ageing effects using twilight as calibrator. Mon. Not. R. Astron. Soc. 2021, 502, 1095–1103. [Google Scholar] [CrossRef]
  18. Fiorentin, P.; Cavazzani, S.; Ortolani, S.; Bertolo, A.; Binotto, R. Instrument assessment and atmospheric phenomena in relation to the night sky brightness time series. Measurement 2022, 191, 110823. [Google Scholar] [CrossRef]
  19. Puschnig, J.; Wallner, S.; Schwope, A.; Näslund, M. Long-term trends of light pollution assessed from SQM measurements and an empirical atmospheric model. Mon. Not. R. Astron. Soc. 2023, 518, 4449–4465. [Google Scholar] [CrossRef]
  20. Fiorentin, P.; Binotto, R.; Cavazzani, S.; Bertolo, A.; Ortolani, S.; Saviane, I. Long-Time Trends in Night Sky Brightness and Ageing of SQM Radiometers. Remote Sens. 2022, 14, 5787. [Google Scholar] [CrossRef]
  21. Kolláth, Z.; Dömény, A. Night sky quality monitoring in existing and planned dark sky parks by digital cameras. Int. J. Sustain. Light. 2017, 19, 61–68. [Google Scholar] [CrossRef]
  22. Bartolomei, M.; Olivieri, L.; Bettanini, C.; Cavazzani, S.; Fiorentin, P. Verification of Angular Response of Sky Quality Meter with Quasi-Punctual Light Sources. Sensors 2021, 21, 7544. [Google Scholar] [CrossRef]
  23. Jechow, A.; Kyba, C.C.; Hölker, F. Beyond all-sky: Assessing ecological light pollution using multi-spectral full-sphere fisheye lens imaging. J. Imaging 2019, 5, 46. [Google Scholar] [CrossRef] [PubMed]
  24. Jechow, A.; Kyba, C.C.; Hölker, F. Mapping the brightness and color of urban to rural skyglow with all-sky photometry. J. Quant. Spectrosc. Radiat. Transf. 2020, 250, 106988. [Google Scholar] [CrossRef]
  25. Fiorentin, P.; Scroccaro, A. Detector-based calibration for illuminance and luminance meters—Experimental results. IEEE Trans. Instrum. Meas. 2010, 59, 1375–1381. [Google Scholar] [CrossRef]
  26. Manual of DeltaOhm Quantum-Photo-Radiometer HD 9021. Available online: http://www.deltaohm.co.kr/main/products/pdisplay.php?active=product&no=538&thiscode=100201 (accessed on 25 August 2023).
  27. Available online: https://c7076-control.chem.sfu.ca/interlock_monitoring_system_resources/usb6008.pdf (accessed on 22 May 2023).
  28. Available online: https://it.mathworks.com/help/matlab/learn_matlab/matrices-and-arrays.html?lang=en (accessed on 17 March 2023).
  29. Wyszecki, G.; Stiles, W.S. Color Science: Concepts and Methods, Quantitative Data and Formulae; John Wiley & Sons: Hoboken, NJ, USA, 2000. [Google Scholar]
  30. Coffin, D. Decoding Raw Digital Photos in Linux. Available online: https://www.dechifro.org/dcraw/ (accessed on 1 March 2023).
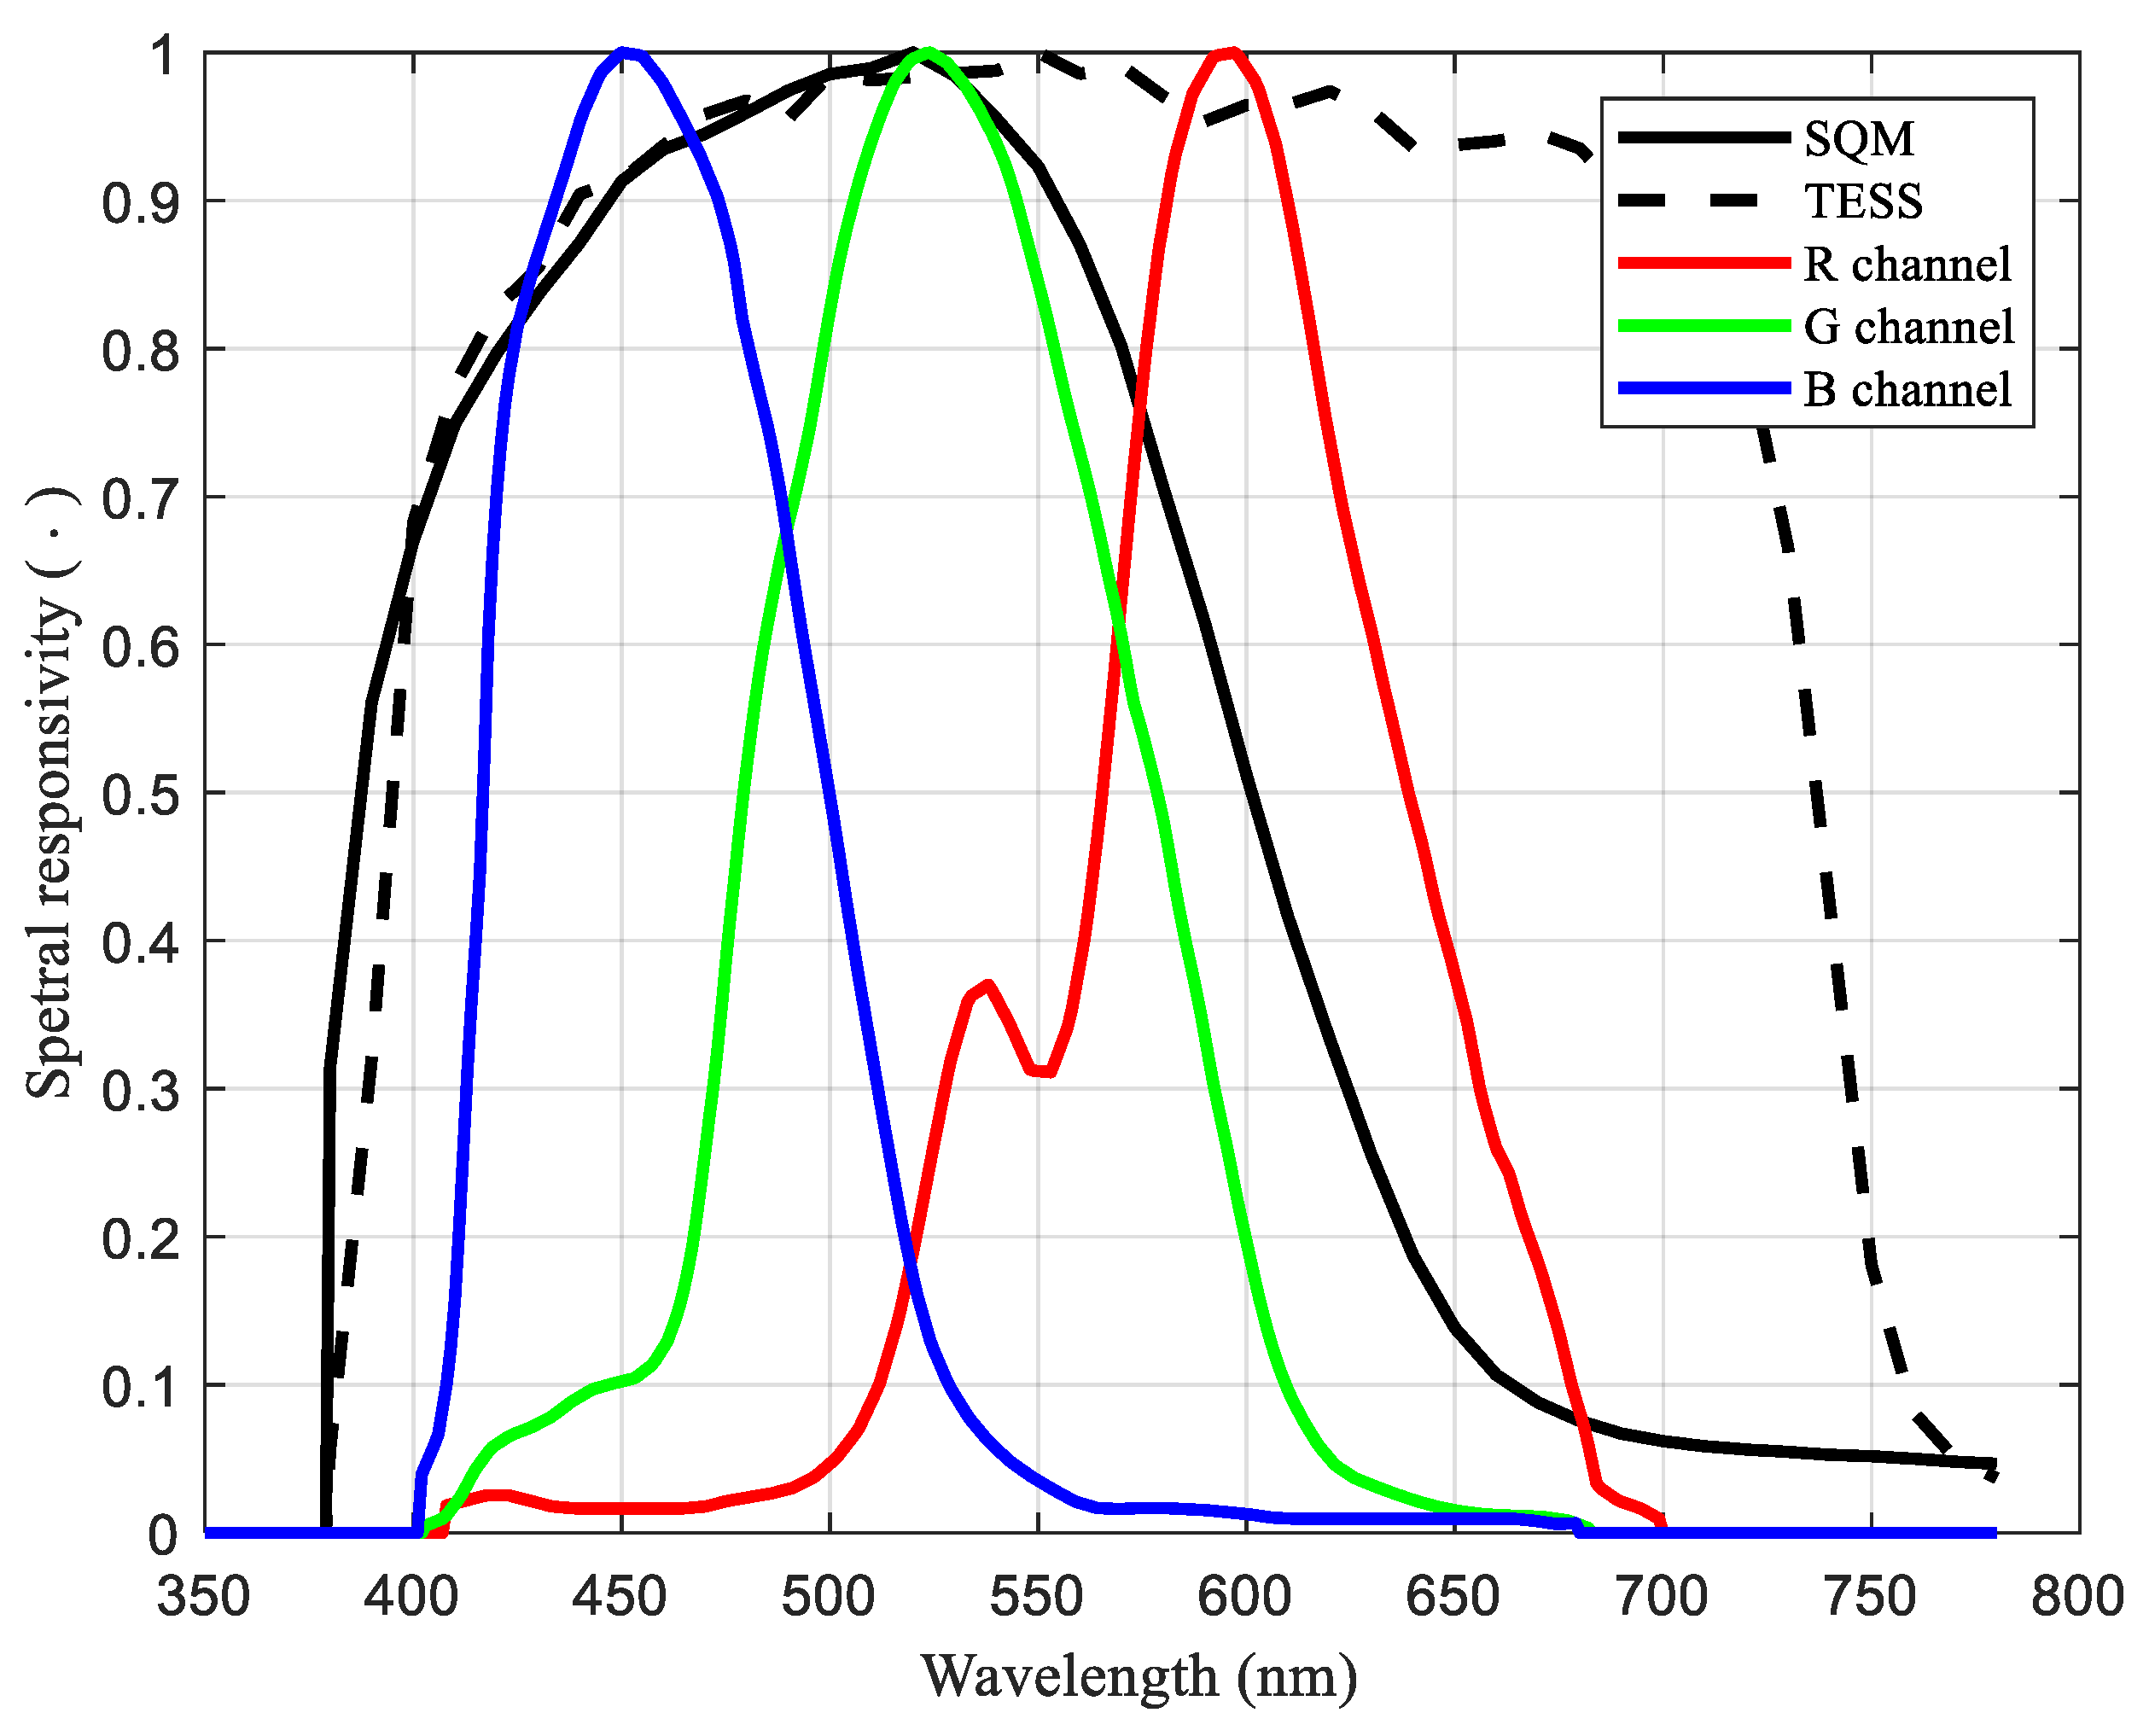
Figure 1. Spectral responsivity of an SQM (black continuous line), a TESS (black dashed line) [13] and, as an example, the spectral responsivity of the three channels of the Canon 5D mark II [14]. The functions are normalised to their maximum.
Remotesensing 15 04196 g001
Figure 2. Spectral radiance at the output port of the coloured LED source (coloured continuous lines) and scaled spectral radiance of Illuminant A (black dashed line).
Remotesensing 15 04196 g002
Figure 3. Colour matching functions x ¯ , y ¯ and z ¯ (continuous black line) and their first (red, dashed line) and second approximations (blue continuous line) (a,c,e). The LED tristimulus values are represented by empty circles with black contour, red squares and blue circles show their first and final approximations, respectively. Reconstruction errors associated with the first and second approximations (b,d,f).
Remotesensing 15 04196 g003
Figure 4. Relative error in the estimates of the colour matching functions x ¯ , y ¯ and z ¯ (blue, continuous line) and errors in the LED tristimulus values (a,c,e). Values of the errors in the colour matching functions of each sub-interval versus the error in the tristimulus (blue circles) and maximum error in the function estimates (red circles) (b,d,f).
Remotesensing 15 04196 g004
Figure 5. Correlation between absolute values of the errors in the colour matching functions x ¯ (section a) and y ¯ (section b) and errors in the tristimulus (X or Y) estimates; the red circle corresponds to the maximum error in the function estimates in wavelength sub-intervals.
Remotesensing 15 04196 g005
Figure 6. An SQM positioned in front of the LED source.
Remotesensing 15 04196 g006
Figure 7. Image of the inner surface of the diffusing sphere from its output port, recorded by the analysed RGB camera when the LED at 590 nm was on. The blue circles correspond to the viewing angles equal to 30°, 60° and 90°. The central disk, extending about 30°, is the baffle in the middle between the input and output ports.
Remotesensing 15 04196 g007
Figure 8. Average values of the outputs of the R, G and B camera channels, normalised to the input LED radiance values (red, green and blue squares); estimates of the spectral responsivity of the R, G an B camera channels (continuous lines); reconstructed normalised outputs of the three channels to the LED radiance (coloured dots. The thin dotted lines represent the uncertainty masks on the r ¯ c a m , g ¯ c a m and b ¯ c a m estimates.
Remotesensing 15 04196 g008
Figure 9. Uncertainty boundary mask of the approximation of the spectral responsivity of the R, G and B channels of the analysed camera. The circles highlight the peak wavelengths of the LEDs.
Remotesensing 15 04196 g009
Figure 10. SQM outputs to LEDs, scaled by each LED total radiance (black squares); reconstructed SQM normalised outputs (blue circles); estimated SQM spectral responsivity (continuous blue line) and its approximation, obtained using the camera (continuous, red line); uncertainty masks on the SQM spectral responsivity (blue, dotted lines) and on the spectral responsivity of the synthetic SQM (red, dotted lines).
Remotesensing 15 04196 g010
Figure 11. Difference between the estimated SQM outputs provided by the synthetic instrument and the real SQM outputs (squares), when using LED lights; error in the approximation of the SQM spectral responsivity by the responsivity of the R, G and B channels (thick, continuous line); mask obtained by combining the uncertainty of the spectral responsivity of the SQM and the camera (thin, dotted lines).
Remotesensing 15 04196 g011
Figure 12. Some spectra of the night sky, numbered from the site with low light pollution to the most polluted ones, where ALAN is mainly due to high-pressure sodium lamps and white LED sources. The spectral responsivity of the SQM and its approximation are also shown for a visual comparison of their different power weightings at the various wavelengths.
Remotesensing 15 04196 g012
Figure 13. Values of the ratio between the response of the synthetic SQM and of the SQM itself alongside the code number assigned to the spectra, as presented in Figure 12 (squares). Error bars account for the uncertainty of the spectral responsivity of the SQM and synthetic SQM. The dashed line shows the average value of the ratio.
Remotesensing 15 04196 g013
Figure 14. Relationship between the fraction of sky radiance associated with radiation with wavelengths longer than 450 nm and the ratio between the responses of the synthetic SQM and the real SQM. The squares correspond to the considered night sky spectral distributions, identified by their code numbers. The straight, blue line corresponds to the linear fitting, while the pink, dashed lines show the upper and lower 95% prediction bounds.
Remotesensing 15 04196 g014
Figure 15. NSB in logarithmic scale measured in parallel by an SQM and the analysed RGB camera (a) and the difference between the two sequences (b).
Remotesensing 15 04196 g015
Figure 16. NBS values measured by the SQM versus values obtained by the RGB camera (blue dots) with their uncertainties. The thick, red line shows the linear fitting function; the thin, dashed lines represent its upper and lower limits (one standard deviation).
Remotesensing 15 04196 g016
Table 1. Error in the tristimulus values associated with the normalised LED radiances at the source output port, as a percentage of the maximum of the related colour matching function.
Error (%) vs. Peak Wavelength (nm)Average of
Abs Error (%)
Tristimulus Func.360405450490545590630675720
x ¯ 1st approx.−0.21.1−2.54.05.0−3.01.82.70.72.3
2nd approx.0.0−0.20.51.44.71.92.70.70.41.4
y ¯ 1st approx.0.00.21.54.2−5.50.12.51.1−0.31.7
2nd approx.0.00.00.403.3−2.91.71.10.1−0.21.1
z ¯ 1st approx.−0.13.7−7.21.00.70.00.00.00.01.5
2nd approx.0.0−1.11.7−1.60.10.00.00.00.00.5
Table 2. Error in the reconstruction of the colour matching functions in the whole wavelength range, as a percentage of the peak values of the functions themselves.
1st Approx. Error2nd Approx Error
Tristimulus FunctionMax Abs (%)Std (%)Max Abs (%)Std (%)
x ¯ 115.0114.2
y ¯ 8.43.87.52.8
z ¯ 143.99.62.8
Table 3. Errors in the reconstructed R, G and B values due to normalised LED radiances, as a percentage of the maximum spectral responsivity of the related channel.
Error (%) vs. Peak Wavelength (nm)Average of
Abs Error (%)
Camera Channel360405450490545590630675720
R0.00.10.11.25.21.12.70.70.51.3
G0.10.01.60.9−4.91.0−0.10.00.11.0
B−0.1−1.02.8−3.3−0.30.00.00.00.10.9
Table 4. Errors in the reconstructed linearised output values of the SQM due to normalised LED radiances, as a percentage of the maximum of its spectral responsivity.
Error (%) vs. Peak Wavelength (nm)Average of
Abs Error (%)
Instrument360 405 450490545590630675720
SQM6.12.70.6−0.2−3.01.30.70.0−3.40.5
Table 5. Measured values of the NSB (in mag arcsec−2) at four sites with different levels of light pollution. The SQM column presents the values of NSB measured by an SQM-L; the SQC sw and Δ SQC sw columns show the NSB values evaluated by the SQC software and their difference from the values of the first column; the RGB and Δ RGB columns have similar significance, but they refer to the synthetic SQM; and the last column presents the expected difference between the measurements of the synthetic SQM and of the real SQM (a corrected to represent the output of an SQM-L; b considering the lowest value of the interval correspondent at a 95% confidence level; c the value was corrected for error due to the instrument ageing).
SiteSQMSQC sw (a)Δ SQC swRGBΔ RGBExpected Δ RGB
Mößna (Austria)21.5421.52−0.0221.910.370.15 (0.31 (b))
Asiago Ekar (Italy)20.6120.53−0.0820.870.260.11 (0.24 (b))
Ca’ di Mezzo (Italy)20.0019.95−0.0520.300.30NA
Padova (Italy)18.51 (c)18.40−0.1118.630.120.11
Disclaimer/Publisher’s Note: The statements, opinions and data contained in all publications are solely those of the individual author(s) and contributor(s) and not of MDPI and/or the editor(s). MDPI and/or the editor(s) disclaim responsibility for any injury to people or property resulting from any ideas, methods, instructions or products referred to in the content.